Article

Salinity Stress Affects Photosynthesis, Malondialdehyde Formation, and Proline Content in Portulaca oleracea L.

Department of Botany and Plant Physiology, Faculty of Agrobiology, Food and Natural Resources, Czech University of Life Sciences Prague, 165 00 Prague, Czech Republic
*
Authors to whom correspondence should be addressed.
Submission received: 22 March 2021 / Revised: 19 April 2021 / Accepted: 20 April 2021 / Published: 22 April 2021
(This article belongs to the Special Issue Salinity Stress in Plants and Molecular Responses)

Abstract

:
In this investigation, the effect of salt stress on Portulaca oleracea L. was monitored at salinity levels of 100 and 300 mM NaCl. At a concentration of 100 mM NaCl there was a decrease in stomatal conductance (gs) simultaneously with an increase in CO2 assimilation (A) at the beginning of salt exposure (day 3). However, the leaf water potential (ψw), the substomatal concentration of CO2 (Ci), the maximum quantum yield of photosystem II (Fv/Fm), and the proline and malondialdehyde (MDA) content remained unchanged. Exposure to 300 mM NaCl caused a decrease in gs from day 3 and a decrease in water potential, CO2 assimilation, and Fv/Fm from day 9. There was a large increase in proline content and a significantly higher MDA concentration on days 6 and 9 of salt stress compared to the control group. After 22 days of exposure to 300 mM NaCl, there was a transition from the C4 cycle to crassulacean acid metabolism (CAM), manifested by a rapid increase in substomatal CO2 concentration and negative CO2 assimilation values. These results document the tolerance of P. oleracea to a lower level of salt stress and the possibility of its use in saline localities.

Graphical Abstract

1. Introduction

Most crops are sensitive to high salt concentrations in the soil and salinization is one of the most serious environmental factors that can limit crop productivity [1,2]. It has been stated that 20% of the total cultivated and 33% of the irrigated agricultural land worldwide is affected by high salinity and the saline area increases by 10% every year. The yield of most crops is significantly reduced when the electrical conductivity (EC) of the soil reaches 4 dS·m−1 (equivalent to 40 mM NaCl) [3]. There are a number of different adaptations that allow certain crop cultivars to continue to grow and produce a harvestable yield under moderate soil salinity [4,5,6].
The adverse effects of salinity are the result of complex interactions among morphological, physiological, and biochemical processes involved in seed germination, plant growth, and water and nutrient uptake [7,8,9]. High concentrations of salt impose both osmotic and ionic stresses on plants [10]. Photosynthesis in all its phases is affected by stress factors, including salinity. The mechanism of photosynthesis involves several components and damage by a stress factor at any level may reduce a plant’s overall photosynthetic capacity [11]. Exposure to salinity leads to closure of the stomata, which acts to limit photosynthesis [12]. Salt-induced osmotic effects can also adversely affect the activities of a number of stomatal enzymes involved in carbon dioxide (CO2) reduction [13]. The effects of salinity on photosynthesis may involve inhibition of electron transport and inactivation of the photosystem II (PSII) reaction centers [14], destroying the oxygen-evolving complex (OEC), and impairing the electron transfer capacity on the donor side of PSII [15]. Increased levels of Na+ and Cl in the non-stomatal leaf tissues can also significantly affect metabolic processes that limit photosynthesis [16].
Osmotic stress impairs the ability of plant cells to detoxify reactive oxygen species (ROS). Under normal growth conditions, there is little ROS production in cells. When a plant’s cellular homeostasis is disrupted by some stress factor; however, there is a significant increase in the concentration of ROS [17], producing.
Harmful effects through lipid peroxidation in cellular membranes, DNA damage, protein denaturation, carbohydrate oxidation, pigment breakdown, and impairment of enzymatic activity [18,19].
The preservation of the osmotic gradient through maintaining an appropriate level of compatible osmolytes is also very important [4]. The solutes that accumulate during osmotic changes include amino acids such as proline and quaternary amines like glycine betaine. A dramatic accumulation of proline is a common physiological response in plants exposed to various abiotic stresses [20].
The importance of proline lies in its capability of stabilizing proteins, membranes, and subcellular structures, and protecting them from damage by scavenging ROS [21]. Some researchers have shown that there is a higher proline content in saline tolerant genotypes, such as Solanum tuberosum L. [22] and Cucumis melo L. [23]. De la Torre-Gonzales et al. [24] stated that when Solanum lycopersicum L. plants are grown under saline conditions, the magnitude of proline increase corresponded to improvement in its tolerance to salt stress. On the contrary, other authors provided evidence that proline was a stress indicator but did not increase tolerance to salt stress [25,26].
Common purslane (Portulaca oleracea L.) is found across the globe and has been used in folk medicine since ancient times. In Chinese medicine P. oleracea possesses a wide spectrum of medicinal uses as a neuroprotective, antimicrobial, antidiabetic, antioxidant, and anticancer agent [27]. P. oleracea is an annual with good drought and salt tolerance, and its responses to abiotic stresses, such as elevated temperature, drought, and high salinity have been studied [28,29,30,31].
Addressing the problems of salinity will be necessary in the future, given the growing population of the planet and the ever-increasing demand for food. At the current rate of world population growth, it will be necessary to produce 70% more food by 2050 than is being produced today [32]. In addition, the changing climatic conditions and their effects on farming threaten the stability of agricultural production. Both research and practice are pursuing a number of ways to address these problems, and improvement in our understanding of the responses of crops to salinity is one of the necessary prerequisites for that. Increased cultivation of halophytic species and their use for phytoremediation could contribute to solving the problem of salinization. The aim of this research was to evaluate the effects of salt stress on the content of free proline and MDA in Portulaca and the parameters of gas exchange and chlorophyll fluorescence.

2. Results

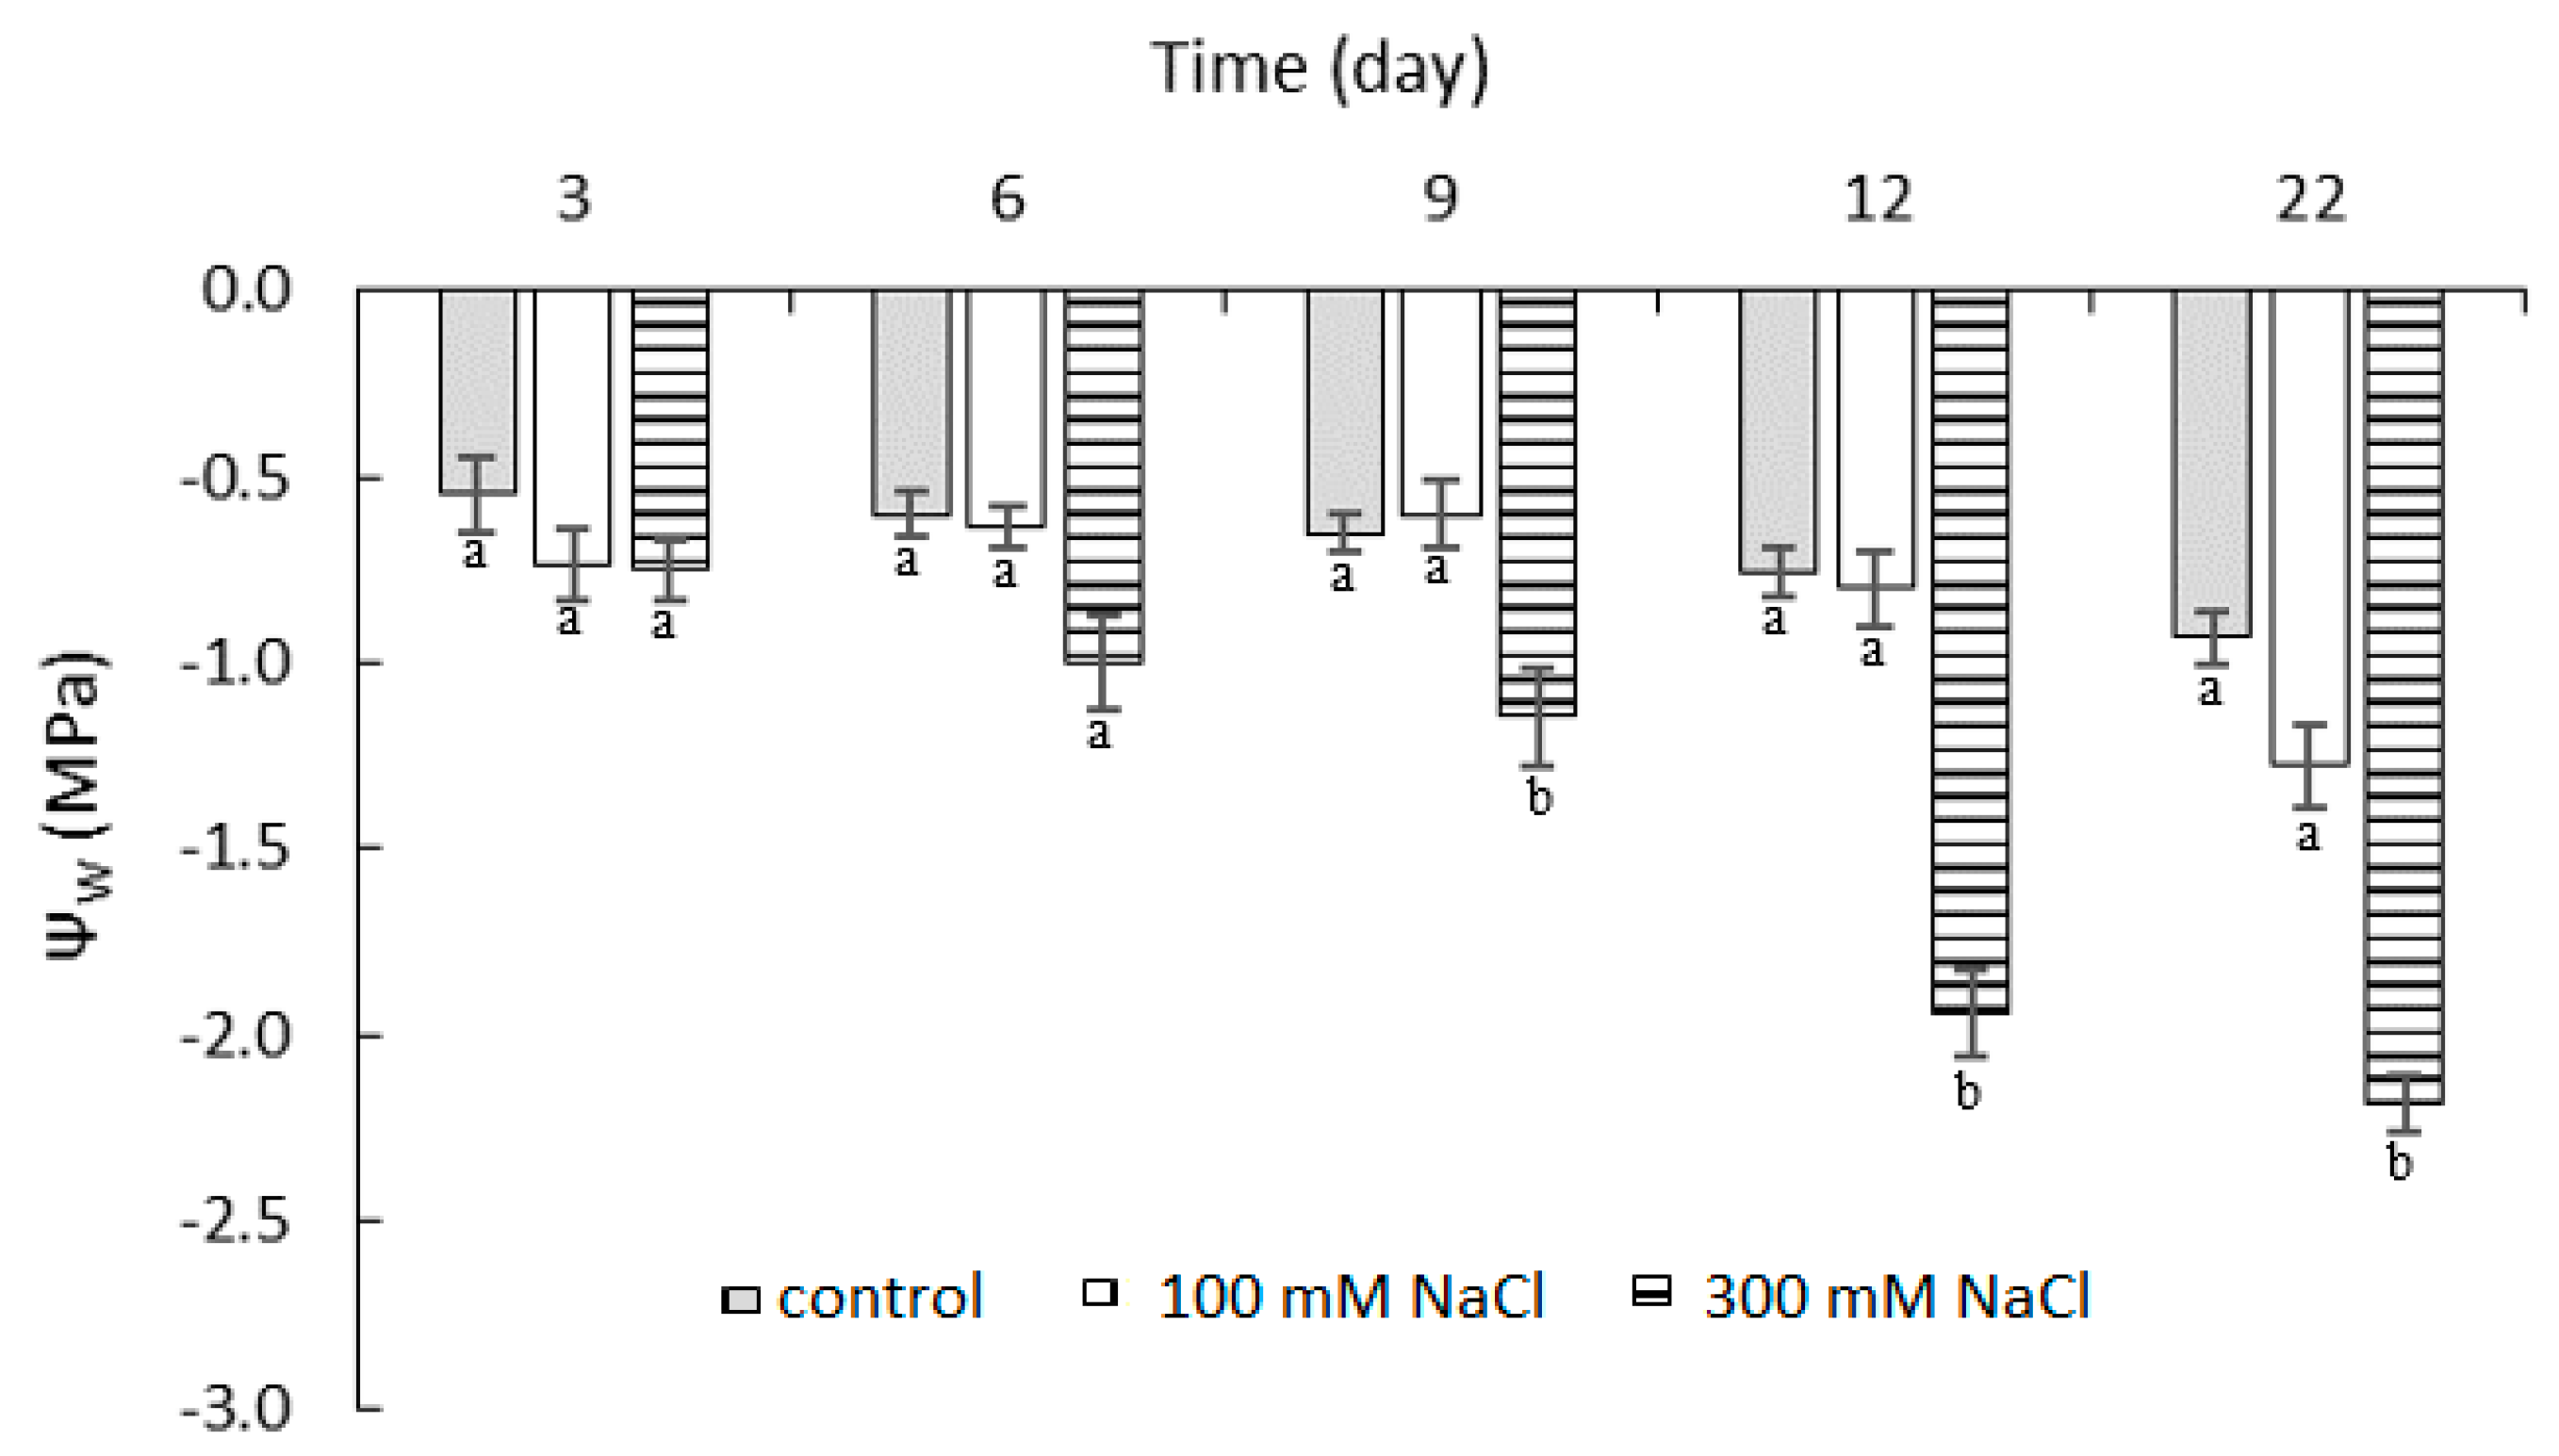
2.1. Effect of NaCl Concentration and Salt Stress Exposure Time on Leaf Water Potential

Salinity reduced the leaf water potential in both experimental treatments (Figure 1). For the 300 mM NaCl treatment, the water potential values ranged from −0.75 to −2.18 MPa. The reduction in leaf water potential was observable from the sixth day of salt stress exposure and was statistically significant relative to control from the ninth day of salt treatment. The water potential decreased rapidly between the 9th and 12th day of salt exposure. For the 100 mM NaCl treatment, the water potential decreased at the end of the experiment, but throughout the experiment, the water potential values were not significantly different from the control.

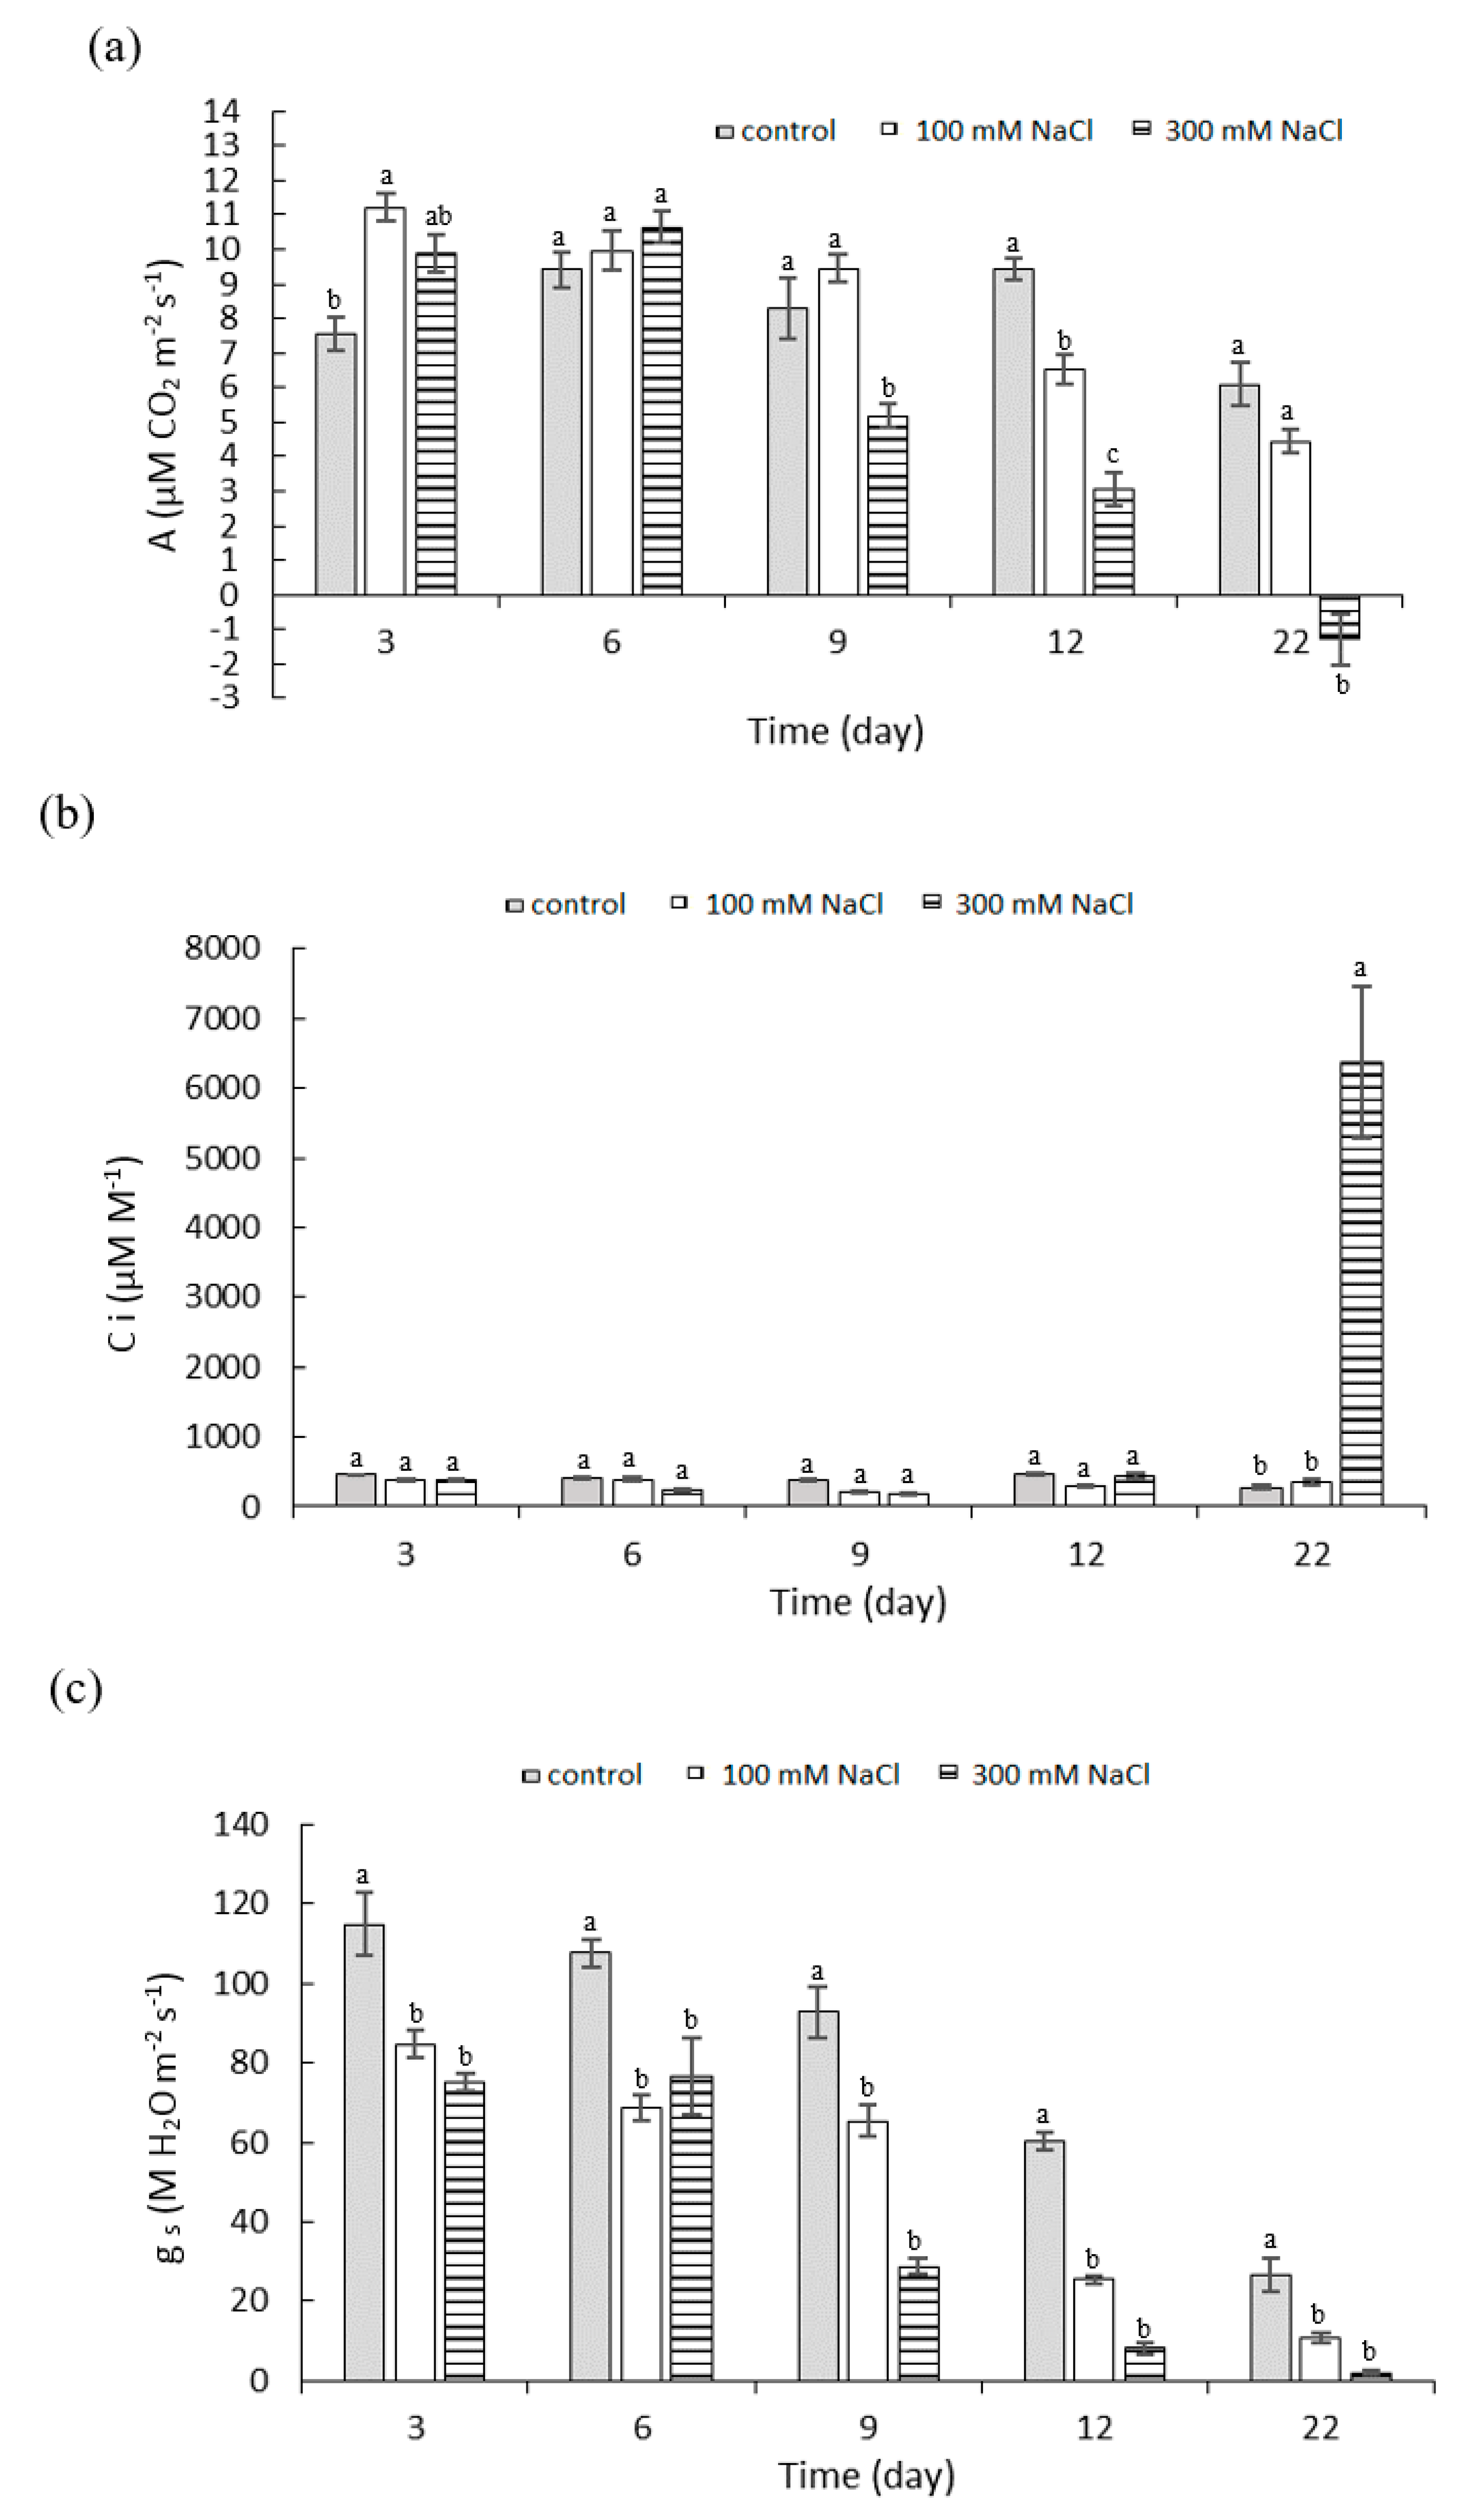
2.2. Effect of NaCl Concentration and Salt Stress Exposure Time on Leaf Gas Exchange Parameters

Changes in CO2 assimilation were measured after all treatments (Figure 2a). On the third day of saline stress exposure, the rate of photosynthesis was significantly increased with 100 mM NaCl compared to control, from 7.58 to 11.21 µM CO2 m−2 s−1. A significant decrease in photosynthetic CO2 assimilation of 38% under 300 mM NaCl treatment was measured from day 9 of stress, in comparison to the control. In the final stages of the experiment (stress day 22), negative values of CO2 assimilation (−1.29 µM CO2·m−2 s−1) were measured. At a salinity of 100 mM NaCl, the CO2 assimilation was significantly reduced on stress day 12 compared to control; at the end of the experiment; however, there was no significant difference between control and 100 mM NaCl exposure.
The values of the substomatal CO2 (Ci) concentration at the 100 mM NaCl concentration were stable and comparable to the control throughout the experiment. The same applied to the 300 mM NaCl treatment, with the exception of day 22, when there was a rapid increase in the Ci values (6382.53 µM M−1). This increase in the substomatal CO2 concentration was almost 23 times higher than the control (Figure 2b). This sharp increase in Ci values was also documented by principle component analysis (PCA) (Figure 3a).
The stomatal conductance was significantly lower than the control for both 100 and 300 mM NaCl, from the third day of stress exposure (84.6 and 75.2 M H2O m−2 s−1, respectively). Differences between the two saline treatments were not significant (Figure 2c). There was a significant decrease in the stomatal conductance values with 300 mM NaCl on days 6 and 9 of stress exposure (76.6 and 28.8 M H2O m−2 s−1, respectively) and at 100 mM NaCl on days 9 and 12 of stress exposure (65.4 and 25.5 M H2O m−2 s−1, respectively). According to the PCA, there was a clear trend of reduction in CO2 assimilation over time and also in the dependence on NaCl concentration, where a high salt concentration reduced the CO2 assimilation. The stomatal regulation was already noticeable at the beginning of the experiment (Figure 3a).

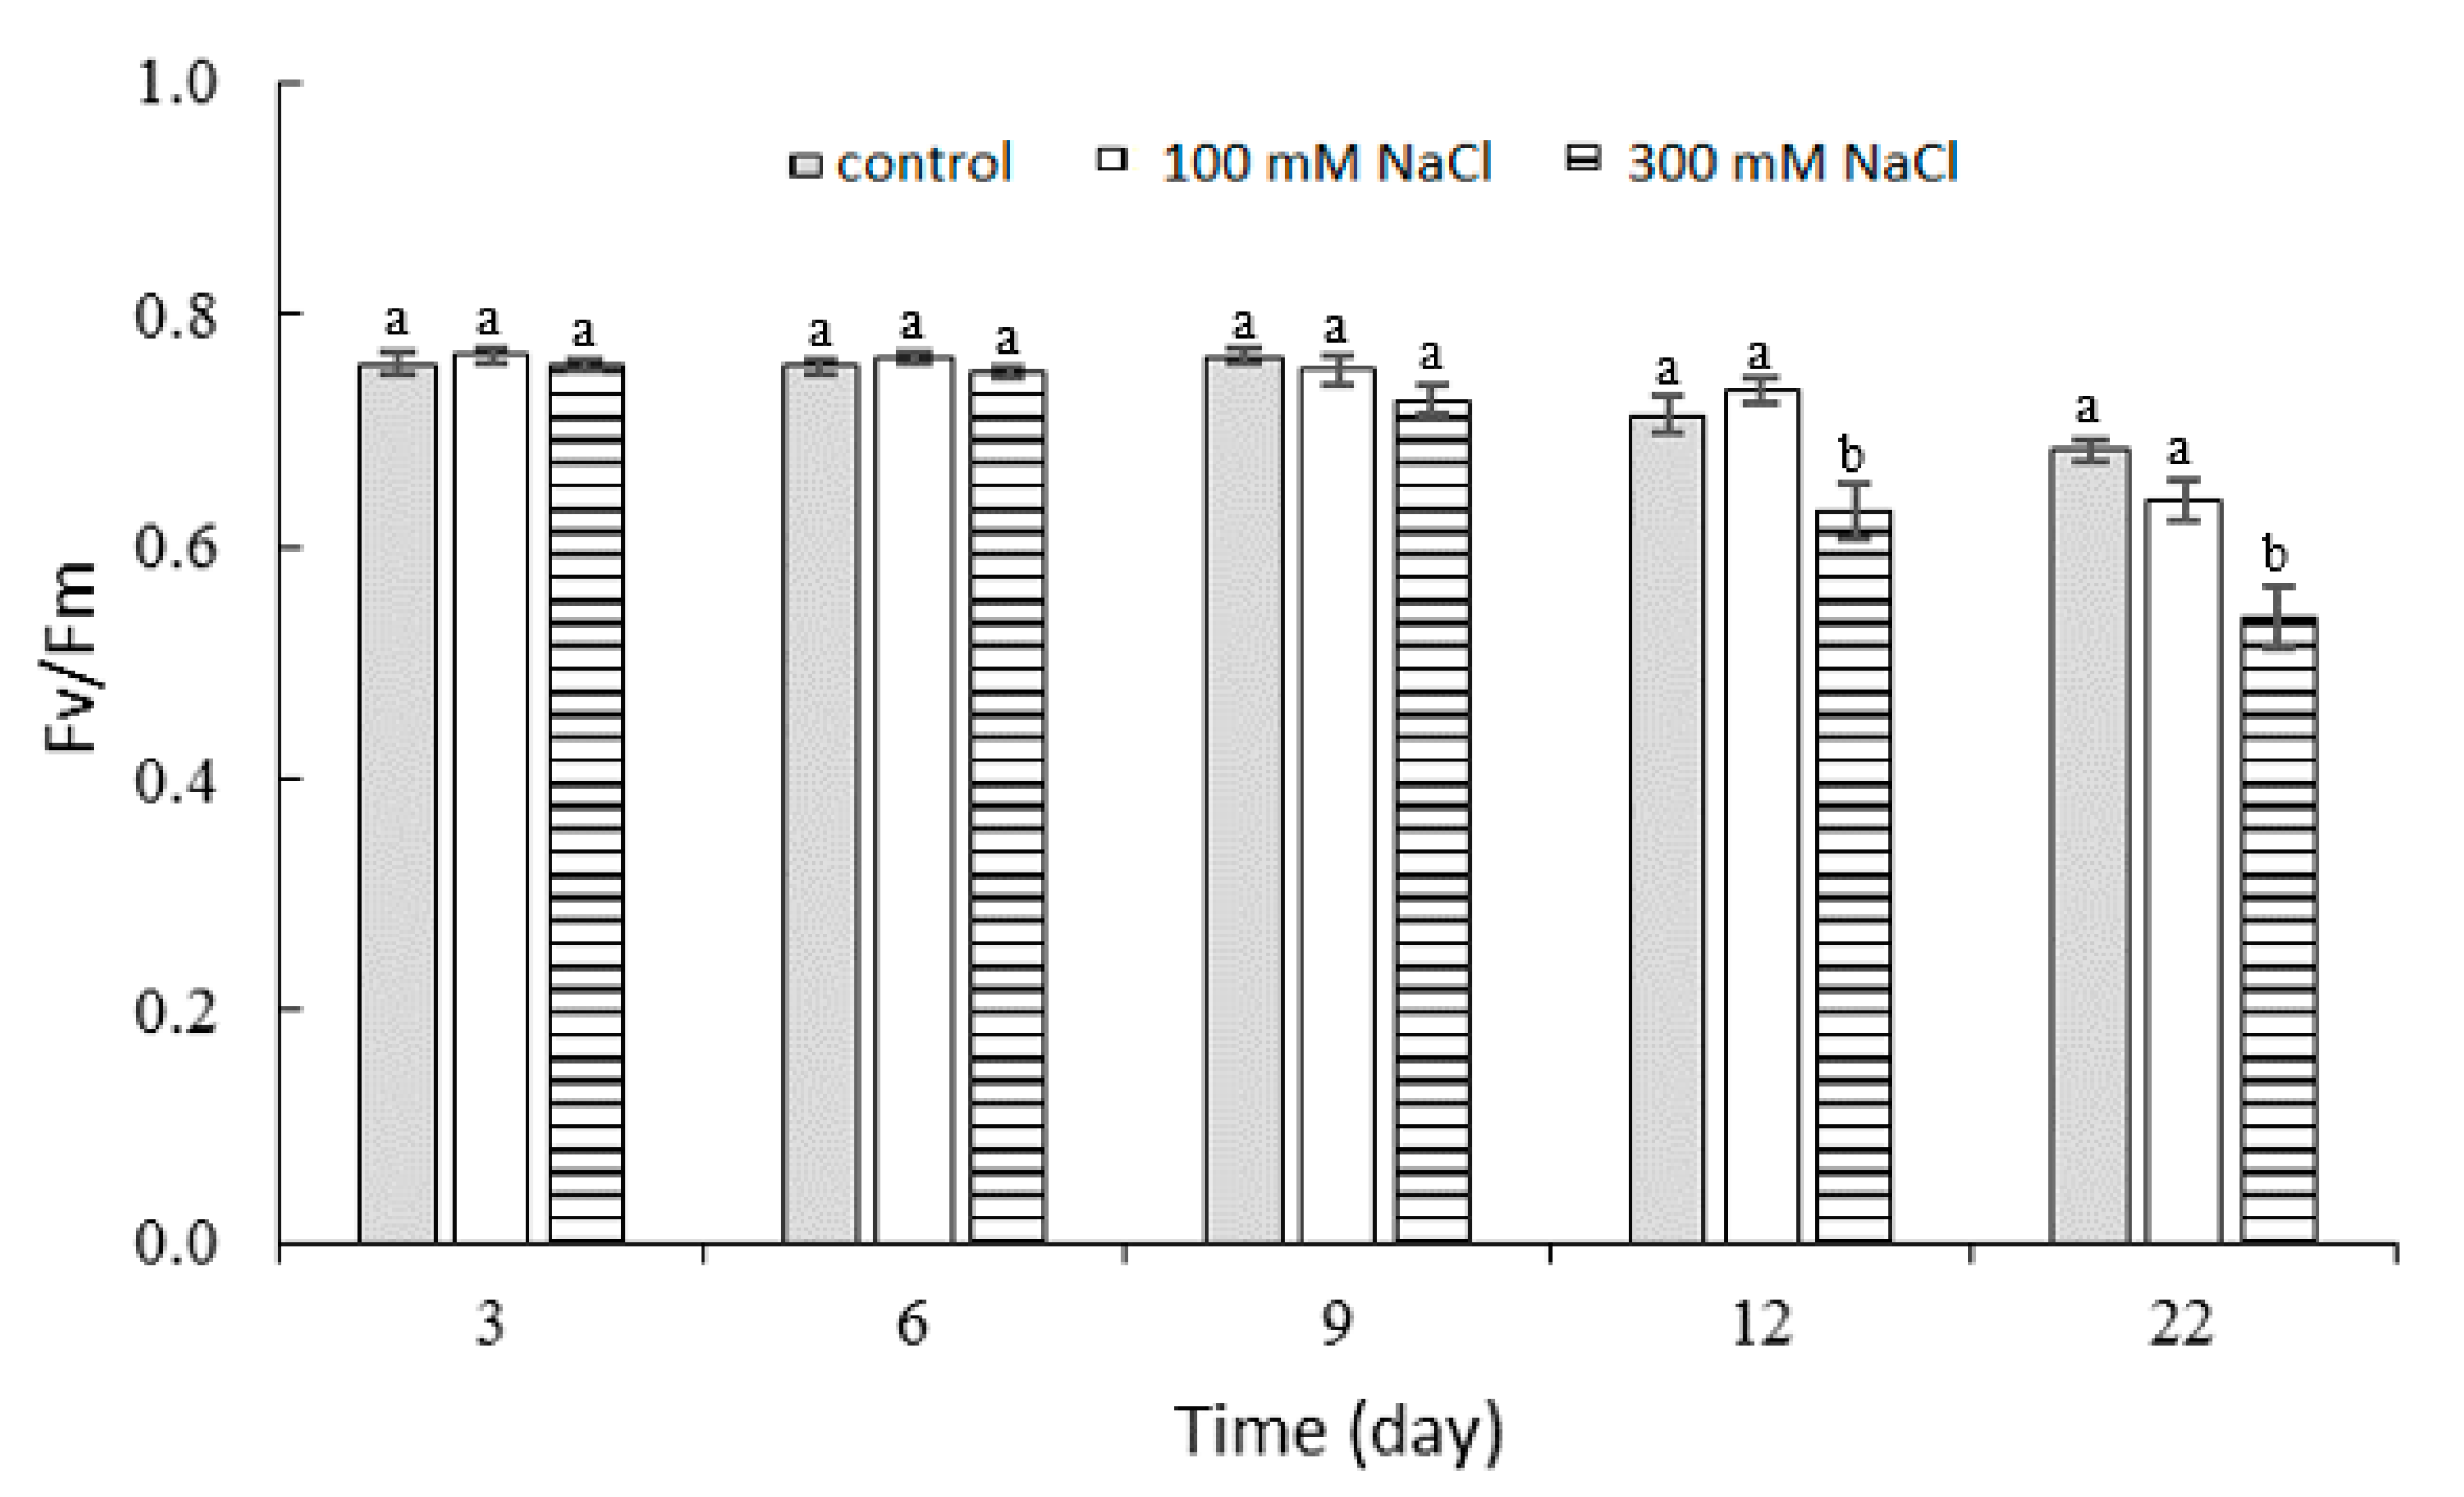
2.3. Effect of NaCl Concentration and Salt Stress Exposure Time on Chlorophyll Fluorescence

For the 100 and 300 mM NaCl treatments, no significant differences were measured in the values of the maximum quantum yield of PSII (Fv/Fm), compared to the control at up to day 9 of stress. A progressive decrease in the maximum quantum yield of the PSII photosystem occurred from day 9 (0.73) until the end of the experiment (0.54) with 300 mM NaCl exposure. Throughout the experiment, there were no significant differences between the control and 100 mM NaCl (Figure 4).

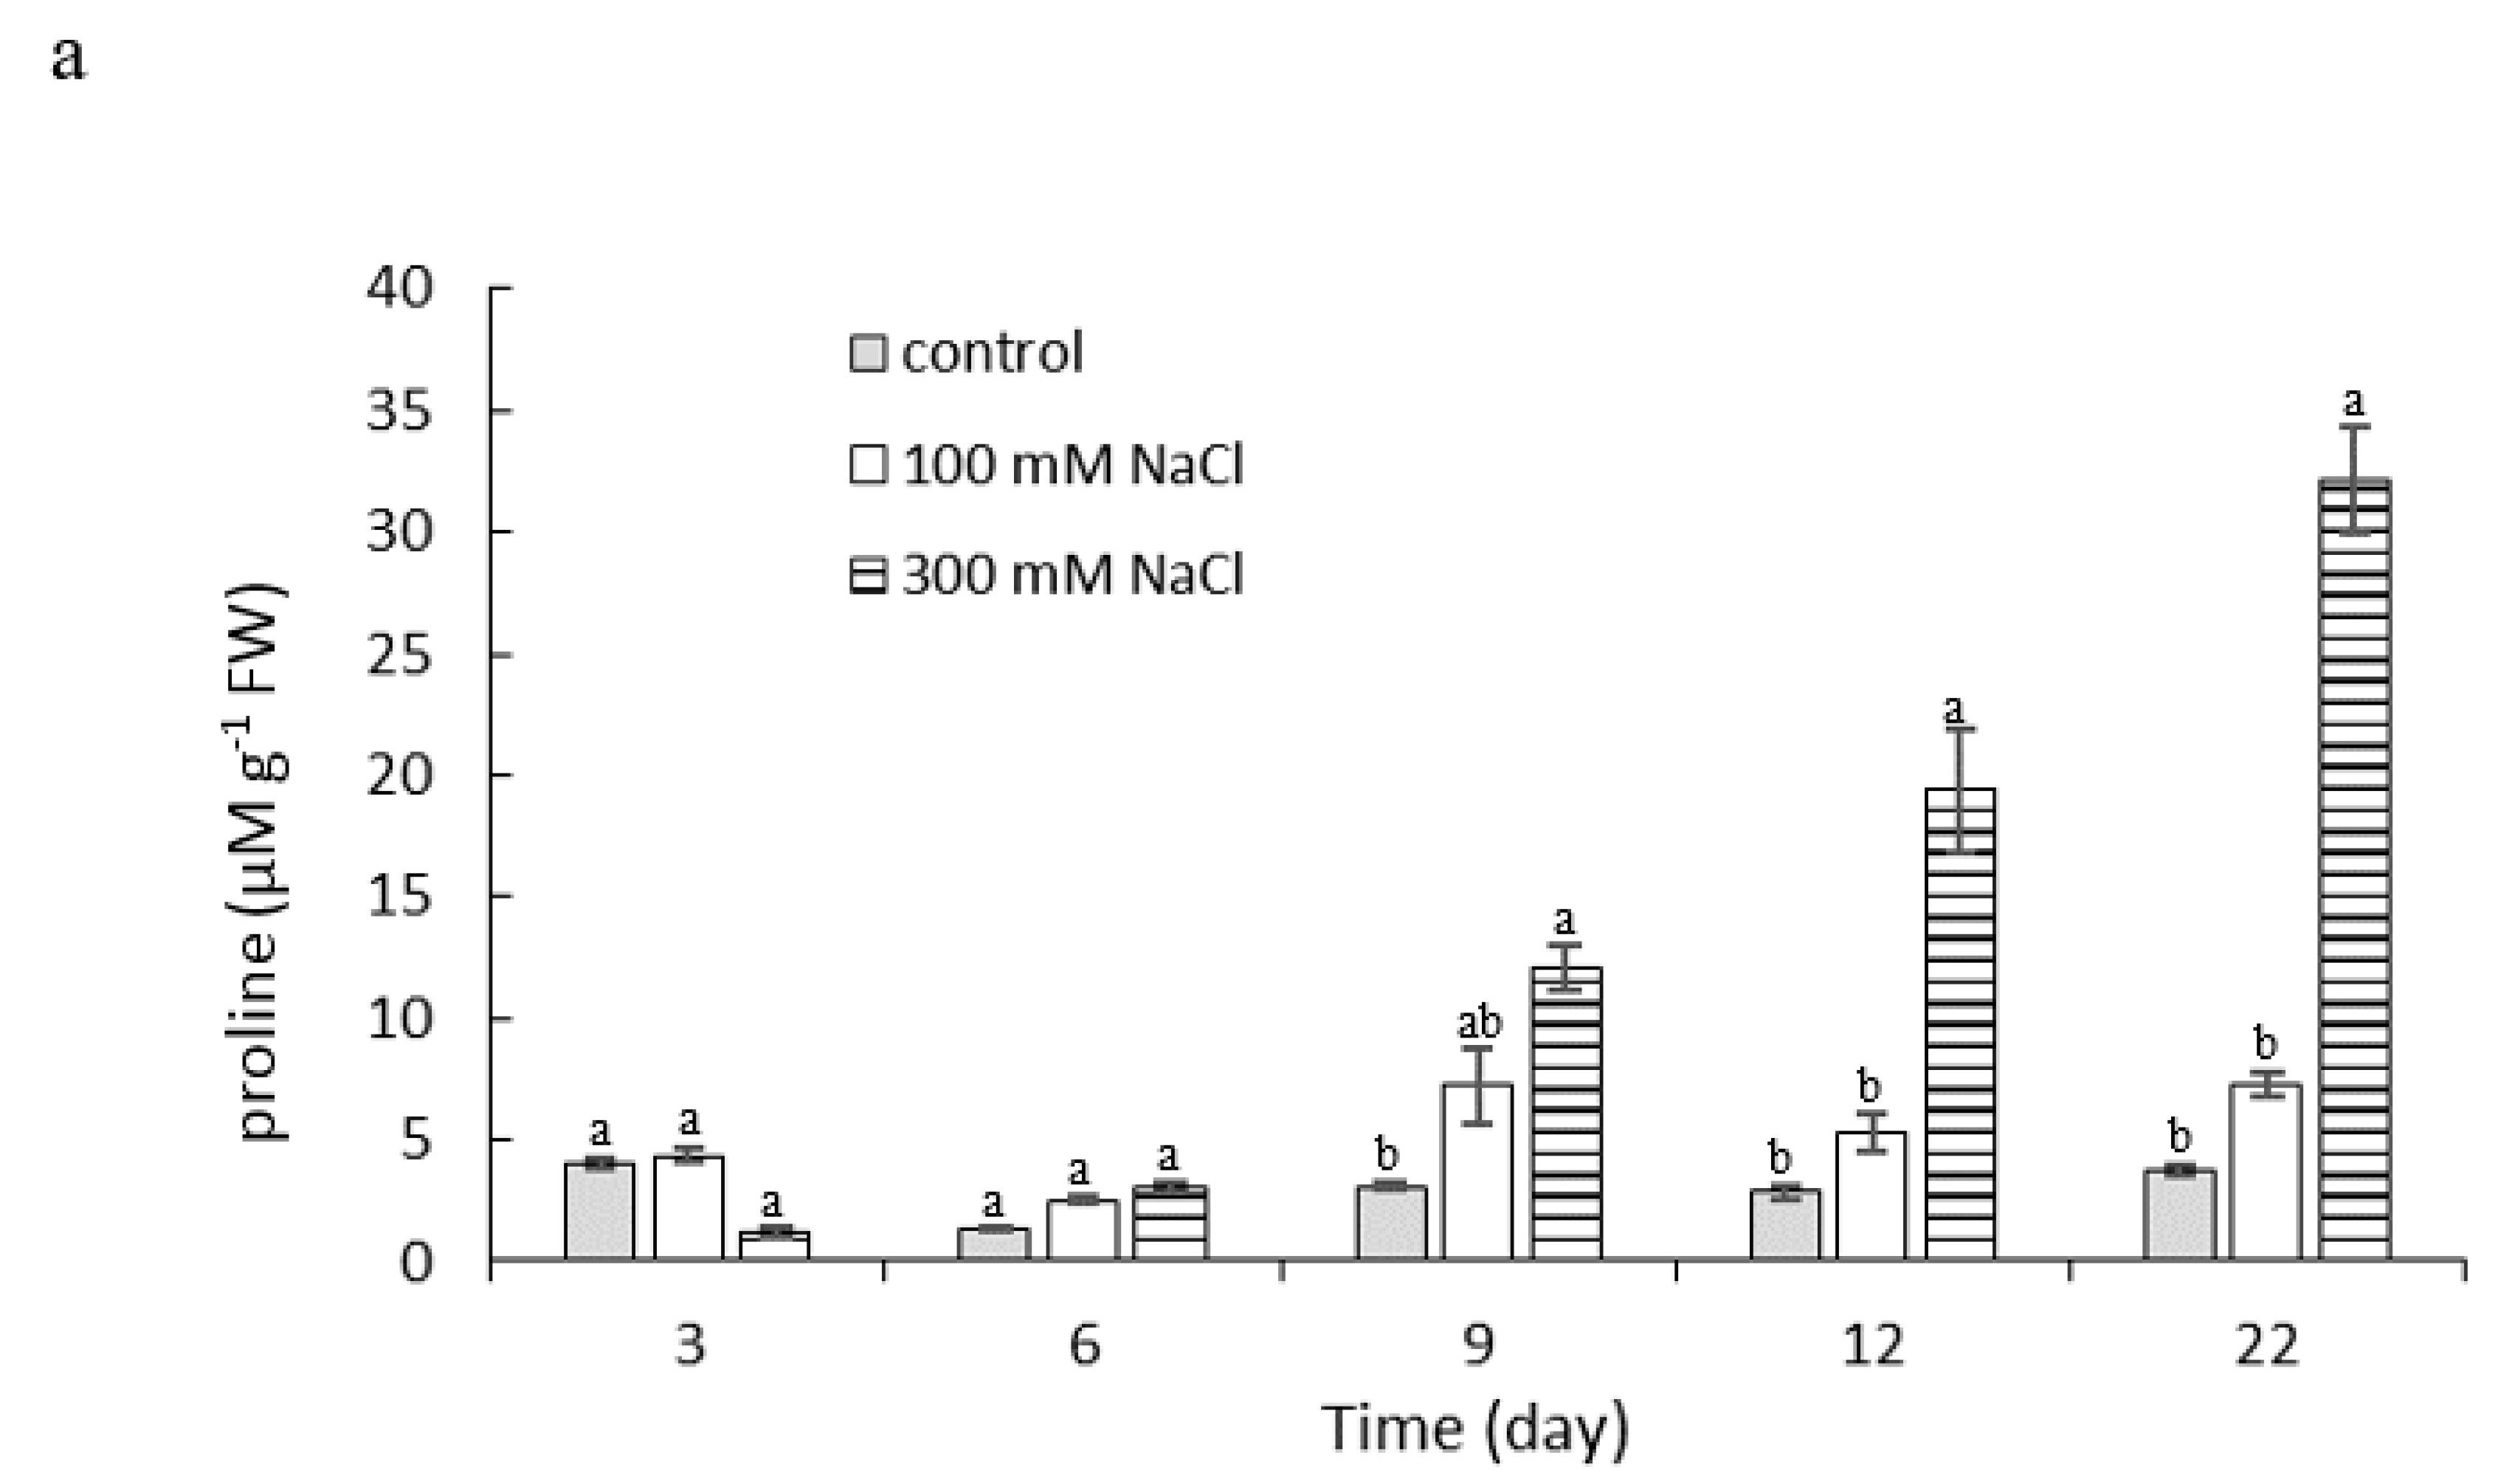
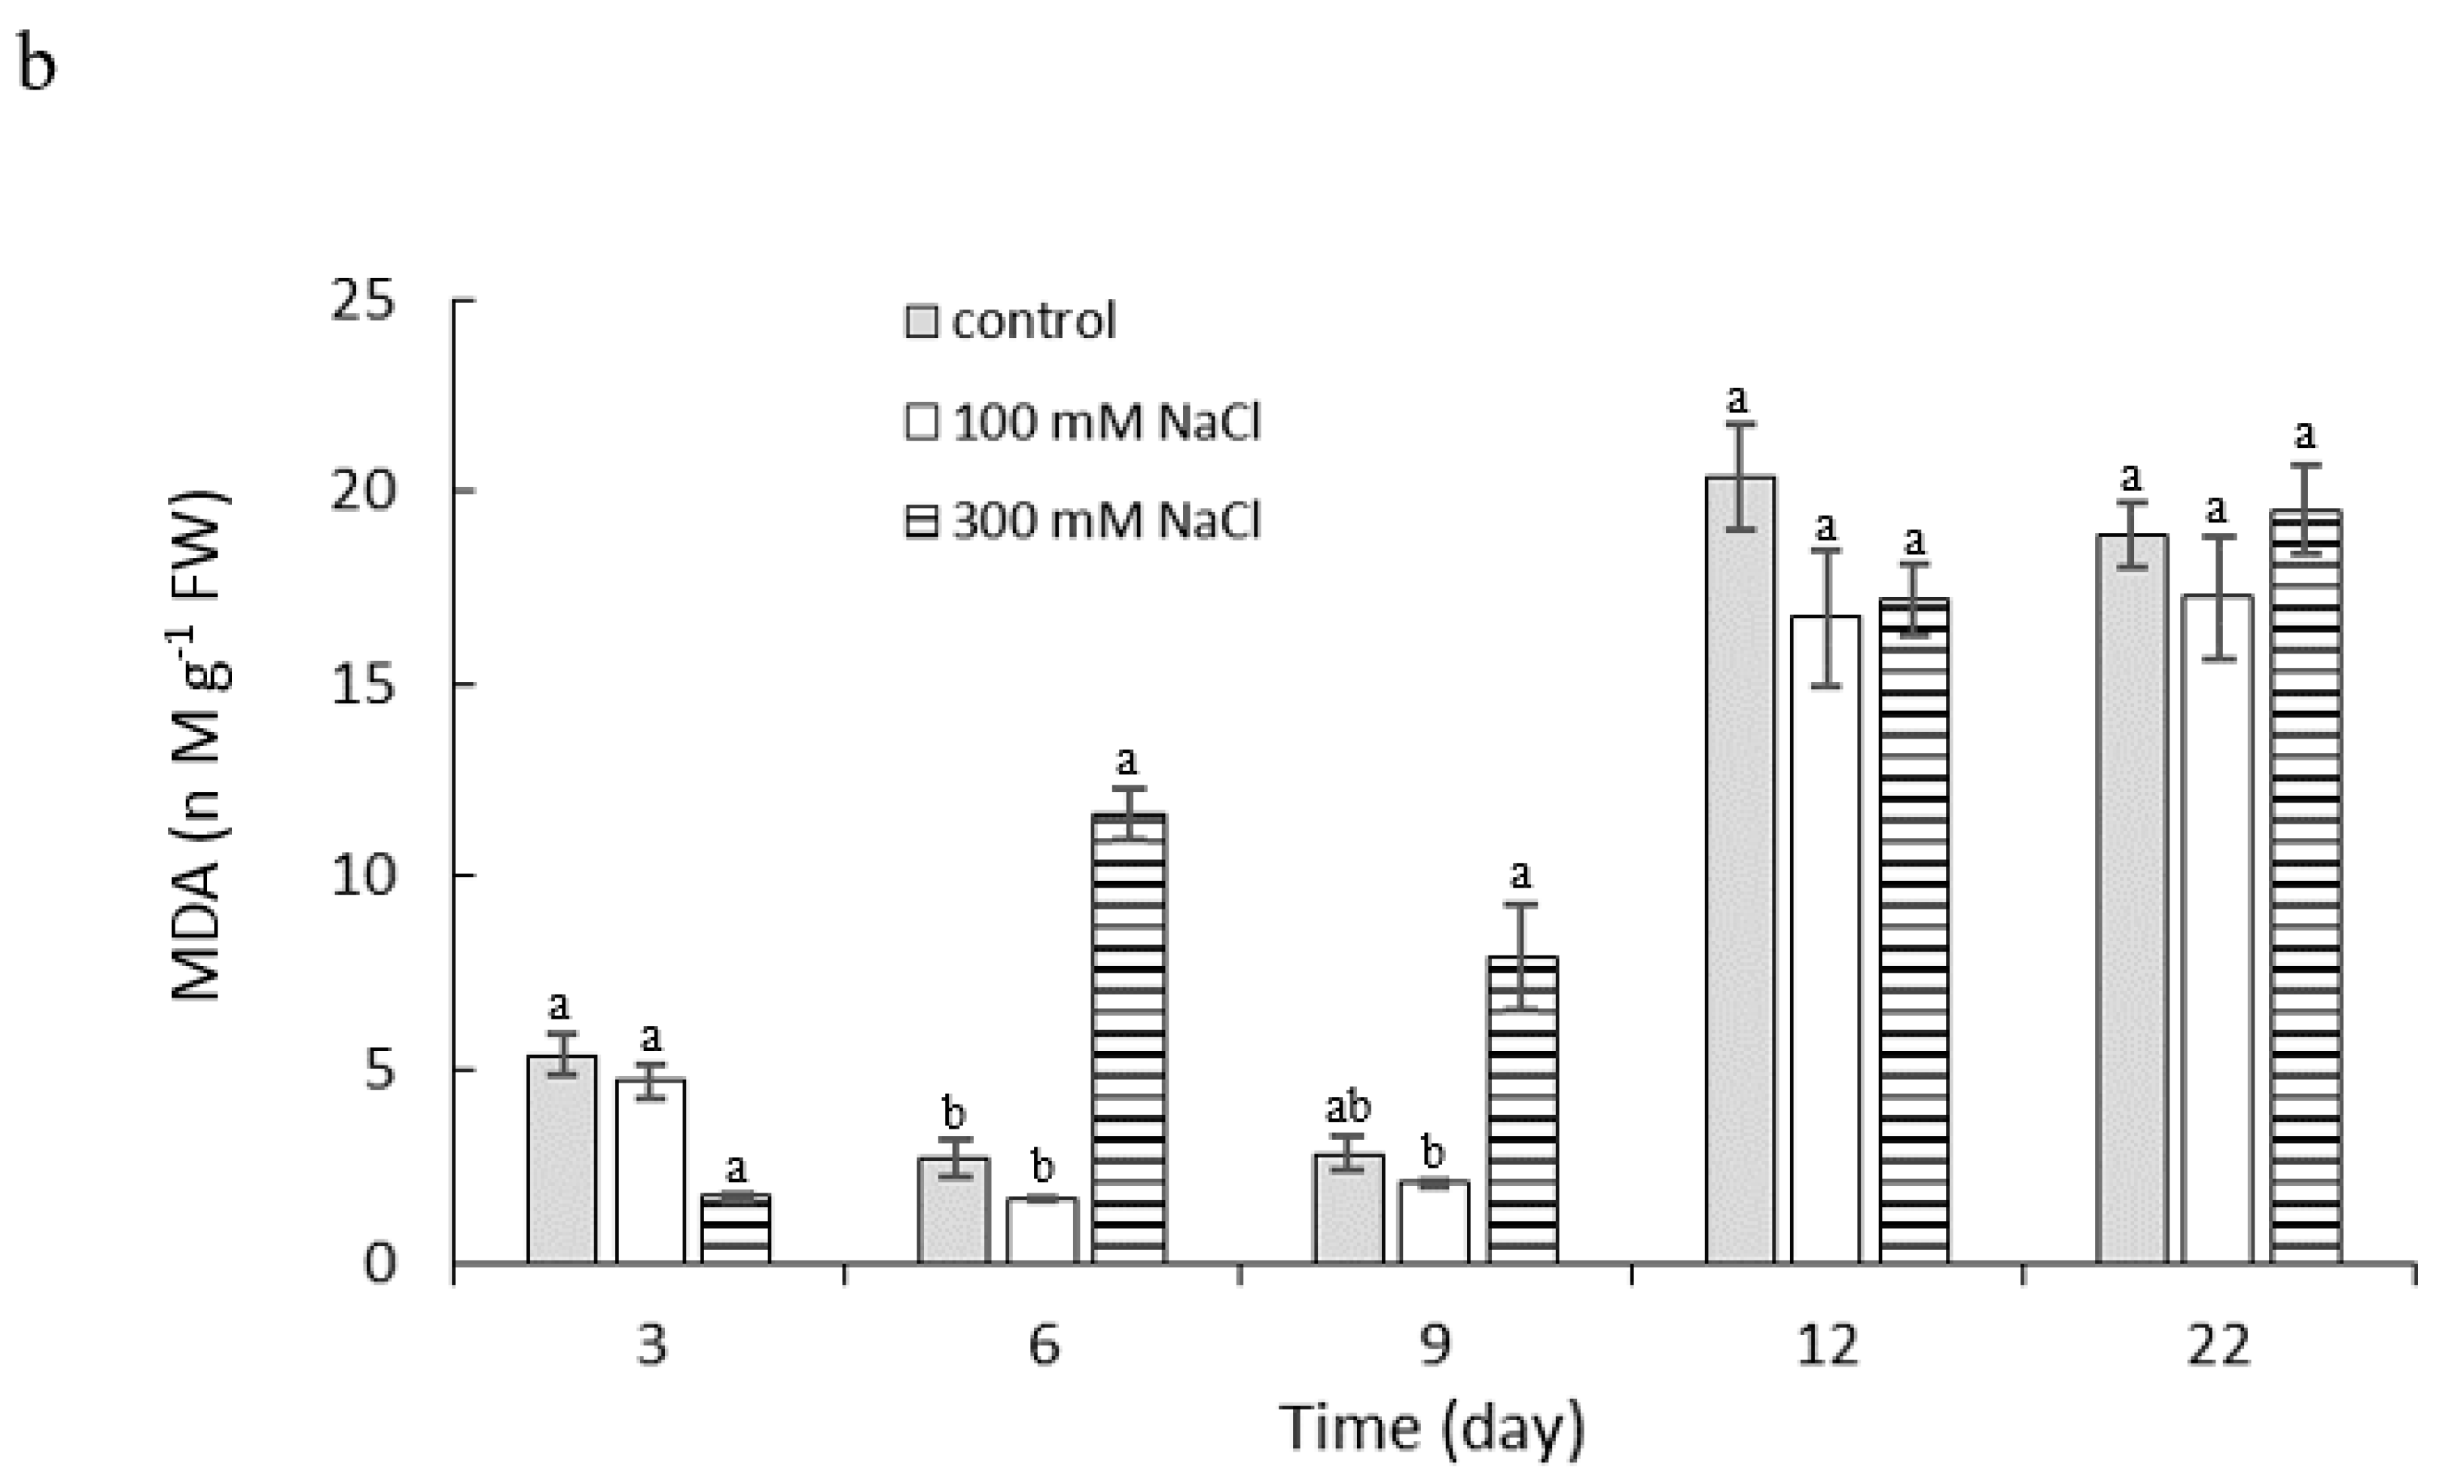
2.4. Effect of NaCl Concentration and Salt Stress Exposure Time on Proline and Malondialdehyde Content

By the sixth day of salt stress exposure, no significant differences in the free proline content in the leaves of the experimental samples were seen compared to control. A significant progressive increase in free proline content in the leaves was recorded for the 300 mM NaCl treatment from exposure on day 9 until the end of the experiment. The free proline content on day 22 of stress exposure at this salinity was 32.12 µM g−1 FW (fresh weight), which is almost 11 times higher than the proline content on day 6 (3.03 µM g−1 FW). The content of free proline in the 100 mM NaCl variant ranged from 2.54 to 7.24 µM ·g−1 FW throughout the experiment and there was no significant difference relative to control (Figure 5a).
At the initial stages of stress exposure, the differences in MDA level between the salinity treatments were inconclusive. A significantly higher MDA content compared to the control group was seen with the 300 mM NaCl treatment on days 6 and 9 of stress exposure (11.62 and 7.89 nM g−1 FW, respectively). For the rest of the experiment, no significant differences between the saline treatments were seen. A common trend for all treatments was an increase in MDA at the end of the experiment (Figure 5b). The PCA results (Figure 3b) showed a close relationship between proline content and high salt concentration, as well as a negative correlation between proline content and water potential (r = 0.938).

3. Discussion

As carbon dioxide assimilation increases or decreases, the photosynthetic absorption of solar energy, CO2 fixation, and glucose formation are likewise altered. The rate of photosynthesis can be affected by environmental factors at all levels, and many researchers have reported a reduction in the rate of photosynthesis due to salinity [3,33,34]. In this study, the plants treated with the lower concentration of salt (100 mM NaCl), showed a higher assimilation of CO2 in the initial phases of salt stress (48% more than control), although it is possible to observe a demonstrable decrease in stomatal conductance already in this phase of salt exposure. The stomatal regulation of vapor loss is extremely sensitive to short-term salt stress [35]. Closing of the pores is one of the adaptive mechanisms to prevent loss of cell turgor from limited water supply. The salinity causes a decrease in stomatal conductance, but the rates of photosynthesis per leaf area unit sometimes remain unchanged [3]. In Arthrocnemum macrostachyum, which is considered to be extremely well adapted to salinity, an increase in net photosynthesis up to a concentration of 510 mM NaCl has been observed [36]. A reduction of the photosynthesis rate and an increase in intercellular CO2 concentration after 14 days of treatment with 100, 150, and 200 mM NaCl was reported by [37]. Tang et al. [38] showed that with increasing NaCl concentration, the intercellular CO2 concentration of purslane and the values of chlorophyll a/b increased, while the transpiration rate, net photosynthesis rate, stomatal conductivity and chlorophyll content decreased.
In this study, a significant reduction in CO2 assimilation and stomatal conductance with 300 mM NaCl occurred on day 9 of stress exposure. Reducing the stomatal conductance, leads to a reduction in intercellular CO2, which decreases the activity of several enzymes including RUBISCO [39], thus limiting carboxylation and reducing the net photosynthetic rate. After 22 days of exposure to 300 mM NaCl, negative values of CO2 assimilation and high substomatal CO2 concentrations were measured. The Portulacaceae is a plant family with remarkable diversity in photosynthetic pathways. This lineage not only has species with different C4 biochemistry (NADP-ME and NAD-ME types) and C3–C4 intermediacy, but also displays different anatomical leaf configurations [40]. P. oleracea is characterized by a leaf type with Kranz anatomy and an NAD-malic enzyme (NAD-ME) -type C4 cycle [41]. The genus Portulaca contains the only known example of a C4 plant which can switch to crassulacean acid metabolism (CAM) under drought stress [42,43]. Salinity reduced the gas exchange and induced CAM metabolism, thus conferring higher water-use efficiency in Talinum triangulare [44].
The CAM gas exchange process has been described in four phases. The nocturnal uptake of CO2 via open stomata, fixation by phosphoenolpyruvate carboxylase (PEPC) and vacuolar storage of CO2 in the form of organic acids, mainly malic acid comprise phase I. Daytime remobilization of vacuolar organic acids, decarboxylation and refixation plus assimilation of CO2 with closed stomata in the Calvin cycle is defined as phase III. Between these two phases there are transitions when the stomata remain open for CO2 uptake for a short time during the very early light period (phase II) and reopen again during the late light period for CO2 uptake with the direct assimilation to carbohydrate, when the vacuolar organic acid is exhausted (phase IV) [45]. The results obtained at a concentration of 300 mM NaCl in the final phase of the experiment, primarily the negative CO2 assimilation, high Ci values, and closed stomata data, can be related to the transition of the C4 cycle of photosynthesis to the CAM cycle. These results correspond with those of Ferrari et al. [46] who stated that CAM was completely reversible and environmentally controlled in P. oleracea leaves. An elevated measurement of internal CO2 concentration was related to the daily malate decarboxylation (phase III), when the stomatal resistance values were high (stomatal conductivity values were low) [47,48]. High internal CO2 concentrations during phase III of CAM and closed stomata allow optimal utilization of light energy [49]. The transition from C4 to CAM under drought conditions and a return to C4 metabolism after subsequent rehydration was reported by [43]. The fixation of CO2 in the dark, although representing only 10% of the control plants’ fixation [43] or the reassimilation of CO2 from respiration, helped to bridge water deficit periods caused by drought or salinity, and thus helped to maintain a positive CO2 balance [50]. The induction of CAM was also demonstrated after 21 to 23 days of drought stress in the C4 plant, P. oleracea, in terms of changes in CO2 exchange profile, malic acid content and in titratable acidity during the day/night cycle [51].
At the 100 mM NaCl concentration, there was no transition to the CAM cycle, although the net assimilation of CO2 and stomatal conductance decreased during the experiment. These parameters also decreased in the control plants. One of the possible causes is leaf senescence, as P. oleracea has a brief growing season and the CO2 assimilation decreases during senescence, which can be considered a form of stress for the plants [52]. Karkanis and Petropoulos [53] reported a decrease in photosynthesis and stomatal conductance in a set of P. oleracea genotypes forty days after sowing and attributed it to exposure to a high temperature (40 °C).
The ratio of Fv/Fm is a very important plant characteristic because it indicates how efficiently the light reaction is proceeding, and it is widely used when studying the impact of stress on plants. An Fv/Fm in the range of 0.79 to 0.84 is a normal value in a number of species [54]. Salt stress of 300 mM NaCl) significantly reduced Fv/Fm on day 12 of exposure. The lower value indicated that a percentage of the PSII reaction centers were damaged or inactivated, a phenomenon commonly observed in plants under stress [55]. Salinity blocked electron transfer from the primary acceptor, plastoquinone (QA) to the secondary acceptor, plastoquinone (QB) at the acceptor side of PSII, which led to a decrease in Fv/Fm [56]. A decrease in the maximum quantum yield of PSII in response to salt was also reported for Raphanus sativus L. [57], Brassica napus L. [58], and Eruca sativa L. [12]. The 100 mM NaCl concentration did not significantly affect Fv/Fm initially compared to the control, but a decrease in the Fv/Fm was observed at both NaCl concentrations in the final phase of the experiment. The ratio of Fv/Fm at 100 mM NaCl was slightly increased compared to 300 mM NaCl [59].
Due to the reduced availability and fixation of CO2, an imbalance between electron excitation and utilization by photosynthesis can occur leading to the production of ROS, especially superoxide (O2-) and hydrogen peroxide (H2O2) [60], which can damage cellular structures [61]. ROS detoxification pathways play a protective role in responding to salt stress by removing toxic radicals generated from the mitochondrial and chloroplast electron transport chains. The antioxidant defense systems include both enzymatic (superoxide dismutase, catalase, and ascorbate peroxidase) and non-enzymatic components (carotenoids and glutathione) [62]. In response to salinity, a large number of compatible solutes may accumulate, especially proline. Glycine betaine [63], sugars, and sugar alcohols [64] also play an important role in osmoregulation. A rapid increase in free proline in leaves occurred in the second half of the experiment in plants treated with 300 mM NaCl, while the water potential of their leaves decreased. Proline provides stress protection to the plants by maintaining osmoregulation and detoxifying ROS, which preserves membrane integrity and stabilizes enzymes and other proteins [65,66]. The increase in proline content after 21 days in two P. oleracea genotypes, T-16 and WI-9, with 200 mM NaCl salt stress was reported by [67]. Yazici et al. [68] found a threefold increase in proline content in P. oleracea plants treated with 140 mM NaCl for 30 days, and stable values for plants treated with 70 mM NaCl for 18 and 30 days. These results are comparable to our data, where plants treated with 100 mM NaCl did not show an increase in free proline content throughout the experiment compared to controls, demonstrating portulaca’s tolerance to salinity at this salt level. The increase in free proline in Portulaca was reported to be 4.6-fold in comparison with control [53].
Malondialdehyde (MDA) is a natural product of lipid peroxidation and is traditionally used as an indicator of the degree of damage caused by stress to cells [69]. Plants exposed to salinity of 100 mM NaCl did not show a significant increase in lipid peroxidation due to stress compared to control. The common phenomenon in our studied plants was an increased content of MDA due to leaf senescence and an increased rate of lipid peroxidation due to oxidative stress [70]. Similar results were reported by Yazici et al. [68]. In their experiments, the MDA content of the control plants increased by 39% during the trial, but 70 mM NaCl exposure did not increase MDA compared to control. After 30 days of exposure to 140 mM NaCl, however, there was a clear increase in MDA compared to control. Different results were reported by Xing et al. [37] for treatment with 100, 150, and 200 mM NaCl, which increased MDA- and O2-production and resulted in damage to cell membrane integrity and protein activity. They stated that long-term exposure to high salinity might destroy some cell membranes, leading to lower SOD, POD, and CAT activities. On the contrary, lipid peroxidation from oxidative stress could not occur within a short period (five weeks) of applied stress [71]. The tolerance of purslane to salinity might be related to an increased capacity of the antioxidant system to scavenge ROS, thus suppressing the level of lipid peroxidation, and inducing the accumulation of osmoprotectant proline under saline conditions [38].
The plants treated with 300 mM NaCl showed an increase in MDA compared to the control groups on days 6 and 9 of the experiment, but in the subsequent phases of stress exposure, the differences were non-significant. An activation of the defense and adaptation mechanisms associated with increased activity of the antioxidant system, limited the formation of ROS, and suppressed the level of lipid peroxidation. These mechanisms are manifested by a rapid increase in proline content and osmotic adaptation, which are closely related to salinity tolerance and the ability of the antioxidant system to scavenge free radicals, suppress lipid peroxidation, and promote the accumulation of osmoprotective agents such as proline.

4. Materials and Methods

4.1. Experimental Design and Salinity Treatments

The experimental plants of purslane, Portulaca oleracea L., cv. Grene, were grown in containers (13 cm × 13 cm) in a garden substrate (pH 5–6.5, nutrient content: N 80–120 mg L−1, P 22–44 mg L−1, K 83–124 mg L−1; 80% white peat, 20% black peat, 20 kg of clay m−3; structure 0–10 mm). The plants were grown in the growth room with the following controlled conditions: air temperature of 25 ± 2/18 ± 2 °C day/night, relative humidity 65–75%, light intensity 450 ± 50 μM m−2 s−1, and photoperiod 12 h light and 12 h dark. Salinity treatments were started on 25-day-old plants with 0 (deionized water, control), 100 and 300 mM NaCl. Measurements of the monitored physiological parameters and the chemical analyses were performed on days 3, 6, 9, 12, and 22 of salt stress.

4.2. Leaf Water Potential

Leaf samples for the determination of leaf water potential (ψw; MPa) were placed into a 5 mL syringe, sealed with Parafilm, and frozen at −24 °C. Prior to the measurements, the samples were kept at laboratory temperature until the tissue was completely defrosted. The water potential was determined by putting several drops of the cells sap upon targets of Whatman #1 filter paper (1.5 cm in diameter) and measured using a WP 4C Dew Point PotentiaMeter (Decagon Devices, Inc., Pullman, WA, USA). The measurements were performed with three repetitions of the five plant samples.

4.3. Leaf Gas Exchange

The net CO2 assimilation (A; μM CO2 m−2 s−1), stomatal conductance (gs; M H2O m−2 s−1) and substomatal concentration of CO2 (Ci; μM M−1), were measured in situ when the 4th or 5th fully expanded leaves appeared, using a portable gas exchange system LCi Portable Photosynthesis System (ADC BioScientific Ltd., Hoddesdon, Great Britain). The gas exchange was measured from 9:00 a.m. to 11:00 a.m. The irradiance was 450 μM m−2 s−1 of photosynthetically active radiation (PAR). With a normal concentration of CO2, the temperature in the measurement chamber was 23 °C, and the duration of the measurement of each sample was about 15 min, after the establishment of steady-state conditions inside the measurement chamber. The measurements of these parameters took place on single leaves from three different plants.

4.4. Chlorophyll Fluorescence

The minimum chlorophyll fluorescence (F0) and the maximum chlorophyll fluorescence (Fm) were also measured in situ with a portable fluorometer OS5p+ (ADC BioScientific Ltd., Hoddesdon, Great Britain) with 1s excitation pulse (660 nm) and a saturation intensity of 3000 μM m−2 s−1. Measurements were made when the 4th or 5th fully expanded leaves appeared after a 20 min dark adaptation period between 9:00 and 11:00 (local solar time) using leaf-clips which were put on the adaxial leaf blades away from the leaf vein. Dark adaptation time was the time needed to obtain a steady value of Fv/Fm. The maximum quantum yield of PSII was calculated using the formula: Fv/Fm = (Fm − F0)/Fm. These parameters were measured with three repetitions on five plants.

4.5. Proline Content

The content of free proline was determined using the method of Bates et al. [72] with modifications. A sample of leaves (0.5 g) was homogenized in 10 mL of 3% sulfosalicylic acid using a mortar and pestle and the homogenate was filtered through filter paper. Aliquots of 1 mL of the filtrate were mixed with 1 mL of acid ninhydrin solution and 1 mL of acetic acid and placed on a shaker for 20 minutes. The samples were then heated at 90 °C for 30 minutes, cooled in ice water, thoroughly mixed with 3 mL of toluene, and incubated 20 min at room temperature. The samples were held for 24 hours at 4 °C, after which the upper layer of the separation mixture was used for measurement of absorbance at 520 nm (UV–Vis, Evolution 210, Thermo Scientific, Waltham, MA, USA). Five plants were used as independent samples for each treatment. The proline concentration was determined using a calibration curve for proline as µM g−1 FW (fresh weight).

4.6. Malondialdehyde (MDA)

The content of malondialdehyde (MDA) was measured based on a modified thiobarbituric acid (TBA) method [73]. Samples of leaves (0.4 g) were homogenized with liquid nitrogen and 80% ethanol and centrifuged in 2 mL microcentrifuge tubes for 5 min and at 6000 rpm. Aliquots of 0.7 mL of each supernatant were mixed with 0.7 mL of 0.65% TBA in 20% TCA (trichloroacetic acid) and 0.01% BHT (butylated hydroxytoluene) and a second set of 0.7 mL samples was mixed with 0.7 mL 20% TCA and 0.01% BHT. The microcentrifuge tubes were incubated at 95 °C for 25 minutes and after cooling, they were centrifuged for 5 minutes at 6000 rpm. The absorbance at 440 nm, 532 nm, and 600 nm was read on a UV–Vis spectrophotometer (Evolution 210, Thermo Scientific) and the concentration of MDA (nM g−1 FW) was calculated using an extinction coefficient of 157 mM cm−1.

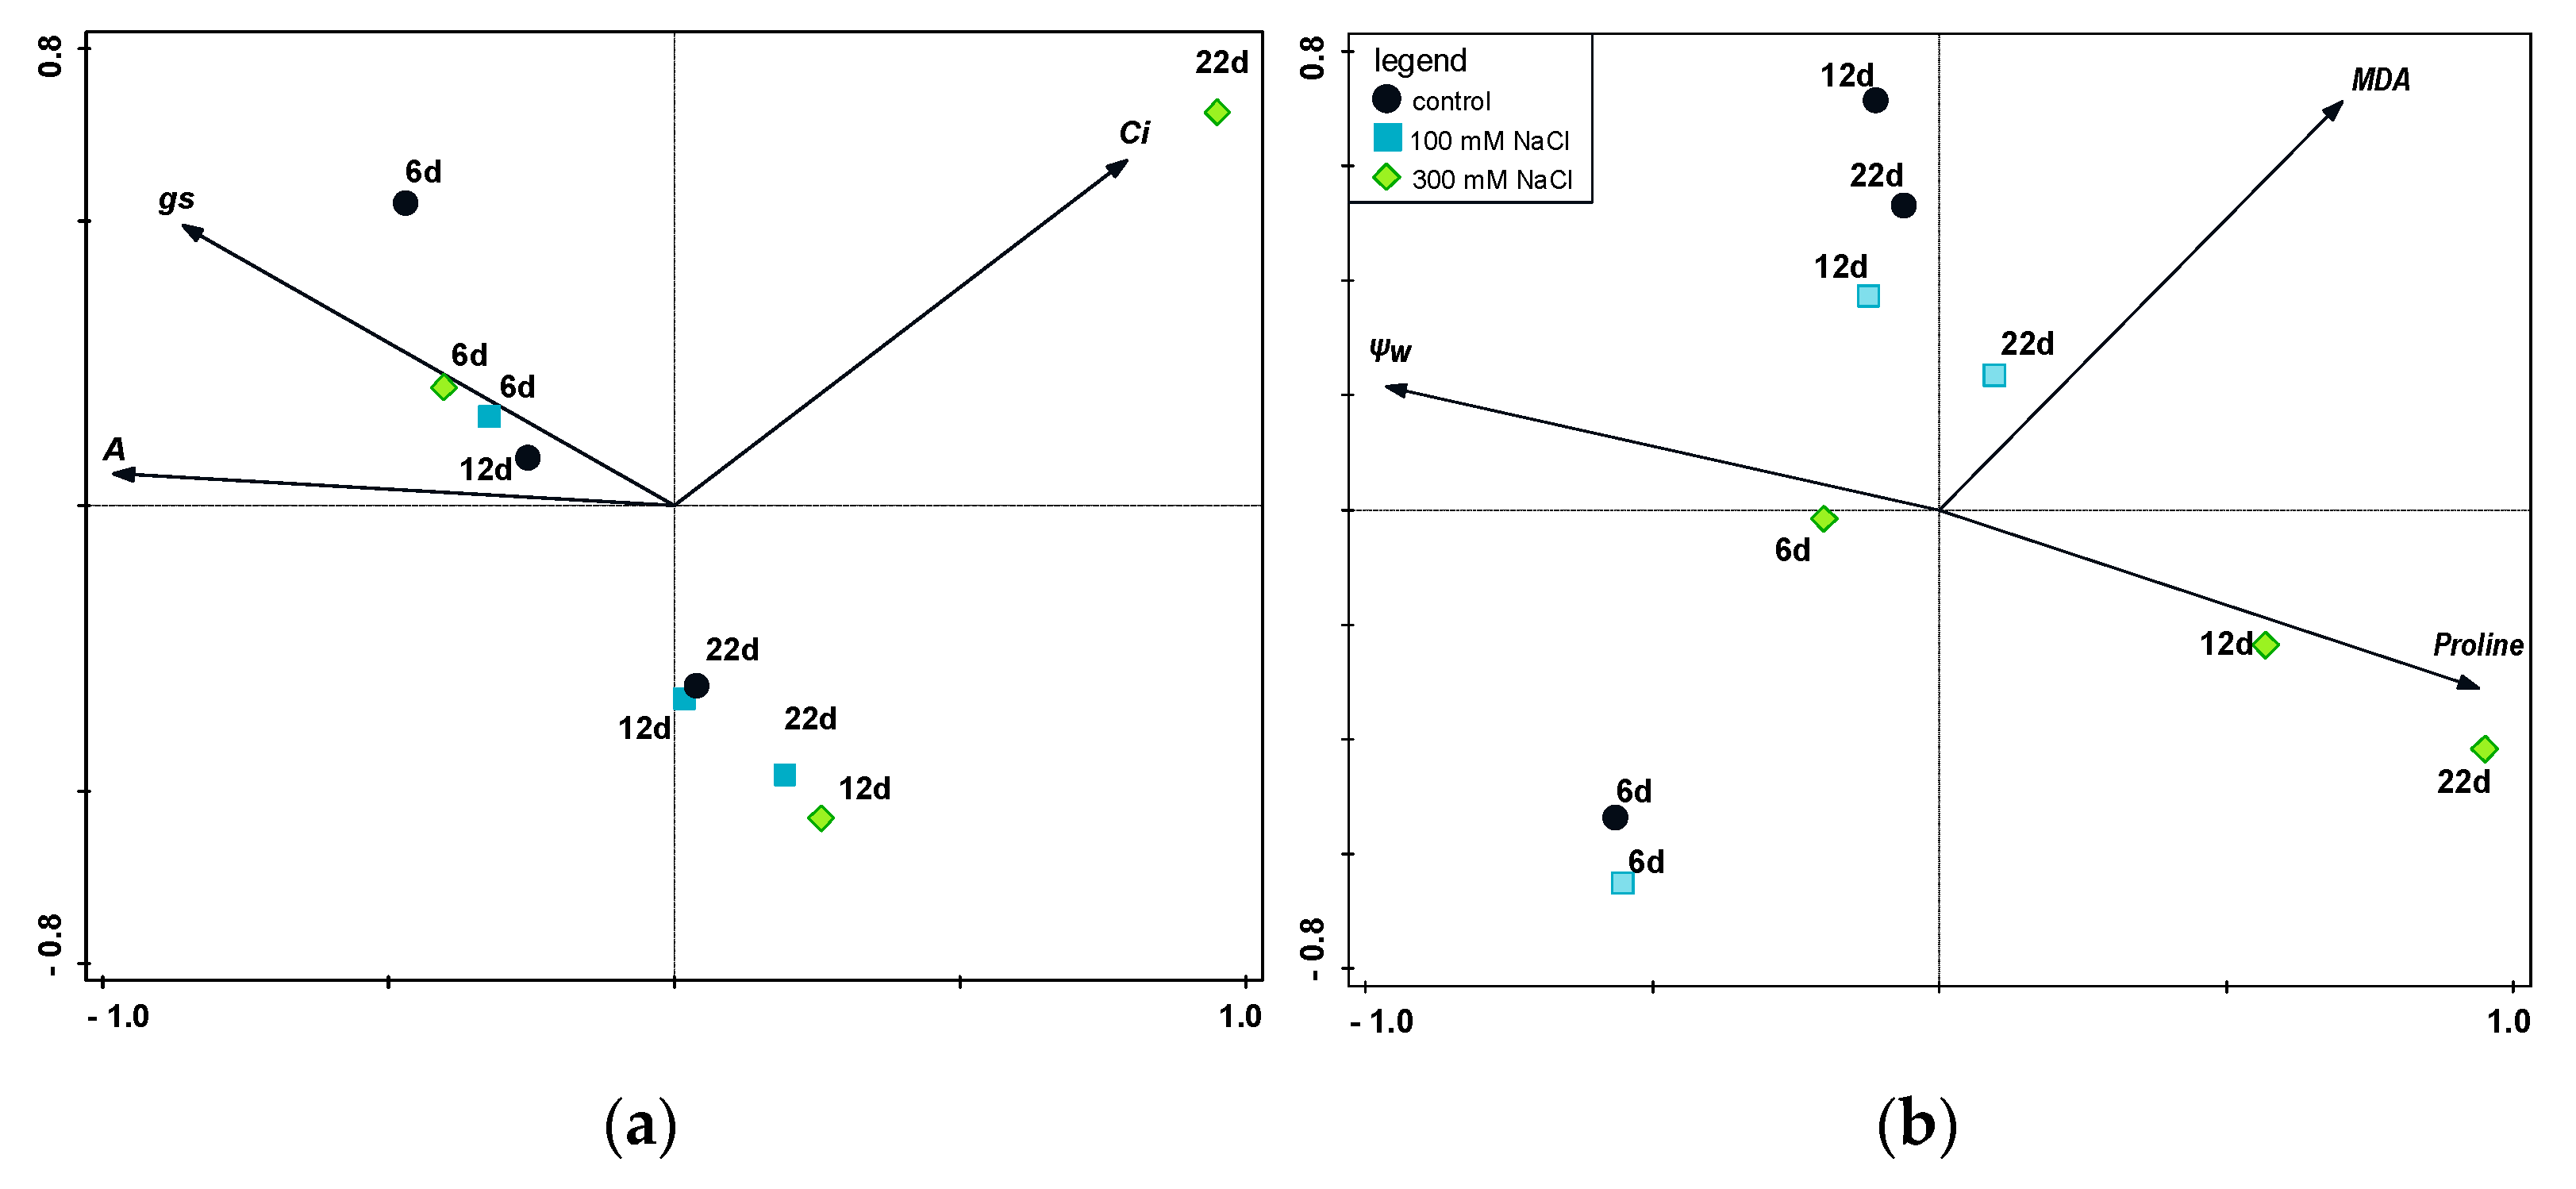
4.7. Statistical Analysis

One-way ANOVA was used to evaluate the variables from the treatments. After obtaining significant results (p < 0.05), multiple comparisons using the Tukey HSD test were applied to identify significant differences between treatments. All analyses were performed using Statistica 13.5 software (Statsoft, Tulsa, OK, USA). Program Canoco 5 [74] was used for PCA (principal component analysis). This analysis was appropriate for finding the differences in reactions of P. oleracea to the salinity treatments on individual days).

5. Conclusions

The results from the combined salinity effects of osmotic and ionic stress were different at different NaCl concentrations manifesting with specific adaptive responses from the plants exposed to stress. The lower salt concentration caused only stomatal regulation of water deficit, as one of the primary regulatory factors of water deficit, without the involvement of other biochemical responses to cope with the stress. At the same time, the lower salt concentration increased photosynthetic CO2 assimilation at the beginning of salt exposure. During the stress exposure, the maximum quantum yield of the PSII was not affected, as the Fv/Fm values were comparable to the control sample. The concentration of free proline and MDA was also similar to the control group, meaning that the level of stress did not require an increased proline synthesis for the protection of cellular structures and scavenging ROS. The osmoregulation was not significant at this level of salinity; only after prolonged salt exposure did the water potential of the leaves decrease. The toxic effect of the Na+ and Cl ions and water deficiency at higher NaCl concentrations and a longer exposure elicited a stress response in the form of activation of proline biosynthesis and the accumulation of proline to reduce cellular damage and maintain ROS homeostasis. The limited osmotic availability of water and the necessary stomatal regulation, together with the need for a supply of CO2, caused the transition from the C4 CO2 fixation mechanism to the CAM mechanism. This salinity tolerance allows Portulaca oleracea to be cultivated in slightly saline localities, or to be potentially used for other technological measures, such as co-cultivation with sensitive glycophytic species. Given the current knowledge about the behavior of Portulacaceae under saline conditions, further research in this area is recommended.

Author Contributions

Conceptualization, H.H. and F.H.; methodology, H.H. and K.K.; software, H.H., P.V., and K.K.; validation, H.H., P.V., and K.K.; formal analysis, H.H., K.K., and P.V.; investigation, H.H.; resources, H.H and K.K.; data curation, H.H., K.K., and F.H.; writing—original draft preparation, H.H.; writing—review and editing, F.H.; visualization, K.K. and P.V.; supervision, F.H.; project administration, F.H.; funding acquisition, F.H. All authors have read and agreed to the published version of the manuscript.

Funding

This research was funded by the EU—Project “NutRisk Centre” grant number CZ.02.1.01/0.0/0.0/16_019/0000845.

Institutional Review Board Statement

Not applicable.

Informed Consent Statement

Not applicable.

Data Availability Statement

Data is contained within the article.

Conflicts of Interest

The authors declare no conflict of interest. The funders had no role in the design of the study; in the collection, analyses, or interpretation of data; in the writing of the manuscript, or in the decision to publish the results.

References

  1. Shahbaz, M.; Ashraf, M. Improving Salinity Tolerance in Cereals. Crit. Rev. Plant Sci. 2013, 32, 237–249. [Google Scholar] [CrossRef]
  2. Shrivastava, P.; Kumar, R. Soil Salinity: A Serious Environmental Issue and Plant Growth Promoting Bacteria as One of the Tools for Its Alleviation. Saudi J. Biol. Sci. 2015, 22, 123–131. [Google Scholar] [CrossRef] [Green Version]
  3. Munns, R.; Tester, M. Mechanisms of Salinity Tolerance. Annu. Rev. Plant Biol. 2008, 59, 651–681. [Google Scholar] [CrossRef] [Green Version]
  4. Munns, R.; Gilliham, M. Salinity Tolerance of Crops—What Is the Cost? New Phytol. 2015, 208, 668–673. [Google Scholar] [CrossRef] [Green Version]
  5. Flowers, T.J.; Colmer, T.D. Plant Salt Tolerance: Adaptations in Halophytes. Ann. Bot. 2015, 115, 327–331. [Google Scholar] [CrossRef] [Green Version]
  6. Acosta-Motos, J.R.; Ortuño, M.F.; Bernal-Vicente, A.; Diaz-Vivancos, P.; Sanchez-Blanco, M.J.; Hernandez, J.A. Plant Responses to Salt Stress: Adaptive Mechanisms. Agronomy 2017, 7, 18. [Google Scholar] [CrossRef] [Green Version]
  7. Akbarimoghaddam, H.; Galavi, M.; Ghanbari, A.; Panjehkeh, N. Salinity Effects on Seed Germination and Seedling Growth of Bread Wheat Cultivars. Trakia J. Sci. 2011, 9, 43–50. [Google Scholar]
  8. Negrão, S.; Schmöckel, S.M.; Tester, M. Evaluating Physiological Responses of Plants to Salinity Stress. Ann. Bot. 2017, 119, 1–11. [Google Scholar] [CrossRef] [Green Version]
  9. Soltabayeva, A.; Ongaltay, A.; Omondi, J.O.; Srivastava, S. Morphological, Physiological and Molecular Markers for Salt-Stressed Plants. Plants 2021, 10, 243. [Google Scholar] [CrossRef]
  10. Yang, Y.; Guo, Y. Elucidating the Molecular Mechanisms Mediating Plant Salt-Stress Responses. New Phytol. 2018, 217, 523–539. [Google Scholar] [CrossRef] [Green Version]
  11. Ashraf, M.; Harris, P.J.C. Photosynthesis under Stressful Environments: An Overview. Photosynthetica 2013, 51, 163–190. [Google Scholar] [CrossRef]
  12. Hnilickova, H.; Hnilicka, F.; Martinkova, J.; Kraus, K. Effects of Salt Stress on Water Status, Photosynthesis and Chlorophyll Fluorescence of Rocket. Plant Soil Environ. 2017, 63, 362–367. [Google Scholar] [CrossRef] [Green Version]
  13. Xu, Z.; Zhou, G. Responses of Leaf Stomatal Density to Water Status and Its Relationship with Photosynthesis in a Grass. J. Exp. Bot. 2008, 59, 3317–3325. [Google Scholar] [CrossRef] [Green Version]
  14. Mehta, P.; Jajoo, A.; Mathur, S.; Bharti, S. Chlorophyll a Fluorescence Study Revealing Effects of High Salt Stress on Photosystem II in Wheat Leaves. Plant Physiol. Biochem. 2010, 48, 16–20. [Google Scholar] [CrossRef]
  15. Kalaji, H.M.; Rastogi, A.; Zivcak, M.; Brestic, M.; Daszkowska-Golec, A.; Sitko, K.; Alsharafa, K.Y.; Lotfi, R.; Stypiński, P.; Samborska, I.A.; et al. Prompt Chlorophyll Fluorescence as a Tool for Crop Phenotyping: An Example of Barley Landraces Exposed to Various Abiotic Stress Factors. Photosynthetica 2018, 56, 953–961. [Google Scholar] [CrossRef] [Green Version]
  16. Biswal, B.; Joshi, P.N.; Raval, M.K.; Biswal, U.C. Photosynthesis, a Global Sensor of Environmental Stress in Green Plants: Stress Signalling and Adaptation. Curr. Sci. 2011, 101, 47–56. [Google Scholar]
  17. Hossain, M.S.; Dietz, K.-J. Tuning of Redox Regulatory Mechanisms, Reactive Oxygen Species and Redox Homeostasis under Salinity Stress. Front. Plant Sci. 2016, 7, 548. [Google Scholar] [CrossRef] [Green Version]
  18. Noctor, G.; Foyer, C.H. Ascorbate and Glutathione: Keeping Active Oxygen Under Control. Annu. Rev. Plant Physiol. Plant Mol. Biol. 1998, 49, 249–279. [Google Scholar] [CrossRef] [PubMed]
  19. Saibi, W.; Feki, K.; Ben Mahmoud, R.; Brini, F. Durum Wheat Dehydrin (DHN-5) Confers Salinity Tolerance to Transgenic Arabidopsis Plants through the Regulation of Proline Metabolism and ROS Scavenging System. Planta 2015, 242, 1187–1194. [Google Scholar] [CrossRef]
  20. Kaur, G.; Asthir, B. Proline: A Key Player in Plant Abiotic Stress Tolerance. Biol. Plant. 2015, 59, 609–619. [Google Scholar] [CrossRef]
  21. Salinas, R.; Sánchez, E.; Ruíz, J.M.; Lao, M.T.; Romero, L. Proline, Betaine, and Choline Responses to Different Phosphorus Levels in Green Bean. Commun. Soil Sci. Plant Anal. 2013, 44, 465–472. [Google Scholar] [CrossRef]
  22. Jaarsma, R.; de Vries, R.S.M.; de Boer, A.H. Effect of Salt Stress on Growth, Na+ Accumulation and Proline Metabolism in Potato (Solanum Tuberosum) Cultivars. PLoS ONE 2013, 8, e60183. [Google Scholar] [CrossRef]
  23. Sarabi, B.; Bolandnazar, S.; Ghaderi, N.; Ghashghaie, J. Genotypic Differences in Physiological and Biochemical Responses to Salinity Stress in Melon (Cucumis Melo L.) Plants: Prospects for Selection of Salt Tolerant Landraces. Plant Physiol. Biochem. 2017, 119, 294–311. [Google Scholar] [CrossRef] [PubMed]
  24. De la Torre-González, A.; Montesinos-Pereira, D.; Blasco, B.; Ruiz, J.M. Influence of the Proline Metabolism and Glycine Betaine on Tolerance to Salt Stress in Tomato (Solanum Lycopersicum L.) Commercial Genotypes. J. Plant Physiol. 2018, 231, 329–336. [Google Scholar] [CrossRef]
  25. Hannachi, S.; Van Labeke, M.-C. Salt Stress Affects Germination, Seedling Growth and Physiological Responses Differentially in Eggplant Cultivars (Solanum melongena L.). Sci. Hortic. 2018, 228, 56–65. [Google Scholar] [CrossRef]
  26. Anower, M.R.; Peel, M.D.; Mott, I.W.; Wu, Y. Physiological Processes Associated with Salinity Tolerance in an Alfalfa Half-Sib Family. J. Agron. Crop Sci. 2017, 203, 506–518. [Google Scholar] [CrossRef]
  27. Zhou, Y.-X.; Xin, H.-L.; Rahman, K.; Wang, S.-J.; Peng, C.; Zhang, H. Portulaca Oleracea L.: A Review of Phytochemistry and Pharmacological Effects. Biomed. Res. Int. 2015, 2015, 925631. [Google Scholar] [CrossRef] [Green Version]
  28. Kafi, M.; Rahimi, Z. Effect of Salinity and Silicon on Root Characteristics, Growth, Water Status, Proline Content and Ion Accumulation of Purslane (Portulaca oleracea L.). Soil Sci. Plant Nutr. 2011, 57, 341–347. [Google Scholar] [CrossRef]
  29. Alam, M.A.; Juraimi, A.S.; Rafii, M.Y.; Abdul Hamid, A.; Aslani, F. Screening of Purslane (Portulaca Oleracea L.) Accessions for High Salt Tolerance. Sci. World J. 2014, 2014, e627916. [Google Scholar] [CrossRef] [PubMed] [Green Version]
  30. Jin, R.; Wang, Y.; Liu, R.; Gou, J.; Chan, Z. Physiological and Metabolic Changes of Purslane (Portulaca Oleracea L.) in Response to Drought, Heat, and Combined Stresses. Front Plant Sci. 2016, 6. [Google Scholar] [CrossRef] [Green Version]
  31. Hnilickova, H.; Hnilicka, F.; Orsak, M.; Hejnak, V. Effect of Salt Stress on Growth, Electrolyte Leakage, Na+ and K+ Content in Selected Plant Species. Plant Soil Environ. 2019, 65, 90–96. [Google Scholar] [CrossRef] [Green Version]
  32. FAO. High Level Expert Forum—How to Feed the World in 2050; Economic and Social Development, Food and Agricultural Organization of the United Nations: Rome, Italy, 2009. [Google Scholar]
  33. Joshi, R.; Sahoo, K.K.; Tripathi, A.K.; Kumar, R.; Gupta, B.K.; Pareek, A.; Singla-Pareek, S.L. Knockdown of an Inflorescence Meristem-Specific Cytokinin Oxidase—OsCKX2 in Rice Reduces Yield Penalty under Salinity Stress Condition. Plant Cell Environ. 2018, 41, 936–946. [Google Scholar] [CrossRef]
  34. Gupta, B.K.; Sahoo, K.K.; Ghosh, A.; Tripathi, A.K.; Anwar, K.; Das, P.; Singh, A.K.; Pareek, A.; Sopory, S.K.; Singla-Pareek, S.L. Manipulation of Glyoxalase Pathway Confers Tolerance to Multiple Stresses in Rice. Plant Cell Environ. 2018, 41, 1186–1200. [Google Scholar] [CrossRef]
  35. Bunce, J.A. How Do Leaf Hydraulics Limit Stomatal Conductance at High Water Vapour Pressure Deficits? Plant Cell Environ. 2006, 29, 1644–1650. [Google Scholar] [CrossRef]
  36. Redondo-Gómez, S.; Mateos-Naranjo, E.; Figueroa, M.E.; Davy, A.J. Salt Stimulation of Growth and Photosynthesis in an Extreme Halophyte, Arthrocnemum Macrostachyum. Plant Biol. 2010, 12, 79–87. [Google Scholar] [CrossRef]
  37. Xing, J.-C.; Dong, J.; Wang, M.-W.; Liu, C.; Zhao, B.-Q.; Wen, Z.-G.; Zhu, X.-M.; Ding, H.-R.; Zhao, X.-H.; Hong, L.-Z. Effects of NaCl Stress on Growth of Portulaca Oleracea and Underlying Mechanisms. Braz. J. Bot. 2019, 2, 217–226. [Google Scholar] [CrossRef]
  38. Tang, N.; Zhang, B.; Chen, Q.; Yang, P.; Wang, L.; Qian, B. Effect of Salt Stress on Photosynthetic and Antioxidant Characteristics in Purslane (Portulaca oleracea). Int. J. Agric. Biol. 2020, 24, 1309–1314. [Google Scholar] [CrossRef]
  39. Chaves, M.M.; Flexas, J.; Pinheiro, C. Photosynthesis under Drought and Salt Stress: Regulation Mechanisms from Whole Plant to Cell. Ann. Bot. 2009, 103, 551–560. [Google Scholar] [CrossRef] [Green Version]
  40. Ocampo, G.; Koteyeva, N.K.; Voznesenskaya, E.V.; Edwards, G.E.; Sage, T.L.; Sage, R.F.; Columbus, J.T. Evolution of Leaf Anatomy and Photosynthetic Pathways in Portulacaceae. Am. J. Bot. 2013, 100, 2388–2402. [Google Scholar] [CrossRef] [PubMed] [Green Version]
  41. Voznesenskaya, E.V.; Koteyeva, N.K.; Edwards, G.E.; Ocampo, G. Revealing Diversity in Structural and Biochemical Forms of C4 Photosynthesis and a C3-C4 Intermediate in Genus portulaca L. (Portulacaceae). J. Exp. Bot. 2010, 61, 3647–3662. [Google Scholar] [CrossRef] [PubMed]
  42. Winter, K.; Holtum, J.A.M. Facultative Crassulacean Acid Metabolism (CAM) Plants: Powerful Tools for Unravelling the Functional Elements of CAM Photosynthesis. J. Exp. Bot. 2014, 65, 3425–3441. [Google Scholar] [CrossRef] [Green Version]
  43. D’Andrea, R.M.; Andreo, C.S.; Lara, M.V. Deciphering the Mechanisms Involved in Portulaca oleracea (C4) Response to Drought: Metabolic Changes Including Crassulacean Acid-like Metabolism Induction and Reversal upon Re-Watering. Physiol. Plant 2014, 152, 414–430. [Google Scholar] [CrossRef]
  44. Montero, E.; Francisco, A.M.; Montes, E.; Herrera, A. Salinity Induction of Recycling Crassulacean Acid Metabolism and Salt Tolerance in Plants of Talinum Triangulare. Ann. Bot. 2018, 121, 1333–1342. [Google Scholar] [CrossRef]
  45. Osmond, C.B. Crassulacean Acid Metabolism: A Curiosity in Context. Ann. Rev. Plant Physiol. 1978, 29, 379–414. [Google Scholar] [CrossRef]
  46. Ferrari, R.C.; Bittencourt, P.P.; Rodrigues, M.A.; Moreno-Villena, J.J.; Alves, F.R.R.; Gastaldi, V.D.; Boxall, S.F.; Dever, L.V.; Demarco, D.; Andrade, S.C.S.; et al. C4 and Crassulacean Acid Metabolism within a Single Leaf: Deciphering Key Components behind a Rare Photosynthetic Adaptation. New Phytol. 2020, 225, 1699–1714. [Google Scholar] [CrossRef]
  47. Cockburn, W. Stomatal Mechanism as the Basis of the Evolution of CAM and C4 Photosynthesis. Plant Cell Environ. 1983, 6, 275–279. [Google Scholar] [CrossRef]
  48. Borland, A.M.; Zambrano, V.A.B.; Ceusters, J.; Shorrock, K. The Photosynthetic Plasticity of Crassulacean Acid Metabolism: An Evolutionary Innovation for Sustainable Productivity in a Changing World. New Phytol. 2011, 191, 619–633. [Google Scholar] [CrossRef]
  49. Franco, A.; Herzog, B.; Hübner, C.; de Mattos, E.; Scarano, F.; Ball, E.; Lüttge, U. Diurnal Changes in Chlorophyll a Fluorescence, CO2-Exchange and Organic Acid Decarboxylation in the Tropical CAM Tree Clusia Hilariana. Tree Physiol. 1999, 19, 635–644. [Google Scholar] [CrossRef] [Green Version]
  50. Herrera, A. Crassulacean Acid Metabolism and Fitness under Water Deficit Stress: If Not for Carbon Gain, What Is Facultative CAM Good For? Ann. Bot. 2009, 103, 645–653. [Google Scholar] [CrossRef] [PubMed] [Green Version]
  51. Lara, M.V.; Drincovich, M.F.; Andreo, C.S. Induction of a Crassulacean Acid-like Metabolism in the C4 Succulent Plant, Portulaca Oleracea L.: Study of Enzymes Involved in Carbon Fixation and Carbohydrate Metabolism. Plant Cell Physiol. 2004, 45, 618–626. [Google Scholar] [CrossRef] [PubMed] [Green Version]
  52. Martínez, D.E.; Costa, M.L.; Guiamet, J.J. Senescence-Associated Degradation of Chloroplast Proteins inside and Outside the Organelle. Plant Biol. 2008, 10, 15–22. [Google Scholar] [CrossRef]
  53. Karkanis, A.C.; Petropoulos, S.A. Physiological and Growth Responses of Several Genotypes of Common Purslane (Portulaca Oleracea L.) under Mediterranean Semi-Arid Conditions. Not. Bot. Horti Agrobot. Cluj-Napoca 2017, 45, 569–575. [Google Scholar] [CrossRef] [Green Version]
  54. Maxwell, K.; Johnson, G.N. Chlorophyll Fluorescence—A Practical Guide. J. Exp. Bot. 2000, 51, 659–668. [Google Scholar] [CrossRef]
  55. Baker, N.R.; Rosenqvist, E. Applications of Chlorophyll Fluorescence Can Improve Crop Production Strategies: An Examination of Future Possibilities. J. Exp. Bot. 2004, 55, 1607–1621. [Google Scholar] [CrossRef] [Green Version]
  56. Shu, S.; Guo, S.-R.; Sun, J.; Yuan, L.-Y. Effects of Salt Stress on the Structure and Function of the Photosynthetic Apparatus in Cucumis Sativus and Its Protection by Exogenous Putrescine. Physiol. Plant 2012, 146, 285–296. [Google Scholar] [CrossRef]
  57. Jamil, M.; Rehman, S.-U.; Lee, K.J.; Kim, J.M.; Kim, H.-S.; Rha, E.S. Salinity Reduced Growth PS2 Photochemistry and Chlorophyll Content in Radish. Sci. Agric. 2007, 64, 111–118. [Google Scholar] [CrossRef] [Green Version]
  58. Naeem, M.S.; Jin, Z.L.; Wan, G.L.; Liu, D.; Liu, H.B.; Yoneyama, K.; Zhou, W.J. 5-Aminolevulinic Acid Improves Photosynthetic Gas Exchange Capacity and Ion Uptake under Salinity Stress in Oilseed Rape (Brassica napus L.). Plant Soil 2010, 332, 405–415. [Google Scholar] [CrossRef]
  59. Zaman, S.; Shah, S.B.; Jiang, Y.T.; Che, S.Q. Saline Conditions Alter Morpho-Physiological Intensification in Purslane (Portulaca oleracea L.). J. Biol. Regul. Homeost. Agents 2018, 32, 635–639. [Google Scholar]
  60. Reddy, A.; Chaitanya, K.V.; Vivekanandan, M. Drought-Induced Responses of Photosynthesis and Antioxidant Metabolism in Higher Plants. J. Plant Physiol. 2004, 161, 1189–1202. [Google Scholar] [CrossRef]
  61. Liu, H.; Sultan, M.A.R.F.; Liu, X.-l.; Zhang, J.; Yu, F.; Zhao, H.-x. Physiological and Comparative Proteomic Analysis Reveals Different Drought Responses in Roots and Leaves of Drought-Tolerant Wild Wheat (Triticum boeoticum). PLoS ONE 2015, 10, e0121852. [Google Scholar] [CrossRef] [Green Version]
  62. Schieber, M.; Chandel, N.S. ROS Function in Redox Signaling and Oxidative Stress. Curr. Biol. 2014, 24, R453–R462. [Google Scholar] [CrossRef] [Green Version]
  63. Annunziata, M.G.; Ciarmiello, L.F.; Woodrow, P.; Dell’Aversana, E.; Carillo, P. Spatial and Temporal Profile of Glycine Betaine Accumulation in Plants Under Abiotic Stresses. Front. Plant Sci. 2019, 10. [Google Scholar] [CrossRef] [Green Version]
  64. Singh, M.; Kumar, J.; Singh, S.; Singh, D.V.; Prasad, S. Roles of Osmoprotectants in Improving Salinity and Drought Tolerance in Plants: A Review. Rev. Environ. Sci. Bio/Technol. 2015, 14. [Google Scholar] [CrossRef]
  65. Ashraf, M.; Foolad, M.R. Roles of Glycine Betaine and Proline in Improving Plant Abiotic Stress Resistance. Environ. Exp. Bot. 2007, 59, 206–216. [Google Scholar] [CrossRef]
  66. Szabados, L.; Savouré, A. Proline: A Multifunctional Amino Acid. Trends Plant Sci. 2010, 15, 89–97. [Google Scholar] [CrossRef]
  67. Mulry, K.R.; Hanson, B.A.; Dudle, D.A. Alternative Strategies in Response to Saline Stress in Two Varieties of Portulaca Oleracea (Purslane). PLoS ONE 2015, 10, e0138723. [Google Scholar] [CrossRef]
  68. Yazici, I.; Türkan, I.; Sekmen, A.H.; Demiral, T. Salinity Tolerance of Purslane (Portulaca oleracea L.) Is Achieved by Enhanced Antioxidative System, Lower Level of Lipid Peroxidation and Proline Accumulation. Environ. Exp. Bot. 2007, 61, 49–57. [Google Scholar] [CrossRef]
  69. Ma, J.; Du, G.; Li, X.; Zhang, C.; Guo, J. A Major Locus Controlling Malondialdehyde Content under Water Stress Is Associated with Fusarium Crown Rot Resistance in Wheat. Mol. Genet. Genom. 2015, 290, 1955–1962. [Google Scholar] [CrossRef]
  70. Jakhar, S.; Mukherjee, D. Chloroplast Pigments, Proteins, Lipid Peroxidation and Activities of Antioxidative Enzymes during Maturation and Senescence of Leaves and Reproductive Organs of Cajanus Cajan L. Physiol. Mol. Biol. Plants 2014, 20, 171–180. [Google Scholar] [CrossRef] [Green Version]
  71. Borsai, O.; Hassan, M.A.; Negrușier, C.; Raigón, M.D.; Boscaiu, M.; Sestraș, R.E.; Vicente, O. Responses to Salt Stress in Portulaca: Insight into Its Tolerance Mechanisms. Plants. 2020, 9, 1660. [Google Scholar] [CrossRef]
  72. Bates, L.S.; Waldren, R.P.; Teare, I.D. Rapid Determination of Free Proline for Water-Stress Studies. Plant Soil 1973, 39, 205–207. [Google Scholar] [CrossRef]
  73. Du, Z.; Bramlage, W.J. Modified Thiobarbituric Acid Assay for Measuring Lipid Oxidation in Sugar-Rich Plant Tissue Extracts. J. Agric. Food Chem. 1992, 40, 1566–1570. [Google Scholar] [CrossRef]
  74. Šmilauer, P.; Lepš, J. Multivariate Analysis of Ecological Data Using CANOCO 5, 2nd ed.; Cambridge University Press: Cambridge, UK, 2014; ISBN 978-1-107-69440-8. [Google Scholar]
Figure 1. Leaf water potential (ψw) in leaves of P. oleracea exposed to 100 mM or 300 mM NaCl. Means ± SE; n = 3; one-way ANOVA with Tukey’s post hoc test; F(8, 128) = 8.092; p = 0.0001. For each time point, the columns with different letters were significantly different (p < 0.05).
Plants 10 00845 g001
Figure 2. (a) Photosynthetic assimilation of CO2 (A); (b) Substomatal concentration of CO2 (Ci) and (c) stomatal conductance (gs) of P. oleracea under treatment with 100 mM and 300 mM NaCl. Means ± SE; n = 3; one-way ANOVA with Tukey’s post hoc test; (a) F(8, 207) = 44.276; p = 0.0001; (b) F(8, 207) = 44.276; p = 0.0001; (c) F(8, 207) = 44.276; p = 0.0001. For each time point, the columns with different letters indicate significant difference at p < 0.05.
Plants 10 00845 g002
Figure 3. Principal component analysis (PCA) ordination diagram. The biplot displays the treatments (samples) at various times (6 d—day 6, 12 d—day 12, 22 d—day 22) with measurements of (a) photosynthetic assimilation of CO2 (A), substomatal concentration of CO2 (Ci) and stomatal conductance (gs); the first axis accounts for 77.7% of the variance and the second axis shows 20.4% of the variance; (b) proline and MDA content in leaves of P. oleracea and leaf water potential (ψw); the first axis accounts for 76.8% of the variance and the second axis is responsible for 21.7% of the variance. The treatments are indicated by the colors of the shapes: black circles, control; light blue squares, 100 mM NaCl; green diamonds, 300 mM NaCl.
Plants 10 00845 g003
Figure 4. Maximum quantum yield of PS II (Fv/Fm) of P. oleracea at different concentrations of NaCl. Means ± SE; n = 3; one-way ANOVA with Tukey’s post hoc test; F(10, 223) = 3.396; p = 0.0001. For each time point, the columns with different letters are significantly different at p < 0.05.
Plants 10 00845 g004
Figure 5. (a) Proline and (b) MDA content in leaves of P. oleracea under salt stress with 100 mM or 300 mM NaCl. Means ± SE; n = 3; one-way ANOVA with Tukey’s post hoc test; (a) F(8, 207) = 44.276; p = 0.0001; (b) F(12, 81) = 6.220; p = 0.0001. For each time point, the columns with different letters indicate significant difference at p < 0.05.
Plants 10 00845 g005aPlants 10 00845 g005b
Publisher’s Note: MDPI stays neutral with regard to jurisdictional claims in published maps and institutional affiliations.

