
Omics for the Improvement of Abiotic, Biotic, and Agronomic Traits in Major Cereal Crops: Applications, Challenges, and Prospects

 , , and
Abstract
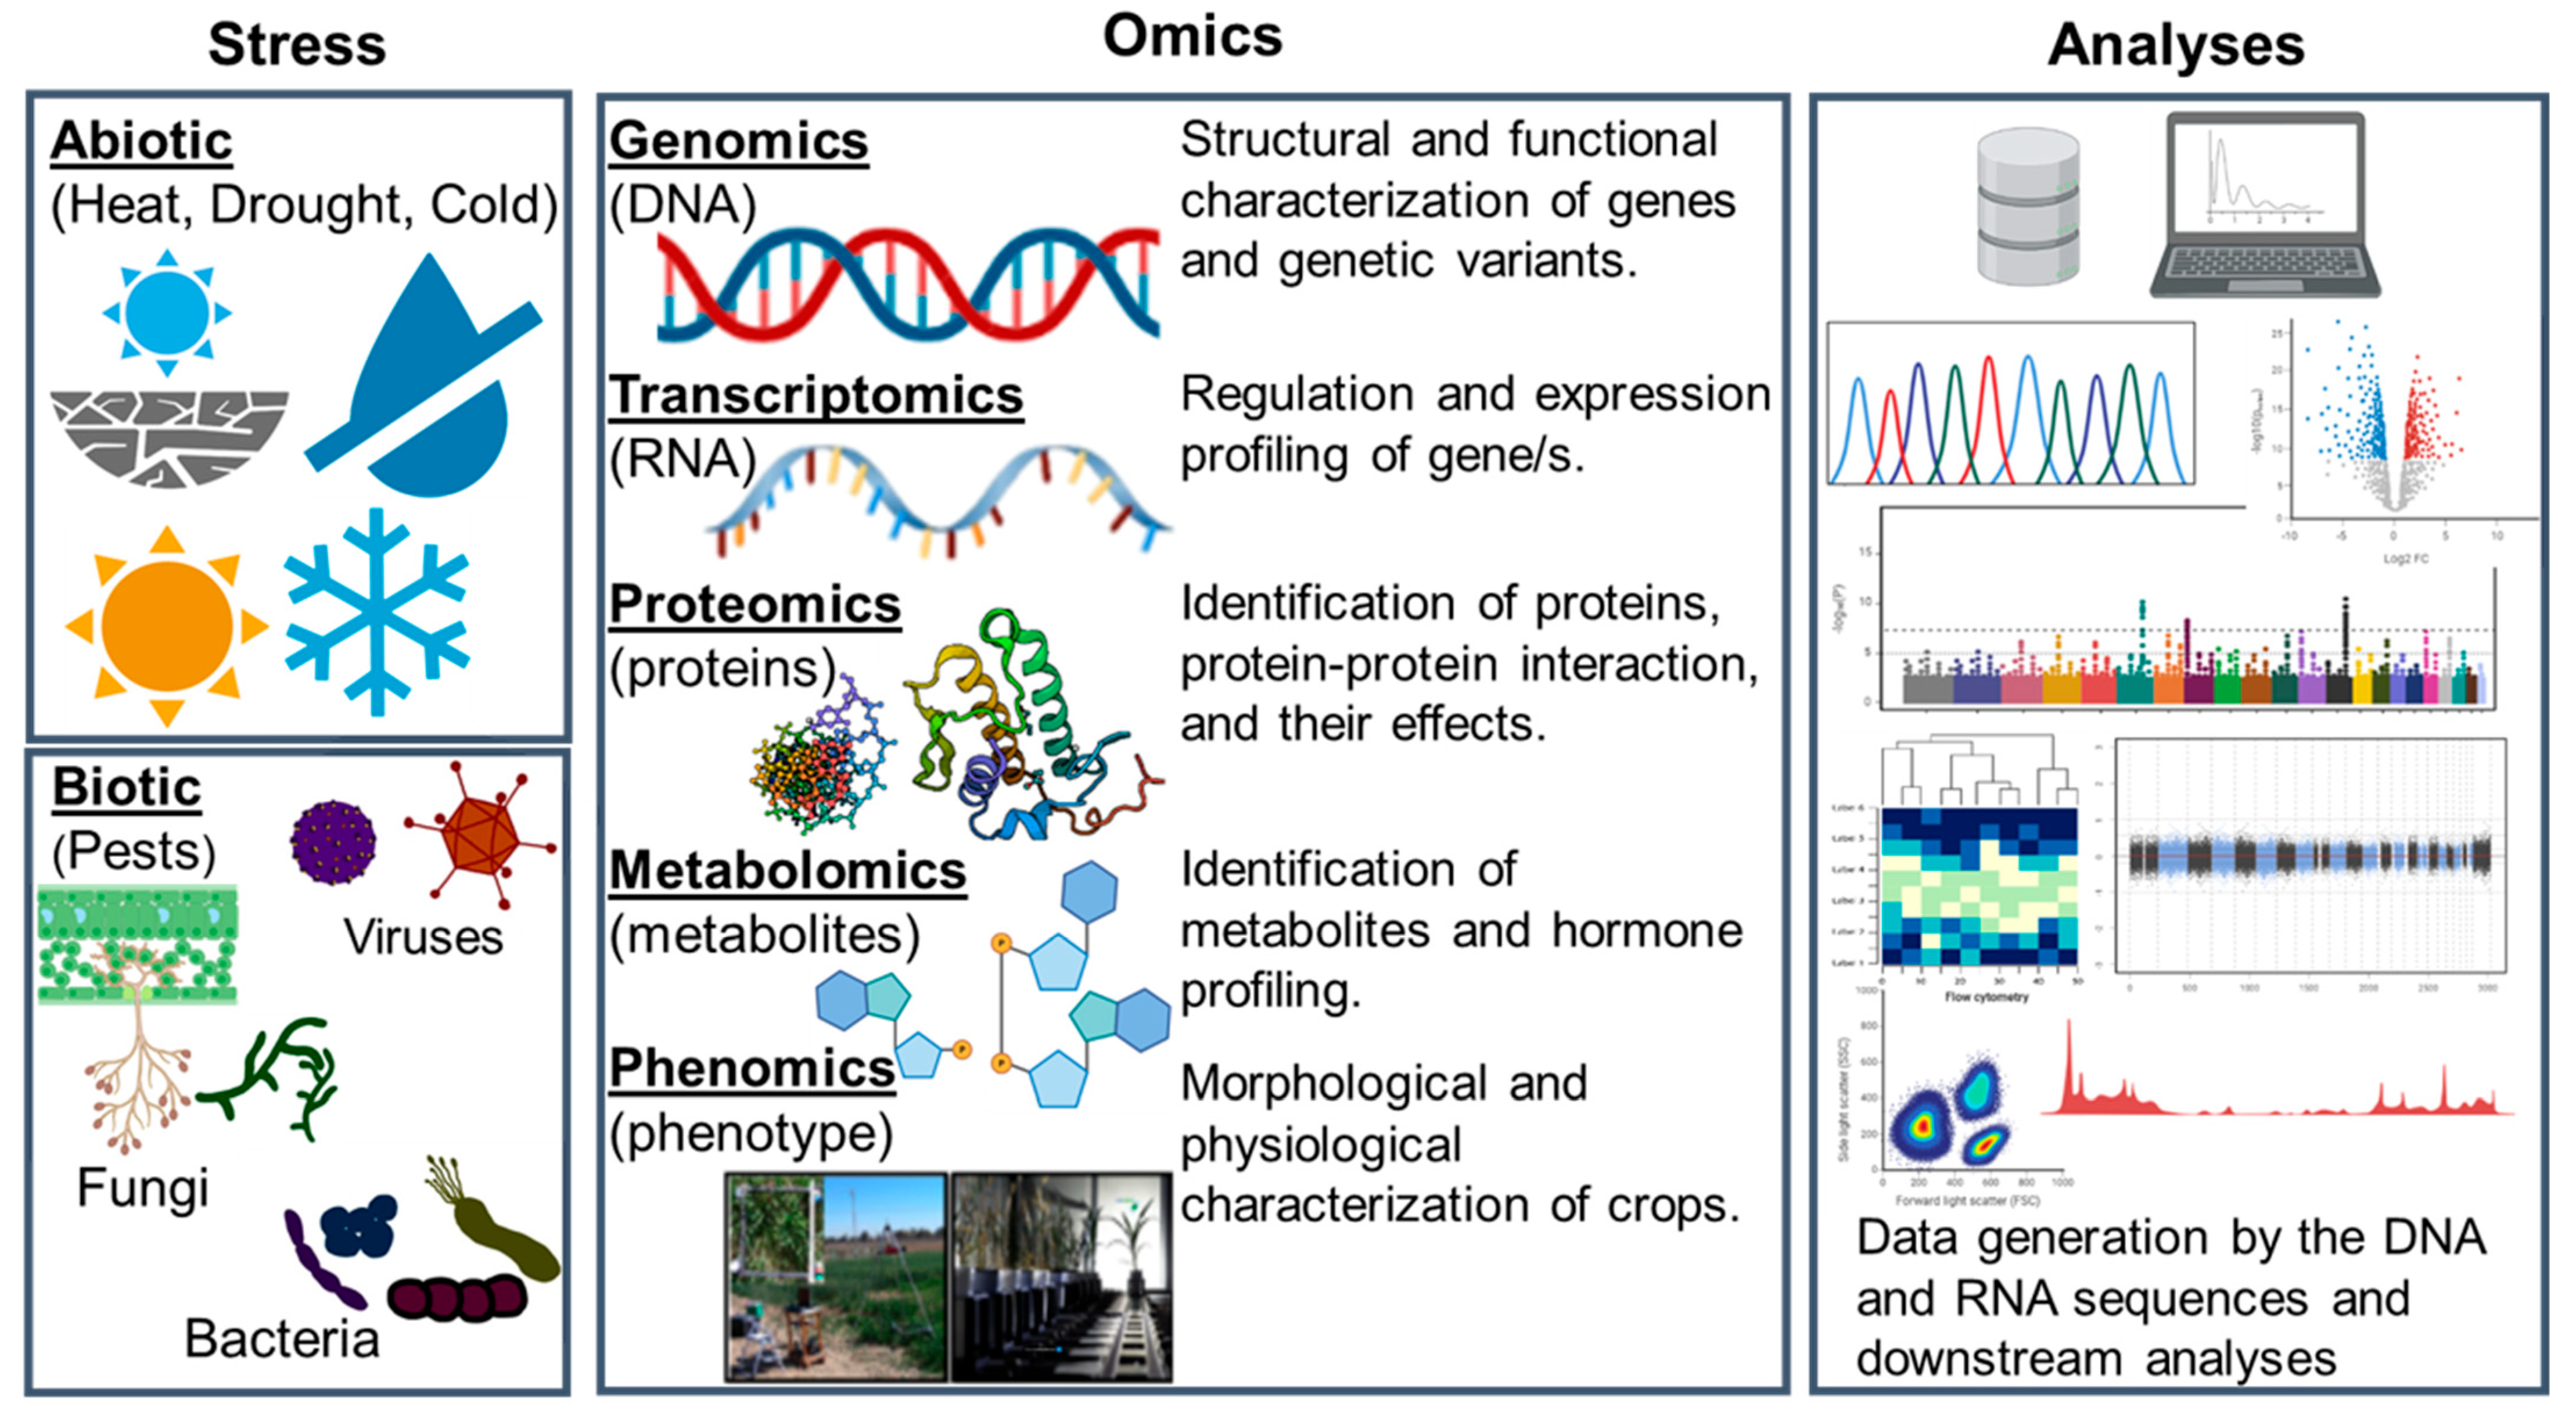
:1. Introduction
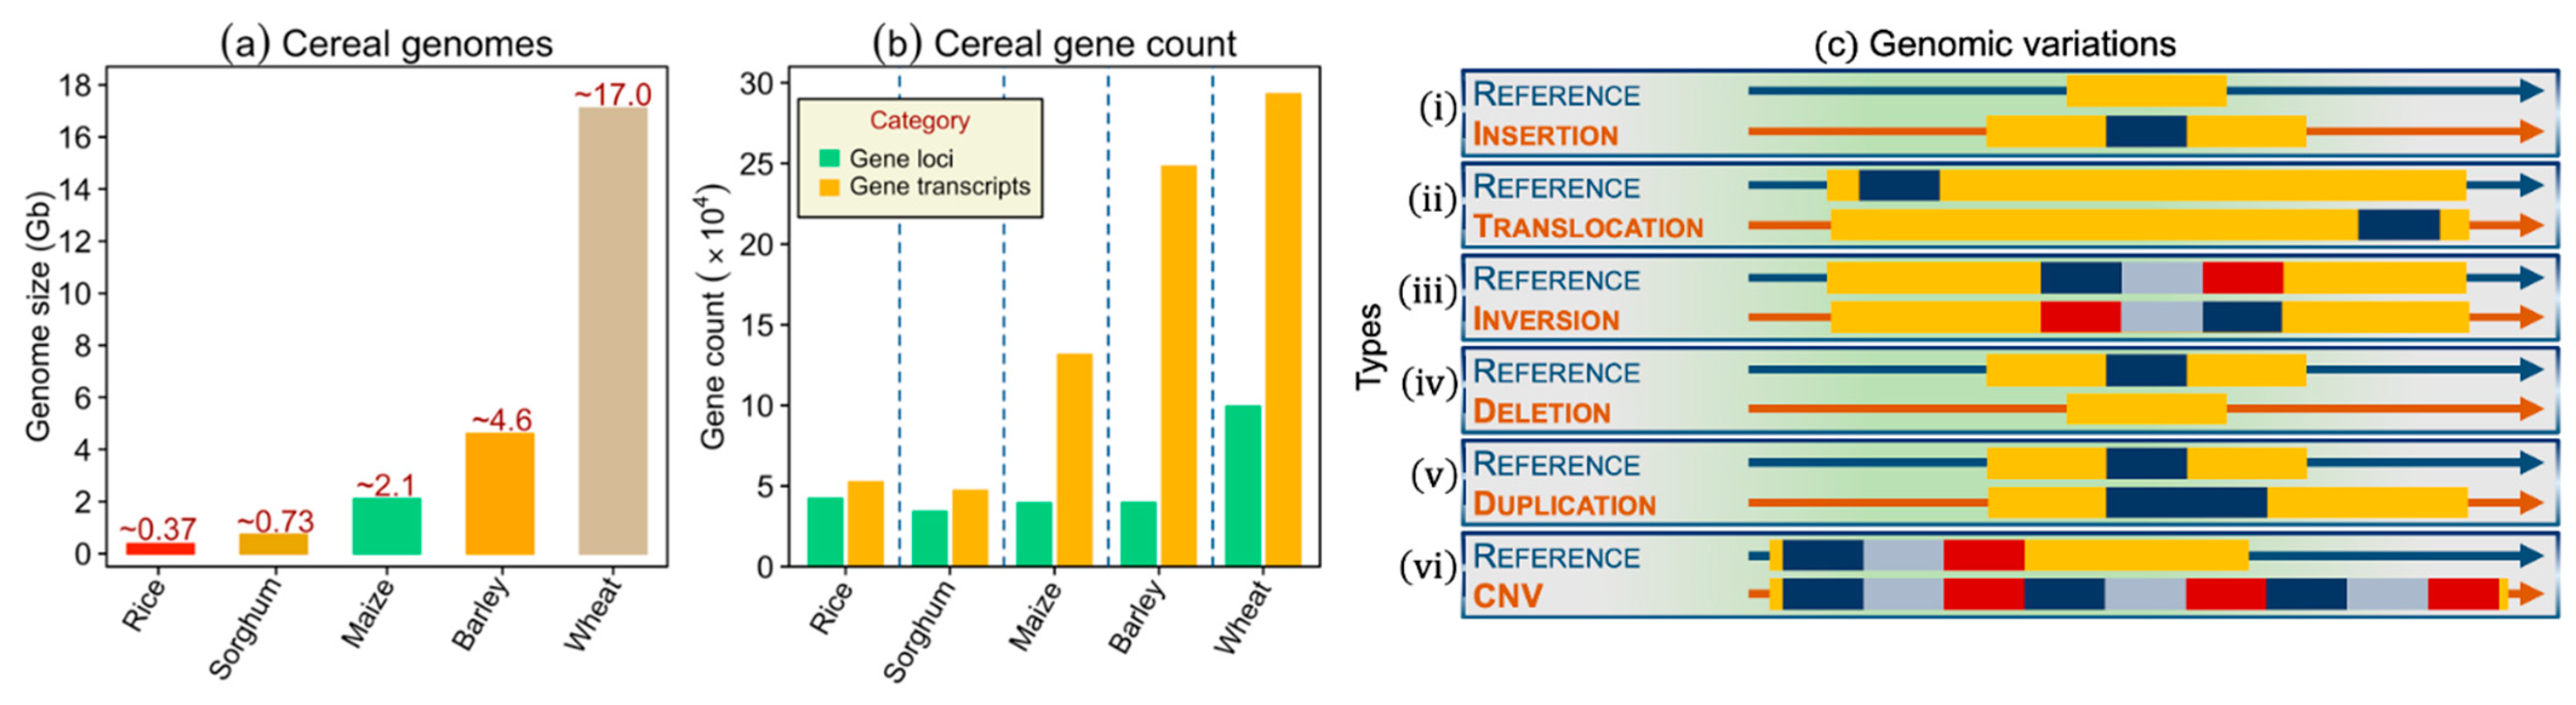
2. Cereal Genomics: Evolution from Sparse Genetic Markers to Whole-Genome Sequencing
2.1. Genome Sequencing Technologies
2.2. Types of Genomic Variants: Applications in Genetics and Breeding
2.2.1. Single Nucleotide Polymorphisms
2.2.2. Variants Apart from SNPs
2.3. Genetic Mapping
2.3.1. Genome-Wide Linkage Mapping
2.3.2. Genome-Wide Association Studies
2.4. The Study of Species-Level Variations via Pangenomes
2.5. Challenges and Prospects in Crop Genomics
3. Cereal Transcriptomics
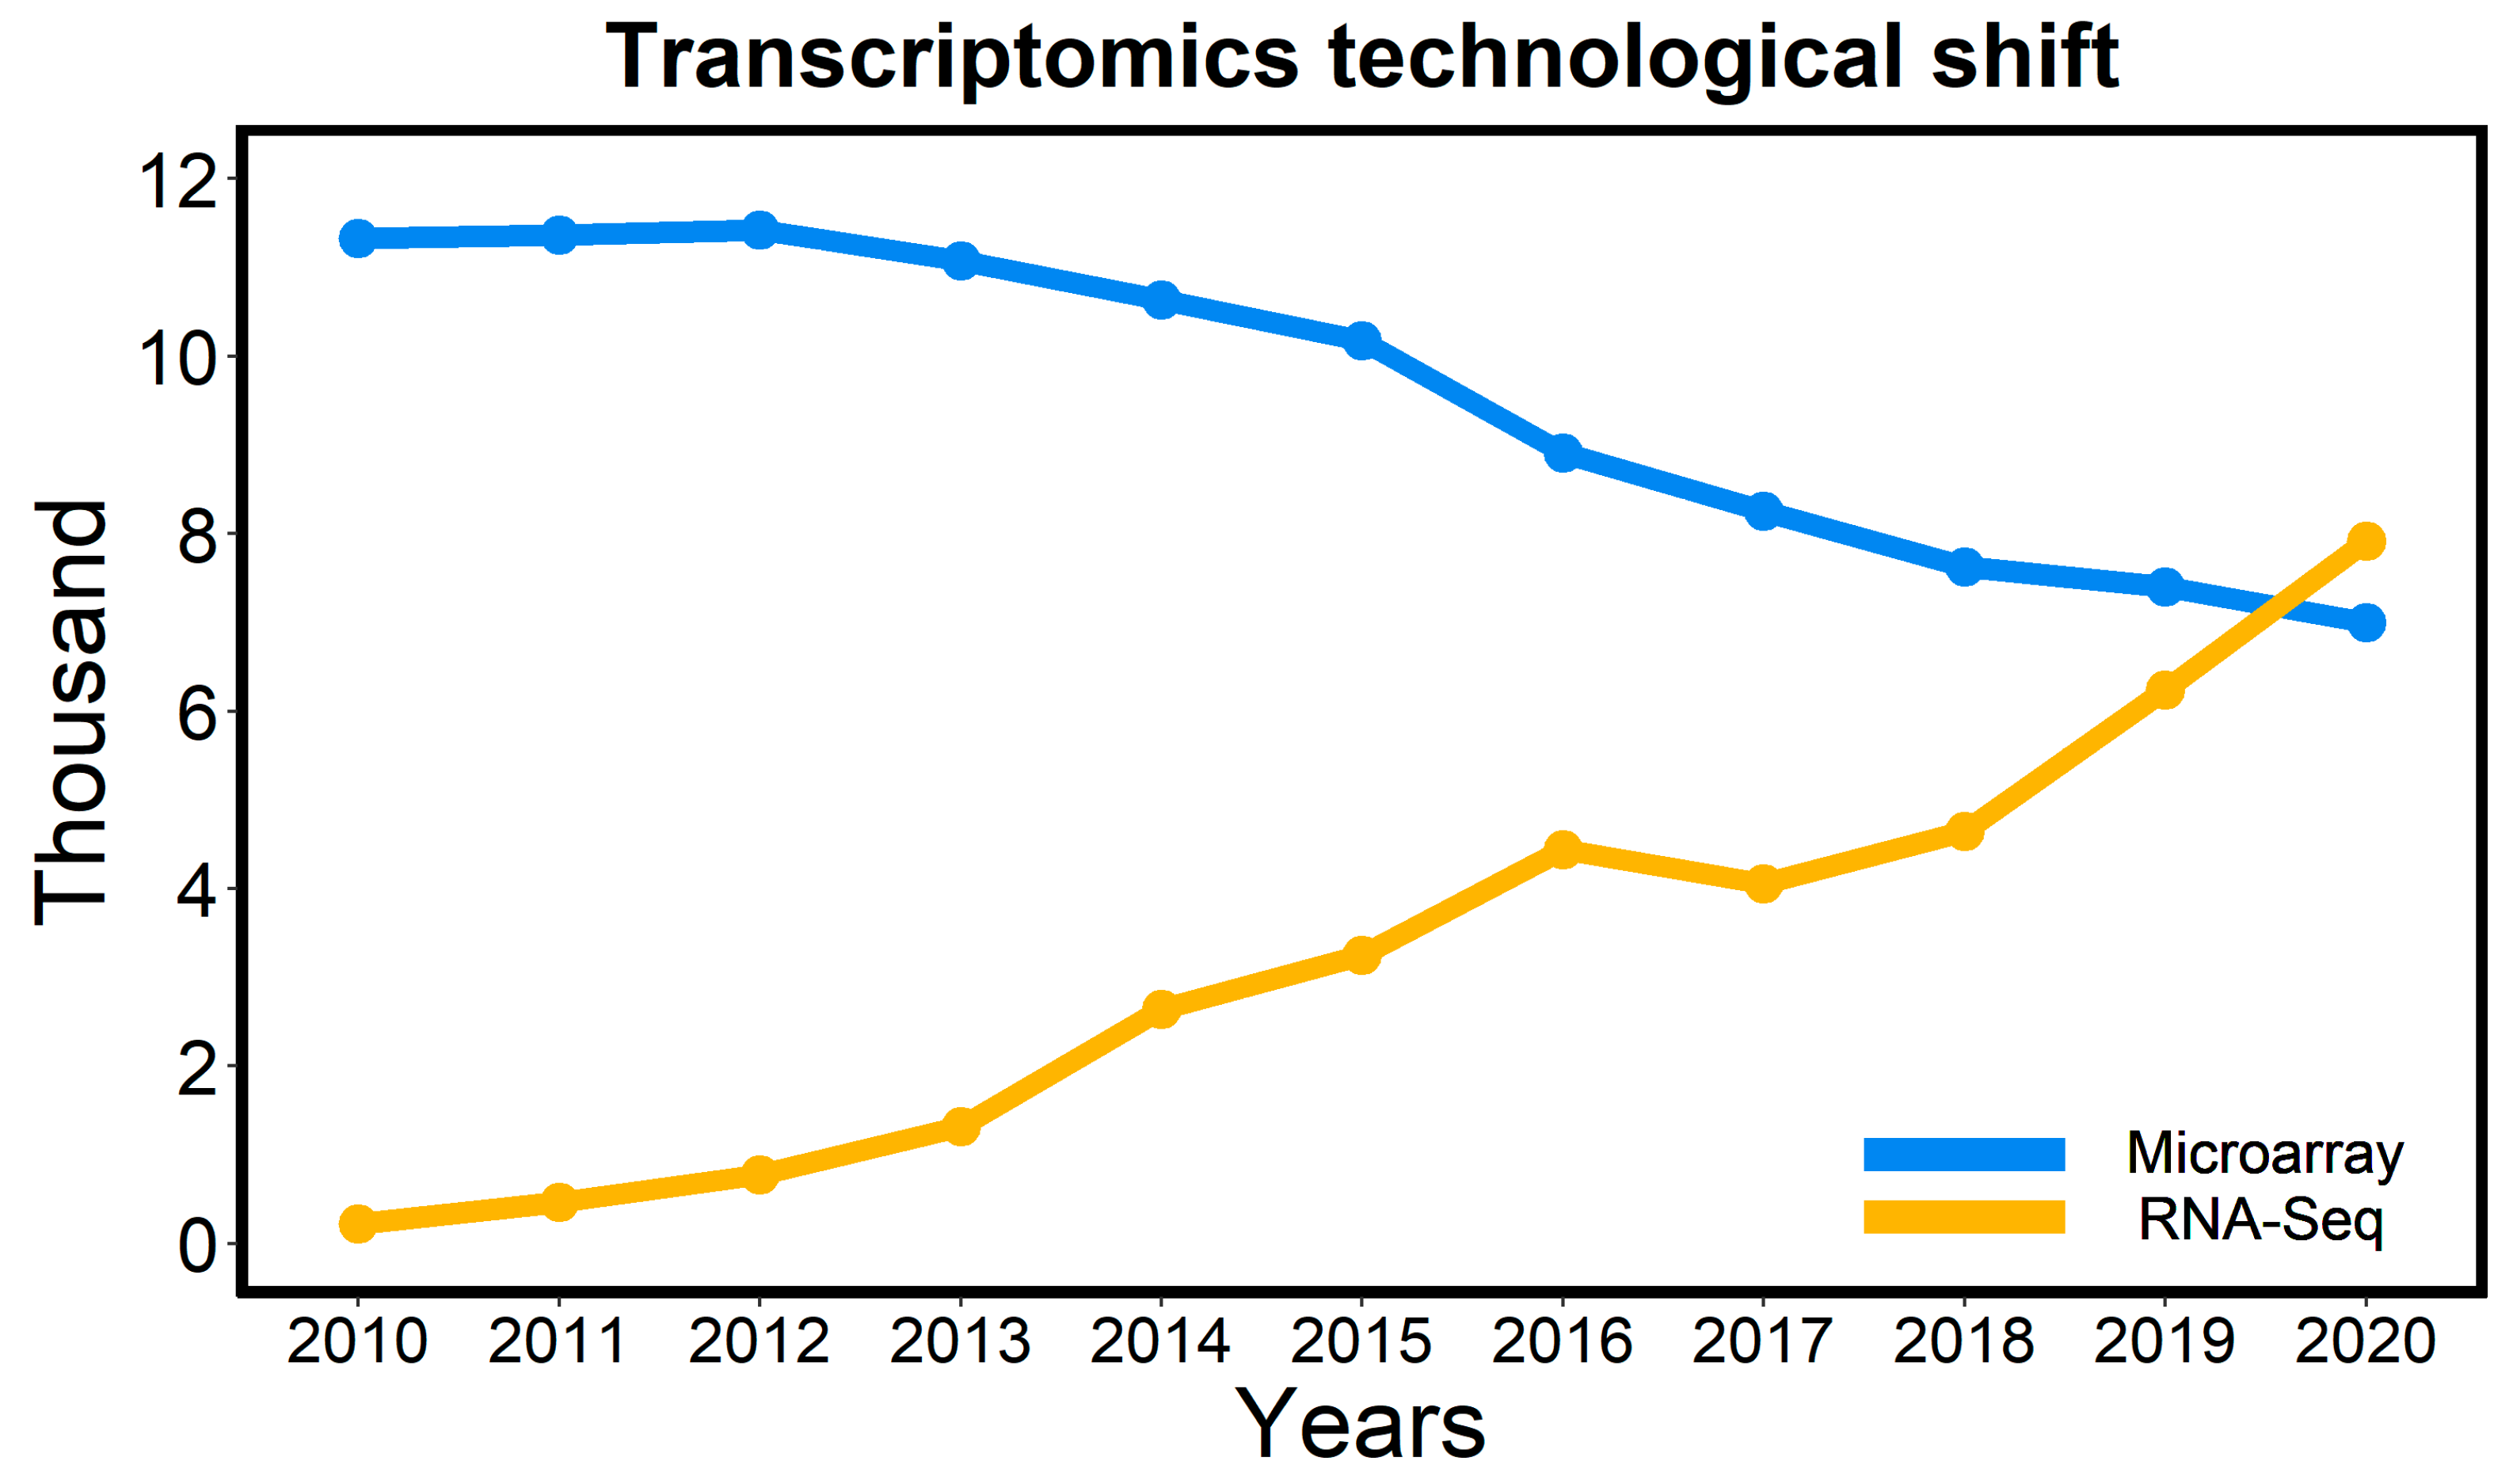
3.1. Transcriptomics Techniques
3.2. Transcriptomics to Study Abiotic Stress Tolerance in Plants

| Crop | Tissue | Technique | Abiotic Stress | Reference |
|---|---|---|---|---|
| Rice | Leaves | RNA-Seq | Drought | [75] |
| Rice | Leaves | Microarray | Cold | [76] |
| Rice | Leaves and shoot | RNA-Seq | Adaptive and salinity | [72] |
| Wheat | Roots | RNA-Seq | Drought | [77] |
| Wheat | Crown tissue and leaves | RNA-Seq | Cold and light | [78] |
| Wheat | Shoots and roots | Microarray | Salinity | [79] |
| Maize | Tassels | RNA-Seq | Drought | [80] |
| Maize | Leaves | RNA-Seq | Salinity | [81] |
| Maize | Leaves | RNA-Seq | Cold | [73] |
| Barley | Leaves and roots | Microarray | Drought | [82] |
| Barley | Roots | RNA-Seq | Salinity | [83] |
| Sorghum | Seedlings | RNA-Seq | Drought | [74] |
| Sorghum | Seedlings | RNA-Seq | Salinity | [84] |
| Sorghum | Seedlings | RNA-Seq | Salinity | [85] |
3.3. Application of Transcriptomics for Crop Improvement against Biotic Stress
3.4. Challenges and Prospects in Transcriptomics
4. Cereal Proteomics
4.1. Technical Advances in Proteomics
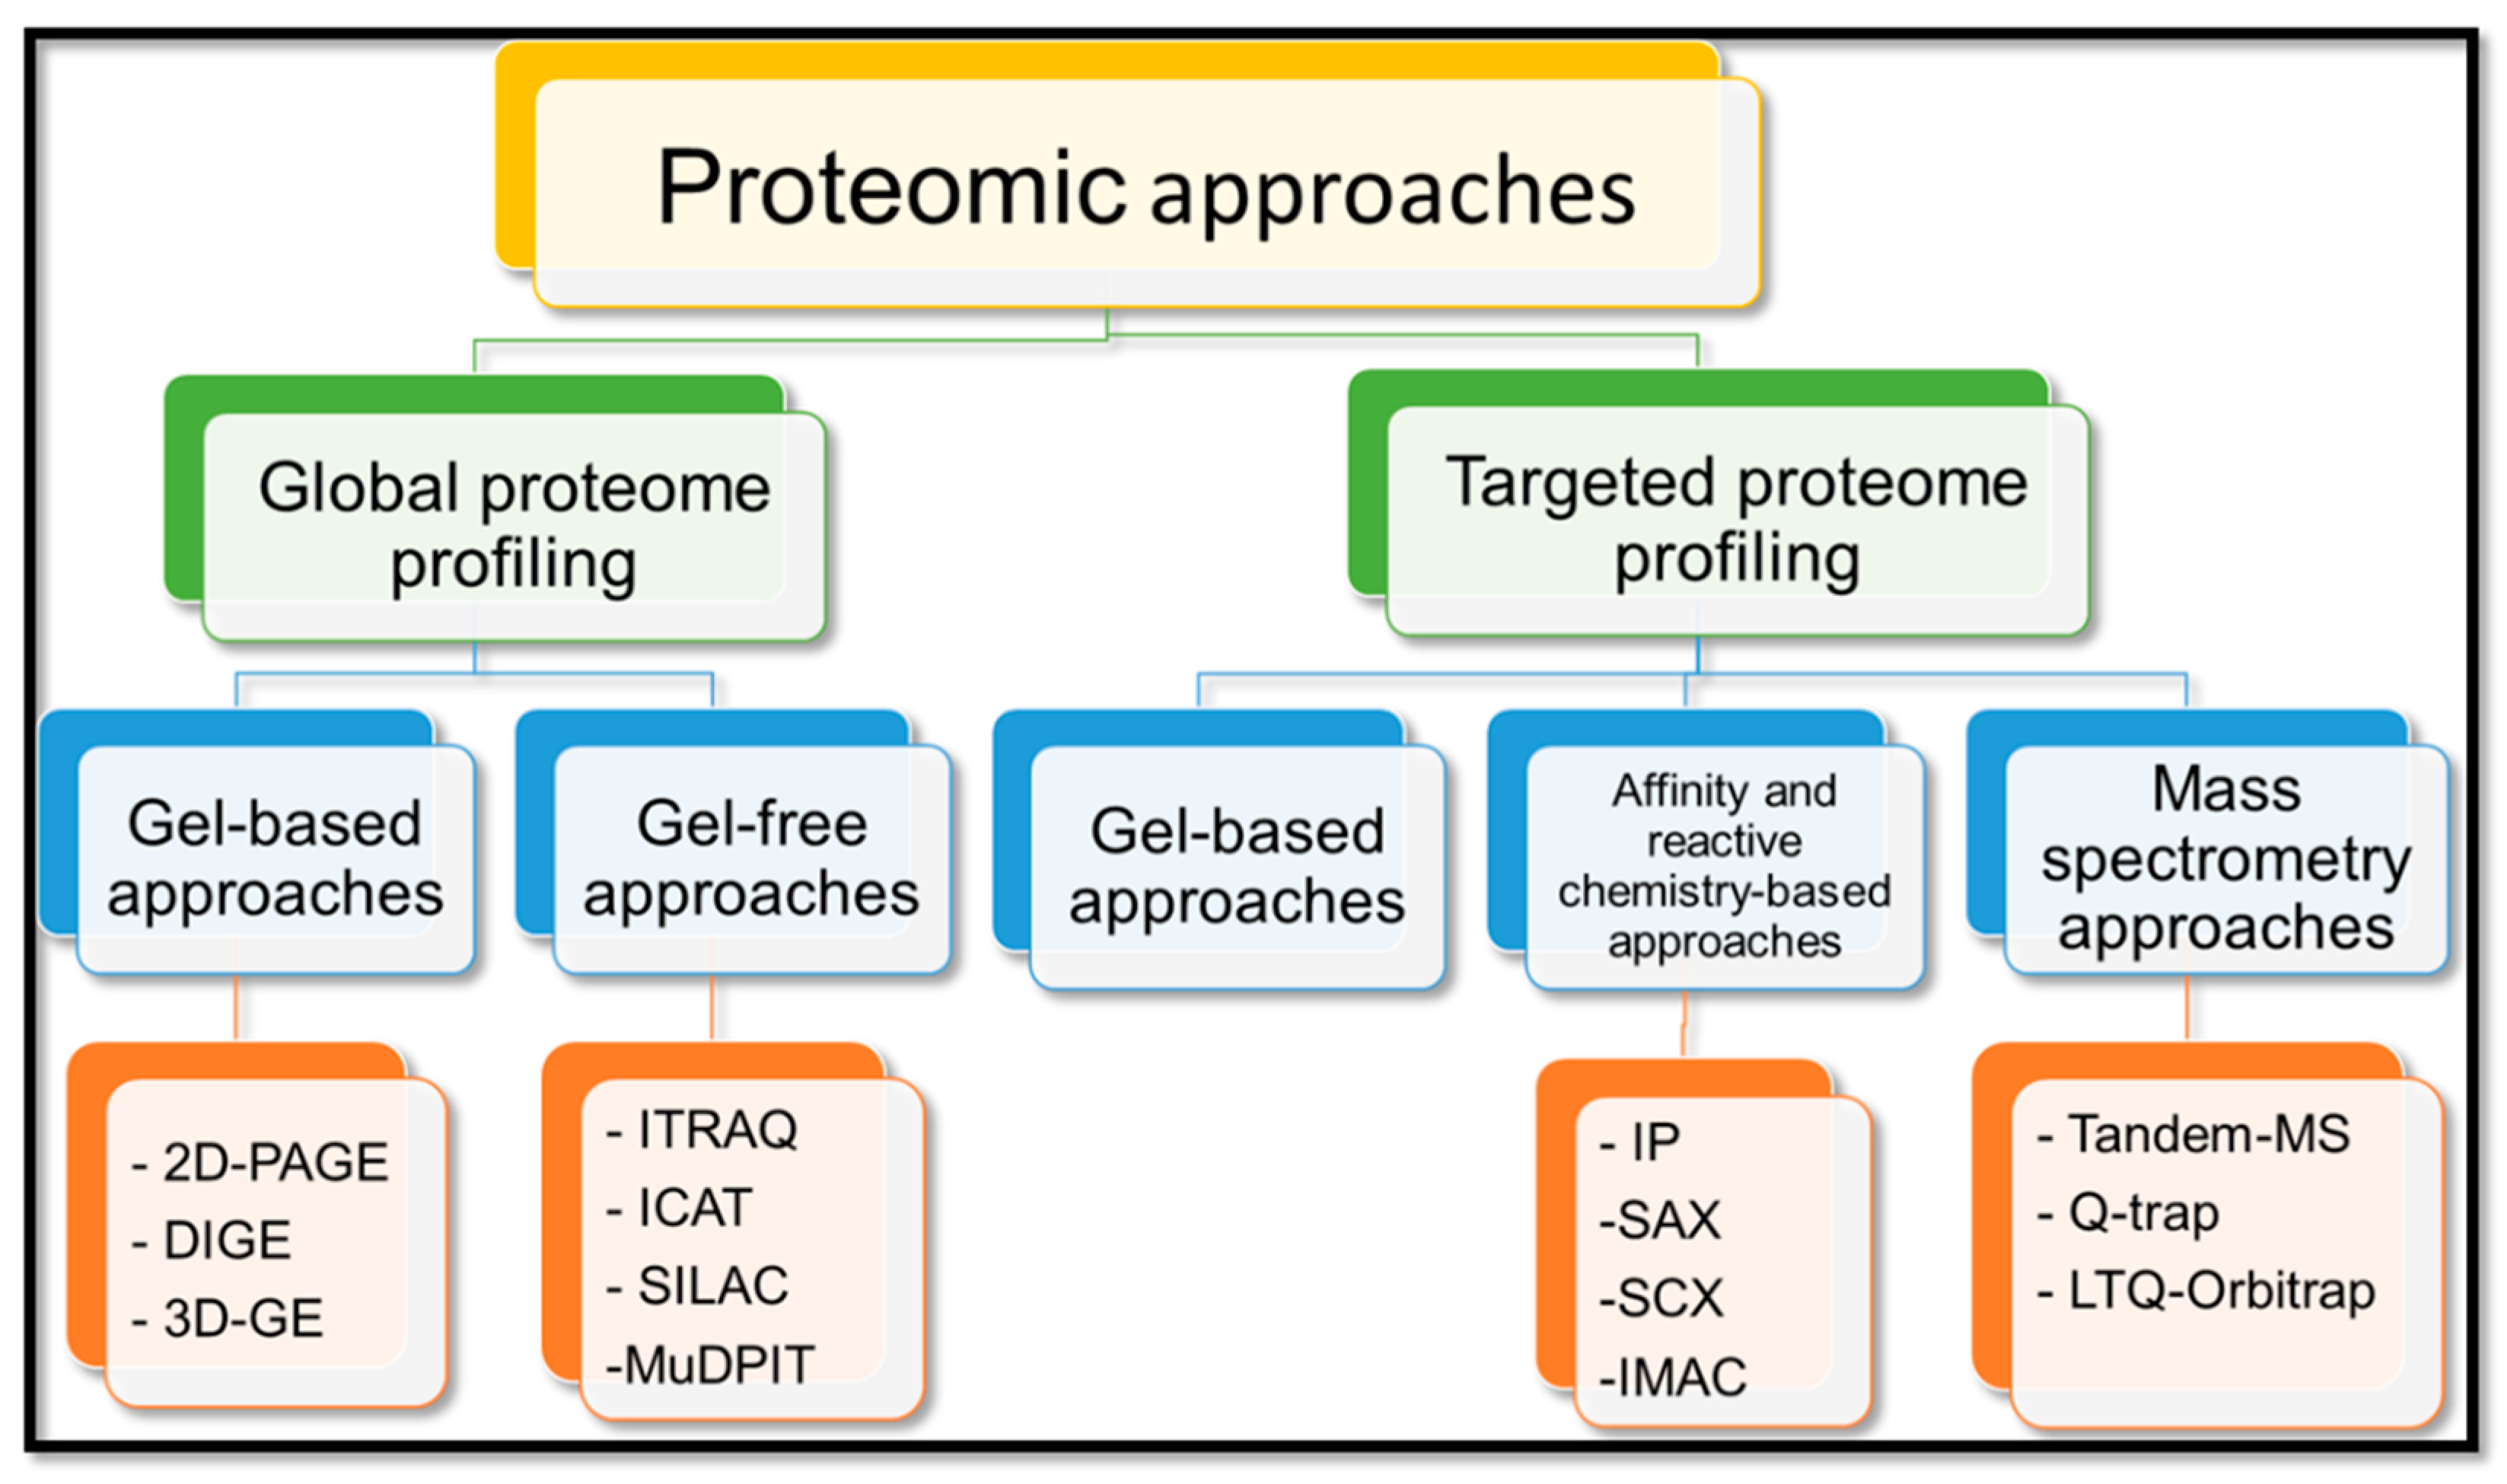
4.2. Global Proteome Profiling
4.2.1. Gel-Based Approaches
4.2.2. Gel-Free Approaches
4.3. Targeted Proteome Profiling
4.3.1. Gel-Based Proteomics
4.3.2. Affinity and Reactive Chemistry-Based Proteomics
4.3.3. MS-Based Proteomics
4.4. Peptidomics, Phosphoproteomics, and Redox Poteomics
4.5. Bioinformatics in Proteomics
4.6. Challenges and Prospects in Proteomics
5. Cereal Metabolomics
5.1. Overview of Metabolomic Pipeline
5.2. Analytical and Data Processing Techniques in Crop Metabolomics
5.3. Applications of Metabolomics for Crop Improvement
| Crop | Stress | Techniques | References |
|---|---|---|---|
| Abiotic stresses | |||
| Rice | Flooding | GC–MS, NMR | [178] |
| Rice | Drought | GC–MS | [162] |
| Rice | Low temperature | LC–MS/MS | [179] |
| Wheat | Drought | UPLC–MS | [167] |
| Wheat | Low nitrogen | UPLC–QTOF–MS | [180] |
| Maize | Salinity | NMR | [181] |
| Maize | Drought | GC–TOF–MS | [166] |
| Maize | Low nitrogen | GC–MS | [182] |
| Barley | Salinity | LC–MS | [163] |
| Barley | Drought | GC–MS | [183] |
| Sorghum | Drought | GC–MS | [175] |
| Sorghum | Low nitrogen | GC–MS/LC–MS | [184] |
| Biotic stresses | |||
| Rice | Magnoporthe grisea | NMR, GC/LC–MS/MS | [165] |
| Rice | Rhizoctonia solani | GC–MS | [168] |
| Wheat | Stagonospora nodorum | GC–MS | [185] |
| Maize | Fusarium verticillioides | LC–HRM | [186] |
| Barley | Fusarium graminearum | HPLC, LC–HRMS | [169] |
| Barley | Fusarium graminearum | LC–MS | [173] |
| Sorghum | Burkholderia andropogonis | LC–MS | [174] |
5.4. Challenges and Prospects in Crop Metabolomics
6. Cereal Phenomics
| Phenotyping Platform/ Techniques | Utilization | References |
|---|---|---|
| BreedVision | Tractor-pulled multisensory phenotyping platform with RGB, multispectral, and time-of-flight sensors | [197] |
| GROWSCREEN fluoro | Work under controlled conditions for quantification of fluorescence pigments | [198] |
| Light curtain analysis | Utilized for leaf area and plant height estimation | [199] |
| LEAF-E | Estimates the total leaf growth and rate of development | [193] |
| Phenocart | A movable platform in the field used for high-throughput phenotyping | [192] |
| Phenopsis | Used to study drought tolerance abilities under control conditions | [200] |
| Phenoplant | Used to obtain chlorophyll fluorescence parameters under controlled conditions | [201] |
| Phenovator | Used for phenotyping a large number of samples under controlled conditions by providing fluorescence, multispectral, and RGB images | [202] |
| Pushcarts | Carts with different sensors used to study plant response to drought, heat, and other stresses; operated by one person | [190] |
| Terrestrial laser scanning | Used for measuring plant height and architecture under field conditions | [203] |
| TRiP | Used to study circadian changes in plants with a series of images and TrRiP algorithm | [204] |
| Unmanned aerial platforms | Multiple sensors can be employed for measuring various traits throughout the field | [205] |
6.1. Plant Phenotyping Platforms
6.2. Imaging Sensors and Analysis
6.2.1. RGB/Visible Imaging
6.2.2. Multispectral Imaging
6.2.3. Hyperspectral Imaging
6.2.4. Thermal Imaging
6.2.5. Fluorescence Imaging
6.2.6. X-ray Computed Tomography
| Crop | Phenotyping Platform Sensor or Techniques | Field/ Lab | Abiotic Stresses/ Agronomic Traits | Imaging Sensor | Description | Reference |
|---|---|---|---|---|---|---|
| Rice | Ground-based platforms | Lab | Salinity | Thermal imaging | Plant growth and transpiration rate was used to predict the salinity responses of plants | [214] |
| Rice | Ground-based platforms | Field | Nitrogen content | Hyperspectral imaging | Reflectance information and cumulative temperature data were used in the partial least square method for predicting nitrogen status | [210] |
| Rice | Ground-based platforms | Field | Drought stress | RGB imaging | Stay green-related feature were extracted for assessing drought-tolerance ability | [196] |
| Wheat | Ground-based platforms | Field | Drought | Passive and active hyperspectral reflectance sensors | Performances of different sensors were evaluated for predicting drought tolerance abilities of genotypes with water stress indices | [208] |
| Wheat | Manned helicopter | Field | Water and heat stress | Thermal imaging | Canopy temperature was measured in high-throughput way for avoiding the plot-to-plot variation with handheld infrared thermometers | [212] |
| Wheat | Ground-based platforms | Field | Nitrogen content | Hyperspectral imaging | Leaf nitrogen status was measured from spectral information with a calibrated model | [217] |
| Maize | Organ/tissue phenotyping | Lab | Drought stress | Hyperspectral imaging | Support vector machine classification method separated the water-stressed genotypes from healthy plants with information from vegetation indices | [218] |
| Maize | Unmanned aerial vehicle | Field | Water status in plants | Multispectral and thermal imaging | Crop water stress index was predicted from the multispectral images to decipher the plant water status | [219] |
| Maize | Unmanned aerial vehicle | Field | Weeds | RGB imaging | Loss of greenness from maize was used for separating weeds from the plants | [220] |
| Barley | Ground-based platforms | Field | Drought | Hyperspectral imaging | Linear ordinal support vector machine model was used to predict the drought responses in the plants | [209] |
| Barley | Organ/tissue phenotyping | Lab | Salinity | Thermal imaging | Infrared imaging was used to differentiate salt concentration among the genotypes | [191] |
| Barley | Unmanned aerial vehicle | Field | Nitrogen use efficiency | RGB, multispectral, and thermal imaging | UAV’s having RGB, multispectral, and thermal imaging was utilized for nitrogen use efficiency | [221] |
| Sorghum | Ground-based platforms | Field | Plant height | RGB, ultrasonic, and LIDAR sensor | A comparison was performed for predicting sorghum height, with the LIDAR sensor performing best | [222] |
| Sorghum | Unmanned aerial vehicle | Field | Drought stress | RGB imaging | Plant height, biomass, and leaf area were measured for assessing the drought-tolerant abilities of genotypes | [223] |
| Crop | Phenotyping Platform/Sensor/Techniques | Field/Lab | Disease/Pest/ Virus | Imaging Sensor | Description | References |
|---|---|---|---|---|---|---|
| Rice | Ground and aerial platforms | Field/ Lab | Rice blast | Multispectral imaging | Reflectance values were correlated with the disease severity | [224] |
| Rice | Organ/tissue phenotyping | Lab | Alfatoxin | Near-infrared spectroscopy | Partial least regression utilized reflectance information for separating infected and healthy seeds | [225] |
| Rice | Unmanned aerial vehicle | Field | Rice sheath blight | RGB and multispectral imaging | Percentage of infected leaves from RGB images and vegetation indices from multispectral imaging aid in the detection of rice sheath blight | [226] |
| Wheat | Ground-based platforms | Field | Septoria tritici blotch | Hyperspectral imaging | Spectral reflectance indices derived from hyperspectral imaging aids in detecting the presence and severity of Septoria tritici blotch | [189] |
| Wheat | Organ/tissue phenotyping | Lab | Fusarium head blight | Hyperspectral imaging | Fusarium head blight was detected using visible-NIR imaging of wheat grain, and grains were separated using linear discrimination and principal component analysis | [227] |
| Wheat | Unmanned aerial vehicle | Field | Yellow rust | Hyperspectral imaging | Deep convolutional neural network utilizing both spectral and spatial resolution provided the best performance for predicting yellow rust | [228] |
| Maize | Ground and aerial platforms | Field | Northern leaf blight | RGB imaging | A convolutional neural network was used for classifying the infected leaves | [229] |
| Maize | Organ/tissue phenotyping | Lab | Alfatoxin infection | Fluorescence imaging | Discriminant analysis from the imaging data aids in the separation of healthy and affected kernels | [213] |
| Maize | Unmanned aerial vehicle | Lab | Tar spot | Multispectral and thermal imaging | Disease-progression curve was analyzed using vegetation indices derived from the images | [230] |
| Barley | Ground-based platforms | Field | Powdery mildew | Hyperspectral imaging | Support vector machine was used for early detection of disease symptoms by measuring reflection bands | [231] |
| Barley | Ground-based platforms | Field | Blast | Hyperspectral imaging | Spectral angle mapping and spectral unmixing analysis was used to locate the pathogen lesions | [232] |
| Barley | Organ/tissue phenotyping | Lab | Rust and powdery mildew | Hyperspectral imaging | A simple volume maximization algorithm was developed for differentiating different infected leaves | [233] |
6.3. Challenges and Prospects in Crop Phenomics
7. Conclusions
Author Contributions
Funding
Data Availability Statement
Acknowledgments
Conflicts of Interest
References
- Shalini, S.; Singla, A.; Goyal, M.; Kaur, V.; Kumar, P. Omics in agriculture: Applications, challenges and future perspectives. In Crop Improvement for Sustainability; Kumar, P., Kumar, S., Kumar, S., Yadav, R.C., Eds.; Daya Publishing House: New Delhi, India, 2018; pp. 343–360. [Google Scholar]
- Röder, M.S.; Korzun, V.; Wendehake, K.; Plaschke, J.; Tixier, M.-H.; Leroy, P.; Ganal, M.W. A microsatellite map of wheat. Genetics 1998, 149, 2007–2023. [Google Scholar] [CrossRef] [PubMed]
- Bernardo, R. Breeding for Quantitative Traits in Plants; Stemma Press: Woodbury, MN, USA, 2010. [Google Scholar]
- Ganal, M.W.; Plieske, J.; Hohmeyer, A.; Polley, A.; Röder, M.S. High-throughput genotyping for cereal research and breeding. In Applications of Genetic and Genomic Research in Cereals; Elsevier: Amsterdam, The Netherlands, 2019; pp. 3–17. [Google Scholar]
- Pruitt, K.D.; Tatusova, T.; Brown, G.R.; Maglott, D.R. NCBI Reference Sequences (RefSeq): Current status, new features and genome annotation policy. Nucleic Acids Res. 2012, 40, D130–D135. [Google Scholar] [CrossRef] [Green Version]
- Rabanus-Wallace, M.T.; Stein, N. Progress in sequencing of Triticeae genomes and future uses. In Applications of Genetic and Genomic Research in Cereals; Elsevier: Amsterdam, The Netherlands, 2019; pp. 19–47. [Google Scholar]
- Goff, S.A.; Ricke, D.; Lan, T.-H.; Presting, G.; Wang, R.; Dunn, M.; Glazebrook, J.; Sessions, A.; Oeller, P.; Varma, H. A draft sequence of the rice genome (Oryza sativa L. ssp. japonica). Science 2002, 296, 92–100. [Google Scholar] [CrossRef] [PubMed] [Green Version]
- Yu, J.; Hu, S.; Wang, J.; Wong, G.K.-S.; Li, S.; Liu, B.; Deng, Y.; Dai, L.; Zhou, Y.; Zhang, X. A draft sequence of the rice genome (Oryza sativa L. ssp. indica). Science 2002, 296, 79–92. [Google Scholar] [CrossRef]
- Paterson, A.H.; Bowers, J.E.; Bruggmann, R.; Dubchak, I.; Grimwood, J.; Gundlach, H.; Haberer, G.; Hellsten, U.; Mitros, T.; Poliakov, A. The Sorghum bicolor genome and the diversification of grasses. Nature 2009, 457, 551–556. [Google Scholar] [CrossRef] [Green Version]
- Schnable, P.S.; Ware, D.; Fulton, R.S.; Stein, J.C.; Wei, F.; Pasternak, S.; Liang, C.; Zhang, J.; Fulton, L.; Graves, T.A. The B73 maize genome: Complexity, diversity, and dynamics. Science 2009, 326, 1112–1115. [Google Scholar] [CrossRef] [Green Version]
- International Wheat Genome Sequencing Consortium. A physical, genetic and functional sequence assembly of the barley genome. Nature 2012, 491, 711. [Google Scholar] [CrossRef]
- International Wheat Genome Sequencing Consortium. A chromosome-based draft sequence of the hexaploid bread wheat (Triticum aestivum L.) genome. Science 2014, 345, 6194. [Google Scholar]
- Consortium, I.W.G.S. Shifting the limits in wheat research and breeding using a fully annotated reference genome. Science 2018, 361. [Google Scholar] [CrossRef] [Green Version]
- Cameron, D.L.; Di Stefano, L.; Papenfuss, A.T. Comprehensive evaluation and characterisation of short read general-purpose structural variant calling software. Nat. Commun. 2019, 10, 1–11. [Google Scholar] [CrossRef] [PubMed]
- Padmarasu, S.; Himmelbach, A.; Mascher, M.; Stein, N. In situ hi-C for plants: An improved method to detect long-range chromatin interactions. In Plant Long Non-Coding RNAs; Springer: Berlin/Heidelberg, Germany, 2019; pp. 441–472. [Google Scholar]
- Yuan, Y.; Chung, C.Y.-L.; Chan, T.-F. Advances in optical mapping for genomic research. Comput. Struct. Biotechnol. J. 2020, 18, 2051–2062. [Google Scholar] [CrossRef] [PubMed]
- Zhu, T.; Wang, L.; Rimbert, H.; Rodriguez, J.C.; Deal, K.R.; De Oliveira, R.; Choulet, F.; Keeble-Gagnère, G.; Tibbits, J.; Rogers, J.; et al. Optical maps refine the bread wheat Triticum aestivum cv. Chinese Spring genome assembly. Plant J. 2021, 107, 303–314. [Google Scholar] [CrossRef] [PubMed]
- Alexandrov, N.; Tai, S.; Wang, W.; Mansueto, L.; Palis, K.; Fuentes, R.R.; Ulat, V.J.; Chebotarov, D.; Zhang, G.; Li, Z. SNP-Seek database of SNPs derived from 3000 rice genomes. Nucleic Acids Res. 2015, 43, D1023–D1027. [Google Scholar] [CrossRef] [PubMed]
- Luo, H.; Zhao, W.; Wang, Y.; Xia, Y.; Wu, X.; Zhang, L.; Tang, B.; Zhu, J.; Fang, L.; Du, Z. SorGSD: A sorghum genome SNP database. Biotechnol. Biofuels 2016, 9, 1–9. [Google Scholar] [CrossRef] [Green Version]
- König, P.; Beier, S.; Basterrechea, M.; Schüler, D.; Arend, D.; Mascher, M.; Stein, N.; Scholz, U.; Lange, M. BRIDGE–a visual analytics web tool for barley genebank genomics. Front. Plant Sci. 2020, 11, 701. [Google Scholar] [CrossRef]
- Sun, C.; Dong, Z.; Zhao, L.; Ren, Y.; Zhang, N.; Chen, F. The Wheat 660K SNP array demonstrates great potential for marker-assisted selection in polyploid wheat. Plant Biotechnol. J. 2020, 18, 1354–1360. [Google Scholar] [CrossRef]
- Saxena, R.K.; Edwards, D.; Varshney, R.K. Structural variations in plant genomes. Brief. Funct. Genom. 2014, 13, 296–307. [Google Scholar] [CrossRef] [Green Version]
- Żmieńko, A.; Samelak, A.; Kozłowski, P.; Figlerowicz, M. Copy number polymorphism in plant genomes. Theor. Appl. Genet. 2014, 127, 1–18. [Google Scholar] [CrossRef] [PubMed] [Green Version]
- Wang, Y.; Xiong, G.; Hu, J.; Jiang, L.; Yu, H.; Xu, J.; Fang, Y.; Zeng, L.; Xu, E.; Xu, J. Copy number variation at the GL7 locus contributes to grain size diversity in rice. Nat. Genet. 2015, 47, 944–948. [Google Scholar] [CrossRef]
- Würschum, T.; Boeven, P.H.; Langer, S.M.; Longin, C.F.H.; Leiser, W.L. Multiply to conquer: Copy number variations at Ppd-B1 and Vrn-A1 facilitate global adaptation in wheat. BMC Genet. 2015, 16, 96. [Google Scholar] [CrossRef] [PubMed] [Green Version]
- Teplyakova, S.; Lebedeva, M.; Ivanova, N.; Horeva, V.; Voytsutskaya, N.; Kovaleva, O.; Potokina, E. Impact of the 7-bp deletion in HvGA20ox2 gene on agronomic important traits in barley (Hordeum vulgare L.). BMC Plant Biol. 2017, 17, 1–10. [Google Scholar] [CrossRef] [Green Version]
- Piffanelli, P.; Ramsay, L.; Waugh, R.; Benabdelmouna, A.; D’Hont, A.; Hollricher, K.; Jørgensen, J.H.; Schulze-Lefert, P.; Panstruga, R. A barley cultivation-associated polymorphism conveys resistance to powdery mildew. Nature 2004, 430, 887–891. [Google Scholar] [CrossRef] [PubMed] [Green Version]
- Yu, J.; Buckler, E.S. Genetic association mapping and genome organization of maize. Curr. Opin. Biotechnol. 2006, 17, 155–160. [Google Scholar] [CrossRef] [PubMed]
- Guo, T.; Yang, J.; Li, D.; Sun, K.; Luo, L.; Xiao, W.; Wang, J.; Liu, Y.; Wang, S.; Wang, H. Integrating GWAS, QTL, mapping and RNA-seq to identify candidate genes for seed vigor in rice (Oryza sativa L.). Mol. Breed. 2019, 39, 87. [Google Scholar] [CrossRef]
- Kim, S.-M.; Reinke, R.F. A novel resistance gene for bacterial blight in rice, Xa43 (t) identified by GWAS, confirmed by QTL mapping using a bi-parental population. PLoS ONE 2019, 14, e0211775. [Google Scholar] [CrossRef] [Green Version]
- Kang, J.-W.; Kabange, N.R.; Phyo, Z.; Park, S.-Y.; Lee, S.-M.; Lee, J.-Y.; Shin, D.; Cho, J.H.; Park, D.-S.; Ko, J.-M. Combined linkage mapping and Genome-Wide Association study identified QTLs associated with grain shape and weight in rice (Oryza sativa L.). Agronomy 2020, 10, 1532. [Google Scholar] [CrossRef]
- Yano, K.; Morinaka, Y.; Wang, F.; Huang, P.; Takehara, S.; Hirai, T.; Ito, A.; Koketsu, E.; Kawamura, M.; Kotake, K.; et al. GWAS with principal component analysis identifies a gene comprehensively controlling rice architecture. Proc. Natl. Acad. Sci. USA 2019, 116, 21262–21267. [Google Scholar] [CrossRef]
- Yuan, J.; Wang, X.; Zhao, Y.; Khan, N.U.; Zhao, Z.; Zhang, Y.; Wen, X.; Tang, F.; Wang, F.; Li, Z. Genetic basis and identification of candidate genes for salt tolerance in rice by GWAS. Sci. Rep. 2020, 10, 1–9. [Google Scholar] [CrossRef]
- Gao, F.; Wen, W.; Liu, J.; Rasheed, A.; Yin, G.; Xia, X.; Wu, X.; He, Z. Genome-wide linkage mapping of QTL for yield components, plant height and yield-related physiological traits in the Chinese wheat cross Zhou 8425B/Chinese Spring. Front. Plant Sci. 2015, 6, 1099. [Google Scholar] [CrossRef] [Green Version]
- Wu, Q.-H.; Chen, Y.-X.; Zhou, S.-H.; Fu, L.; Chen, J.-J.; Xiao, Y.; Zhang, D.; Ouyang, S.-H.; Zhao, X.-J.; Cui, Y. High-density genetic linkage map construction and QTL mapping of grain shape and size in the wheat population Yanda1817× Beinong6. PLoS ONE 2015, 10, e0118144. [Google Scholar] [CrossRef] [Green Version]
- Tian, X.; Wen, W.; Xie, L.; Fu, L.; Xu, D.; Fu, C.; Wang, D.; Chen, X.; Xia, X.; Chen, Q. Molecular mapping of reduced plant height gene Rht24 in bread wheat. Front. Plant Sci. 2017, 8, 1379. [Google Scholar] [CrossRef] [Green Version]
- Guo, Z.; Chen, D.; Alqudah, A.M.; Roder, M.S.; Ganal, M.W.; Schnurbusch, T. Genome-wide association analyses of 54 traits identified multiple loci for the determination of floret fertility in wheat. New Phytol. 2017, 214, 257–270. [Google Scholar] [CrossRef]
- Muqaddasi, Q.H.; Brassac, J.; Koppolu, R.; Plieske, J.; Ganal, M.W.; Röder, M.S. TaAPO-A1, an ortholog of rice ABERRANT PANICLE ORGANIZATION 1, is associated with total spikelet number per spike in elite European hexaploid winter wheat (Triticum aestivum L.) varieties. Sci. Rep. 2019, 9, 1–12. [Google Scholar] [CrossRef] [PubMed] [Green Version]
- Poland, J.A.; Bradbury, P.J.; Buckler, E.S.; Nelson, R.J. Genome-wide nested association mapping of quantitative resistance to northern leaf blight in maize. Proc. Natl. Acad. Sci. USA 2011, 108, 6893–6898. [Google Scholar] [CrossRef] [PubMed] [Green Version]
- Li, X.; Zhou, Z.; Ding, J.; Wu, Y.; Zhou, B.; Wang, R.; Ma, J.; Wang, S.; Zhang, X.; Xia, Z. Combined linkage and association mapping reveals QTL and candidate genes for plant and ear height in maize. Front. Plant Sci. 2016, 7, 833. [Google Scholar] [CrossRef] [PubMed] [Green Version]
- Wu, X.; Li, Y.; Shi, Y.; Song, Y.; Zhang, D.; Li, C.; Buckler, E.S.; Li, Y.; Zhang, Z.; Wang, T. Joint-linkage mapping and GWAS reveal extensive genetic loci that regulate male inflorescence size in maize. Plant Biotechnol. J. 2016, 14, 1551–1562. [Google Scholar] [CrossRef] [Green Version]
- Li, H.; Thrash, A.; Tang, J.D.; He, L.; Yan, J.; Warburton, M.L. Leveraging GWAS data to identify metabolic pathways and networks involved in maize lipid biosynthesis. Plant J. 2019, 98, 853–863. [Google Scholar] [CrossRef] [Green Version]
- Wang, H.; Wei, J.; Li, P.; Wang, Y.; Ge, Z.; Qian, J.; Fan, Y.; Ni, J.; Xu, Y.; Yang, Z. Integrating GWAS and gene expression analysis identifies candidate genes for root morphology traits in maize at the seedling stage. Genes 2019, 10, 773. [Google Scholar] [CrossRef] [Green Version]
- Wang, J.; Yang, J.; Jia, Q.; Zhu, J.; Shang, Y.; Hua, W.; Zhou, M. A new QTL for plant height in barley (Hordeum vulgare L.) showing no negative effects on grain yield. PLoS ONE 2014, 9, e90144. [Google Scholar] [CrossRef]
- Liller, C.B.; Walla, A.; Boer, M.P.; Hedley, P.; Macaulay, M.; Effgen, S.; von Korff, M.; van Esse, G.W.; Koornneef, M. Fine mapping of a major QTL for awn length in barley using a multiparent mapping population. Theor. Appl. Genet. 2017, 130, 269–281. [Google Scholar] [CrossRef] [Green Version]
- Alqudah, A.M.; Sharma, R.; Pasam, R.K.; Graner, A.; Kilian, B.; Schnurbusch, T. Genetic dissection of photoperiod response based on GWAS of pre-anthesis phased duration in spring barley. PLoS ONE 2014, 9, e113120. [Google Scholar] [CrossRef] [Green Version]
- Karunarathne, S.D.; Han, Y.; Zhang, X.-Q.; Zhou, G.; Hill, C.B.; Chen, K.; Angessa, T.; Li, C. Genome-wide association study and identification of candidate genes for nitrogen use efficiency in barley (Hordeum vulgare L.). Front. Plant Sci. 2020, 11, 1361. [Google Scholar] [CrossRef] [PubMed]
- Thabet, S.G.; Moursi, Y.S.; Karam, M.A.; Börner, A.; Alqudah, A.M. Natural variation uncovers candidate genes for barley spikelet number and grain yield under drought stress. Genes 2020, 11, 533. [Google Scholar] [CrossRef] [PubMed]
- Zou, G.; Zhai, G.; Feng, Q.; Yan, S.; Wang, A.; Zhao, Q.; Shao, J.; Zhang, Z.; Zou, J.; Han, B. Identification of QTLs for eight agronomically important traits using an ultra-high-density map based on SNPs generated from high-throughput sequencing in sorghum under contrasting photoperiods. J. Exp. Bot. 2012, 63, 5451–5462. [Google Scholar] [CrossRef] [PubMed] [Green Version]
- Boyles, R.E.; Pfeiffer, B.K.; Cooper, E.A.; Rauh, B.L.; Zielinski, K.J.; Myers, M.T.; Brenton, Z.; Rooney, W.L.; Kresovich, S. Genetic dissection of sorghum grain quality traits using diverse and segregating populations. Theor. Appl. Genet. 2017, 130, 697–716. [Google Scholar] [CrossRef] [Green Version]
- Zhao, J.; Mantilla Perez, M.B.; Hu, J.; Salas Fernandez, M.G. Genome-wide association study for nine plant architecture traits in sorghum. Plant Genome 2016, 9, 1–14. [Google Scholar] [CrossRef] [Green Version]
- Rhodes, D.H.; Hoffmann, L.; Rooney, W.L.; Herald, T.J.; Bean, S.; Boyles, R.; Brenton, Z.W.; Kresovich, S. Genetic architecture of kernel composition in global sorghum germplasm. BMC Genom. 2017, 18, 1–8. [Google Scholar] [CrossRef] [Green Version]
- Tao, Y.; Zhao, X.; Wang, X.; Hathorn, A.; Hunt, C.; Cruickshank, A.W.; van Oosterom, E.J.; Godwin, I.D.; Mace, E.S.; Jordan, D.R. Large-scale GWAS in sorghum reveals common genetic control of grain size among cereals. Plant Biotechnol. J. 2020, 18, 1093–1105. [Google Scholar] [CrossRef] [PubMed] [Green Version]
- Jayakodi, M.; Padmarasu, S.; Haberer, G.; Bonthala, V.S.; Gundlach, H.; Monat, C.; Lux, T.; Kamal, N.; Lang, D.; Himmelbach, A.; et al. The barley pan-genome reveals the hidden legacy of mutation breeding. Nature 2020, 588, 284–289. [Google Scholar] [CrossRef]
- Jayakodi, M.; Schreiber, M.; Stein, N.; Mascher, M. Building pan-genome infrastructures for crop plants and their use in association genetics. DNA Res. 2021, 28, dsaa030. [Google Scholar] [CrossRef]
- Zhao, Q.; Feng, Q.; Lu, H.; Li, Y.; Wang, A.; Tian, Q.; Zhan, Q.; Lu, Y.; Zhang, L.; Huang, T. Pan-genome analysis highlights the extent of genomic variation in cultivated and wild rice. Nat. Genet. 2018, 50, 278–284. [Google Scholar] [CrossRef] [Green Version]
- Walkowiak, S.; Gao, L.; Monat, C.; Haberer, G.; Kassa, M.T.; Brinton, J.; Ramirez-Gonzalez, R.H.; Kolodziej, M.C.; Delorean, E.; Thambugala, D.; et al. Multiple wheat genomes reveal global variation in modern breeding. Nature 2020, 588, 277–283. [Google Scholar] [CrossRef] [PubMed]
- Sim, G.; Kafatos, F.; Jones, C.; Koehler, M.; Efstratiadis, A.; Maniatis, T. Use of a cDNA library for studies on evolution and developmental expression of the chorion multigene families. Cell 1979, 18, 1303–1316. [Google Scholar] [CrossRef]
- Lowe, R.; Shirley, N.; Bleackley, M.; Dolan, S.; Shafee, T. Transcriptomics technologies. PLoS Comput. Biol. 2017, 13, e1005457. [Google Scholar] [CrossRef] [PubMed] [Green Version]
- Singh, J.; Aggarwal, R.; Gurjar, M.; Sharma, S.; Jain, S.; Saharan, M. Identification and expression analysis of pathogenicity-related genes in Tilletia indica inciting Karnal bunt of wheat. Australas. Plant Pathol. 2020, 49, 393–402. [Google Scholar] [CrossRef]
- Velculescu, V.E.; Zhang, L.; Vogelstein, B.; Kinzler, K.W. Serial analysis of gene expression. Science 1995, 270, 484–487. [Google Scholar] [CrossRef] [PubMed] [Green Version]
- Itzkovitz, S.; Van Oudenaarden, A. Validating transcripts with probes and imaging technology. Nat. Methods 2011, 8, S12–S19. [Google Scholar] [CrossRef] [PubMed] [Green Version]
- LaFratta, C.N.; Walt, D.R. Very high density sensing arrays. Chem. Rev. 2008, 108, 614–637. [Google Scholar] [CrossRef]
- Darshan, K.; Aggarwal, R.; Bashyal, B.M.; Singh, J.; Shanmugam, V.; Gurjar, M.S.; Solanke, A.U. Transcriptome profiling provides insights into potential antagonistic mechanisms involved in Chaetomium globosum against Bipolaris sorokiniana. Front. Microbiol. 2020, 11, 578115. [Google Scholar] [CrossRef]
- Le Nguyen, K.; Grondin, A.; Courtois, B.; Gantet, P. Next-generation sequencing accelerates crop gene discovery. Trends Plant Sci. 2019, 24, 263–274. [Google Scholar] [CrossRef]
- Knierim, E.; Lucke, B.; Schwarz, J.M.; Schuelke, M.; Seelow, D. Systematic comparison of three methods for fragmentation of long-range PCR products for next generation sequencing. PLoS ONE 2011, 6, e28240. [Google Scholar] [CrossRef] [PubMed] [Green Version]
- Luo, Y.; Hitz, B.C.; Gabdank, I.; Hilton, J.A.; Kagda, M.S.; Lam, B.; Myers, Z.; Sud, P.; Jou, J.; Lin, K. New developments on the Encyclopedia of DNA Elements (ENCODE) data portal. Nucleic Acids Res. 2020, 48, D882–D889. [Google Scholar] [CrossRef] [PubMed]
- Zhang, M.; Hong, L.-Z.; Gu, M.-F.; Wu, C.-D.; Zhang, G. Transcriptome analyses revealed molecular responses of Cynanchum auriculatum leaves to saline stress. Sci. Rep. 2020, 10, 1–11. [Google Scholar]
- Ahanger, M.A.; Akram, N.A.; Ashraf, M.; Alyemeni, M.N.; Wijaya, L.; Ahmad, P. Plant responses to environmental stresses—From gene to biotechnology. AoB Plants 2017, 9, plx025. [Google Scholar] [CrossRef] [Green Version]
- Selvi, A.; Devi, K.; Manimekalai, R.; Prathima, P. Comparative analysis of drought-responsive transcriptomes of sugarcane genotypes with differential tolerance to drought. 3 Biotech 2020, 10, 1–14. [Google Scholar] [CrossRef] [PubMed]
- Le, D.T.; Nishiyama, R.; Watanabe, Y.; Tanaka, M.; Seki, M.; Yamaguchi-Shinozaki, K.; Shinozaki, K.; Tran, L.-S.P. Differential gene expression in soybean leaf tissues at late developmental stages under drought stress revealed by genome-wide transcriptome analysis. PLoS ONE 2012, 7, e49522. [Google Scholar] [CrossRef] [Green Version]
- Formentin, E.; Sudiro, C.; Perin, G.; Riccadonna, S.; Barizza, E.; Baldoni, E.; Lavezzo, E.; Stevanato, P.; Sacchi, G.A.; Fontana, P. Transcriptome and cell physiological analyses in different rice cultivars provide new insights into adaptive and salinity stress responses. Front. Plant Sci. 2018, 9, 204. [Google Scholar] [CrossRef] [PubMed] [Green Version]
- Li, Z.; Hu, G.; Liu, X.; Zhou, Y.; Li, Y.; Zhang, X.; Yuan, X.; Zhang, Q.; Yang, D.; Wang, T. Transcriptome sequencing identified genes and gene ontologies associated with early freezing tolerance in maize. Front. Plant Sci. 2016, 7, 1477. [Google Scholar] [CrossRef] [Green Version]
- Abdel-Ghany, S.E.; Ullah, F.; Ben-Hur, A.; Reddy, A.S. Transcriptome analysis of drought-resistant and drought-sensitive sorghum (Sorghum bicolor) genotypes in response to peg-induced drought stress. Int. J. Mol. Sci. 2020, 21, 772. [Google Scholar] [CrossRef] [Green Version]
- Yoo, Y.-H.; Nalini Chandran, A.K.; Park, J.-C.; Gho, Y.-S.; Lee, S.-W.; An, G.; Jung, K.-H. OsPhyB-mediating novel regulatory pathway for drought tolerance in rice root identified by a global RNA-Seq transcriptome analysis of rice genes in response to water deficiencies. Front. Plant Sci. 2017, 8, 580. [Google Scholar] [CrossRef] [PubMed]
- Hong, W.-J.; Jiang, X.; Ahn, H.R.; Choi, J.; Kim, S.-R.; Jung, K.-H. Systematic analysis of cold stress response and diurnal rhythm using transcriptome data in rice reveals the molecular networks related to various biological processes. Int. J. Mol. Sci. 2020, 21, 6872. [Google Scholar] [CrossRef] [PubMed]
- Hu, L.; Xie, Y.; Fan, S.; Wang, Z.; Wang, F.; Zhang, B.; Li, H.; Song, J.; Kong, L. Comparative analysis of root transcriptome profiles between drought-tolerant and susceptible wheat genotypes in response to water stress. Plant Sci. 2018, 272, 276–293. [Google Scholar] [CrossRef] [PubMed]
- Winfield, M.O.; Lu, C.; Wilson, I.D.; Coghill, J.A.; Edwards, K.J. Cold-and light-induced changes in the transcriptome of wheat leading to phase transition from vegetative to reproductive growth. BMC Plant Biol. 2009, 9, 1–14. [Google Scholar] [CrossRef] [Green Version]
- Kawaura, K.; Mochida, K.; Yamazaki, Y.; Ogihara, Y. Transcriptome analysis of salinity stress responses in common wheat using a 22k oligo-DNA microarray. Funct. Integr. Genom. 2006, 6, 132–142. [Google Scholar] [CrossRef] [PubMed]
- Wang, N.; Li, L.; Gao, W.; Wu, Y.; Yong, H.; Weng, J.; Li, M.-s.; Zhang, D.; Hao, Z.; Li, X. Transcriptomes of early developing tassels under drought stress reveal differential expression of genes related to drought tolerance in maize. J. Integr. Agric. 2018, 17, 1276–1288. [Google Scholar] [CrossRef] [Green Version]
- Wang, M.; Wang, Y.; Zhang, Y.; Li, C.; Gong, S.; Yan, S.; Li, G.; Hu, G.; Ren, H.; Yang, J. Comparative transcriptome analysis of salt-sensitive and salt-tolerant maize reveals potential mechanisms to enhance salt resistance. Genes Genom. 2019, 41, 781–801. [Google Scholar] [CrossRef]
- Janiak, A.; Kwasniewski, M.; Sowa, M.; Kuczyńska, A.; Mikołajczak, K.; Ogrodowicz, P.; Szarejko, I. Insights into barley root transcriptome under mild drought stress with an emphasis on gene expression regulatory mechanisms. Int. J. Mol. Sci. 2019, 20, 6139. [Google Scholar] [CrossRef] [Green Version]
- Hill, C.B.; Cassin, A.; Keeble-Gagnère, G.; Doblin, M.S.; Bacic, A.; Roessner, U. De novo transcriptome assembly and analysis of differentially expressed genes of two barley genotypes reveal root-zone-specific responses to salt exposure. Sci. Rep. 2016, 6, 1–14. [Google Scholar] [CrossRef] [Green Version]
- Sun, X.; Zheng, H.; Li, J.; Liu, L.; Zhang, X.; Sui, N. Comparative transcriptome analysis reveals new lncRNAs responding to salt stress in sweet sorghum. Front. Bioeng. Biotechnol. 2020, 8, 331. [Google Scholar] [CrossRef] [Green Version]
- Punia, H.; Tokas, J.; Bhadu, S.; Mohanty, A.K.; Rawat, P.; Malik, A. Proteome dynamics and transcriptome profiling in sorghum [Sorghum bicolor (L.) Moench] under salt stress. 3 Biotech 2020, 10, 1–10. [Google Scholar] [CrossRef]
- Atkinson, N.J.; Urwin, P.E. The interaction of plant biotic and abiotic stresses: From genes to the field. J. Exp. Bot. 2012, 63, 3523–3543. [Google Scholar] [CrossRef] [Green Version]
- Bilgin, D.D.; Zavala, J.A.; Zhu, J.; Clough, S.J.; Ort, D.R.; DeLUCIA, E.H. Biotic stress globally downregulates photosynthesis genes. Plant Cell Environ. 2010, 33, 1597–1613. [Google Scholar] [CrossRef] [PubMed] [Green Version]
- Betsuyaku, S.; Katou, S.; Takebayashi, Y.; Sakakibara, H.; Nomura, N.; Fukuda, H. Salicylic acid and jasmonic acid pathways are activated in spatially different domains around the infection site during effector-triggered immunity in Arabidopsis thaliana. Plant Cell Physiol. 2018, 59, 8–16. [Google Scholar] [CrossRef]
- Pan, Y.; Liu, Z.; Rocheleau, H.; Fauteux, F.; Wang, Y.; McCartney, C.; Ouellet, T. Transcriptome dynamics associated with resistance and susceptibility against Fusarium head blight in four wheat genotypes. BMC Genom. 2018, 19, 1–26. [Google Scholar] [CrossRef] [PubMed]
- Jeon, J.; Lee, G.-W.; Kim, K.-T.; Park, S.-Y.; Kim, S.; Kwon, S.; Huh, A.; Chung, H.; Lee, D.-Y.; Kim, C.-Y. Transcriptome profiling of the rice blast fungus Magnaporthe oryzae and its host Oryza sativa during infection. Mol. Plant Microbe Interact. 2020, 33, 141–144. [Google Scholar] [CrossRef] [Green Version]
- Tariq, R.; Wang, C.; Qin, T.; Xu, F.; Tang, Y.; Gao, Y.; Ji, Z.; Zhao, K. Comparative transcriptome profiling of rice near-isogenic line carrying Xa23 under infection of Xanthomonas oryzae pv. oryzae. Int. J. Mol. Sci. 2018, 19, 717. [Google Scholar] [CrossRef] [Green Version]
- Zhang, J.; Chen, L.; Fu, C.; Wang, L.; Liu, H.; Cheng, Y.; Li, S.; Deng, Q.; Wang, S.; Zhu, J. Comparative transcriptome analyses of gene expression changes triggered by Rhizoctonia solani AG1 IA infection in resistant and susceptible rice varieties. Front. Plant Sci. 2017, 8, 1422. [Google Scholar] [CrossRef] [PubMed] [Green Version]
- Sharma, C.; Saripalli, G.; Kumar, S.; Gautam, T.; Kumar, A.; Rani, S.; Jain, N.; Prasad, P.; Raghuvanshi, S.; Jain, M. A study of transcriptome in leaf rust infected bread wheat involving seedling resistance gene Lr28. Funct. Plant Biol. 2018, 45, 1046–1064. [Google Scholar] [CrossRef] [PubMed]
- Hao, Y.; Wang, T.; Wang, K.; Wang, X.; Fu, Y.; Huang, L.; Kang, Z. Transcriptome analysis provides insights into the mechanisms underlying wheat plant resistance to stripe rust at the adult plant stage. PLoS ONE 2016, 11, e0150717. [Google Scholar]
- Yu, Y.; Shi, J.; Li, X.; Liu, J.; Geng, Q.; Shi, H.; Ke, Y.; Sun, Q. Transcriptome analysis reveals the molecular mechanisms of the defense response to gray leaf spot disease in maize. BMC Genom. 2018, 19, 1–17. [Google Scholar] [CrossRef] [PubMed]
- Kebede, A.Z.; Johnston, A.; Schneiderman, D.; Bosnich, W.; Harris, L.J. Transcriptome profiling of two maize inbreds with distinct responses to Gibberella ear rot disease to identify candidate resistance genes. BMC Genom. 2018, 19, 1–12. [Google Scholar] [CrossRef] [Green Version]
- Ghorbani, A.; Izadpanah, K.; Dietzgen, R.G. Changes in maize transcriptome in response to maize Iranian mosaic virus infection. PLoS ONE 2018, 13, e0194592. [Google Scholar] [CrossRef] [PubMed] [Green Version]
- Sjokvist, E.; Lemcke, R.; Kamble, M.; Turner, F.; Blaxter, M.; Havis, N.H.; Lyngkjær, M.F.; Radutoiu, S. Dissection of Ramularia leaf spot disease by integrated analysis of barley and Ramularia collo-cygni transcriptome responses. Mol. Plant Microbe Interact. 2019, 32, 176–193. [Google Scholar] [CrossRef] [PubMed] [Green Version]
- Li, Y.; Guo, G.; Zhou, L.; Chen, Y.; Zong, Y.; Huang, J.; Lu, R.; Liu, C. Transcriptome analysis identifies candidate genes and functional pathways controlling the response of two contrasting barley varieties to powdery mildew infection. Int. J. Mol. Sci. 2020, 21, 151. [Google Scholar] [CrossRef] [Green Version]
- Shoaib, A.; Aldaoude, A.; Arabi, M.; Al-Shehadah, E.; Jawhar, M. Transcriptome profiling reveals distinct gene activations in barley responding to scald and spot blotch. Cereal Res. Commun. 2018, 46, 490–498. [Google Scholar] [CrossRef] [Green Version]
- Tan, L.; Chen, S.; Wang, T.; Dai, S. Proteomic insights into seed germination in response to environmental factors. Proteomics 2013, 13, 1850–1870. [Google Scholar] [CrossRef] [PubMed]
- Eldakak, M.; Milad, S.I.; Nawar, A.I.; Rohila, J.S. Proteomics: A biotechnology tool for crop improvement. Front. Plant Sci. 2013, 4, 35. [Google Scholar] [CrossRef] [Green Version]
- Ashwin, N.; Barnabas, L.; Sundar, A.R.; Malathi, P.; Viswanathan, R.; Masi, A.; Agrawal, G.K.; Rakwal, R. Advances in proteomic technologies and their scope of application in understanding plant–pathogen interactions. J. Plant Biochem. Biotechnol. 2017, 26, 371–386. [Google Scholar] [CrossRef]
- Anguraj Vadivel, A.K. Gel-based proteomics in plants: Time to move on from the tradition. Front. Plant Sci. 2015, 6, 369. [Google Scholar] [CrossRef] [PubMed] [Green Version]
- Tan, B.C.; Lim, Y.S.; Lau, S.-E. Proteomics in commercial crops: An overview. J. Proteom. 2017, 169, 176–188. [Google Scholar] [CrossRef]
- Lee, J.; Jiang, W.; Qiao, Y.; Cho, Y.I.; Woo, M.O.; Chin, J.H.; Kwon, S.W.; Hong, S.S.; Choi, I.Y.; Koh, H.J. Shotgun proteomic analysis for detecting differentially expressed proteins in the reduced culm number rice. Proteomics 2011, 11, 455–468. [Google Scholar] [CrossRef] [PubMed]
- Beckett, P. The basics of 2D DIGE. In Difference Gel Electrophoresis (DIGE); Springer: Berlin/Heidelberg, Germany, 2012; pp. 9–19. [Google Scholar]
- Colignon, B.; Raes, M.; Dieu, M.; Delaive, E.; Mauro, S. Evaluation of three-dimensional gel electrophoresis to improve quantitative profiling of complex proteomes. Proteomics 2013, 13, 2077–2082. [Google Scholar] [CrossRef] [PubMed]
- Rabilloud, T. When 2 D is not enough, go for an extra dimension. Proteomics 2013, 13, 2065–2068. [Google Scholar] [CrossRef] [Green Version]
- Resing, K.A.; Ahn, N.G. Proteomics strategies for protein identification. FEBS Lett. 2005, 579, 885–889. [Google Scholar] [CrossRef] [Green Version]
- Yates III, J.R. A century of mass spectrometry: From atoms to proteomes. Nat. Methods 2011, 8, 633–637. [Google Scholar] [CrossRef]
- Shiio, Y.; Aebersold, R. Quantitative proteome analysis using isotope-coded affinity tags and mass spectrometry. Nat. Protoc. 2006, 1, 139. [Google Scholar] [CrossRef] [PubMed]
- Das, A.; Paudel, B.; Rohila, J.S. Potentials of proteomics in crop breeding. In Advances in Plant Breeding Strategies: Breeding, Biotechnology and Molecular Tools; Springer: Berlin/Heidelberg, Germany, 2015; pp. 513–537. [Google Scholar]
- Evans, C.; Noirel, J.; Ow, S.Y.; Salim, M.; Pereira-Medrano, A.G.; Couto, N.; Pandhal, J.; Smith, D.; Pham, T.K.; Karunakaran, E. An insight into iTRAQ: Where do we stand now? Anal. Bioanal. Chem. 2012, 404, 1011–1027. [Google Scholar] [CrossRef] [PubMed]
- Van Emon, J.M. The omics revolution in agricultural research. J. Agric. Food Chem. 2016, 64, 36–44. [Google Scholar] [CrossRef] [PubMed]
- Ong, S.-E.; Blagoev, B.; Kratchmarova, I.; Kristensen, D.B.; Steen, H.; Pandey, A.; Mann, M. Stable isotope labeling by amino acids in cell culture, SILAC, as a simple and accurate approach to expression proteomics. Mol. Cell. Proteom. 2002, 1, 376–386. [Google Scholar] [CrossRef] [Green Version]
- Mastrobuoni, G.; Irgang, S.; Pietzke, M.; Aßmus, H.E.; Wenzel, M.; Schulze, W.X.; Kempa, S. Proteome dynamics and early salt stress response of the photosynthetic organism Chlamydomonas reinhardtii. BMC Genom. 2012, 13, 1–13. [Google Scholar] [CrossRef] [Green Version]
- Liebler, D.C.; Zimmerman, L.J. Targeted quantitation of proteins by mass spectrometry. Biochemistry 2013, 52, 3797–3806. [Google Scholar] [CrossRef]
- Jorrín-Novo, J.V.; Pascual, J.; Sánchez-Lucas, R.; Romero-Rodríguez, M.C.; Rodríguez-Ortega, M.J.; Lenz, C.; Valledor, L. Fourteen years of plant proteomics reflected in Proteomics: Moving from model species and 2DE-based approaches to orphan species and gel-free platforms. Proteomics 2015, 15, 1089–1112. [Google Scholar] [CrossRef] [PubMed]
- Wu, Y.; Mirzaei, M.; Pascovici, D.; Chick, J.M.; Atwell, B.J.; Haynes, P.A. Quantitative proteomic analysis of two different rice varieties reveals that drought tolerance is correlated with reduced abundance of photosynthetic machinery and increased abundance of ClpD1 protease. J. Proteom. 2016, 143, 73–82. [Google Scholar] [CrossRef] [PubMed]
- Ji, Z.; Zeng, Y.; Liang, Y.; Qian, Q.; Yang, C. Proteomic dissection of the rice-Fusarium fujikuroi interaction and the correlation between the proteome and transcriptome under disease stress. BMC Genom. 2019, 20, 1–11. [Google Scholar] [CrossRef] [PubMed]
- Wang, Y.; Kim, S.G.; Wu, J.; Huh, H.H.; Lee, S.J.; Rakwal, R.; Kumar Agrawal, G.; Park, Z.Y.; Young Kang, K.; Kim, S.T. Secretome analysis of the rice bacterium Xanthomonas oryzae (Xoo) using in vitro and in planta systems. Proteomics 2013, 13, 1901–1912. [Google Scholar] [CrossRef] [PubMed]
- Hao, P.; Zhu, J.; Gu, A.; Lv, D.; Ge, P.; Chen, G.; Li, X.; Yan, Y. An integrative proteome analysis of different seedling organs in tolerant and sensitive wheat cultivars under drought stress and recovery. Proteomics 2015, 15, 1544–1563. [Google Scholar] [CrossRef]
- Kacem, N.; Mauro, S.; Muhovski, Y.; Delporte, F.; Renaut, J.; Djekoun, A.; Watillon, B. Diagonal two-dimensional electrophoresis (D-2DE): A new approach to study the effect of osmotic stress induced by polyethylene glycol in durum wheat (Triticum durum Desf.). Mol. Biol. Rep. 2016, 43, 897–909. [Google Scholar] [CrossRef]
- Maytalman, D.; Mert, Z.; Baykal, A.; Inan, C.; Gunel, A.; Hasançebi, S. Proteomic analysis of early responsive resistance proteins of wheat (Triticum aestivum) to yellow rust (Puccinia striiformis f. sp. tritici) using ProteomeLab PF2D. Plant Omics 2013, 6, 24–35. [Google Scholar]
- Day, J.; Gietz, R.D.; Rampitsch, C. Proteome changes induced by Pyrenophora tritici-repentis ToxA in both insensitive and sensitive wheat indicate senescence-like signaling. Proteome Sci. 2015, 13, 1–10. [Google Scholar] [CrossRef] [PubMed] [Green Version]
- Cui, D.; Wu, D.; Liu, J.; Li, D.; Xu, C.; Li, S.; Li, P.; Zhang, H.; Liu, X.; Jiang, C. Proteomic analysis of seedling roots of two maize inbred lines that differ significantly in the salt stress response. PLoS ONE 2015, 10, e0116697. [Google Scholar] [CrossRef] [PubMed]
- Li, G.; Gao, J.; Peng, H.; Shen, Y.; Ding, H.; Zhang, Z.; Pan, G.; Lin, H. Proteomic changes in maize as a response to heavy metal (lead) stress revealed by iTRAQ quantitative proteomics. Genet. Mol. Res. 2016, 15, 1–14. [Google Scholar] [CrossRef]
- Mohammadi, M.; Anoop, V.; Gleddie, S.; Harris, L.J. Proteomic profiling of two maize inbreds during early gibberella ear rot infection. Proteomics 2011, 11, 3675–3684. [Google Scholar] [CrossRef]
- Yue, R.; Lu, C.; Han, X.; Guo, S.; Yan, S.; Liu, L.; Fu, X.; Chen, N.; Guo, X.; Chi, H. Comparative proteomic analysis of maize (Zea mays L.) seedlings under rice black-streaked dwarf virus infection. BMC Plant Biol. 2018, 18, 1–11. [Google Scholar] [CrossRef] [PubMed] [Green Version]
- Ashoub, A.; Baeumlisberger, M.; Neupaertl, M.; Karas, M.; Brüggemann, W. Characterization of common and distinctive adjustments of wild barley leaf proteome under drought acclimation, heat stress and their combination. Plant Mol. Biol. 2015, 87, 459–471. [Google Scholar] [CrossRef] [PubMed]
- Mostek, A.; Börner, A.; Weidner, S. Comparative proteomic analysis of β-aminobutyric acid-mediated alleviation of salt stress in barley. Plant Physiol. Biochem. 2016, 99, 150–161. [Google Scholar] [CrossRef]
- Bernardo, L.; Prinsi, B.; Negri, A.S.; Cattivelli, L.; Espen, L.; Valè, G. Proteomic characterization of the Rph15 barley resistance gene-mediated defence responses to leaf rust. BMC Genom. 2012, 13, 642. [Google Scholar] [CrossRef] [PubMed] [Green Version]
- Eggert, K.; Pawelzik, E. Proteome analysis of Fusarium head blight in grains of naked barley (Hordeum vulgare subsp. nudum). Proteomics 2011, 11, 972–985. [Google Scholar] [CrossRef]
- Pennington, H.G.; Gheorghe, D.M.; Damerum, A.; Pliego, C.; Spanu, P.D.; Cramer, R.; Bindschedler, L.V. Interactions between the powdery mildew effector BEC1054 and barley proteins identify candidate host targets. J. Proteome Res. 2016, 15, 826–839. [Google Scholar] [CrossRef] [PubMed] [Green Version]
- Roy, S.K.; Cho, S.-W.; Kwon, S.J.; Kamal, A.H.M.; Kim, S.-W.; Oh, M.-W.; Lee, M.-S.; Chung, K.-Y.; Xin, Z.; Woo, S.-H. Morpho-physiological and proteome level responses to cadmium stress in sorghum. PLoS ONE 2016, 11, e0150431. [Google Scholar]
- Jedmowski, C.; Ashoub, A.; Beckhaus, T.; Berberich, T.; Karas, M.; Brüggemann, W. Comparative analysis of Sorghum bicolor proteome in response to drought stress and following recovery. Int. J. Proteom. 2014, 395095. [Google Scholar] [CrossRef] [Green Version]
- Jadhav, K.; Ranjani, R.V.; Senthil, N.; Arulkumar, N.; Tamilarasi, P.; Sumathi, K.; Ganesan, K.; Paranidharan, V.; Raveendran, M.; Kim, G.S. Proteomic analysis of a compatible interaction between sorghum downy mildew pathogen (Peronosclerospora sorghi) and maize (Zea mays L.). Int. J. Curr. Microbiol. Appl. Sci. 2018, 7, 653–670. [Google Scholar] [CrossRef]
- Wiśniewski, J.R. Mass spectrometry–based proteomics: Principles, perspectives, and challenges. Arch. Pathol. Lab. Med. 2008, 132, 1566–1569. [Google Scholar] [CrossRef]
- Marshall, J.; Kupchak, P.; Zhu, W.; Yantha, J.; Vrees, T.; Furesz, S.; Jacks, K.; Smith, C.; Kireeva, I.; Zhang, R. Processing of serum proteins underlies the mass spectral fingerprinting of myocardial infarction. J. Proteome Res. 2003, 2, 361–372. [Google Scholar] [CrossRef] [PubMed]
- Farrokhi, N.; Whitelegge, J.P.; Brusslan, J.A. Plant peptides and peptidomics. Plant Biotechnol. J. 2008, 6, 105–134. [Google Scholar] [CrossRef] [PubMed]
- Nakagami, H.; Sugiyama, N.; Ishihama, Y.; Shirasu, K. Shotguns in the front line: Phosphoproteomics in plants. Plant Cell Physiol. 2012, 53, 118–124. [Google Scholar] [CrossRef] [PubMed] [Green Version]
- Navrot, N.; Finnie, C.; Svensson, B.; Hägglund, P. Plant redox proteomics. J. Proteom. 2011, 74, 1450–1462. [Google Scholar] [CrossRef]
- del Toro, N.; Reisinger, F.; Foster, J.M.; Contell, J.; Fabregat, A.; Safont, P.R.; Hermjakob, H.; Vizcaíno, J.A. PRIDE Proteomes: A condensed view of the plethora of public proteomics data available in the PRIDE repository. DILS 2014, 2014, 21–24. [Google Scholar]
- Kusebauch, U.; Deutsch, E.W.; Campbell, D.S.; Sun, Z.; Farrah, T.; Moritz, R.L. Using PeptideAtlas, SRMAtlas, and PASSEL: Comprehensive resources for discovery and targeted proteomics. Curr. Protoc. Bioinform. 2014, 46, 13.25.11–13.25.28. [Google Scholar] [CrossRef] [PubMed] [Green Version]
- Sun, Q.; Zybailov, B.; Majeran, W.; Friso, G.; Olinares, P.D.B.; Van Wijk, K.J. PPDB, the plant proteomics database at Cornell. Nucleic Acids Res. 2009, 37, D969–D974. [Google Scholar] [CrossRef] [PubMed]
- Joshi, H.J.; Christiansen, K.M.; Fitz, J.; Cao, J.; Lipzen, A.; Martin, J.; Smith-Moritz, A.M.; Pennacchio, L.A.; Schackwitz, W.S.; Weigel, D. 1001 Proteomes: A functional proteomics portal for the analysis of Arabidopsis thaliana accessions. Bioinformatics 2012, 28, 1303–1306. [Google Scholar] [CrossRef] [PubMed] [Green Version]
- Sapkota, A.; Liu, X.; Zhao, X.-M.; Cao, Y.; Liu, J.; Liu, Z.-P.; Chen, L. DIPOS: Database of interacting proteins in Oryza sativa. Mol. BioSyst. 2011, 7, 2615–2621. [Google Scholar] [CrossRef] [PubMed]
- Hirsch-Hoffmann, M.; Gruissem, W.; Baerenfaller, K. pep2pro: The high-throughput proteomics data processing, analysis, and visualization tool. Front. Plant Sci. 2012, 3, 1–5. [Google Scholar] [CrossRef] [PubMed] [Green Version]
- Braun, H.-P.; Senkler, M. Functional annotation of 2D protein maps: The GelMap portal. Front. Plant Sci. 2012, 3, 87. [Google Scholar]
- Fan, J.; Mohareb, F.; Jones, A.M.; Bessant, C. MRMaid: The SRM assay design tool for Arabidopsis and other species. Front. Plant Sci. 2012, 3, 164. [Google Scholar] [CrossRef] [PubMed] [Green Version]
- Farrah, T.; Deutsch, E.W.; Kreisberg, R.; Sun, Z.; Campbell, D.S.; Mendoza, L.; Kusebauch, U.; Brusniak, M.Y.; Hüttenhain, R.; Schiess, R. PASSEL: The Peptide Atlas SRM experiment library. Proteomics 2012, 12, 1170–1175. [Google Scholar] [CrossRef] [Green Version]
- Baslam, M.; Mitsui, T. Proteomic for quality: Mining the proteome as a strategy to elucidate the protein complex applied for quality improvement. In The Future of Rice Demand: Quality Beyond Productivity; Springer Nature: Cham, Switzerland, 2020; pp. 473–494. [Google Scholar]
- Deborde, C.; Moing, A.; Roch, L.; Jacob, D.; Rolin, D.; Giraudeau, P. Plant metabolism as studied by NMR spectroscopy. Prog. Nucl. Magn. Reson. Spectrosc. 2017, 102, 61–97. [Google Scholar]
- Khakimov, B.; Bak, S.; Engelsen, S.B. High-throughput cereal metabolomics: Current analytical technologies, challenges and perspectives. J. Cereal Sci. 2014, 59, 393–418. [Google Scholar]
- Balmer, D.; Flors, V.; Glauser, G.; Mauch-Mani, B. Metabolomics of cereals under biotic stress: Current knowledge and techniques. Front. Plant Sci. 2013, 4, 82. [Google Scholar] [CrossRef] [Green Version]
- Piasecka, A.; Kachlicki, P.; Stobiecki, M. Analytical methods for detection of plant metabolomes changes in response to biotic and abiotic stresses. Int. J. Mol. Sci. 2019, 20, 379. [Google Scholar] [CrossRef] [Green Version]
- Wen, W.; Li, D.; Li, X.; Gao, Y.; Li, W.; Li, H.; Liu, J.; Liu, H.; Chen, W.; Luo, J. Metabolome-based genome-wide association study of maize kernel leads to novel biochemical insights. Nat. Commun. 2014, 5, 1–10. [Google Scholar] [CrossRef] [Green Version]
- Ibarra-Estrada, E.; Soto-Hernández, R.M.; Palma-Tenango, M. Metabolomics as a Tool in Agriculture; Prasain, J.K., Ed.; InTechOpen: Rijeka, Croatia, 2016; pp. 148–168. [Google Scholar]
- Vuckovic, D. Current trends and challenges in sample preparation for global metabolomics using liquid chromatography–mass spectrometry. Anal. Bioanal. Chem. 2012, 403, 1523–1548. [Google Scholar] [CrossRef]
- Wu, X.; Li, N.; Li, H.; Tang, H. An optimized method for NMR-based plant seed metabolomic analysis with maximized polar metabolite extraction efficiency, signal-to-noise ratio, and chemical shift consistency. Analyst 2014, 139, 1769–1778. [Google Scholar] [CrossRef] [PubMed]
- Casartelli, A.; Riewe, D.; Hubberten, H.M.; Altmann, T.; Hoefgen, R.; Heuer, S. Exploring traditional aus-type rice for metabolites conferring drought tolerance. Rice 2018, 11, 1–16. [Google Scholar] [CrossRef] [PubMed] [Green Version]
- Cao, D.; Lutz, A.; Hill, C.B.; Callahan, D.L.; Roessner, U. A quantitative profiling method of phytohormones and other metabolites applied to barley roots subjected to salinity stress. Front. Plant Sci. 2017, 7, 2070. [Google Scholar] [CrossRef] [PubMed] [Green Version]
- Zhang, W.; Ramautar, R. CE-MS for metabolomics: Developments and applications in the period 2018–2020. Electrophoresis 2020, 42, 381–401. [Google Scholar] [CrossRef]
- Jones, O.A.; Maguire, M.L.; Griffin, J.L.; Jung, Y.-H.; Shibato, J.; Rakwal, R.; Agrawal, G.K.; Jwa, N.-S. Using metabolic profiling to assess plant-pathogen interactions: An example using rice (Oryza sativa) and the blast pathogen Magnaporthe grisea. Eur. J. Plant Pathol. 2011, 129, 539–554. [Google Scholar] [CrossRef]
- Witt, S.; Galicia, L.; Lisec, J.; Cairns, J.; Tiessen, A.; Araus, J.L.; Palacios-Rojas, N.; Fernie, A.R. Metabolic and phenotypic responses of greenhouse-grown maize hybrids to experimentally controlled drought stress. Mol. Plant 2012, 5, 401–417. [Google Scholar] [CrossRef] [Green Version]
- Zhao, Y.-Y.; Wu, S.-P.; Liu, S.; Zhang, Y.; Lin, R.-C. Ultra-performance liquid chromatography–mass spectrometry as a sensitive and powerful technology in lipidomic applications. Chem. Biol. Interact. 2014, 220, 181–192. [Google Scholar] [CrossRef]
- Suharti, W.S.; Nose, A.; Zheng, S.-H. Metabolomic study of two rice lines infected by Rhizoctonia solani in negative ion mode by CE/TOF-MS. J. Plant Physiol. 2016, 206, 13–24. [Google Scholar] [CrossRef] [PubMed]
- Karre, S.; Kumar, A.; Dhokane, D.; Kushalappa, A.C. Metabolo-transcriptome profiling of barley reveals induction of chitin elicitor receptor kinase gene (HvCERK1) conferring resistance against Fusarium graminearum. Plant Mol. Biol. 2017, 93, 247–267. [Google Scholar] [CrossRef]
- Benincasa, P.; D’Amato, R.; Falcinelli, B.; Troni, E.; Fontanella, M.C.; Frusciante, S.; Guiducci, M.; Beone, G.M.; Businelli, D.; Diretto, G. Grain endogenous selenium and moderate salt stress work as synergic elicitors in the enrichment of bioactive compounds in maize sprouts. Agronomy 2020, 10, 735. [Google Scholar] [CrossRef]
- Chun, H.; Keleş, S. Sparse partial least squares regression for simultaneous dimension reduction and variable selection. J. R. Stat. Soc. Ser. B (Stat. Methodol.) 2010, 72, 3–25. [Google Scholar] [CrossRef] [PubMed] [Green Version]
- Xu, Y.; Goodacre, R. Multiblock principal component analysis: An efficient tool for analyzing metabolomics data which contain two influential factors. Metabolomics 2012, 8, 37–51. [Google Scholar] [CrossRef]
- Afendi, F.M.; Okada, T.; Yamazaki, M.; Hirai-Morita, A.; Nakamura, Y.; Nakamura, K.; Ikeda, S.; Takahashi, H.; Altaf-Ul-Amin, M.; Darusman, L.K. KNApSAcK family databases: Integrated metabolite–plant species databases for multifaceted plant research. Plant Cell Physiol. 2012, 53, e1. [Google Scholar] [CrossRef] [Green Version]
- Kanehisa, M. KEGG bioinformatics resource for plant genomics and metabolomics. In Plant Bioinformatics; Springer: Berlin/Heidelberg, Germany, 2016; pp. 55–70. [Google Scholar]
- Pavli, O.I.; Vlachos, C.E.; Kalloniati, C.; Flemetakis, E.; Skaracis, G.N. Metabolite profiling reveals the effect of drought on sorghum (‘Sorghum bicolor’ L. Moench) metabolism. Plant Omics 2013, 6, 371–376. [Google Scholar]
- Matsuda, F.; Okazaki, Y.; Oikawa, A.; Kusano, M.; Nakabayashi, R.; Kikuchi, J.; Yonemaru, J.I.; Ebana, K.; Yano, M.; Saito, K. Dissection of genotype–phenotype associations in rice grains using metabolome quantitative trait loci analysis. Plant J. 2012, 70, 624–636. [Google Scholar] [CrossRef]
- Chen, W.; Gao, Y.; Xie, W.; Gong, L.; Lu, K.; Wang, W.; Li, Y.; Liu, X.; Zhang, H.; Dong, H. Genome-wide association analyses provide genetic and biochemical insights into natural variation in rice metabolism. Nat. Genet. 2014, 46, 714–721. [Google Scholar] [CrossRef]
- Barding Jr, G.A.; Fukao, T.; Béni, S.; Bailey-Serres, J.; Larive, C.K. Differential metabolic regulation governed by the rice SUB1A gene during submergence stress and identification of alanylglycine by 1H NMR spectroscopy. J. Proteome Res. 2012, 11, 320–330. [Google Scholar] [CrossRef]
- Yang, M.; Yang, J.; Su, L.; Sun, K.; Li, D.; Liu, Y.; Wang, H.; Chen, Z.; Guo, T. Metabolic profile analysis and identification of key metabolites during rice seed germination under low-temperature stress. Plant Sci. 2019, 289, 110282. [Google Scholar] [CrossRef]
- Zhang, Y.; Ma, X.-M.; Wang, X.-C.; Liu, J.-H.; Huang, B.-Y.; Guo, X.-Y.; Xiong, S.-P.; La, G.-X. UPLC-QTOF analysis reveals metabolomic changes in the flag leaf of wheat (Triticum aestivum L.) under low-nitrogen stress. Plant Physiol. Biochem. 2017, 111, 30–38. [Google Scholar] [CrossRef]
- Gavaghan, C.L.; Li, J.V.; Hadfield, S.T.; Hole, S.; Nicholson, J.K.; Wilson, I.D.; Howe, P.W.; Stanley, P.D.; Holmes, E. Application of NMR-based metabolomics to the investigation of salt stress in maize (Zea mays). Phytochem. Anal. 2011, 22, 214–224. [Google Scholar] [CrossRef]
- Amiour, N.; Imbaud, S.; Clément, G.; Agier, N.; Zivy, M.; Valot, B.; Balliau, T.; Armengaud, P.; Quilleré, I.; Cañas, R. The use of metabolomics integrated with transcriptomic and proteomic studies for identifying key steps involved in the control of nitrogen metabolism in crops such as maize. J. Exp. Bot. 2012, 63, 5017–5033. [Google Scholar] [CrossRef] [Green Version]
- Swarcewicz, B.; Sawikowska, A.; Marczak, Ł.; Łuczak, M.; Ciesiołka, D.; Krystkowiak, K.; Kuczyńska, A.; Piślewska-Bednarek, M.; Krajewski, P.; Stobiecki, M. Effect of drought stress on metabolite contents in barley recombinant inbred line population revealed by untargeted GC–MS profiling. Acta Physiol. Plant. 2017, 39, 1–16. [Google Scholar] [CrossRef]
- Sheflin, A.M.; Chiniquy, D.; Yuan, C.; Goren, E.; Kumar, I.; Braud, M.; Brutnell, T.; Eveland, A.L.; Tringe, S.; Liu, P. Metabolomics of sorghum roots during nitrogen stress reveals compromised metabolic capacity for salicylic acid biosynthesis. Plant Direct 2019, 3, e00122. [Google Scholar] [CrossRef] [PubMed] [Green Version]
- Vincent, D.; Du Fall, L.A.; Livk, A.; Mathesius, U.; Lipscombe, R.J.; Oliver, R.P.; Friesen, T.L.; Solomon, P.S. A functional genomics approach to dissect the mode of action of the Stagonospora nodorum effector protein SnToxA in wheat. Mol. Plant Pathol. 2012, 13, 467–482. [Google Scholar] [CrossRef] [PubMed]
- Ciasca, B.; Lanubile, A.; Marocco, A.; Pascale, M.; Logrieco, A.F.; Lattanzio, V.M. Application of an integrated and open source workflow for LC-HRMS plant metabolomics studies. Case-control study: Metabolic changes of maize in response to Fusarium verticillioides infection. Front. Plant Sci. 2020, 11, 664. [Google Scholar] [CrossRef]
- Misra, B.B.; Assmann, S.M.; Chen, S. Plant single-cell and single-cell-type metabolomics. Trends Plant Sci. 2014, 19, 637–646. [Google Scholar] [CrossRef]
- Sun, M.; Yang, Z.; Wawrik, B. Metabolomic fingerprints of individual algal cells using the single-probe mass spectrometry technique. Front. Plant Sci. 2018, 9, 571. [Google Scholar] [CrossRef]
- Anderegg, J.; Hund, A.; Karisto, P.; Mikaberidze, A. In-field detection and quantification of Septoria tritici blotch in diverse wheat germplasm using spectral–temporal features. Front. Plant Sci. 2019, 10, 1355. [Google Scholar] [CrossRef] [Green Version]
- White, J.W.; Conley, M.M. A flexible, low-cost cart for proximal sensing. Crop Sci. 2013, 53, 1646–1649. [Google Scholar] [CrossRef] [Green Version]
- Sirault, X.R.; James, R.A.; Furbank, R.T. A new screening method for osmotic component of salinity tolerance in cereals using infrared thermography. Funct. Plant Biol. 2009, 36, 970–977. [Google Scholar] [CrossRef] [PubMed]
- Crain, J.; Mondal, S.; Rutkoski, J.; Singh, R.P.; Poland, J. Combining high-throughput phenotyping and genomic information to increase prediction and selection accuracy in wheat breeding. Plant Genome 2018, 11, 170043. [Google Scholar] [CrossRef] [PubMed] [Green Version]
- Voorend, W.; Lootens, P.; Nelissen, H.; Roldán-Ruiz, I.; Inzé, D.; Muylle, H. LEAF-E: A tool to analyze grass leaf growth using function fitting. Plant Methods 2014, 10, 1–13. [Google Scholar] [CrossRef] [PubMed] [Green Version]
- Singh, A.; Ganapathysubramanian, B.; Singh, A.K.; Sarkar, S. Machine learning for high-throughput stress phenotyping in plants. Trends Plant Sci. 2016, 21, 110–124. [Google Scholar] [CrossRef] [PubMed] [Green Version]
- Sandhu, K.S.; Mihalyov, P.D.; Lewiwn, M.J.; Pumphre, y.M.O.; Carter, A.H. Combining genomic and phenomic information for predicting grain protein content and grain yield in spring wheat. Front. Plant Sci. 2021, 12, 170. [Google Scholar] [CrossRef] [PubMed]
- Duan, L.; Han, J.; Guo, Z.; Tu, H.; Yang, P.; Zhang, D.; Fan, Y.; Chen, G.; Xiong, L.; Dai, M. Novel digital features discriminate between drought resistant and drought sensitive rice under controlled and field conditions. Front. Plant Sci. 2018, 9, 492. [Google Scholar] [CrossRef] [Green Version]
- Busemeyer, L.; Mentrup, D.; Möller, K.; Wunder, E.; Alheit, K.; Hahn, V.; Maurer, H.P.; Reif, J.C.; Würschum, T.; Müller, J. BreedVision—A multi-sensor platform for non-destructive field-based phenotyping in plant breeding. Sensors 2013, 13, 2830–2847. [Google Scholar] [CrossRef] [PubMed]
- Jansen, M.; Gilmer, F.; Biskup, B.; Nagel, K.A.; Rascher, U.; Fischbach, A.; Briem, S.; Dreissen, G.; Tittmann, S.; Braun, S. Simultaneous phenotyping of leaf growth and chlorophyll fluorescence via GROWSCREEN FLUORO allows detection of stress tolerance in Arabidopsis thaliana and other rosette plants. Funct. Plant Biol. 2009, 36, 902–914. [Google Scholar] [CrossRef]
- Fanourakis, D.; Briese, C.; Max, J.F.; Kleinen, S.; Putz, A.; Fiorani, F.; Ulbrich, A.; Schurr, U. Rapid determination of leaf area and plant height by using light curtain arrays in four species with contrasting shoot architecture. Plant Methods 2014, 10, 1–11. [Google Scholar] [CrossRef] [PubMed] [Green Version]
- Granier, C.; Aguirrezabal, L.; Chenu, K.; Cookson, S.J.; Dauzat, M.; Hamard, P.; Thioux, J.J.; Rolland, G.; Bouchier-Combaud, S.; Lebaudy, A. PHENOPSIS, an automated platform for reproducible phenotyping of plant responses to soil water deficit in Arabidopsis thaliana permitted the identification of an accession with low sensitivity to soil water deficit. New Phytol. 2006, 169, 623–635. [Google Scholar] [CrossRef]
- Rousseau, C.; Hunault, G.; Gaillard, S.; Bourbeillon, J.; Montiel, G.; Simier, P.; Campion, C.; Jacques, M.-A.; Belin, E.; Boureau, T. Phenoplant: A web resource for the exploration of large chlorophyll fluorescence image datasets. Plant Methods 2015, 11, 1–12. [Google Scholar] [CrossRef] [PubMed]
- Flood, P.J.; Kruijer, W.; Schnabel, S.K.; van der Schoor, R.; Jalink, H.; Snel, J.F.; Harbinson, J.; Aarts, M.G. Phenomics for photosynthesis, growth and reflectance in Arabidopsis thaliana reveals circadian and long-term fluctuations in heritability. Plant Methods 2016, 12, 1–14. [Google Scholar] [CrossRef] [Green Version]
- Friedli, M.; Kirchgessner, N.; Grieder, C.; Liebisch, F.; Mannale, M.; Walter, A. Terrestrial 3D laser scanning to track the increase in canopy height of both monocot and dicot crop species under field conditions. Plant Methods 2016, 12, 1–15. [Google Scholar] [CrossRef] [Green Version]
- Greenham, K.; Lou, P.; Remsen, S.E.; Farid, H.; McClung, C.R. TRiP: Tracking Rhythms in Plants, an automated leaf movement analysis program for circadian period estimation. Plant Methods 2015, 11, 1–11. [Google Scholar] [CrossRef] [PubMed] [Green Version]
- Zaman-Allah, M.; Vergara, O.; Araus, J.; Tarekegne, A.; Magorokosho, C.; Zarco-Tejada, P.; Hornero, A.; Albà, A.H.; Das, B.; Craufurd, P. Unmanned aerial platform-based multi-spectral imaging for field phenotyping of maize. Plant Methods 2015, 11, 1–10. [Google Scholar] [CrossRef] [Green Version]
- Zhang, C.; Craine, W.A.; McGee, R.J.; Vandemark, G.J.; Davis, J.B.; Brown, J.; Hulbert, S.H.; Sankaran, S. Image-based phenotyping of flowering intensity in cool-season crops. Sensors 2020, 20, 1450. [Google Scholar] [CrossRef] [Green Version]
- Zhang, C.; McGee, R.J.; Vandemark, G.; Sankaran, S. Crop performance evaluation of chickpea and dry pea breeding lines across seasons and locations using phenomics data. Front. Plant Sci. 2021, 12, 61. [Google Scholar]
- Becker, E.; Schmidhalter, U. Evaluation of yield and drought using active and passive spectral sensing systems at the reproductive stage in wheat. Front. Plant Sci. 2017, 8, 379. [Google Scholar] [CrossRef] [PubMed] [Green Version]
- Behmann, J.; Schmitter, P.; Steinrücken, J.; Plümer, L. Ordinal classification for efficient plant stress prediction in hyperspectral data. Int. Arch. Photogramm. Remote Sens. Spat. Inf. Sci. 2014, XL-7, 29–36. [Google Scholar] [CrossRef] [Green Version]
- Onoyama, H.; Ryu, C.; Suguri, M.; Iida, M. Potential of hyperspectral imaging for constructing a year-invariant model to estimate the nitrogen content of rice plants at the panicle initiation stage. IFAC Proc. Vol. 2013, 46, 219–224. [Google Scholar] [CrossRef]
- Gerhards, M.; Rock, G.; Schlerf, M.; Udelhoven, T. Water stress detection in potato plants using leaf temperature, emissivity, and reflectance. Int. J. Appl. Earth Obs. Geoinf. 2016, 53, 27–39. [Google Scholar] [CrossRef]
- Deery, D.M.; Rebetzke, G.J.; Jimenez-Berni, J.A.; James, R.A.; Condon, A.G.; Bovill, W.D.; Hutchinson, P.; Scarrow, J.; Davy, R.; Furbank, R.T. Methodology for high-throughput field phenotyping of canopy temperature using airborne thermography. Front. Plant Sci. 2016, 7, 1808. [Google Scholar] [CrossRef] [Green Version]
- Yao, H.; Hruska, Z.; Kincaid, R.; Brown, R.L.; Bhatnagar, D.; Cleveland, T.E. Detecting maize inoculated with toxigenic and atoxigenic fungal strains with fluorescence hyperspectral imagery. Biosyst. Eng. 2013, 115, 125–135. [Google Scholar] [CrossRef]
- Al-Tamimi, N.; Brien, C.; Oakey, H.; Berger, B.; Saade, S.; Ho, Y.S.; Schmöckel, S.M.; Tester, M.; Negrão, S. Salinity tolerance loci revealed in rice using high-throughput non-invasive phenotyping. Nat. Commun. 2016, 7, 1–11. [Google Scholar] [CrossRef] [Green Version]
- Sankaran, S.; Mishra, A.; Ehsani, R.; Davis, C. A review of advanced techniques for detecting plant diseases. Comput. Electron. Agric. 2010, 72, 1–13. [Google Scholar] [CrossRef]
- Araus Ortega, J.L.; Kefauver, S.C.; Zaman Allah, M.; Olsen, M.S.; Cairns, J.E. Translating high throughput phenotyping into genetic gain. Trends Plant Sci. 2018, 23, 451–466. [Google Scholar] [CrossRef] [Green Version]
- Vigneau, N.; Ecarnot, M.; Rabatel, G.; Roumet, P. Potential of field hyperspectral imaging as a non destructive method to assess leaf nitrogen content in wheat. Field Crop. Res. 2011, 122, 25–31. [Google Scholar] [CrossRef] [Green Version]
- Behmann, J.; Steinrücken, J.; Plümer, L. Detection of early plant stress responses in hyperspectral images. ISPRS J. Photogramm. Remote Sens. 2014, 93, 98–111. [Google Scholar] [CrossRef]
- Zhang, L.; Zhang, H.; Niu, Y.; Han, W. Mapping maize water stress based on UAV multispectral remote sensing. Remote Sens. 2019, 11, 605. [Google Scholar] [CrossRef] [Green Version]
- Guerrero, J.M.; Pajares, G.; Montalvo, M.; Romeo, J.; Guijarro, M. Support vector machines for crop/weeds identification in maize fields. Expert Syst. Appl. 2012, 39, 11149–11155. [Google Scholar] [CrossRef]
- Kefauver, S.C.; Vicente, R.; Vergara-Díaz, O.; Fernandez-Gallego, J.A.; Kerfal, S.; Lopez, A.; Melichar, J.P.; Serret Molins, M.D.; Araus, J.L. Comparative UAV and field phenotyping to assess yield and nitrogen use efficiency in hybrid and conventional barley. Front. Plant Sci. 2017, 8, 1733. [Google Scholar] [CrossRef]
- Wang, X.; Singh, D.; Marla, S.; Morris, G.; Poland, J. Field-based high-throughput phenotyping of plant height in sorghum using different sensing technologies. Plant Methods 2018, 14, 1–16. [Google Scholar] [CrossRef] [PubMed]
- Spindel, J.E.; Dahlberg, J.; Colgan, M.; Hollingsworth, J.; Sievert, J.; Staggenborg, S.H.; Hutmacher, R.; Jansson, C.; Vogel, J.P. Association mapping by aerial drone reveals 213 genetic associations for Sorghum bicolor biomass traits under drought. BMC Genom. 2018, 19, 679. [Google Scholar] [CrossRef] [PubMed]
- Kobayashi, T.; Kanda, E.; Kitada, K.; Ishiguro, K.; Torigoe, Y. Detection of rice panicle blast with multispectral radiometer and the potential of using airborne multispectral scanners. Phytopathology 2001, 91, 316–323. [Google Scholar] [CrossRef] [Green Version]
- Sirisomboon, C.D.; Putthang, R.; Sirisomboon, P. Application of near infrared spectroscopy to detect aflatoxigenic fungal contamination in rice. Food Control 2013, 33, 207–214. [Google Scholar] [CrossRef]
- Zhang, D.; Zhou, X.; Zhang, J.; Lan, Y.; Xu, C.; Liang, D. Detection of rice sheath blight using an unmanned aerial system with high-resolution color and multispectral imaging. PLoS ONE 2018, 13, e0187470. [Google Scholar] [CrossRef] [PubMed] [Green Version]
- Shahin, M.A.; Symons, S.J. Detection of Fusarium damaged kernels in Canada Western Red Spring wheat using visible/near-infrared hyperspectral imaging and principal component analysis. Comput. Electron. Agric. 2011, 75, 107–112. [Google Scholar] [CrossRef]
- Zhang, X.; Han, L.; Dong, Y.; Shi, Y.; Huang, W.; Han, L.; González-Moreno, P.; Ma, H.; Ye, H.; Sobeih, T. A deep learning-based approach for automated yellow rust disease detection from high-resolution hyperspectral UAV images. Remote Sens. 2019, 11, 1554. [Google Scholar] [CrossRef] [Green Version]
- DeChant, C.; Wiesner-Hanks, T.; Chen, S.; Stewart, E.L.; Yosinski, J.; Gore, M.A.; Nelson, R.J.; Lipson, H. Automated identification of northern leaf blight-infected maize plants from field imagery using deep learning. Phytopathology 2017, 107, 1426–1432. [Google Scholar] [CrossRef] [PubMed] [Green Version]
- Loladze, A.; Rodrigues, F.A., Jr.; Toledo, F.; San Vicente, F.; Gérard, B.; Boddupalli, M.P. Application of remote sensing for phenotyping tar spot complex resistance in maize. Front. Plant Sci. 2019, 10, 552. [Google Scholar] [CrossRef] [Green Version]
- Thomas, S.; Behmann, J.; Steier, A.; Kraska, T.; Muller, O.; Rascher, U.; Mahlein, A.-K. Quantitative assessment of disease severity and rating of barley cultivars based on hyperspectral imaging in a non-invasive, automated phenotyping platform. Plant Methods 2018, 14, 1–12. [Google Scholar] [CrossRef] [PubMed] [Green Version]
- Zhou, R.-Q.; Jin, J.-J.; Li, Q.-M.; Su, Z.-Z.; Yu, X.-J.; Tang, Y.; Luo, S.-M.; He, Y.; Li, X.-L. Early detection of Magnaporthe oryzae-infected barley leaves and lesion visualization based on hyperspectral imaging. Front. Plant Sci. 2019, 9, 1962. [Google Scholar] [CrossRef] [PubMed]
- Wahabzada, M.; Mahlein, A.-K.; Bauckhage, C.; Steiner, U.; Oerke, E.-C.; Kersting, K. Metro maps of plant disease dynamics—automated mining of differences using hyperspectral images. PLoS ONE 2015, 10, e0116902. [Google Scholar] [CrossRef]
- Sandhu, K.S.; Aoun, M.; Morris, C.F.; Carter, A.H. Genomic selection for end-use quality and processing traits in soft white winter wheat breeding program with machine and deep learning models. Biology 2021, 10, 689. [Google Scholar] [CrossRef] [PubMed]
- Sandhu, K.; Patil, S.S.; Pumphrey, M.; Carter, A. Multitrait machine- and deep-learning models for genomic selection using spectral information in a wheat breeding program. Plant Genome 2021, e20119. [Google Scholar]
- Sandhu, K.S.; Lozada, D.N.; Zhang, Z.; Pumphrey, M.O.; Carter, A.H. Deep learning for predicting complex traits in spring wheat breeding program. Front. Plant Sci. 2020, 11, 2084. [Google Scholar]


| Crop | Mapping Method | Trait or Gene Studied | Reference |
|---|---|---|---|
| Rice | GWLM and GWAS | Seed vigor | [29] |
| Rice | GWLM and GWAS | Bacterial blight-resistant gene, Xa43(t) | [30] |
| Rice | GWLM and GWAS | Grain shape and grain weight | [31] |
| Rice | GWAS | Plant architecture | [32] |
| Rice | GWAS | Salt tolerance, OsSTL1 and OsSTL2 | [33] |
| Wheat | GWLM | Plant height and yield | [34] |
| Wheat | GWLM | Grain shape and size | [35] |
| Wheat | GWLM | Reduced plant height gene, Rht24 | [36] |
| Wheat | GWAS | Floret fertility, assimilate partitioning, and spike morphology traits | [37] |
| Wheat | GWAS | Total spikelet number | [38] |
| Maize | GWLM | Resistance to northern leaf blight | [39] |
| Maize | GWLM and GWAS | Plant and ear height | [40] |
| Maize | GWLM and GWAS | Male inflorescence size | [41] |
| Maize | GWAS | Lipid biosynthesis | [42] |
| Maize | GWAS | Root morphology traits | [43] |
| Barley | GWLM | Plant height | [44] |
| Barley | GWLM | Awn length | [45] |
| Barley | GWAS | Photoperiod response | [46] |
| Barley | GWAS | Nitrogen use efficiency | [47] |
| Barley | GWAS | Spikelet number and grain yield | [48] |
| Sorghum | GWLM | Plant height, node number, panicle length, flag leaf length, and flag leaf width | [49] |
| Sorghum | GWLM and GWAS | Grain quality traits | [50] |
| Sorghum | GWAS | Plant architecture traits (e.g., tiller number, panicle length, seed number, internode length) | [51] |
| Sorghum | GWAS | Kernel composition | [52] |
| Sorghum | GWAS | Grain size | [53] |
| Platform | Read Length (in bps) | Chemical Reaction | Amplification Method | Read Pair | Overall Error Rate |
|---|---|---|---|---|---|
| 1st generation | |||||
| Sanger sequencing | 750 | Chain termination | PCR | Yes | — |
| 2nd generation | |||||
| 454 Roche | 400 | Pyrosequencing | Emulsion PCR | Yes | 0.5% |
| HiSeq Ilumina | 150–300 (paired end) | Reversible termination | Solid-phase PCR | Yes | 0.2% |
| SOLiD | 75 (single-end) or 50 (paired-end) | Sequencing by ligation | Emulsion PCR | Yes | 0.1% |
| Ion torrent | 200–400 | Proton detection | Emulsion PCR | Yes | 1% |
| 3rd generation | |||||
| PacBio | 25 kb (single-end) | Real-time sequencing | Real-time single- molecular template Hi-Fi | No | 0.1% |
| Oxford Nanopore | 30 kb | Disruption of ionic current flow through nanopores | Not required | No | 3% |
| Crop | Tissue | Biotic Stress | Reference |
|---|---|---|---|
| Rice | Leaves | Magnaporthe oryzae | [90] |
| Rice | Leaves | Xanthomonas oryzae pv. oryzae | [91] |
| Rice | Leaf sheath | Rhizoctonia solani | [92] |
| Wheat | Spikes | Fusarium graminearum | [89] |
| Wheat | Seedlings | Puccinia triticina | [93] |
| Wheat | Leaves | Puccinia striiformis f. sp. tritici | [94] |
| Maize | Leaves | Cercospora zeae-maydis; Cercospora zeina | [95] |
| Maize | Leaves | Fusarium graminearum | [96] |
| Maize | Leaves | Maize Iranian mosaic virus | [97] |
| Barley | Leaves | Ramularia coolo-cygni | [98] |
| Barley | Leaves | Blumeria graminis f. sp. hordei | [99] |
| Barley | Leaves | Rhynchosporium secalis; Cochliobolus sativus | [100] |
| Technique | Application | Advantages |
|---|---|---|
| 2D-PAGE | ● Protein separation ● Expression profiling | ● Information about post-translational modifications (PTM) ● Relatively quantitative |
| DIGE | ● Separation of proteins ● Quantitative expression profiling | ● Higher sensitivity as compared to 2D-PAGE ● Less gel-to-gel variability ● Multiplexing |
| 3D-GE | ● Protein separation ● Quantitative expression profiling | ● Overcome co-migration interferences ● High reproducibility |
| ICAT | ● Chemical isotope labelling for quantitative proteomics | ● High sensitivity and reproducibility ● Detects low abundant proteins |
| iTRAQ | ● Isobaric tagging of proteins | ● High reproducibility ● Multiplexing ● High throughput |
| SILAC | ● Isotopic labelling of cells ● Differential expression studies | ● Simple and straightforward quantitation ● Highly sensitive ● Robust ● Degree of labelling is high |
| MuDPIT | ● Identification of protein –protein interactions | ● Large protein complex identification |
| Crop | Abiotic/Biotic Stresses | Techniques | References |
|---|---|---|---|
| Rice | Drought | LC–MS/MS | [120] |
| Rice | Bakanae disease | TMT–MS | [121] |
| Rice | Bacterial blight | 2DE/MudPIT, MALDI–TOF/MS | [122] |
| Wheat | Drought | 2D-PAGE | [123] |
| Wheat | Drought | 2DE, MALDI–TOF–TOF–MS | [124] |
| Wheat | Yellow rust | nanoLC ESI–MS/MS | [125] |
| Wheat | Tan spot | 2D-PAGE | [126] |
| Maize | Salinization | iTRAQ, LC–MS/MS | [127] |
| Maize | Heavy metal | iTRAQ, LC–MS/MS | [128] |
| Maize | Ear rot disease | iTRAQ | [129] |
| Maize | Maize rough dwarf disease | LC–MS/MS, TMT labeling | [130] |
| Barley | Drought | DIGE and LTQ-Orbitrap | [131] |
| Barley | Salinization | 2D-PAGE | [132] |
| Barley | Leaf rust | LC–MS/MS | [133] |
| Barley | Fusarium head blight | 2D-PAGE, MS | [134] |
| Barley | Powdery mildew | LC–MS | [135] |
| Sorghum | Heavy metal toxicity | 2D-PAGE | [136] |
| Sorghum | Drought | DIGE | [137] |
| Sorghum | Downy mildew | 2D-PAGE, MLADI–TOF/MS | [138] |
| Technique | Description | Advantages |
|---|---|---|
| LC–MS | Allows profiling of secondary metabolites, such as alkaloids, flavonoids, and phenylpropanoids, based on their different partitioning coefficients between the mobile phase (solvent) and stationary phase (column) | ● Enables detection of metabolites without prior derivatization ● Useful for both reactive and thermally stable metabolites ● High sensitivity to ionized metabolites ● High mass accuracy allows the identification of unknown compounds ● A larger sample, such as 1–50 mL, can be used |
| CE–MS | Detect and separate polar or charged metabolites, such as inorganic ions, organic acids, amino acids, vitamins, nucleotides and nucleosides, thiols, carbohydrates, and peptides, based on their charge and size | ● Allow rapid analyses with higher resolution than in LC ● Allow separation of polar or charged metabolites, which are incompatible with LC and GC ● Can use heterogeneous samples ● Easy sample preparation than in GC and LC ● Low reagent use and low cost ● Less quantity of sample, up to 1 uL can be used |
| GC–MS | Allow the simultaneous separation and detection of many volatile, thermally stable compounds and primary metabolites, such as sugars, amino acids, organic acids, and polyamines in complex mixtures | ● High resolution ● High sensitivity to non-polar and volatile metabolites ● Lower cost than LC–MS |
| NMR | Record the absorption and re-emission energy of atom nuclei due to differences in an external magnetic field | ● Allow detection of unknown metabolites ● Less biased and lower experimental error than in MS-based methods ● Easy sample preparation than in MS methods ● Excellent compound coverage ● Less destructive sampling ● Highly utilized in untargeted metabolomics profiling |
| VS | Measures slight differences in vibrational behavior of organic functional groups and chemical bonding under electromagnetic (EM) radiation | ● Non-destructive method ● Minimal to no sample preparation ● Excellent compound coverage ● Untargeted metabolomic profiling with high accuracy ● High reproducibility |
Publisher’s Note: MDPI stays neutral with regard to jurisdictional claims in published maps and institutional affiliations. |
© 2021 by the authors. Licensee MDPI, Basel, Switzerland. This article is an open access article distributed under the terms and conditions of the Creative Commons Attribution (CC BY) license (https://creativecommons.org/licenses/by/4.0/).
Share and Cite
Kaur, B.; Sandhu, K.S.; Kamal, R.; Kaur, K.; Singh, J.; Röder, M.S.; Muqaddasi, Q.H. Omics for the Improvement of Abiotic, Biotic, and Agronomic Traits in Major Cereal Crops: Applications, Challenges, and Prospects. Plants 2021, 10, 1989. https://0-doi-org.brum.beds.ac.uk/10.3390/plants10101989
Kaur B, Sandhu KS, Kamal R, Kaur K, Singh J, Röder MS, Muqaddasi QH. Omics for the Improvement of Abiotic, Biotic, and Agronomic Traits in Major Cereal Crops: Applications, Challenges, and Prospects. Plants. 2021; 10(10):1989. https://0-doi-org.brum.beds.ac.uk/10.3390/plants10101989
Chicago/Turabian StyleKaur, Balwinder, Karansher S. Sandhu, Roop Kamal, Kawalpreet Kaur, Jagmohan Singh, Marion S. Röder, and Quddoos H. Muqaddasi. 2021. "Omics for the Improvement of Abiotic, Biotic, and Agronomic Traits in Major Cereal Crops: Applications, Challenges, and Prospects" Plants 10, no. 10: 1989. https://0-doi-org.brum.beds.ac.uk/10.3390/plants10101989