Finding the optimal solution that combines an adequate in-service behavior along with a cost-efficient result is very complex and requires a multiperspective analysis; since, for example, a large in-operation durability is required together with a short degradation time when the material ends its life cycle. Thus, different constraints (CS) to solve the conflicts between goal functions and selection criteria (SC) are established. Thermoplastics, thermosets and elastomers to be processed using AM are evaluated according to their in-service performance.
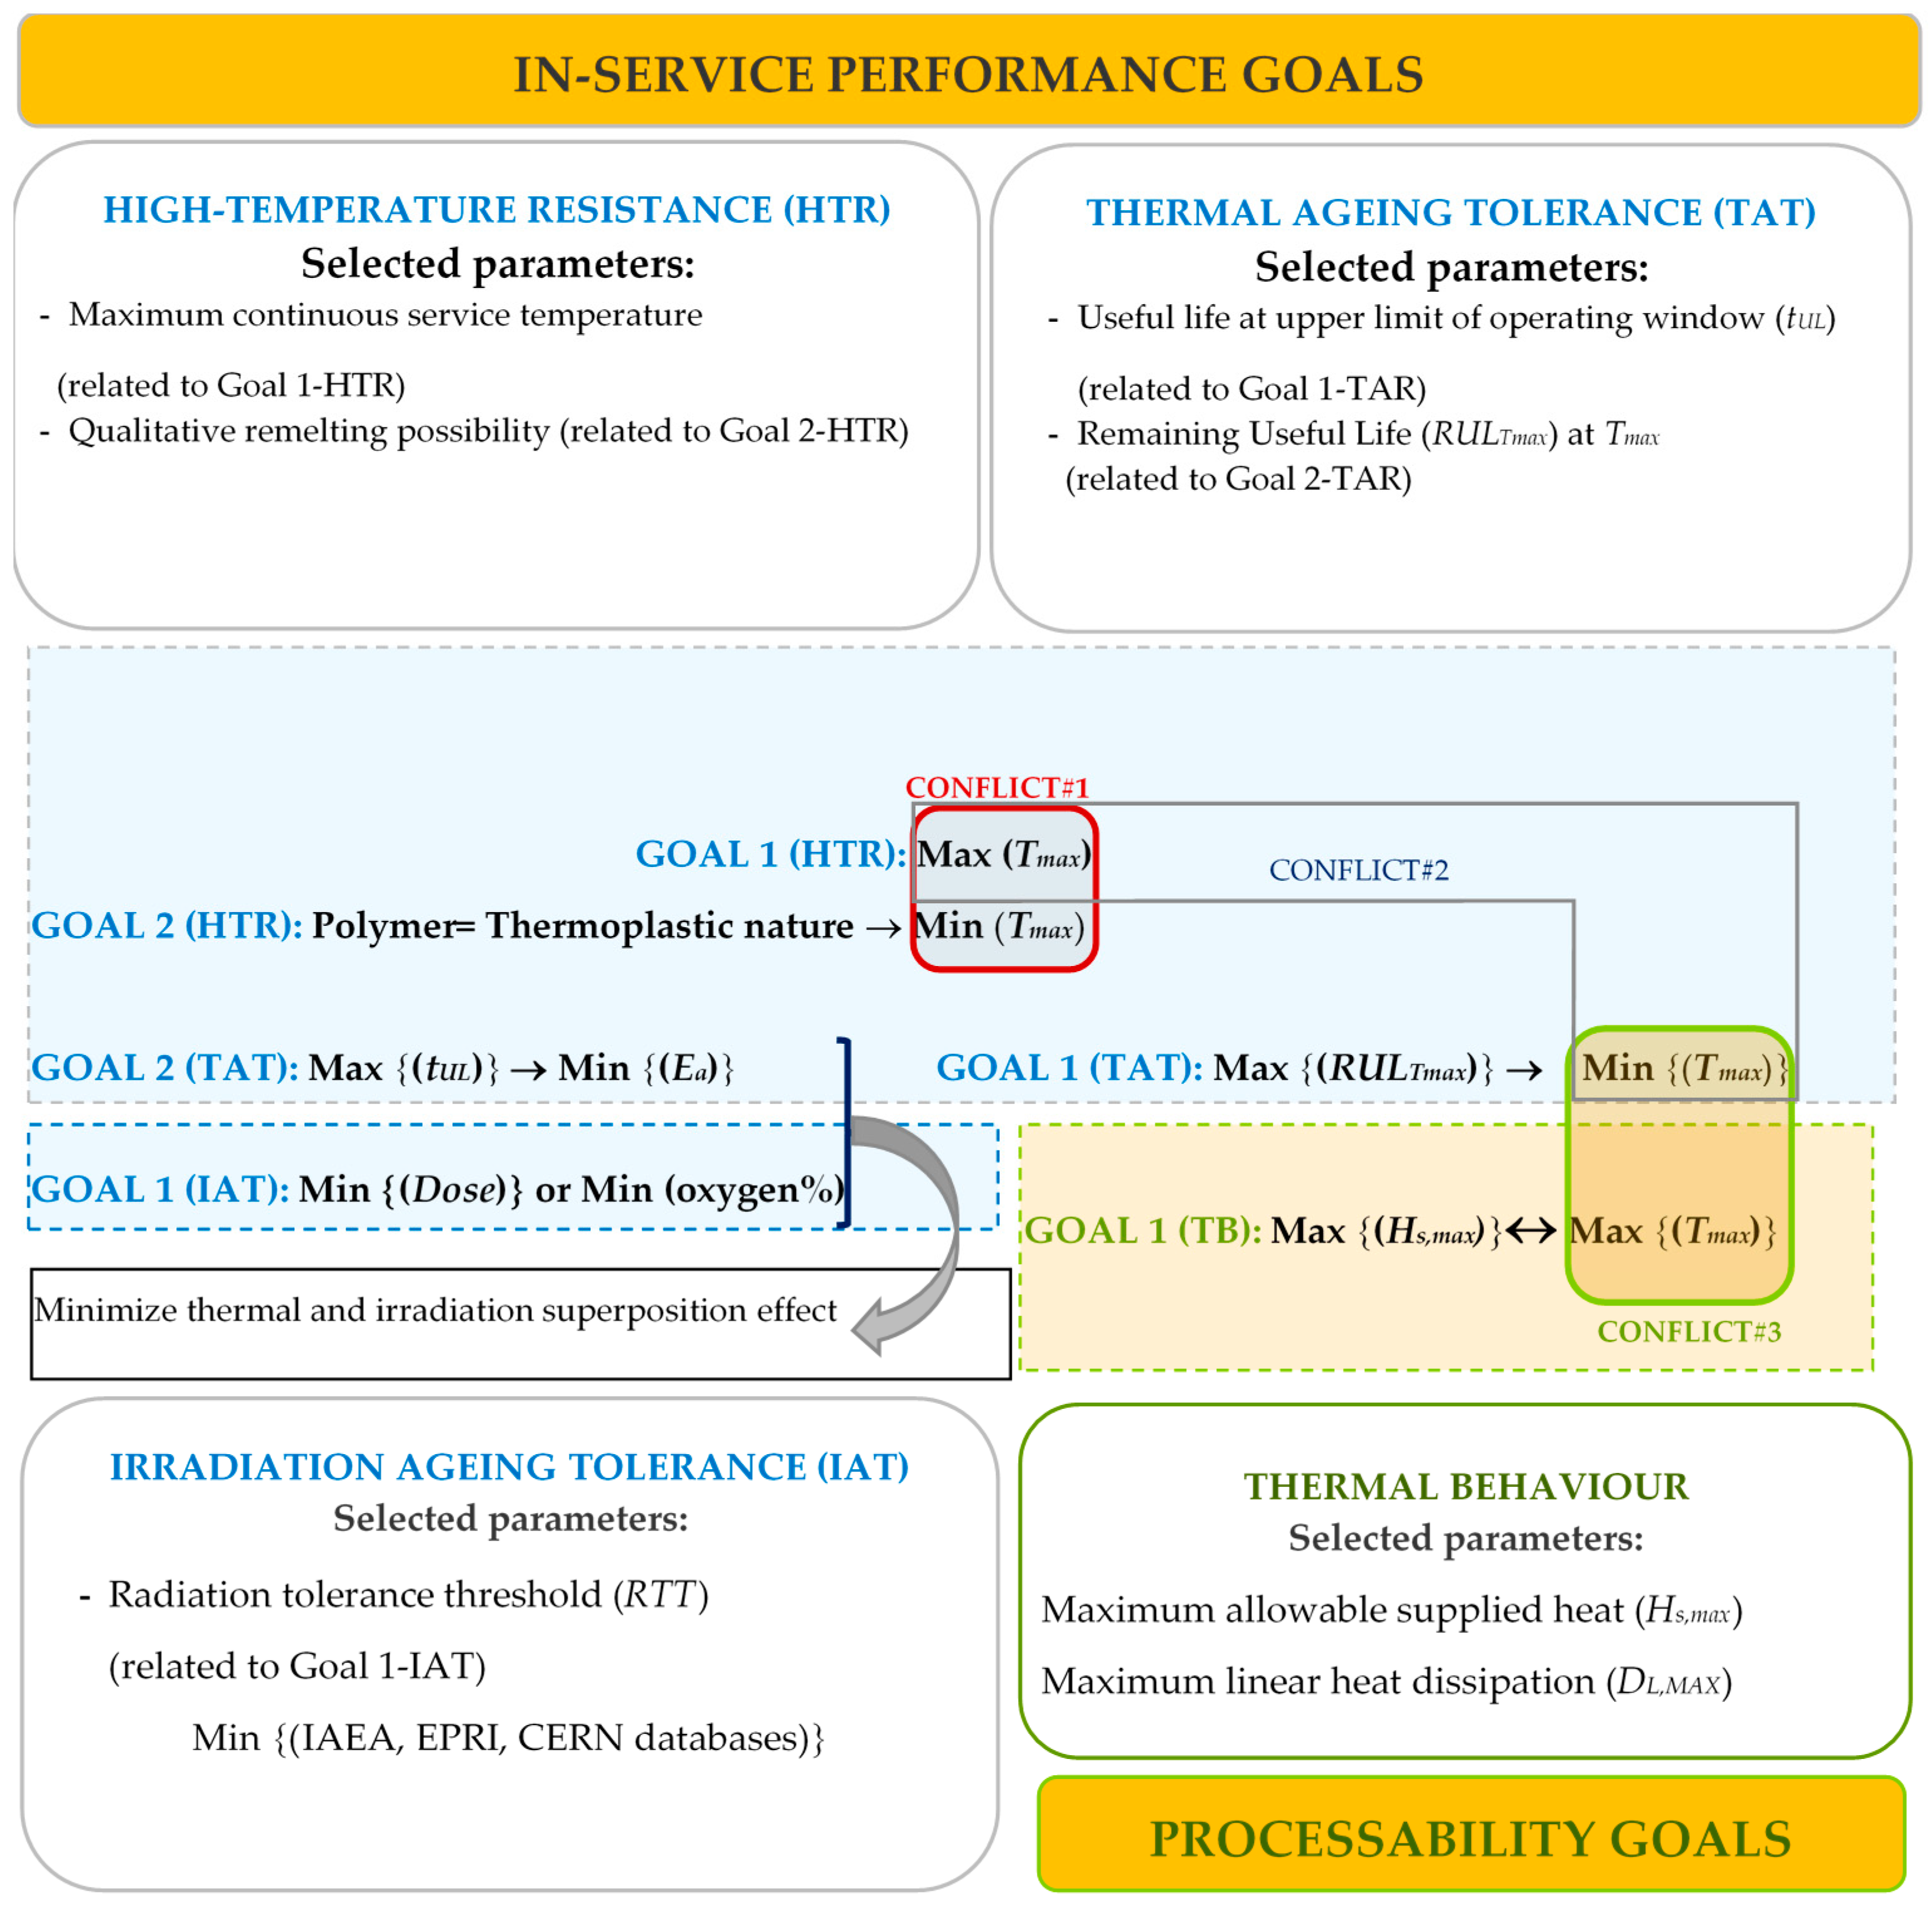
On the other hand, material processability (Stage B) analysis is centered on thermal conductivity and thermal diffusivity that allow us to calculate interesting parameters such as the maximum allowable supplied heat (Hs,max) and the maximum linear heat dissipation (DL,max).
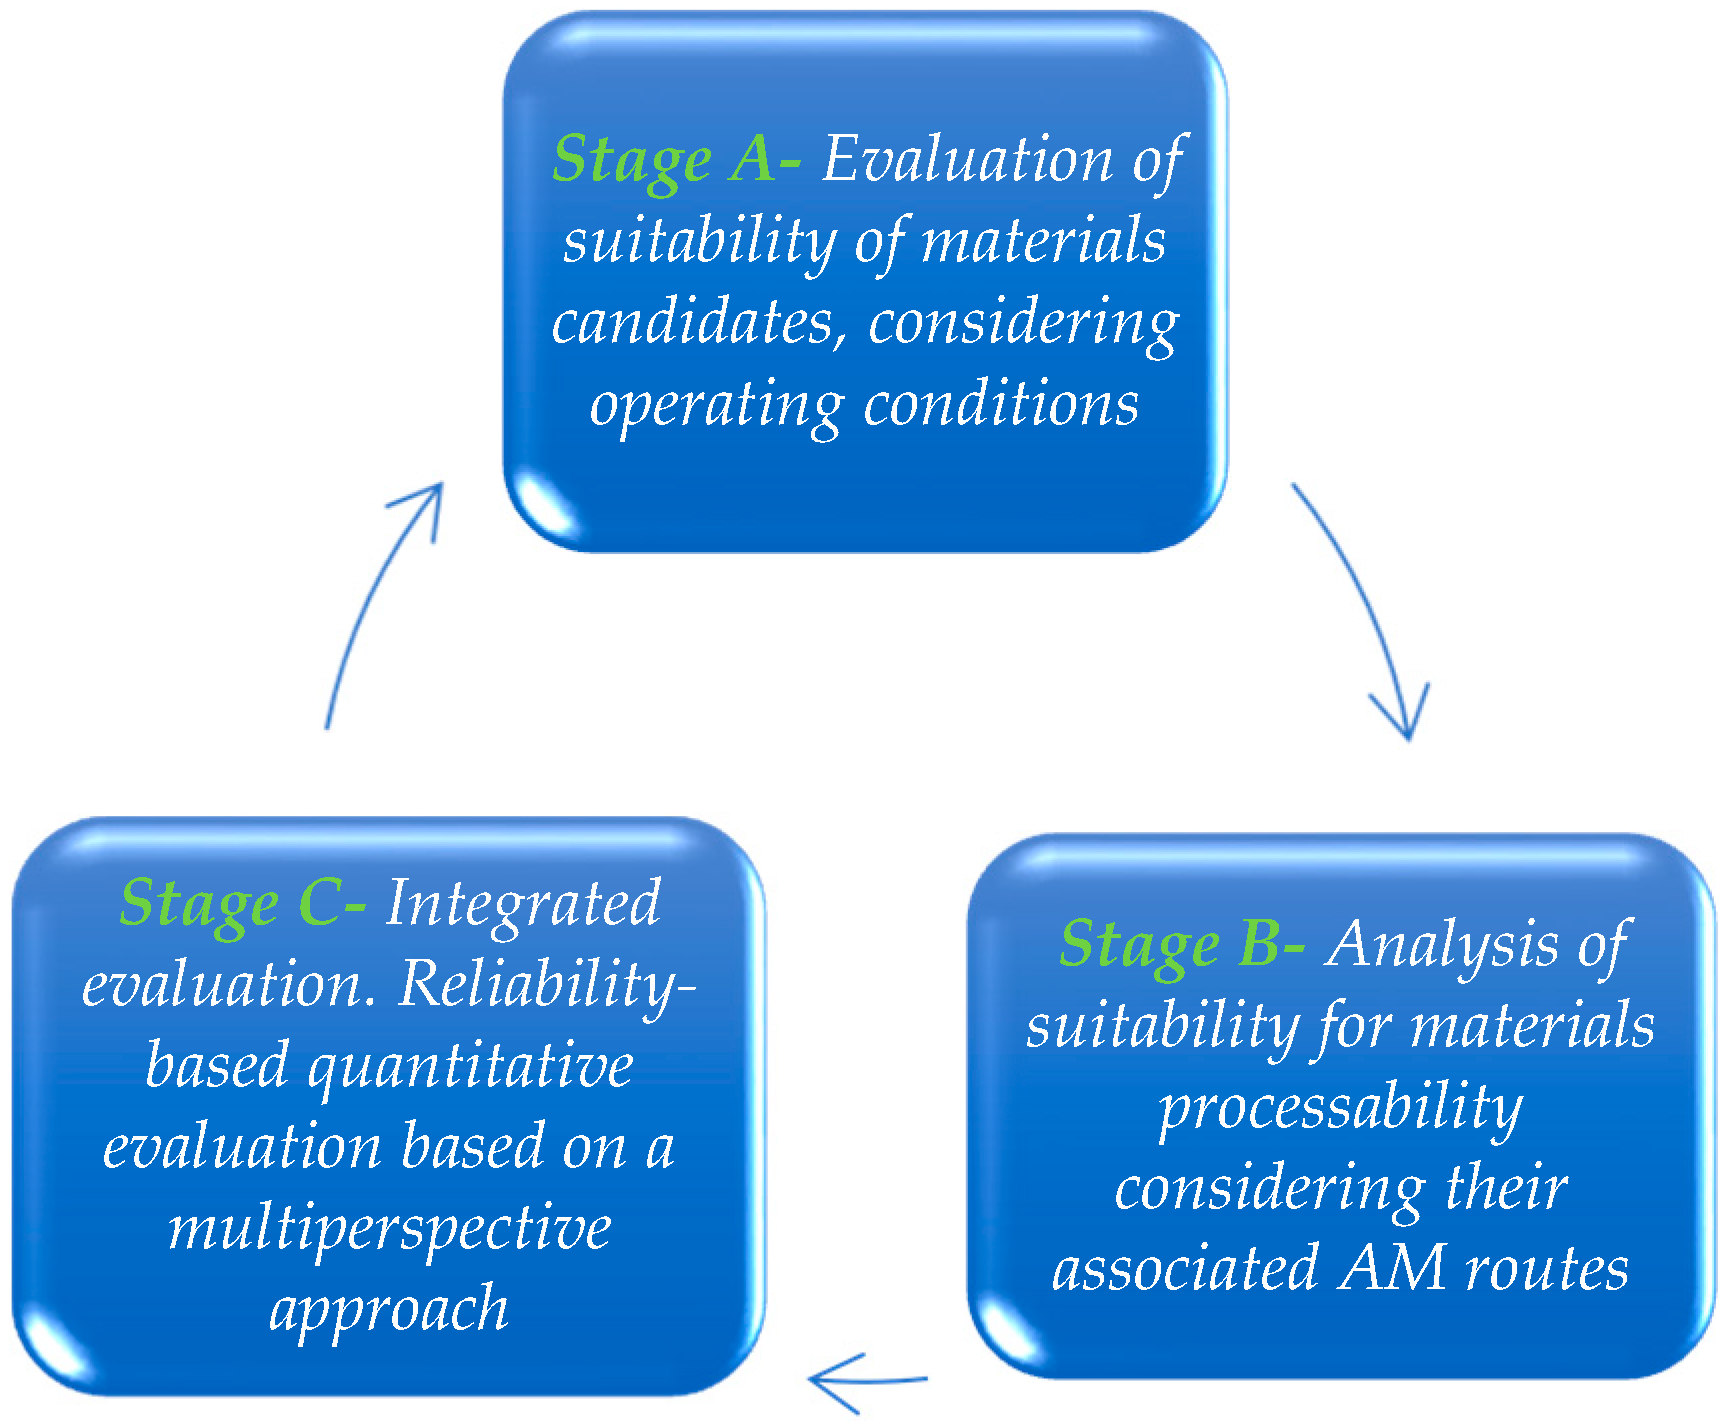
2.1. Stage A—Evaluation of Materials Candidates, Considering Operating Conditions
A reliability engineering program must be implemented from the conceptual phase of the physical asset to define the reliability requirements of the systems and equipment and the selection of suppliers that can deliver high-performance equipment in reliability. Therefore, predictive analyses based on more extended and recognized models and databases are performed.
Thermal aging of polymers considering operating time can be explained using the Arrhenius model. Thus, the common form to equate periods of time at two different temperatures is (Equation (1)):
where:
tUL = Lifetime by design (hours) at normal plant temperature
t’UL = Useful life (hours) at an increased temperature
Tn = Normal plant temperature (K)
Ta = Augmented temperature (K)
Ea = Activation energy (eV)
k = Boltzmann’s constant = 0.8617 × 10⁴ eV/K
The behavior of polymers under irradiation is strongly influenced by the atmosphere in which they are irradiated, particularly in the presence of oxygen. When polymers are irradiated in oxygen-containing atmospheres, the irradiation dose required to reach a particular level of degradation usually changes with dose rate [
40]. However, many studies show a synergy between heat and radiation most of the failures are caused by thermal aging rather than radiation aging [
41]. Radiation resistance is characterized by the half value dose of significant mechanical properties, for instance tensile strength [
42]. This is the absorbed dose that reduces a property by 50% [
43]. Thus, several studies have determined radiation thresholds until no severe degradation effects are observed [
44,
45,
46].
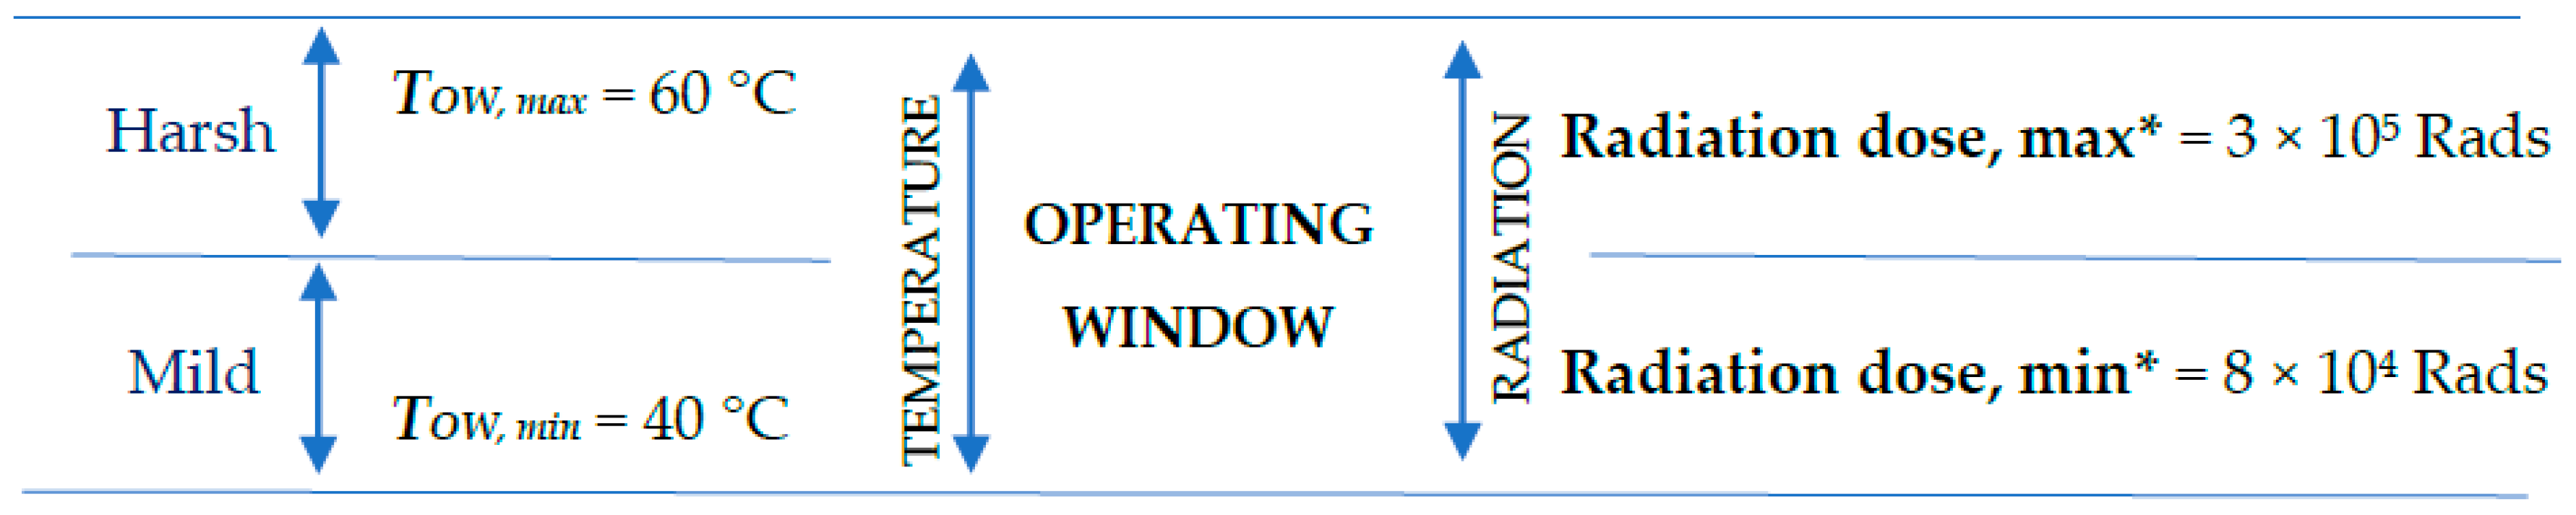
Well-defined temperature and radiation operating windows are essential to stablish an analysis framework (
Figure 3). Thus, defined normal conditions allow us to consider different scenarios depending the parameters variability inside the constructed range. Additionally, extreme conditions (out of operating windows) can be taken into account, comparatively, with respect to normal operating parameters (considering mild or harsh environment).
Table 2 shows energy activation (
Ea) according to EPRI TR 1009748 [
47] for thermal aging and maximum continuous service temperature (
Tmax) [
48], along with the radiation thresholds according to EPRI NP 2921 [
44], IAEA 1551 [
45] and CERN 72-07 [
46].
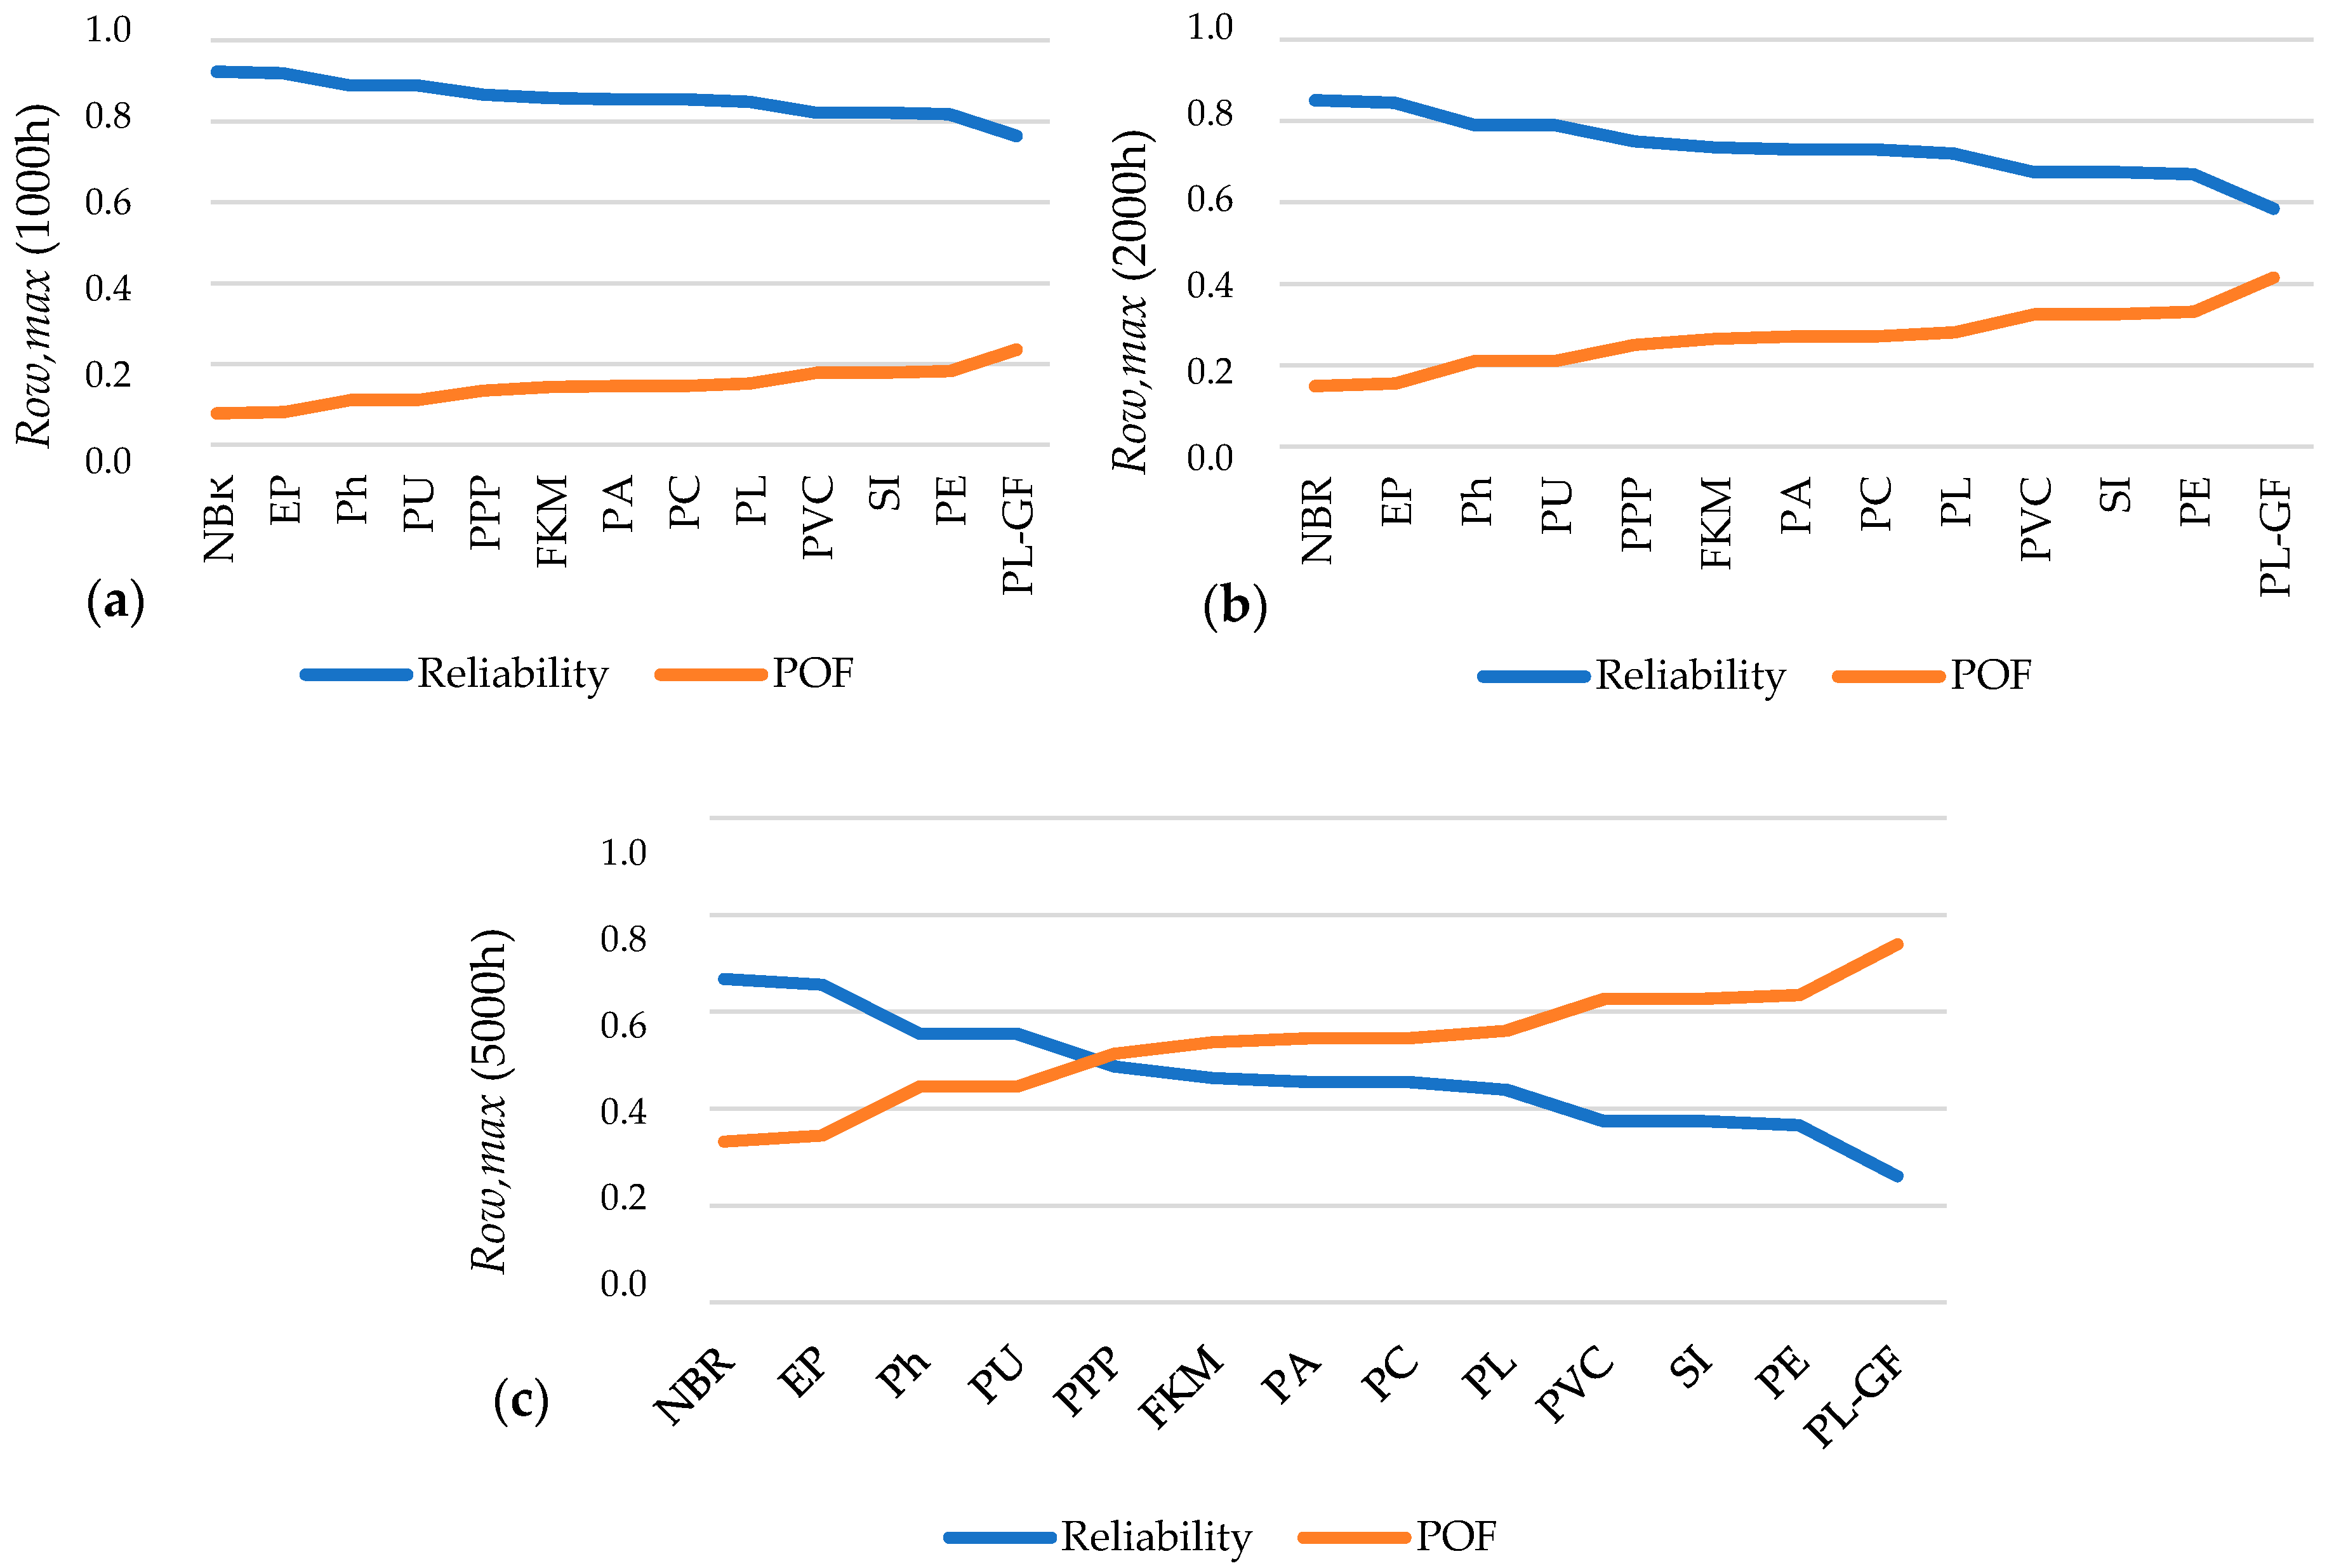
The time to failure (
tfailure) is obtained by solving the Equation (2)
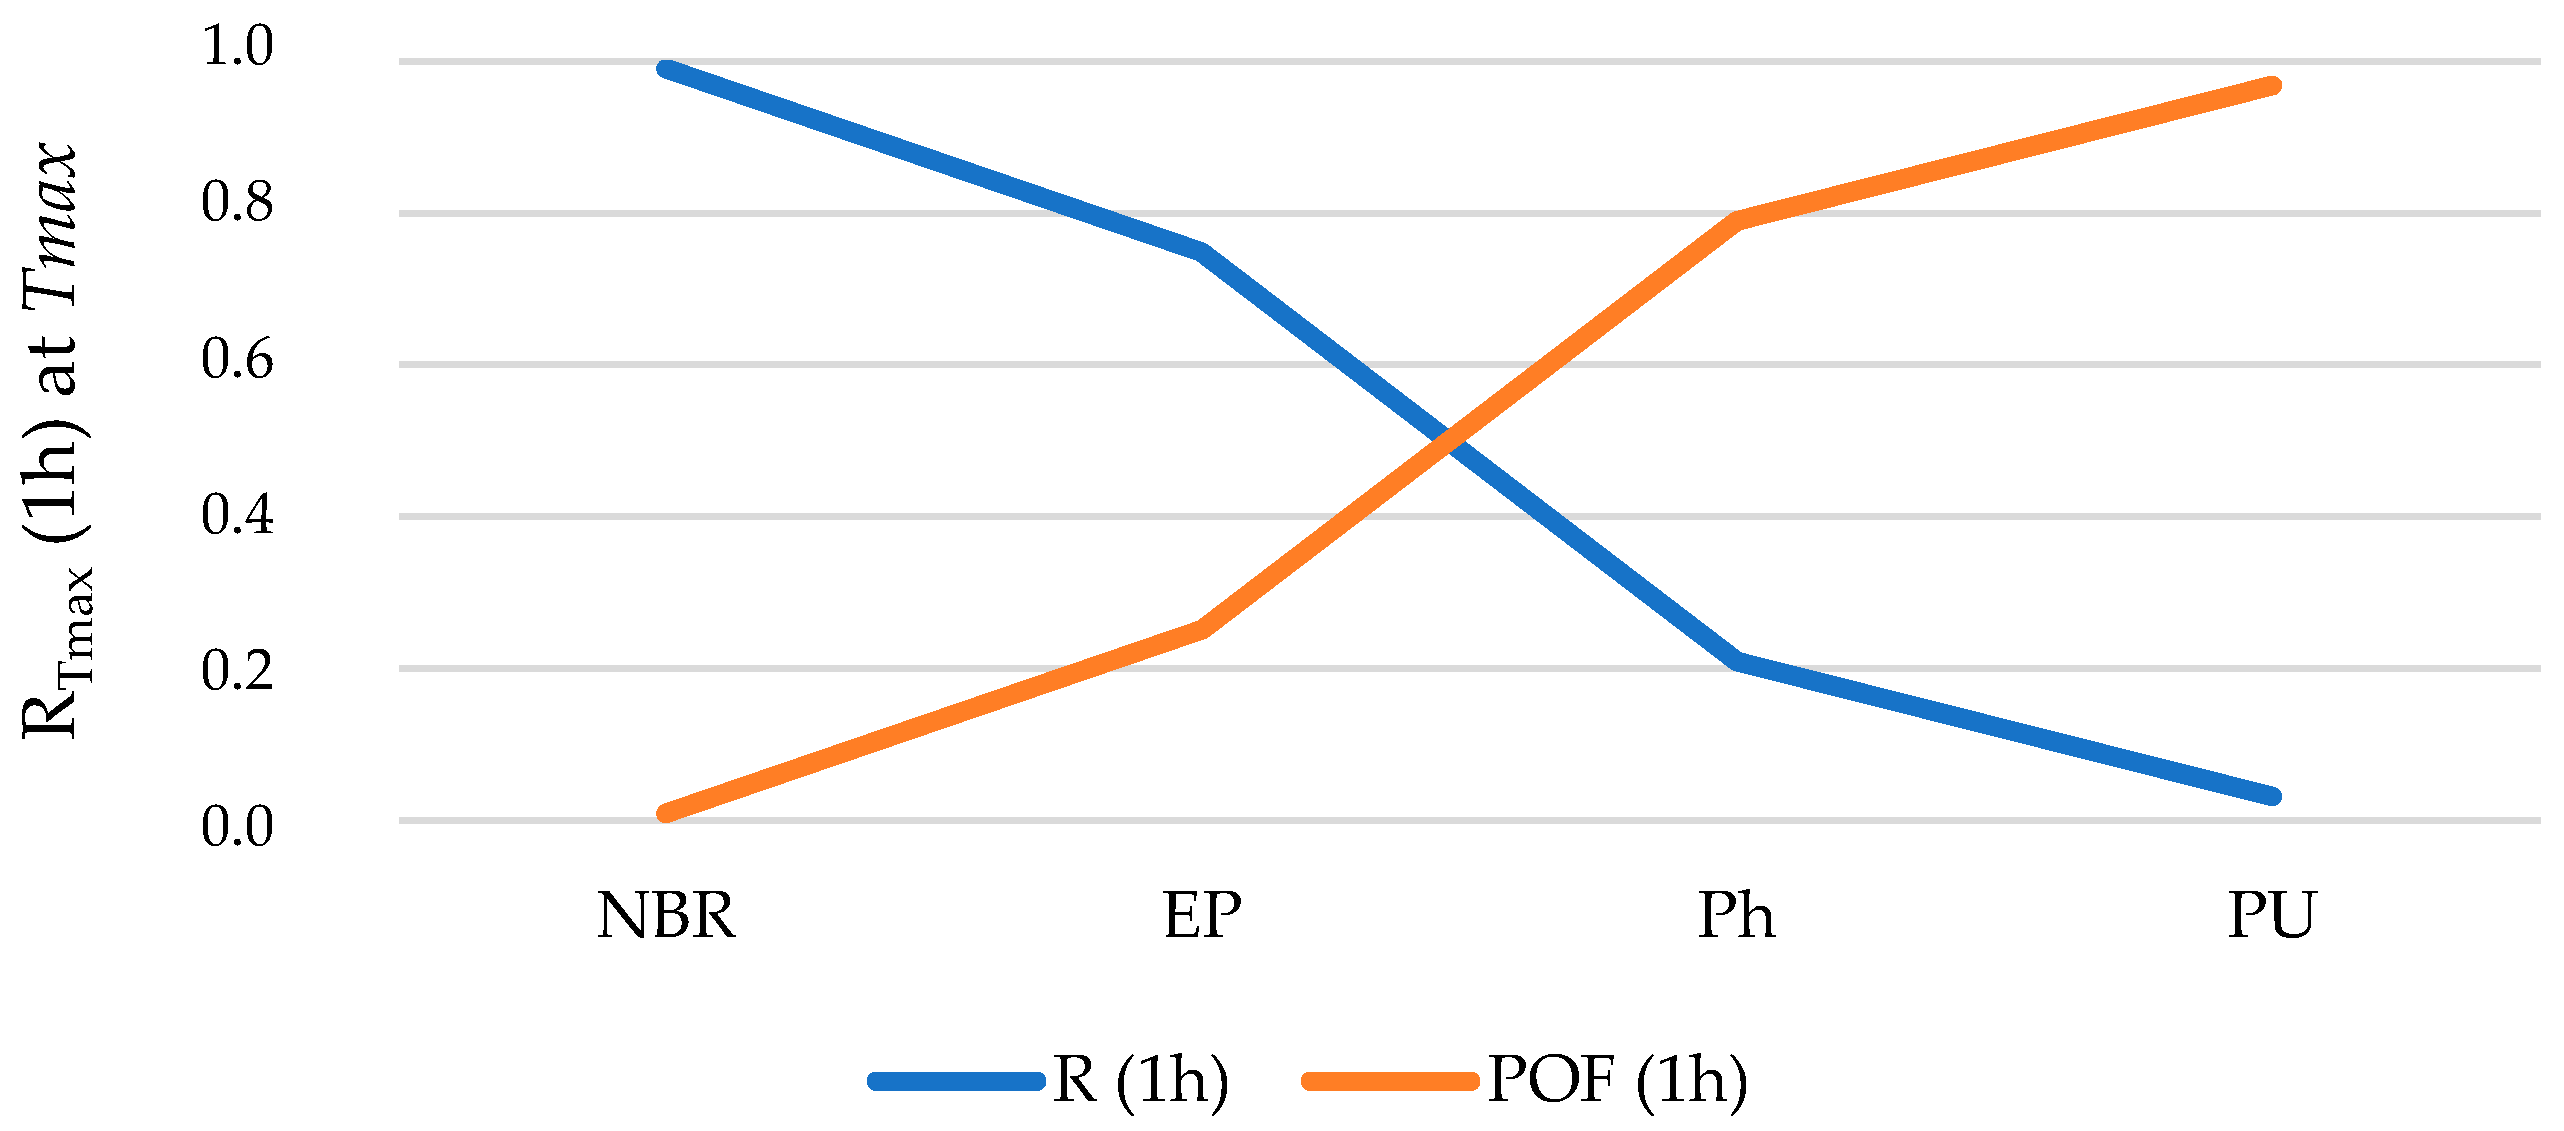
Additionally, Equation (3) is used to calculate
RULTmax.
Table 3 presents
tfailure at
TOW,max and
RULTmax.
Using a stringency level methodology [
49], the maximum level of stringency is assigned to the maximum value of the distribution (to evaluate HTR and TAT). The stringency level (SL) is therefore calculated according to Equation (4):
SL of the rest of HRT and TAT requirements are calculated as follows (Equation (5)):
where
Ls is the analyzed requirement value,
Ls,max is the maximum value of the distribution and
SLmax is the maximum value in the scale of stringency levels (between 1 and 5). Thus,
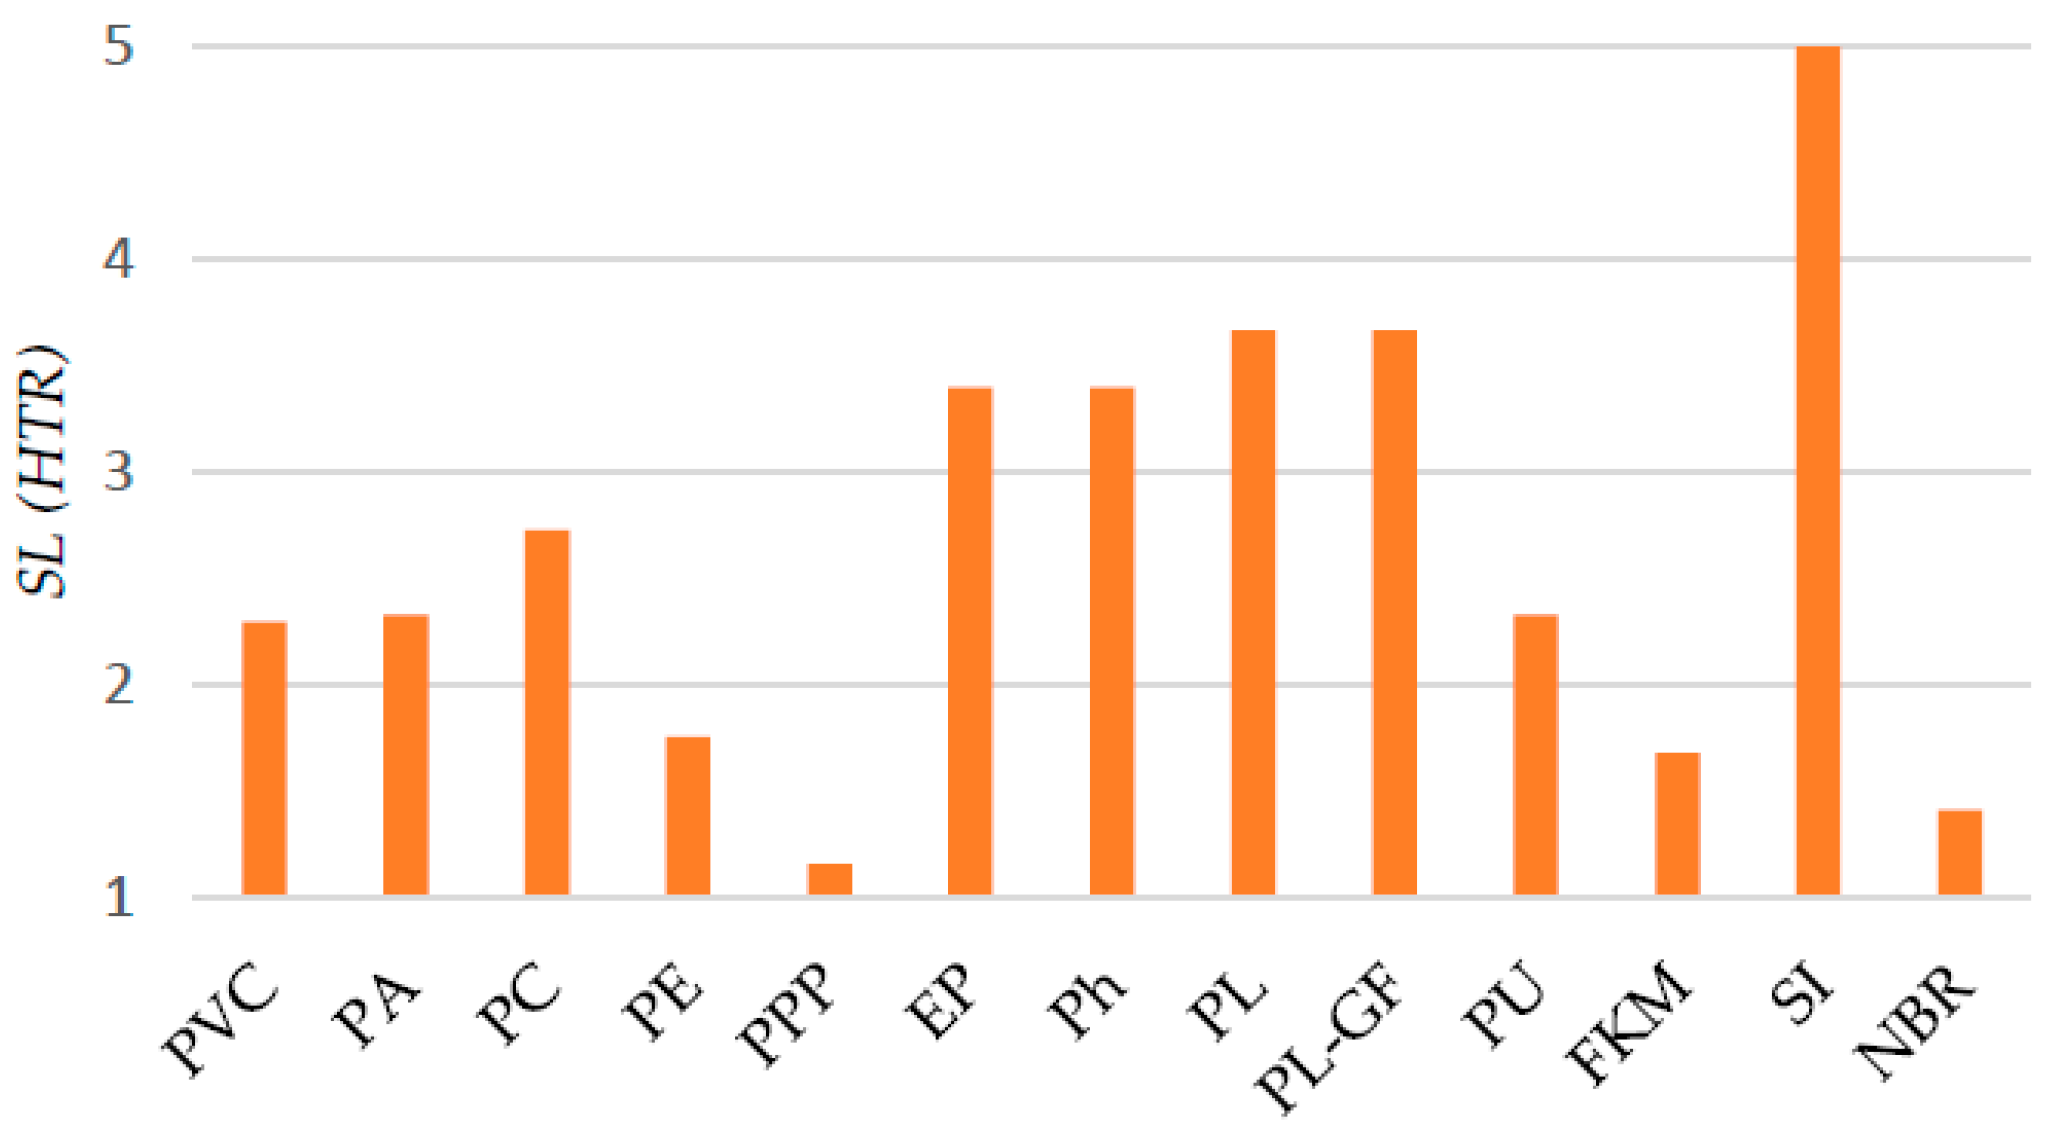
Figure 4 exhibits the SL (HTR).
As
Figure 2 indicated, conflict#1 and conflict#2 arise when materials should be selected according to the maximum temperature in service (
Tmax); to maximize the high-temperature resistance (HTR),
Tmax must be maximized. Nevertheless, this differs to the objective of selecting thermoplastic polymers nature due to their better recyclability. In addition, to maximize a remaining useful life (
RULTmax) in abnormal conditions (out of normal operating window; at
Tmax),
Tmax should not be a higher value. Therefore, a constraint (CS#1) is now defined to find a moderate balance:
Constraint (CS)#1: 2 < SL(HTR) ≤ 3.5
Therefore, according to the results shown in
Figure 4 and the Constraint #1, the following polymers meet the criteria: PVC (
SL = 2.30), PA (
SL = 2.33), PC (
SL = 2.72), EP (
SL = 3.40), Ph (
SL = 3.40) and PU (
SL = 2.33).
For the TAT requirements, a relative weight of 90% for the normal operating condition versus abnormal operation is considered (in case of accident, i.e., out of normal operating window as indicated in
Figure 3), Equation (6) shows the weighted
SL:
Thus,
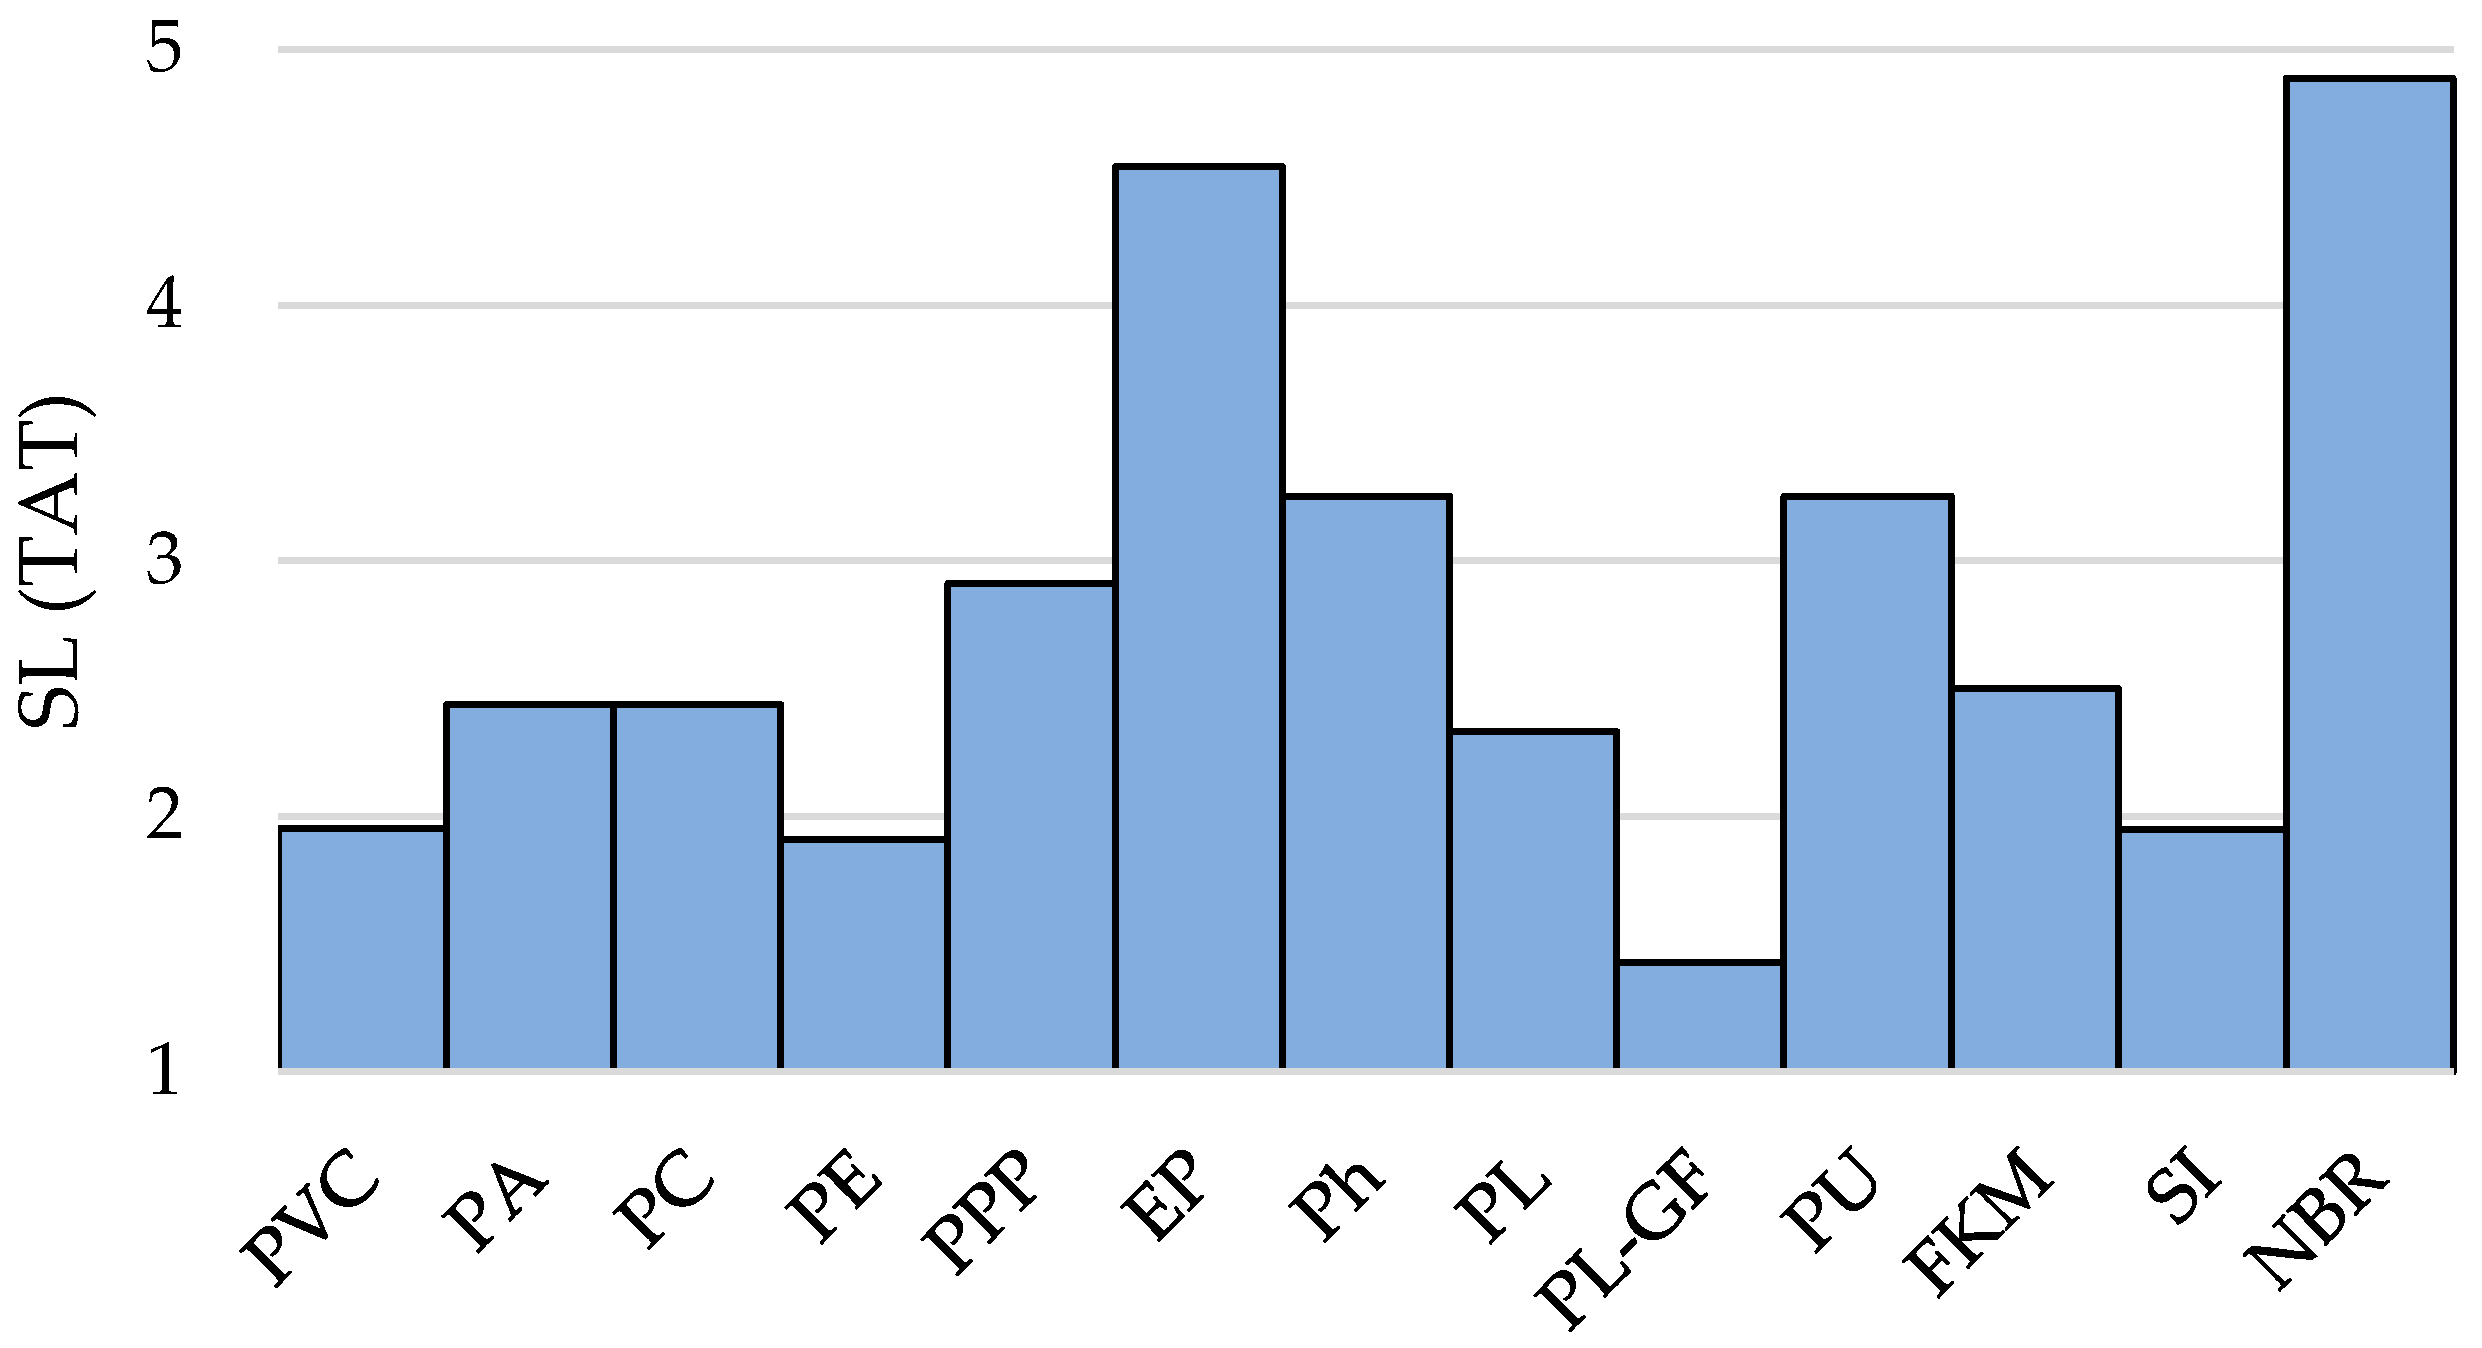
Figure 5 exhibits the stringency level of thermal aging tolerance—
SL (
TAT)—for the analyzed materials set.
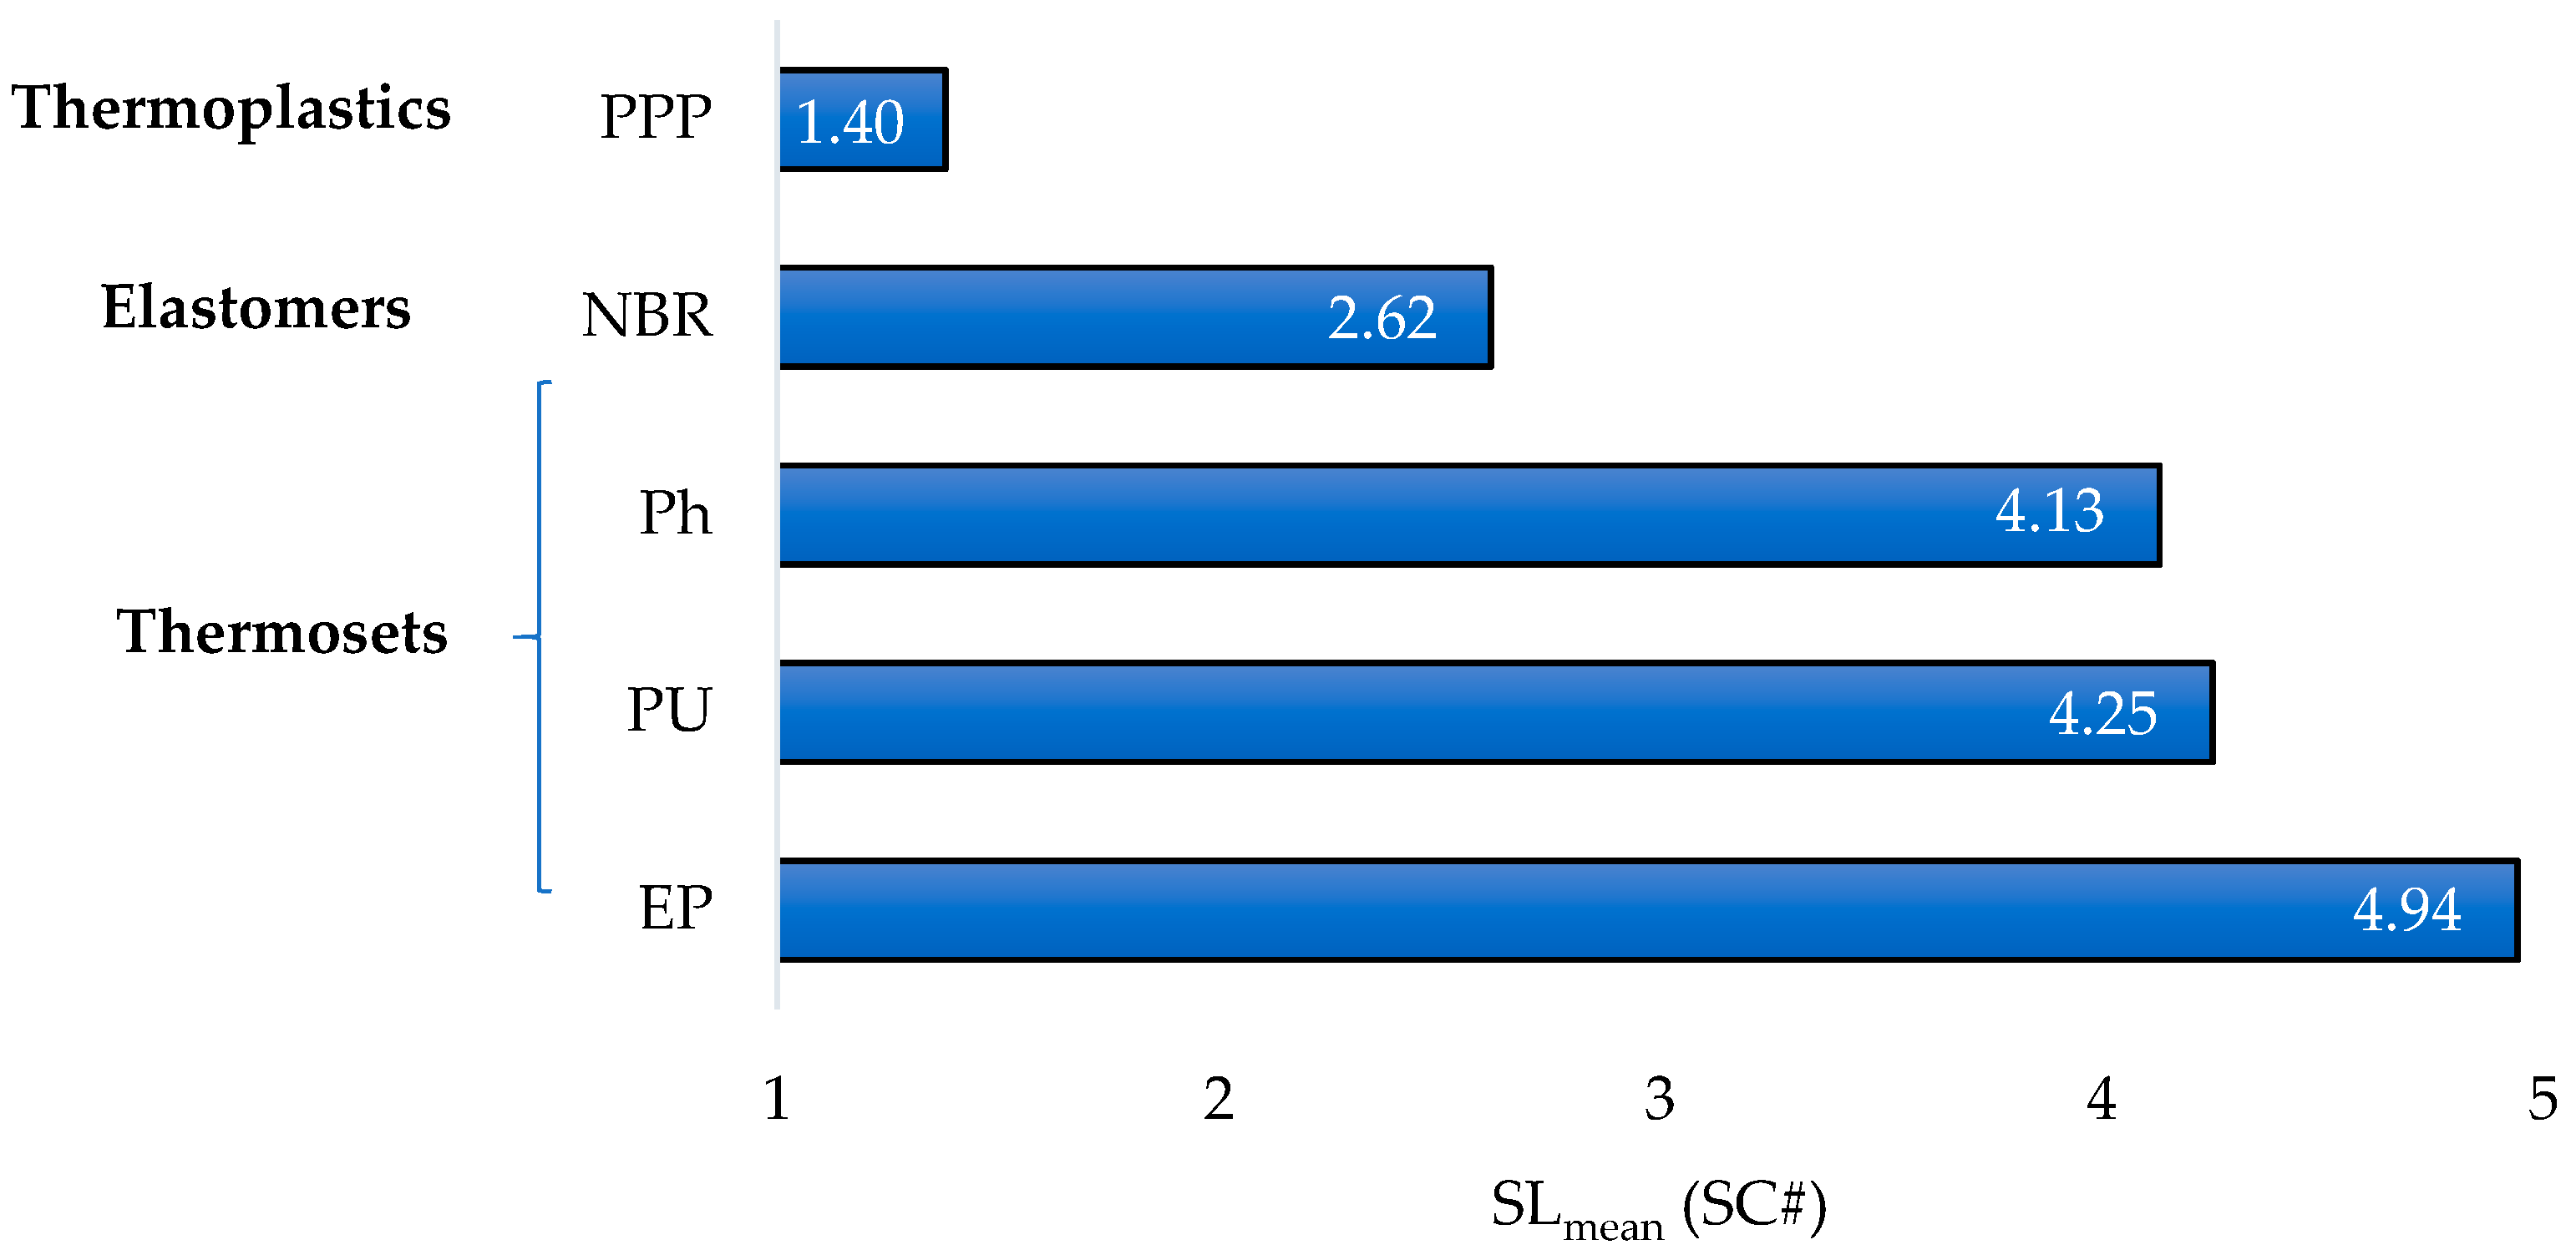
According to the results shown in
Figure 5 along with a goal function that consists in maximizing
tfailure and
RULTmax, the materials with highest values (above
SL(
TAT) ≥ 3.00) are: PPP (
SL = 3.02), EP (
SL = 4.30), Ph (
SL = 3.08), PU (
SL = 3.08), NBR (
SL = 4.77).
Equation (7) provides the calculation of
RTTi based on the more restrictive (minimum) value provide by IAEA, EPRI and CERN databases.
Irradiation performance is calculated applying a stringency level calculation. It assigns the maximum level of stringency to the maximum value of the distribution, according to the following equation:
The calculation to evaluate the radiation resistance is developed according to the Equations (8)–(12) using radiation threshold (
ROW,max) and the radiation tolerance threshold for the polymer
i according to IAEA, EPRI and CERN databases (
RTTi), that defines the limit to avoid pernicious effects on the mechanical properties of the polymers:
Therefore, a safety factor (SF) equal to 3.75 is chosen to assign maximum stringency value.
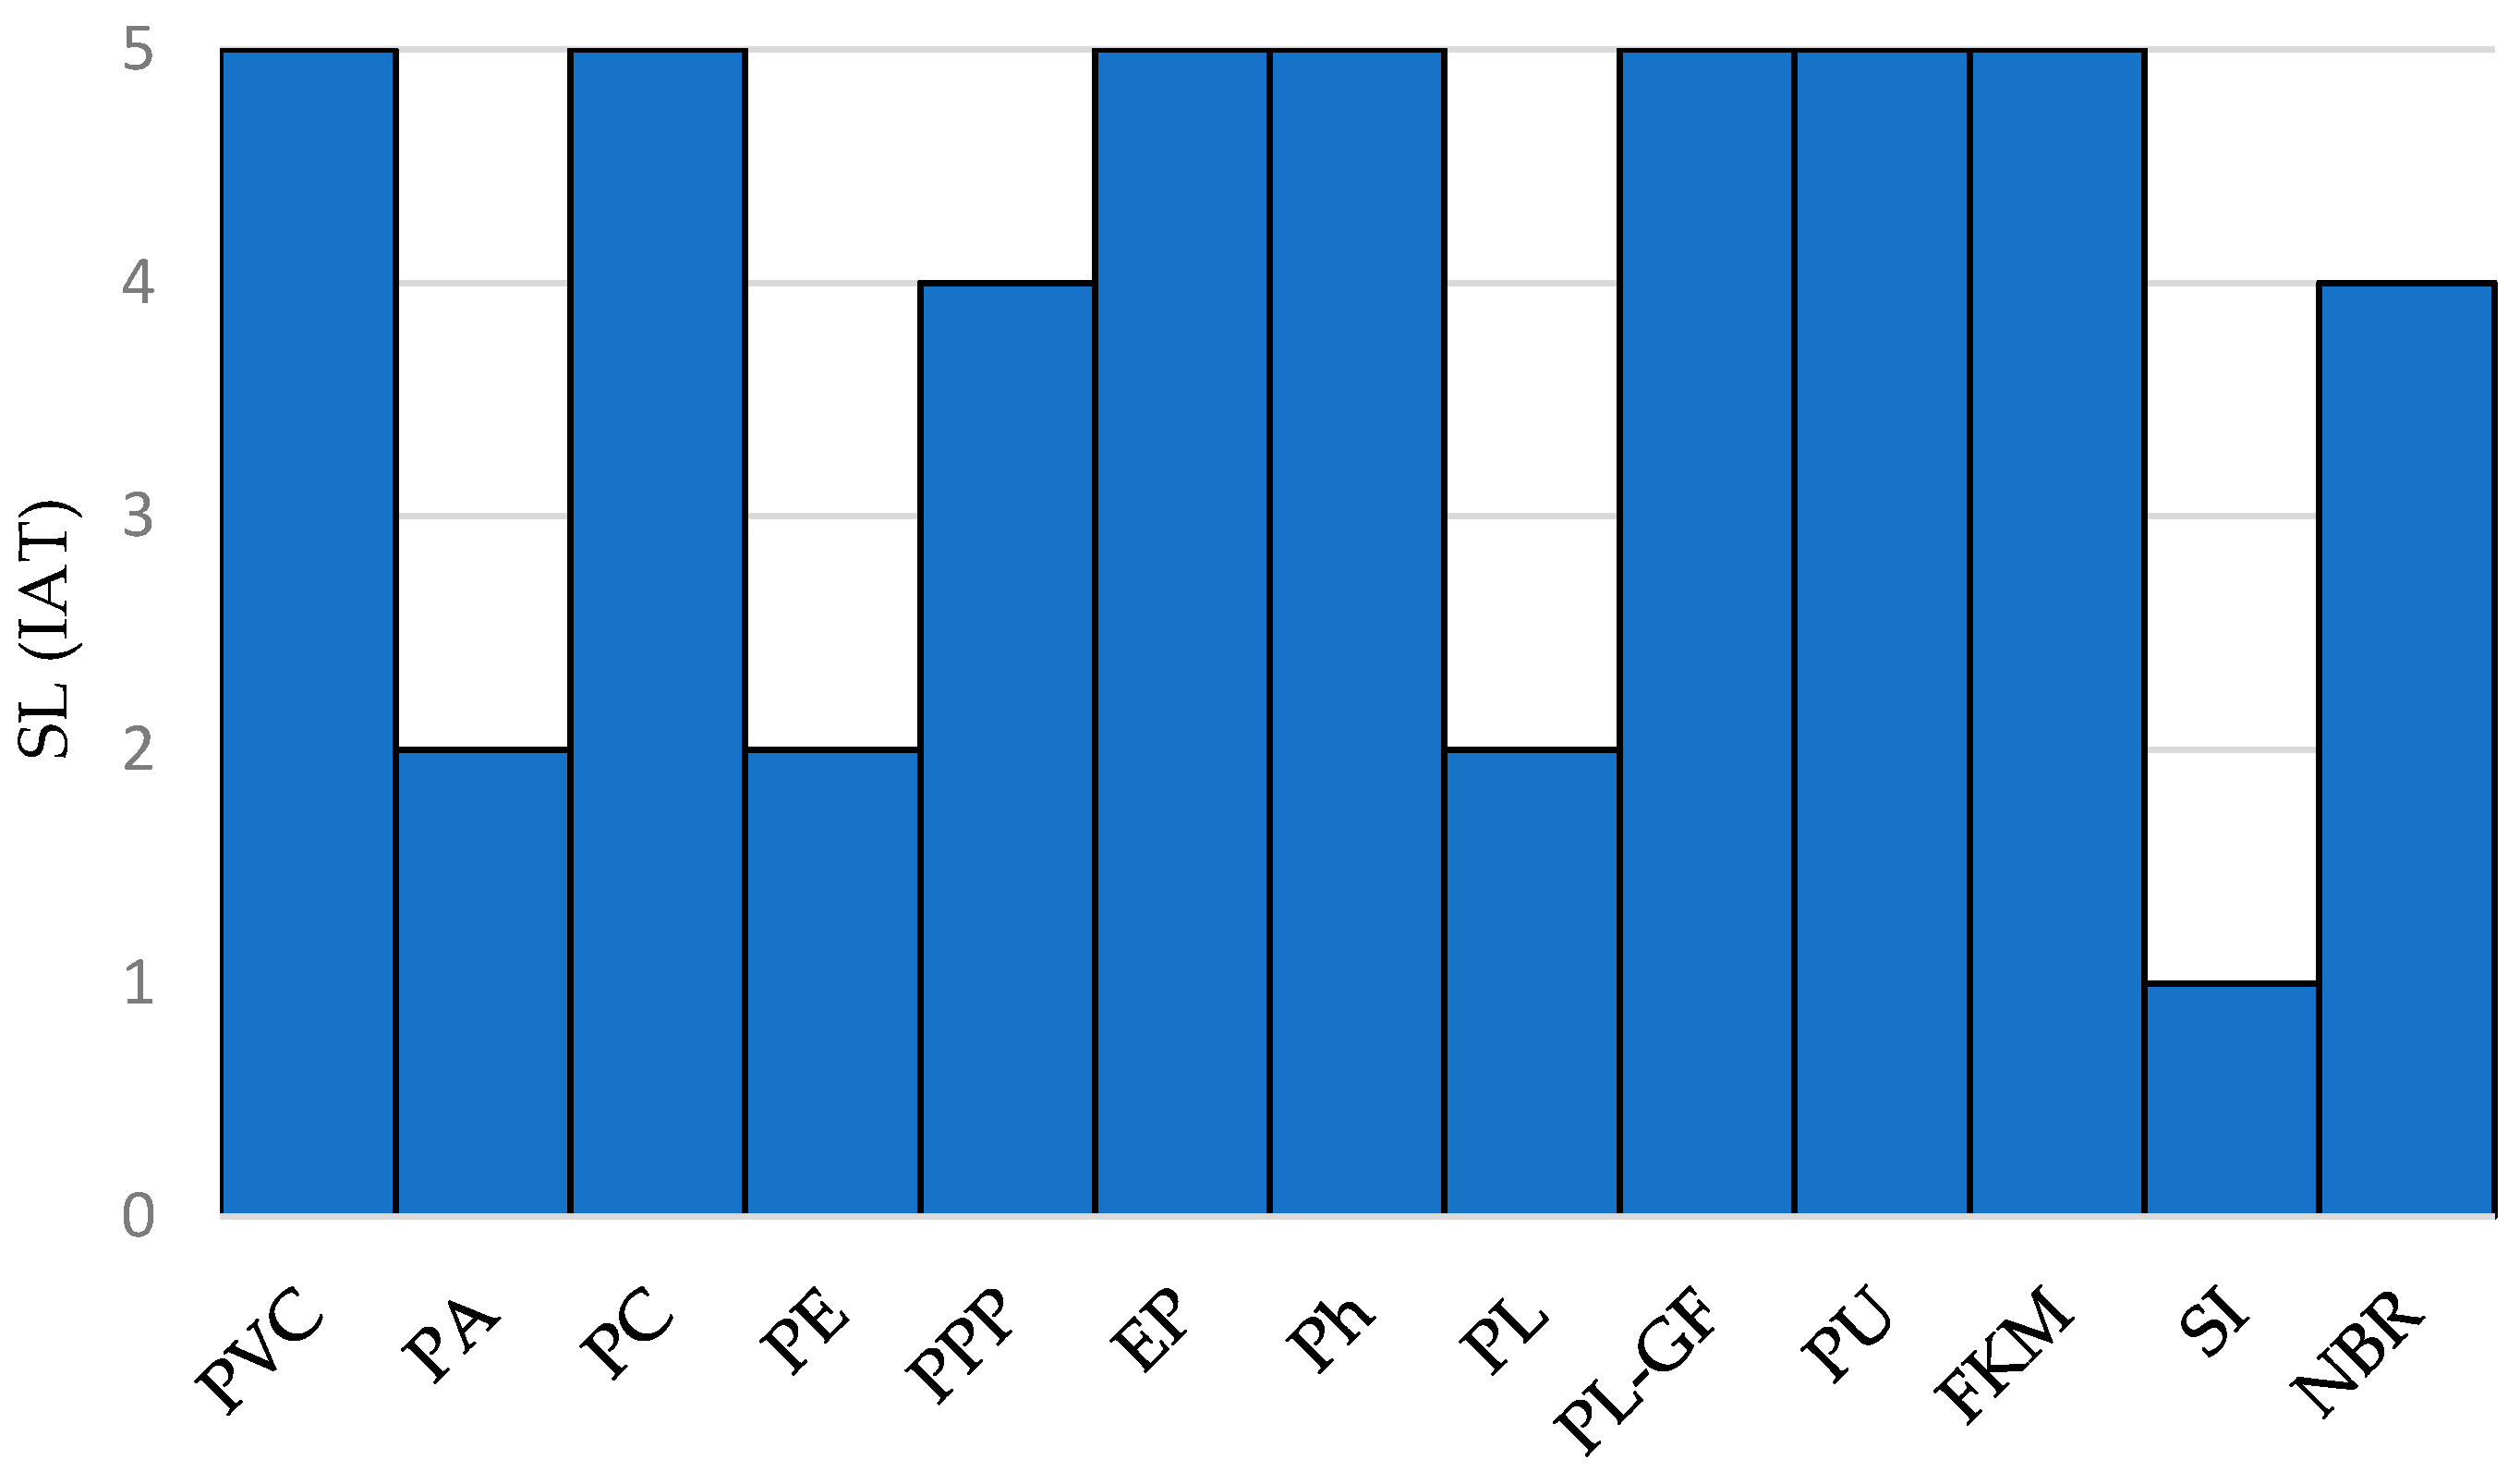
Figure 6 shows the irradiation aging tolerance based on the stringency level approach.
IAT evaluation is shown in
Figure 6, in terms of stringency levels using Equations (8)–(12). Thus, selecting the polymers that exhibit
SL(IAT) ≥ 3, the following list is obtained: PVC (
SL = 5.00), PC (
SL = 5.00), PPP (
SL = 4.00), EP (
SL = 5.00), Ph (
SL = 5.00), PL-GF (
SL = 5.00), PU (
SL = 5.00), FKM (
SL = 5.00), NBR (
SL = 4.00).
2.2. Stage B—Analysis of Materials Processability Considering Their Associated AM Routes
As mentioned previously, FDM, SLS and VP-SLA have been selected as the potential AM routes to process the materials when obsolescence problems and an intricate manufacturing geometry are challenges to face.
FDM uses a heated nozzle to convert the thermoplastic filament into a semi-molten form, which is extruded to build the structure through layer-by-layer deposition [
50]. Compared to other AM methods, as the FDM method offers many advantages including cost effectiveness, and now, many researchers are moving towards FDM to study this process thoroughly [
51].
With SLS, a powder bed fusion AM process, three-dimensional (3D) objects can be fabricated by adding powdered materials layer by layer according to computer-aided design (CAD) models [
52]. The main advantage of SLS is that it can process an extensive scope of materials including polymers, metals, ceramics and composites. In fact, SLS of plastics shows an excellent capability to manufacture serial components.
VP-SLA is a very high suitable technique for thermoset and elastomers additive manufacturing, whereas PBF or EB are not suitable. VP-SLA is one of the most interesting technologies among the wide AM family, because it allows one to reach the highest levels of accuracy combining the advantages of starting from a liquid base material with the vector scanning driven modality that the laser adopts to cure it [
53].
For example, the photopolymer resins used during this process are also known as thermosetting plastics or thermosets, which strengthen during post-curing and keep their shape, even after reheating. This is in contrast to thermoplastics, which can be re-melted after being formed into a part.
Some recent AM studies have been centered on thermal properties, calculating the thermal profiles for an arbitrary rastering sequence, squarely focusing on part scale depending on several normalized parameters that depend on the time and length scales of the rastering process: normalized power, normalized thermal diffusivity and normalized beam width. Normalized profiles remove a prefactor, resulting on profiles that depend on two parameters, the normalized thermal diffusivity and the normalized beam spread [
54]. Therefore, in this work, thermal diffusivity is considered as the most relevant feature to calculate thermal processability.
The differential equation of heat conduction through an isotropic material [
55] considering the propagation in a linear dimension, is shown in Equation (13).
where
is the material density and
c is the heat capacity of material.
Thus, an important processability parameter is the density of polymer, since the mechanical strength typically increases with the molecular weight and degree of branching or side chains. The other important parameter is the specific heat capacity of material (
cs), presented also in
Table 4, along with density, according to the information provided by different databases [
44,
45,
46].
Other aspects important in the further processing are related to the rheological behavior of materials. Nevertheless, this methodology intends to fit a basis to make a decision on materials and their associated AM routes. Rheological aspects can be quantified by an experimental or numerical method in a further phase.
Table 4 shows the main processability parameters (density-
, thermal conductivity-
k, thermal diffusivity-
a, specific heat capacity-
cs, typical layer thickness per AM technique-
tlayer,min obtained from different databases [
48,
56,
57,
58,
59,
60,
61,
62,
63,
64,
65,
66,
67], including the calculation of penetration depth (
d).
Subsequently, it is recommendable that a medium density is used to find a balance between mechanical strength and processability. Unfortunately, this also results in an elevation of the melt viscosity and melting point, and the extrusion of high strength thermoplastics requires elevated temperatures that aggravate thermal distortion [
56]. Therefore, an adequate balance between resistance and elongation is crucial to improve processability, delaying also an early embrittlement due to a further thermal and radiation in-service degradation. Thus, (SC)#1 is stablished considered a balanced requirement mean ±0.2.
Selecting criterion (SC)#1: 1.25 < ρ ≤ 1.65
Therefore, PVC, PC, PE, EP, Ph, PL, PL-GF, PU and SI fulfill the selection criterion (SC)#1.
On the other hand, it is recommendable a low specific heat capacity to ease the heat transfer. The following selection criterion is considered in the analysis, considering that the study is comparative and a cs = 1500 J/kg·°C is a central representative value.
Selecting criterion (SC)#2:cs < 1500 J/kg·°C
Thus, the selection order according to SC#2 criterion is: PVC (Cs = 1004 J/kg·°C), FKM (Cs = 1023 J/kg·°C), EP (Cs = 1046 J/kg·°C), PL/PL-GF (Cs = 1130 J/kg·°C), SI (Cs = 1255 J/kg·°C), NBR (Cs = 1443 J/kg·°C) and Ph (Cs = 1463 J/kg·°C).
On the one hand, high thermal conductivity improves processability and, on the other hand, heat transfer and hence reduce the inside temperature and thermal stress of components [
57]. Thermal analysis can become a useful tool to enhance our ability to predict the outcome of the fabrication process [
54]. In additive manufacturing, parameters such as thermal conductivity and diffusivity and specific heat capacity are essential to estimate the penetration depth (mm) and speed (mm/s), which is important to evaluate the suitability of different additive manufacturing routes. Thus, penetration depth (
d) can be calculated according to Equation (14):
where
a is the thermal diffusivity,
t is the application time of energy-input and
k is the thermal conductivity.
In addition, considering the maximum service temperature (
Tmax), the maximum allowable supplied heat (
HS, MAX) can be calculated according the Equation (15).
where
cs is the specific heat capacity, calculated as c/
m (where
m is the mass in kg and
c is the heat capacity in J/°C) and
ΔTMAX is the maximum temperature gap, calculated like the difference between
TMAX (maximum service temperature—until degradation) and usual room temperature (25 °C).
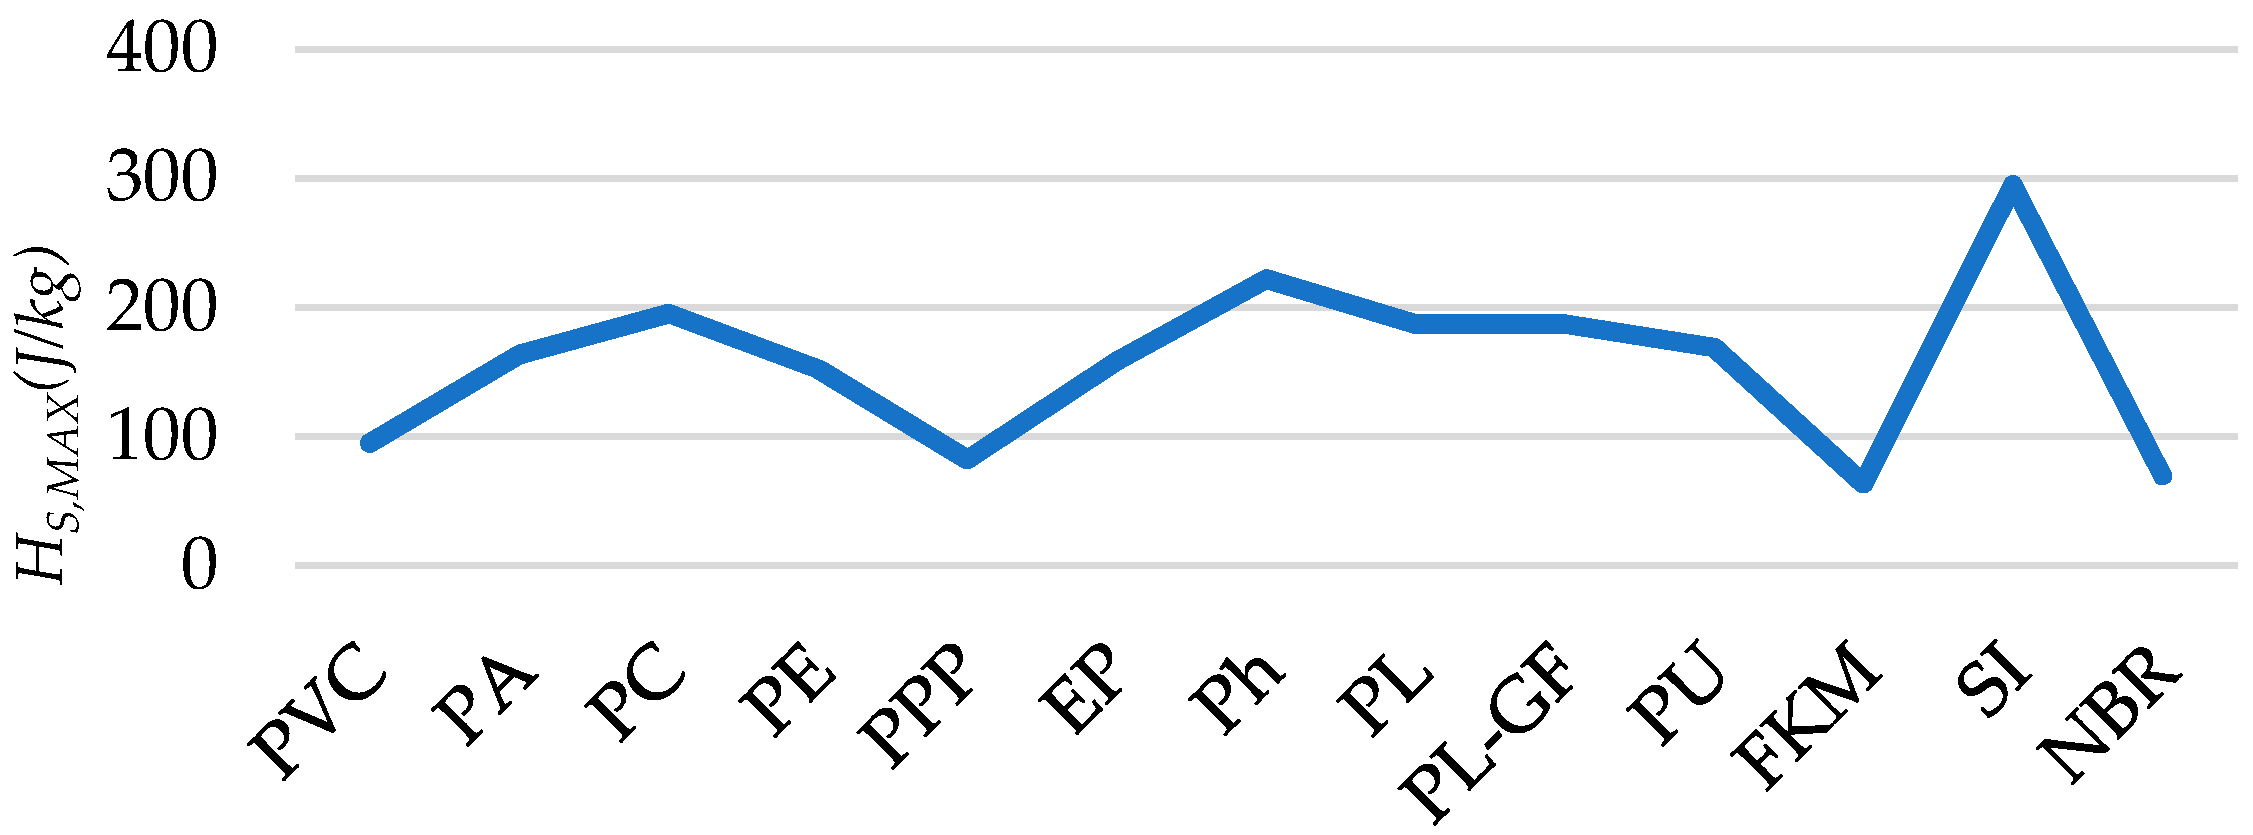
Figure 7 provides the
HS,MAX (J/kg) for each analyzed polymer.
To find the most suitable (best processability) options, a selection criterion (SC#3) considering the value of HS,MAX is established:
Selection criterion (SC)#3:HS,MAX > 150 J/g
Analogously, a considered central value of 150 J/g are stablished as a minimum threshold.
Thus, the selection order according to SC#3: SI (HS,MAX = 294.93 J/g), Ph (HS,MAX = 222.04 J/g), PC (HS,MAX = 195.31 J/g), PL/PL-GF (HS,MAX = 187.08 J/g), PU (HS,MAX = 168.87 J/g), PA (HS,MAX = 163.39 J/g), EP (HS,MAX = 158.65 J/g) and PE (HS,MAX = 152.12 J/g).
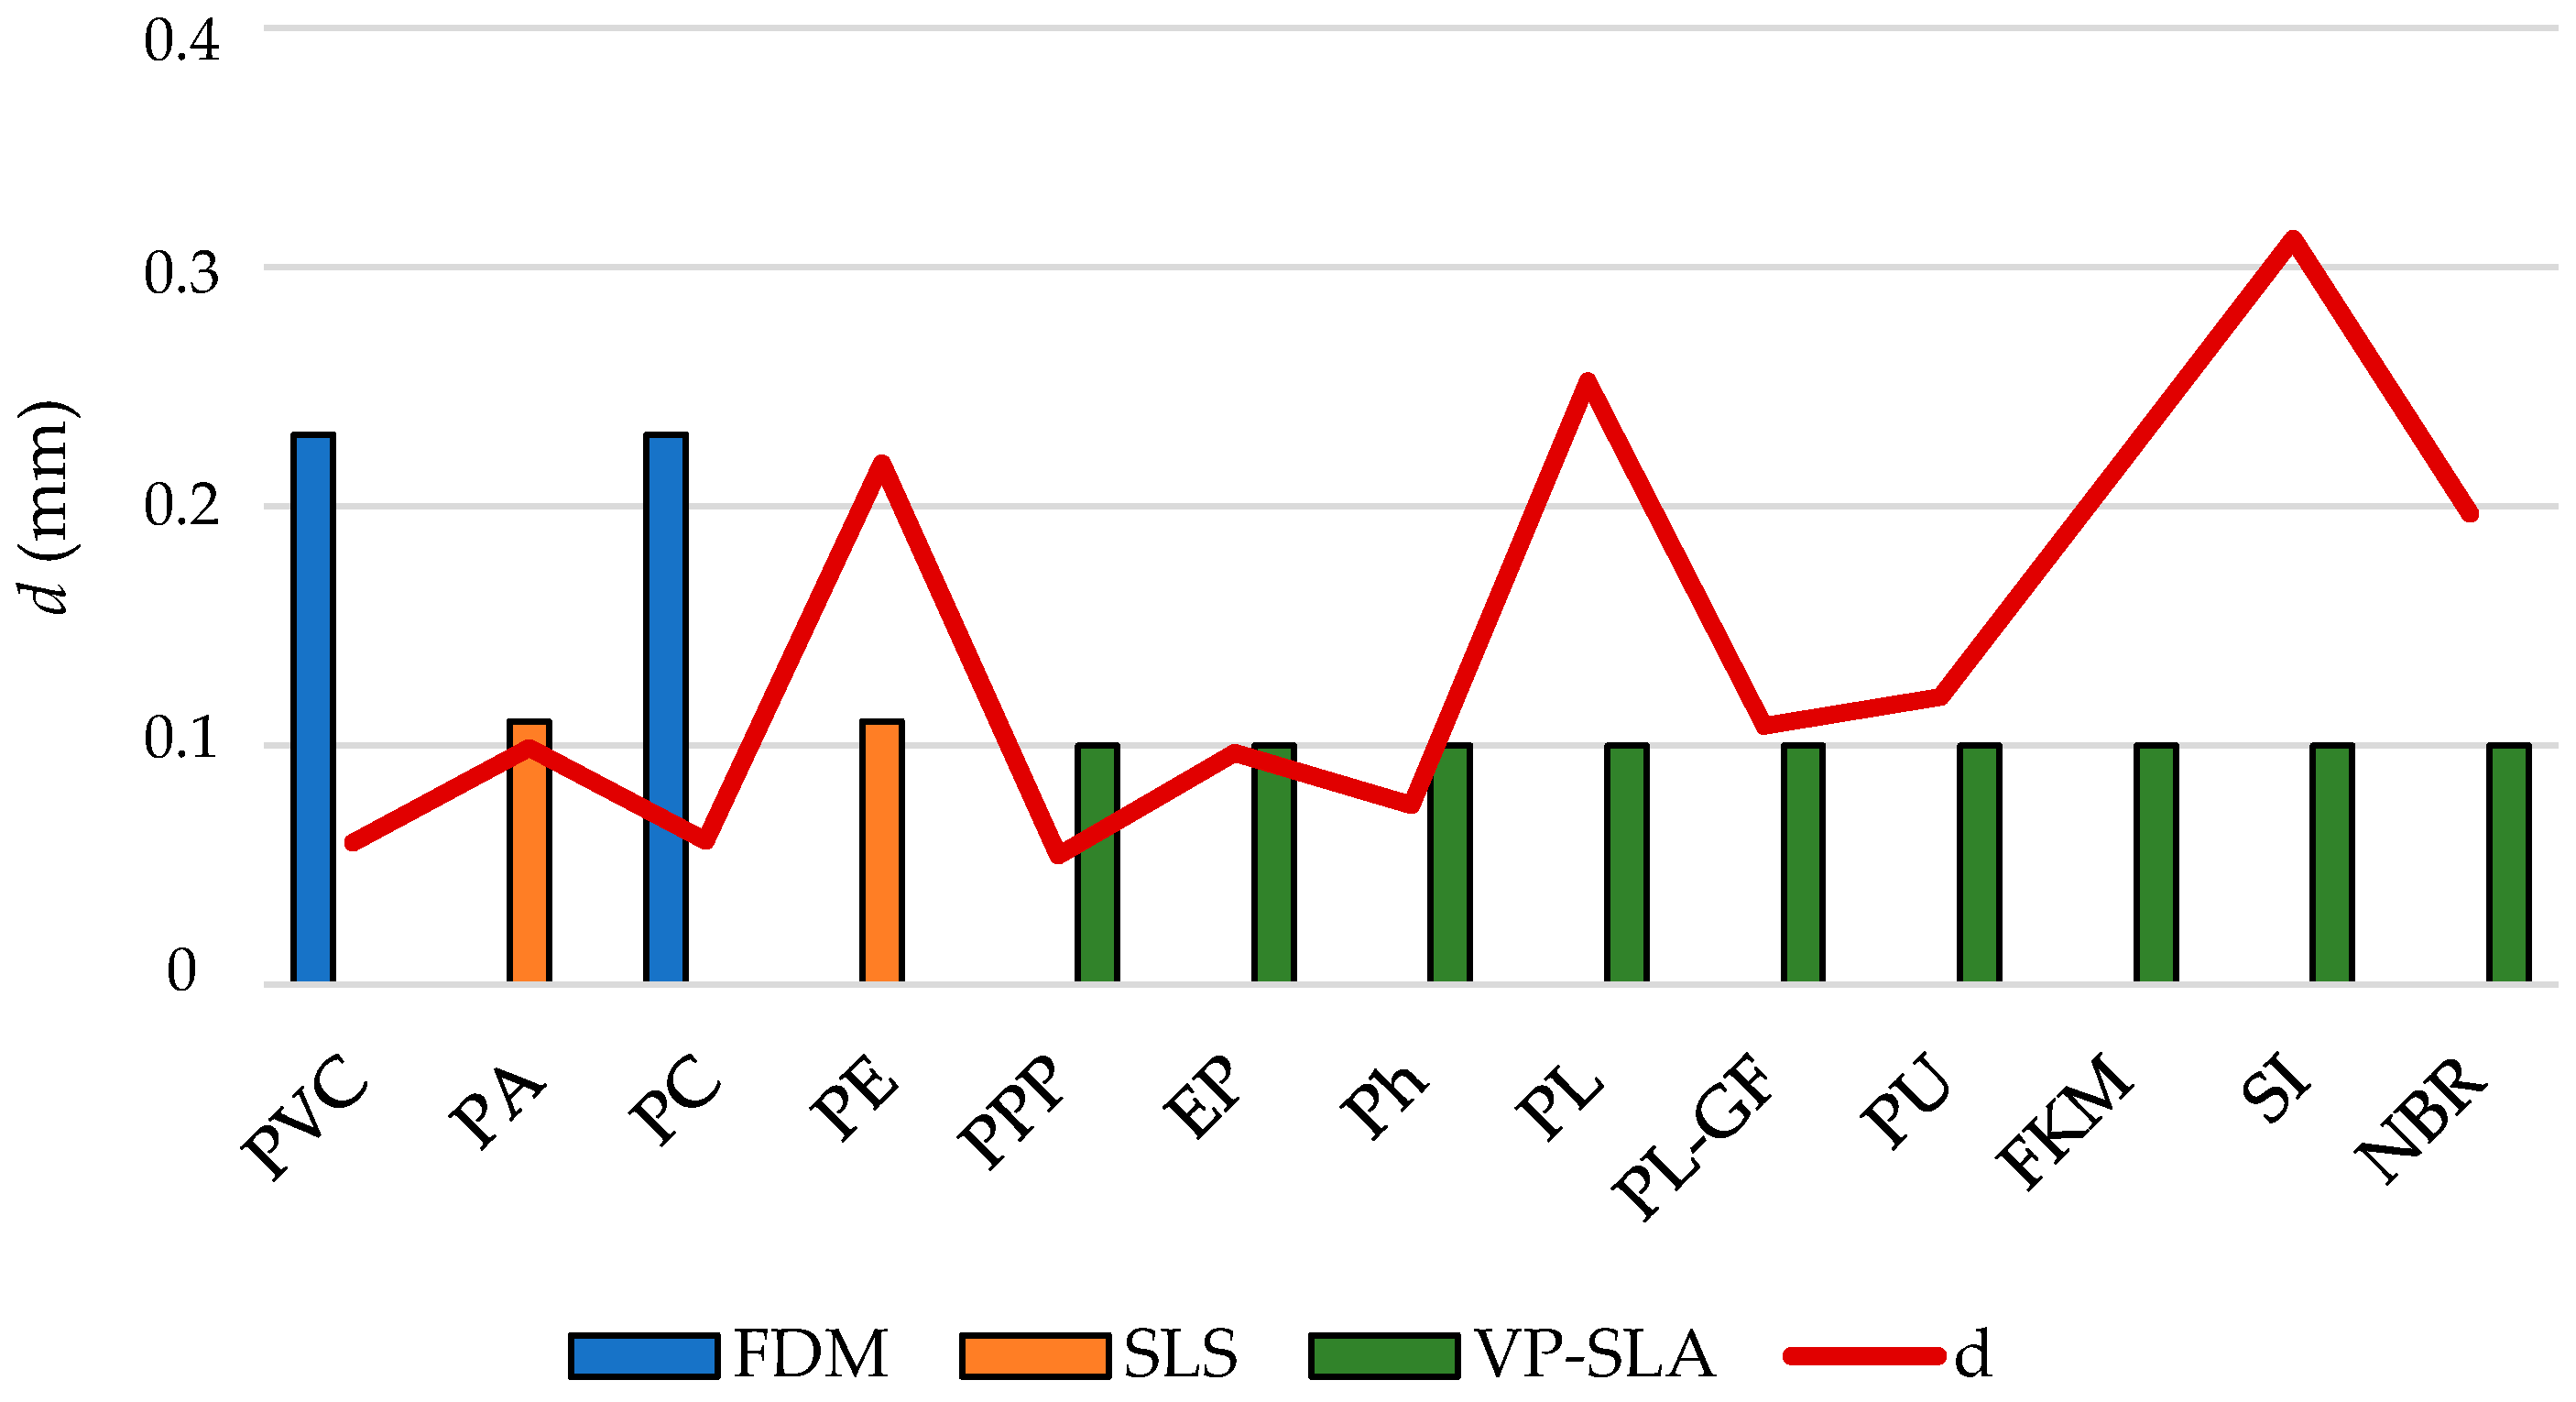
One challenge in AM is to control the heat penetration depth since layers are very thin and usually heat input affects more deeply that it would be recommended, moreover considering the discontinuous structure of AM parts [
68]. Therefore, to analyze the suitability of each potential AM technique for each polymer, a comparison between heat penetration depth (due to polymer characteristics) and the average expected layer thickness is performed (
Figure 8).
Thermoplastics show, in general (excepting PE), better behavior since the penetration depth for a heat input per second is usually less than the average layer thickness. On the other hand, EP and Ph thermosets show similar behavior compared to thermoplastics.
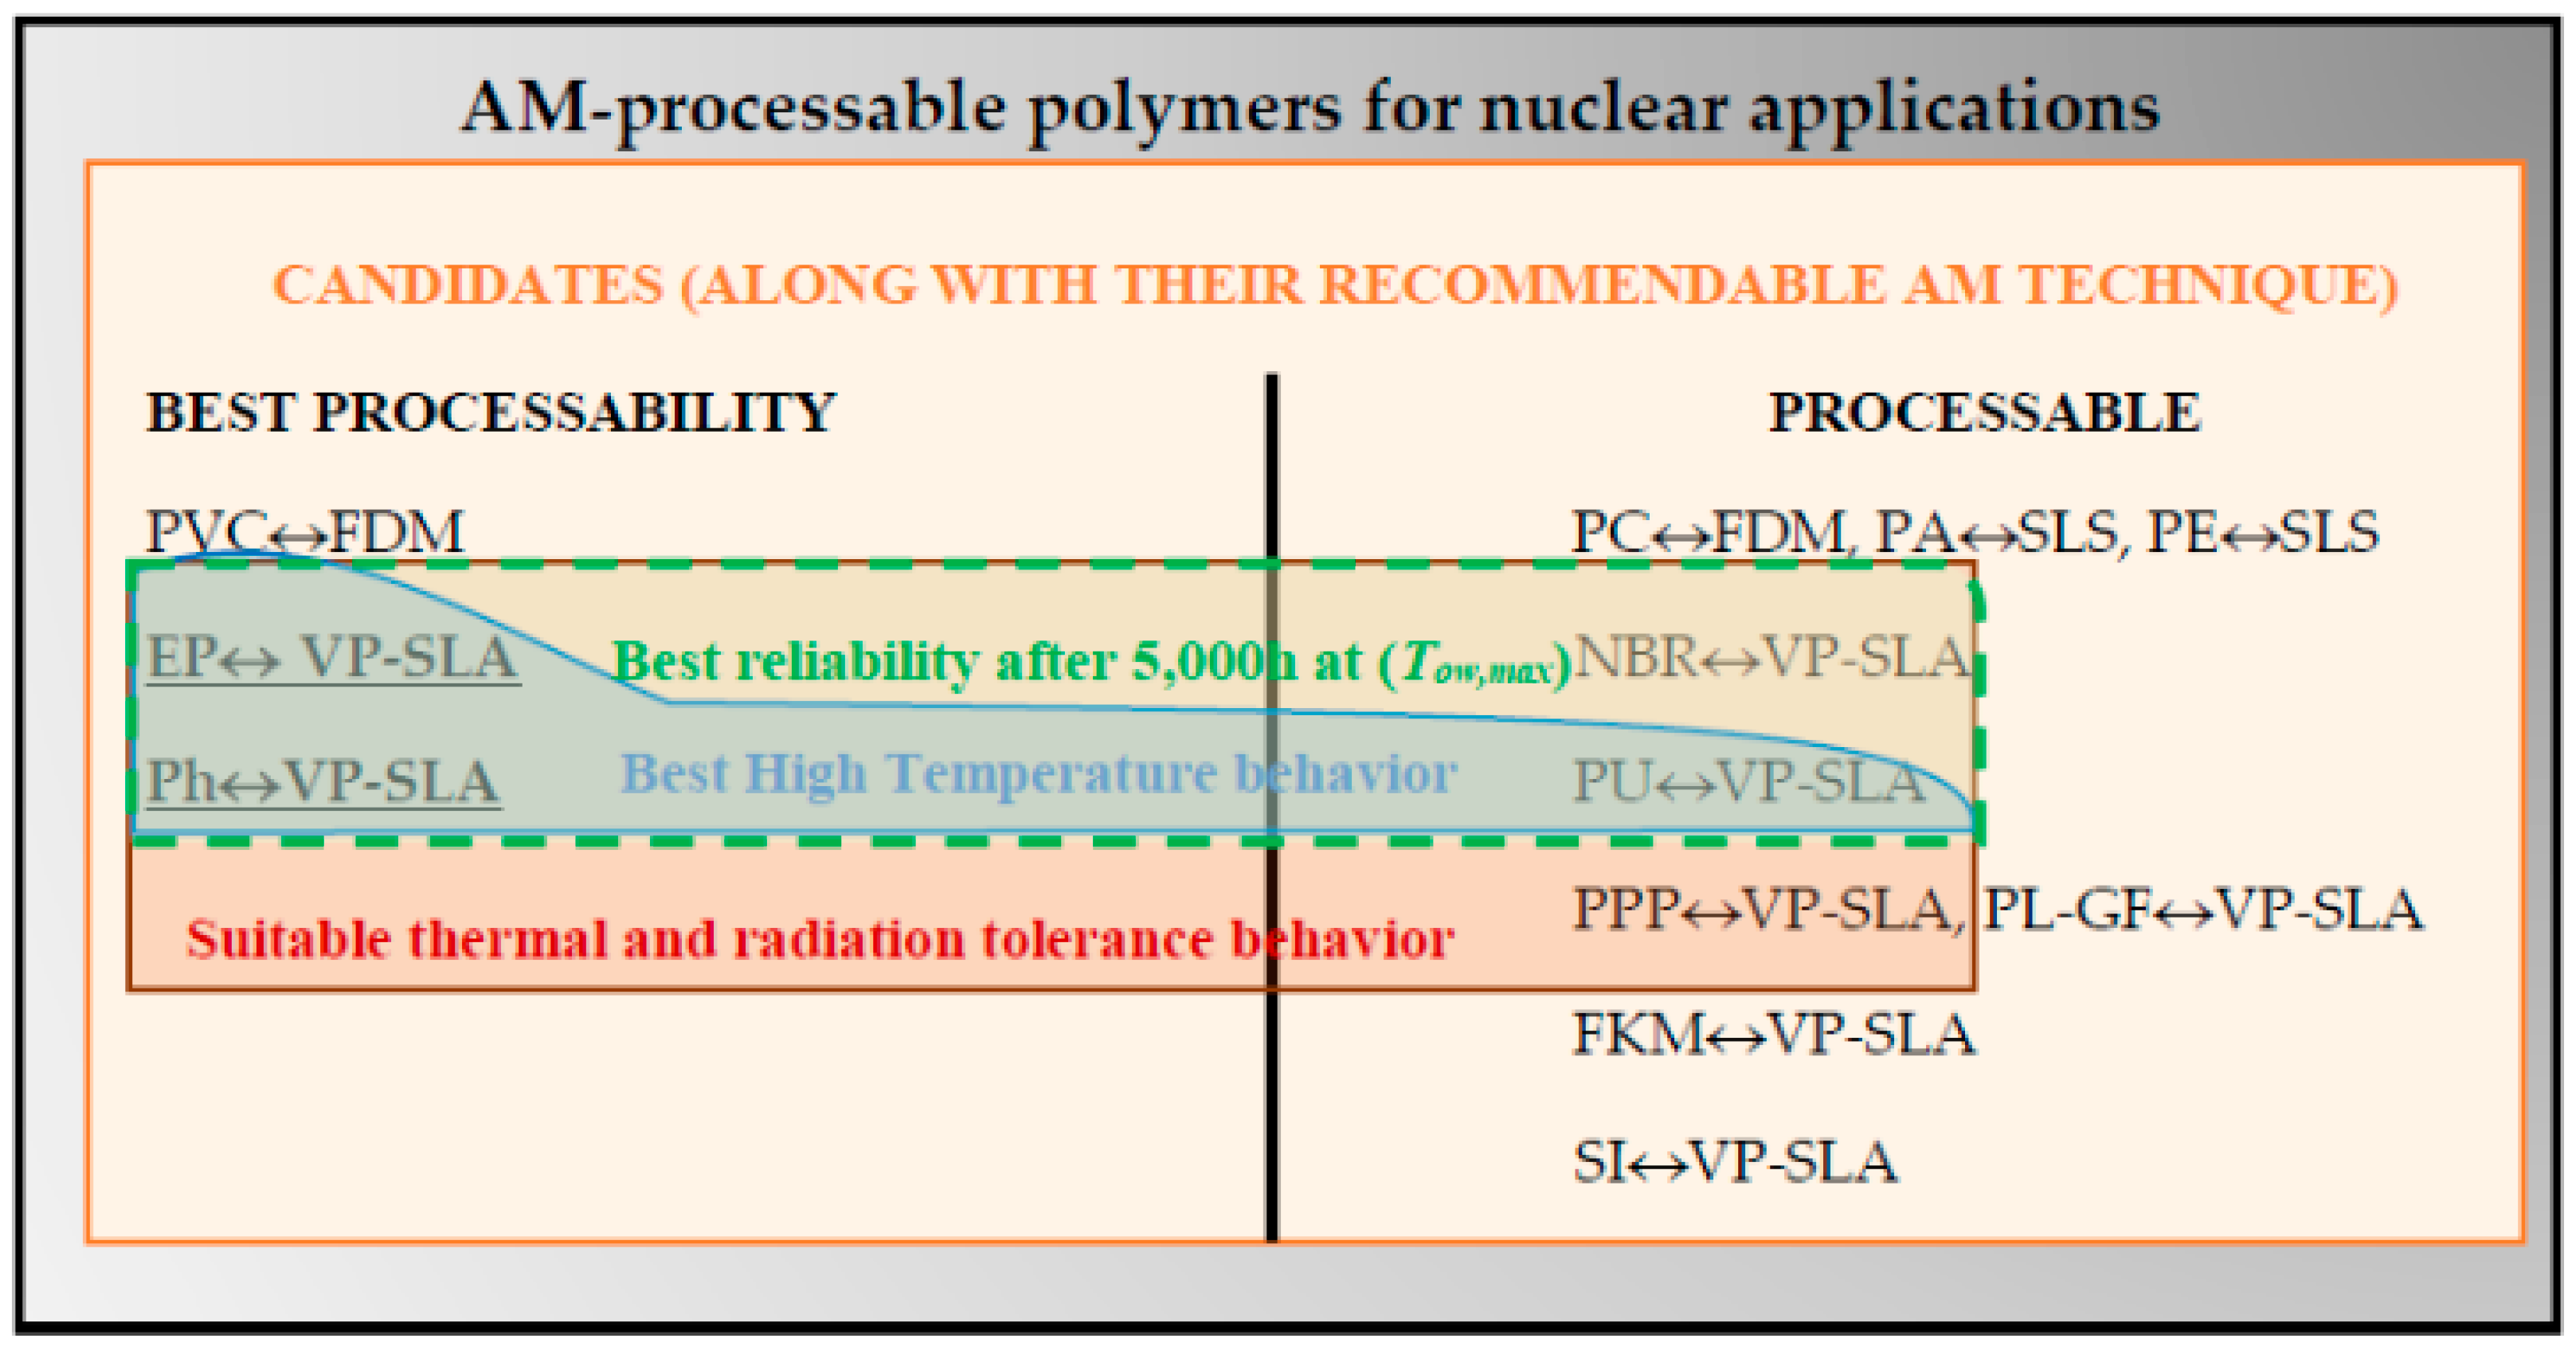
Compatibility between material and their associated AM technique: for FDM, PVC and PC are the best options to control the heat input. For SLS, PA is the unique adequate option. On the other hand, considering the thermoplastic PPP and thermosets and elastomers to be processed using VP-SLA, only PPP, EP and Ph are suitable considering this heat input control criterion.


