
Fabrication of Gelatin Nanofibers by Electrospinning—Mixture of Gelatin and Polyvinyl Alcohol

 , and
, and
Abstract
:1. Introduction
2. Experimental Procedure
2.1. Substrate and Materials
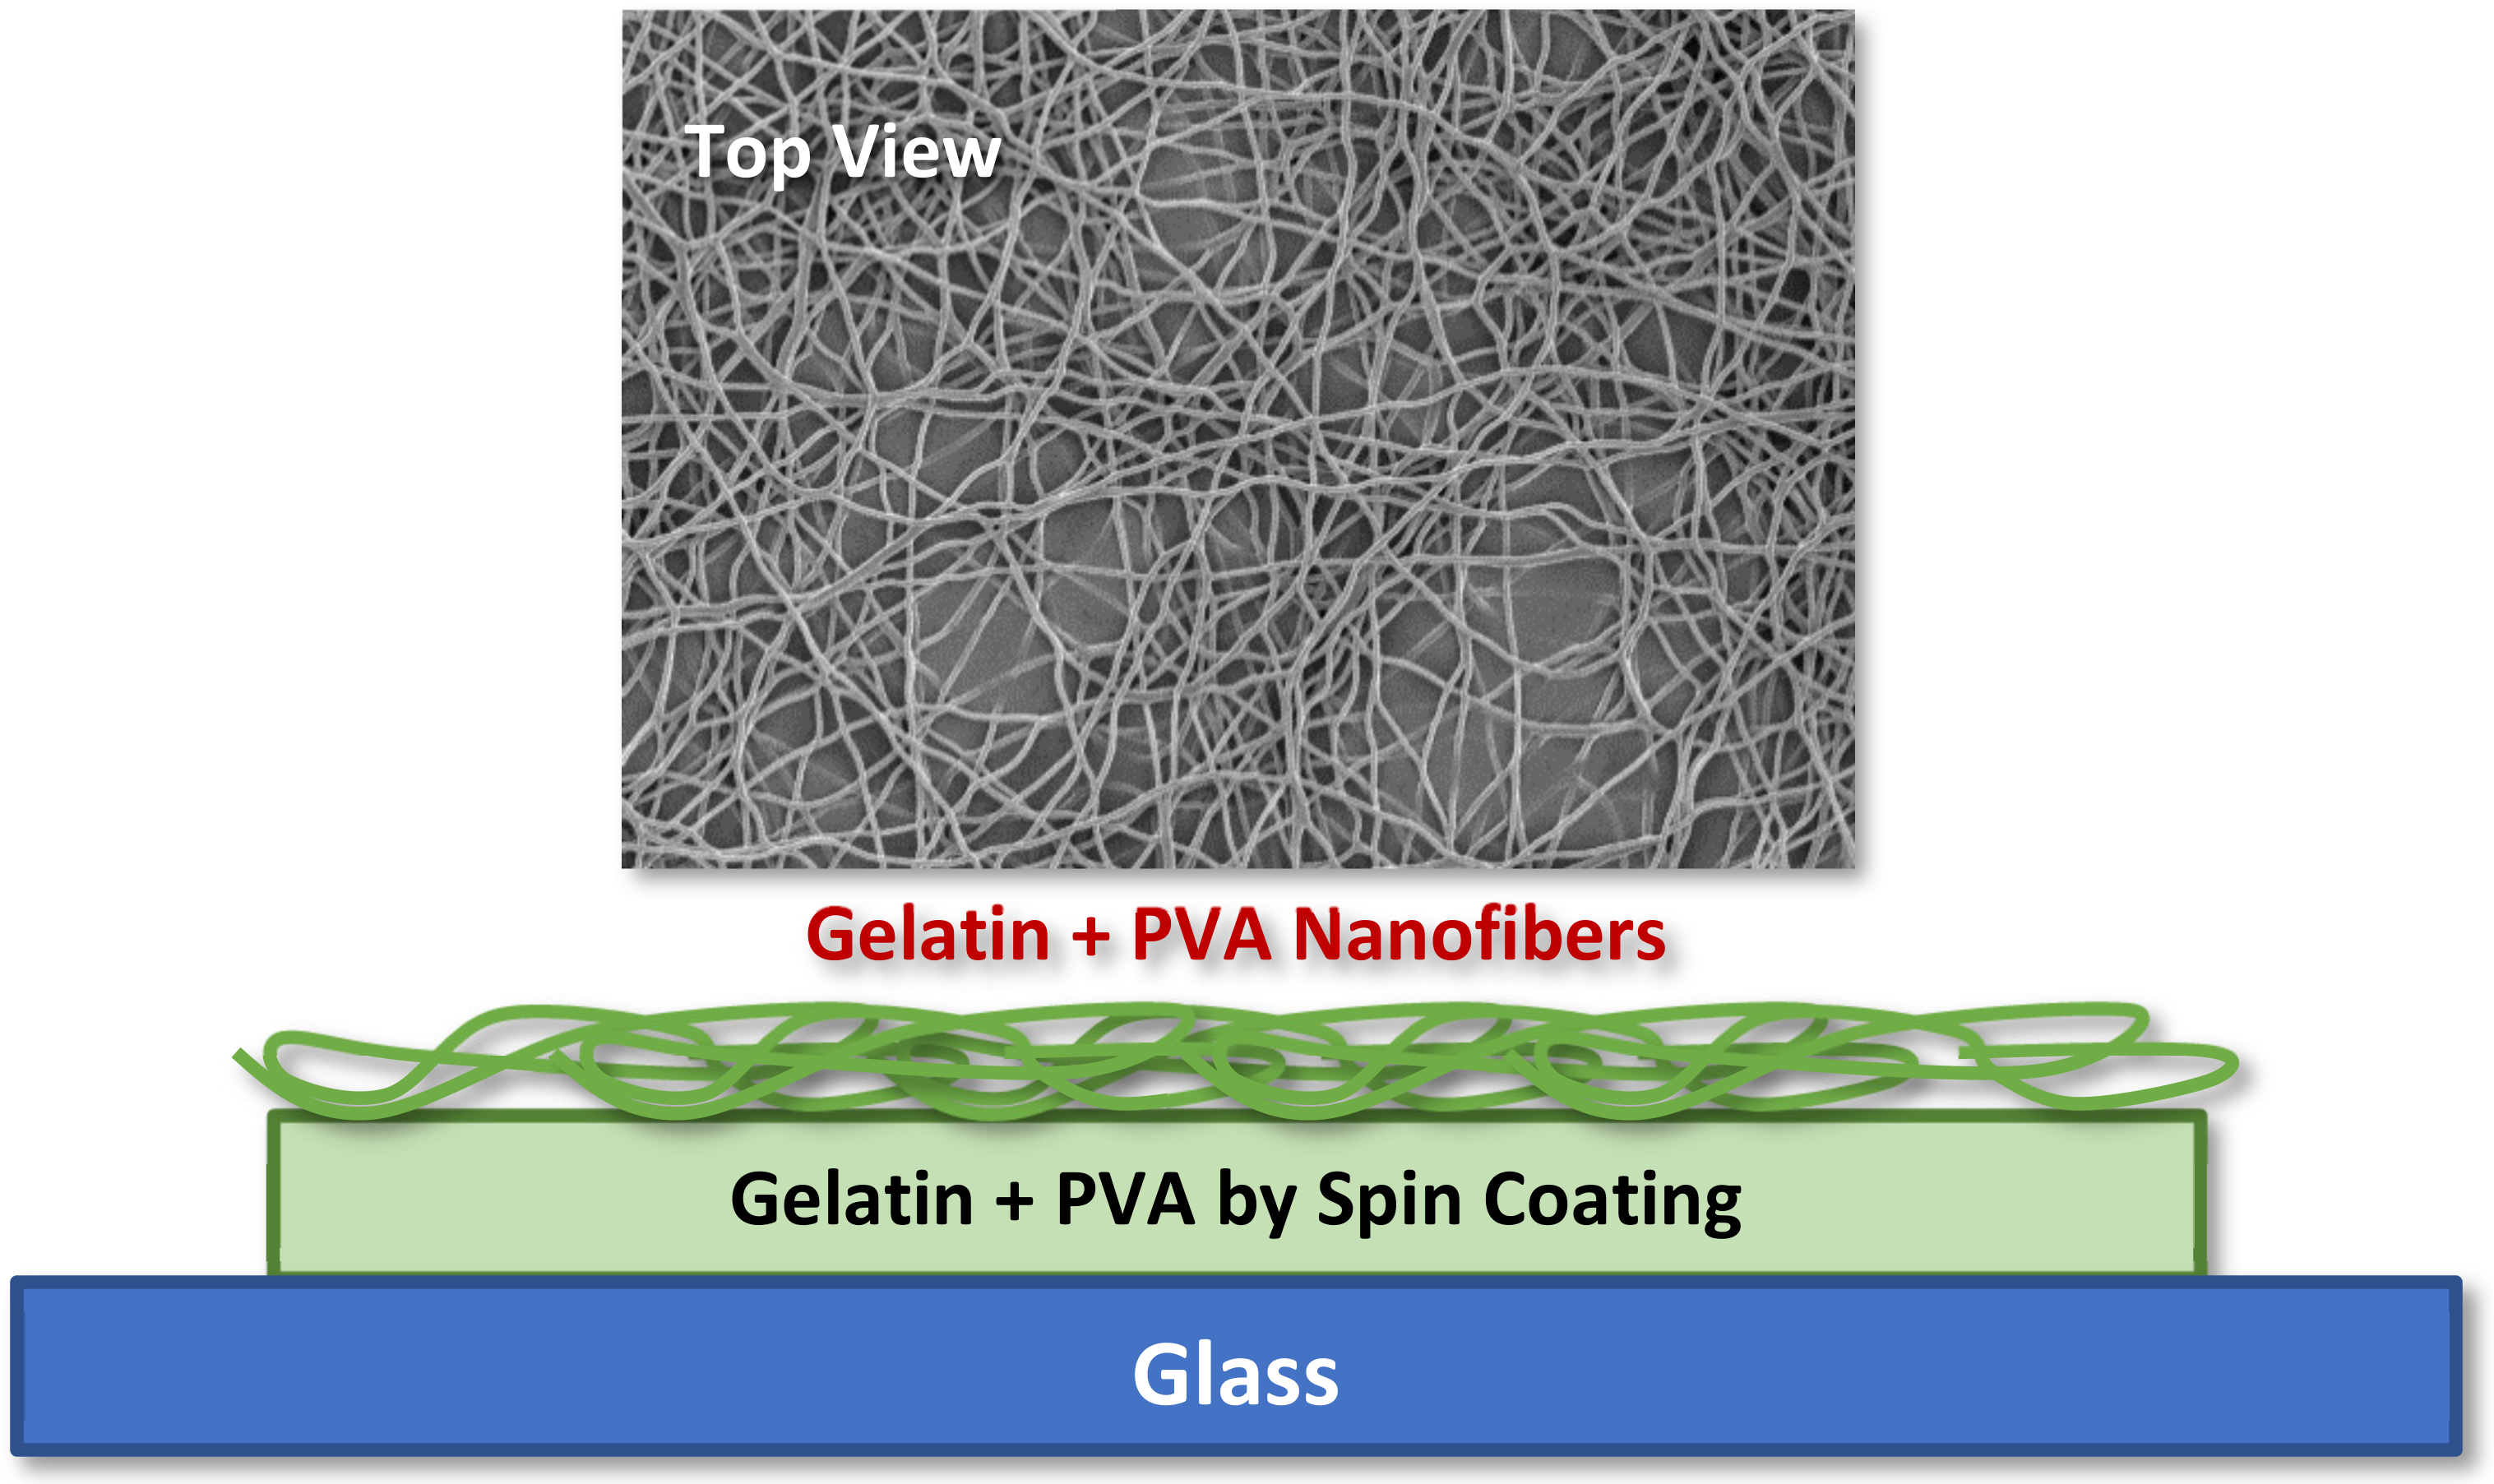
2.2. Spin Coating
2.3. Electrospinning
2.4. Characterization
2.4.1. Viscosity of Polymer Solution
2.4.2. Electrical Conductivity and pH Value of Polymer Solution
2.4.3. Surface Tension of Polymer Solution
2.4.4. Surface Morphology of Layer Film and Nanofibers
2.4.5. Chemical Element Analysis of Layer Film and Nanofibers
2.4.6. Molecular Structure of Layer Film and Nanofibers
2.4.7. Contact Angle of Layer Film and Nanofibers
3. In Vitro Cell Culture
3.1. Cell Preparation
3.2. Cell Viability Test
3.3. MTT Assay
4. Results
4.1. Characterizations for Polymer Solution
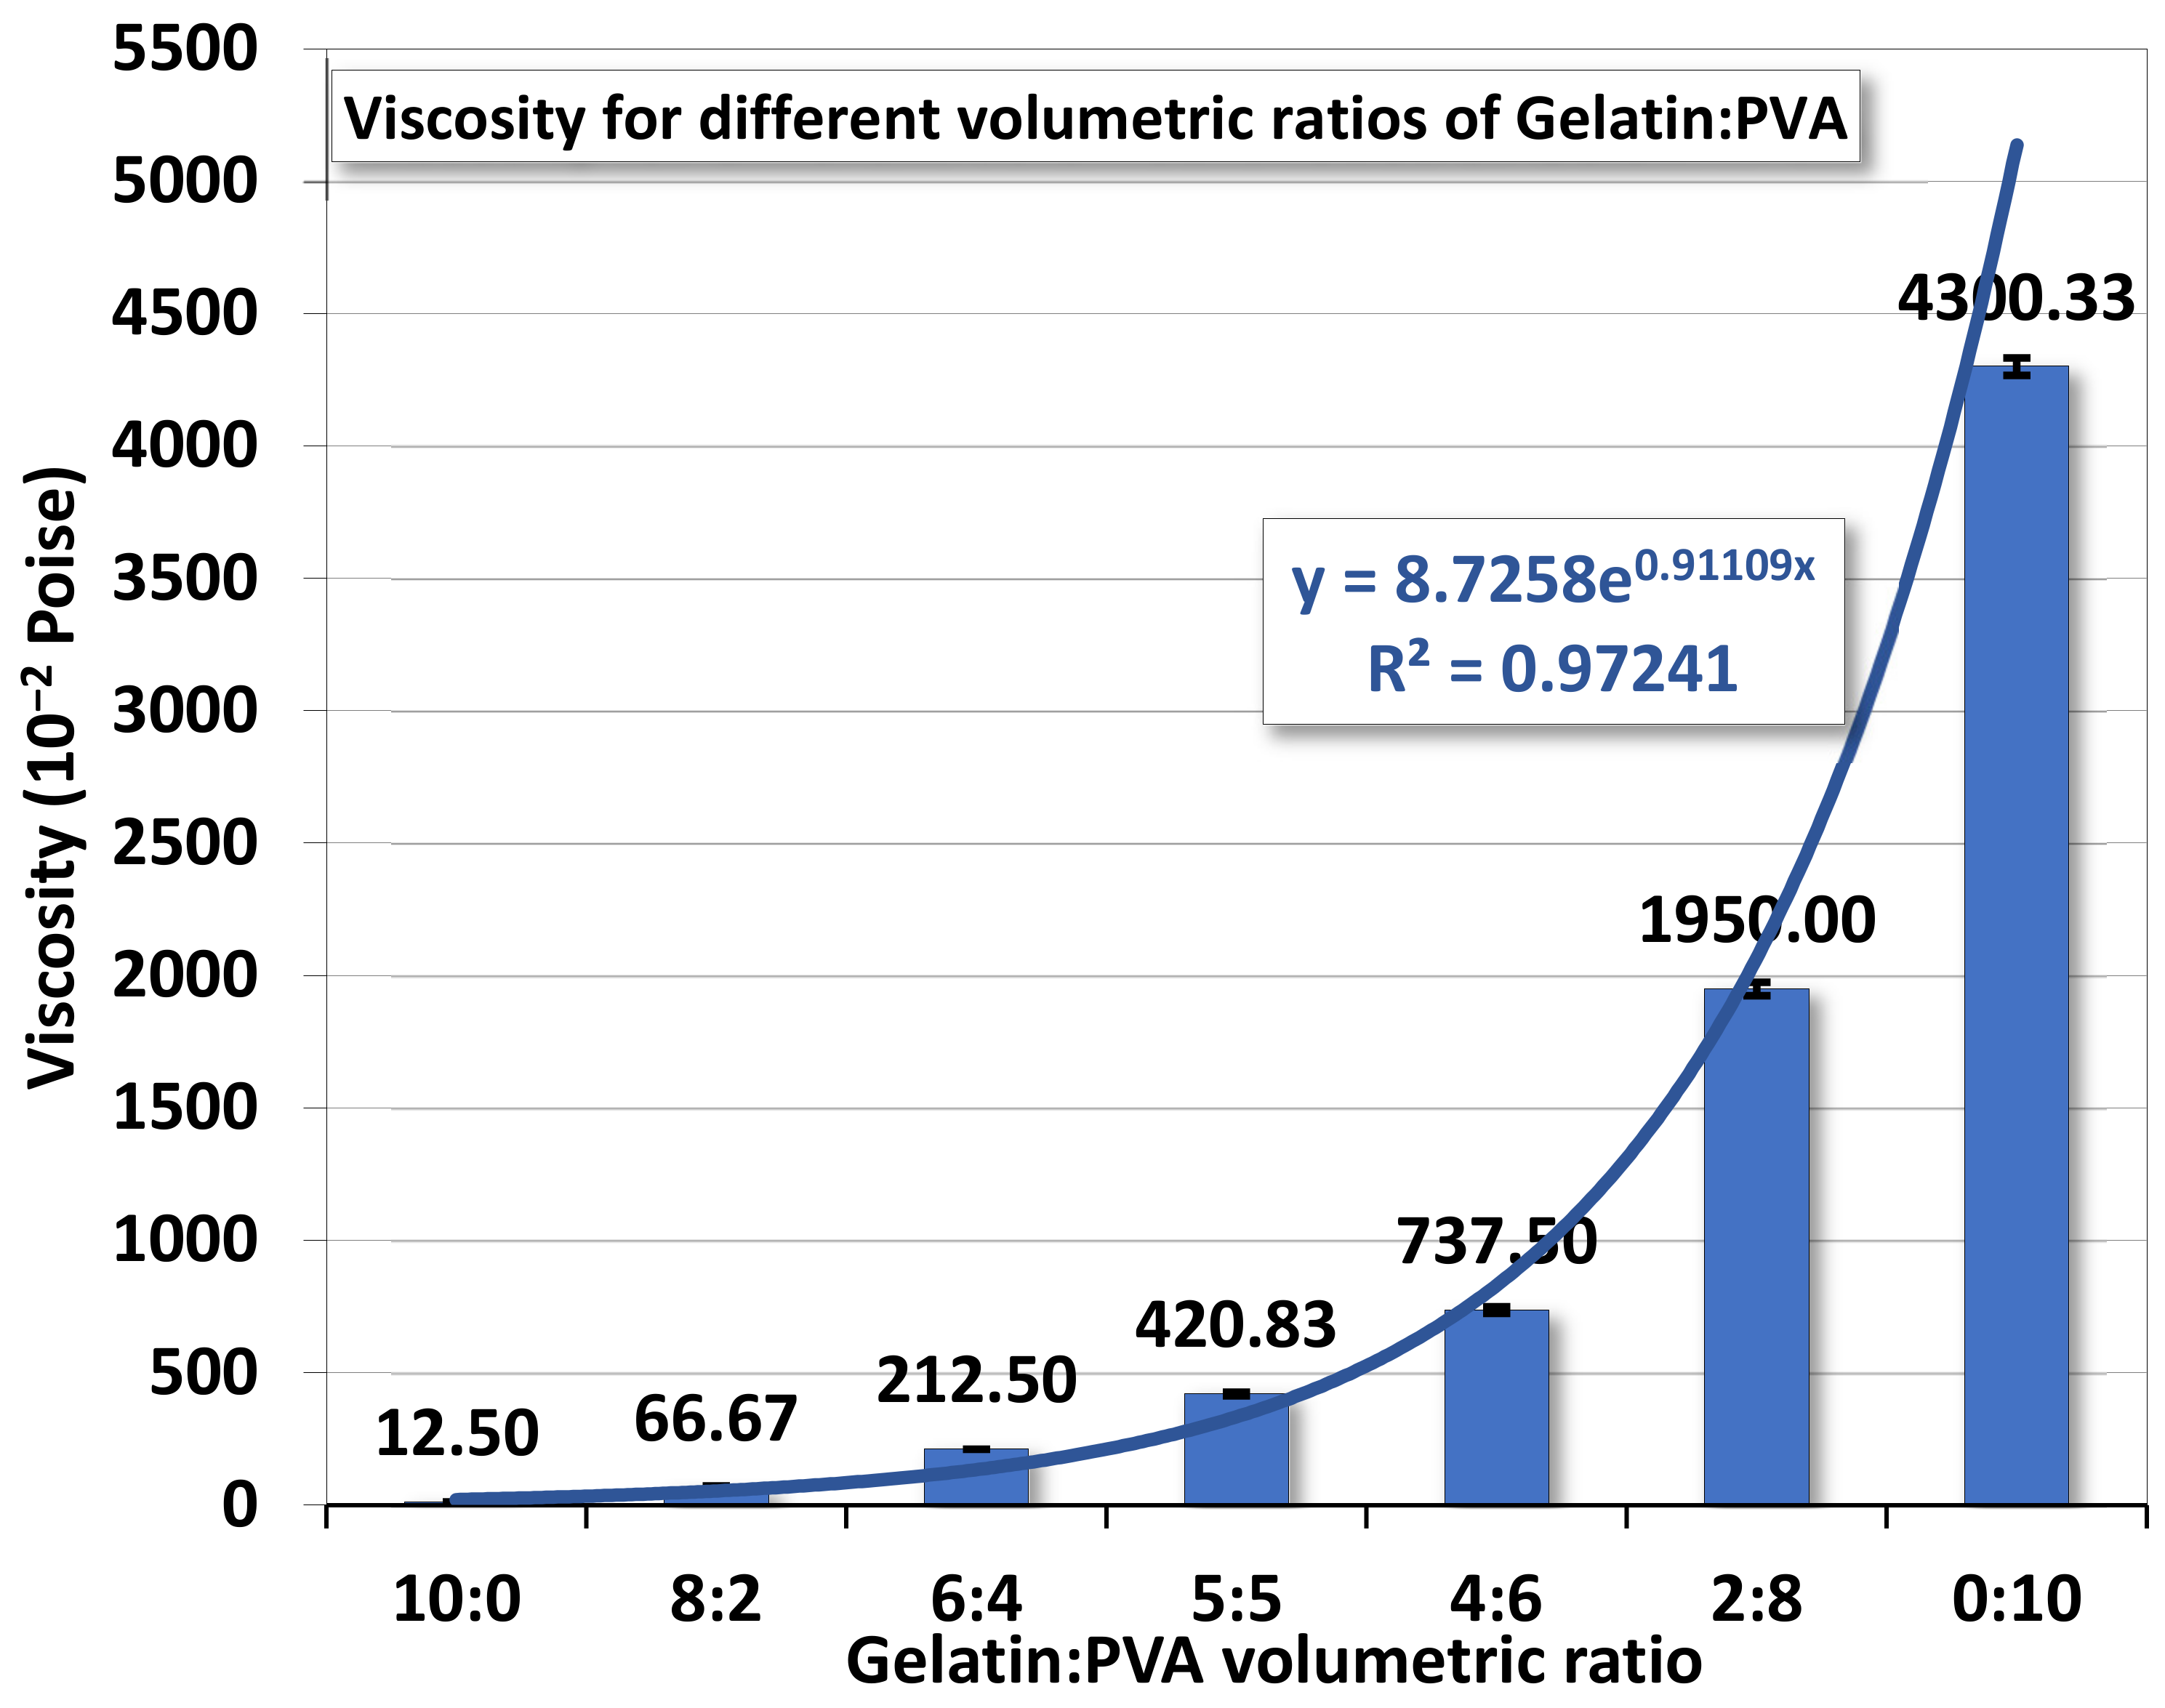
4.1.1. Viscosity
 in PVA is better for resisting such water bonding [51].
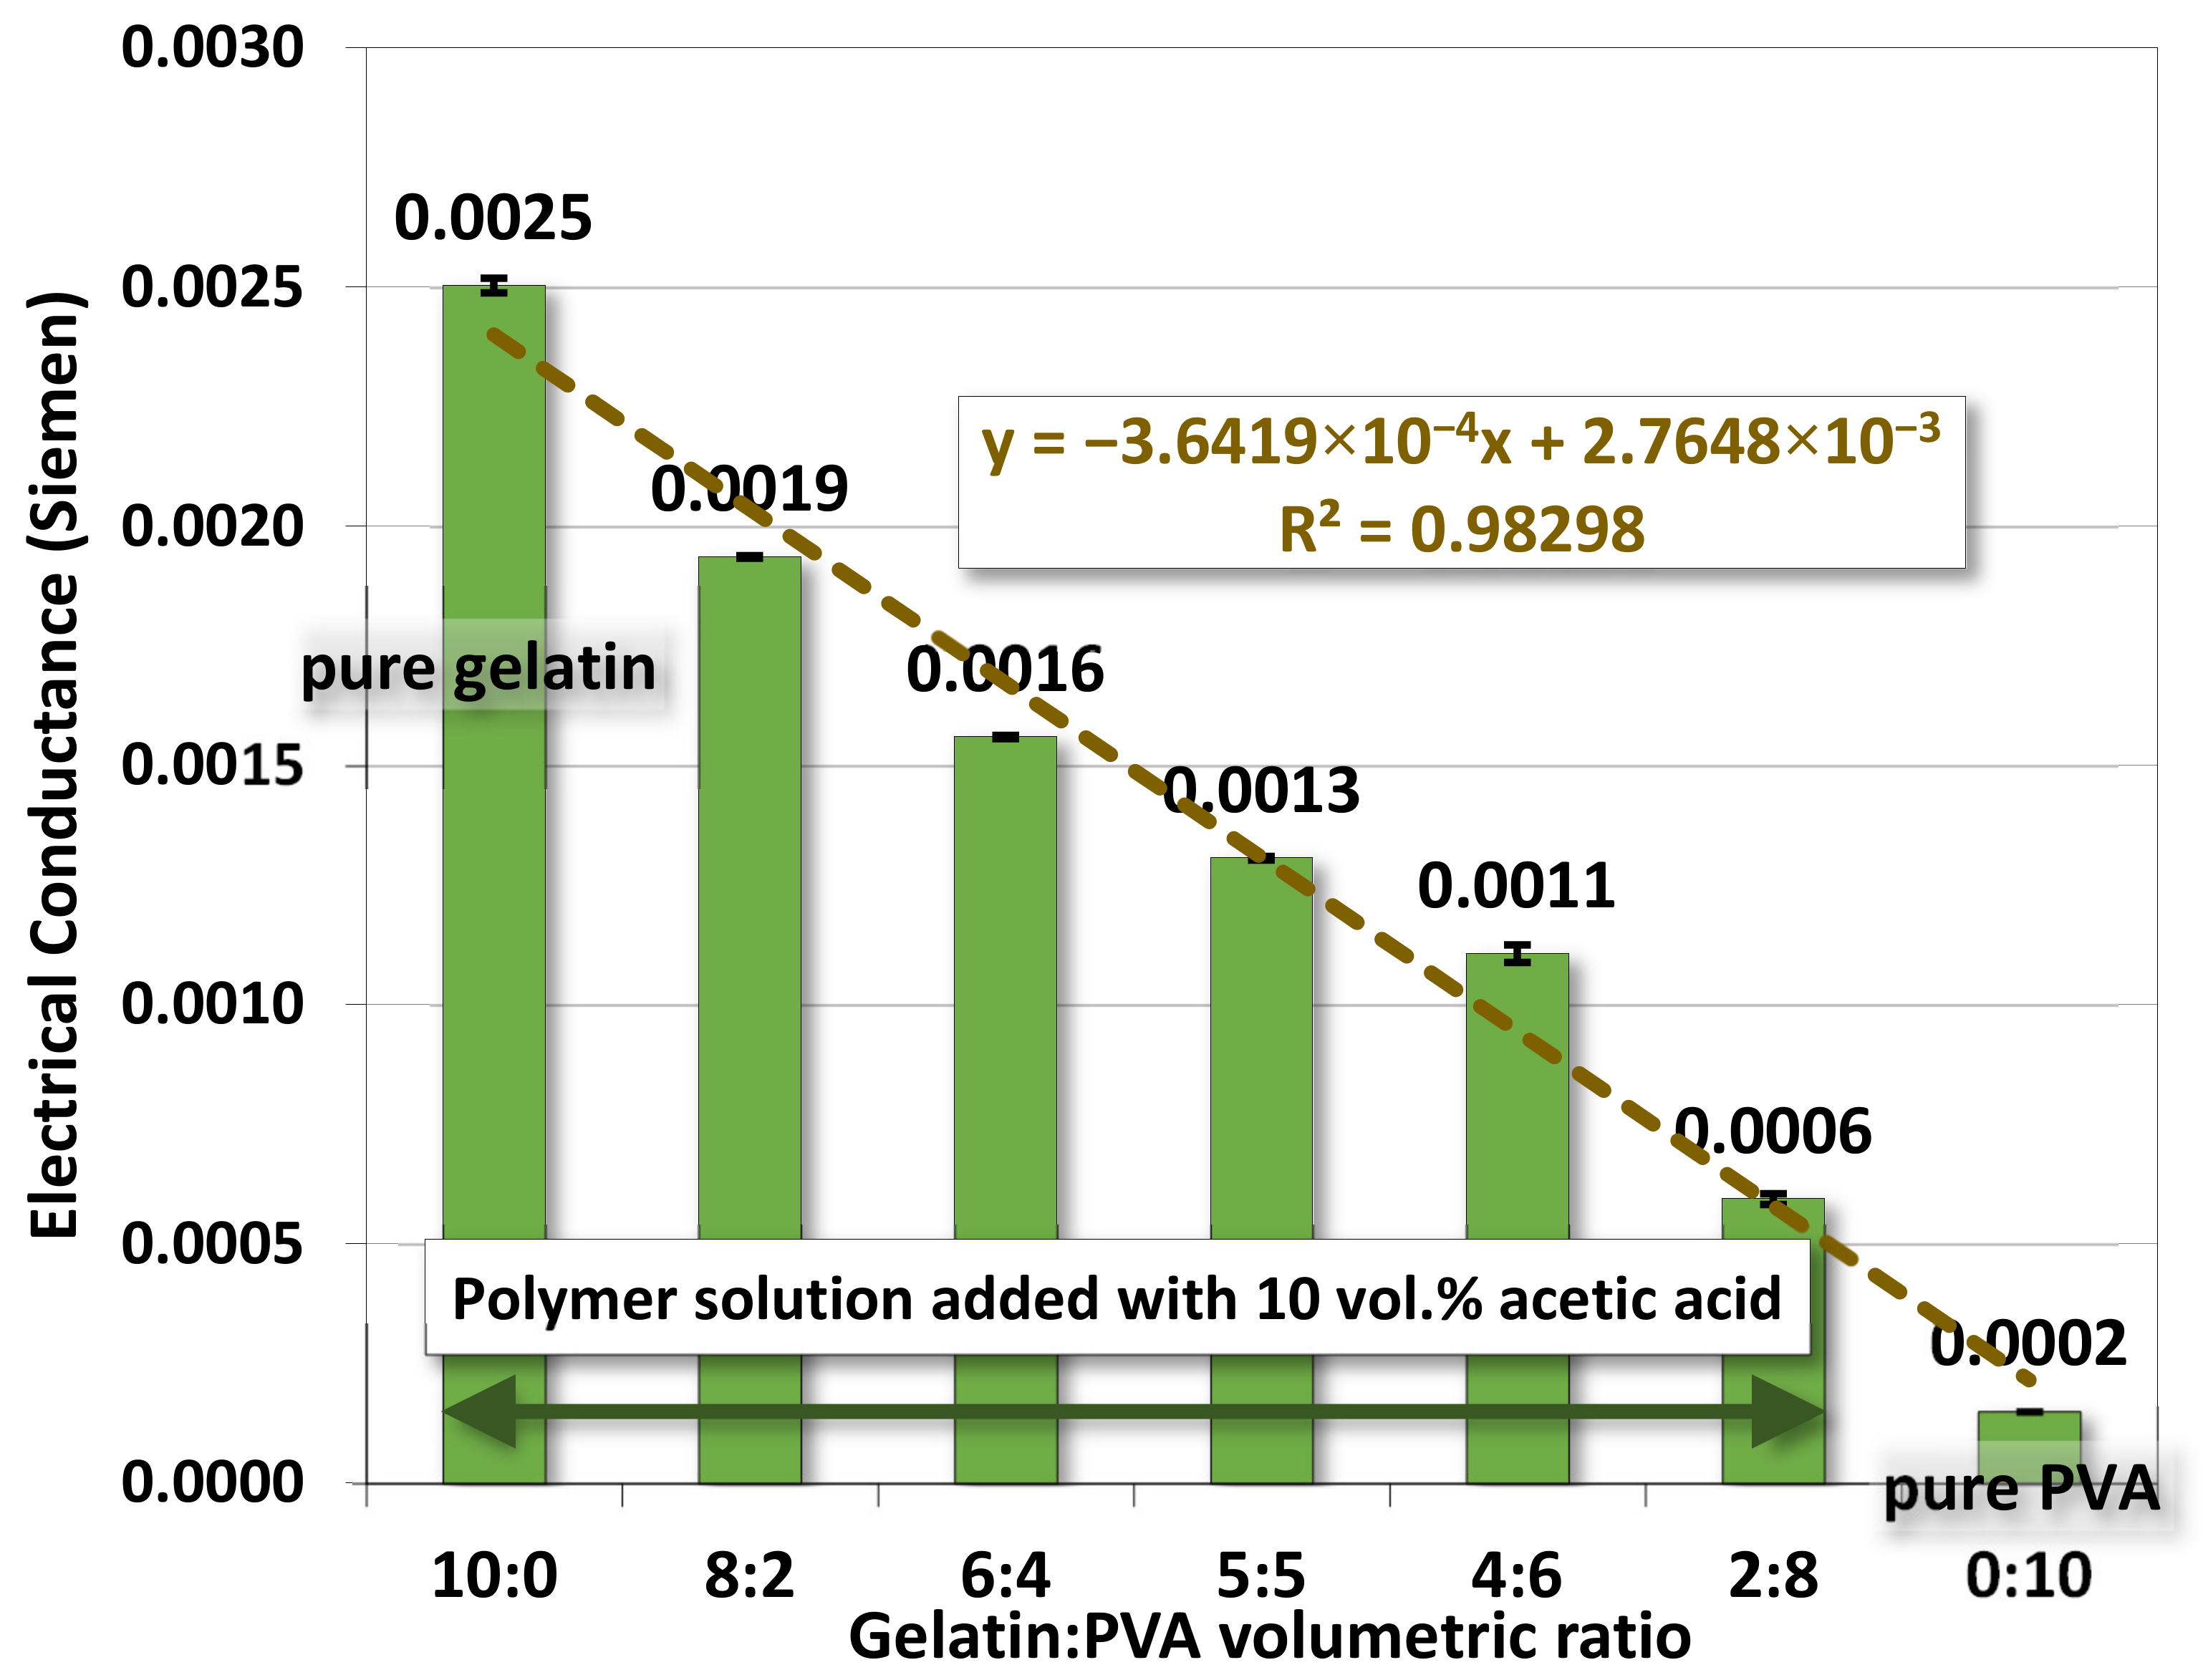
4.1.2. Electrical Conductance
4.1.3. pH Value
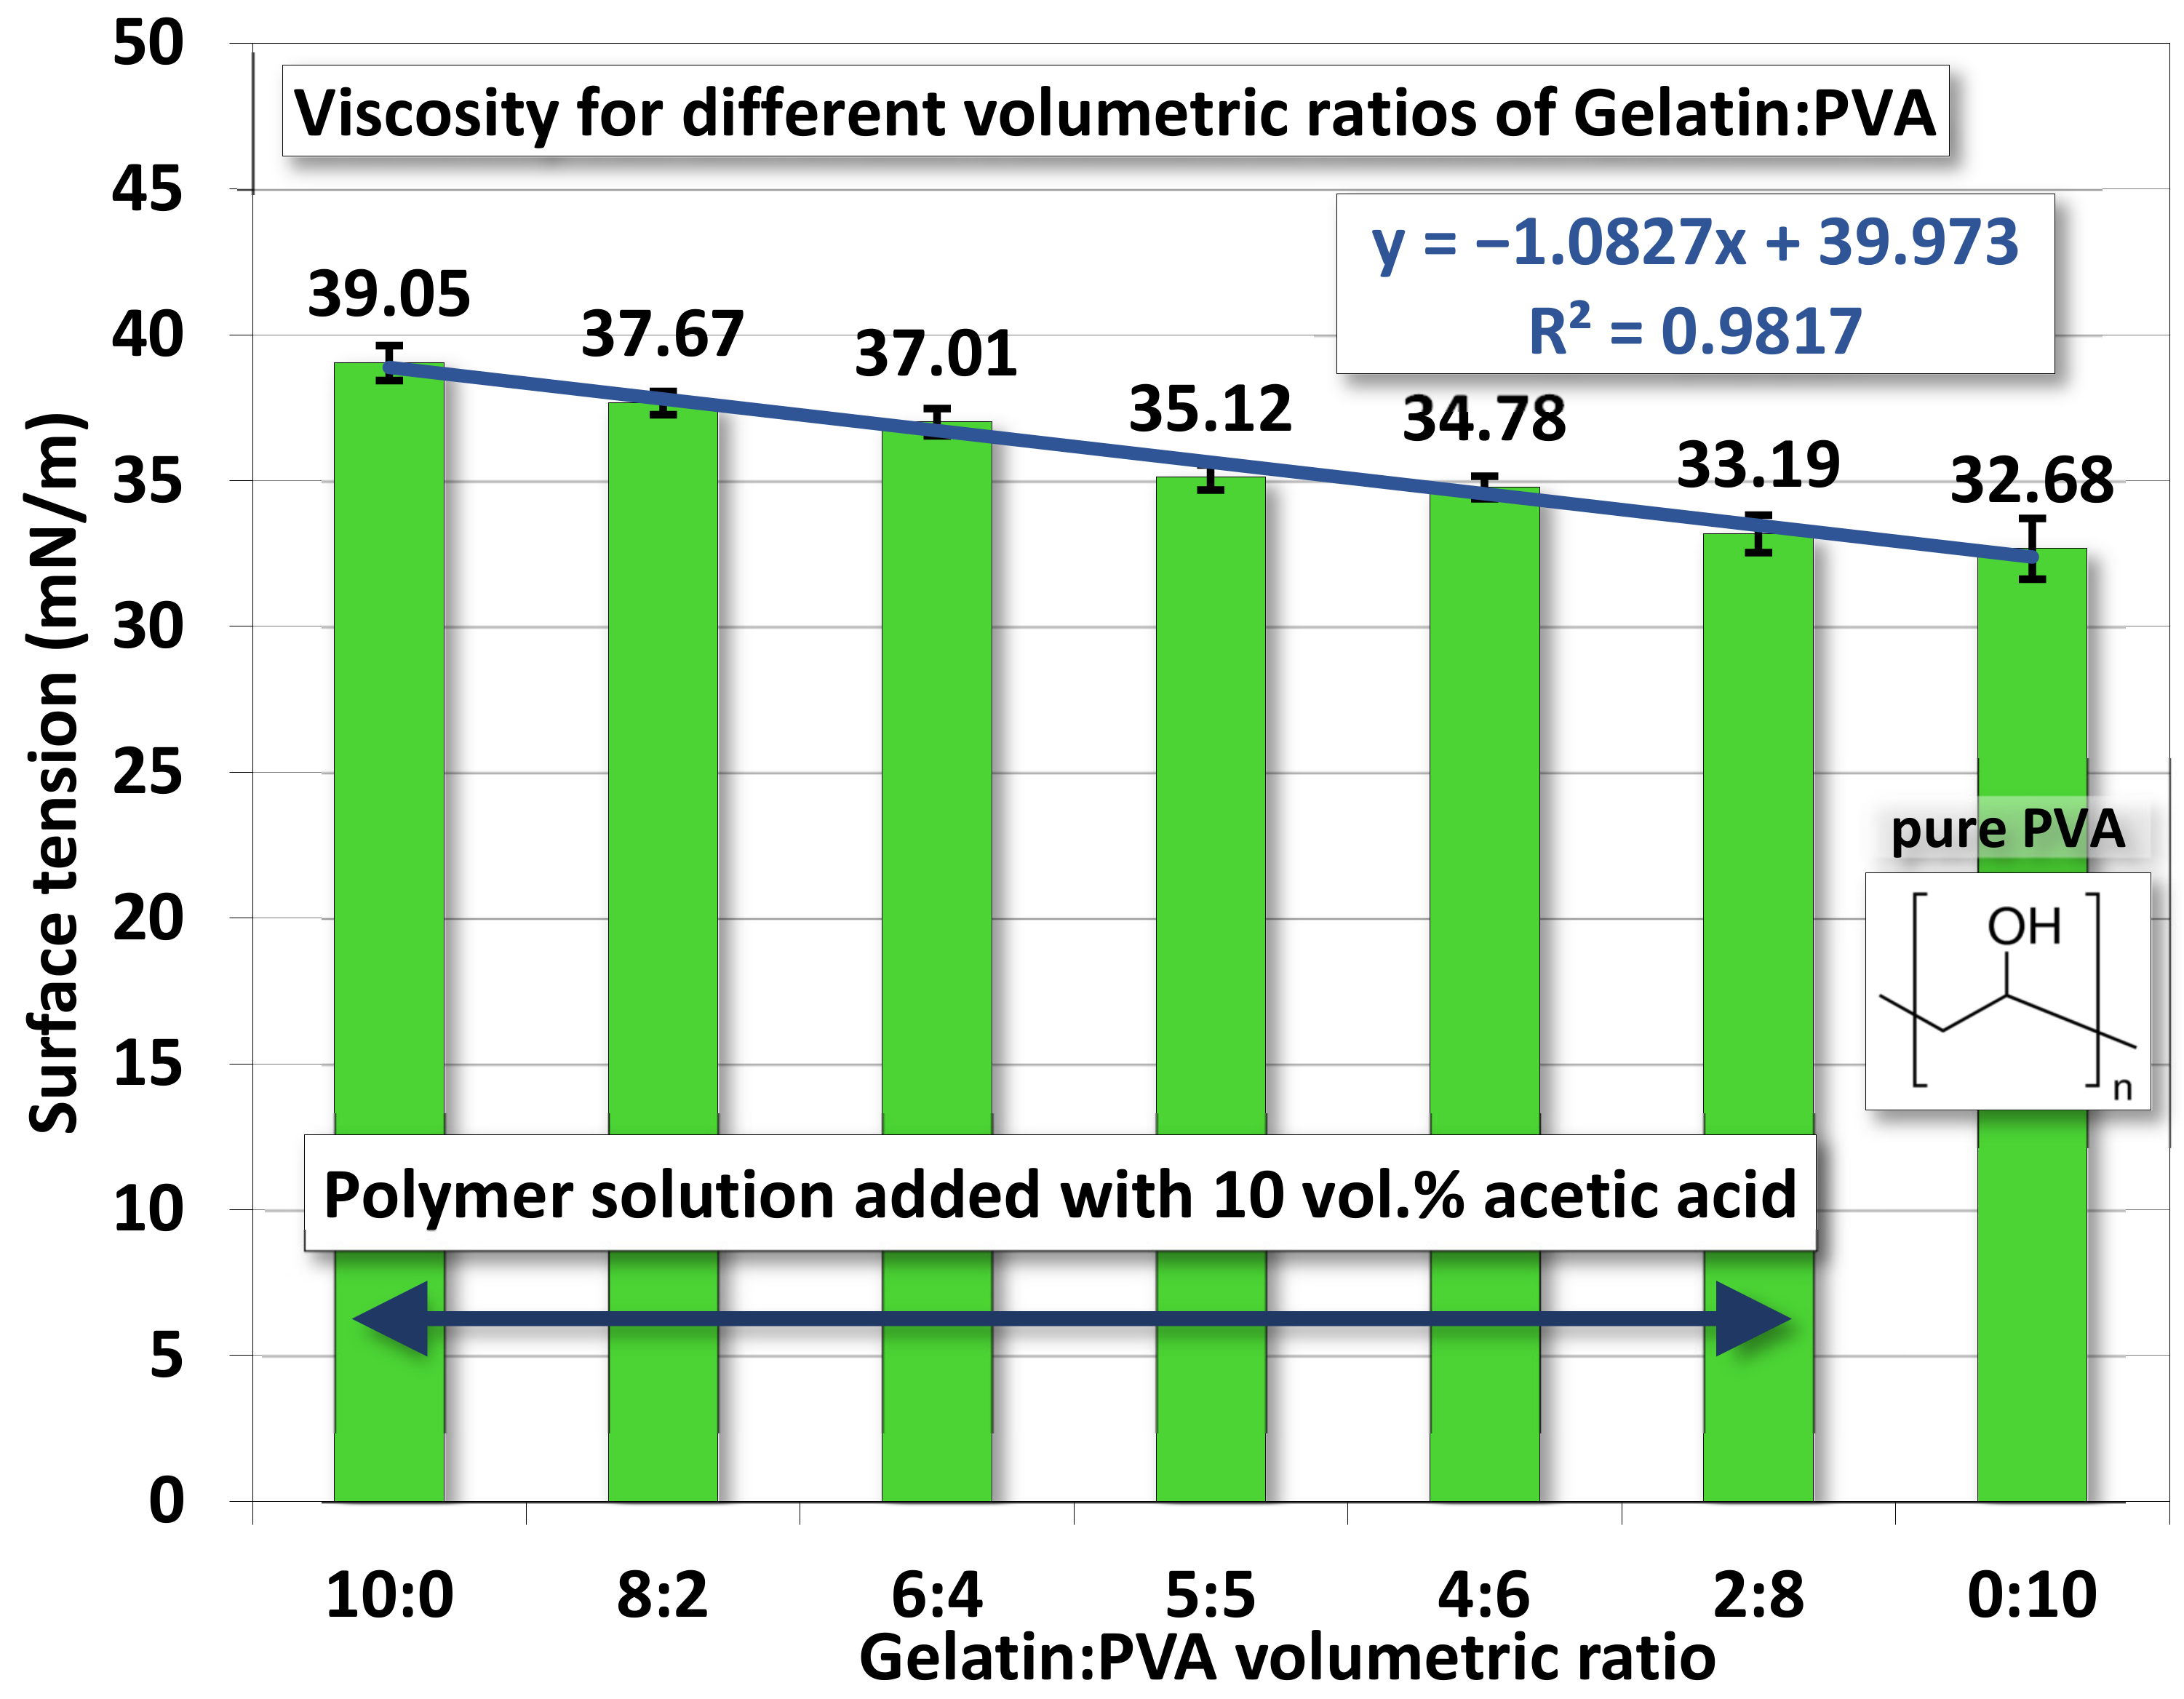
4.1.4. Surface Tension
4.2. Characterizations for Layer Films and Nanofibers
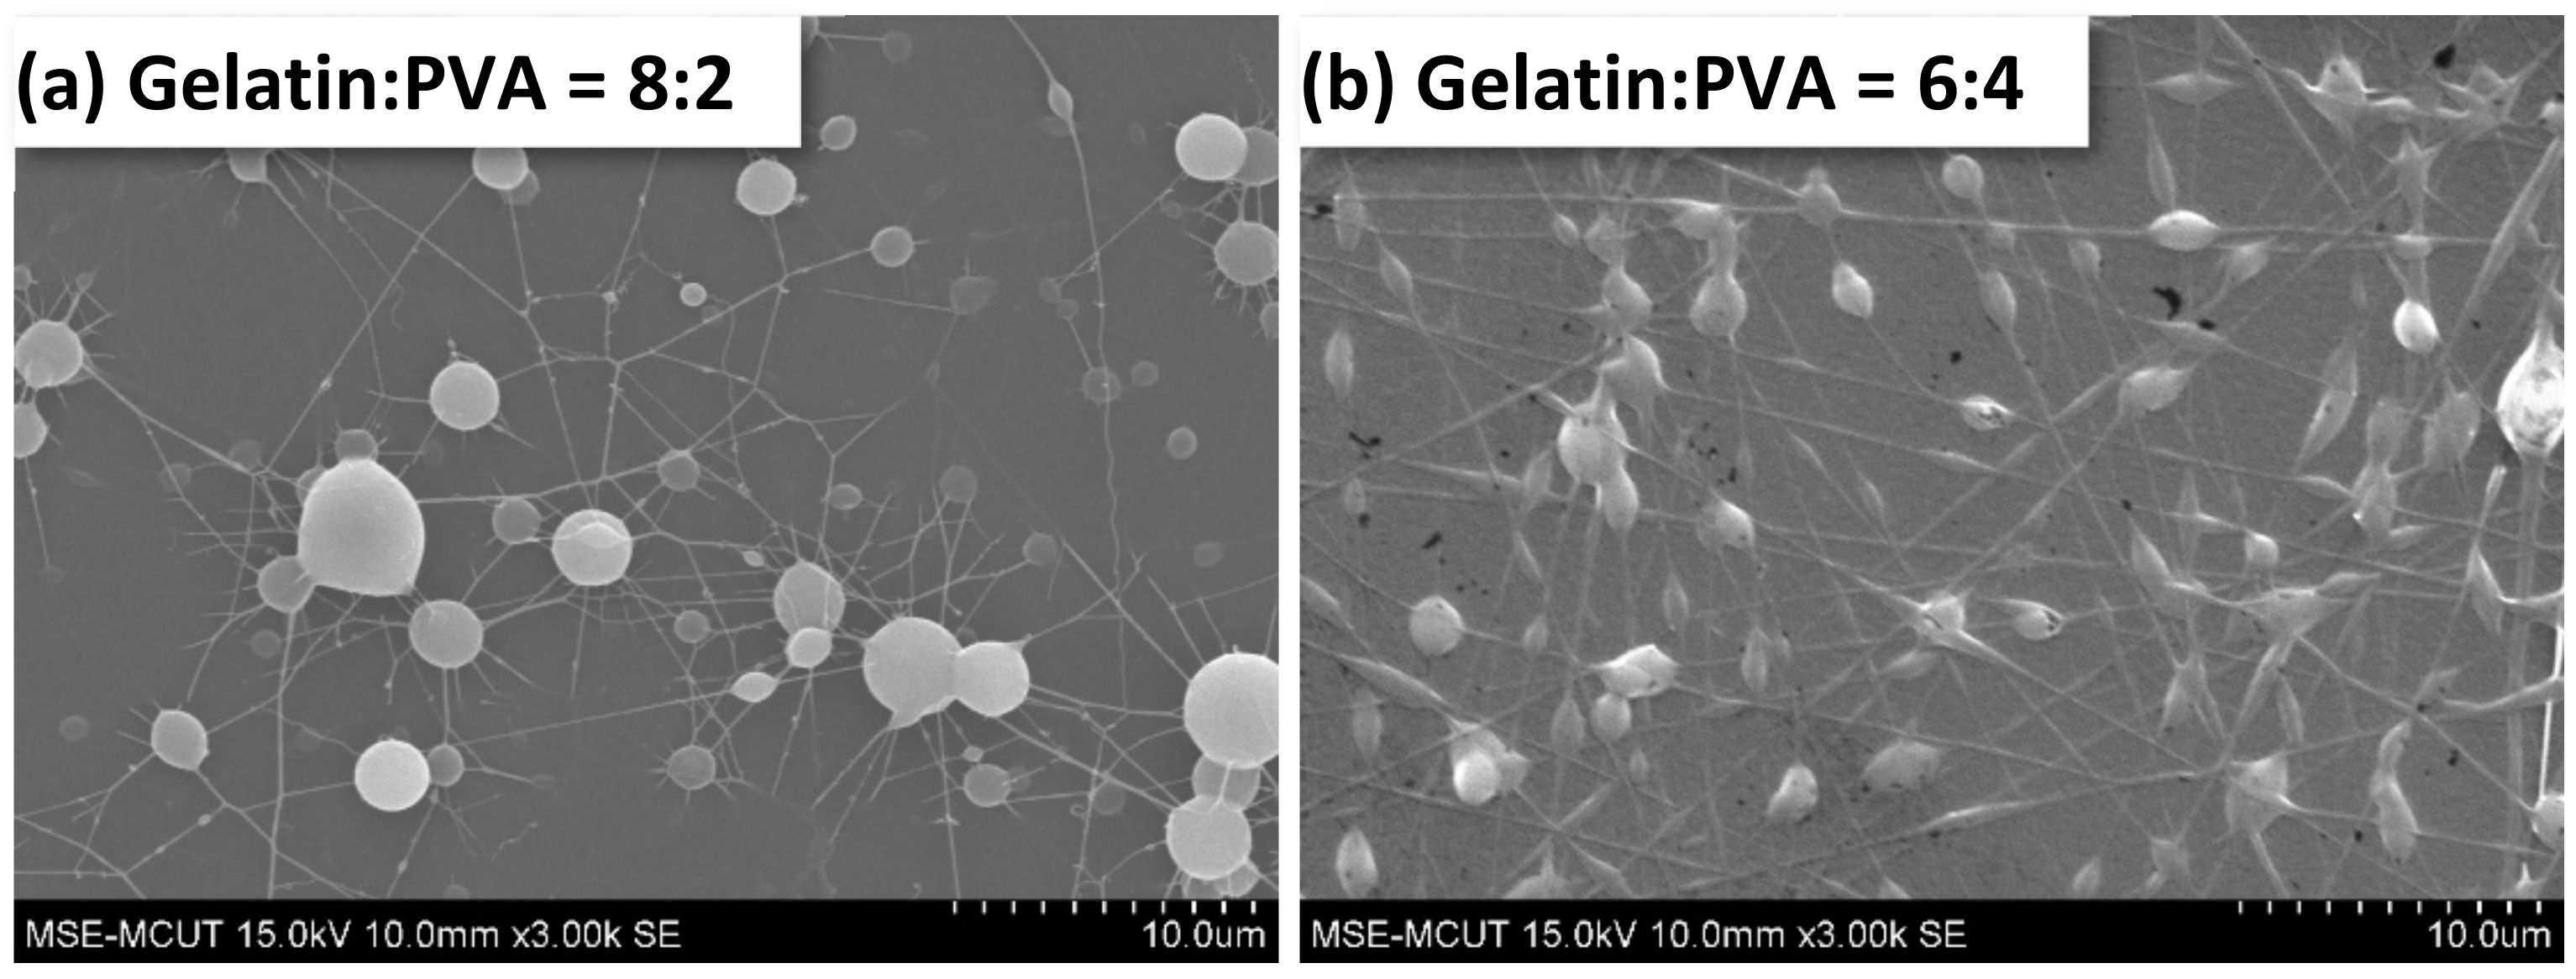
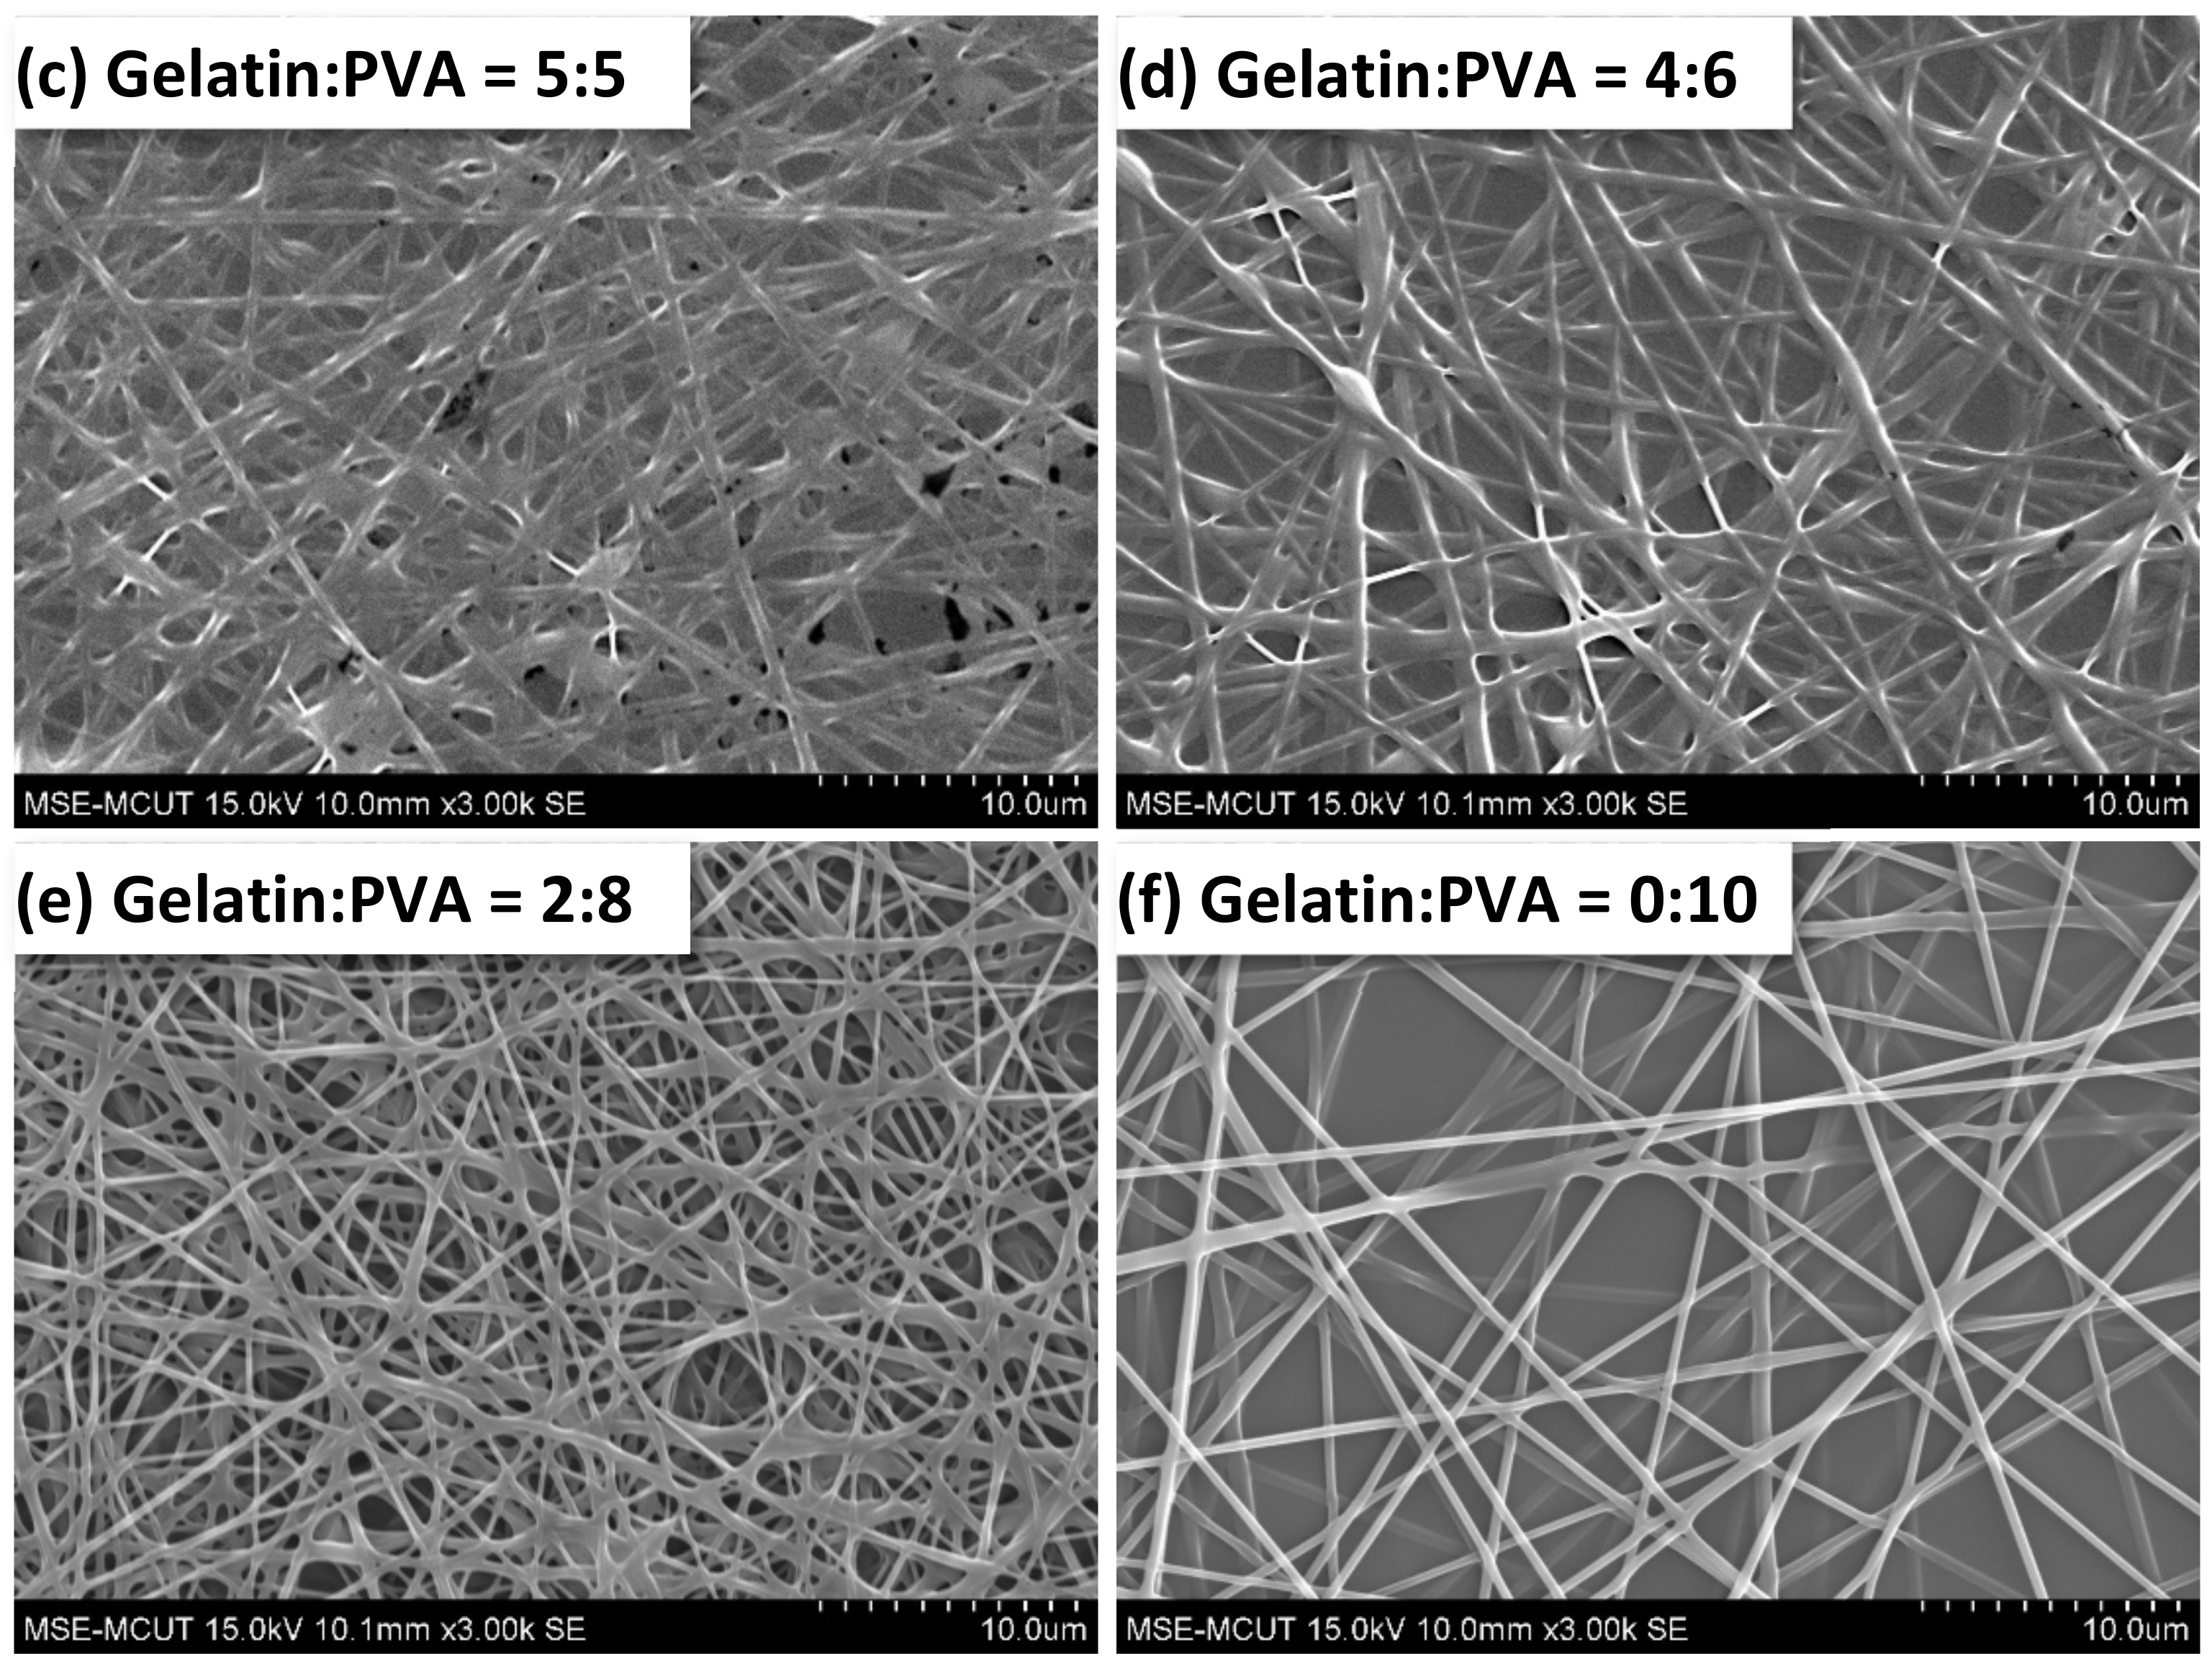
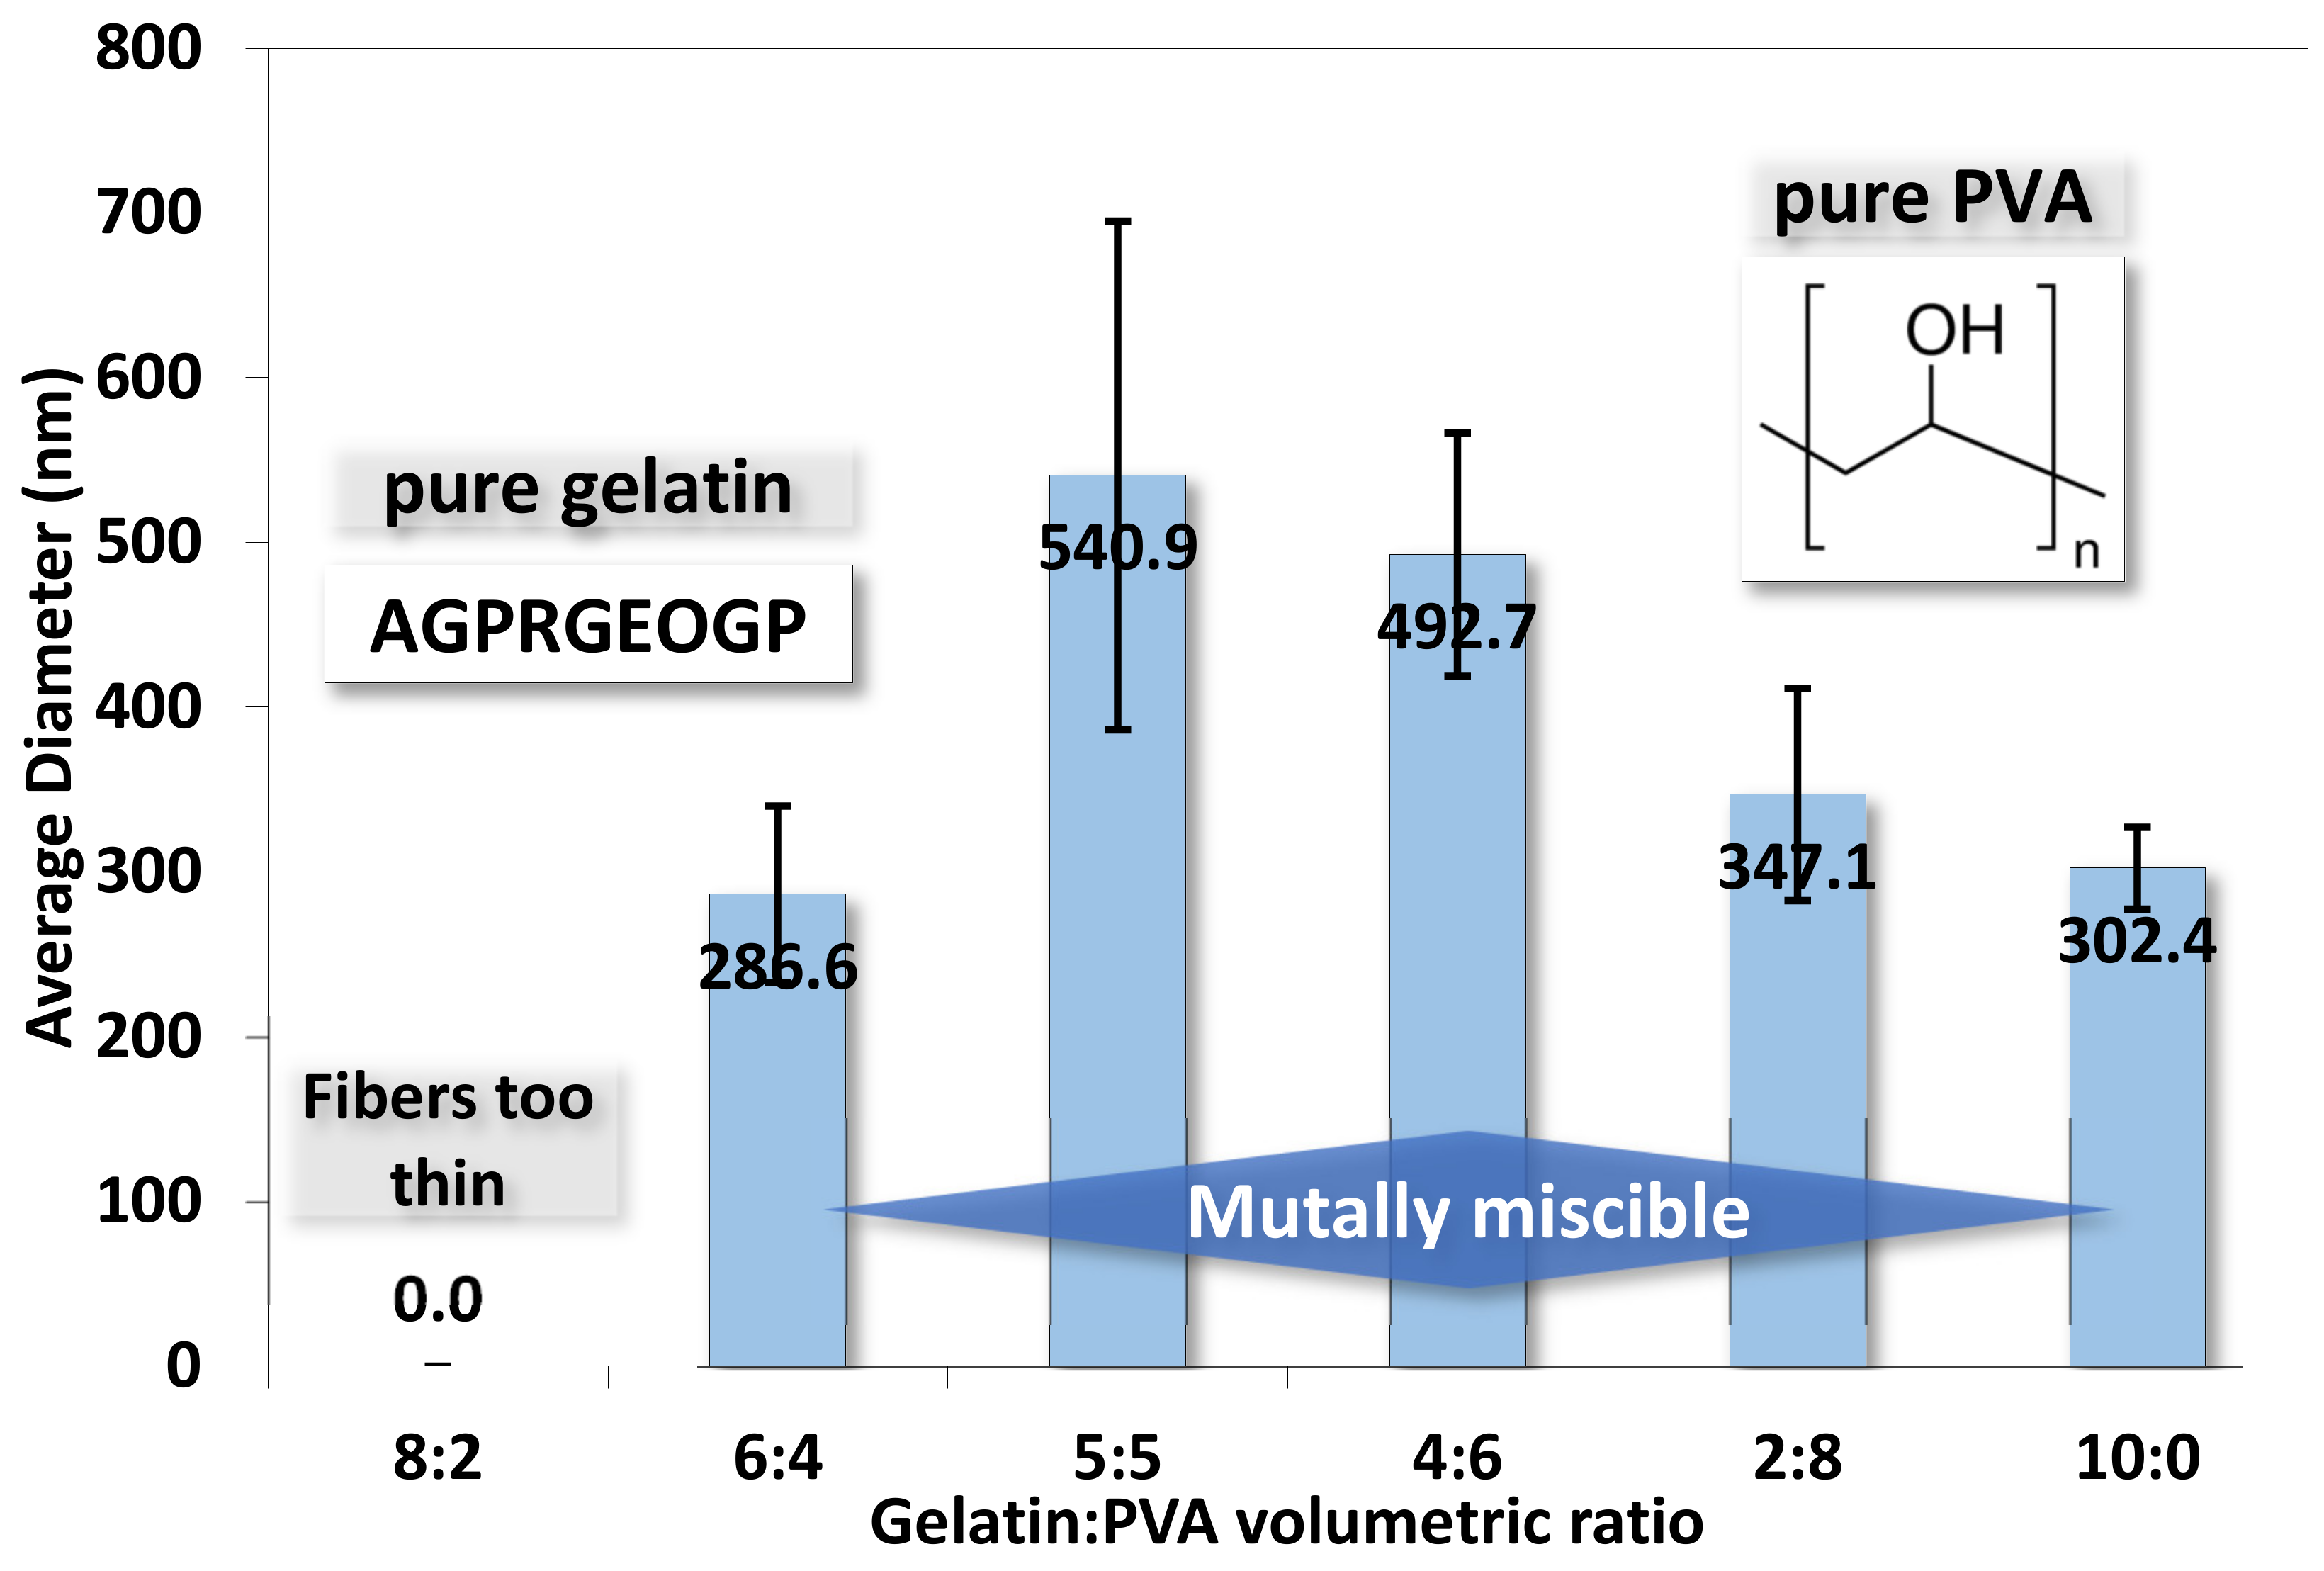
4.2.1. Morphology of Nanofibers
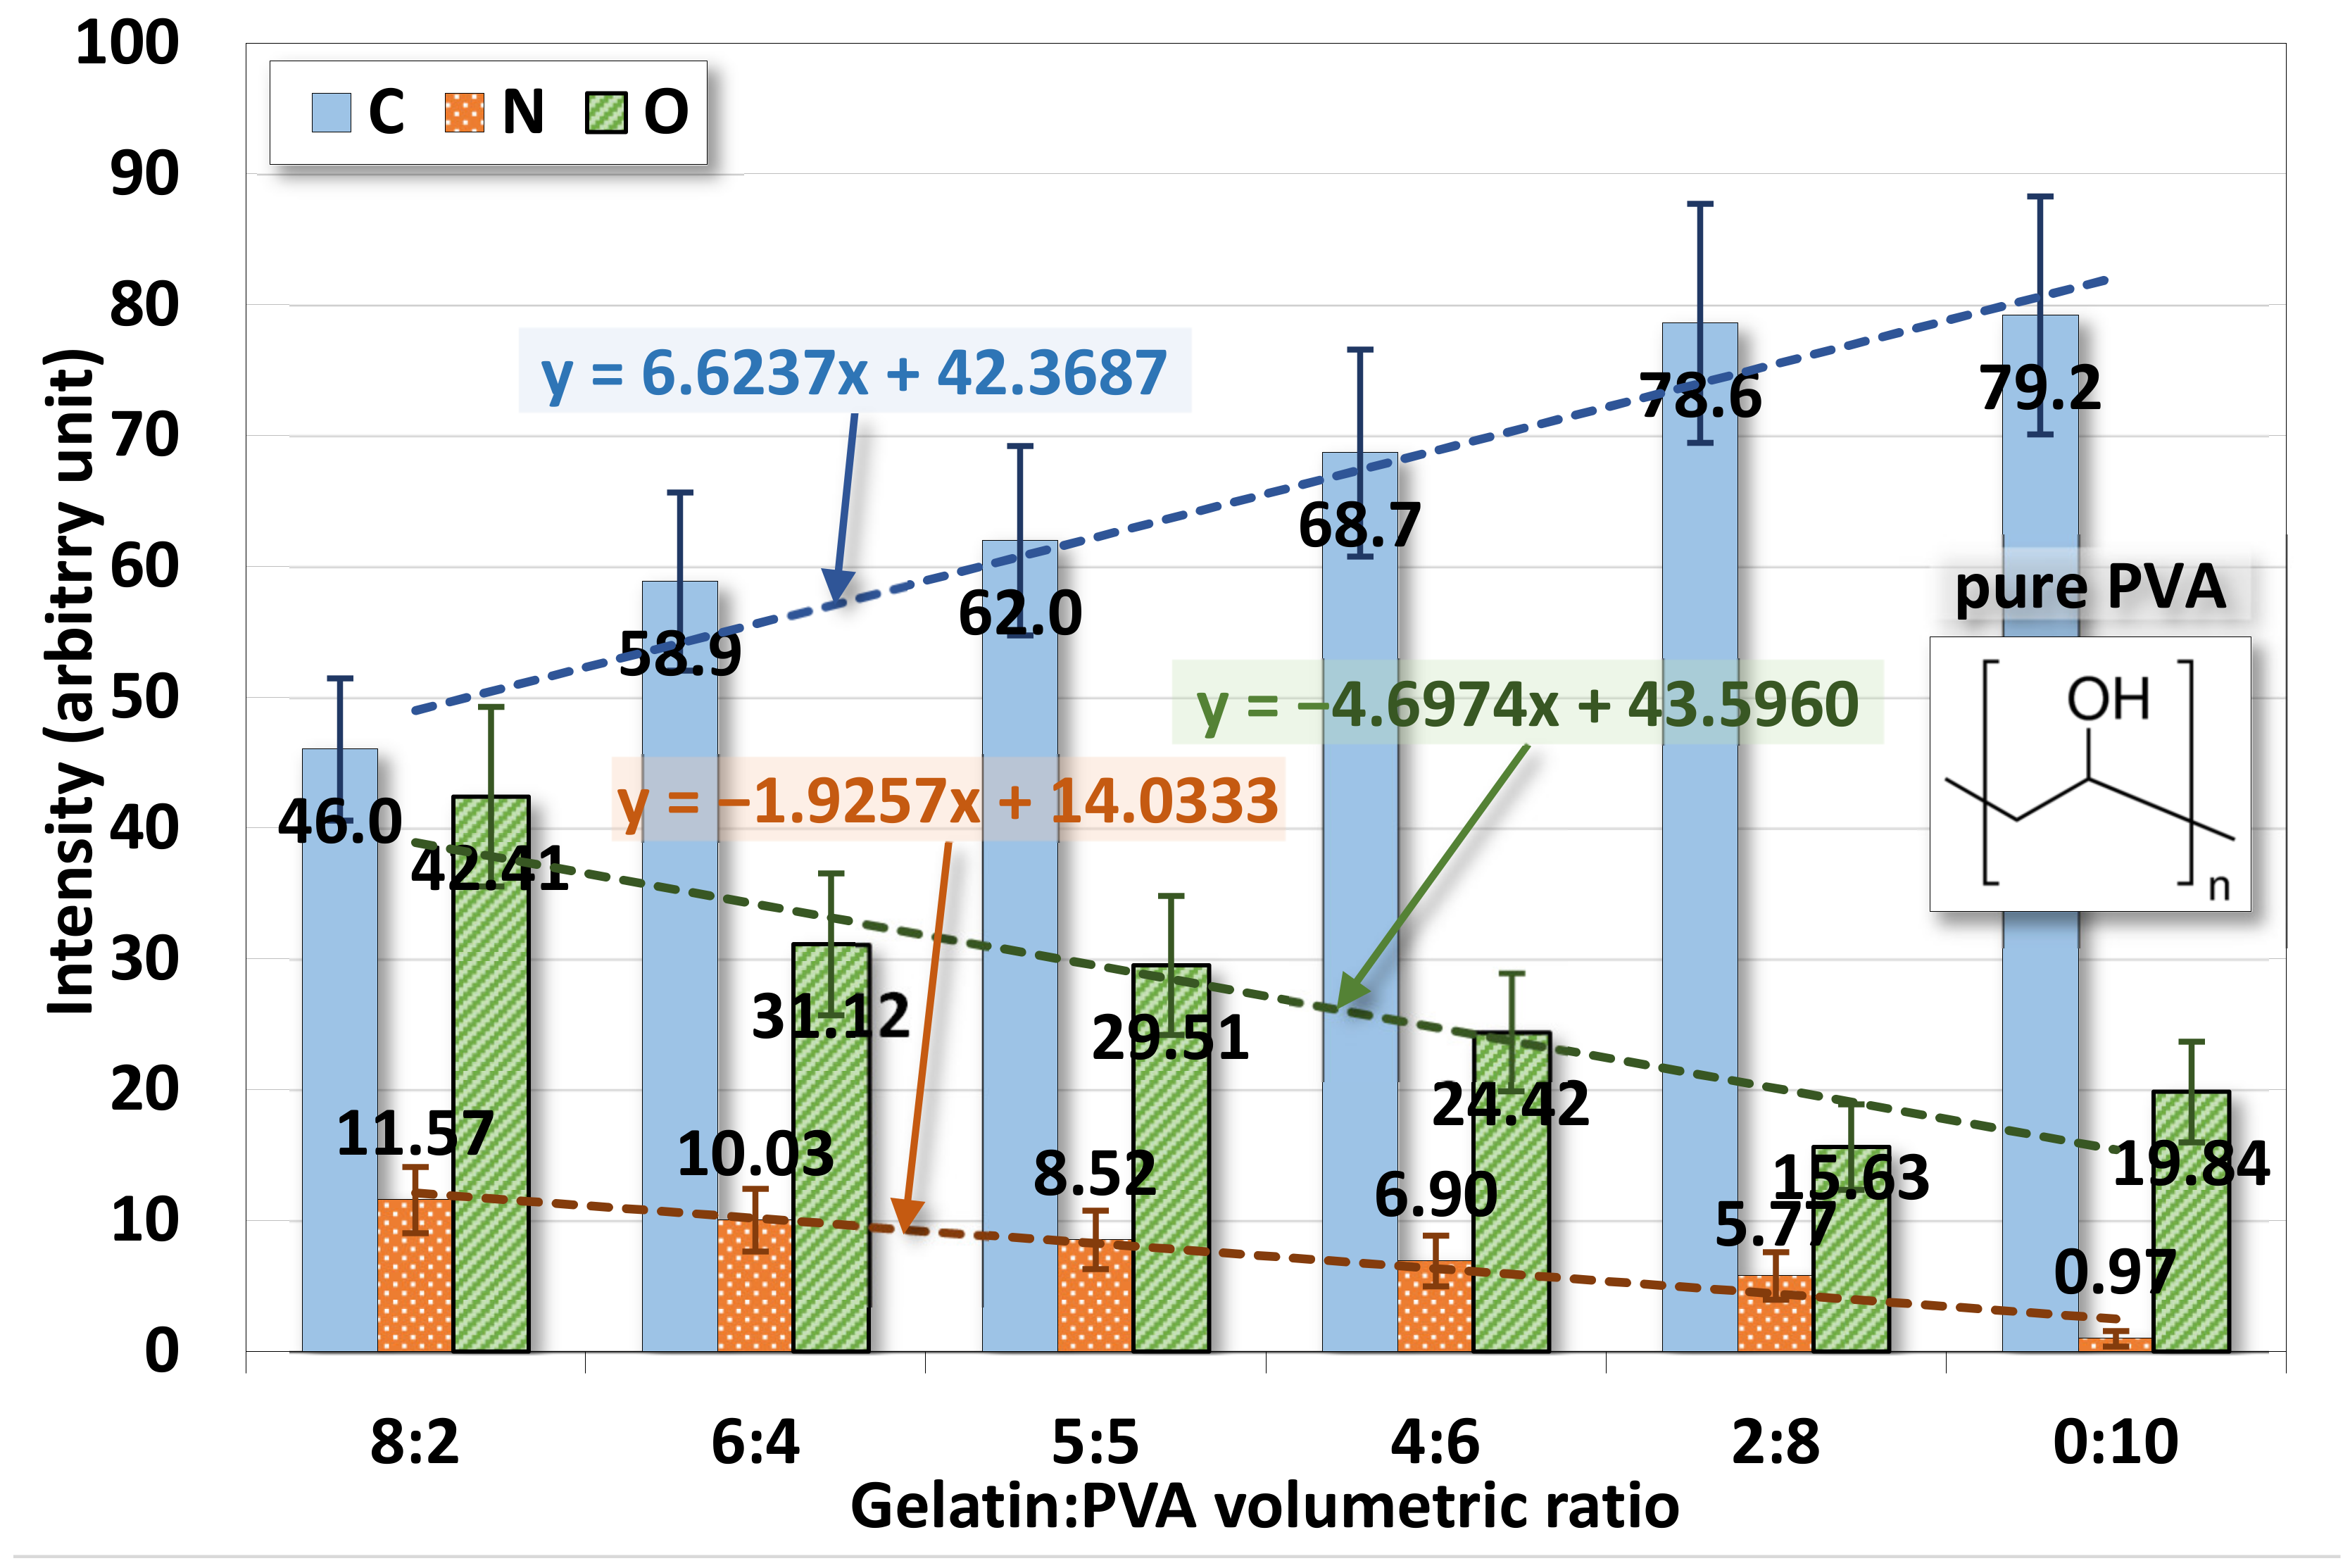
4.2.2. EDS
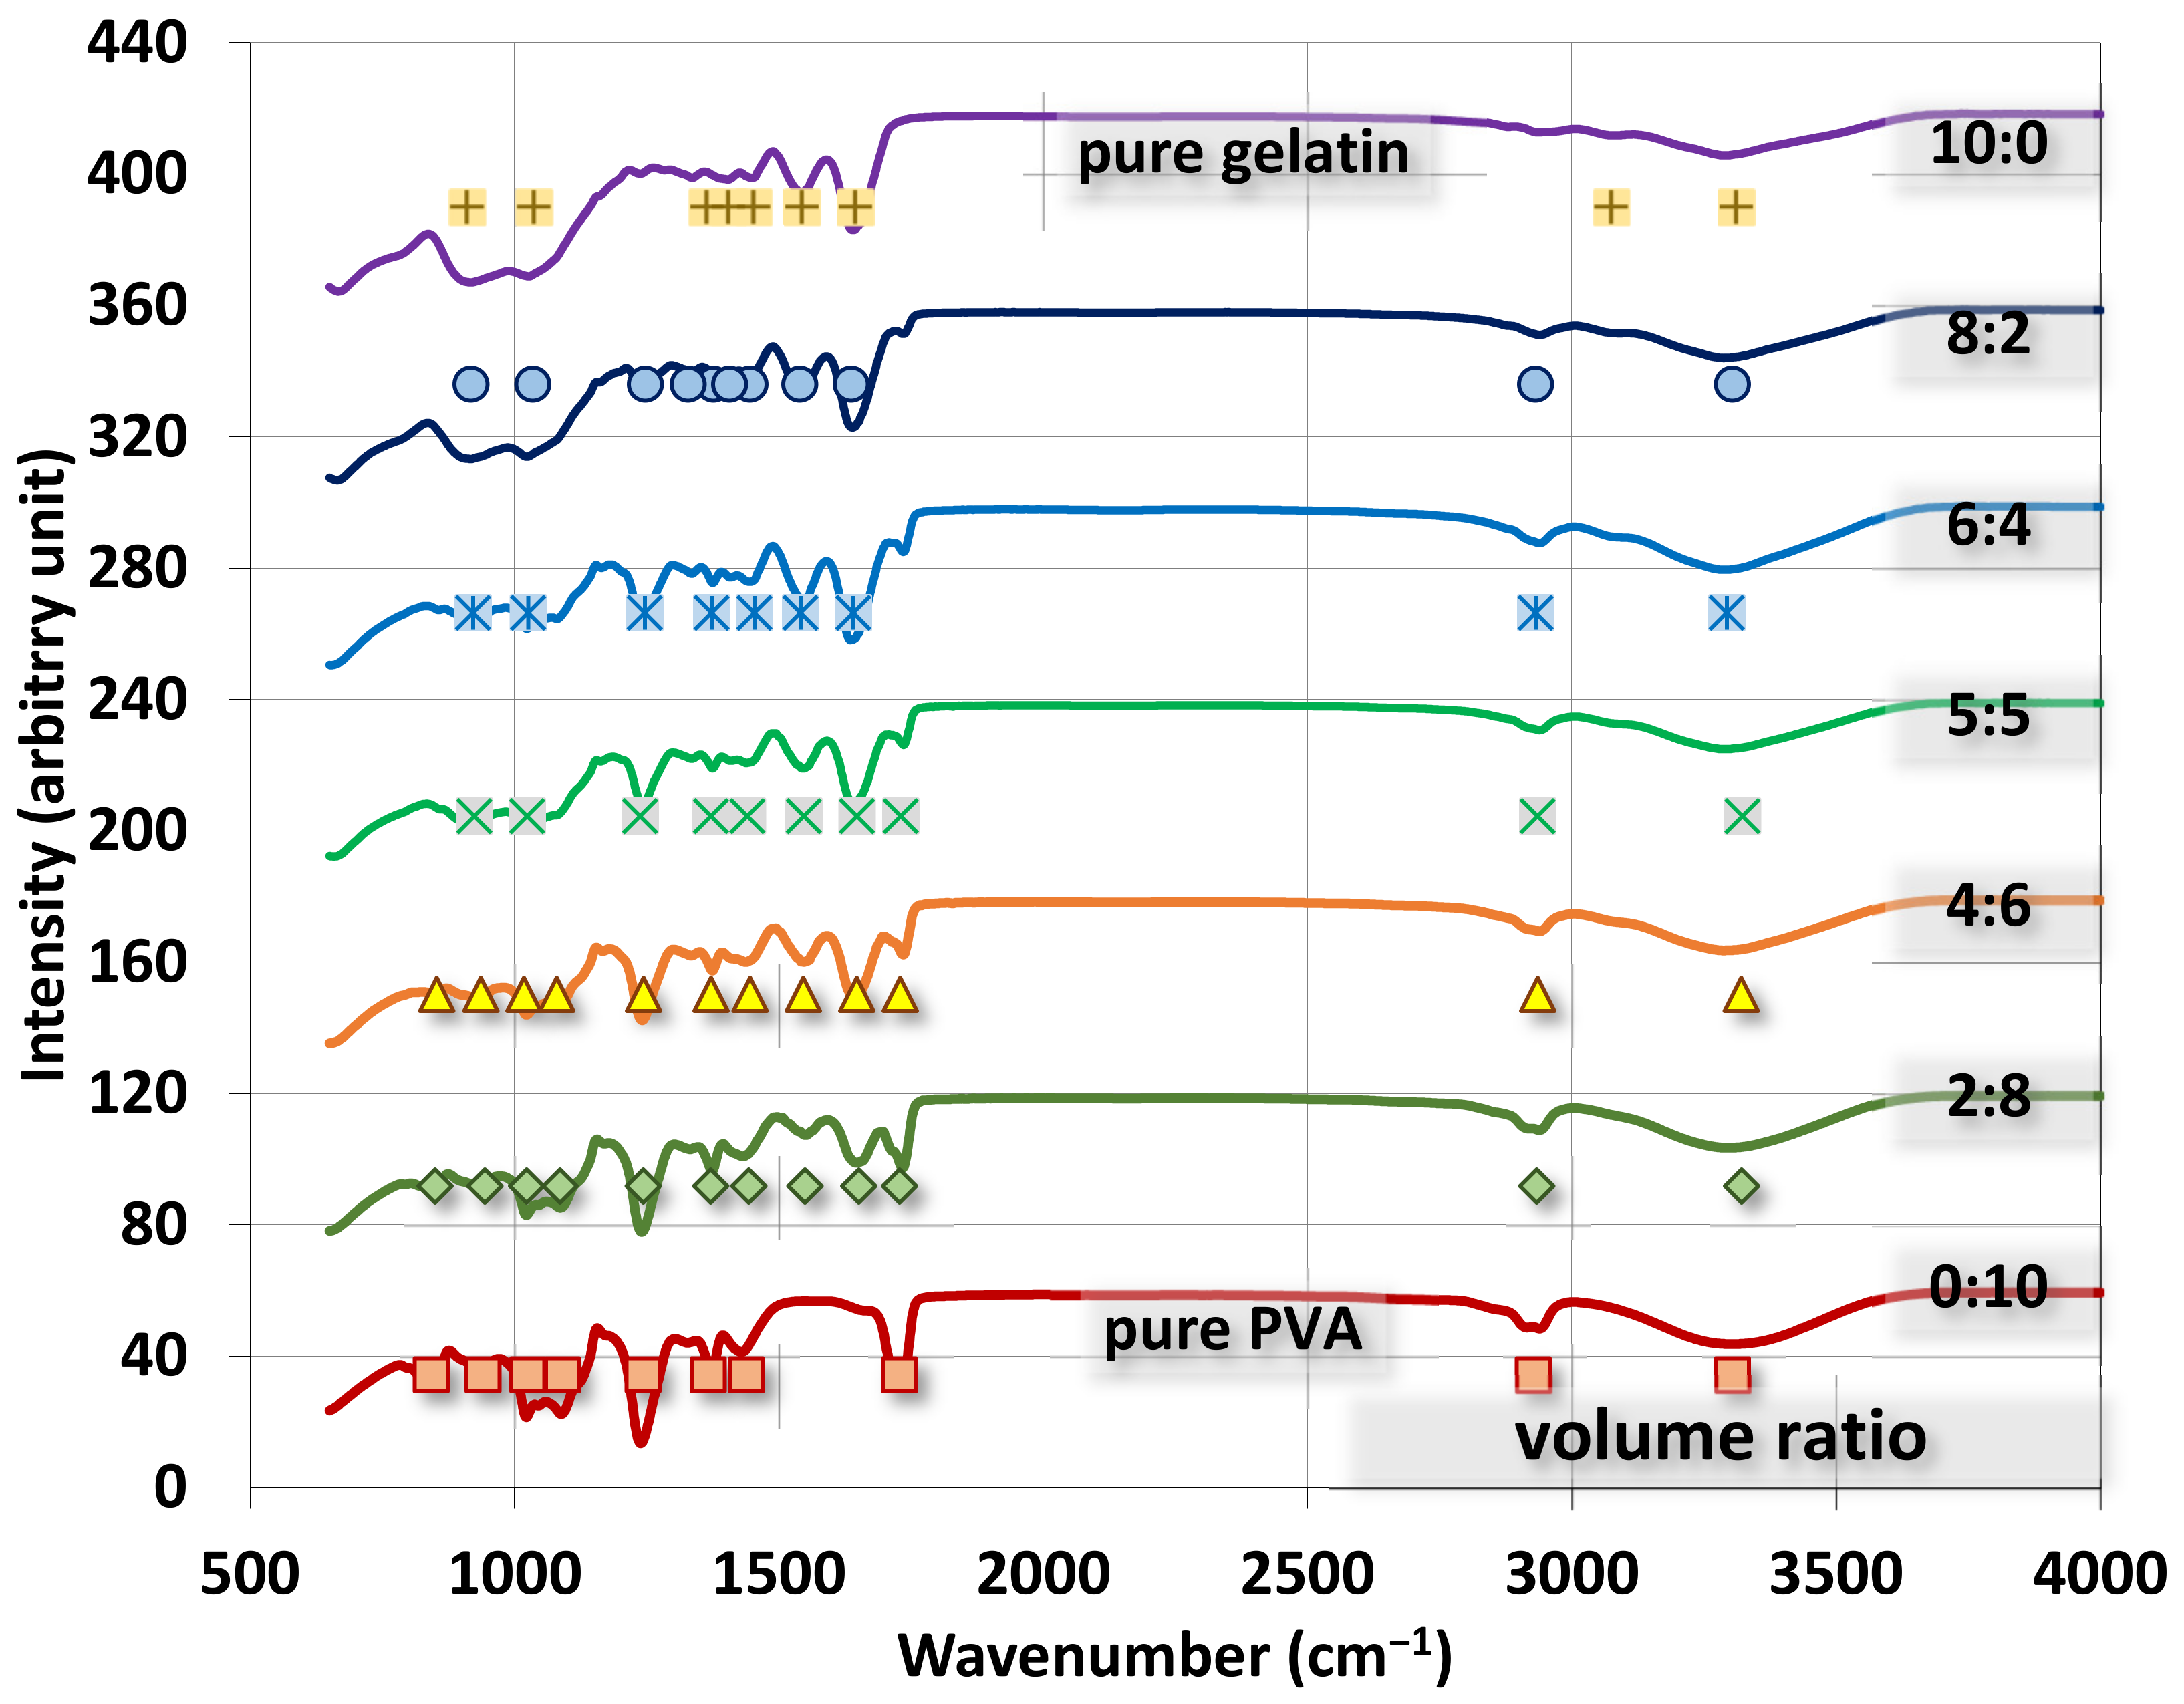
4.2.3. FTIR
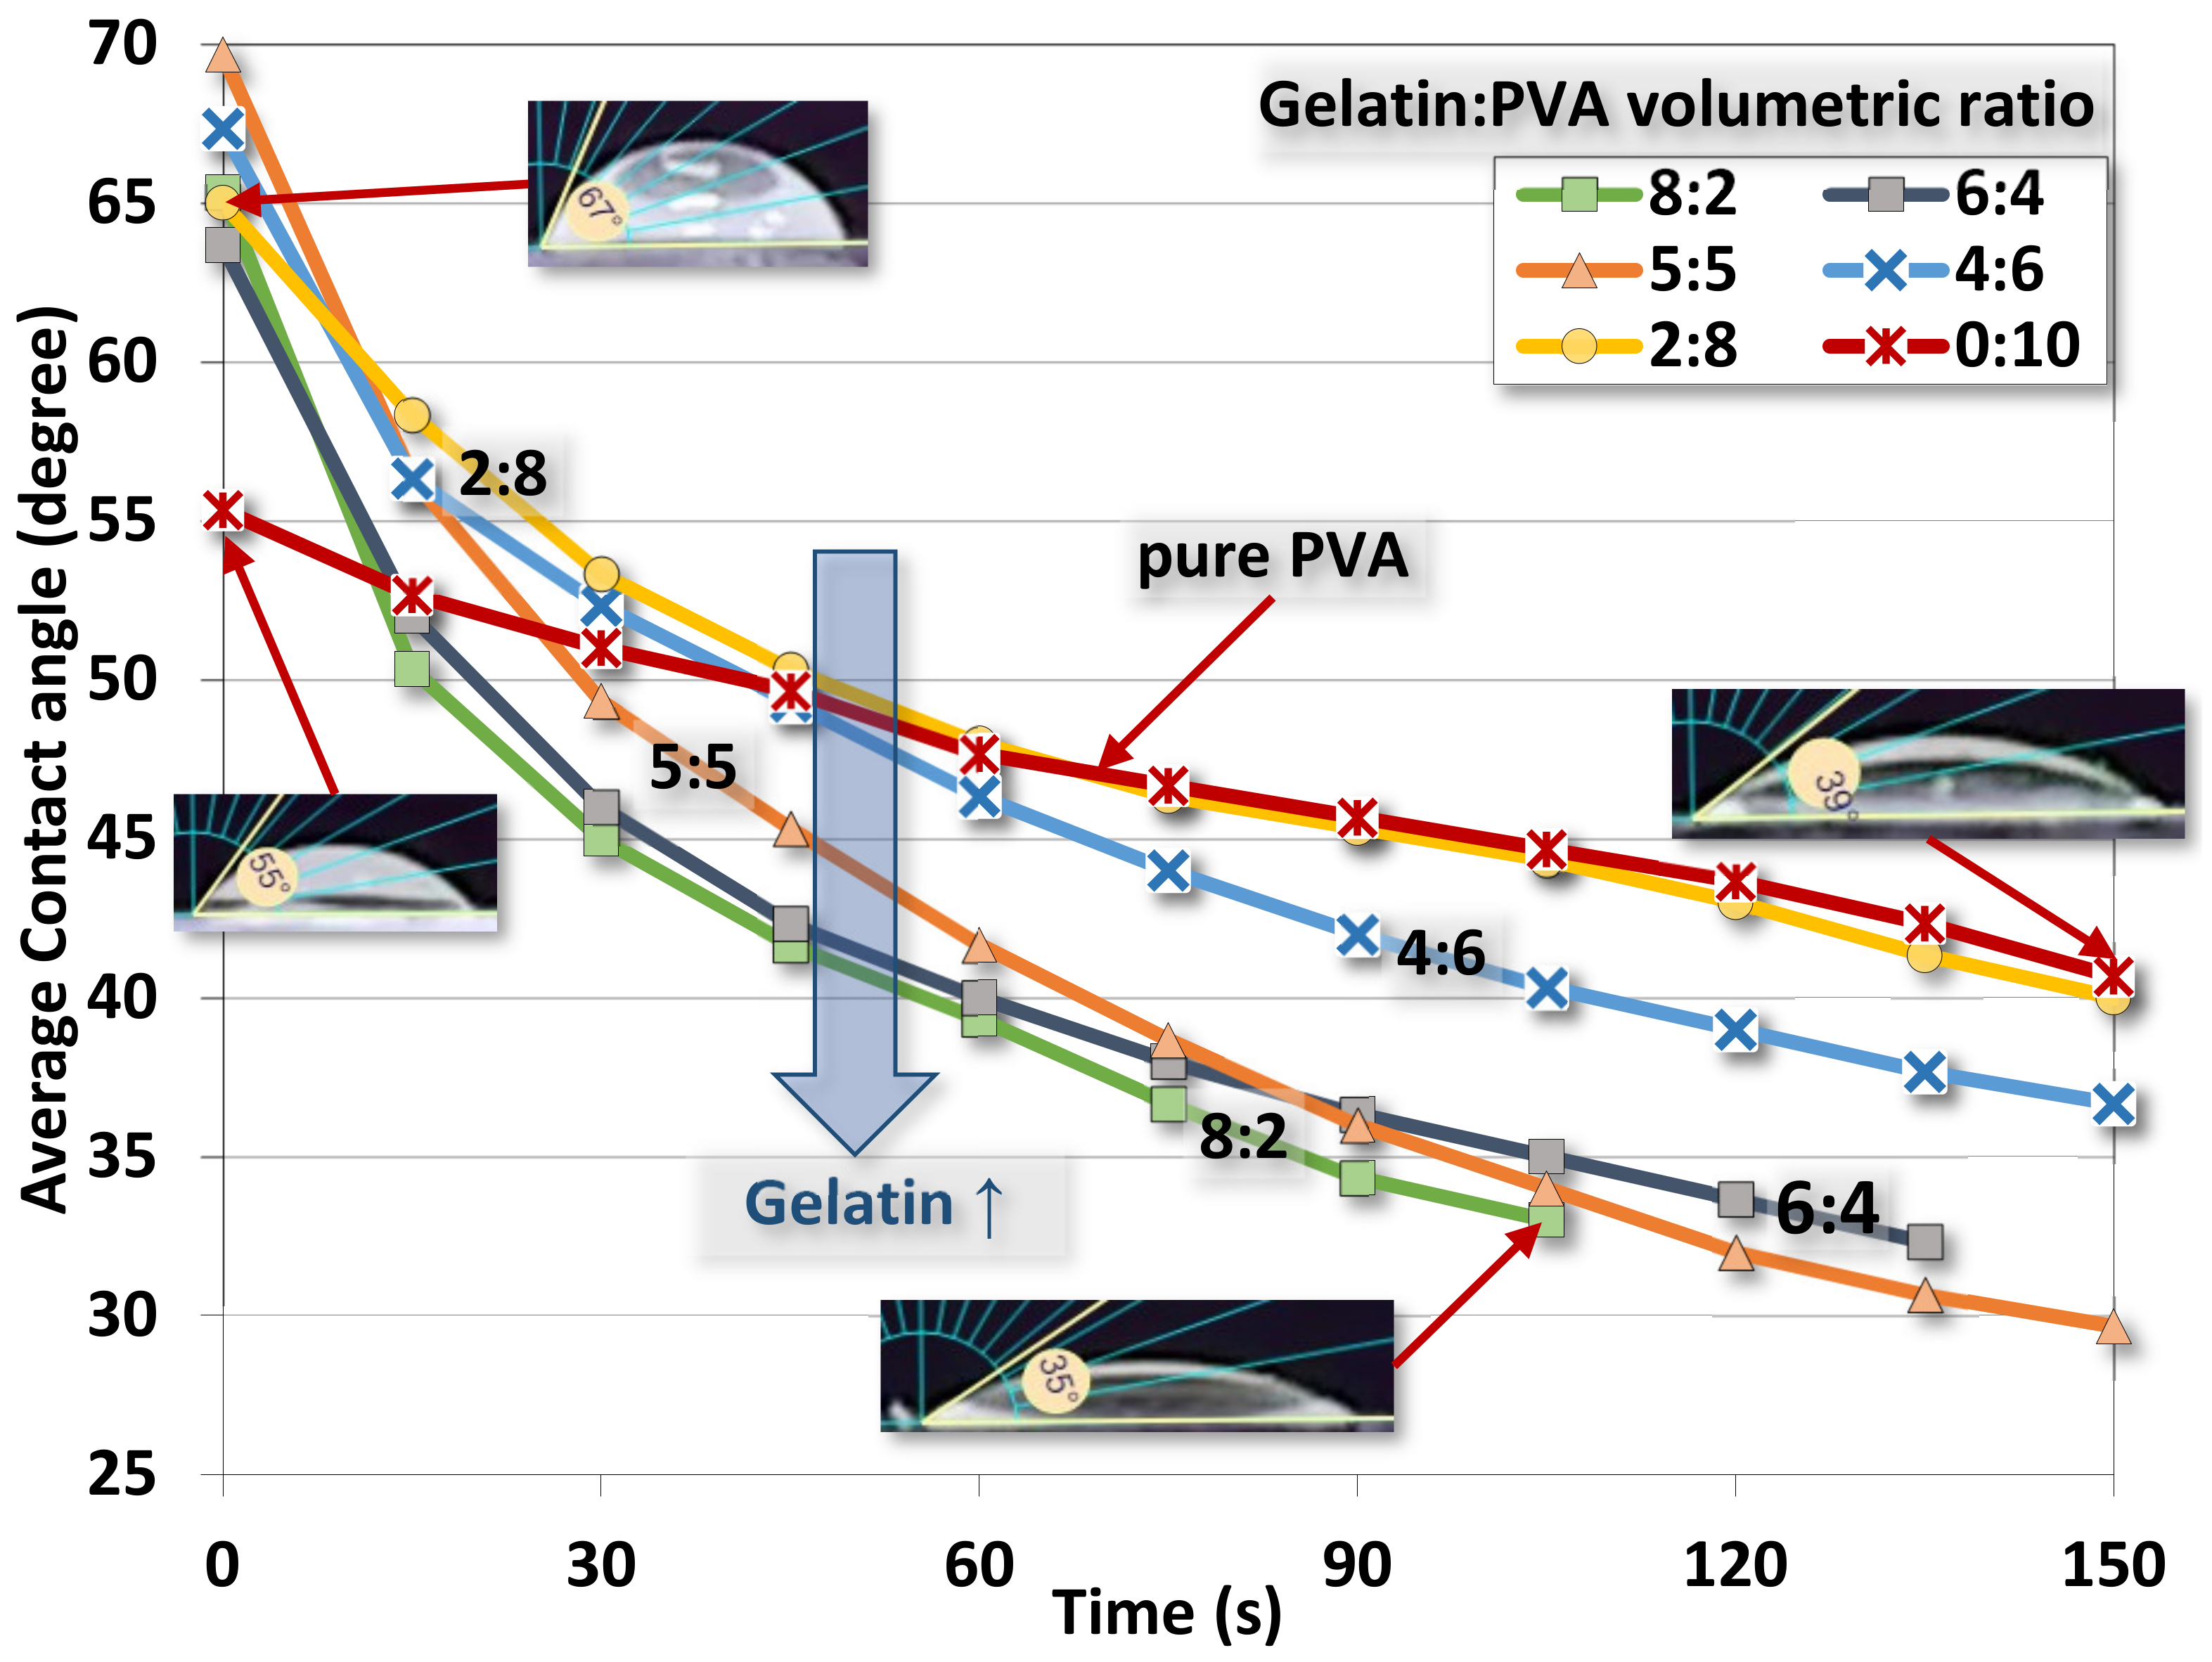
4.2.4. Contact Angle
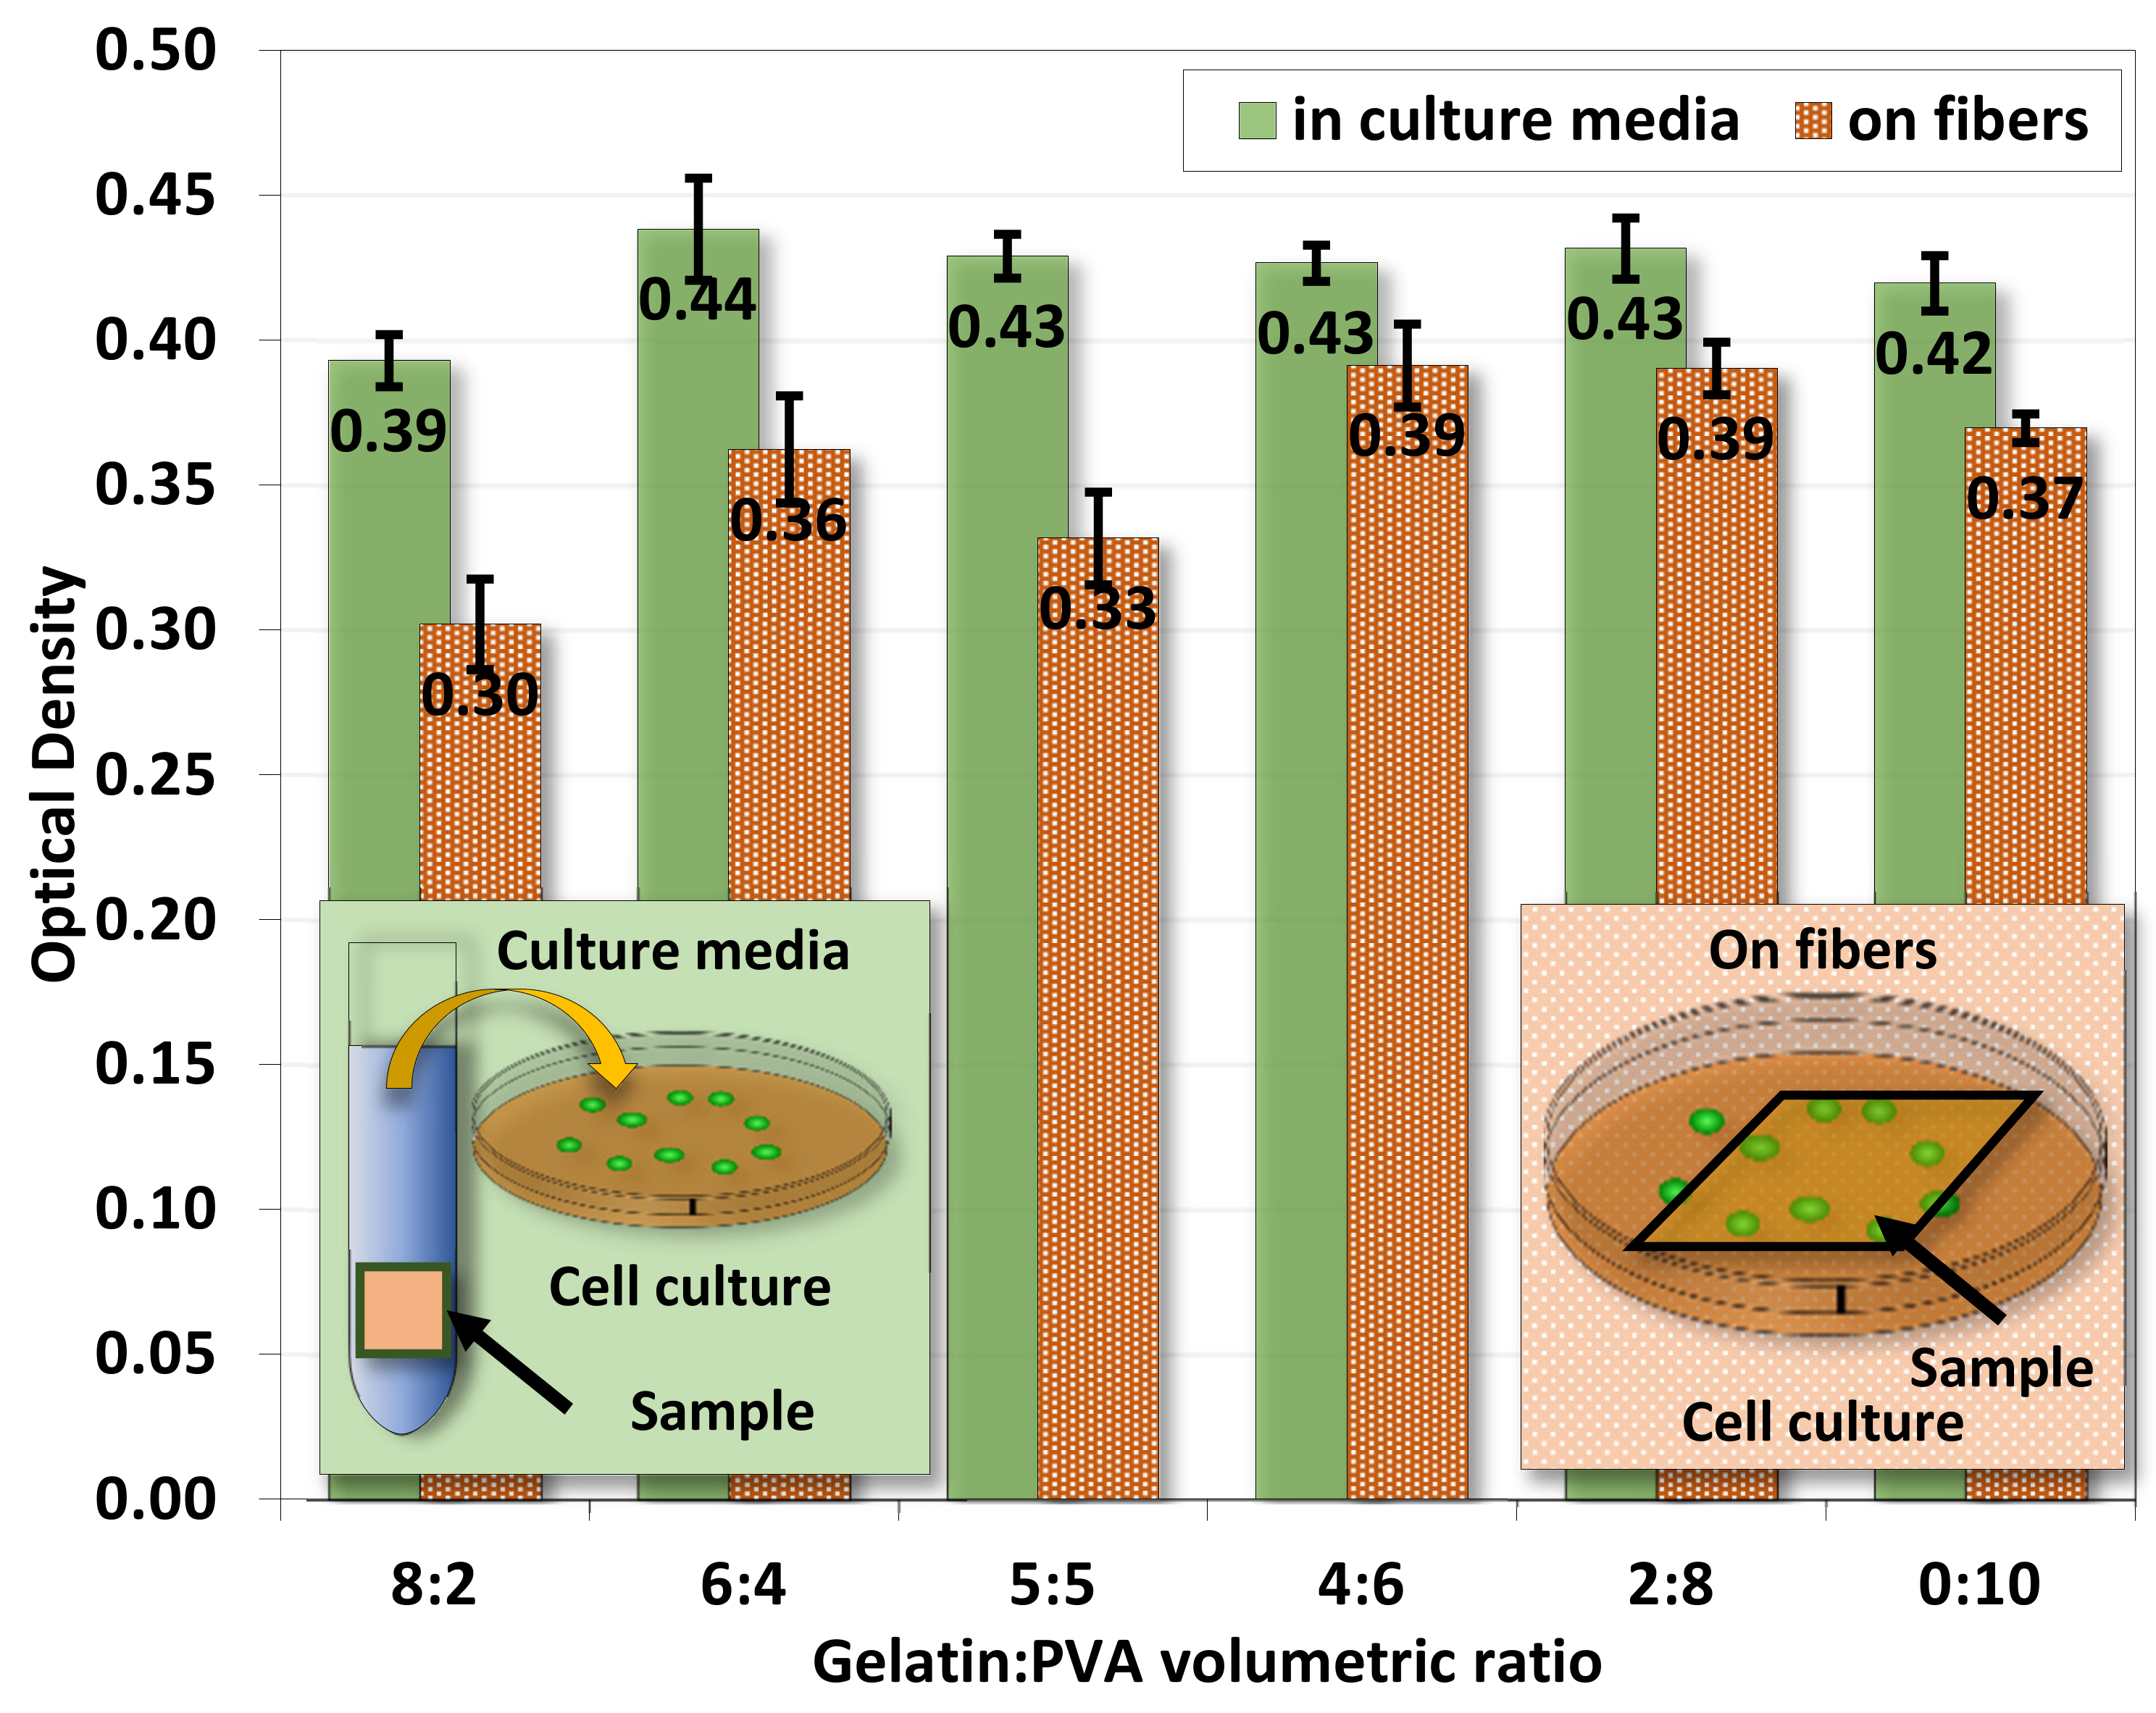
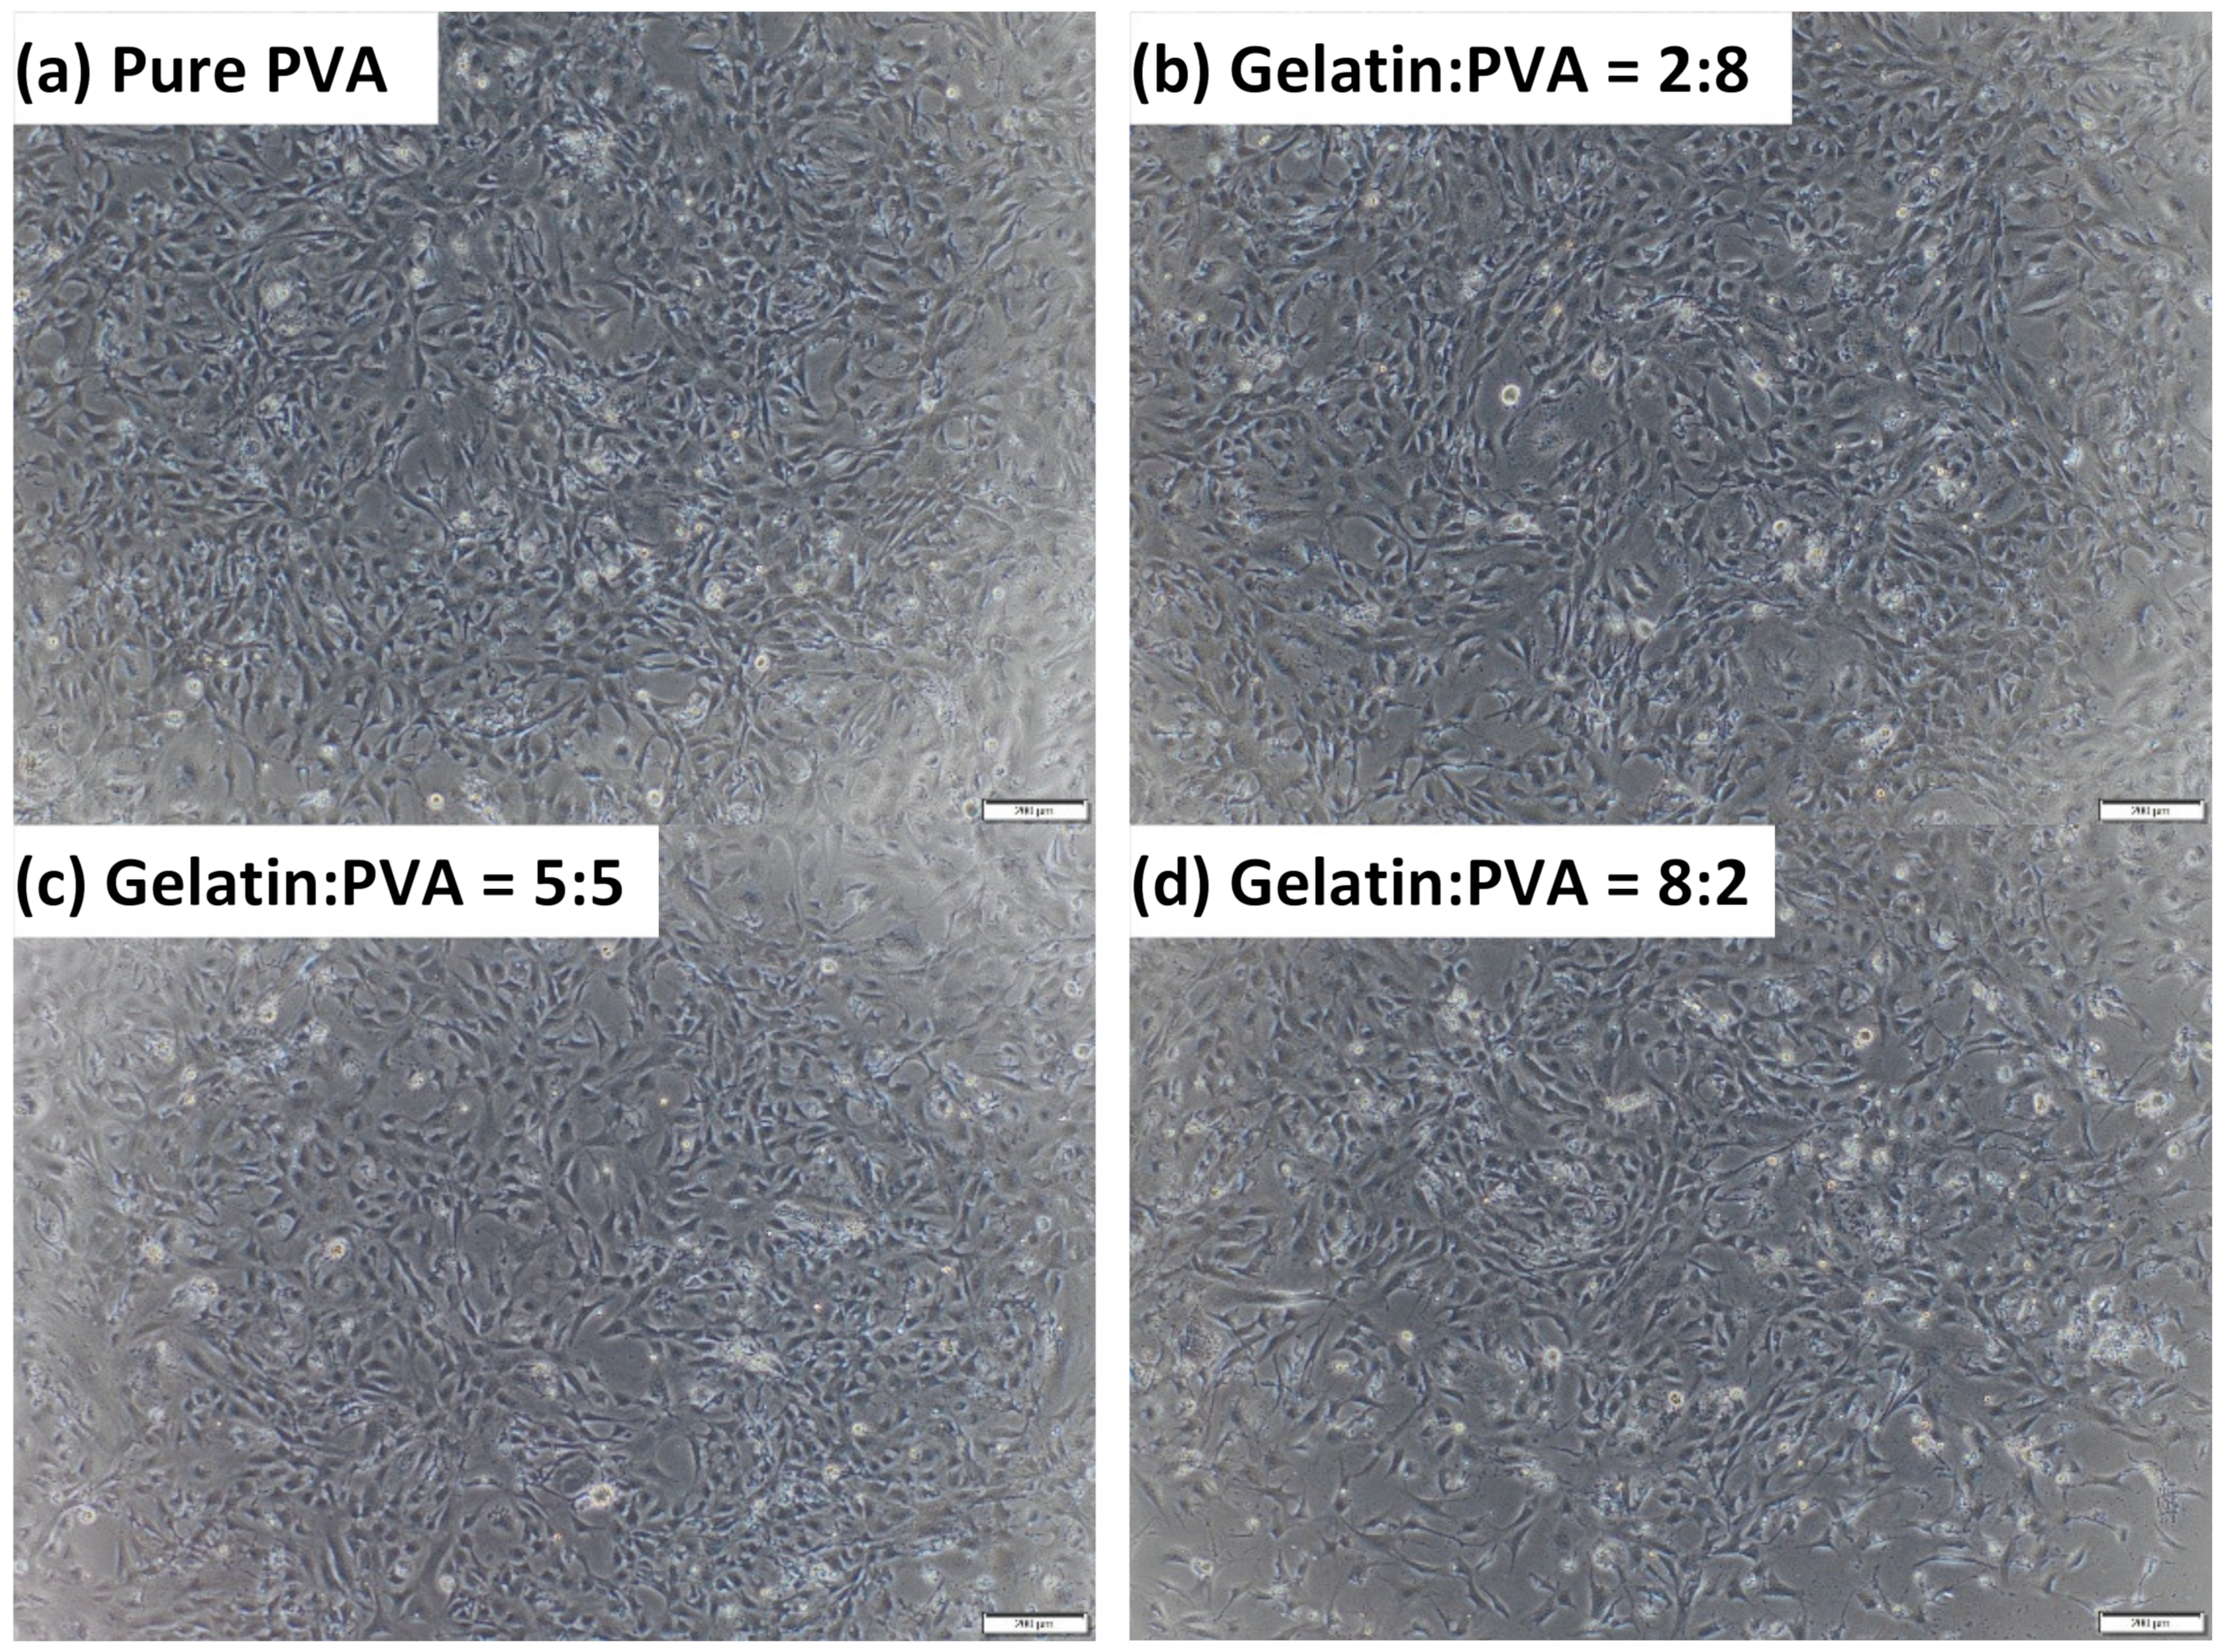
4.3. Cell Culture
5. Discussion
5.1. Summary of Process Parameters for Electrospinning Nanofibers
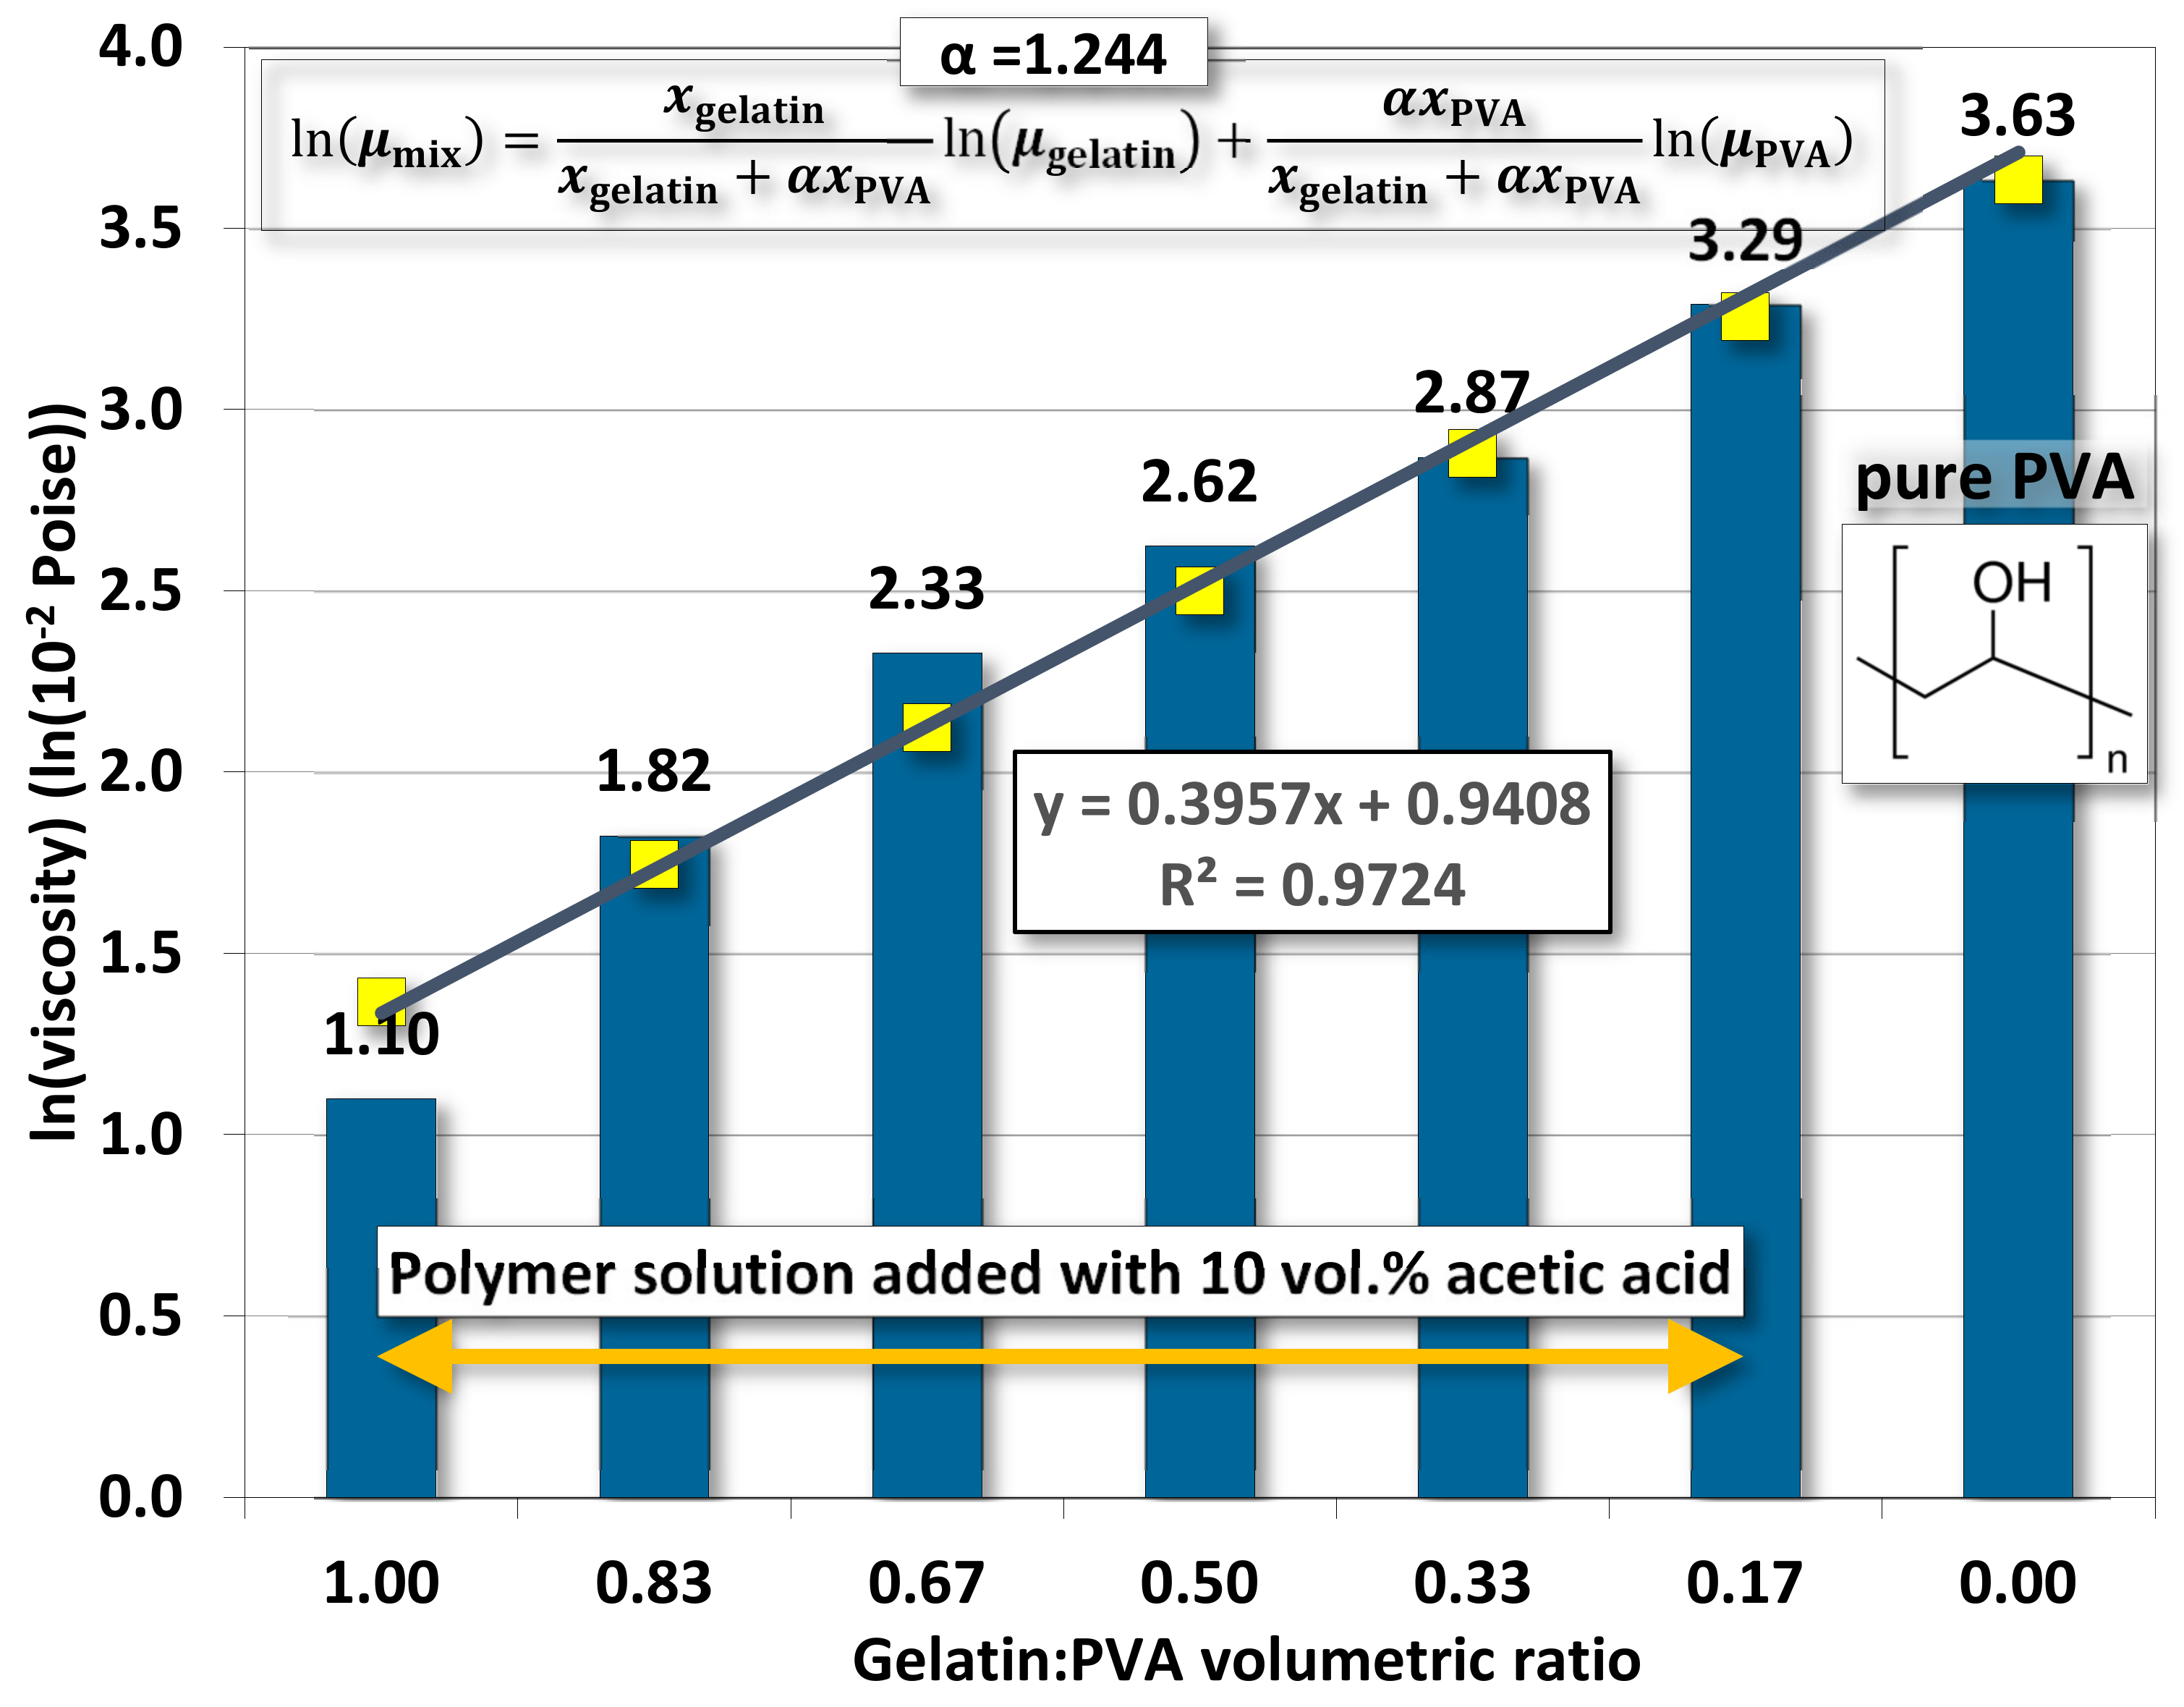
5.2. Fitting Model of Viscosity
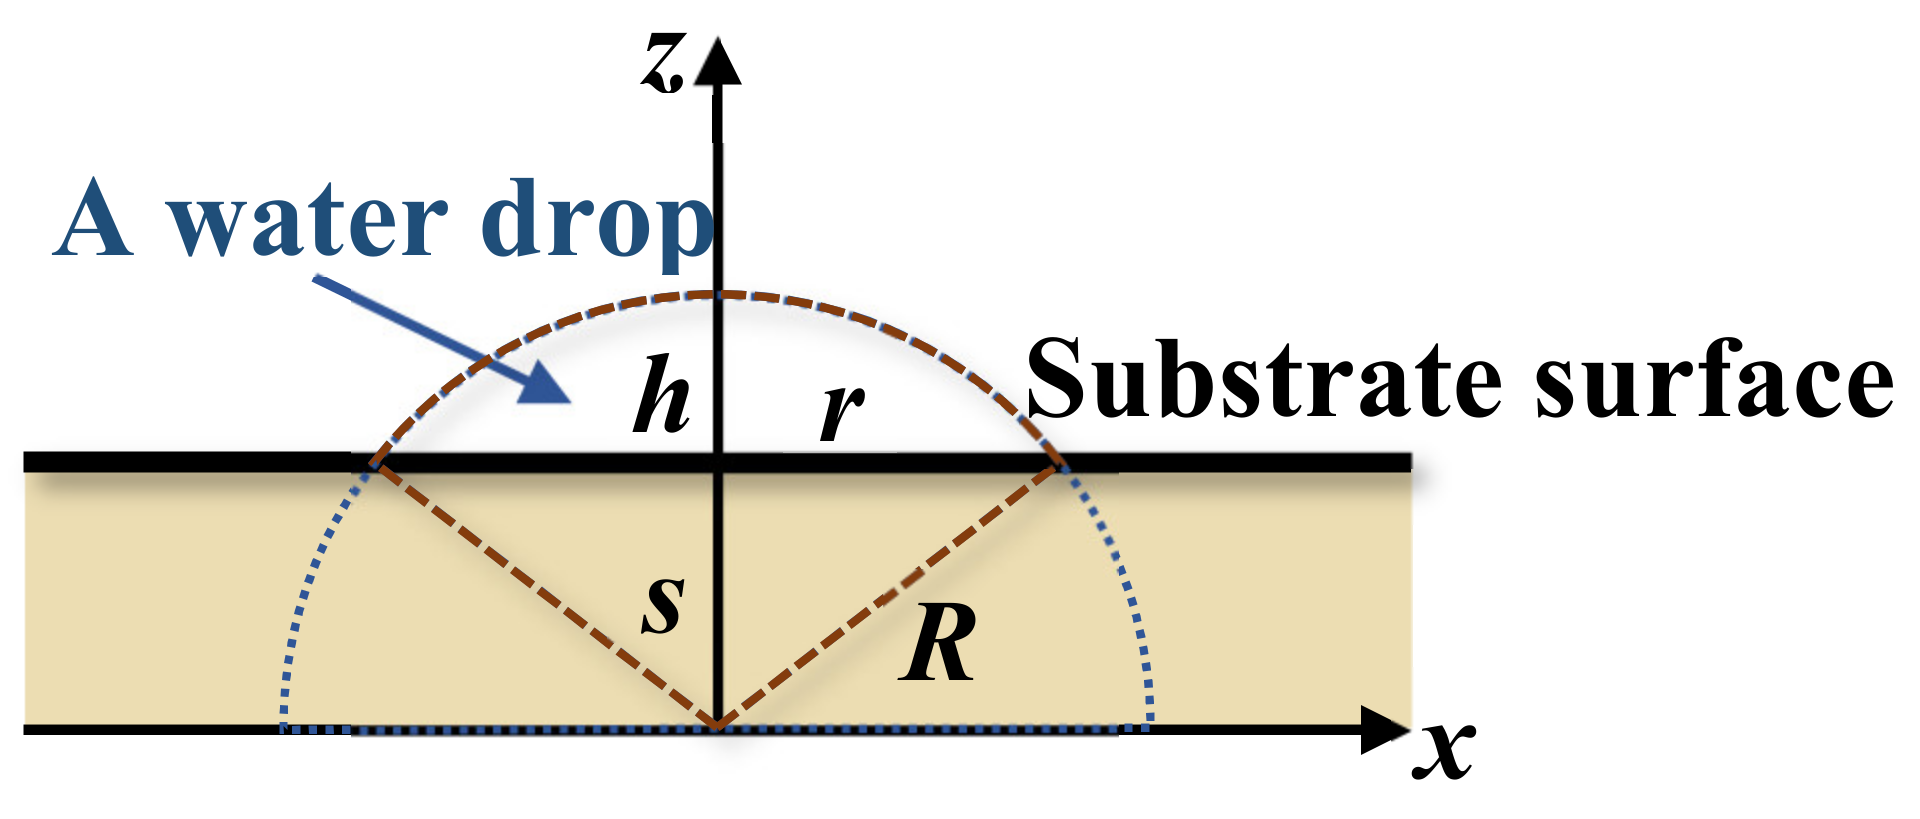
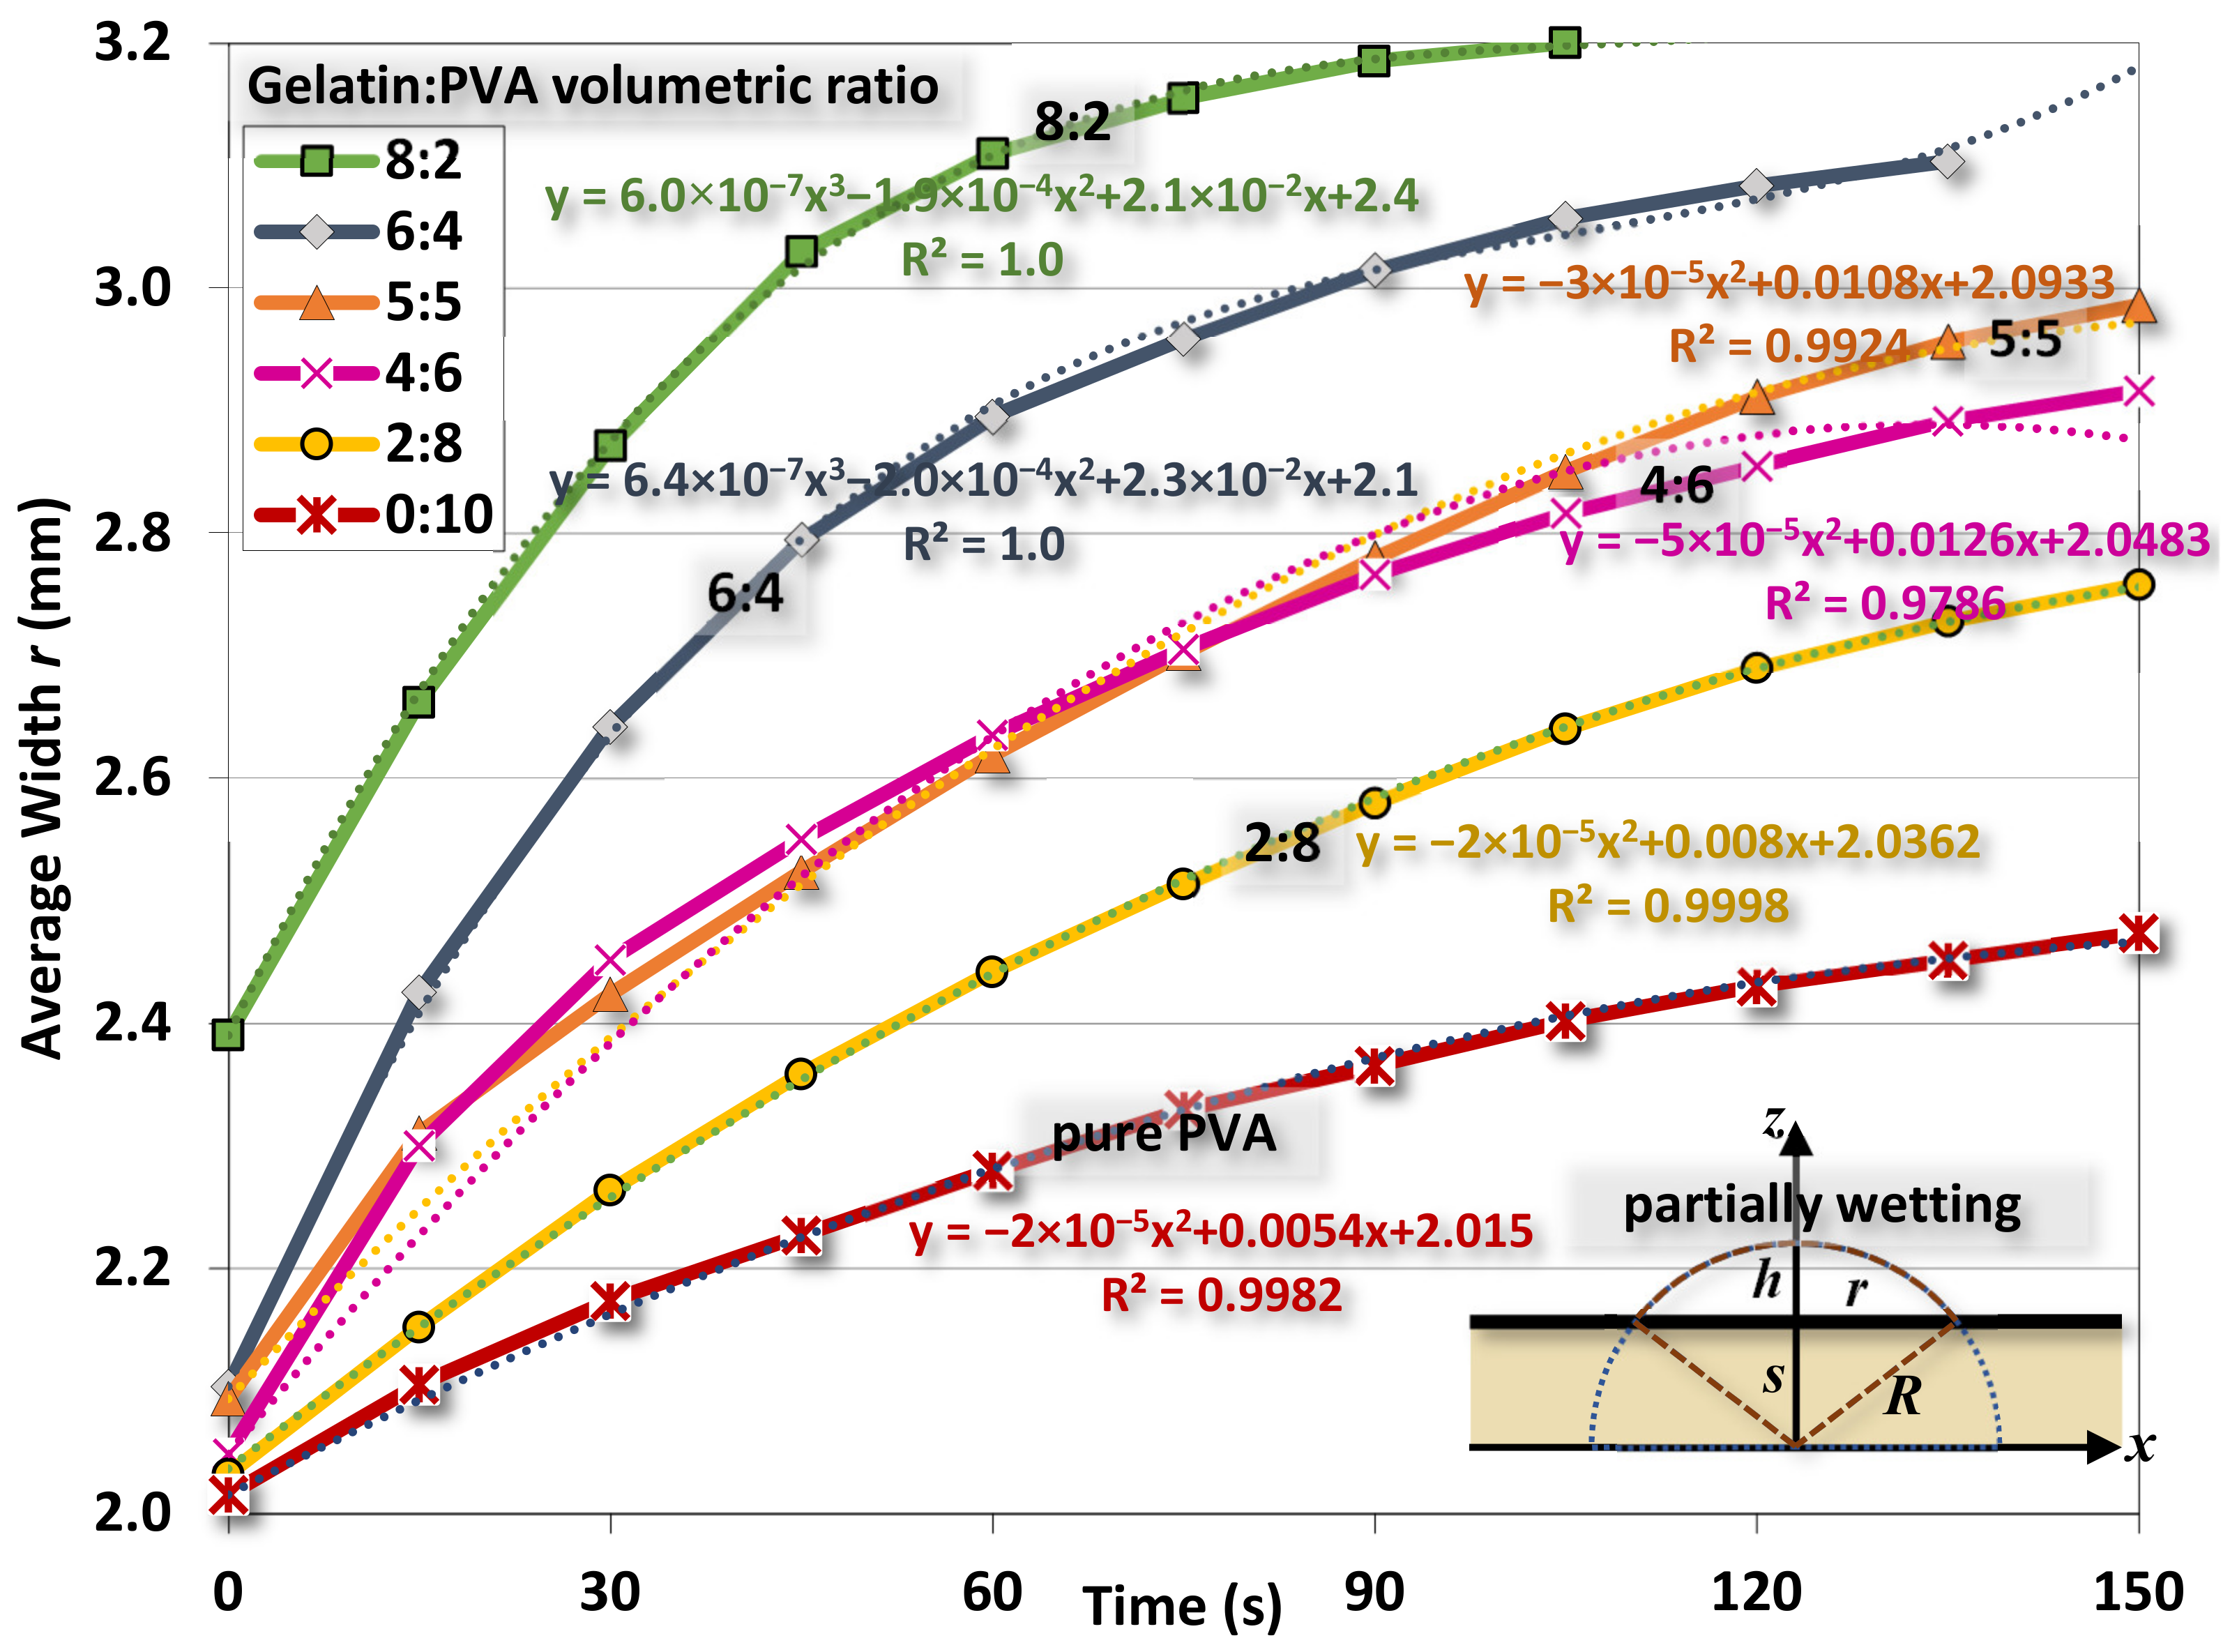
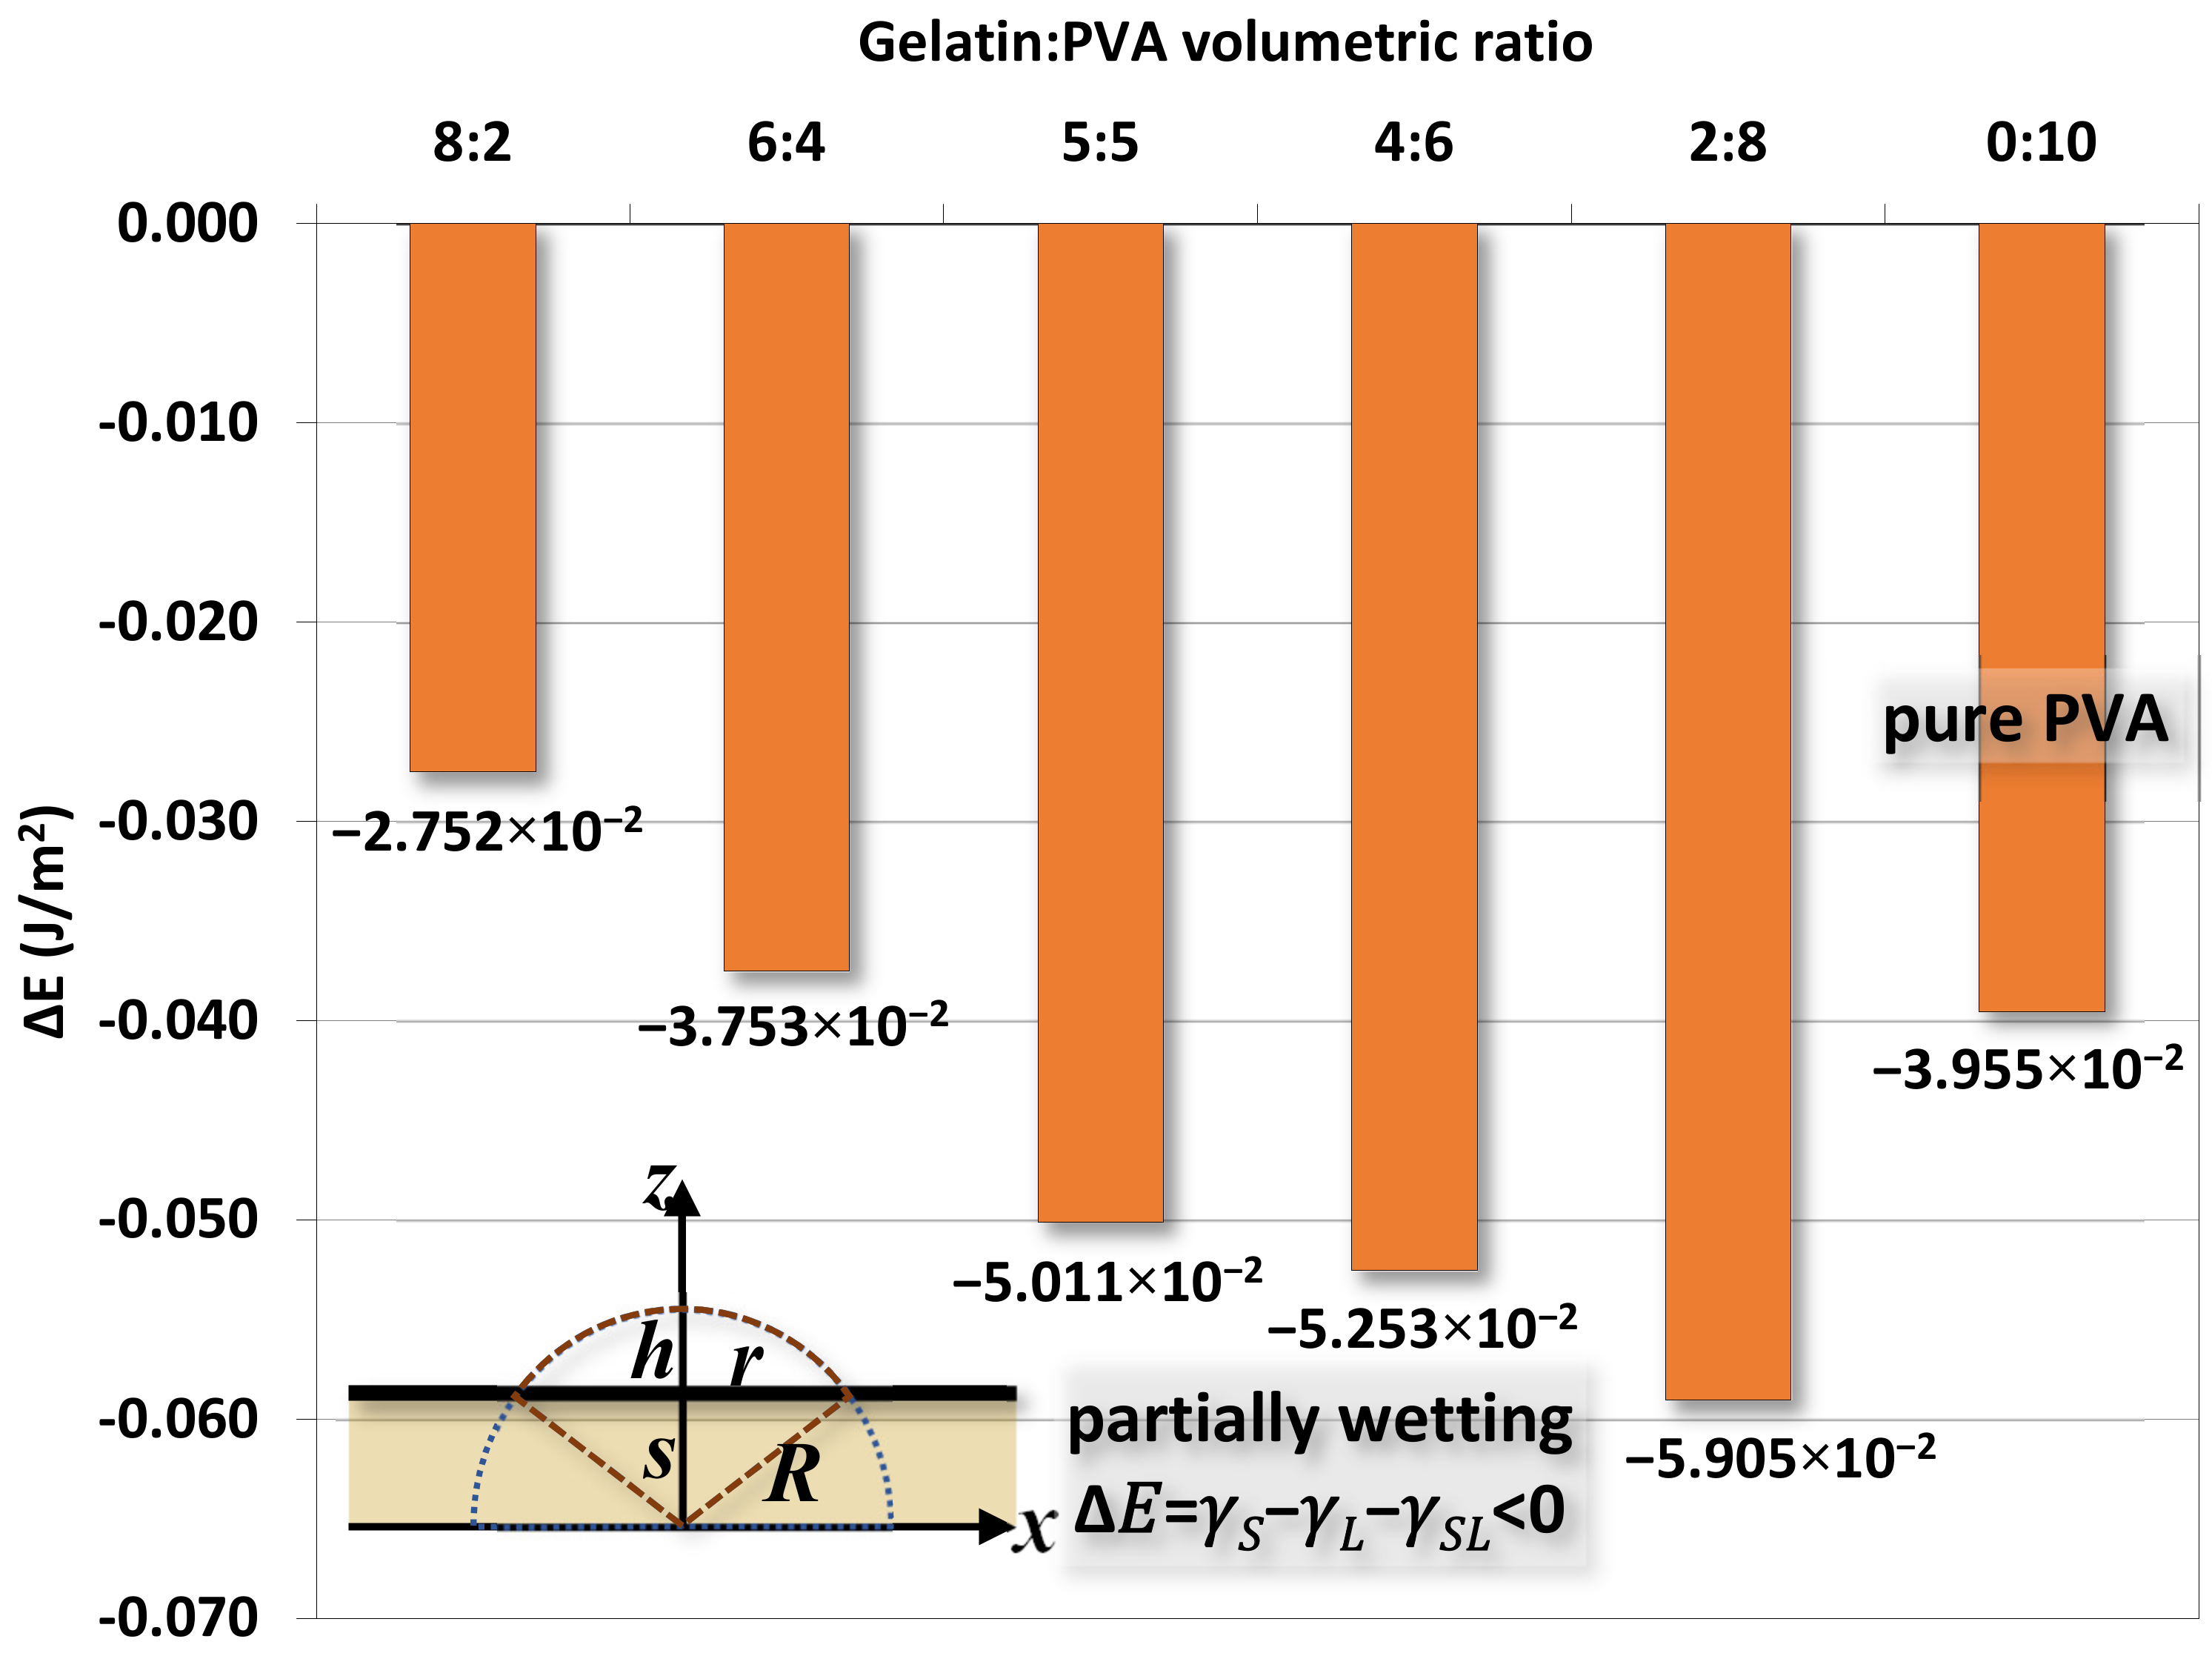
5.3. Estimation of the Interfacial Energy by Water Contact Test
- We first determine r and h at the selected time (including initial values of r0 and h0) from the image of the water drop for the contact angle test;
- Radius of the drop R and penetration s can be calculated following Equations (8) and (9). Then, the volume of the drop can be calculated by simple integration shown in Appendix A;
- For water at 25 °C, the surface tension of γL = 0.07275 J/m2, viscosity is 0.0091, and poise and density are 997 kg/m3;
- The rate change, , is estimated from the fitting functions, as shown in Figure 15;
- The interfacial energy ΔE at different times is estimated from Equation (11) as
- Plugging values of ΔE at each time back to eq. (11) to re-calculate . These are different from the estimated from the fitting functions;
- Among various values of ΔE at each time, an optimal value that minimizes the difference of between the fitting function and the previous step can be determined accordingly.
6. Conclusions
Author Contributions
Funding
Institutional Review Board Statement
Informed Consent Statement
Data Availability Statement
Conflicts of Interest
Appendix A. Integration of Drop Volume in the Contact Angle Test
Appendix B. Major FTIR Absorption Peaks

| Wavenumber (cm−1) | Gelatin Mode | Reference |
|---|---|---|
| 400–900 | –CO–NH–moiety, amide IV-VI bands | [41] |
| 670–1240 | Amide III (C-N, in-plane bending vibrations of N-H, weak C-C bond, and C=O) | [43] |
| 900–1900 | Amide I, II, and III | [41] |
| 1238 | Delta N-H, C-N stretching | [40] |
| 1245 | Amide III | [44] |
| 1300–1560 | Amide II (N-H bond-bending mode and stretching vibration of C-N bond) | [43] |
| 1328 | Wagging vibration of proline side chains | [42] |
| 1400 | Symmetric O–C–O stretching | [40] |
| 1500–1550 | N-H deformation | [42] |
| 1540 | Amide II | [42] |
| 1541 | Delta N-H, C-N stretching | [40] |
| 1560 | Amide II | [44] |
| 1620–1660 | Amide I (stretching of carbonyl C=O (peptide bond) with less involvement of the stretching C-N bond) | [43] |
| 1637 | C=O stretching | [42] |
| 1650 | Amide I | [44] |
| 1653 | C=O, CN stretching | [40] |
| 2300–3600 | Amide A | [43] |
| 2700–3600 | Amide A and B | [41] |
| 2947 | C-H stretching | [42] |
| 2960–2935 | Asymmetric and symmetric CH2 stretching | [40] |
| 3065 | N-H stretching | [40] |
| 3270–3370 | N-H stretching | [42] |
| 3306 | N-H, O-H stretching | [40] |
| Wavenumber (cm−1) | PVA Mode | Reference |
| 839 | C-C stretching vibration | [48] |
| 849 | C-H rocking mode | [50] |
| 1000–1100 | C–O stretching in C–O–H groups and COC groups | [50] |
| 1081 | C–O stretching of acetyl groups | [48] |
| 1085–1150 | C–O–C | [47] |
| 1100 | C-O-C | [45] |
| 1140 | Crystalline C–O stretching | [50] |
| 1141 | C–O (crystallinity) | [47] |
| 1248 | C–O stretching | [50] |
| 1261 | C–O stretching | [50] |
| 1324 | C–H deformation vibration | [48] |
| 1377 | CH3 bending | [45] |
| 1417–1461 | Delta CH2 | [47] |
| 1425 | C–H bending vibration of CH2 | [48] |
| 1435 | C–H bending | [50] |
| 1440 | CH2 bending | [45] |
| 1680–1730 | C=O and C-O stretch from the remaining acetate groups | [46] |
| 1690 | C=O carbonyl stretch | [48] |
| 1720–1737 | C=O stretching | [45] |
| 1732 | C=O stretching | [50] |
| 1735–1750 | C=O | [47] |
| 2840 | Symmetric stretching vibrational of C–H from alkyl groups | [49] |
| 2840–3000 | C-H stretch from alkyl groups | [46] |
| 2914 | C–H stretching from the alkyl groups | [50] |
| 2917 | CH2 asymmetric stretching | [48] |
| 2920 | Antisymmetric stretching vibrational of C–H from alkyl groups | [49] |
| 2929 | CH sp3 | [45] |
| 2943 | C–H stretching from the alkyl groups | [50] |
| 3200–3550 | O-H stretching | [46] |
| 3280 | O–H stretching | [48] |
| 3369 | O–H stretching | [50] |
| 3400 | O–H stretching | [49] |
| 3411 | O-H stretching | [45] |
References
- Sousa Coelho, D.; Veleirinho, B.; Alberti, T.; Maestri, A.; Yunes, R.; Dias, P.; Maraschin, M. Electrospinning Technology: Designing Nanofibers toward Wound Healing Application. In Nanomaterials—Toxicity, Human Health and Environment; Clichici, S., Filip, A., M. do Nascimento, G., Eds.; IntechOpen: London, UK, 2018. [Google Scholar]
- Samadian, H.; Zamiri, S.; Ehterami, A.; Farzamfar, S.; Vaez, A.; Khastar, H.; Alam, M.; Ai, A.; Derakhshankhah, H.; Allahyari, Z.; et al. Electrospun cellulose acetate/gelatin nanofibrous wound dressing containing berberine for diabetic foot ulcer healing: In vitro and in vivo studies. Sci. Rep. 2020, 10, 8312. [Google Scholar] [CrossRef]
- Liu, X.; Xu, H.; Zhang, M.; Yu, D.-G. Electrospun medicated nanofibers for wound healing: Review. Membranes 2021, 11, 770. [Google Scholar] [CrossRef]
- Liu, Y.; Zhou, S.; Gao, Y.; Zhai, Y. Electrospun nanofibers as a wound dressing for treating diabetic foot ulcer. J. Pharm. Sci. 2019, 14, 130–143. [Google Scholar] [CrossRef] [PubMed]
- Ng, C.; Hamzah, M.; Razak, S.I.A.; Sukor, J.; Nayan, N.; Hasraf, N. Study on morphological properties of polyvinyl alcohol/poly(lactic acid) wound dressing membrane as drug delivery carrier in wound healing treatment. J. Adv. Manuf. Technol. 2020, 1, 7–11. [Google Scholar] [CrossRef]
- Pilehvar-Soltanahmadi, Y.; Dadashpour, M.; Mohajeri, A.; Fattahi, A.; Sheervalilou, R.; Zarghami, N. An overview on application of natural substances incorporated with electrospun nanofibrous scaffolds to development of innovative wound dressings. Mini-Rev. Med. Chem. 2018, 18, 414–427. [Google Scholar] [CrossRef] [PubMed]
- Mousavi, S.-M.; Nejad, Z.M.; Hashemi, S.A.; Salari, M.; Gholami, A.; Ramakrishna, S.; Chiang, W.-H.; Lai, C.W. Bioactive agent-loaded electrospun nanofiber membranes for accelerating healing process: A review. Membranes 2021, 11, 702. [Google Scholar] [CrossRef]
- Arampatzis, A.S.; Kontogiannopoulos, K.N.; Theodoridis, K.; Aggelidou, E.; Rat, A.; Willems, A.; Tsivintzelis, I.; Papageorgiou, V.P.; Kritis, A.; Assimopoulou, A.N. Electrospun wound dressings containing bioactive natural products: Physico-chemical characterization and biological assessment. Biomater. Res. 2021, 25, 23. [Google Scholar] [CrossRef] [PubMed]
- Namekawa, K.; Schreiber, M.T.; Aoyagia, T.; Ebara, M. Fabrication of zeolite–polymer composite nanofibers for removal of uremic toxins from kidney failure patients. Biomater. Sci. 2014, 2, 674–679. [Google Scholar] [CrossRef]
- Subtirica, A.I.; Banciu, C.A.; Chivu, A.A.M.; Dinca, L.C. Nanofibres made from biocompatible and biodegradable polymers, with potential application as medical textiles. Ind. Text. 2018, 69, 55–58. [Google Scholar]
- Güler, B. Comparative analysis of superabsorbent properties of PVP and PAA nanofibres. Ind. Text. 2021, 72, 460–466. [Google Scholar] [CrossRef]
- Raja, I.S.; Preeth, D.R.; Vedhanayagam, M.; Hyon, S.-H.; Lim, D.; Kim, B.; Rajalakshmi, S.; Han, D.-W. Polyphenols-loaded electrospun nanofibers in bone tissue engineering and regeneration. Biomater. Res. 2021, 25, 29. [Google Scholar] [CrossRef] [PubMed]
- Sheikh, F.A.; Ju, H.W.; Lee, J.M.; Moon, B.M.; Park, H.J.; Lee, O.J.; Kim, J.-H.; Kim, D.-K.; Park, C.H. 3D electrospun silk fibroin nanofibers for fabrication of artificial skin. Nanomed. Nanotechnol. Biol. Med. 2015, 11, 681–691. [Google Scholar] [CrossRef] [PubMed]
- Tan, H.; Marra, K.G. Injectable, biodegradable hydrogels for tissue engineering applications. Materials 2010, 3, 1746–1767. [Google Scholar] [CrossRef]
- Lee, J.H. Injectable hydrogels delivering therapeutic agents for disease treatment and tissue engineering. Biomater. Res. 2018, 22, 27. [Google Scholar] [CrossRef] [Green Version]
- Liu, M.; Zeng, X.; Ma, C.; Yi, H.; Ali, Z.; Mou, X.; Li, S.; Deng, Y.; He, N. Injectable hydrogels for cartilage and bone tissue engineering. Bone Res. 2017, 5, 17014. [Google Scholar] [CrossRef]
- Cook, M.T.; Smith, S.L.; Khutoryanskiy, V.V. Novel glycopolymer hydrogels as mucosa-mimetic materials to reduce animal testing. Chem. Comm. 2015, 51, 14447–14450. [Google Scholar] [CrossRef] [PubMed] [Green Version]
- Al-Nimry, S.; Dayah, A.A.; Hasan, I.; Daghmash, R. Cosmetic, biomedical and pharmaceutical applications of fish gelatin/hydrolysates. Mar. Drugs 2021, 19, 145. [Google Scholar] [CrossRef]
- Schmidt, M.M.; Prestes-Dornelles, R.; Mello, R.; Kubota, E.H.; Mazutti, M.; Kempka, A.; Demiate, I. Collagen extraction process. Int. Food Res. J. 2016, 23, 913–922. [Google Scholar]
- Mokrejs, P.; Langmaier, F.; Mladek, M.; Janacova, D.; Kolomaznik, K.; Vasek, V. Extraction of collagen and gelatine from meat industry by-products for food and non food uses. Waste Manag. Res. 2009, 27, 31–37. [Google Scholar] [CrossRef]
- Ahmad, T.; Ismail, A.; Ahmad, S.A.; Abdul Khalil, K.; Awad, E.A.; Akhtar, M.T.; Sazili, A.Q. Recovery of gelatin from bovine skin with the aid of pepsin and its effects on the characteristics of the extracted gelatin. Polymers 2021, 13, 1554. [Google Scholar] [CrossRef]
- Sompie, M.; Surtijono, S.E.; Pontoh, J.H.W.; Lontaan, N.N. The effects of acetic acid concentration and extraction temperature on physical and chemical properties of pigskin gelatin. Procedia Food Sci. 2015, 3, 383–388. [Google Scholar] [CrossRef] [Green Version]
- Kariduraganavar, M.Y.; Kittur, A.A.; Kamble, R.R. Chapter 1—Polymer Synthesis and Processing. In Natural and Synthetic Biomedical Polymers; Kumbar, S.G., Laurencin, C.T., Deng, M., Eds.; Elsevier: Oxford, UK, 2014; pp. 1–31. [Google Scholar]
- Arsyanti, L.; Erwanto, Y.; Rohman, A.; Pranoto, Y. Chemical composition and characterization of skin gelatin from buffalo (Bubalus bubalis). Int. Food Res. J. 2018, 25, 1095–1099. [Google Scholar]
- Eastoe, J.E. The amino acid composition of mammalian collagen and gelatin. Biochem. J. 1955, 61, 589–600. [Google Scholar] [CrossRef] [Green Version]
- Siregar, G.R.M.; Suprayitno, E. Amino acid composition of gelatin from ephinephelus sp. J. Agric. Vet. Sci. 2019, 12, 51–54. [Google Scholar]
- Duconseille, A.; Astruc, T.; Quintana, N.; Meersman, F.; Sante-Lhoutellier, V. Gelatin structure and composition linked to hard capsule dissolution: A review. Food Hydrocoll. 2015, 43, 360–376. [Google Scholar] [CrossRef]
- Ali, E.; Sultana, S.; Hamid, S.B.A.; Hossain, M.; Yehya, W.A.; Kader, A.; Bhargava, S.K. Gelatin controversies in food, pharmaceuticals, and personal care products: Authentication methods, current status, and future challenges. Crit. Rev. Food Sci. Nutr. 2018, 58, 1495–1511. [Google Scholar] [CrossRef] [PubMed]
- Said, M. Role and function of gelatin in the development of the food and non-food industry: A review. IOP Conf. Ser. Earth Environ. Sci. 2020, 492, 012086. [Google Scholar] [CrossRef]
- Nitsuwat, S.; Zhang, P.; Ng, K.; Fang, Z. Fish gelatin as an alternative to mammalian gelatin for food industry: A meta-analysis. LWT 2021, 141, 110899. [Google Scholar] [CrossRef]
- Liang, M.; Li, Z.; Gao, C.; Wang, F.; Chen, Z. Preparation and characterization of gelatin/sericin/carboxymethyl chitosan medical tissue glue. J. Appl. Biomater. Funct. Mater. 2018, 16, 97–106. [Google Scholar] [CrossRef]
- Zhang, L.; Zhou, Y.; Wu, Q.; Han, Z.; Zhao, Z.; Li, F.; Wang, C.; Wei, K.; Li, G. A functional polyvinyl alcohol fibrous membrane loaded with artemisinin and chloroquine phosphate. J. Polym. Res. 2021, 28, 232. [Google Scholar] [CrossRef]
- Baker, M.I.; Walsh, S.P.; Schwartz, Z.; Boyan, B.D. A review of polyvinyl alcohol and its uses in cartilage and orthopedic applications. J. Biomed. Mater. Res. Part B Appl. Biomater. 2012, 100, 1451–1457. [Google Scholar] [CrossRef] [PubMed]
- Teodorescu, M.; Bercea, M.; Morariu, S. Biomaterials of PVA and PVP in medical and pharmaceutical applications: Perspectives and challenges. Biotechnol. Adv. 2019, 37, 109–131. [Google Scholar] [CrossRef] [PubMed]
- Feldman, D. Poly(Vinyl Alcohol) recent contributions to engineering and medicine. J. Compos. Sci. 2020, 4, 175. [Google Scholar] [CrossRef]
- Muppalaneni, S. Polyvinyl alcohol in medicine and pharmacy: A perspective. J. Dev. Drugs 2013, 02. [Google Scholar] [CrossRef] [Green Version]
- National Toxicology Program. Available online: https://ntp.niehs.nih.gov/ (accessed on 28 April 2022).
- Quan, L.; Xin, Y.; Wu, X.; Ao, Q. Mechanism of Self-Healing Hydrogels and Application in Tissue Engineering. Polymers 2022, 14, 2184. [Google Scholar] [CrossRef] [PubMed]
- Mad-Ali, S.; Benjakul, S.; Prodpran, T.; Maqsood, S. Characteristics and gelling properties of gelatin from goat skin as affected by drying methods. J. Food Sci. Technol. 2017, 54, 1646–1654. [Google Scholar] [CrossRef] [Green Version]
- Derkach, S.R.; Voron’ko, N.G.; Sokolan, N.I.; Kolotova, D.S.; Kuchina, Y.A. Interactions between gelatin and sodium alginate: UV and FTIR studies. J. Dispers. Sci. Technol. 2020, 41, 690–698. [Google Scholar] [CrossRef]
- Saidi, G.; Rahman, M.; Guizani, N. Fourier transform infrared (FTIR) spectroscopic study of extracted gelatin from shaari (Lithrinus microdon) skin: Effects of extraction conditions. Int. Food Res. J. 2012, 19, 1167–1173. [Google Scholar]
- Qadir, M.; Hossan, J.; Gafur, M.; Karim, M. Preparation and characterization of gelatin-hydroxyapatite composite for bone tissue engineering. Int. J. Eng. Sci. 2014, 14, 24. [Google Scholar]
- Irfanita, N.; Jaswir, I.; Mirghani, M.; Sukmasari, S.; Dewi Ardini, Y.; Lestari, W. Rapid detection of gelatin in dental materials using attenuated total reflection Fourier transform infrared spectroscopy (ATR-FTIR). J. Phys. Conf. Ser. 2017, 884, 012090. [Google Scholar] [CrossRef] [Green Version]
- Payne, K.J.; Veis, A. Fourier transform ir spectroscopy of collagen and gelatin solutions: Deconvolution of the amide I band for conformational studies. Biopolymers 1988, 27, 1749–1760. [Google Scholar] [CrossRef]
- Hendrawan, H.; Khoerunnisa, F.; Sonjaya, Y.; Putri, A.D. Poly (vinyl alcohol)/glutaraldehyde/Premna oblongifolia merr extract hydrogel for controlled-release and water absorption application. IOP Conf. Ser. Mater. Sci. Eng. 2019, 509, 012048. [Google Scholar] [CrossRef]
- Alhosseini, S.N.; Moztarzadeh, F.; Mozafari, M.; Asgari, S.; Dodel, M.; Samadikuchaksaraei, A.; Kargozar, S.; Jalali, N. Synthesis and characterization of electrospun polyvinyl alcohol nanofibrous scaffolds modified by blending with chitosan for neural tissue engineering. Int. J. Nanomed. 2012, 7, 25–34. [Google Scholar]
- Mansur, H.S.; Sadahira, C.M.; Souza, A.N.; Mansur, A.A.P. FTIR spectroscopy characterization of poly (vinyl alcohol) hydrogel with different hydrolysis degree and chemically crosslinked with glutaraldehyde. Mater. Sci. Eng. C 2008, 28, 539–548. [Google Scholar] [CrossRef]
- Kharazmi, A.; Faraji, N.; Mat Hussin, R.; Saion, E.; Yunus, W.M.; Behzad, K. Structural, optical, opto-thermal and thermal properties of ZnS-PVA nanofluids synthesized through a radiolytic approach. Beilstein J. Nanotechnol. 2015, 6, 529–536. [Google Scholar] [CrossRef] [PubMed] [Green Version]
- Awada, H.; Daneault, C. Chemical modification of poly(vinyl alcohol) in water. Appl. Sci. 2015, 5, 840–850. [Google Scholar] [CrossRef]
- Lin, S.-Y.; Cheng, W.-T.; Wei, Y.-S.; Lin, H.-L. DSC-FTIR microspectroscopy used to investigate the heat-induced intramolecular cyclic anhydride formation between Eudragit E and PVA copolymer. Polym. J. 2011, 43, 577–580. [Google Scholar] [CrossRef] [Green Version]
- Liu, B.; Zhang, J.; Guo, H. Research progress of polyvinyl alcohol water-resistant film materials. Membranes 2022, 12, 347. [Google Scholar] [CrossRef] [PubMed]
- Bahram, M.; Mohseni, N.; Moghtader, M. An introduction to hydrogels and some recent applications. In Emerging Concepts in Analysis and Applications of Hydrogels; Majee, S., Ed.; IntechOpen: London, UK, 2016. [Google Scholar]
- Kobayashi, M.; Kanekiyo, M.; Ando, I.; Amiya, S. A study of the gelation mechanism of poly(vinyl alcohol) in aqueous solution by high-resolution solid-state 13C NMR spectroscopy. Polym. Gels Netw. 1998, 6, 425–428. [Google Scholar] [CrossRef]
- Takeshita, H.; Kanaya, T.; Nishida, K.; Kaji, K. Gelation process and phase separation of PVA solutions as studied by a light scattering technique. Macromolecules 1999, 32, 7815–7819. [Google Scholar] [CrossRef]
- Bercea, M.; Morariu, S.; Rusu, D. In situ gelation of aqueous solutions of entangled poly(vinyl alcohol). Soft Matter 2013, 9, 1244–1253. [Google Scholar] [CrossRef]
- Kanaya, T.; Takahashi, N.; Takeshita, H.; Ohkura, M.; Nishida, K.; Kaji, K. Structure and dynamics of poly(vinyl alcohol) gels in mixtures of dimethyl sulfoxide and water. Polym. J. 2012, 44, 83–94. [Google Scholar] [CrossRef] [Green Version]
- Cavalieri, F.; Miano, F.; D’Antona, P.; Paradossi, G. Study of gelling behavior of poly(vinyl alcohol)-methacrylate for potential utilizations in tissue replacement and drug delivery. Biomacromolecules 2004, 5, 2439–2446. [Google Scholar] [CrossRef]
- Hetsroni, G.; Zakin, J.L.; Lin, Z.; Mosyak, A.; Pancallo, E.A.; Rozenblit, R. The effect of surfactants on bubble growth, wall thermal patterns and heat transfer in pool boiling. Int. J. Heat Mass Transf. 2001, 44, 485–497. [Google Scholar] [CrossRef]
- Yang, Q.; Li, Z.; Hong, Y.; Zhao, Y.; Qiu, S.; Wang, C.; Wei, Y. Influence of solvents on the formation of ultrathin uniform poly(vinyl pyrrolidone) nanofibers with electrospinning. J. Polym. Sci. B Polym. Phys. 2004, 42, 3721–3726. [Google Scholar] [CrossRef]
- Prahasti, G.; Zulfi, A.; Munir, M.M. Needleless electrospinning system with wire spinneret: An alternative way to control morphology, size, and productivity of nanofibers. Nano Express 2020, 1, 010046. [Google Scholar] [CrossRef]
- Ahmmed, K.M.T.; Syeda, S. Enhancement of nucleate pool boiling heat transfer with sodium oleate. J. Chem. Eng. 2017, 29, 44. [Google Scholar] [CrossRef] [Green Version]
- Zhmud, B. Viscosity Blending Equations. Lube 2014, 121, 24. [Google Scholar]
- Härth, M.; Schubert, D.W. Simple approach for spreading dynamics of polymeric fluids. Macromol. Chem. Phys. 2012, 213, 654–665. [Google Scholar] [CrossRef]
- Kuo, T.-Y.; Jhang, C.-F.; Lin, C.-M.; Hsien, T.-Y.; Hsieh, H.-J. Fabrication and application of coaxial polyvinyl alcohol/chitosan nanofiber membranes. Open Phys. J. 2017, 15, 1004–1014. [Google Scholar] [CrossRef]
- Bhattacharya, A.; Ray, P. Studies on surface tension of poly(vinyl alcohol): Effect of concentration, temperature, and addition of chaotropic agents. J. Appl. Polym. Sci. 2004, 93, 122–130. [Google Scholar] [CrossRef]
- Johnston, J.H.; Peard, G.T. The surface tension of gelatin solutions. Biochem. J. 1925, 19, 281–289. [Google Scholar] [CrossRef] [PubMed] [Green Version]


| Process Parameters for Gelatin/PVA Films by Spin Coating | |
|---|---|
| Speed (rpm) | 3000 |
| Operational temperature (°C) | Room temperature |
| Deposition time (second) | 60 |
| Gelatin concentration in DI water (wt. %) | 12 |
| PVA concentration in DI water (wt. %) | 12 |
| Acetic acid concentration in DI water (vol. %) | 10 mL/100 mL (10%) |
| Mixture of polymeric solution volume ratio (vol. %) | 8:2, 6:4, 5:5, 4:6, 2:8, 0:10 in total 10 mL |
| Process Parameters for Gelatin/PVA Nanofibers by Electrospinning | |
|---|---|
| Voltage (kV) | 12–12.5 |
| Syringe pumping speed (μL/min) | 1 × 10⁻² |
| Syringe outer/inner diameter (mm) | 5.0 × 10⁻¹/2.6 × 10−1 |
| Operational temperature (°C) | Room temperature |
| Working distance (cm) | 12 |
| Deposition time (sec) | >60 |
| Volumetric Ratio Gel:PVA | |||||||
|---|---|---|---|---|---|---|---|
| 10:0 | 8:2 | 6:4 | 5:5 | 4:6 | 2:8 | 0:10 | |
| Viscosity | |||||||
| 8.7258×e0.91109x | |||||||
| Coefficient of Determination R2 | 0.972 | ||||||
| 95% confidence interval | 6.2662 ≤ 8.7258 ≤ 12.1508 0.8370 ≤ 0.91109 ≤ 0.9851 | ||||||
| Sensitivity (slope of fitting function) | 19.7542 | 49.1432 | 122.2549 | 304.1370 | 756.6103 | 1882.2410 | 4682.5044 |
| pH | |||||||
| y = 5.5143×10⁻²x + 3.232 | |||||||
| Coefficient of Determination R2 | 0.983 | ||||||
| 95% confidence interval | 3.2088 ≤ 3.232 ≤ 3.2552 0.0492 ≤ 0.055143 ≤ 0.0611 | ||||||
| Sensitivity (slope of fitting function) | 0.0551 | ||||||
| Electrical Conductance | |||||||
| y = −3.6419×10⁻⁴x + 2.7648×10⁻³ | |||||||
| Coefficient of Determination R2 | 0.966 | ||||||
| 95% confidence interval | 0.0025 ≤ 0.0027648 ≤ 0.0030 −0.0003 ≤ −0.00036419 ≤ −0.0004 | ||||||
| Sensitivity (slope of fitting function) | −3.6419×10⁻⁴ | ||||||
| Surface Tension | |||||||
| y = −1.0827x + 39.973 | |||||||
| Coefficient of Determination R2 | 0.982 | ||||||
| 95% confidence interval | 39.2904 ≤ 39.973 ≤ 40.6562 −1.2354 ≤ −1.0827 ≤ −0.9300 | ||||||
| Sensitivity (slope of fitting function) | −1.0827 | ||||||
Publisher’s Note: MDPI stays neutral with regard to jurisdictional claims in published maps and institutional affiliations. |
© 2022 by the authors. Licensee MDPI, Basel, Switzerland. This article is an open access article distributed under the terms and conditions of the Creative Commons Attribution (CC BY) license (https://creativecommons.org/licenses/by/4.0/).
Share and Cite
Chi, H.Y.; Chang, N.Y.; Li, C.; Chan, V.; Hsieh, J.H.; Tsai, Y.-H.; Lin, T. Fabrication of Gelatin Nanofibers by Electrospinning—Mixture of Gelatin and Polyvinyl Alcohol. Polymers 2022, 14, 2610. https://0-doi-org.brum.beds.ac.uk/10.3390/polym14132610
Chi HY, Chang NY, Li C, Chan V, Hsieh JH, Tsai Y-H, Lin T. Fabrication of Gelatin Nanofibers by Electrospinning—Mixture of Gelatin and Polyvinyl Alcohol. Polymers. 2022; 14(13):2610. https://0-doi-org.brum.beds.ac.uk/10.3390/polym14132610
Chicago/Turabian StyleChi, Hsiu Yu, Nai Yun Chang, Chuan Li, Vincent Chan, Jang Hsin Hsieh, Ya-Hui Tsai, and Tingchao Lin. 2022. "Fabrication of Gelatin Nanofibers by Electrospinning—Mixture of Gelatin and Polyvinyl Alcohol" Polymers 14, no. 13: 2610. https://0-doi-org.brum.beds.ac.uk/10.3390/polym14132610