
Assessment of Natural Zeolite Clinoptilolite for Remediation of Mercury-Contaminated Environment


1
Faculty of Chemistry and Technology, Department of Environmental Engineering, University of Split, Ruđera Boškovića 35, 21 000 Split, Croatia
2
Geological Survey of Slovenia, Dimičeva ulica 14, 1000 Ljubljana, Slovenia
*
Author to whom correspondence should be addressed.
Processes 2022, 10(4), 639; https://0-doi-org.brum.beds.ac.uk/10.3390/pr10040639
Submission received: 17 February 2022
/
Revised: 9 March 2022
/
Accepted: 22 March 2022
/
Published: 24 March 2022
(This article belongs to the Special Issue Wastewater and Waste Treatment: Overview, Challenges and Current Trends)
Abstract
:The soil at ancient roasting sites in the surroundings of the Idrija mine (Slovenia) is highly contaminated with mercury. To assess the impact of mercury on groundwater by infiltration and find an eco-friendly remediation method, the leaching of mercury from the soil containing 1347 mg Hg/kg, followed by sorption of the total leached mercury on cost-effective natural zeolite (NZ) clinoptilolite, was performed. The leaching of soil in ultrapure water of pHo = 3.00–11.46 after 24 h resulted in the total leached mercury concentration in the range 0.33–17.43 µg/L. Much higher concentrations (136.9–488.0 µg/L) were determined after the first few hours of leaching and were high above the maximum permissible level in water for human consumption. The NZ showed very good sorption of the total leached mercury, with a maximum removal efficiency of 94.2%. The leaching of mercury in presence of the NZ resulted in a significant decrease of the total leached mercury (1.9–20.3 µg/L compared to 12.8–42.2 µg/L), with removal efficiencies up to 90.5%, indicating immobilization of mercury species. The NZ has a great potential for economically viable remediation of mercury-contaminated environment. However, efforts should be made in the further study of mercury leachability to reduce the mercury concentration in water to acceptable levels.
1. Introduction
Mercury (Hg) and its compounds are identified as priority hazardous substances in the field of water policy and are listed among the 10 chemicals of major public health concern [1,2]. It is well-known that mining and ore processing areas are known to be major sources of mercury pollution, especially mercury-enriched ore deposits that have been exploited for centuries by inadequate techniques [3]. The other anthropogenic sources of mercury are small-scale gold mining, coal combustion, metal smelting and cement production [4,5]. Despite the awareness of the negative mercury impact on both human health and global environment, some of the mercury compounds are still used in the production of vinyl chloride, chlorine-based chemicals, in dentistry and in skin lightening products, but also in traditional medicines and some ritualistic and religious practices [6,7].
Once emitted in the atmosphere, mercury can be transmitted long distances, becoming a global concern and must be considered at international levels. For example, 40–80% of the annual amount of mercury deposited in Europe originates from mercury emissions from outside its boundaries [2]. Even if all anthropogenic emissions cease immediately, the significant amount of mercury in the environment will lag behind for centuries [4]. Mercury toxicity is very dependent on its speciation and transformation, and the process of mercury methylation is perhaps the most significant process in the global circulation of mercury in the environment [4,8]. Among all mercury compounds, organic mercury is considered to be the most dangerous due to rapid and extensive absorption by the human body through the food chain. For preventing or reducing the exposure to these pollutants, the remediation of mercury-polluted environments is of primary interest [5,9]. In a selection of remediation technology, the main approaches include immobilization of the contaminant or its removal from polluted media, using ex situ or in situ technologies. Ex situ technologies are quite expensive, while in situ technologies using thermal, biological or physical and chemical methods are more economically viable [9,10,11,12]. Alternative photocatalytic and electrocatalytic approaches for eco-friendly mercury removal are also being developed [13,14,15,16]. There is no single technology appropriate for all contaminants; thus, a combination of different technologies is needed for achieving satisfying results. So far, different materials have been studied for mercury removal, from waste to modified and novel materials [17,18,19,20]. The usage of novel materials is very effective but quite expensive, while waste materials are cost effective but sometimes limited due to the possible content of toxic ingredients. Among natural materials, zeolites seem adequate for remediation due to the prevalence of their natural deposits, simple and economically acceptable exploitation, high removal capacity and great reusability [21,22,23].
The present study aimed to investigate the potential of natural zeolite (NZ) for mercury capturing in order to remediate the extremely mercury-contaminated sites of Idrija district in Slovenia, without causing secondary pollution. Namely, in the Idrija mine, which is the second largest mercury mine in the world, during 500 years (1490–1995) of mercury exploitation from ore containing cinnabar (HgS) and/or native mercury (Hg0), around 37,500 t of mercury were lost into the environment [24,25,26,27,28,29,30]. Extremely high concentrations of mercury (10 to even 10,000 mg/kg) found in the soil represent a potential source of mercury in aquatic systems by runoff and migration through the porous media [26,28]. The geochemical studies estimated that mercury will leach from these sites into groundwater for at least the next 100 years [26,27,28,30]. Therefore, the plan for remediation is extremely necessary in order to protect sources of drinking water.
A promising approach to remediation of contaminated groundwater is a permeable reactive barrier, where natural zeolite can be used as a filler material for immobilization of mercury by sorption process [31]. To the best of our knowledge, this is the first attempt at using natural zeolite clinoptilolite for possible remediation of the mercury-contaminated environment at these sites. It is expected that this research will expand the knowledge on the possible application of natural zeolites in environmentally friendly and economically viable in situ remediation technologies of the mercury-contaminated environment and contribute to the reduction of mercury migration. Ultimately, the results obtained could contribute to solving serious environmental problems caused by the presence of mercury and other heavy metals in the environment, especially in waters, with the final goal of protecting human health.
2. Materials and Methods
2.1. Samples Preparation
The experiments were carried out on the contaminated soil taken within the first 30 cm of the soil profile F1 at the Ferbejžene trate roasting site in Idrija district in Slovenia (location of F1 profile is given in Gosar and Čar [32], for more details see also Teršič et al. [26]). The air-dried sample of soil was gently disaggregated in a ceramic mortar, sieved through a 2 mm sieve, then pulverized in an agate mill to a fine-grain size of <0.075 mm and stored in polyethylene bags.
The natural zeolite (NZ) used in this research originates from the Zlatokop deposit in Vranjska Banja (Serbia). The sample was milled and sieved (Retsch AS200 basic device) in order to obtain two particle sizes (<0.04 mm and 0.6–0.8 mm), washed several times with ultrapure water in order to remove impurities, dried at 60 °C and finally stored in a desiccator until use.
2.2. Physicochemical Characterization of Contaminated Soil
Elemental analysis of mercury-contaminated soil (3 parallel analysis/3 sample replicates) was performed by simultaneous multielement analysis of 53 elements. Elemental concentrations were analyzed at AcmeLabs, Vancouver, Canada (accredited under ISO 9001:2008) with inductively coupled plasma (ICP) mass spectrometry (MS) after digestion of an aliquot of 15 g sample material with aqua regia (1:1:1 HCl:HNO3:H2O) for 3 h at 160 °C. Samples exceeding the upper detection limit for Hg (100 mg/kg) were analyzed using ICP emission spectrometry (ICP-ES).
The soil pH value was determined in a 1:5 soil:suspensions ratio in water (pH-H2O), as well as in electrolyte solutions, 1 M potassium chloride (pH-KCl) and 0.01 M calcium chloride (pH-CaCl2) following the DIN ISO standard method [33].
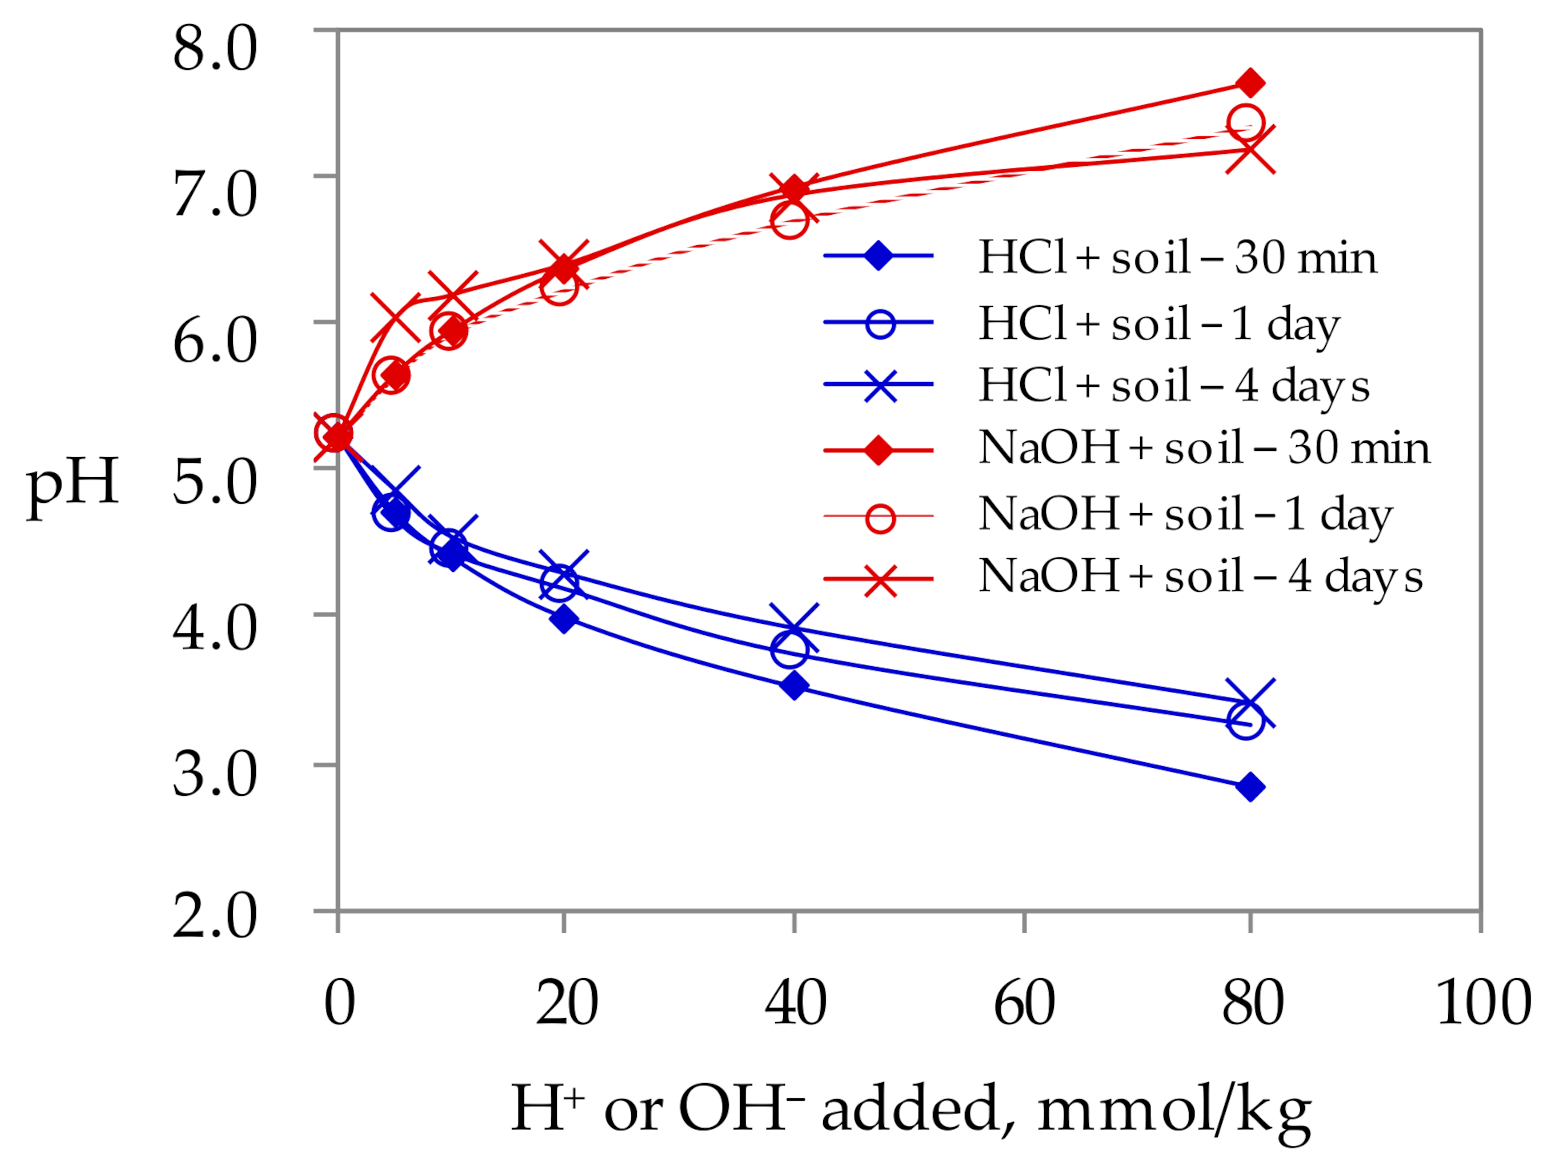
The soil buffering capacity (BC) was determined by the addition of dilute 0.1 M HCl or 0.1 M NaOH solutions (0, 5, 10, 20, 40 and 80 mmol/kg of soil) to 1:5 soil:water suspensions. The suspensions were shaken occasionally, and the pH values were monitored after 30 min, 1 day and 4 days, in order to establish pH equilibration [34,35].
The cation exchange capacity (CEC) of the soil was determined according to HRN EN ISO standard method [36] using barium chloride (barium chloride dihydrate for analysis EMSURE® ACS, ISO, Reag. Ph Eur, Merck, Darmstadt, Germany).
The rough estimation of soil organic matter (SOM) content was performed by a loss on ignition (LOI) procedure at 400 °C to accomplish the destruction of organic matter while avoiding overestimation of its content due to destruction of present mineral matter through the loss of structural water [37,38,39]. After oven-drying at 90 °C, the weighed soil sample was heated at 400 °C to constant mass. The SOM percentage was calculated as follows:
where SOM is the estimated soil organic matter content (%), m90°C is the soil weight after oven-drying at 90 °C (g) and m400°C is the soil weight after heating at 400 °C (g).
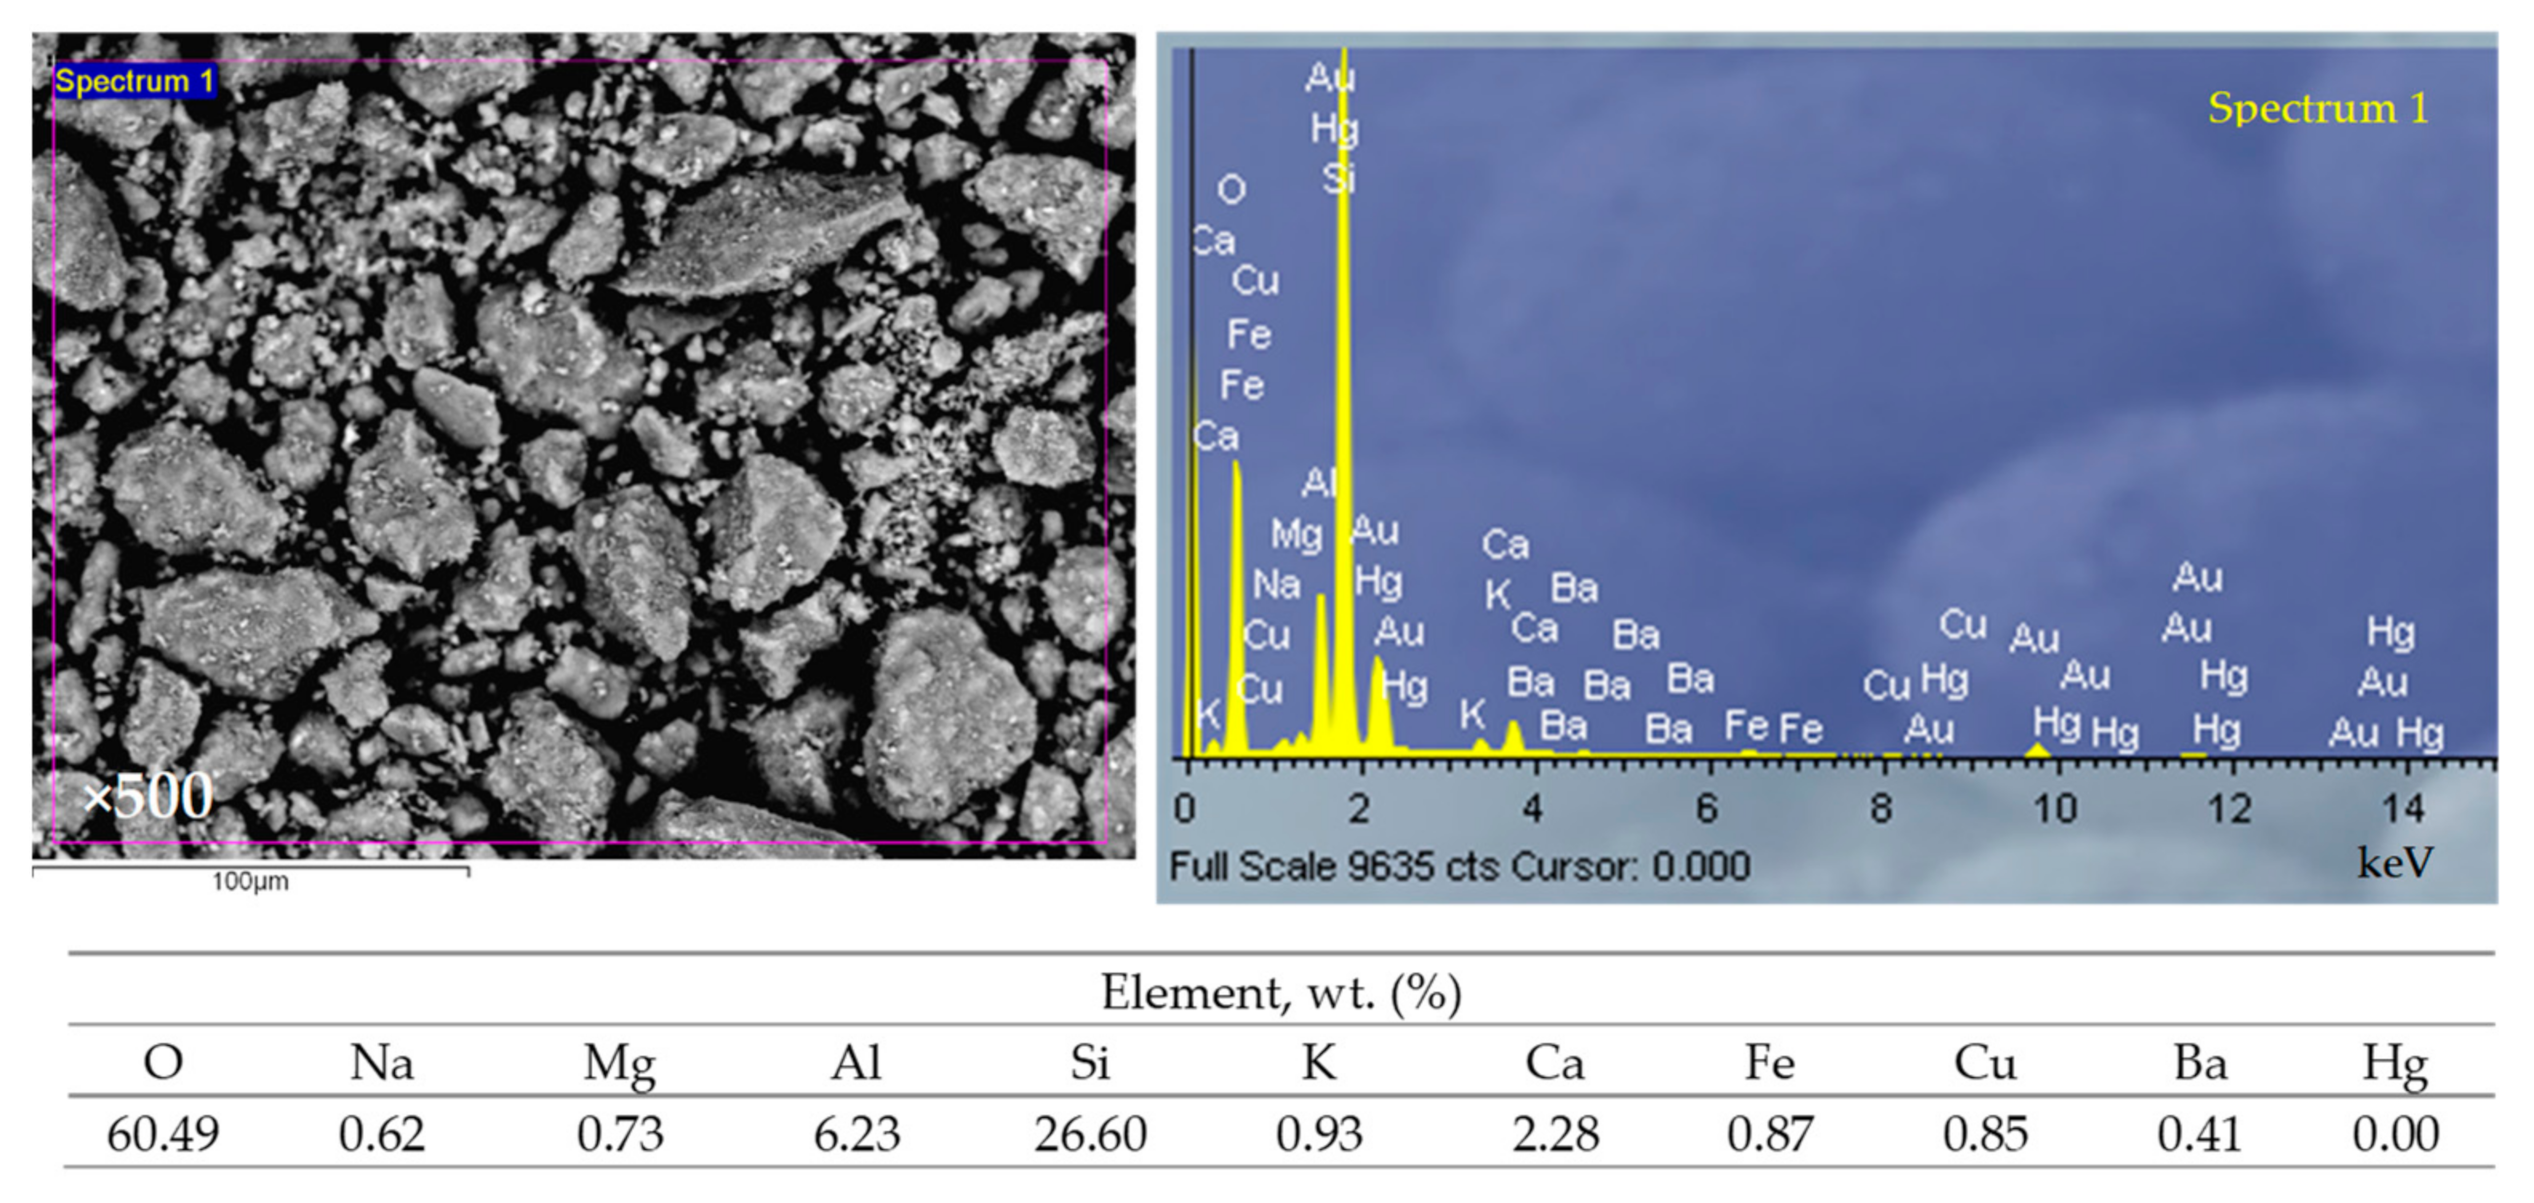
The morphological characterization of the soil sample and zeolite samples after sorption were analyzed by scanning electron microscopy (SEM), while the semi-quantitative elemental composition by energy dispersive spectrometry (EDS) technique on Jeol Scanning Microscope—6610LV. The SEM analysis through the secondary electron image (SEI) and backscattered electrons (BEC) at magnifications from 300× to 1400× was performed. The BEC view provided insight into the phases of different chemical compositions present on the surface of the soil particle. Imaging was also performed in selected sites (spectra) on the particle surface or over the entire surface (mapping analysis).
For identification and quantification of the mineralogical composition of the soil, the X-ray powder diffraction (XRPD) technique was used. The X-ray diffraction patterns were collected in the Bragg–Brentano geometry using a Panalytical Aeris bench-top diffractometer with Ni-filtered CuKα radiation obtained from an X-ray tube operating at 7.5 mA and 40 kV, in the 2θ range of 5–80°. Samples were prepared in a thin film on a zero-background silicon holder, which was spinning during data collection. The powder X-ray diffraction patterns were analyzed by the Rietveld method using the Topas program (Bruker-AXS, Karlsruhe, Germany).
2.3. Leaching and Sorption Experiments
Leaching experiments provide insight into the changes in solubility of soil compounds and enable the environmental impact assessment of soil pollutants. For investigation of mercury leaching from the soil and its possible capturing onto natural zeolite, two different approaches were used. The first one was performed in two steps, by leaching the total mercury from the contaminated soil and its subsequent sorption onto natural zeolite. On the contrary, the second one involved simultaneous leaching and sorption by mixing the soil with ultrapure water without or with the addition of the natural zeolite to the soil.
2.3.1. Leaching of Mercury from the Contaminated Soil Followed by Sorption from the Obtained Leachates onto Natural Zeolite
The leaching experiments were performed in accordance with the standard batch method DIN 38414 S4 [40]. Nine portions of ultrapure water of different initial pHo values in the range from 3.00 to 11.46, adjusted by addition of 1 M HNO3 or 1 M KOH, were mixed with mercury-contaminated soil in the solid/liquid ratio, S/L = 1/10, in an incubator shaker at 23 ± 2 °C, at 25 rpm for 24 h. The nine obtained leachates were separated from the solid phase by double centrifugation at 4000 rpm for 15 min followed by filtration through 0.45 µm filter, and the concentration of the total mercury in supernatants was determined by atomic absorption spectrometry on a direct thermal decomposition mercury analyzer (Mercury Analyzer MA—3000, NIC). During the experiment, the pH and electrical conductivity were monitored.
Afterwards, obtained leachates were subjected to sorption on NZ of two particle sizes (<0.04 mm or 0.6–0.8 mm) by batch method. The NZ and each leachate were shaken in the S/L ratio of 1/100 at 23 ± 2 °C, at 25 rpm for 24 h. The experiment was monitored by measuring the pH and electrical conductivity at defined time intervals within 24 h, while the residual total mercury concentration was determined after 24 h. The experiments were performed in duplicate.
2.3.2. Simultaneous Leaching of Mercury from the Contaminated Soil and Its Sorption onto Natural Zeolite
Further leaching experiments were carried out in batch mode at three different initial pHo values of ultrapure water of 4.11, 5.09 and 6.04, chosen based on previously obtained results. The ultrapure water and the contaminated soil were stirred at ≈800 rpm in S/L = 1/10 (300 g/3000 mL) at 23 ± 2 °C for 24 h, simultaneously in two 5-liter batch reactors, without and with the addition of 10% of NZ (0.6–0.8 mm) to the soil. The stirring speed was chosen in such a way to keep the soil in suspension. For monitoring the concentration of the total mercury leached over time, a certain volume of suspension was taken at each time interval (1, 2, 3, 4, 5, 7 and 24 h), where the total sampled volume did not exceed 5% of the total suspension volume. In the obtained supernatants, the residual concentration of the total mercury was analyzed on a mercury analyzer. The pH and electrical conductivity were measured in the suspensions at the same time intervals.
3. Results and Discussion
3.1. Physicochemical Characterization of the Mercury-Contaminated Soil
The elemental analysis of mercury-contaminated soil is presented in Table 1. Element content in the soil represents the mean value of three measurements. As it can be seen the total mercury content of 1347 mg/kg indicates extremely contaminated soil. For comparison, agricultural land is considered contaminated when mercury content is higher than the threshold value of 0.5 mg/kg [41,42,43]. According to the previous research, the average percentage of non-cinnabar compounds at roasting sites of the Idrija district was 35–40%, showing that soil contains considerable amounts of potentially bioavailable mercury that could leach into the environment [26]. Among others, the major elements in the soil are Fe and Al. There are also substantial amounts of Ca, Mg, K and Mn followed by S and P. In significantly lower amounts, Ce, Zn, Li, Ba, V, Pb, La, Rb, Cr and As are present, while other elements are present only in traces.
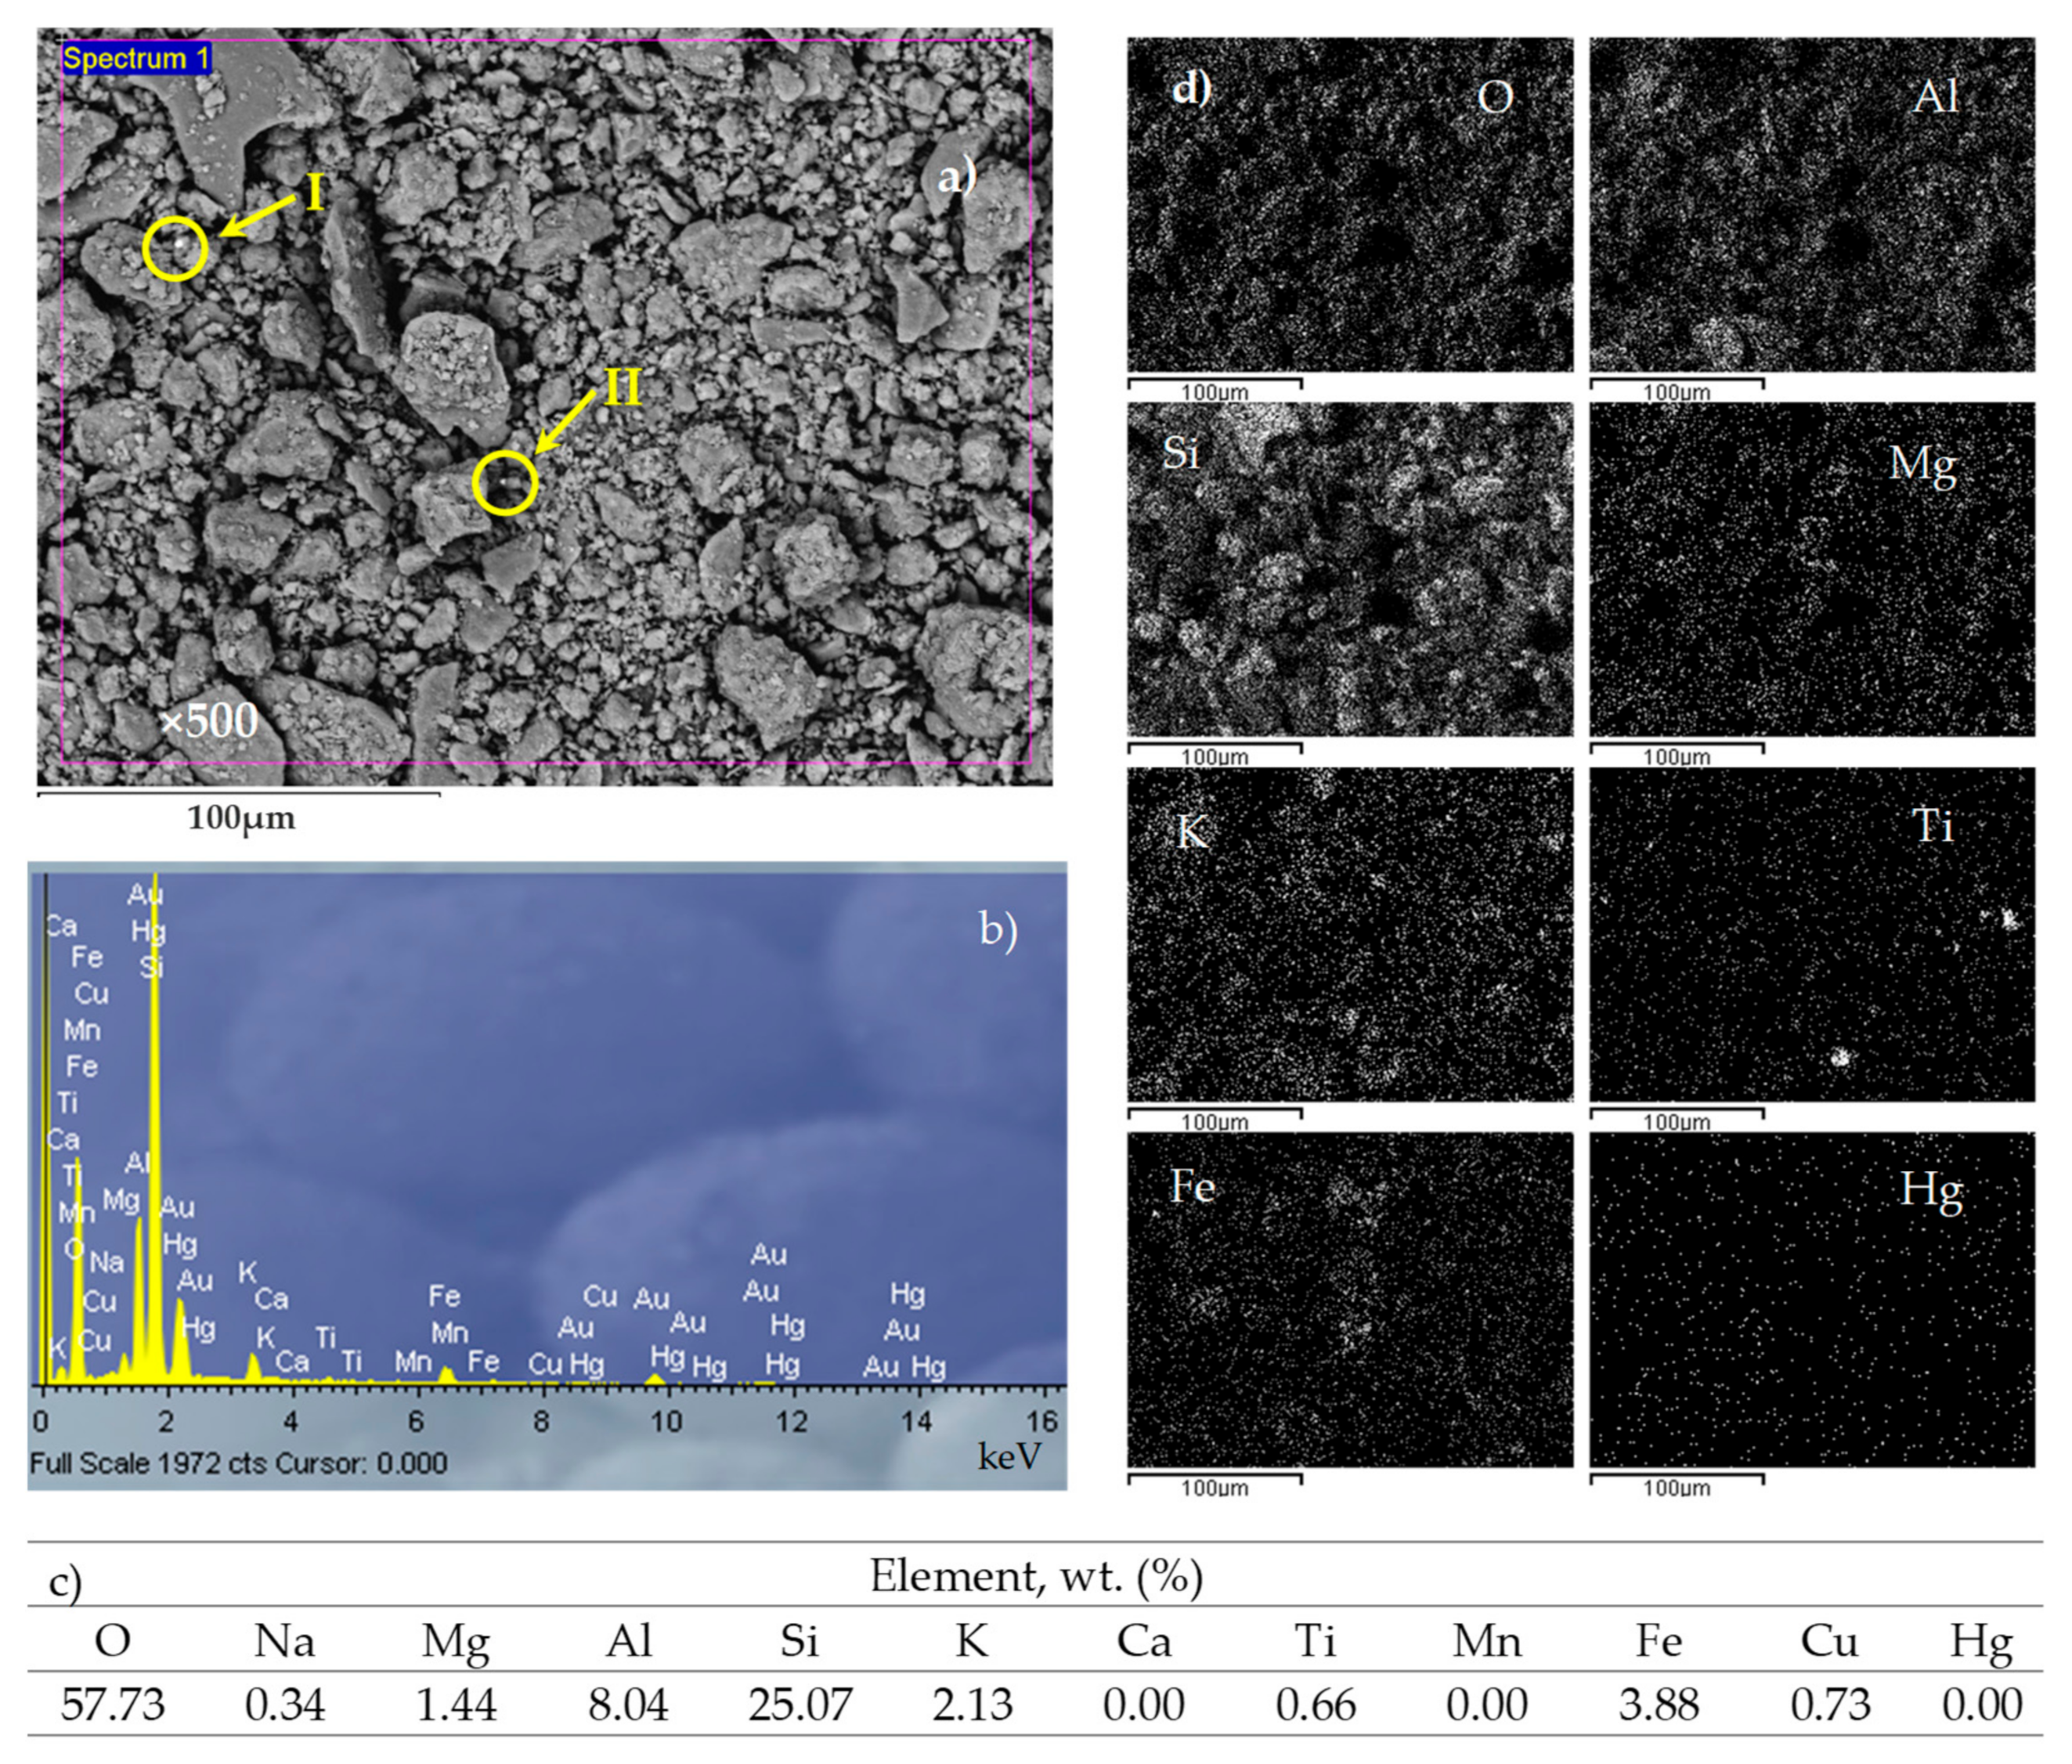
The goal of SEM-EDS analysis was to examine the surface morphology and to identify the main elements and their proportions, especially mercury. Figure 1 represents the SEM image of mercury-contaminated soil with corresponding EDS results and mapping analysis. It can be seen that mercury is uniformly distributed over entire selected area, but among the most abundant elements (O, Si and Al), its content (in weight %) was too low to be determined.
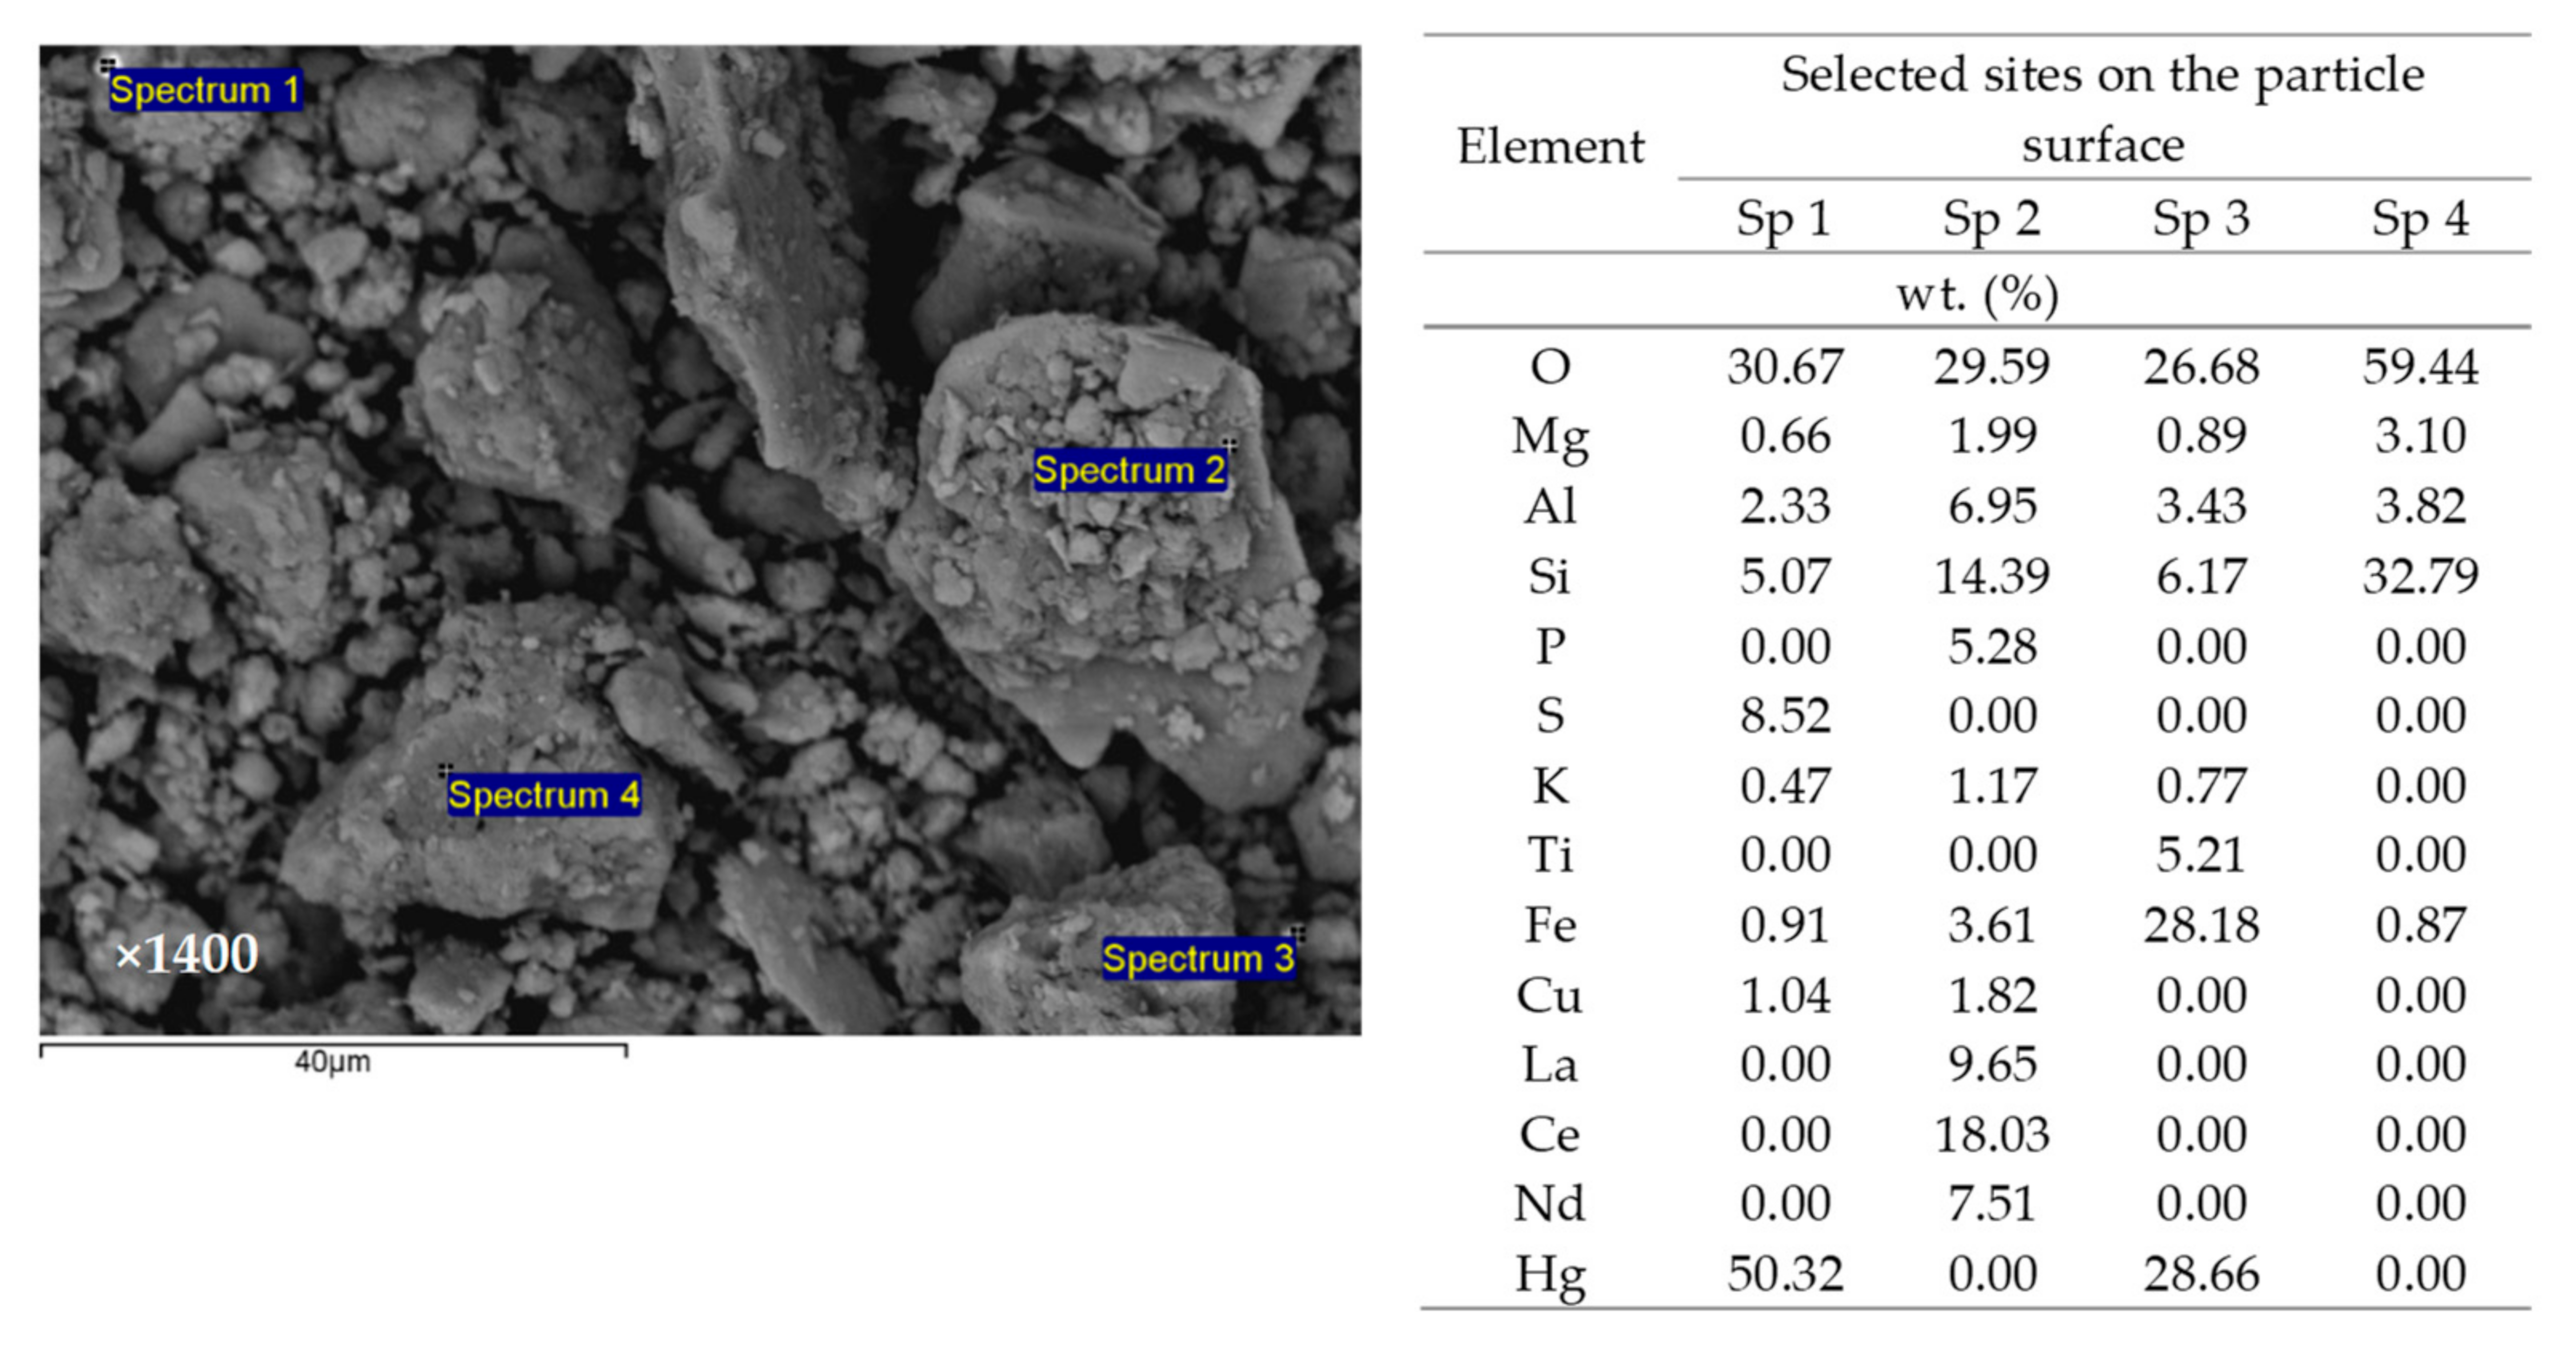
Nevertheless, two bright agglomerates were observed on SEM image in Figure 1 and marked as I and II. Therefore, additional SEM-EDS analysis was performed at magnification of 1400× as shown in Figure 2, where Spectrum 1 represents agglomerate I and Spectrum 3 represents agglomerate II.
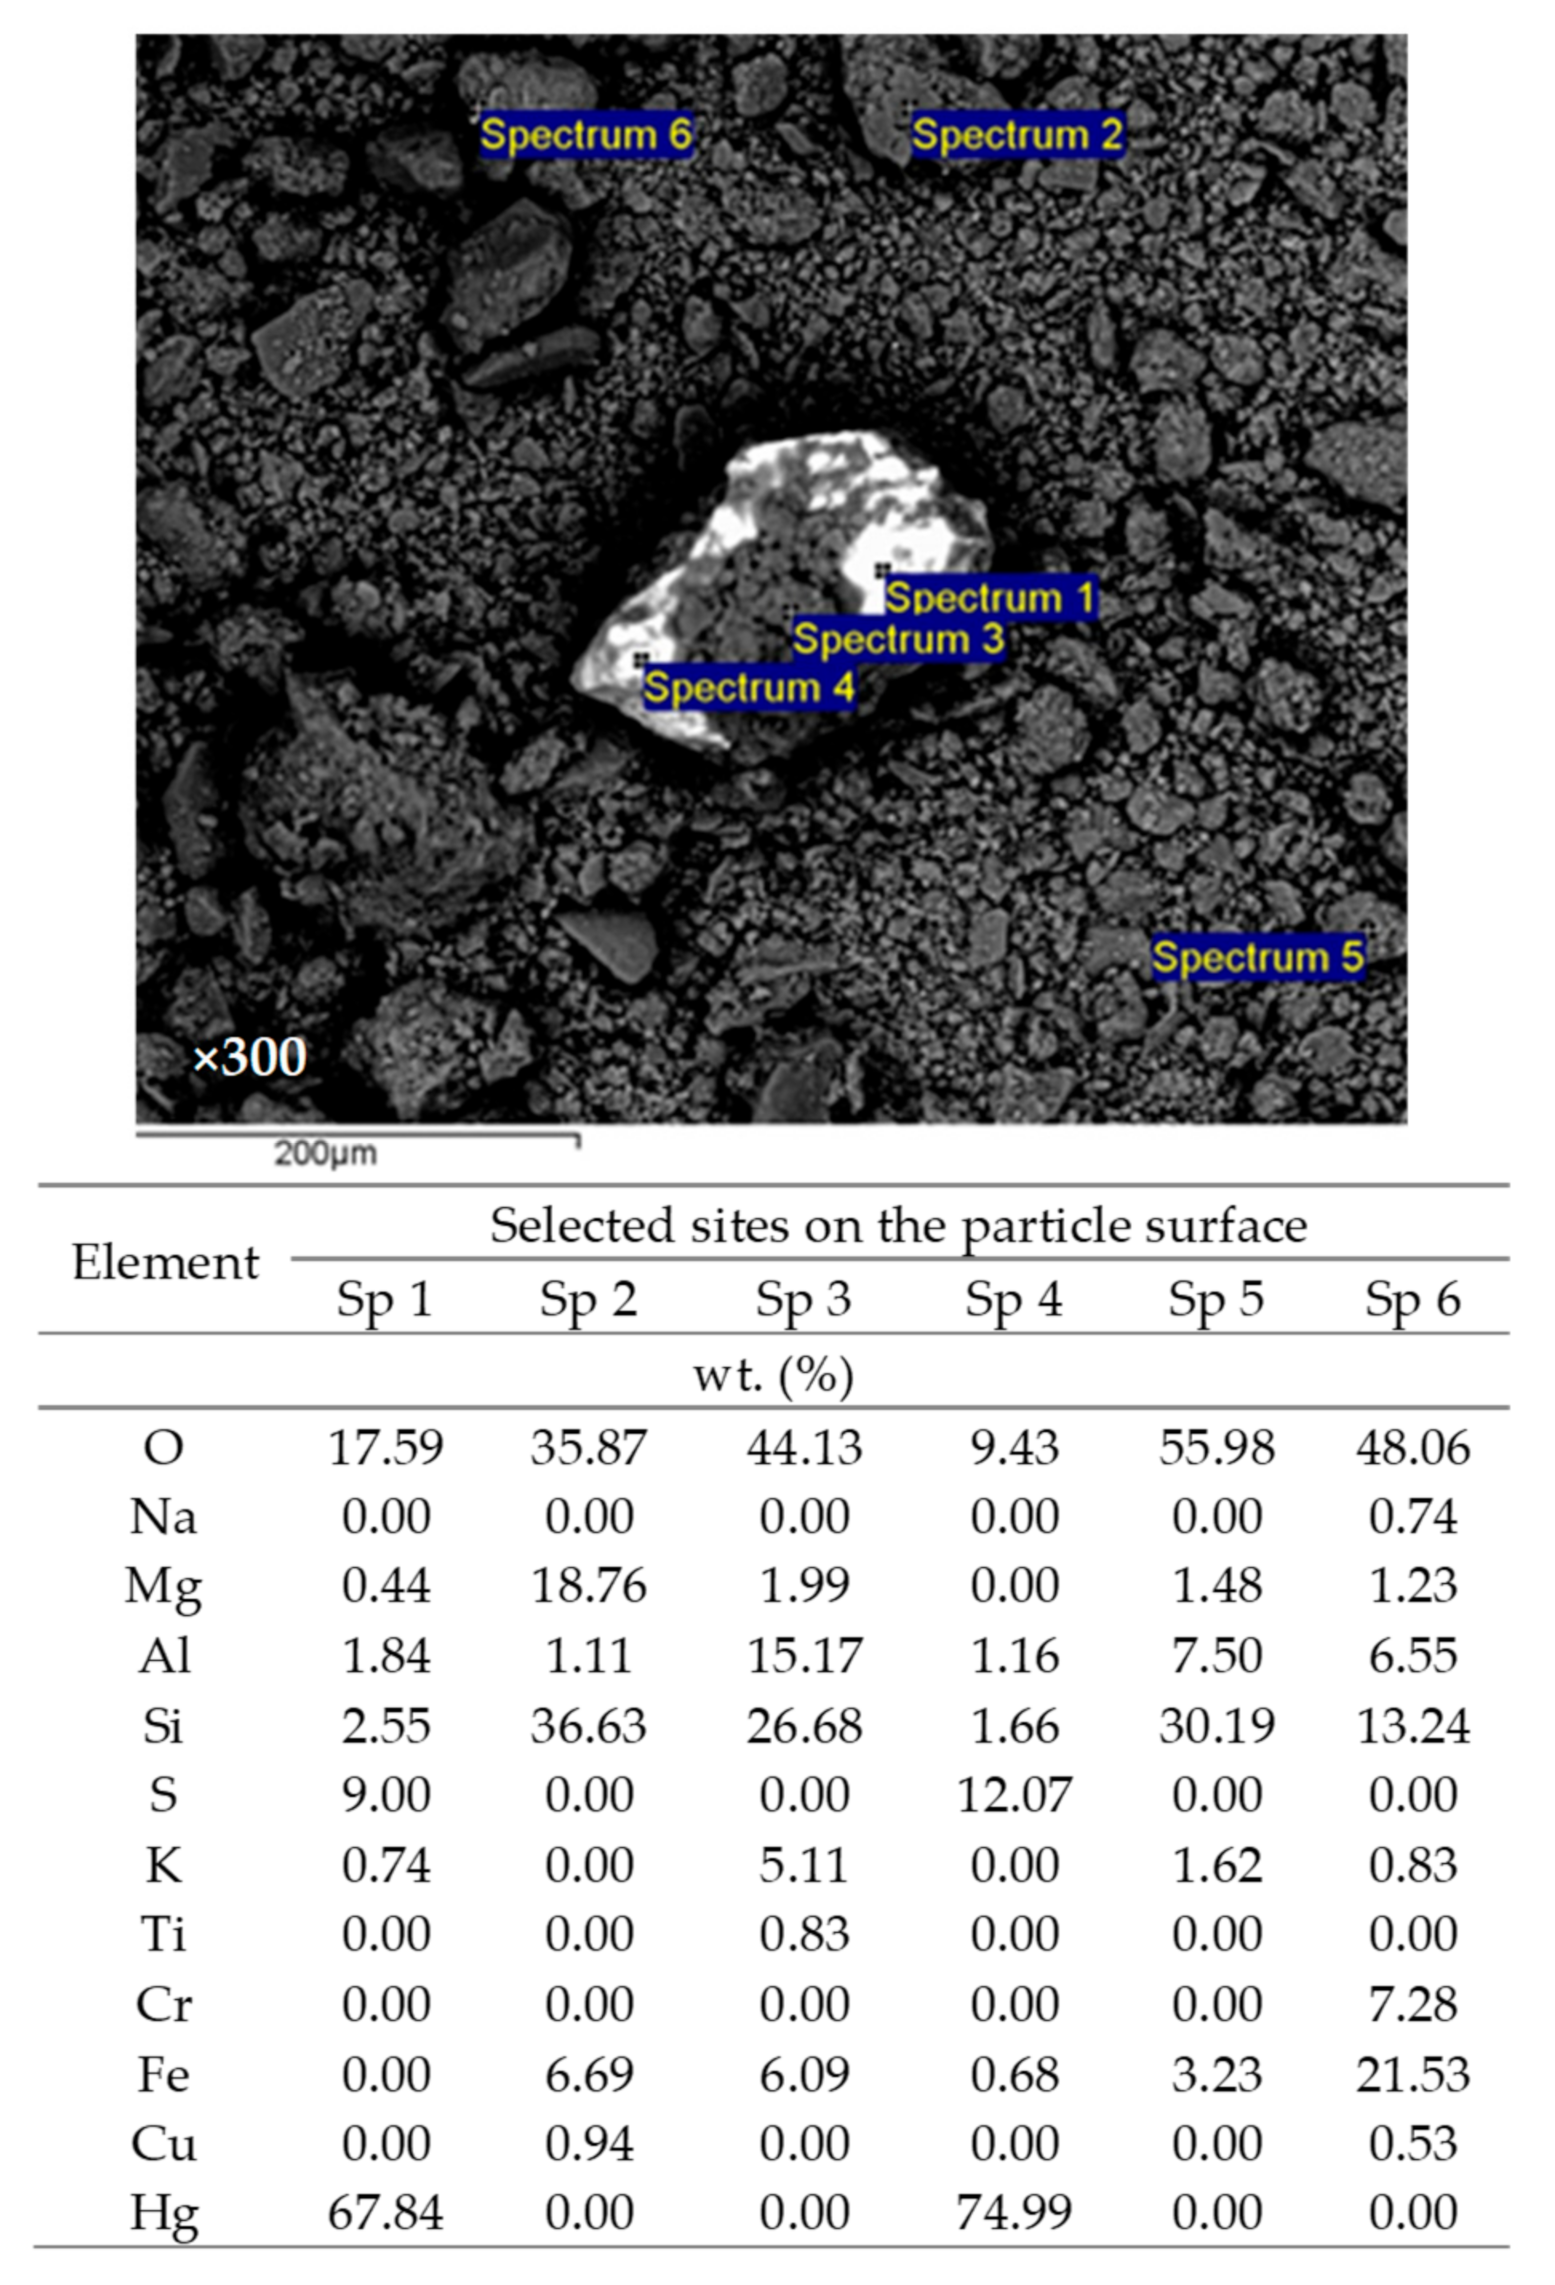
According to EDS analysis, the analyzed sites (Spectra 1 and 3) in Figure 2 contain mercury in large quantities probably in the form of HgS and HgO. In the analyzed site (Spectrum 3), besides mercury, iron oxide is also found, which is in agreement with the high content of iron in the soil obtained by elemental analysis given in Table 1. A particle in Figure 3 is another confirmation of the cinnabar (HgS) presence in the analyzed soil.
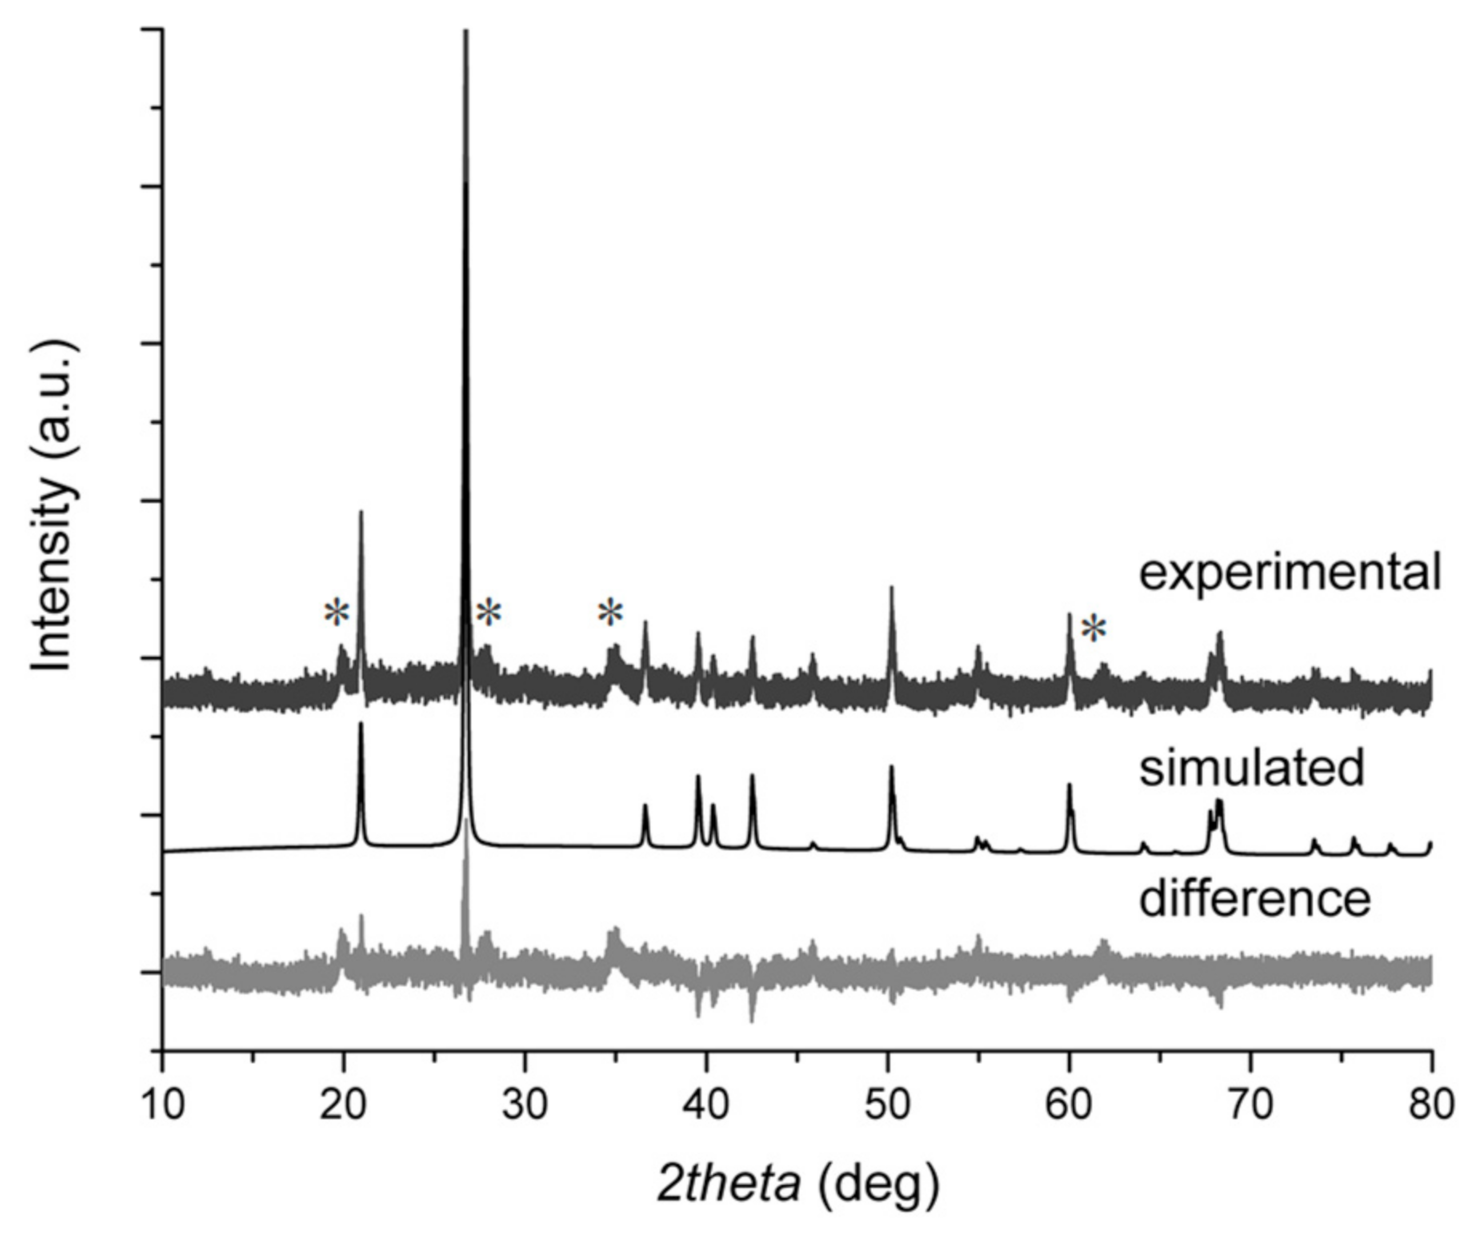
It can be seen that the bright areas (Spectra 1 and 4) contain higher amounts of sulfur (9.00 and 12.07 wt. %), oxygen (17.59 and 9.43 wt. %) and mercury (67.84 and 74.99 wt. %), indicating the presence of HgS and HgO. The other spectra in Figure 3 contain neither sulfur nor mercury, and represent the common soil composition, with elevated content of O, Si, Al, Mg and Fe as major elements, which are commonly expressed as oxides [44]. According to the obtained SEM-EDS results, it can be observed that at all sites without mercury content, the amount of silicon and aluminum components are elevated. Elemental analysis from Figure 1 and Figure 3 confirm silicon content on the marked spectra, which is in correspondence to SiO2 determined by XRD analysis of the soil and presented in Figure 4. The Rietveld analysis shows that the soil sample mostly consists of alpha-quartz [45]. There are also additional small diffraction peaks in the patterns, which remain unidentified. There is no amorphous halo in the pattern background indicating that the sample is largely crystalline.
It was found that SOM content in the analyzed soil was 5.16%, indicating the soil has low organic content [46,47]. In general, soil is composed of mineral fraction and organic matter, where the total amount of organic matter usually ranges from 0.5% to 10%. However, despite these usually small proportions of the soil organic components, their impact on soil properties is often much greater than would be expected, since, unlike minerals, organic matter in the soil is transformed much faster [48,49]. Organic matter significantly increases the soil capacity for ion sorption by regulating the balance between ions in the soil solution and those exchangeable on colloidal soil particles. Thus, the soil organic matter greatly affects the mobility and availability of metals in soil. Organic matter has a large capacity to bind mercury, creating very stable complexes [50,51]. Previous analyses of mercury species in highly Hg-contaminated soil from ancient small-scale ore roasting sites in the Idrija area (Pšenk and Ferbejžene trate) have shown that more than 90% of soluble mercury occurs in non-reactive organic complexes, confirming the preferential binding of mercury to organic matter. The amount of easily reactive mercury is generally low and ranges from 0.038% to 1.7% of the total soluble mercury [52].
3.2. Chemical Behavior of the Mercury-Contaminated Soil
The metal mobility in the soil directly depends on soil pH, BC and CEC. By knowing BC, it is possible to evaluate the soil’s ability to resist the pH changes and the capability of immobilization of the soil contaminants. The soils with higher BC can absorb more acid or base with no significant change in pH [53]. Knowing the pH reaction of the soil provides insight into soil processes, where at higher pH values, metal precipitation occurs, while at lower pH values, cation exchange becomes dominant. Additionally, the higher content of soil organic matter or clays improves BC due to the large numbers of surface sites able to adsorb hydrogen ions [34,54]. Thus, its estimation could be one of the parameters that is unavoidable in remediation studies and in environmental risk assessment. In order to elucidate the changes happening in such a real soil system and for better interpretation of the leaching and sorption results, the soil pH, BC and CEC were determined prior to the leaching experiments.
The soil pH was determined in the suspension of the contaminated soil in water (pH–H2O), KCl (pH–KCl) and CaCl2 (pH–CaCl2) solutions. The acidity measured in water refers to the acidity of the soil solution, while acidity in KCl or CaCl2 solutions also includes the potential exchangeable acidity of the soil adsorption complex, and thus usually yields lower pH values than in water. The obtained pH values of the soil of 5.22 in water, 4.13 in CaCl2 and 3.89 in KCl classify the mercury-contaminated soil into moderate to strong acid soils [55]. The lower pH values in the CaCl2 and KCl solutions indicate that mercury-contaminated soil contains a considerable amount of potential exchangeable acidity. In addition to free hydrogen ions in soil solution, acidity in electrolyte solutions is also caused by exchangeable acidic cations, H+, Al3+ and Fe3+/Fe2+, that are weakly bound to the soil surface exchange complex. Namely, the H+ can be displaced upon the addition of K+ and Ca2+, which leads to an additional decrease in pH.
The BC of the soil was estimated by the addition of either dilute HCl or NaOH solutions to the contaminated soil suspended in water. The obtained results are compared in Figure 5.
The data show that mercury-contaminated soil resists well to pH change, upon the addition of both an acid or base, and a period of 30 min seems sufficient to reach equilibrium pH. In general, flatter curves correspond to a smaller change in pH, indicating better BC. On the contrary, the steeper curves are characterized by low BC. Maximum buffering is defined as the minimal slope of pH in soil suspension vs. the amount of added acid or base [56,57,58,59]. The BC is calculated from the slope of the curves when the amount of added H+ or OH− (mmol/kg) was plotted against the pH, and the mean value equals 3.89 cmol/kg⸱pH. The comparison of obtained soil BC with other soils is very difficult. Soils vary considerably in their BC because it is greatly affected by soil properties. For example, the BC of 18 acid tropical and subtropical soils in China ranged from 0.91 up to 3.21 cmol/kg⸱pH, depending on their properties [35]. The BC of organic soils is mostly higher than 80 cmol/kg⸱pH [60]. Usually, the BC lower than 1 cmol/kg⸱pH is interpreted as low, between 1 and 2 cmol/kg⸱pH as moderate, while higher than 2 cmol/kg⸱pH is interpreted as high [61]. If soil BC is not high enough, metals will not retain in the soil, but rather will be leached [34,54]. Some soil components are effective in buffering in a wider pH range, while some of them are effective only in a limited range of the pH values. The buffer reactions at low pH are most controlled by aluminum compounds, while at high pH they are controlled by carbonates [49]. The oxides and hydroxides of Fe and Al are effective in the whole pH range due to the sorption/desorption of H+ on hydroxyl surface sites. Thus, due to their high content (Table 1) in mercury-contaminated soil, they probably greatly contribute to its BC [57,58].
The value of CEC for mercury-contaminated soil is 15.4 cmol/kg, with the amounts of individual non-acid exchangeable cations as follows: Ca2+ at 2.49 cmol/kg, Mg2+ at 1.89 cmol/kg, K+ at 0.35 cmol/kg and Na+ at 0.084 cmol/kg. As it can be seen, the Ca2+ is the dominant non-acid cation in this soil sample. The amount of acid cations H+ and Al3+ equals 10.586 cmol/kg, which leads to 68.74% of soil acid saturation (the ratio of the amount of exchangeable H+ and Al3+ and CEC multiplied with 100) [49,62]. This is in line with the obtained values of the soil pH and corresponds to elemental soil analysis. Since the CEC was determined by the standard method using barium as the exchanger cation (pH = 8.2), the overestimation of CEC in this case was very likely since mercury-contaminated soil is acidic. Thus, the obtained value represents the maximum cation exchange capacity of the soil. If we consider that for soil humus the CEC is higher than 150 cmol/kg, then the obtained soil CEC is quite low [49]. However, even high organic soils will have low effective CEC if soil pH is low. In soils with pH lower than 6.0, the negative exchange sites will be occupied by tightly held acid-forming cations, mostly H+ and Al3+, as well as by Mn2+ or Fe3+/Fe2+, enabling nutrient binding and exchanging [49,62,63,64,65]. Some studies reported a high correlation of CEC with BC, where for acid soils the main buffering mechanism was cation exchange of H+ with non-acid cations [35]. The CEC is a key parameter describing the sorption/desorption of both nutrients and contaminants by soil, and the obtained CEC points onto soil vulnerability in mercury losses through the leaching.
3.3. Mercury Leaching from Contaminated Soil and Its Subsequent Sorption from the Obtained Leachates onto Natural Zeolite
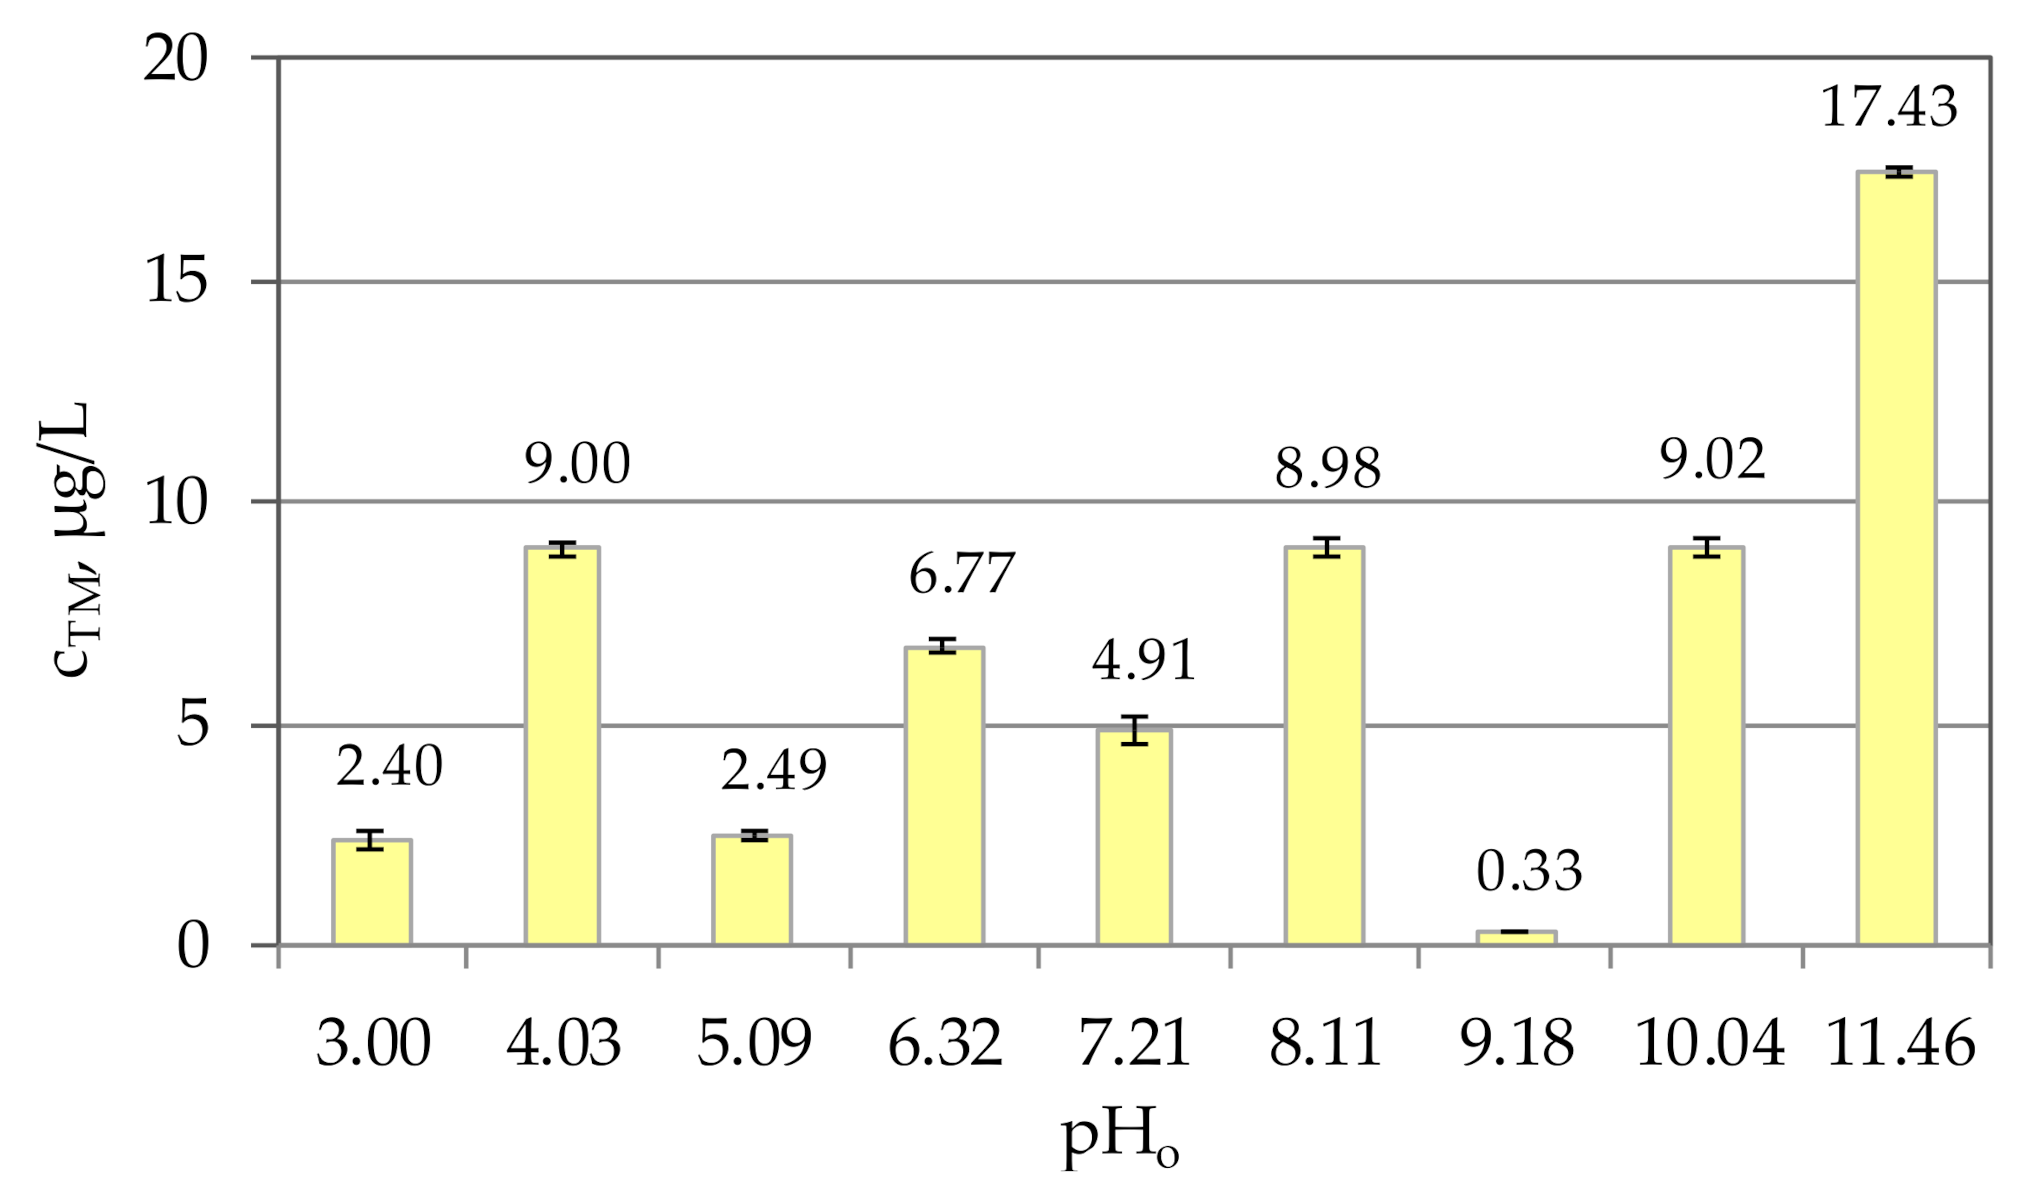
The results of mercury leaching from contaminated soil in the ultrapure water of different initial pHo values in the range 3.00–11.46 according to the standard leaching method are presented in Figure 6 as the concentration of total mercury (cTM) leached after 24 h vs. pHo.
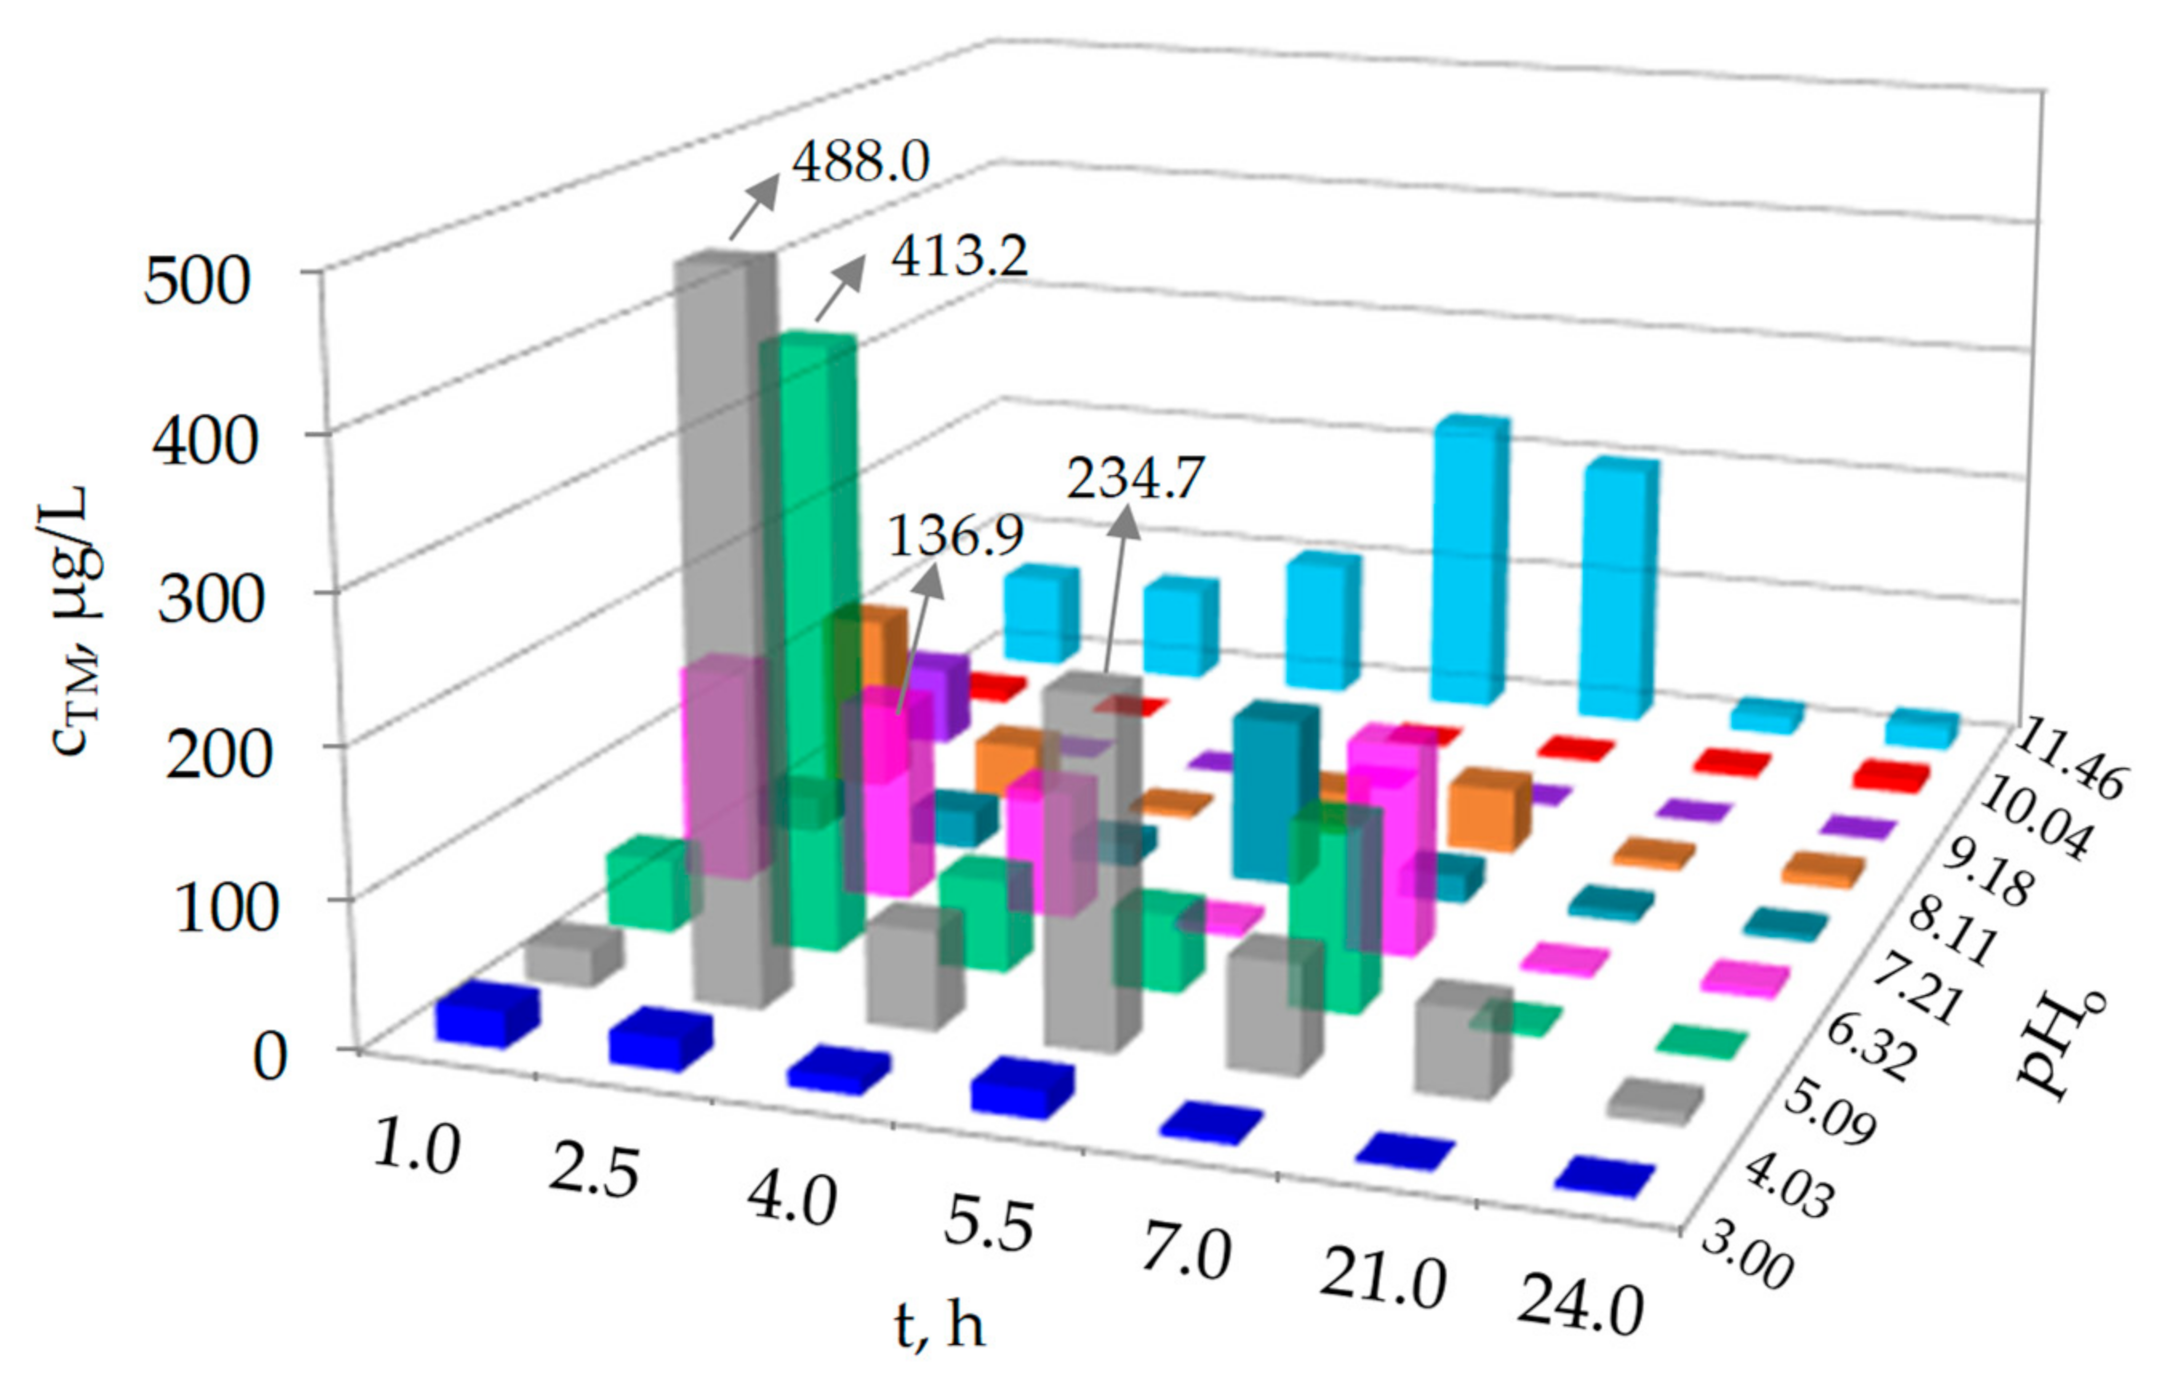
In Figure 6 it can be observed that there is no regularity in the concentration of the total mercury leached in the examined pH range. The concentration of the total mercury after 24 h was in the range 0.33–17.43 µg/L, suggesting a strong affinity of mercury toward soil constituents. However, these low concentrations still exceeded the maximum permissible mercury concentration of 1.0 μg/L in water for human consumption [66]. As it can be seen, the highest concentration of the total mercury was obtained under extremely alkaline conditions at pHo = 11.46. Namely, in the soil system, humic and fulvic acids along with other substances form a dissolved organic carbon (DOC) that controls the binding of heavy metals. The higher solubility of DOC is expected with increasing pH, thus affecting the release of mercury [67]. Fulvic acids are soluble in acidic and alkaline conditions, while humic acids are soluble only in alkaline conditions. The mercury in the soil will be mobile depending on the mobility of its complexes. In general, dissolving or even degradation of the structure of organo-mineral mercury complexes is considered to have the most dominant influence on mercury mobility at highly acidic or alkaline conditions. Since the mercury-contaminated soil is a very complex system, the synergistic interaction of numerous factors on the mercury speciation and transformations finally affects the rate and extent of its transportation. Mercury in the soil in an oxidized state as mercuric (Hg2+) tends to formation of inorganic compounds (HgCl2, HgO or HgS), or binds to the organic matter forming different organo-mercury compounds. Additionally, it was found that soluble mercury complexes, as well as nano-sized mercury particles, have a major impact on mercury mobility, methylation in soil and availability [68]. However, the variation in the concentration of leached mercury at examined pHo range indicates that besides pH, some other factors also might be important for leaching. Although the standard leaching method prescribes a contact time of 24 h, the concentration of the total mercury was monitored in time intervals within 24 h during the same experiment, in order to get insight into mercury behavior over time. The results are presented in Figure 7.
As can be seen in Figure 7, at each pHo value, there is an alternating increase and decrease in the concentration of total mercury. In the first few hours of the experiment, the concentration of total mercury is considerably higher than after 24 h. It reaches even 488.0 μg/L after 2.5 h from the beginning of the experiment, which is more than 50 times higher compared to the same sample in Figure 6. High mercury concentrations were obtained at neutral or slightly acidic pH values, which more likely occur in nature. High concentrations of leached mercury cannot only be attributed to the release from organo-mineral complexes, but also to mercury speciation and soil properties. In addition, the influence of soil inhomogeneity cannot be ignored. The observed irregularity in the concentration of the total mercury is most likely due to changes in mercury mobility, which significantly depends on its chemical form and bonds established. In the soil solution, organic compounds and water are the most abundant ligands, so hydrolysis and organic complexation are the most common reactions. The mobility of metals in the environment depends on the many different processes—dissolution, sorption, complex formation, migration, deposition, diffusion (into minerals), binding to organic matter, adsorption, desorption, evaporation, etc. Each metal can be precipitated and/or adsorbed even with a small change in equilibrium conditions, which alter very easily in the soil depending on the location [69]. Mercury is therefore most likely released from one phase of the soil and re-binds to another phase in the soil, causing a variation in the concentration of the total mercury in the soil suspension over 24 h.
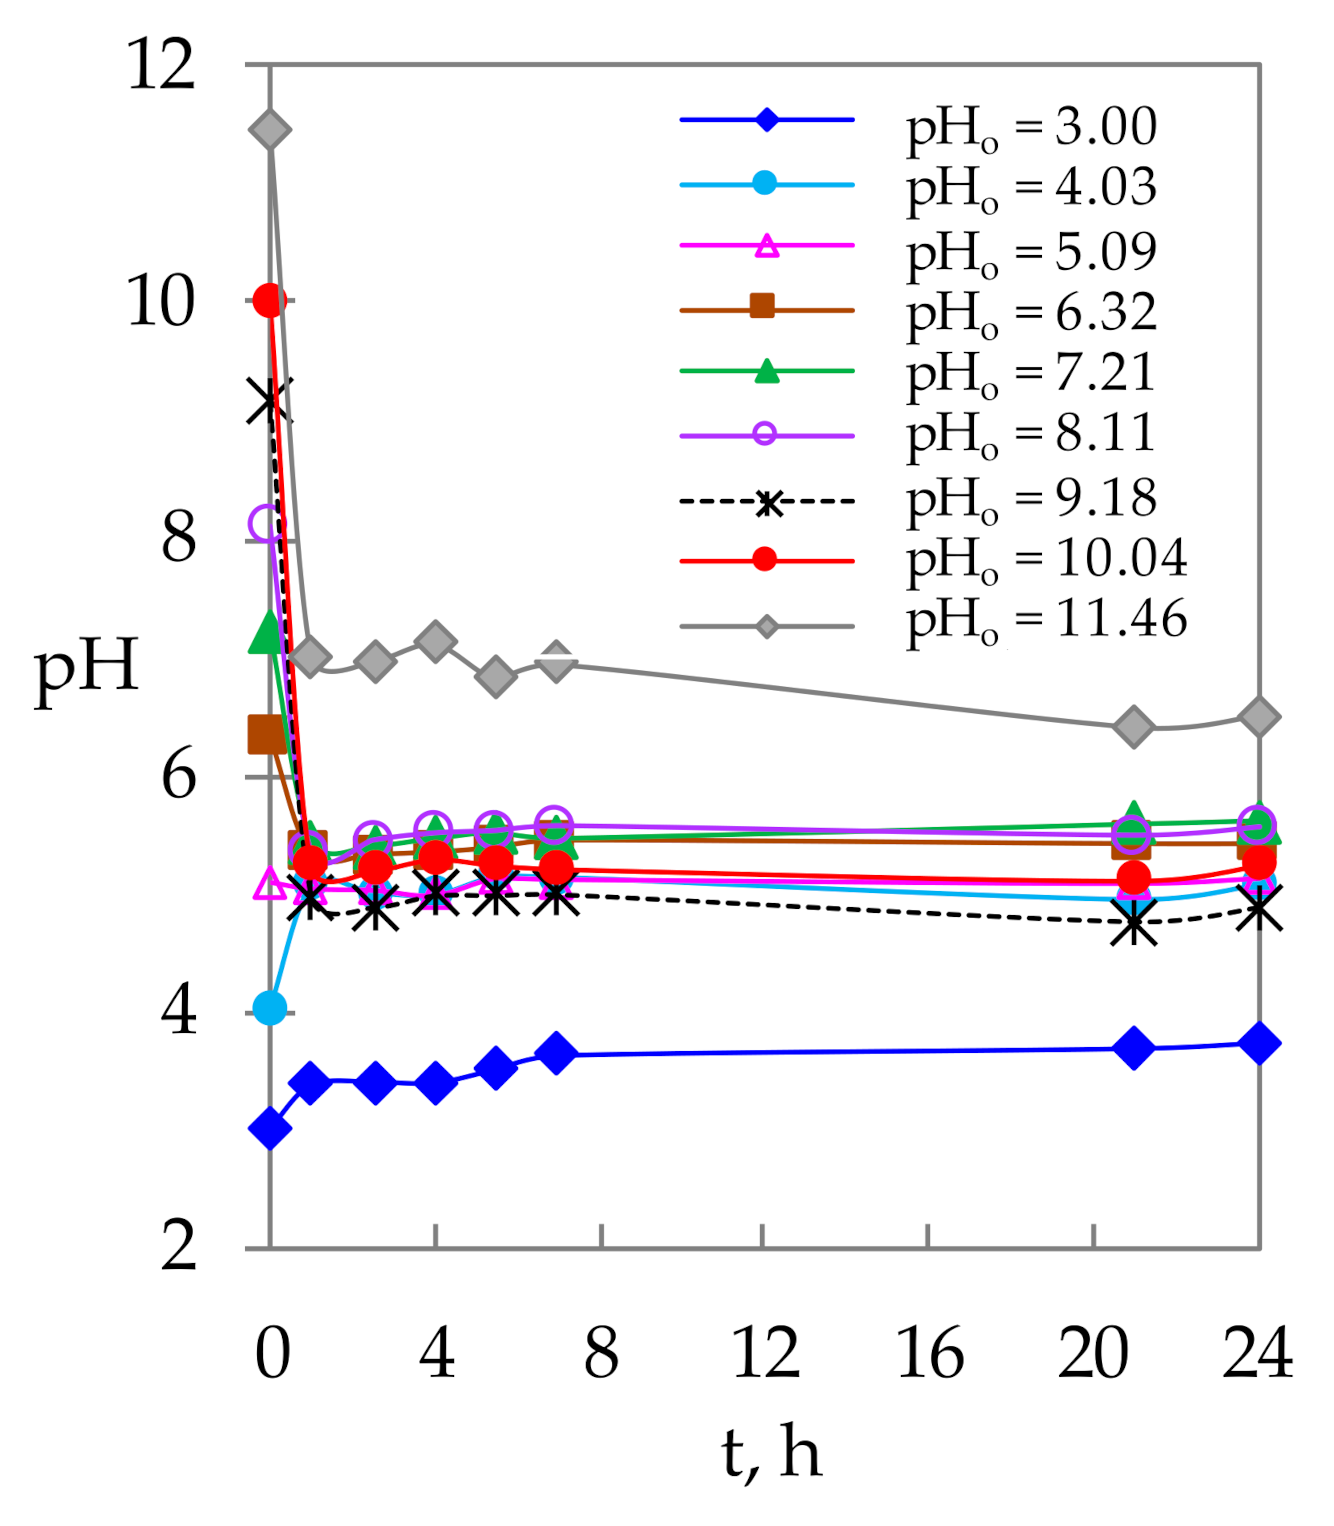
To better understand this complex soil system, the pH and electrical conductivity (ĸ) in suspensions during the leaching experiment were monitored. The results are given in Figure 8 and Figure 9. The electrical conductivity is presented in two separate graphs in Figure 9 in order to get better visibility of the obtained results.
According to Figure 8, the highest change in pH can be observed in the first two hours of the experiment. The constant value of pH is established very rapidly, and soil suspensions tend to be slightly acidic or neutral pH range, except for pHo = 3.00. This can be attributed to the buffering capacity of the soil, which is least expressed for the lowest pHo due to the extremely high concentration of H3O+. The electrical conductivity in Figure 9 shows a similar trend for all pHo values. The highest electrical conductivity in Figure 9a is measured for pHo = 3.00 and pHo = 11.46 due to the high concentration of H3O+ or OH−. The specific electrical conductivity of both H+, λo(H+) = 350 S·cm2/mol and OH−, λo(OH−) ≈ 200 S·cm2/mol at 25 °C, compared to other ionic species, is extremely high [70]. For all other pHo values in Figure 9b, the electrical conductivity is lower than 100 μS/cm.
The changes in pH and electrical conductivity values were negligible after ≈5 h for all examined pHo values, indicating that variations in total mercury concentrations in Figure 7 are not in function of pH and ĸ.
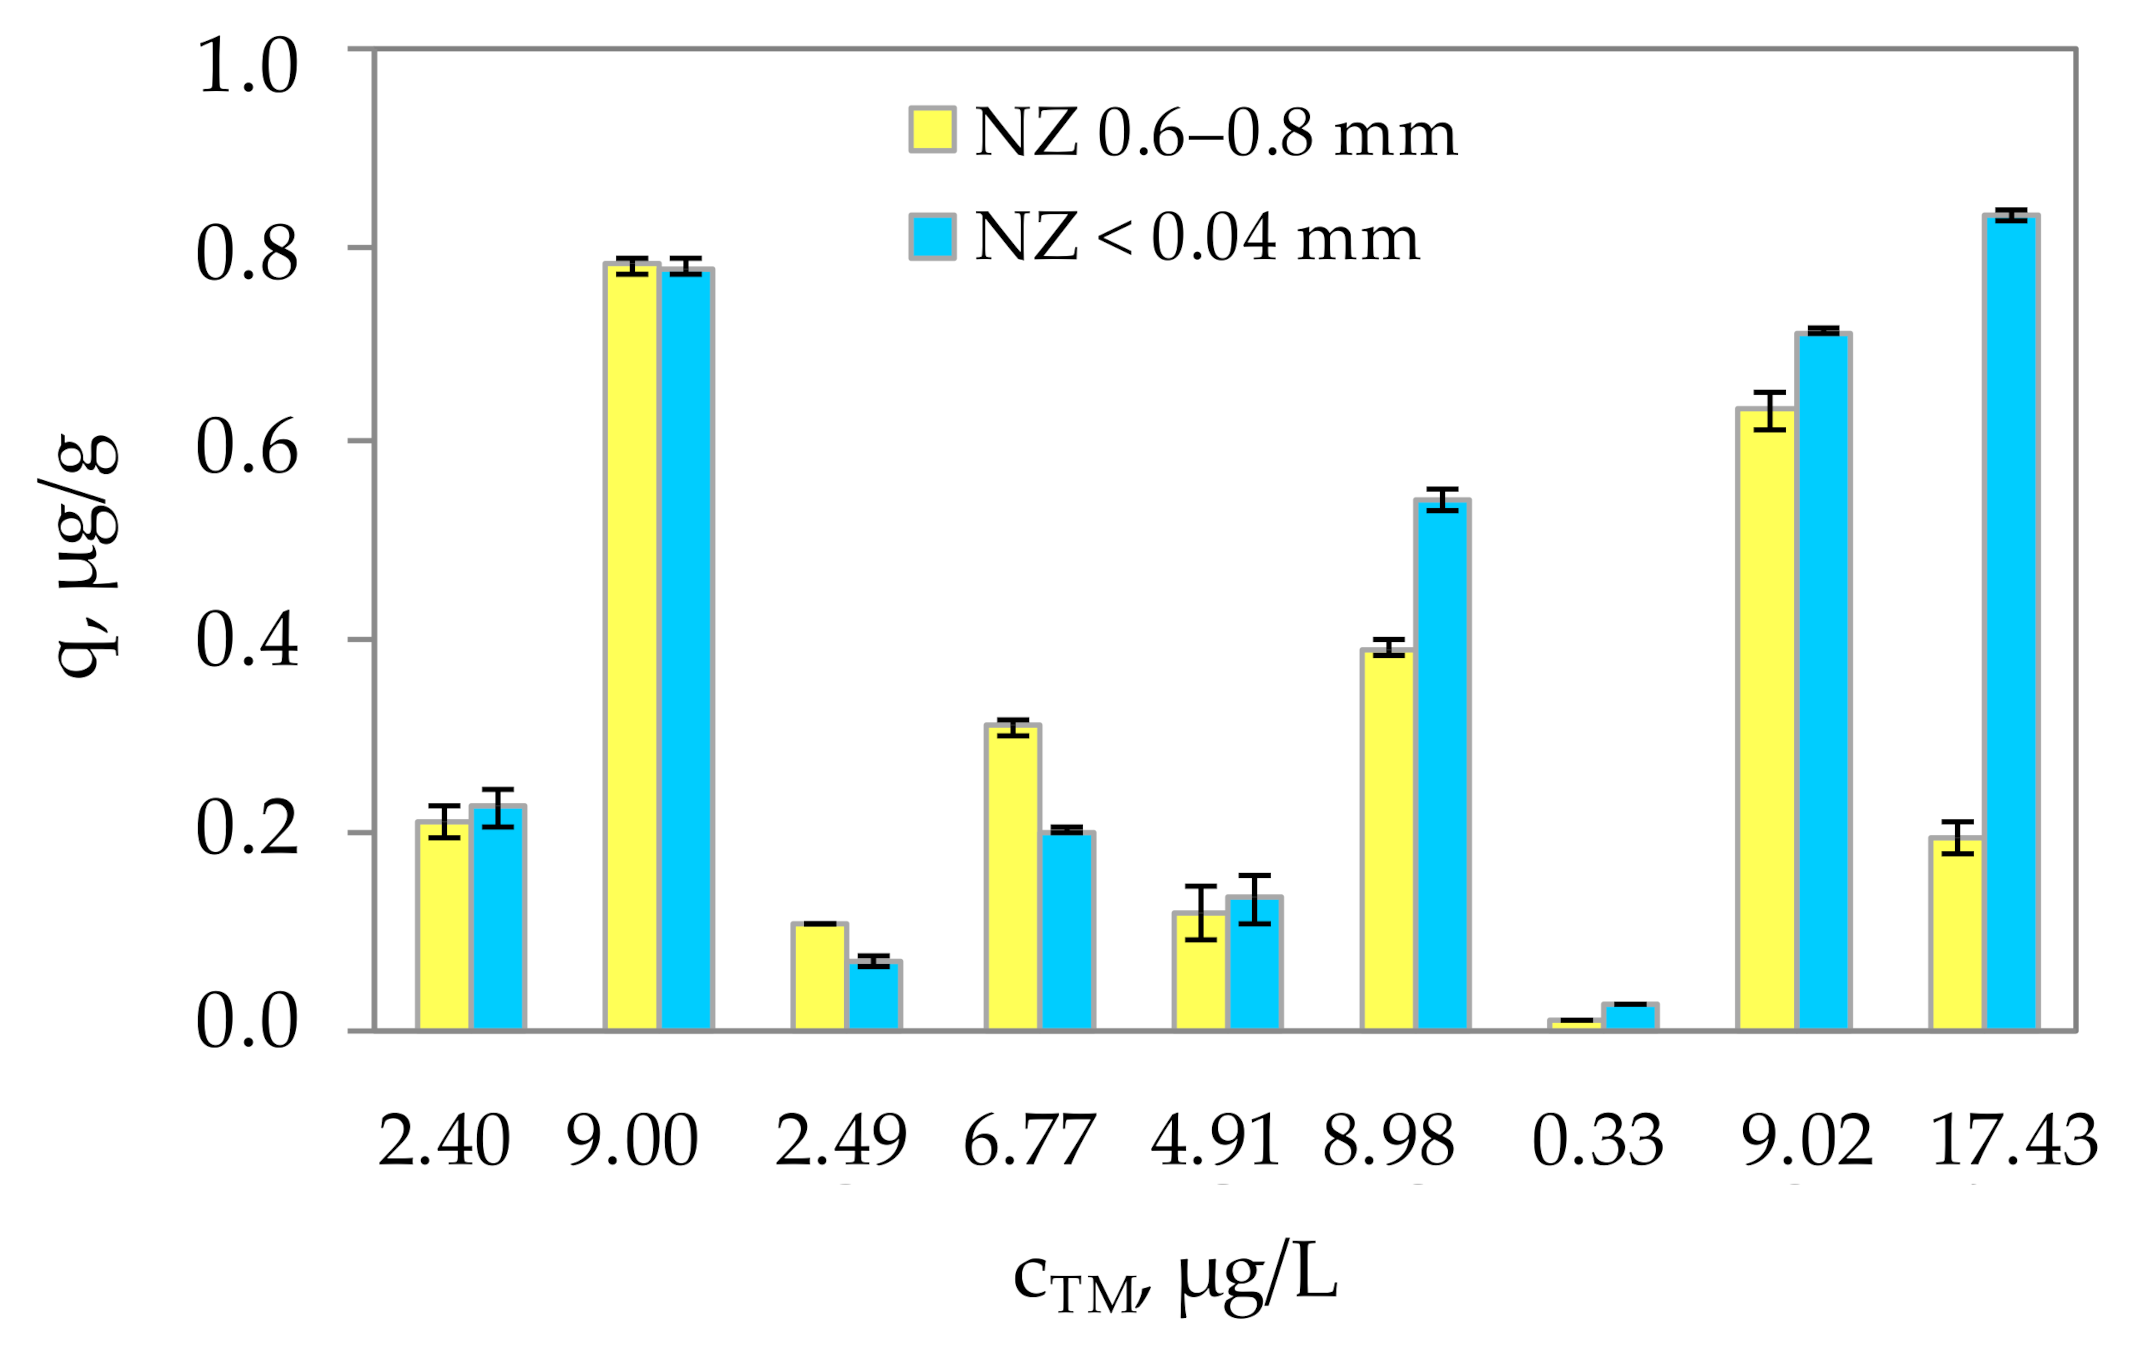
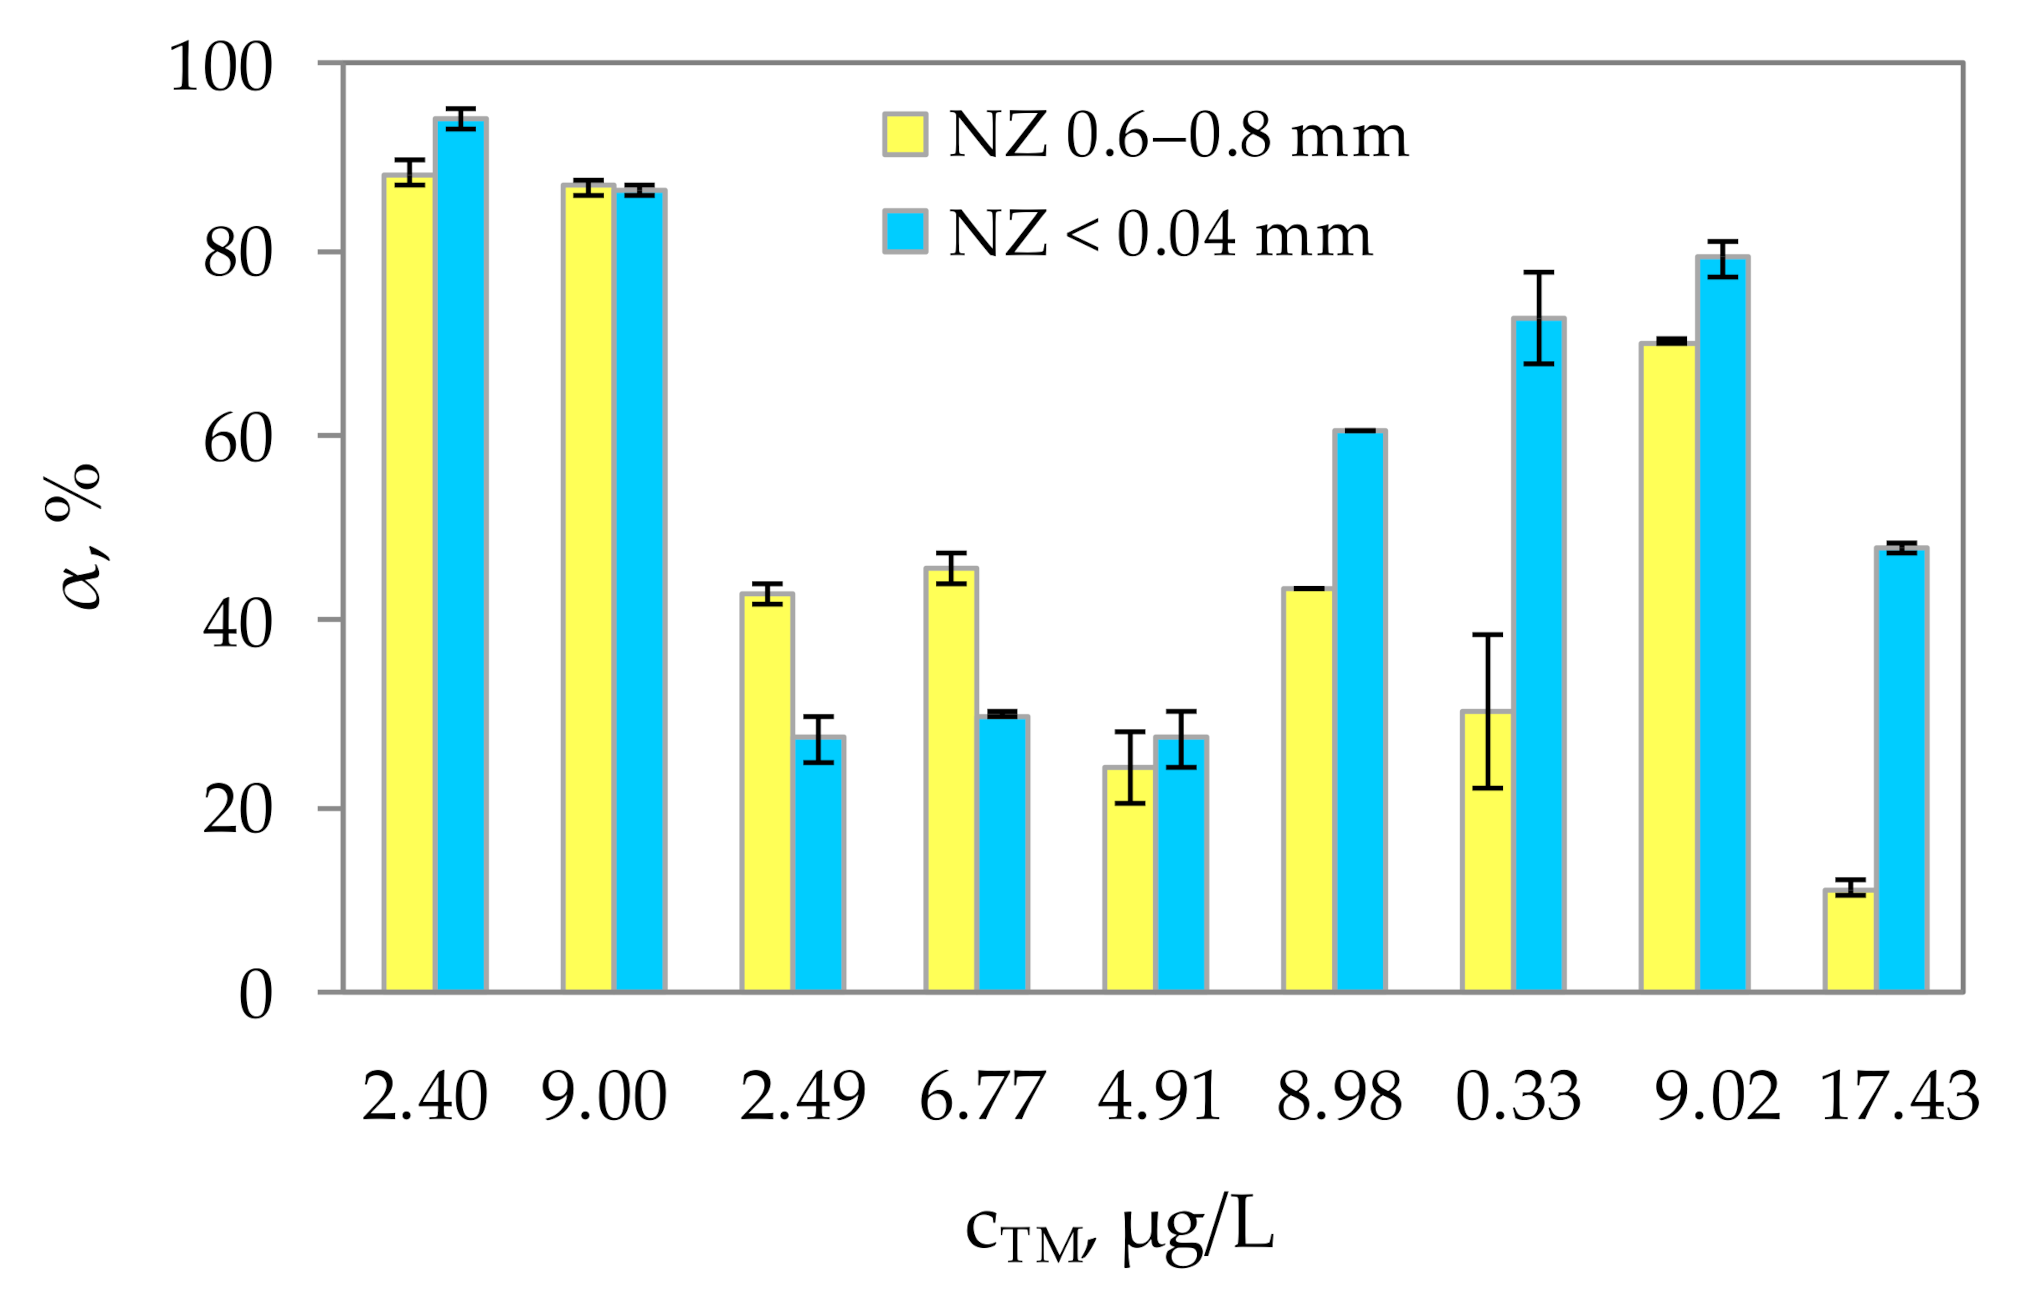
Leachates obtained at different pHo values in Figure 6 were mixed with natural zeolite of two particle sizes. Based on the experimental results after 24 h of contact with natural zeolite, the mercury uptake and removal efficiency of both zeolite particle sizes were calculated according to the following equations and presented graphically in Figure 10 and Figure 11:
where q is mercury uptake per unit mass of zeolite in equilibrium (μg/g), α is the removal efficiency in equilibrium (%), co(Hg) is the concentration of total mercury in leachates (μg/L), ce(Hg) is the equilibrium concentration of total mercury in eluates after sorption (μg/L), m is mass of the zeolite (g) and V is the volume of leachate before sorption (L).
According to the results presented in Figure 10 and Figure 11, it is noticeable that there is no direct relationship between mercury uptake and removal efficiency on the initial total mercury concentration in leachates. The obtained values of mercury uptake (q) were in the range 0.010–0.781 µg/g for the particle size of 0.6–0.8 mm, and 0.024–0.834 µg/g for the particle size < 0.04 mm, respectively. The highest values of mercury uptake were mainly achieved for the highest initial concentrations of total mercury. The visible oscillations are most likely due to differences in the pHo values, which affected the type of mercury speciation in leachates, and consequently its sorption onto natural zeolite. A slightly larger amount of total mercury was uptake by the powdered zeolite, due to the larger specific surface area. This is especially noticeable for the highest initial concentration of the total mercury of 17.43 µg/L. The removal efficiency (α) was in the range 11.2–88.3% for the particle size of 0.6–0.8 mm, and 27.3–94.2% for the particle size < 0.04 mm, respectively. The maximum removal efficiency of 94.2% for the NZ of a smaller particle size was obtained for initial mercury concentration of 2.40 µg/L and pHo = 3.00. Interestingly, the removal efficiencies higher than 60% were obtained for different initial concentrations of total mercury of 2.4, 9.0, 8.98, 0.33 and 9.02 μg/L, which is quite unexpected. This indicates that regardless of mercury concentration, some other factors greatly affect mercury uptake on the zeolite, most likely the speciation of mercury in the leachates.
In literature reports, higher but inconsistent sorption capacities and removal efficiencies of mercury can be found, but sorption is mostly performed from modal solutions with significantly higher initial mercury concentrations [71,72]. Higher concentration usually leads to improved sorption capacity due to the greater driving force [73]. Furthermore, compared to modal solutions, obtained leachates comprise of various organic and inorganic mercury species, which significantly affect mercury uptake. For instance, it was found that mercury uptake onto natural zeolite was hindered by the presence of humic acids, due to its partial sorption to organic matter [74]. Removal of mercury from industrial effluents (0.0028–0.0246 mg Hg/kg) resulted in lower capacity of natural zeolite in the range 0.0039–0.021 mg/kg, due to the competition of other present cations, which also undergo sorption on zeolite [75]. Moreover, the use of unmodified natural low-cost sorbents commonly leads to lower sorption capacities and removal efficiencies, compared to synthesized and modified sorbents. As in the case of low-cost sugarcane bagasse, the removal efficiency was only 20%, while its activation increased the efficiency to 85–95%, with a capacity of up to 4.8 mg/g, for an initial mercury concentration of 1 mg/L [76]. Non-modified magnetic iron oxide nanoparticles removed mercury with ≈44% efficiency, while modification of the adsorbent increased the efficiency to 98.6%, with a capacity of 590 µg/g, for an initial mercury concentration of 50 µg/L [77]. Modification improves sorption capacity but can cause higher costs and secondary pollution. Generally, natural zeolites have a great ion-exchange capacity, but their adsorption properties need improvement [78]. In order to increase mercury uptake, further research of mercury leachability from the contaminated soil should be focused on the modification of the natural zeolite surface by sulfurization, since the mercury tendency for sulfur-containing species has been long established.
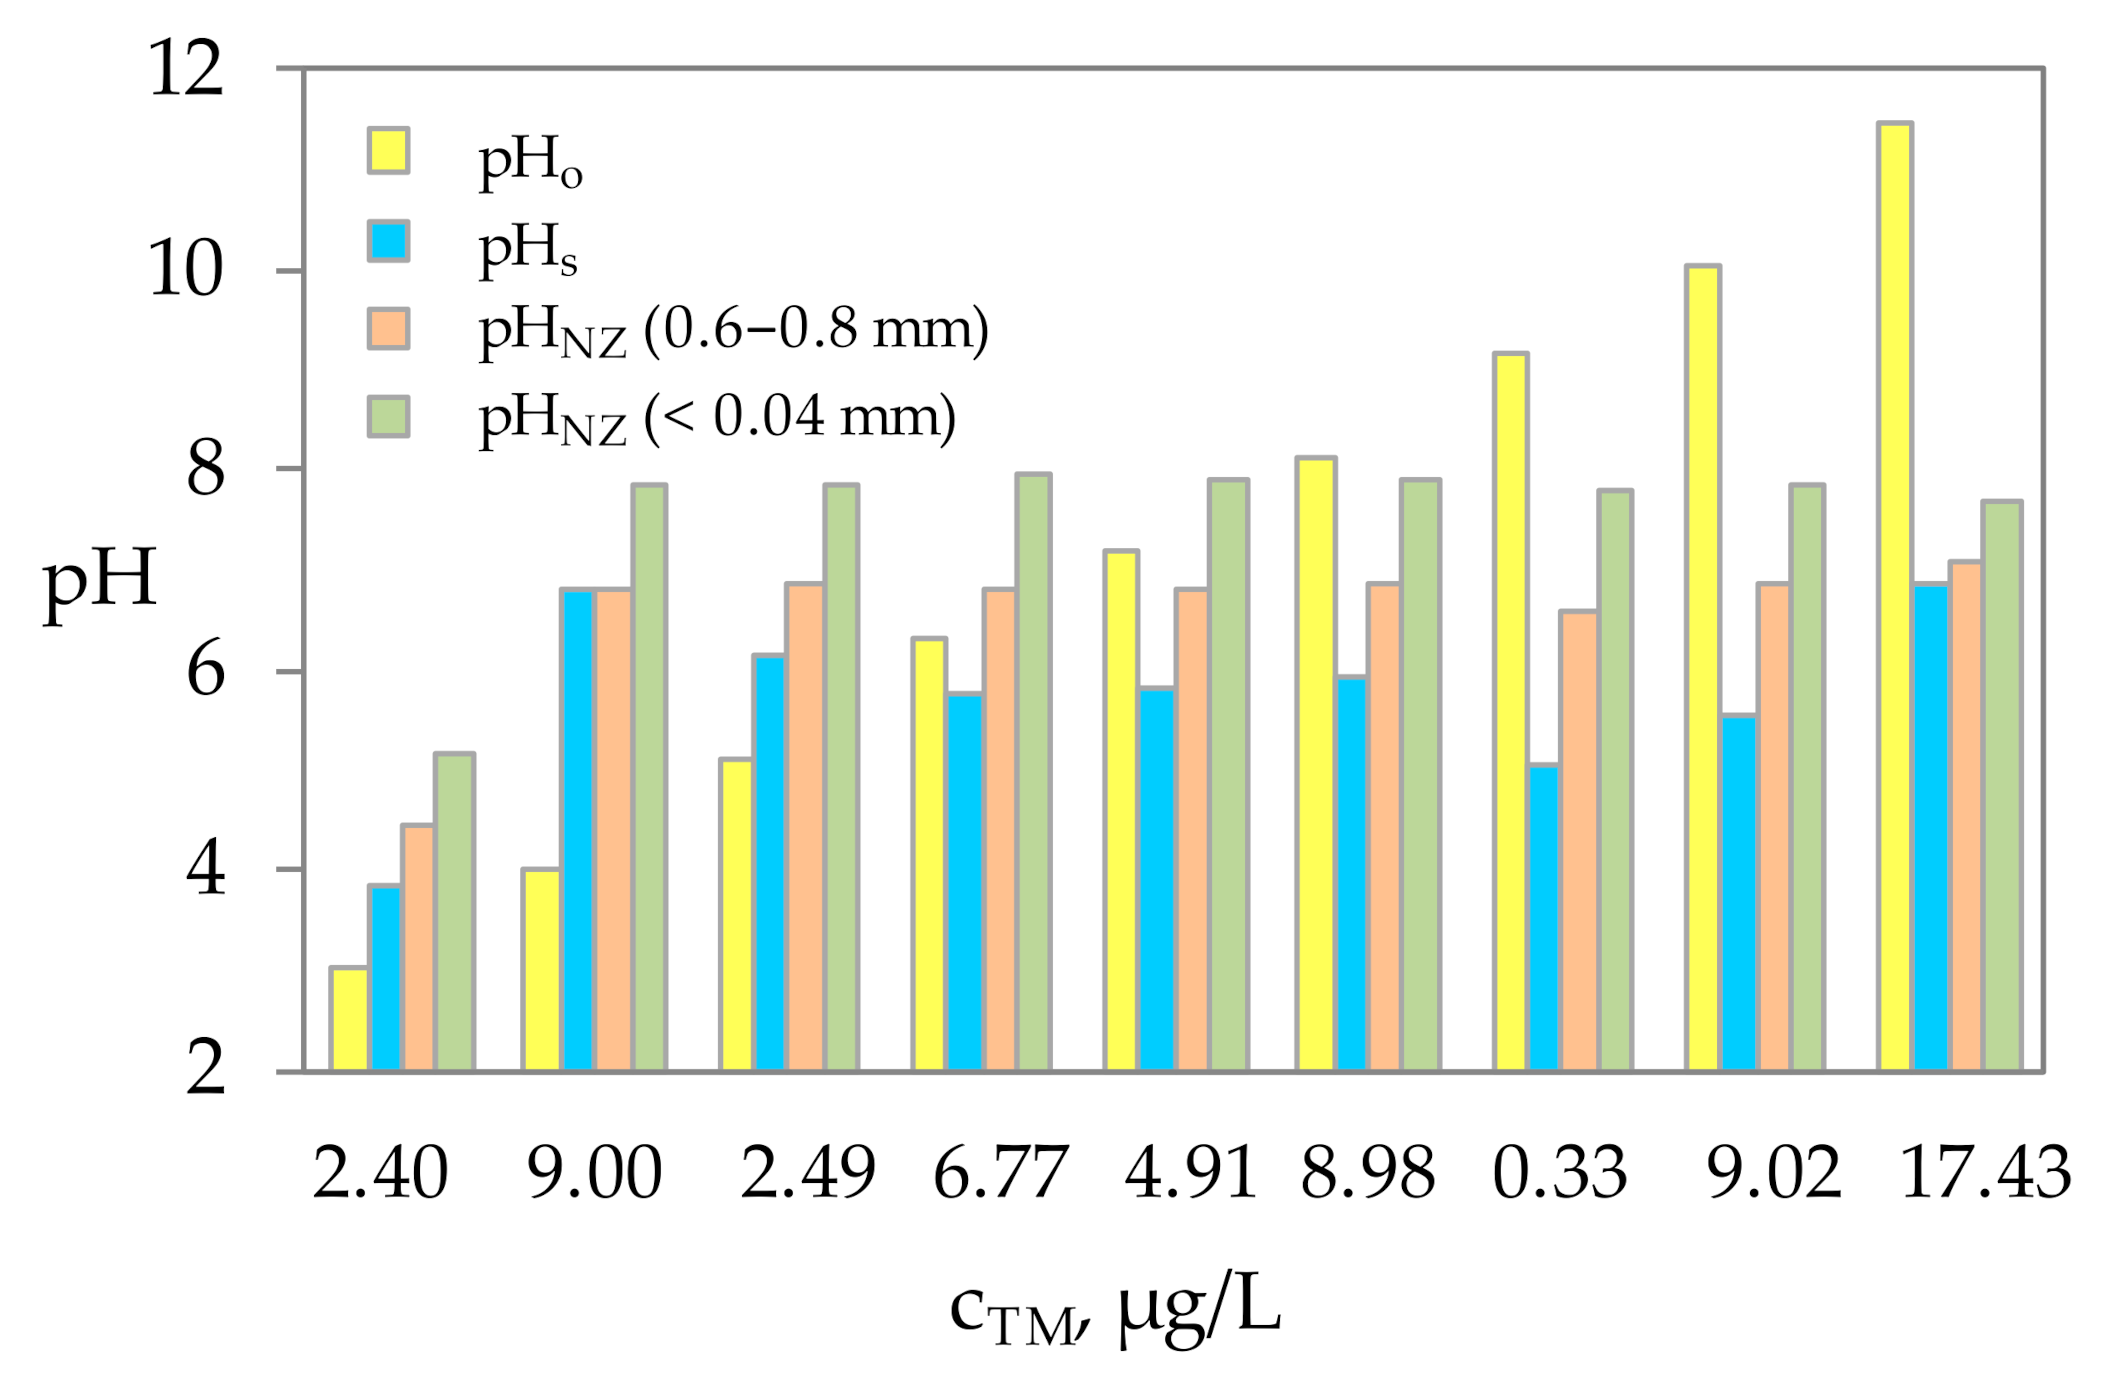
In Figure 12, a comparison of pH values before leaching, prior to sorption and after sorption on the natural zeolite can be seen.
Despite a wide range of initial pHo values prior to leaching, the neutral or slightly acidic range of pHS values indicates good buffering capacity of the soil. The pHNZ values are slightly higher than pHS and are mostly in the neutral pH range.
3.4. SEM-EDS Analysis of Zeolite Samples before and after Sorption of Total Mercury
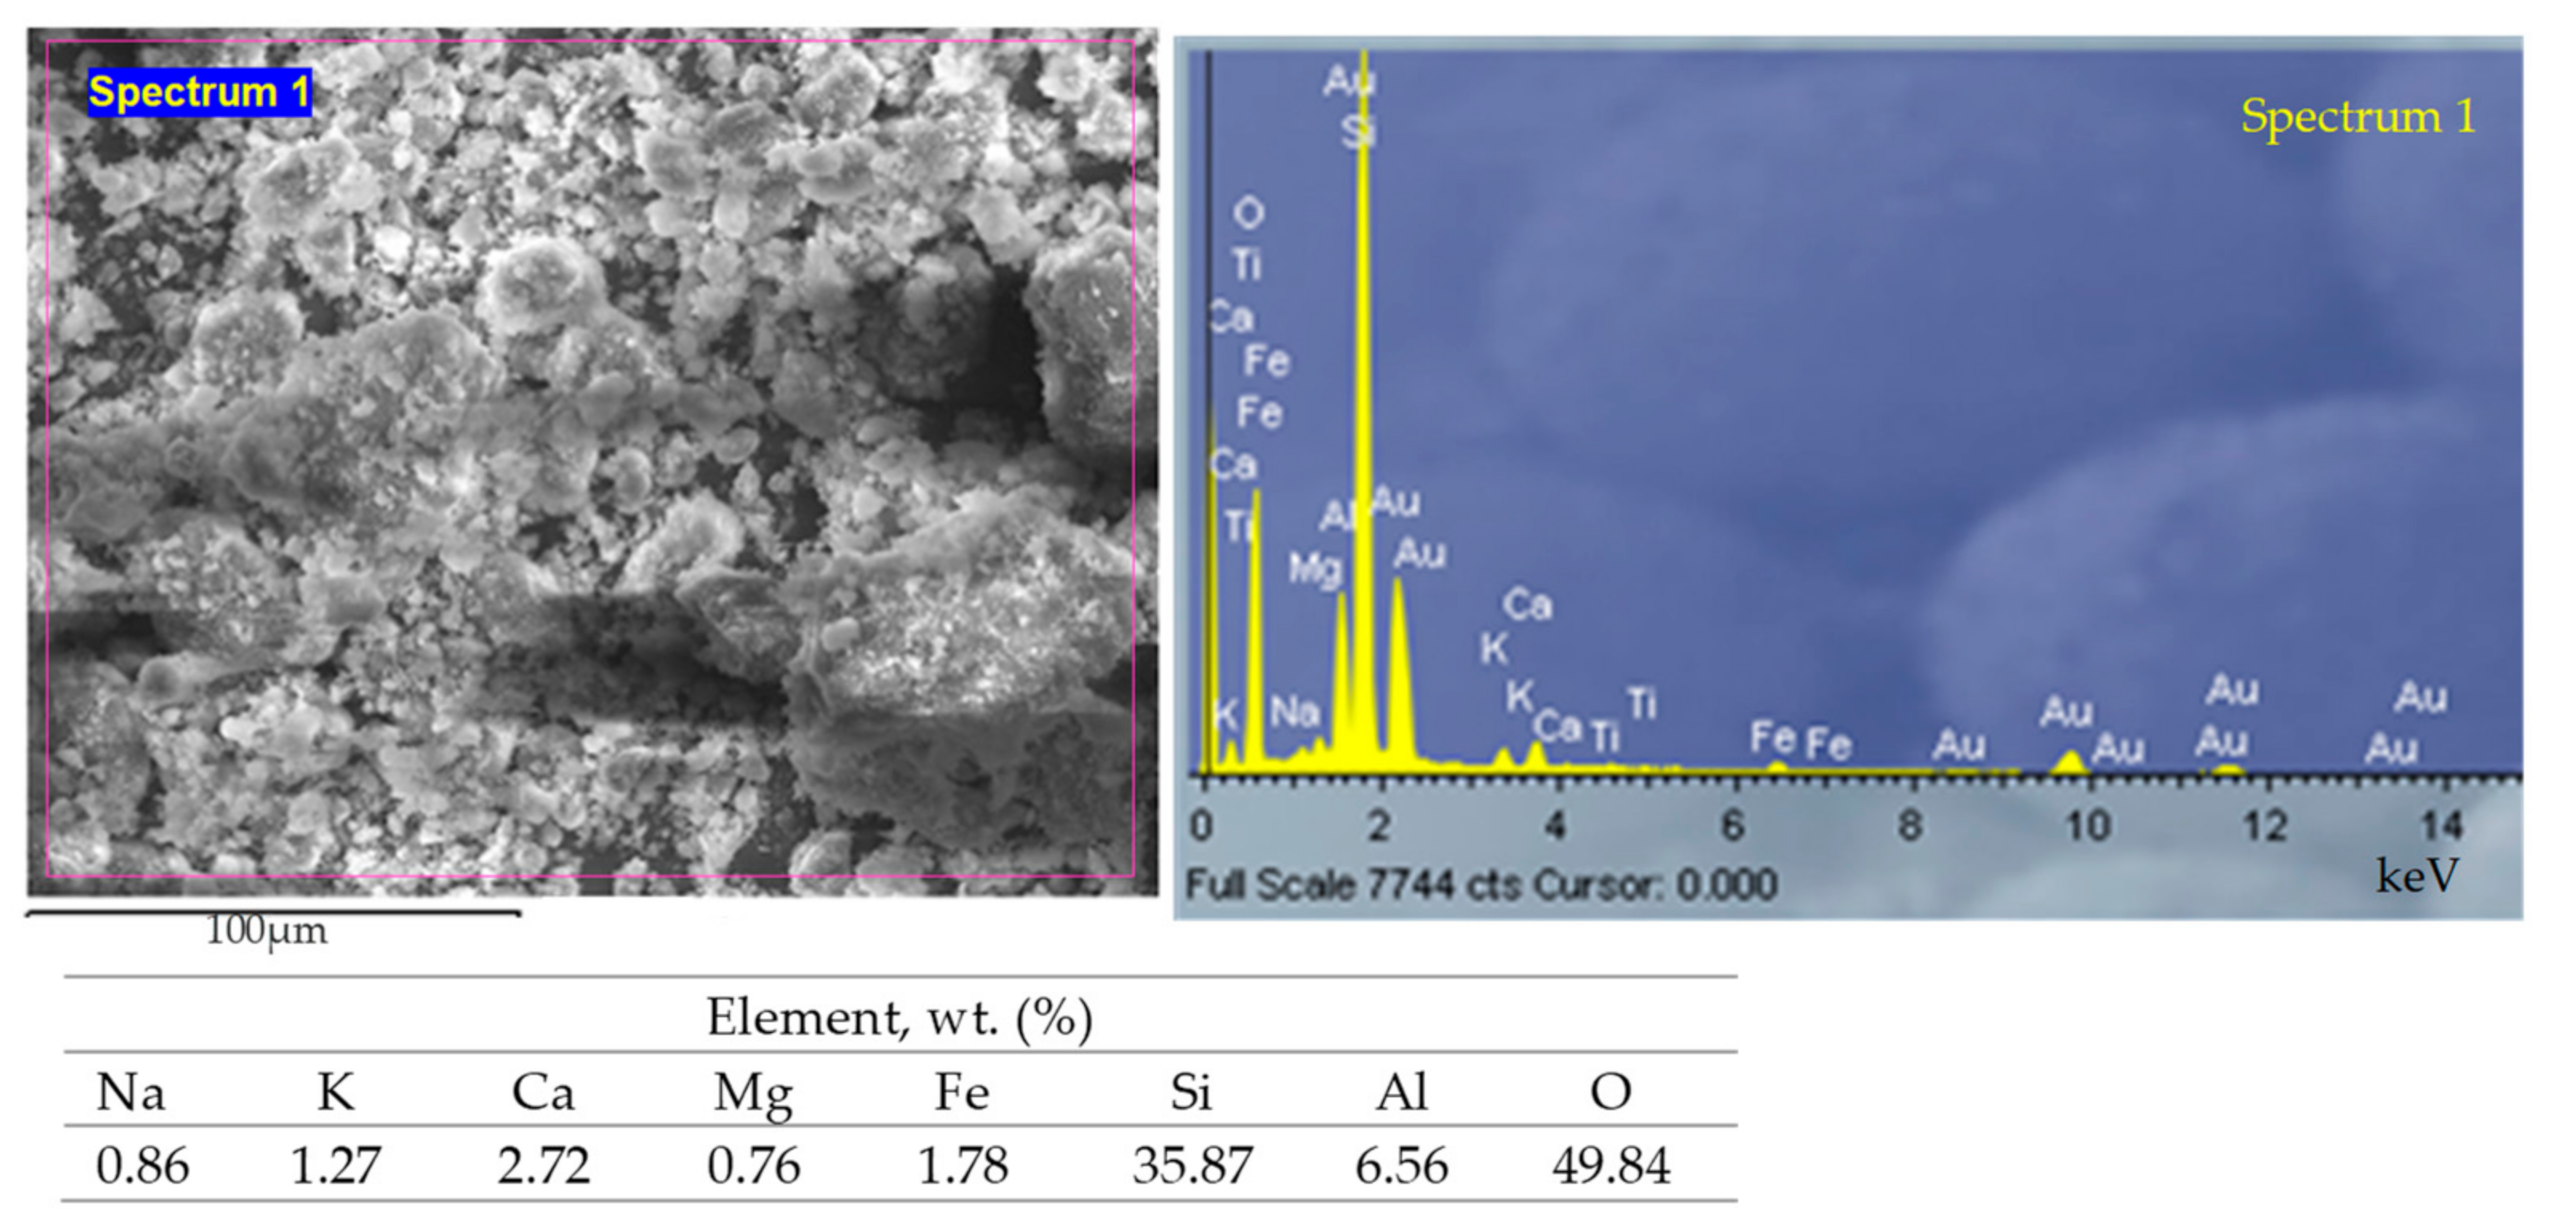
Figure 13 presents SEM image of natural zeolite surface before sorption with the corresponding EDS analysis.
According to standard chemical analysis of aluminosilicates [79], zeolite contains (in mass%) the following: SiO2, 66.36; Al2O3, 13.81; Fe2O3, 1.69; MgO, 1.03; CaO, 3.65; K2O, 0.99; and Na2O, 1.03, with a loss on ignition 13.40, while the major mineralogical component according to the semi-quantitative mineralogical analysis is clinoptilolite (up to 80%) with quartz as an impurity [80].
The morphology of the zeolite surface of two particle sizes after sorption of total mercury with corresponding EDS results is given in Figure 14 and Figure 15.
According to the obtained results, the presence of mercury onto the surface of both zeolite samples can be observed in given EDS spectra, but there were no visible mercury agglomerates. The content of mercury in weight % again was not possible to determine, as it was in the case of SEM-EDS results obtained for a sample of mercury-contaminated soil. This is due to the low initial mercury concentration in leachates. Thus, the significant difference in the element composition on the zeolite surface before and after sorption was not observed. A slight decrease in the Na and K content on the surface of zeolite after sorption was noted, which could be attributed to ion exchange with mercury species.
3.5. Simultaneous Leaching of Mercury from the Contaminated Soil and Its Sorption onto Natural Zeolite
The leaching experiments were continued with an emphasis on the first few hours of the experiment for pHo values of ultrapure water of 4.11, 5.09 and 6.04, according to the earlier obtained results (Figure 7). Leaching was performed simultaneously in two 5-liter batch reactors, without and with the addition of natural zeolite to the soil, in order to evaluate its effectiveness in reducing mercury leaching. Larger reactors enabled getting more representative suspension samples and avoiding or minimizing possible inhomogeneity of the soil.
3.5.1. Concentration of the Total Mercury Leached
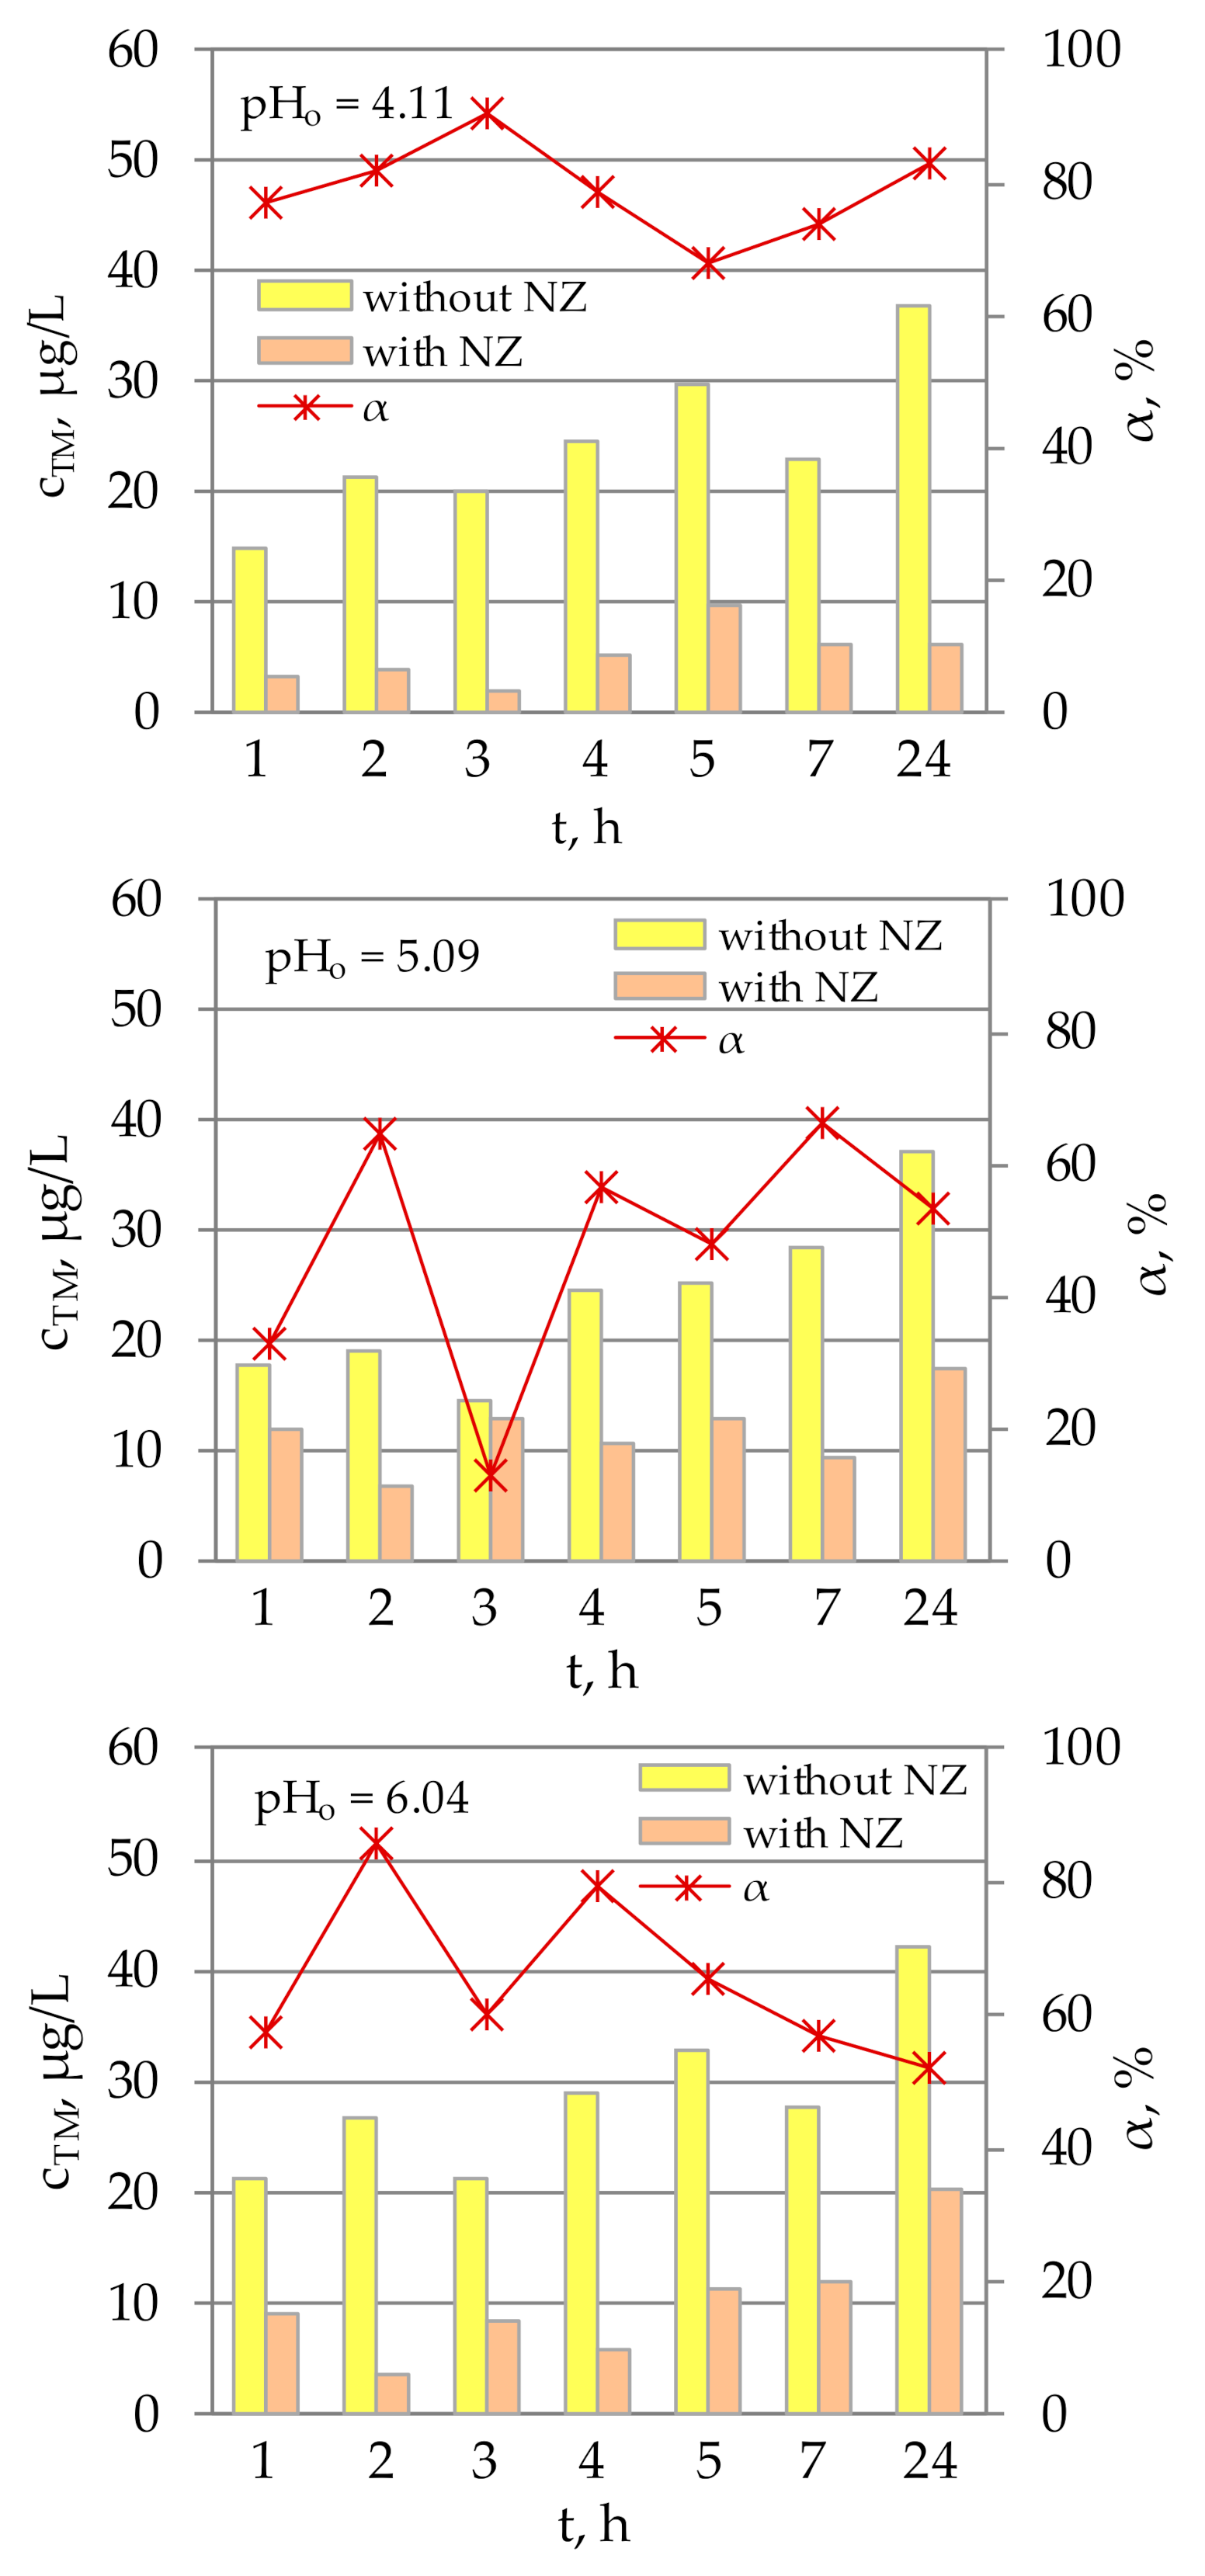
The concentrations of the total mercury leached at time intervals within 24 h without and with the addition of natural zeolite to the soil in ultrapure water of three different initial pHo values are graphically shown in Figure 16. For all three pHo values, the same trend in the increase of the total mercury concentration without natural zeolite addition can be observed. The mercury concentration did not exhibit a clear pattern as a function of time, but these variations were not so considerable as in Figure 6, where they are probably a consequence of soil inhomogeneity and experimental performance in nine batch reactors. In all leachates the concentration of the total mercury was higher than the maximum allowed value of 1 μg/L in water for human consumption [66]. The concentration of the total mercury in suspensions without natural zeolite ranged from 12.8 µg/L to 42.2 µg/L, with the maximum concentration achieved after 24 h for all pHo values. The lower concentration of the total mercury from 1.9 to 20.3 µg/L was determined in all leachates in the presence of natural zeolite for all examined pHo values, implying uptake of mercury species on the zeolite. These three pHo values correspond to real conditions in nature, and mercury is most likely present in a form that is much more readily available for binding to zeolite.
For determining the efficiency α (%) of natural zeolite in reducing the concentration of leached mercury, Equation (3) was used, where co(Hg) in μg/L represents the concentration of the total mercury leached in soil suspension without natural zeolite, while ce(Hg) in μg/L represents the concentration of the total mercury leached in soil suspension with the presence of natural zeolite. The calculated removal efficiencies are also shown in Figure 16. It can be seen that the removal efficiency of natural zeolite toward the total mercury under given conditions was from 12.9% to as much as 90.5%. The best removal on the natural zeolite was achieved at the lowest initial pHo of 4.11, where α was in the range 67.7–90.5%. Moreover, at this pHo, the highest removal efficiency was achieved up to the first 3 h. The same tendency, although less pronounced, was observed for pHo of 5.09 and 6.04 up to the first two hours, which is in correspondence with previously obtained results. At pHo = 6.04, the removal efficiency was in the range 51.9–85.7%, while the lowest removal was achieved at pHo of 5.09, where it was in the range 12.9–66.4%.
3.5.2. pH and Electrical Conductivity
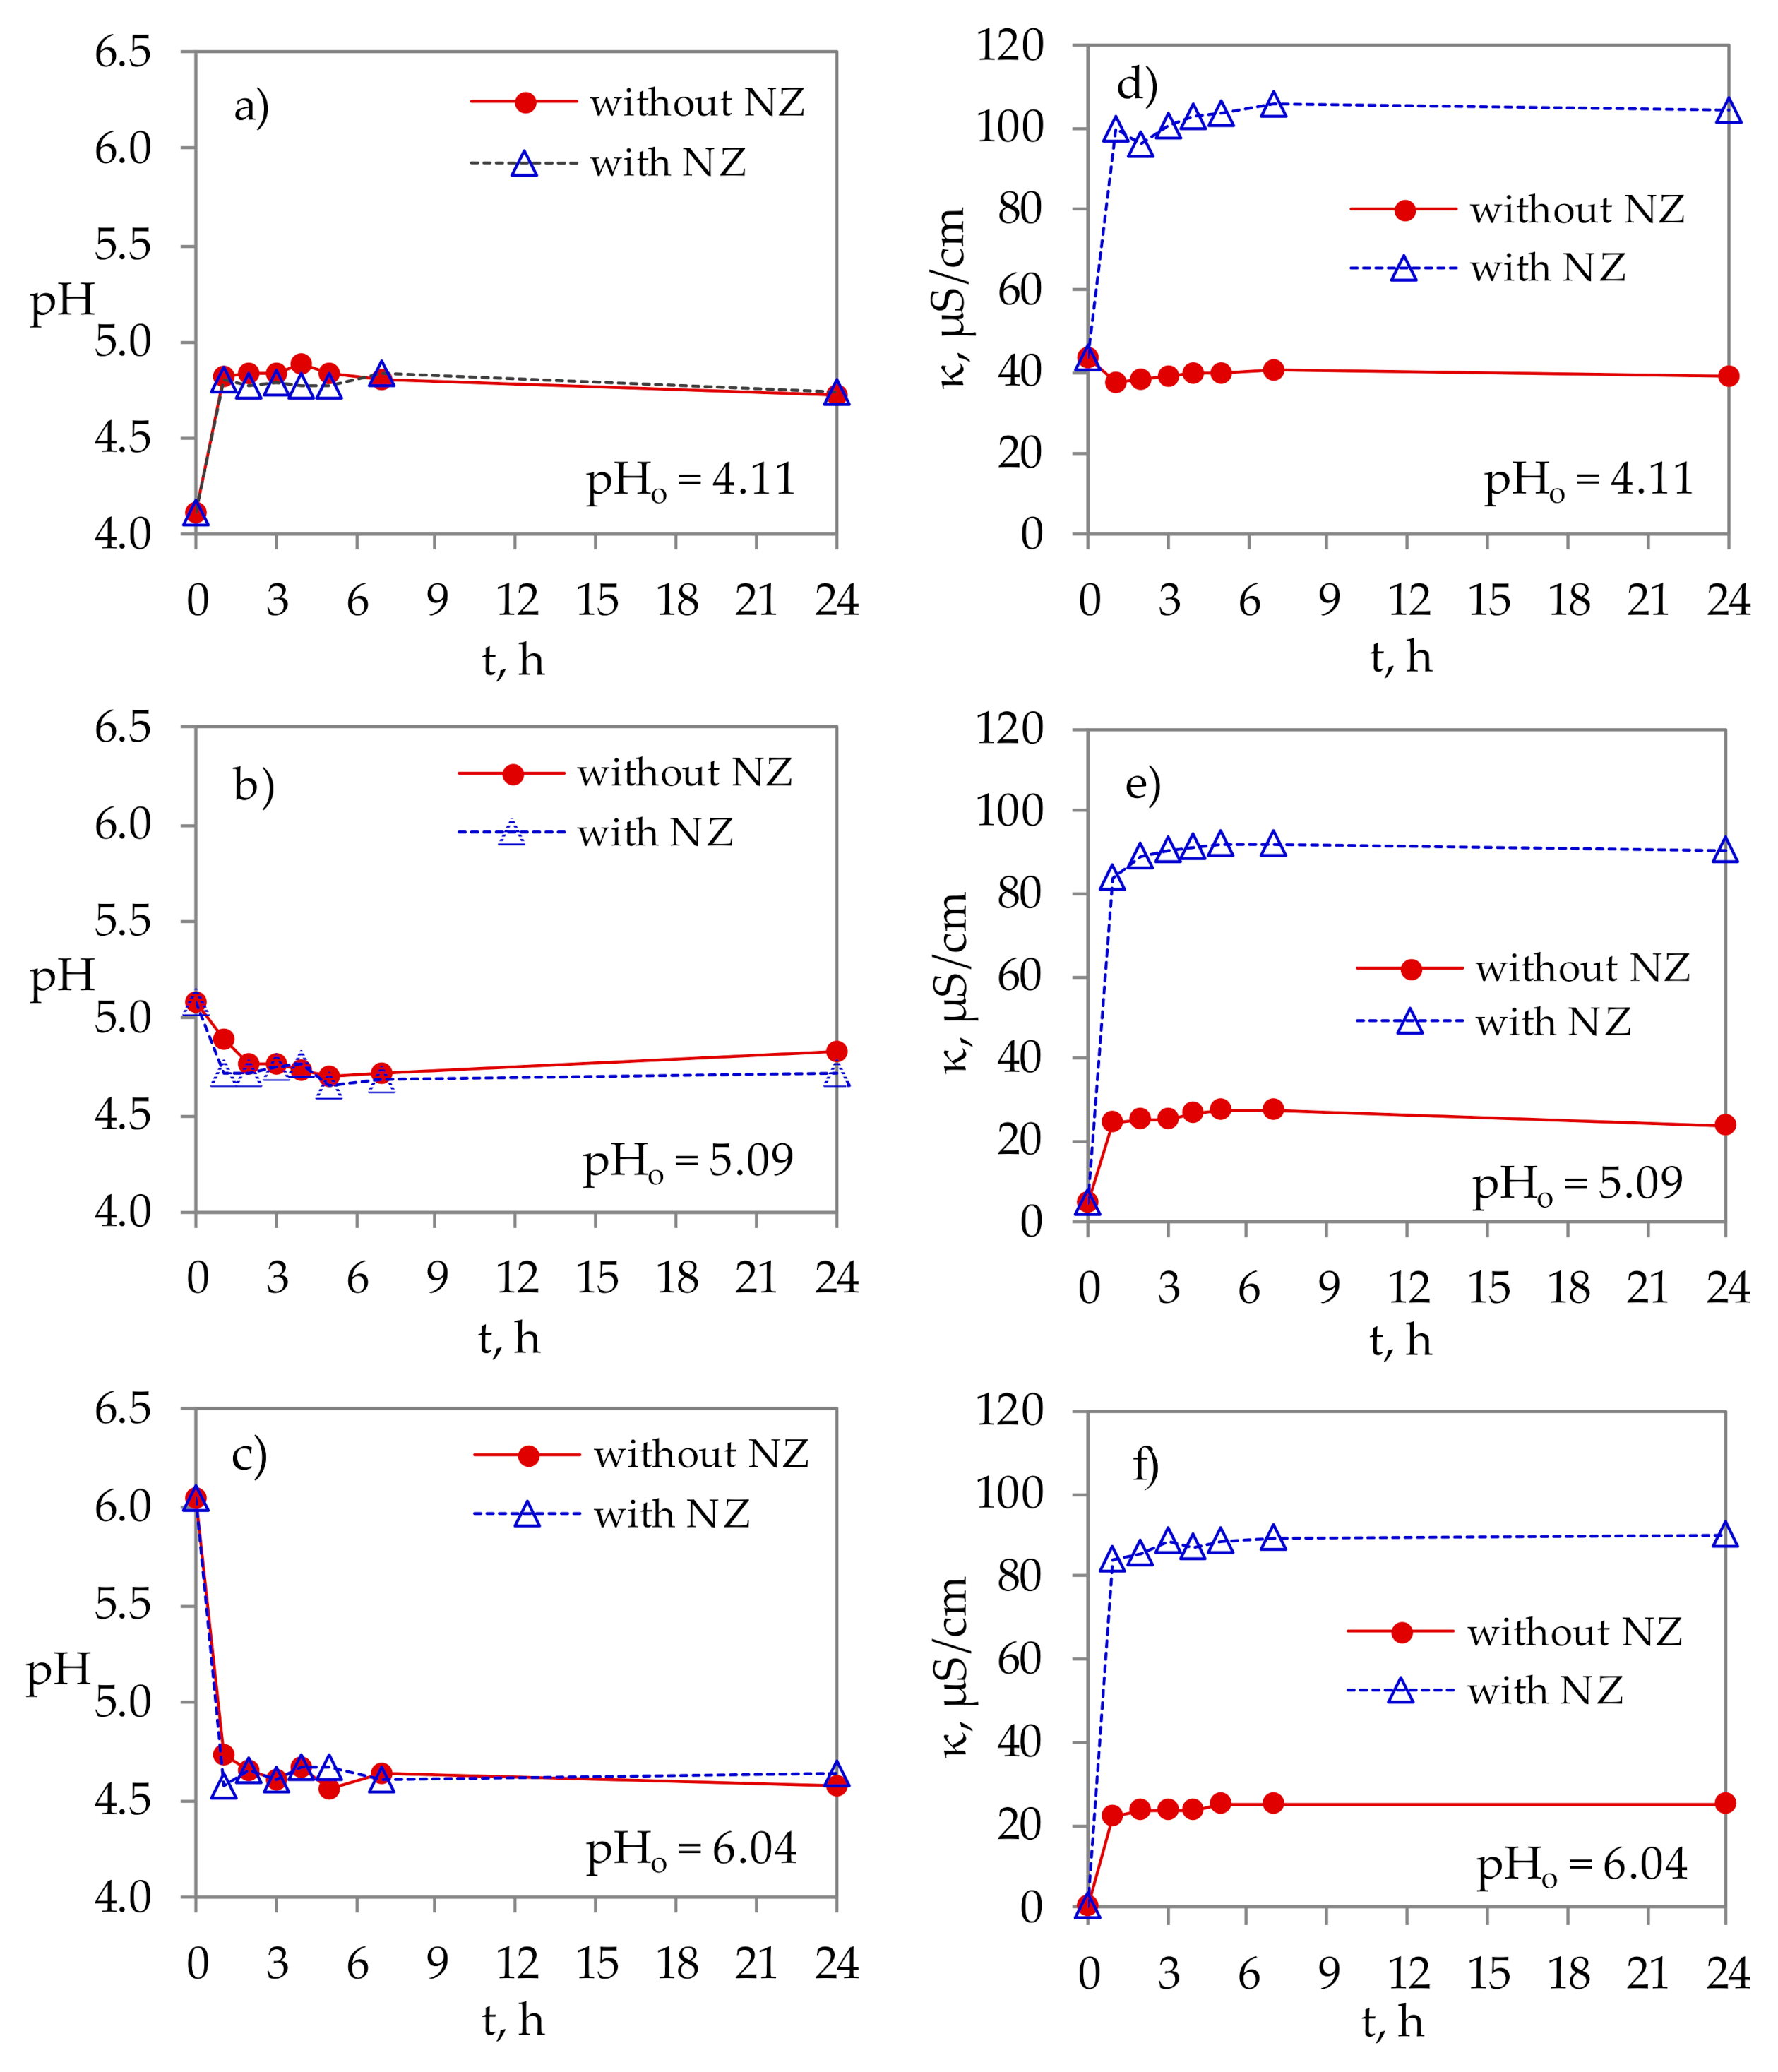
Changes in the pH value in soil–ultrapure water and soil with natural zeolite–ultrapure water suspensions at different initial pHo values of 4.11, 5.09 and 6.04 are shown graphically in Figure 17. All suspensions tend to have a slightly acidic pH, which can be attributed to the buffering capacity of the soil. The largest change in pH in Figure 17a–c in all suspensions occurs within the first two hours of the experiment after which it becomes almost constant. The pH value in suspensions depends on the exchange of H3O+ and OH− with ionic species from the soil, as well as with cations from the zeolite structure. The difference in pH values in the case of suspensions without and with the presence of natural zeolite is almost negligible, indicating the strong buffering capacity of the soil. This is in line with several similar field studies [81,82].
The largest change in electrical conductivity in Figure 17d–f in all suspensions occurs within the first two hours and remains almost constant until the end of the experiment. The electrical conductivity decreases with increasing in pHo, both in suspensions without and with the presence of natural zeolite. The difference in electrical conductivity of ≈60 µS/cm in soil suspensions with and without the NZ (Figure 17d–f), as a consequence of the zeolite–soil interaction is negligible.
4. Conclusions
In the surroundings of the Idrija mine (Slovenia) extremely mercury-contaminated ancient small-scale cinnabar roasting sites were identified. Soil from one of these locations (Ferbejžene trate) containing 1347 mg Hg/kg was tested. Leaching of this soil in ultrapure water of pHo values in the range 3.00–11.46 resulted in equilibrium concentrations of the total leached mercury up to 17.43 µg/L, while maximal concentrations during leaching were from 136.9 to 488.0 µg/L, for the pHo range 4.03–6.32. These concentrations are quite high if we consider that the maximum permissible mercury concentration in water for human consumption is 1.0 µg/L, and mercury and its compounds have been identified as priority hazardous substances in the field of water policy. The pH significantly not only affected the mobility and solubility of mercury species in the soil, but also very likely the mercury speciation in leachates.
The natural zeolite clinoptilolite of two particle sizes showed very good sorption of leached mercury, where the maximum removal efficiency of 94.2% was achieved. The removal efficiencies are not in correlation with total mercury concentrations in leachates, indicating that presumably mercury speciation is the dominant factor affecting mercury uptake on the natural zeolite. Furthermore, by leaching of mercury in the presence of the natural zeolite, a significant decrease of the total leached mercury is observed (1.9–20.3 µg/L compared to 12.8–42.2 µg/L), for all examined pHo values, pointing to immobilization of mercury species, with obtained removal efficiencies up to 90.5%. In both, the soil–ultrapure water and soil–zeolite–ultrapure water suspensions, the tendency toward neutral or weak acidic equilibrium stages indicates the high buffering capacity of these systems.
The obtained preliminary results indicate the potential of natural zeolite clinoptilolite for remediation of mercury-contaminated environments. However, additional efforts should be made to maintain the mercury concentration in the water below the maximum permissible limits. Natural zeolites are proven as great ion exchangers, but their adsorption properties need to be improved. Due to the well-known mercury tendency toward sulfur-containing species, the sulfurization of the zeolite surface might improve its effectiveness in mercury capturing. Moreover, the performance of multistage sorption could reduce the mercury concentration in water up to satisfying levels.
The further studying of mercury leachability at ancient roasting sites of the Idrija district in Slovenia should be continued by estimation of the efficiency of modified natural materials in their mercury capture capability, especially in column mode. Additionally, in some part of further research the attention should be addressed to an adequate method of disposal of heavy metal-bearing zeolite to prevent secondary pollution. The solidification/stabilization process by cementitious binders seems very promising in reducing the release of toxic species into the environment, especially since many researchers found that the addition of low content of zeolitic tuff improves the properties of the concrete.
Author Contributions
Conceptualization, investigation, methodology, visualization, writing—original draft preparation, review and editing, I.N.; formal analysis, visualization, writing—review and editing, M.G.; visualization, writing—review and editing, M.U.; visualization, writing—review and editing, M.T. All authors have read and agreed to the published version of the manuscript.
Funding
This research was fully financially supported by the bilateral Croatian–Slovenian project “Application of natural zeolite for remediation of mercury-contaminated soil”. The study was partly financed by the Slovenian Research Agency (ARRS) through the research program Groundwater and Geochemistry (P1-0020). The APC was funded by Geological Survey of Slovenia (P1-0020).
Institutional Review Board Statement
Not applicable.
Informed Consent Statement
Not applicable.
Data Availability Statement
Not applicable.
Acknowledgments
Many thanks to colleague Mariusz Macherzyński from AGH University of Science and Technology, Faculty of Energy and Fuels, Department of Coal Chemistry and Environmental Sciences in Krakow, Poland and the AGH UST (grant No. 11.11.210.374).
Conflicts of Interest
The authors declare no conflict of interest. The funders had no role in the design of the study; in the collection, analyses, or interpretation of data; in the writing of the manuscript, or in the decision to publish the results.
References
- WHO. Exposure to Mercury: A Major Public Health Concern, 2nd ed.; Preventing Disease through Healthy Environments; World Health Organization: Geneva, Switzerland, 2021; ISBN 9789240023567. Available online: https://www.who.int/publications/i/item/9789240023567 (accessed on 14 December 2021).
- EEA Report No 11/2018, TH-AL-18-011-EN-N, Mercury in Europe’s Environment, A Priority for European and Global Action, European Environment Agency. Available online: https://www.eea.europa.eu/publications/mercury-in-europe-s-environment/download (accessed on 14 December 2021).
- Gray, J.E.; Pribil, M.J.; Higueras, P.L. Mercury isotope fractionation during ore retorting in the Almadén mining district, Spain. Chem. Geol. 2013, 357, 150–157. [Google Scholar] [CrossRef] [Green Version]
- Swartzendruber, P.; Jaffe, D. Sources and transport a global issue. In Mercury in the Environment: Pattern and Process, 1st ed.; Bank, M.S., Ed.; University of California Press: Berkeley, CA, USA; Los Angeles, CA, USA; London, UK, 2012; Chapter 1; pp. 3–18. [Google Scholar]
- Calao-Ramos, C.; Bravo, A.G.; Paternina-Uribe, R.; Marrugo-Negrete, J.; Díez, S. Occupational human exposure to mercury in artisanal small-scale gold mining communities of Colombia. Environ Int. 2021, 146, 106216. [Google Scholar] [CrossRef] [PubMed]
- Masur, L.C. A review of the use of mercury in historic and current ritualistic and spiritual practices. Altern. Med. Rev. 2011, 16, 314–320. [Google Scholar] [PubMed]
- WHO. Preventing Disease through Healthy Environments, Mercury in Skin Lightening Products, World Health Organization, WHO/CED/PHE/EPE/19.13. 2019. Available online: https://apps.who.int/iris/bitstream/handle/10665/330015/WHO-CED-PHE-EPE-19.13-eng.pdf (accessed on 16 December 2021).
- Shiwei, Z.; Dongmei, Z.; Yuan, X.; Ying, M.; Liu, S.; Huiying, L. Study on mercury methylation in phragmites australis soil and its influencing factors. Water Air Soil Pollut. 2020, 231, 426. [Google Scholar] [CrossRef]
- He, F.; Gao, J.; Pierce, E.; Strong, P.J.; Wang, H.; Liang, L. In situ remediation technologies for mercury-contaminated soil. Sci Pollut Res. 2015, 22, 8124–8147. [Google Scholar] [CrossRef]
- McCarthy, D.; Edwards, G.C.; Gustin, M.S.; Care, A.; Miller, M.B.; Sunna, A. An innovative approach to bioremediation of mercury contaminated soils from industrial mining operations. Chemosphere 2017, 184, 694–699. [Google Scholar] [CrossRef]
- Moharem, M.; Elkhatib, E.; Mesalem, M. Remediation of chromium and mercury polluted calcareous soils using nanoparticles: Sorption-desorption kinetics, speciation and fractionation. Environ. Res. 2019, 170, 366–373. [Google Scholar] [CrossRef]
- Eckley, C.S.; Gilmour, C.C.; Janssen, S.; Luxton, T.P.; Randall, P.M.; Whalin, L.; Austin, C. The assessment and remediation of mercury contaminated sites: A review of current approaches. Sci Total Environ. 2020, 707, 136031. [Google Scholar] [CrossRef]
- Spanu, D.; Bestetti, A.; Hildebrand, H.; Schmuki, P.; Altomare, M.; Recchia, S. Photocatalytic reduction and scavenging of Hg(ii) over templated-dewetted Au on TiO2 nanotubes. Photochem. Photobiol. Sci. 2019, 18, 1046–1055. [Google Scholar] [CrossRef]
- Wang, T.; He, S.; Zhang, Y.; Wang, J.; Pan, W.-P. Photocatalytic removal of elemental mercury on TiO2-BiOIO3 heterostructures: Mercury transformation, sulfur tolerance and SO2/SO3 conversion. Chem. Eng. J. 2020, 388, 124390. [Google Scholar] [CrossRef]
- Tunsu, C.; Wickman, B. Effective removal of mercury from aqueous streams via electrochemical alloy formation on platinum. Nat. Commun. 2018, 9, 4876. [Google Scholar] [CrossRef] [PubMed]
- Bengtsson, M.K.O.; Tunsu, C.; Wickman, B. Decontamination of mercury-containing aqueous streams by electrochemical alloy formation on copper. Ind. Eng. Chem. Res. 2019, 58, 9166–9172. [Google Scholar] [CrossRef]
- O’Connor, D.; Peng, T.; Li, G.; Wang, S.; Duan, L.; Mulder, J.; Cornelissen, G.; Cheng, Z.; Yang, S.; Hou, D. Sulfur-modified rice husk biochar: A green method for the remediation of mercury contaminated soil. Sci. Total Environ. 2018, 621, 819–826. [Google Scholar] [CrossRef] [PubMed]
- Al-Ghouti, M.A.; Da’ana, D.; Abu-Dieyeh, M.; Khraisheh, M. Adsorptive removal of mercury from water by adsorbents derived from date pits. Sci. Rep. 2019, 9, 1–15. [Google Scholar] [CrossRef] [Green Version]
- Abdillah, A.M.; Abidin, Z.; Widiatmaka, W.; Johan, E.; Matsue, N. Adsorptive Removal of Mercury by Zeolites and Montmorillonite. J. Pengelolaan Sumberd. Alam Lingk. 2019, 9, 797–801. [Google Scholar] [CrossRef]
- Fayazi, M. Removal of mercury(II) from wastewater using a new and effective composite: Sulfur-coated magnetic carbon nanotubes. Environ. Sci. Pollut. Res. Int. 2020, 27, 12270–12279. [Google Scholar]
- Favvas, E.; Tsanaktsidis, C.; Sapalidis, A.; Tzilantonis, G.; Papageorgiou, S.; Mitropoulos, A. Clinoptilolite, a natural zeolite material: Structural characterization and performance evaluation on its dehydration properties of hydrocarbon-based fuels. Microporous Mesoporous Mater. 2016, 225, 385–391. [Google Scholar] [CrossRef]
- Nuić, I.; Trgo, M.; Vukojević Medvidović, N. The application of the packed bed reactor theory to Pb and Zn uptake from the binary solution onto the fixed bed of natural zeolite. Chem. Eng. J. 2016, 295, 347–357. [Google Scholar] [CrossRef]
- Nuić, I.; Trgo, M.; Vukojević Medvidović, N.; Ugrina, M. A mass transfer analysis of competitive binding of Pb, Cd, and Zn from binary systems onto a fixed zeolite bed. Int. J. Environ. Res. Public Health 2019, 16, 426. [Google Scholar] [CrossRef] [Green Version]
- Cigale, M. Rudnik živega srebra Idrija od 1490 do 2006. In 2. Slovenski Geološki Kongres, Zbornik Povzetkov. Rudnik ŽIvega Srebra v Zapiranju d.o.o., Idrija; Režun, B., Eržen, U., Petrič, M., Gantar, I., Eds.; Rudnik Živega srebra v Zapiranju: Idrija, Slovenia, 2006; pp. 13–16. (In Slovenian) [Google Scholar]
- Kavčič, I. History of Smelting in Idrija; Založba Bogataj: Idrija, Slovenia, 2008; pp. 1–352. (In Slovenian) [Google Scholar]
- Teršič, T.; Gosar, M.; Biester, H. Distribution and speciation of mercury in soil in the area of an ancient mercury ore roasting site, Frbejžene trate (Idrija area, Slovenia). J. Geochem. Explor. 2011, 110, 136–145. [Google Scholar] [CrossRef]
- Teršič, T.; Gosar, M.; Biester, H. Environmental impact of ancient small-scale mercury ore processing at Pšenk on soil (Idrija area, Slovenia). Appl. Geochem. 2011, 26, 1867–1876. [Google Scholar] [CrossRef]
- Gosar, M.; Teršič, T. Environmental geochemistry studies in the area of Idrija mercury mine, Slovenia. Environ. Geochem. Health 2012, 34, 27–41. [Google Scholar] [CrossRef] [PubMed]
- Gosar, M.; Teršič, T. Contaminated sediment loads from ancient mercury ore roasting sites, Idrija area, Slovenia. J. Geochem. Explor. 2015, 149, 97–105. [Google Scholar] [CrossRef]
- Gosar, M.; Šajn, R.; Teršič, T. Distribution pattern of mercury in the Slovenian soil: Geochemical mapping based on multiple geochemical datasets. J. Geochem. Explor. 2016, 167, 38–48. [Google Scholar] [CrossRef] [Green Version]
- Vukojević Medvidović, N.; Nuić, I.; Ugrina, M.; Trgo, M. Evaluation of natural zeolite as a material for permeable reactive barrier for remediation of zinc contaminated groundwater based on column study. Water Air Soil Pollut. 2018, 229, 1–14. [Google Scholar] [CrossRef]
- Gosar, M.; Čar, J. Influence of mercury ore roasting sites from 16th and 17th century on the mercury dispersion in surroundings of Idrija. Geologija 2006, 49, 91–101. [Google Scholar] [CrossRef]
- DIN ISO 10390:2005; Soil Quality-Determination of pH. International Organization for Standardization. ISO: Geneva, Switzerland, 2005.
- Nelson, P.; Su, N. Soil pH buffering capacity: A descriptive function and its application to some acidic tropical soils. Aust. J. Soil Res. 2010, 48, 201–207. [Google Scholar] [CrossRef]
- Xu, R.-K.; Zhao, A.-Z.; Yuan, J.; Jiang, J. pH buffering capacity of acid soils from tropical and subtropical regions of China as influenced by incorporation of crop straw biochars. J. Soils Sediments 2012, 12, 494–502. [Google Scholar] [CrossRef]
- HRN EN ISO 11260:2012; Soil Quality-Determination of Effective Cation Exchange Capacity and Base Saturation Level Using Barium Chloride Solution, (ISO 11260:1994+Cor 1:1996; EN ISO 11260:2011). Croatian Standards Institute: Zagreb, Croatia, 2012; p. 14. Available online: https://repozitorij.hzn.hr/norm/HRN+EN+ISO+11260%3A2012 (accessed on 16 February 2022).
- Zhang, H.; Wang, J.J. Loss on ignition method. In Soil Test Methods from the Southeasten United States. Southern Extension and Research Activity Information Exchange Group 6; Sikora, F.J., Moore, K.P., Eds.; University of Georgia: Athens, Greek, 2014; pp. 155–157. Available online: https://aesl.ces.uga.edu/sera6/PUB/MethodsManualFinalSERA6.asp (accessed on 16 December 2021).
- Roper, W.; Robarge, W.; Osmond, D.; Heitman, J.L. Comparing four methods of measuring soil organic matter in North Carolina soils. Soil Sci. Soc. Am. J. 2019, 83, 466–474. [Google Scholar] [CrossRef]
- Vogel, S.; Bönecke, E.; Kling, C.; Kramer, E.; Lück, K.; Nagel, A.; Philipp, G.; Rühlmann, R.; Schröter, I.; Gebbers, R. Base neutralizing capacity of agricultural soils in a quaternary landscape of north-east Germany and its relationship to best management practices in lime requirement determination. Agronomy 2020, 10, 877. [Google Scholar] [CrossRef]
- DIN 38414 S4; German Standard Procedure for Water, Wastewater and Sediment Testing–Sludge and Sediment. Determination of Leachability. Institut für Normung: Berlin, Germany, 1984.
- The Environmental Management (Soil Quality Standards) Regulations. 2007. Available online: https://extwprlegs1.fao.org/docs/pdf/tan151538.pdf (accessed on 18 June 2021).
- Government Decree on the Assessment of Soil Contamination and Remediation Needs (214/2007), Ministry of the Environment, Finland. 2007. Available online: https://www.finlex.fi/en/laki/kaannokset/2007/en20070214.pdf (accessed on 16 February 2022).
- Vodyanitskii, Y.N. Standards for the contents of heavy metals in soils of some states. Ann. Agrar. Sci. 2016, 14, 257–263. [Google Scholar] [CrossRef] [Green Version]
- Krupenikov, I.A.; Boincean, B.P.; Dent, D. Soil mineralogy and elemental composition. In The Black Earth; International Year of Planet Earth; Springer: Dordrecht, The Netherlands, 2011; pp. 27–32. [Google Scholar] [CrossRef]
- D’Amour, H.; Denner, W.; Schulz, H. Structure determination of [alpha]-quartz up to 68 x 108 Pa. Acta Cryst. 1979, B35, 550–555. [Google Scholar] [CrossRef] [Green Version]
- ISO 14688-2:2004; Geotechnical Investigation and Testing-Identification and Classification of Soil-Part 2: Principles for a Classification. International Organization for Standardization, ISO: Geneva, Switzerland, 2004.
- Huang, P.-T.; Patel, M.; Santagata, M.C.; Bobet, A. FHWA/IN/JTRP-2008/2, Classification of Organic Soils; Final Report; Indiana Department of Transportation and Federal Highway Administration: Indianapolis, IN, USA, 2009; pp. 46–62. Available online: https://www.geostructures.com/library/technical-bulletins/pdf/Classification-of-Organic-Soils-FHWA-IN-JTRP-2008-2.pdf (accessed on 16 February 2022).
- Brümmer, G.; Herms, U. Influence of soil reaction and organic matter on the solubility of heavy metals in soils. In Effects of Accumulation of Air Pollutants in Forest Ecosystems; Urlich, B., Pankrath, J., Eds.; D. Reidel Publishing Company: Dordrecht, The Netherlands, 1983; pp. 233–243. [Google Scholar]
- Weil, R.R.; Brady, N.C. The Nature and Properties of Soils, 15th ed.; Pearson Education Limited, Edinburgh Gate: Harlow, UK, 2017; pp. 20–51, 345–391, 392–437. [Google Scholar]
- Schuster, E. The behaviour of mercury in the soil with special emphasis on complexation and adsorption processes-a review of the literature. Water Air Soil Pollut. 1991, 56, 667–680. [Google Scholar] [CrossRef]
- Xu, J.; Kleja, D.B.; Biester, H.; Lagerkvist, A.; Kumpiene, J. Influence of particle size distribution, organic carbon, pH and chlorides on washing of mercury contaminated soil. Chemosphere 2014, 109, 99–105. [Google Scholar] [CrossRef] [PubMed] [Green Version]
- Teršič, T.; Biester, H.; Gosar, M. Leaching of mercury from soils at extremely contaminated historical roasting sites (Idrija area, Slovenia). Geoderma 2014, 226–227, 213–222. [Google Scholar] [CrossRef]
- Sharpley, A.N. Effect of soil pH on cation and anion solubility. Commun. Soil Sci. Plant Anal. 1991, 22, 827–841. [Google Scholar] [CrossRef]
- Jiang, J.; Wang, Y.-P.; Yu, M.; Cao, N.; Yan, J. Soil organic matter is important for acid buffering and reducing aluminum leaching from acidic forest soils. Chem. Geol. 2018, 501, 86–94. [Google Scholar] [CrossRef]
- Tan, K.H. Principles of Soil Chemistry, 4th ed.; CRC Press Taylor & Francis Group: Boca Raton, FL, USA, 2011; pp. 243–266. [Google Scholar]
- Matsusaka, Y.; Sherman, G.D. Titration Curves and Buffering Capacities of Hawaiian Soils; Technical Bulletin No 11; University of Hawaii, College of Agriculture, Agricultural Experiment Station: Honolulu, HA, USA, 1950; pp. 5–36. [Google Scholar]
- Jansen van Rensburg, H.G.; Claassens, A.S.; Beukes, D.J. Relationships between soil buffer capacity and selected soil properties in a resource-poor farming area in the Mpumalanga Province of South Africa. S. Afr. J. Plant Soil. 2009, 26, 237–243. [Google Scholar] [CrossRef] [Green Version]
- Bloom, P.R.; Skyllberg, U. Soil pH and pH buffering. In Handbook of Soil Sciences, Properties and Processes, 2nd ed.; Huang, P.M., Li, Y., Sumner, M.E., Eds.; CRC Press: Boca Raton, FL, USA, 2012; pp. 1–14. [Google Scholar]
- Pagani, A.; Sawyer, J.E.; Mallarino, A.P.; Moody, L.; Davis, J.; Phillips, S. Site-Specific Nutrient Management: For Nutrient Management Planning to Improve Crop Production, Environmental Quality, and Economic Return; Extension and Outreach Publications: Washington, DC, USA, 2013; Volume 116, pp. 103–113. Available online: https://lib.dr.iastate.edu/extension_pubs/116 (accessed on 17 December 2021).
- Curtin, D.; Trolove, S. Predicting pH buffering capacity of New Zealand soils from organic matter content and mineral characteristics. Soil Res. 2013, 51, 494–502. [Google Scholar] [CrossRef]
- Moore, G.; Dolling, P.; Porter, B.; Leonard, L. Chemical factors affecting plant growth. In Soil Guide: A Handbook for Understanding and Managing Agricultural Soils; No. 4343; Moore, G.A., Ed.; Department of Agriculture, Western Australia: Bulletin, Australia, 2001; pp. 127–140. [Google Scholar]
- Reganold, J.P.; Harsh, J.B. Expressing cation exchange capacity in milliequivalents per 100 grams and in SI units. J. Agric. Educ. 1985, 14, 84–90. [Google Scholar] [CrossRef]
- Johnson, C.E. Cation exchange properties of acid forest soils of the north eastern USA. Eur. J. Soil Sci. 2002, 53, 271–282. [Google Scholar] [CrossRef]
- Nešić, L.; Vasin, J.; Belic, M.; Ćirić, V.; Gligorijevic, J.; Milunovic, K.; Sekulić, P. The colloid fraction and cation-exchange capacity in the soils of Vojvodina, Serbia. Ratar. Povrt. 2015, 52, 18–23. [Google Scholar] [CrossRef] [Green Version]
- Gumbara, R.H.; Darmawan; Sumawinata, B. A comparison of cation exchange capacity of organic soils determined by ammonium acetate solutions buffered at some pHs ranging between around field pH and 7.0. IOP Conf Ser. Earth Environ Sci. 2019, 393, 012015. [Google Scholar] [CrossRef]
- Directive (EU) 2020/2184 of the European Parliament and of the Council of 16 December 2020 on the Quality of Water Intended for Human Consumption. ELI. Available online: http://data.europa.eu/eli/dir/2020/2184/oj (accessed on 17 December 2021).
- Cappuyns, V.; Swennen, R. The Application of pHstat leaching tests to assess the pH-dependent release of trace metals from soils, sediments and waste materials. J. Hazard. Mater. 2008, 158, 185–195. [Google Scholar] [CrossRef]
- O’Connor, D.; Hou, D.; Ok, Y.S.; Mulder, J.; Duan, L.; Wu, Q.; Wang, S.; Tack, F.M.G.; Rinklebe, J. Mercury speciation, transformation, and transportation in soils, atmospheric flux, and implications for risk management: A critical review. Environ. Int. 2019, 126, 747–761. [Google Scholar] [CrossRef]
- Clifford, M.J.; Hilson, G.M.; Hodson, M.E. Characteristics and behaviour of individual elements, Tin and Mercury. In Trace Elements in Soils; Hooda, P.S., Ed.; John Wiley & Sons Ltd.: Chichester, UK, 2010; pp. 497–513. [Google Scholar]
- Miller, R.L.; Bradford, W.L.; Peters, N.E. Specific Conductance; Theoretical Considerations and Application to Analytical Quality Control; U.S. Geological survey Water Supply Paper 2311; United States Government Printing Office: Washington, DC, USA, 1988. [CrossRef]
- Zhang, D.; Crini, G.; Lichtfouse, E.; Rhimi, B.; Wang, C. Removal of mercury ions from aqueous solutions by crosslinked chitosan-based adsorbents: A mini review. Chem. Rec. 2020, 20, 1–16. [Google Scholar] [CrossRef]
- Sharma, A.; Sharma, A.; Arya, R.K. Removal of mercury(II) from aqueous solution: A review of recent work. Sep. Sci. Technol. 2015, 50, 1310–1320. [Google Scholar] [CrossRef]
- Liu, Z.; Sun, Y.; Xu, X.; Qu, J.; Qu, B. Adsorption of Hg(II) in an aqueous solution by activated carbon prepared from rice husk using KOH activation. ACS Omega 2020, 5, 29231–29242. [Google Scholar]
- Prasakti, L.; Utami, F.N.; Prasetya, A. Removal of mercury ion from wastewater using natural zeolite: Effect of humic acid to adsorption isotherm. IOP Conf. Ser. Earth Environ. Sci. 2021, 882, 012068. [Google Scholar]
- Chojnacki, A.; Chojnacka, K.; Hoffmann, J.; Gorecki, H. The application of natural zeolites for mercury removal: From laboratory tests to industrial scale. Miner. Eng. 2004, 17, 933–937. [Google Scholar] [CrossRef]
- Giraldo, S.; Robles, I.; Ramirez, A.; Flórez, E.; Acelas, N. Mercury removal from wastewater using agroindustrial waste adsorbents. SN Appl. Sci. 2020, 2, 1029. [Google Scholar] [CrossRef]
- Parham, H.; Zargar, B.; Shiralipour, R. Fast and efficient removal of mercury from water samples using magnetic iron oxide nanoparticles modified with 2-mercaptobenzothiazole. J. Hazard. Mater. 2012, 205–206, 94–100. [Google Scholar] [CrossRef]
- Wang, S.; Peng, Y. Natural zeolites as effective adsorbents in water and wastewater treatment. Chem. Eng. J. 2010, 156, 11–24. [Google Scholar] [CrossRef]
- Voinovitch, I.; Debrad-Guedon, J.; Louvrier, J. The Analysis of Silicates; Israel Program for Scientific Translations: Jerusalem, Israel, 1966; pp. 127–129. [Google Scholar]
- Vukojević Medvidović, N.; Perić, J.; Trgo, M. Column performance in lead removal from aqueous solutions by fixed bed of natural zeolite-clinoptilolite. Sep. Purif. Technol. 2006, 49, 237–244. [Google Scholar]
- Litaor, M.I.; Katz, L.; Shenker, M. The influence of compost and zeolite co-addition on the nutrients status and plant growth in intensively cultivated Mediterranean Soils. Soil Use Manag. 2017, 33, 72–80. [Google Scholar] [CrossRef] [Green Version]
- Tallai, M.; Olah Zsuposne, A.; Sandor, Z.; Katai, J. The effect of using zeolite on some characteristics of sandy soil and on the amount of the test plant biomass. Ann. Ser. Agric. Silvic Vet. 2017, 6, 115–120. [Google Scholar]
Figure 1.
(a) SEM image, (b) EDS peaks of elements over the entire surface (Spectrum 1), (c) element content in wt. (%) over the entire surface and (d) distribution of main elements and mercury (Hg) over the entire surface.
Figure 1.
(a) SEM image, (b) EDS peaks of elements over the entire surface (Spectrum 1), (c) element content in wt. (%) over the entire surface and (d) distribution of main elements and mercury (Hg) over the entire surface.

Figure 2.
SEM image of mercury-contaminated soil particles with four selected sites (spectra, Sp) for EDS analysis and corresponding EDS results.
Figure 2.
SEM image of mercury-contaminated soil particles with four selected sites (spectra, Sp) for EDS analysis and corresponding EDS results.

Figure 3.
SEM image of mercury-contaminated soil particle magnified 300× with six selected sites (spectra, Sp) analyzed, with corresponding EDS results.
Figure 3.
SEM image of mercury-contaminated soil particle magnified 300× with six selected sites (spectra, Sp) analyzed, with corresponding EDS results.

Figure 4.
Rietveld fit for the XRD spectrum of the studied mercury-contaminated soil using the crystal structure of alpha-quartz (“simulated”). “Difference” curve represents the difference between “experimental” and “simulated” using alpha-quartz as the only phase. Some additional unidentified reflections are marked with “*”.

Figure 5.
Change in pH of soil suspension after the addition of different amounts of HCl or NaOH.

Figure 6.
The concentration (mean ± SD) of total mercury leached in ultrapure water of different pHo values in the range 3.00–11.46 after 24 h.
Figure 6.
The concentration (mean ± SD) of total mercury leached in ultrapure water of different pHo values in the range 3.00–11.46 after 24 h.

Figure 7.
The concentration of the total mercury leached in soil suspensions at different pHo values in time intervals within 24 h. Note: the results after 24 h correspond to those given in Figure 6.
Figure 7.
The concentration of the total mercury leached in soil suspensions at different pHo values in time intervals within 24 h. Note: the results after 24 h correspond to those given in Figure 6.

Figure 8.
Change of pH values in suspensions during the leaching.

Figure 9.
Change in electrical conductivity during the leaching for: (a) pHo = 3.00 and pHo = 11.46, and (b) pHo = 4.03–10.04.
Figure 9.
Change in electrical conductivity during the leaching for: (a) pHo = 3.00 and pHo = 11.46, and (b) pHo = 4.03–10.04.

Figure 10.
Mercury uptake (mean ± SD) onto natural zeolite of two particle sizes in dependence on the initial concentration of total mercury leached.
Figure 10.
Mercury uptake (mean ± SD) onto natural zeolite of two particle sizes in dependence on the initial concentration of total mercury leached.

Figure 11.
Removal efficiency (mean ± SD) of natural zeolite of two particle sizes toward total mercury in dependence on the initial concentration of total mercury leached.
Figure 11.
Removal efficiency (mean ± SD) of natural zeolite of two particle sizes toward total mercury in dependence on the initial concentration of total mercury leached.

Figure 12.
The comparison of pH values before leaching (pHo), prior to sorption (pHS) and after sorption (pHNZ) on two particle sizes of natural zeolite.
Figure 12.
The comparison of pH values before leaching (pHo), prior to sorption (pHS) and after sorption (pHNZ) on two particle sizes of natural zeolite.

Figure 13.
SEM image and EDS analysis with mass percentage values of the detected elements on the marked (Spectrum 1) surface for raw natural zeolite.
Figure 13.
SEM image and EDS analysis with mass percentage values of the detected elements on the marked (Spectrum 1) surface for raw natural zeolite.

Figure 14.
SEM image and EDS results for NZ of particle size < 0.04 mm after sorption of total mercury leached for pHo of ultrapure water of 6.32.
Figure 14.
SEM image and EDS results for NZ of particle size < 0.04 mm after sorption of total mercury leached for pHo of ultrapure water of 6.32.

Figure 15.
SEM image and EDS results for NZ of particle size 0.6–0.8 mm after sorption of total mercury leached for pHo of ultrapure water of 6.32.
Figure 15.
SEM image and EDS results for NZ of particle size 0.6–0.8 mm after sorption of total mercury leached for pHo of ultrapure water of 6.32.

Figure 16.
The concentration of total mercury leached from the soil and removal efficiency of natural zeolite at time intervals within 24 h without and with the addition of natural zeolite for three different pHo values of ultrapure water.
Figure 16.
The concentration of total mercury leached from the soil and removal efficiency of natural zeolite at time intervals within 24 h without and with the addition of natural zeolite for three different pHo values of ultrapure water.

Figure 17.
Change in: (a–c) pH and (d–f) electrical conductivity in suspensions during soil leaching without and with the addition of natural zeolite for three different pHo values of ultrapure water.
Figure 17.
Change in: (a–c) pH and (d–f) electrical conductivity in suspensions during soil leaching without and with the addition of natural zeolite for three different pHo values of ultrapure water.


Table 1.
Elemental content of mercury-contaminated soil sample.
| Element | Element Content, mg/kg | ||
|---|---|---|---|
| Min. | Max. | Average | |
| Ag | 0.06 | 0.12 | 0.08 |
| Al | 21,500.00 | 22,700.00 | 22,200.00 |
| As | 22.20 | 24.90 | 23.60 |
| B | 1.00 | 3.00 | 2.00 |
| Ba | 59.70 | 61.00 | 60.47 |
| Be | 3.10 | 6.10 | 4.60 |
| Bi | LDL | 0.15 | 0.15 |
| Ca | 700.00 | 700.00 | 700.00 |
| Cd | 0.43 | 0.89 | 0.60 |
| Ce | 72.80 | 77.60 | 75.10 |
| Co | 11.20 | 12.10 | 11.73 |
| Cr | 23.80 | 25.00 | 24.53 |
| Cs | 2.34 | 2.66 | 2.53 |
| Cu | 18.37 | 19.01 | 18.69 |
| Fe | 24,800.00 | 25,300.00 | 25,100.00 |
| Ga | 4.10 | 7.50 | 5.40 |
| Ge | LDL | 0.40 | 0.40 |
| Hf | 0.11 | 0.45 | 0.28 |
| Hg | 1290.00 | 1410.00 | 1347.00 |
| K | 2100.00 | 2400.00 | 2300.00 |
| La | 29.40 | 31.20 | 30.37 |
| Li | 58.80 | 69.70 | 63.37 |
| Mg | 4900.00 | 5900.00 | 5500.00 |
| Mn | 1062.00 | 1087.00 | 1074.67 |
| Mo | 4.07 | 6.22 | 5.23 |
| Na | LDL | 100.00 | 100.00 |
| Nb | 0.18 | 0.18 | 0.18 |
| Ni | 21.30 | 22.10 | 21.77 |
| P | 300.00 | 300.00 | 300.00 |
| Pb | 35.04 | 43.43 | 39.87 |
| Rb | 25.80 | 29.50 | 27.37 |
| S | 400.00 | 400.00 | 400.00 |
| Sb | 0.65 | 3.05 | 1.85 |
| Sc | 3.70 | 7.30 | 4.97 |
| Se | 7.00 | 8.90 | 7.70 |
| Sn | 0.20 | 1.00 | 0.60 |
| Sr | 6.50 | 6.80 | 6.63 |
| Te | LDL | 1.44 | 1.44 |
| Th | 5.00 | 6.10 | 5.67 |
| Ti | LDL | 20.00 | 20.00 |
| Tl | 0.37 | 0.65 | 0.51 |
| U | 2.50 | 2.80 | 2.67 |
| V | 47.00 | 48.00 | 47.67 |
| Y | 18.02 | 19.92 | 18.87 |
| Zn | 63.70 | 66.30 | 65.27 |
| Zr | 5.00 | 5.60 | 5.20 |
| W | 0.30 | 0.30 | 0.30 |
LDL—low detection limit; the elements (Au, In, Pd, Pt, Re and Ta) below the detectable limits were excluded from the table.
Publisher’s Note: MDPI stays neutral with regard to jurisdictional claims in published maps and institutional affiliations. |
© 2022 by the authors. Licensee MDPI, Basel, Switzerland. This article is an open access article distributed under the terms and conditions of the Creative Commons Attribution (CC BY) license (https://creativecommons.org/licenses/by/4.0/).
Share and Cite
MDPI and ACS Style
Nuić, I.; Gosar, M.; Ugrina, M.; Trgo, M. Assessment of Natural Zeolite Clinoptilolite for Remediation of Mercury-Contaminated Environment. Processes 2022, 10, 639. https://0-doi-org.brum.beds.ac.uk/10.3390/pr10040639
AMA Style
Nuić I, Gosar M, Ugrina M, Trgo M. Assessment of Natural Zeolite Clinoptilolite for Remediation of Mercury-Contaminated Environment. Processes. 2022; 10(4):639. https://0-doi-org.brum.beds.ac.uk/10.3390/pr10040639
Chicago/Turabian StyleNuić, Ivona, Mateja Gosar, Marin Ugrina, and Marina Trgo. 2022. "Assessment of Natural Zeolite Clinoptilolite for Remediation of Mercury-Contaminated Environment" Processes 10, no. 4: 639. https://0-doi-org.brum.beds.ac.uk/10.3390/pr10040639
Note that from the first issue of 2016, this journal uses article numbers instead of page numbers. See further details here.