
Development Process of Energy Mix towards Neutral Carbon Future of the Slovak Republic: A Review


Faculty of Mining, Ecology, Process Technologies and Geotechnology, Institute of Earth Sources, Technical University of Košice, Letná 9, 042 00 Košice, Slovakia
*
Author to whom correspondence should be addressed.
Processes 2021, 9(8), 1263; https://0-doi-org.brum.beds.ac.uk/10.3390/pr9081263
Submission received: 21 June 2021
/
Revised: 13 July 2021
/
Accepted: 20 July 2021
/
Published: 21 July 2021
(This article belongs to the Special Issue Sustainable Development Processes for Renewable Energy Technology)
Abstract
:Global climate change is putting humanity under pressure, which in many areas poses an unprecedented threat to society as we know it. In an effort to mitigate its effects, it is necessary to reduce the overall production of greenhouse gases and thus, dependence on fossil fuels in all areas of human activities. The presented paper deals with an evaluation of energy mix of the Slovak Republic and four selected neighboring countries in the context of achieving their carbon neutral or carbon negative future. The development of the evaluated energy mixes as well as greenhouse gas emissions is presented from a long-term perspective, which makes it possible to evaluate and compare mutual trends and approaches to emission-free energy sectors.
1. Introduction
The defining feature of recent decades is turbulence. Whether it is geopolitical, economic, or environmental instability, it is possible, to a certain extent, to connect this high variability, respective uncertainty with global climate change [1,2,3,4]. Global climate change is a phenomenon that came to the forefront of interest in the 1960s and is becoming increasingly important [5,6]. Impacts of climate change can be observed on all continents, in all oceans and in the highest layers of the atmosphere [7,8,9,10]. Climate change affects all levels of the ecological pyramid and affects the food chain to an extent that was previously known only from prehistoric cataclysmic events [11,12,13,14]. All manifestations of climate change expose the entire biological sphere to adaptive pressure, which causes not only the extinction of various species but mainly a change in the species composition of a certain geographical area [15,16,17,18]. For human society, the greatest threat is the loss of living space due to rising sea levels [19,20,21,22], the lack of drinking water for personal consumption [23,24,25] as well as agriculture and industry [26,27], extreme weather events [28,29] and long-term changes in temperature profile [30,31], spread of new diseases [32,33,34], famine [35,36], migration [37,38], deteriorating air quality [39,40], etc.
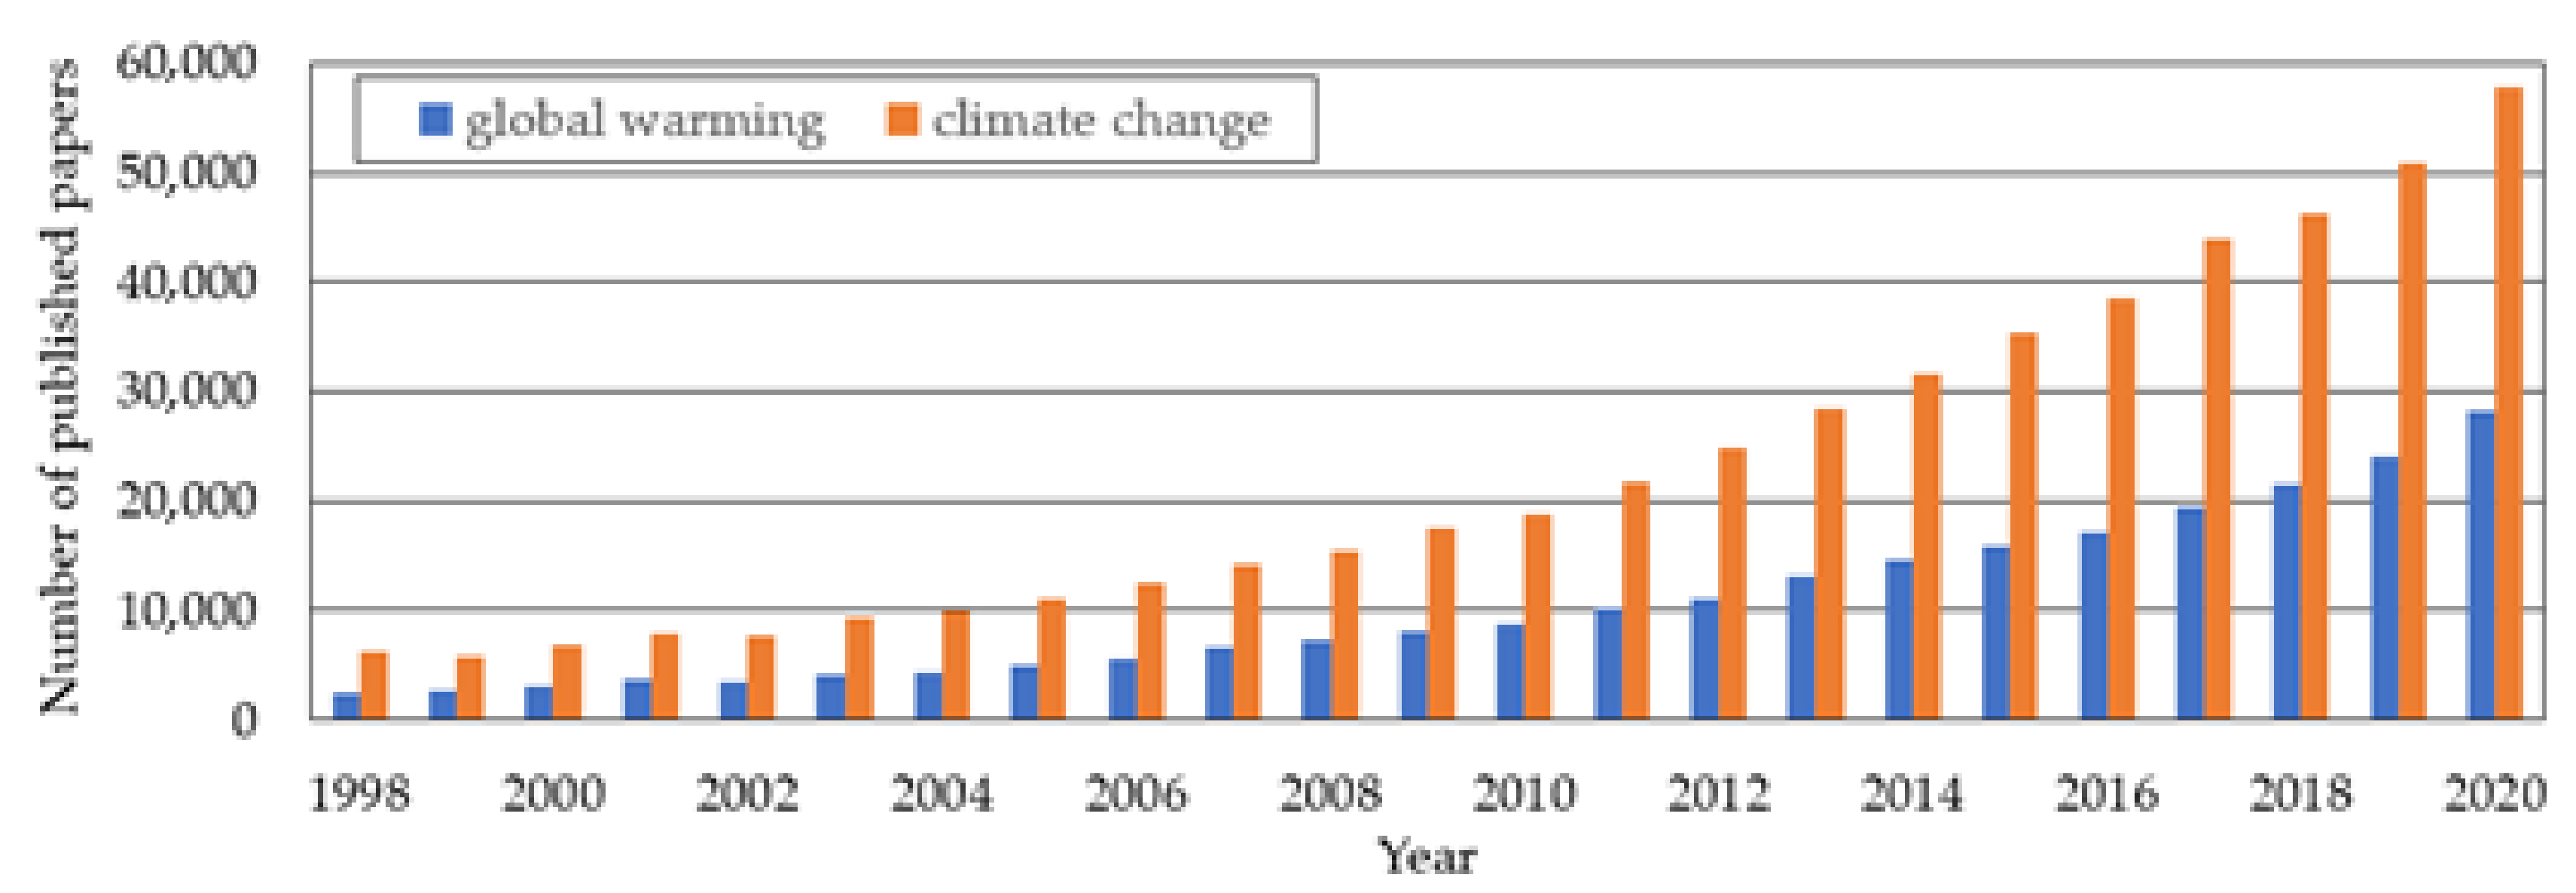
The importance of the topic of climate change is also evident from summary of scientific papers published in database ScienceDirect.com (accessed 25 May 2021), where 663,186 publications which contained the keywords climate change, have been published since 1998. To this number we can add 288,071 publications with the keywords global warming, which was used mainly in the past. At present, the preferred term is global climate change, which better captures the essence of the problem. Figure 1 shows the development of the number of publications on a given topic in the years 1998–2020. However, if we included publications dealing with the indirect consequences of climate change, or publications dealing with approaches and methods of mitigating the impacts of climate change, the resulting number would be an order of magnitude higher.
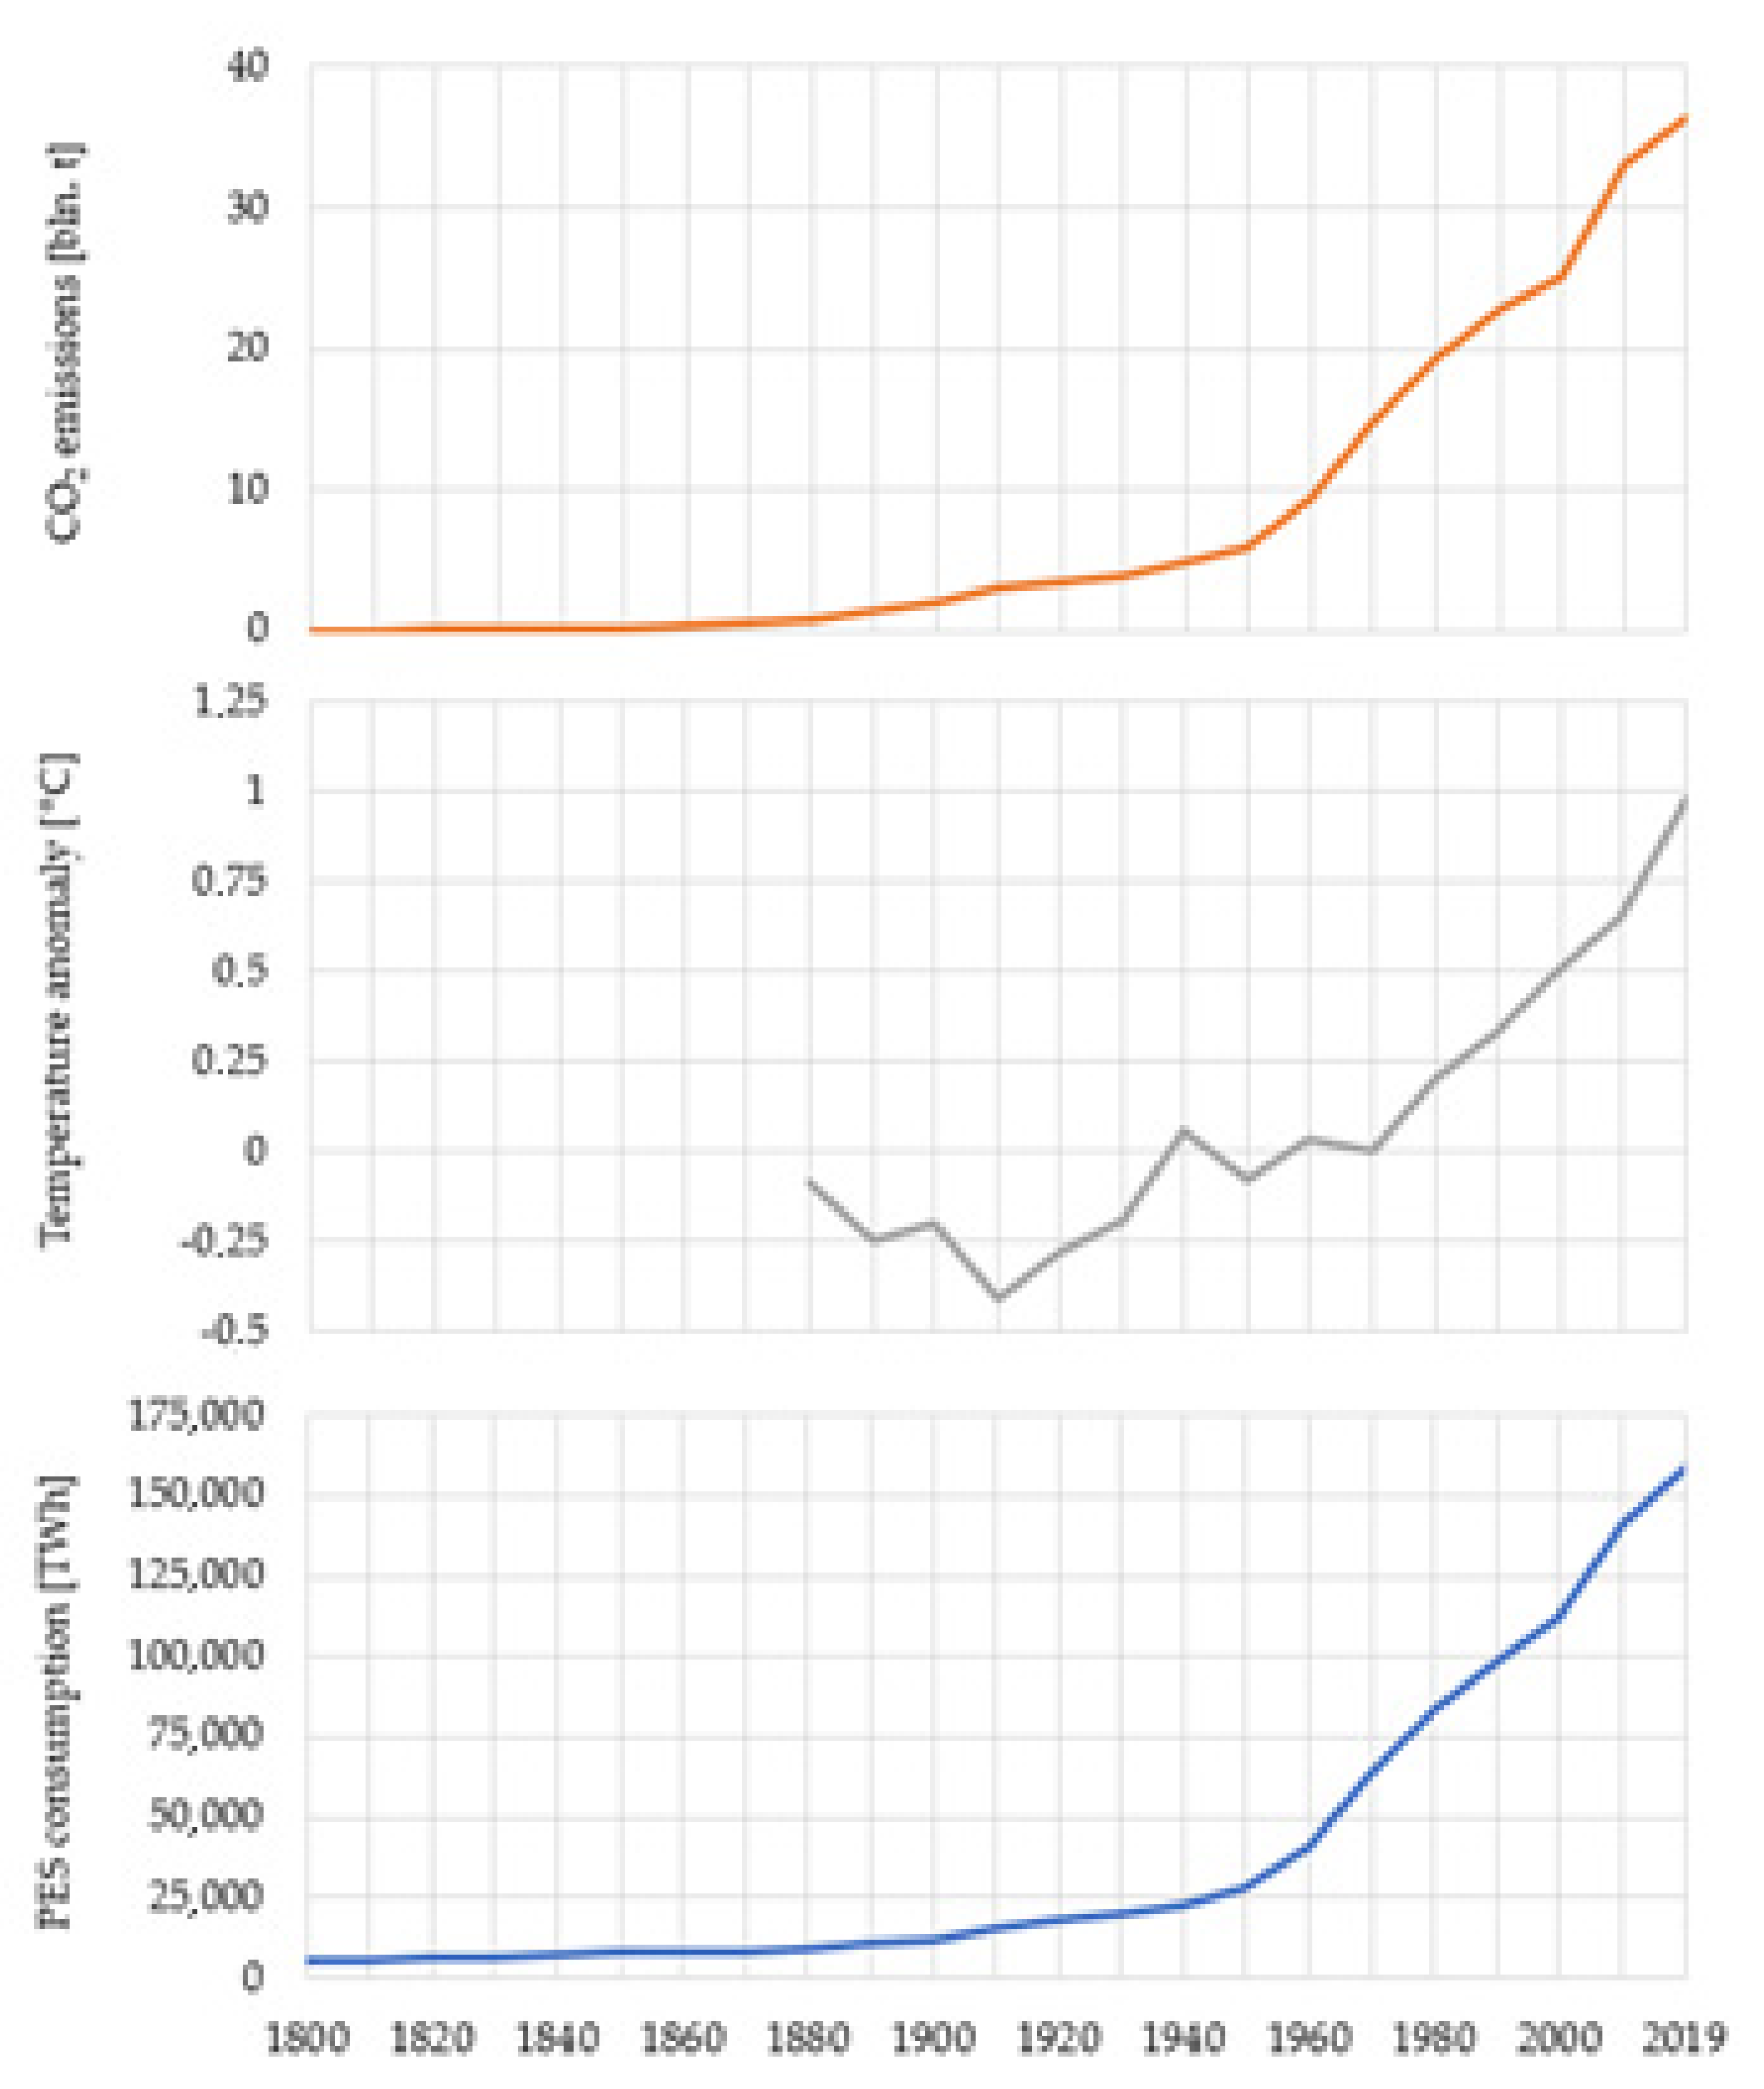
At present, the vast majority of the world’s scientific organizations, as well as the leading scientists in the field of climate, no longer doubt the reasons that contributed to the gradual development of climate change. All the reasons can be attributed to the anthropogenic activities associated with increasing the level of CO2 in the atmosphere [41,42,43,44,45]. This increase can be dated to the beginning of the industrial revolution [46] at the turn of the 18th and 19th centuries, when mankind began to use fossil fuels in previously unknown scales [47]. The evolution of CO2 emissions (from fossil fuel combustion and cement production), primary energy consumption and global temperature anomaly between 1800 and 2019 is shown in Figure 2. From all three graphs, it is possible to identify interrelated trends. The first one is the logical link between the increase in CO2 emissions and the consumption of primary energy sources. The second is the increase in the value of the temperature anomaly, where it is interesting to observe the growth rate in the last half century, which is almost identical to the growth of primary energy consumption and CO2 emissions.
One possible way to mitigate the effects of climate change is to keep global temperature rise to 1.5 °C [51] compared to the pre-industrial revolution time. This can be done by adjusting the consumption and structure of primary energy sources, especially in electricity generation or transportation [52,53,54,55,56,57]. The presented paper deals with the long-term development of the energy mix of Slovakia as well as the surrounding countries from the point of view of a carbon neutral or carbon negative future. The comparison evaluates individual approaches to reducing CO2 emissions and structural changes in energy mixes and related changes in the structure of primary energy consumption, which can be an example of good practice in the field.
2. Global Energy Review
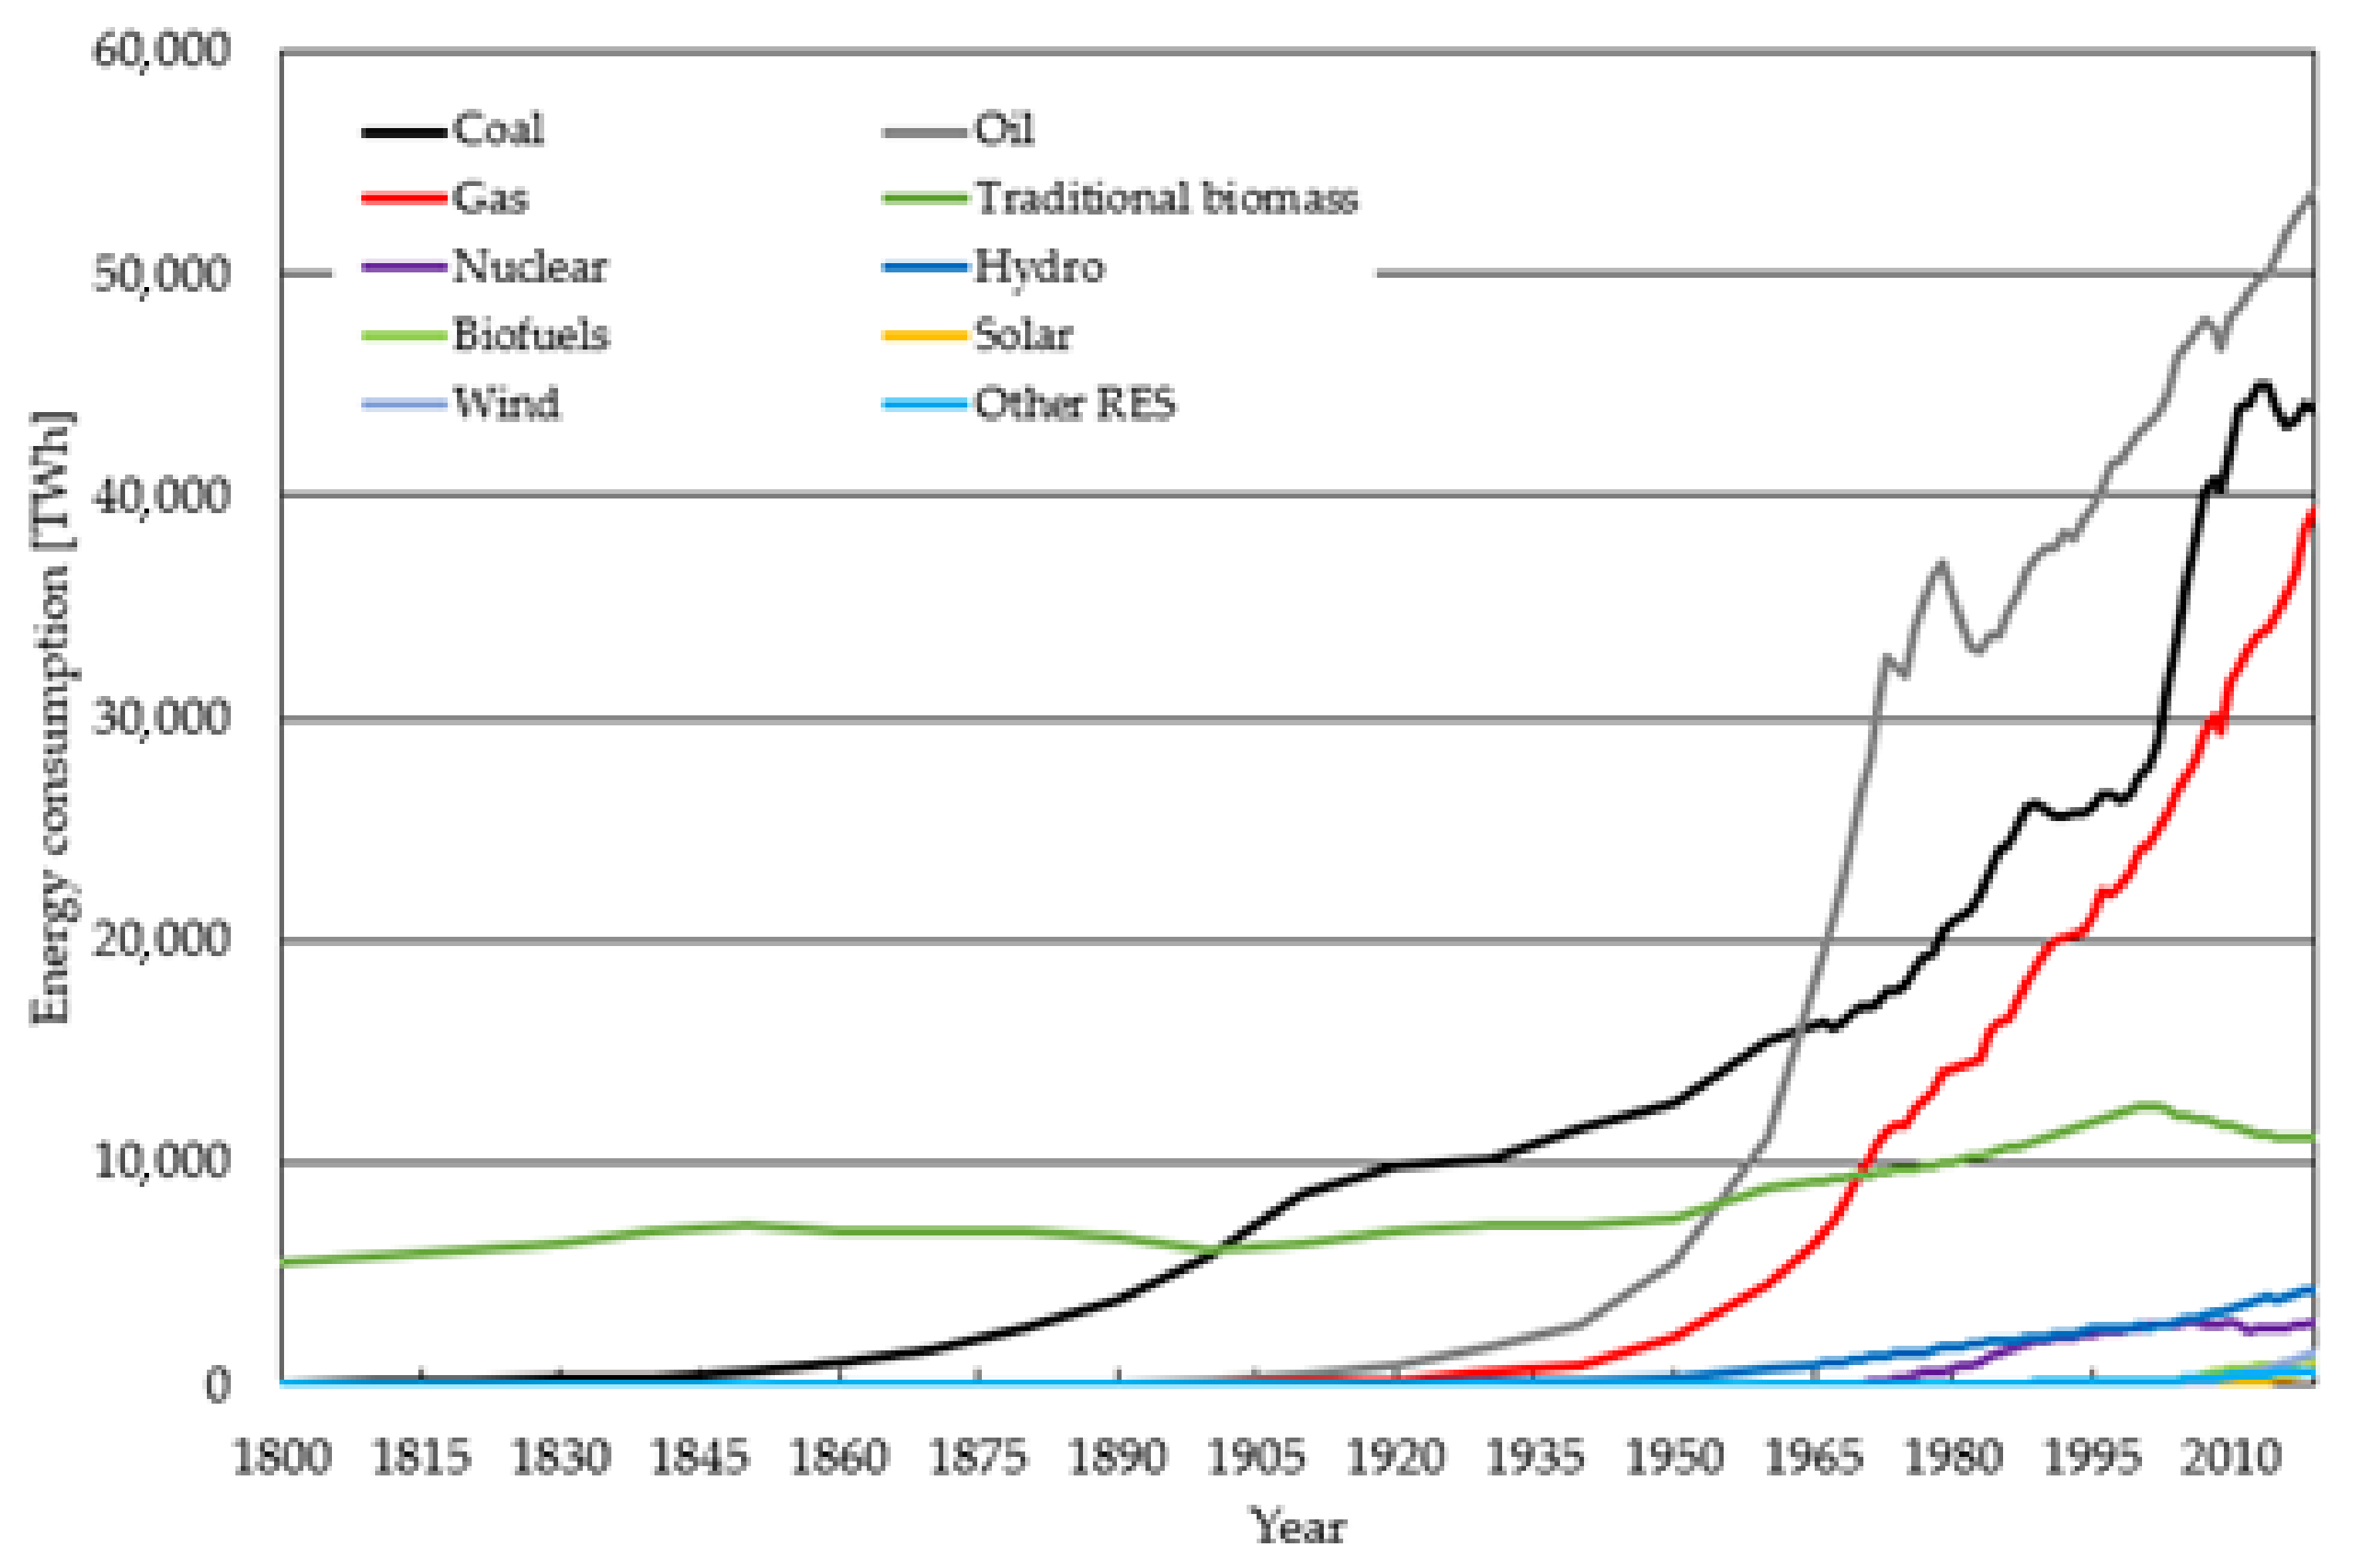
Current global yearly primary energy consumption is just below 160,000 TWh [49], while most of energy requirements is still covered by consumption of fossil fuels (approximately 86%). Despite the positive examples of reducing dependence on fossil fuels using renewable and low-emission sources that can be seen in some geographical locations (or countries) [58,59] or specific sectors [60], it is clear that global energy consumption is mainly addressed by fossil fuels. Figure 3 shows the development of primary energy consumption from 1800 to 2019. Conversion of outputs is based on the BP methodology, considering a 0.359 efficiency of fossil fuel conversion [61].
In the graph, all sources, except for traditional biomass and coal, show the growing character of the development of their consumption. The steepest growth can be seen in the consumption of natural gas, which is caused by several factors. The first is the environmental aspect, where the combustion of natural gas generates less CO2 emissions per unit of energy produced than other fossil fuels [62]. This fact is the driving force in the construction of relatively costly power plants with gas combustion turbines, which replace the coal thermal power plants in a large part of the so-called developed, or Western countries. Gas combustion turbine power plants have a fast start-up [63] (compared to steam turbine power plants) and can provide back-up sources for renewable energy sources (RES), whose prediction of electricity production is in some cases difficult, which can lead to grid instability and endangering the supply of electricity to the final consumer [64,65]. Another factor accelerating global natural gas consumption is the increasing share of LPG and LNG use, especially in freight transport [66,67], where gradual exit from the use of diesel engines producing increased emissions is needed. The last significant factor underpinning the increase in natural gas consumption is the increase in hydrogen use [68]. Hydrogen production is currently carried out mainly in two ways, in the first we can talk about the green hydrogen, which is produced by the electrolysis of water, using electricity produced from renewable sources [69]. The second way is less ecological production of hydrogen by steam reforming of methane. At present, 95% of hydrogen is produced in the second, less environmentally friendly way [70].
The essential non-fossil primary energy source has long been the use of traditional biomass. The term traditional biomass mainly means the use of forest bulk wood. This energy source is typical for the developing countries and forms the basic energy pillar of many people who use wood biomass for food preparation, water disinfection or ensuring thermal comfort in their homes. The course of the development of the consumption of this energy source has an interesting character, which is based on the dramatic increase in the population of the so-called third countries since the Second World War. This population increase was caused by a slight increase in living standards (availability of at least minimal health care, food aid from developed countries, political reforms, improved economic efficiency) and was necessarily covered by an increase in traditional biomass consumption, which in many areas caused significant environmental problems associated with deforestation. The peak around 2000 and the gradual decline is paradoxically also associated with rising living standards, where in many countries (especially Southeast Asia) living standards have risen to such an extent that the use of only traditional biomass is no longer necessary, and the population has access to other more advanced fuels. The short stagnation evident from the recent period is caused not only by a decrease in the rate of population growth but also by a slowdown in the increase in the living standards of the population, which is not a desirable phenomenon.
The overall share of RES in primary energy consumption is at a very small level, but a closer look shows exponential growth and thus it is possible to expect an increase in their role in the future. The exception is the use of hydropower, where the proportion is higher than in case of solar and wind energy, but the potential of large rivers to build large hydropower electricity plants is in many parts of the world very small [71] and no exponential increase in utilization of hydropower can be expected.
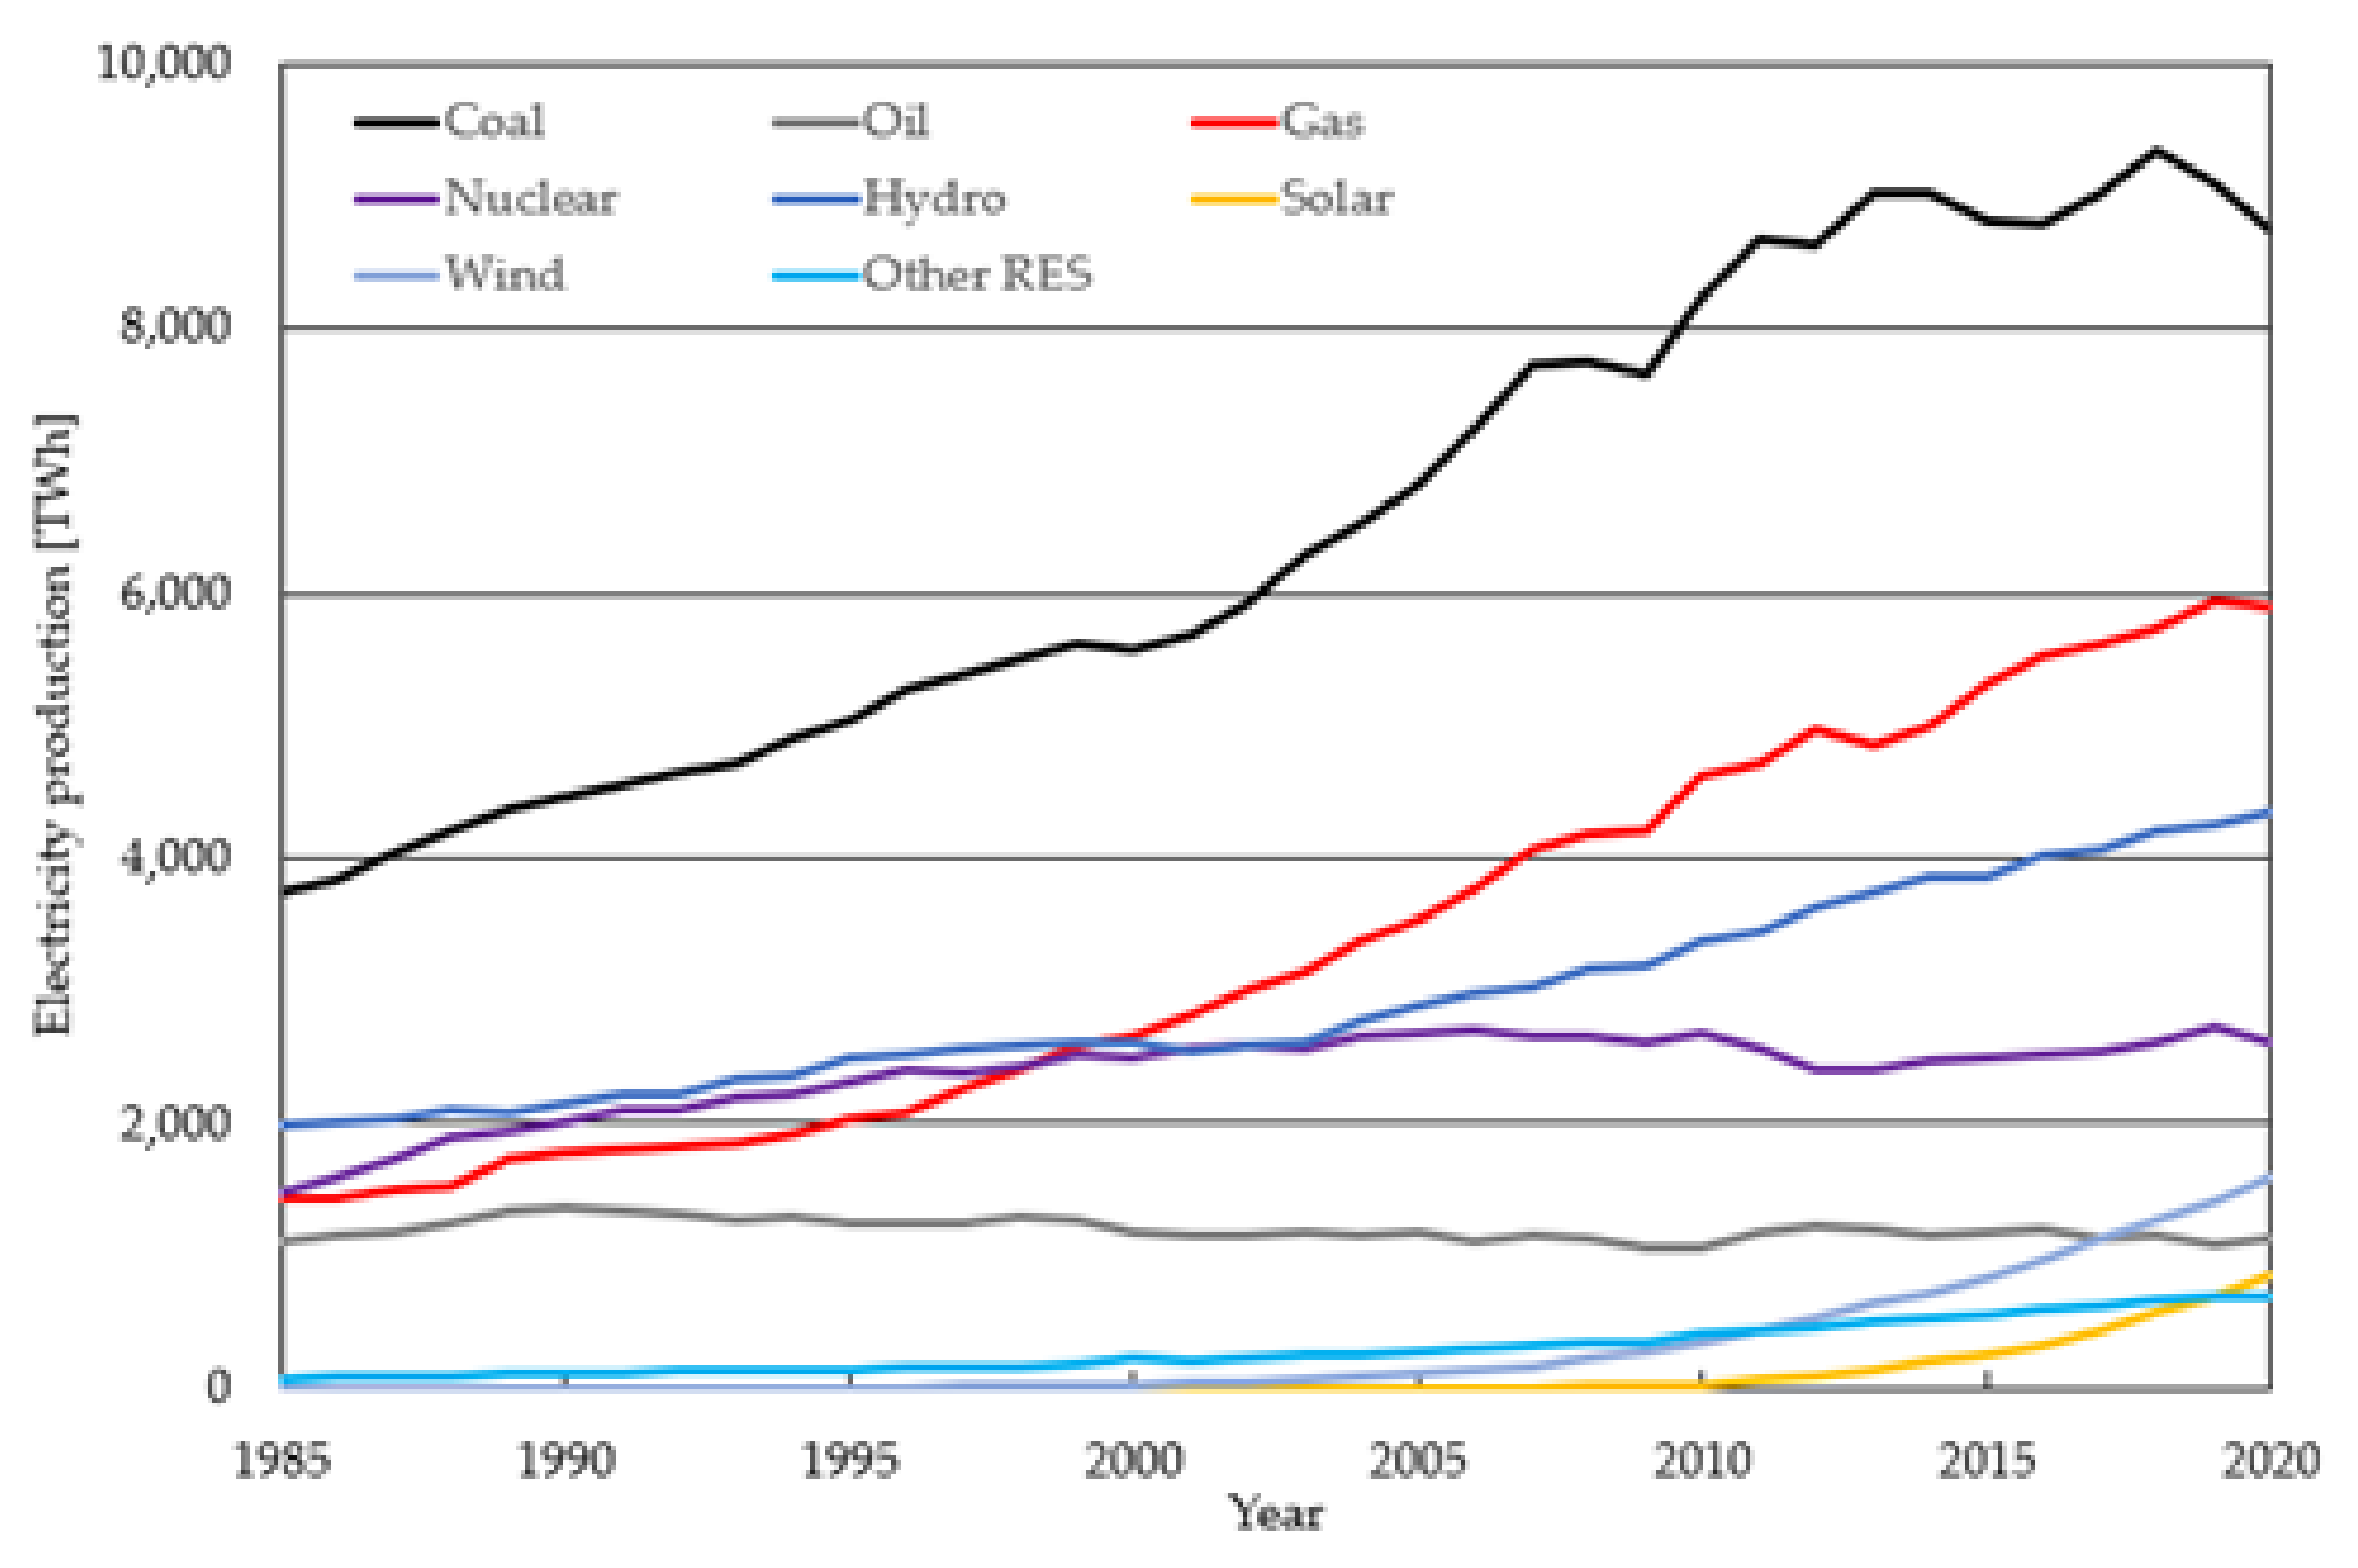
Based on the above facts, it is possible to assume that the future increase in primary energy consumption will be covered mainly by renewable sources, natural gas and nuclear energy. The situation is quite different if we look only at the electricity production depicted in Figure 4. In 2020 almost 26,000 TWh of electricity was generated [49]. In the production of electricity, the situation with the share of fossil fuels does not look so dominant. The use of hydro and nuclear energy has a significant share in the production of electricity, and the solar and wind energy is also gaining in importance, the growth of which is also exponential in this case.
Based on presented statistics and evaluation of the development of key factors in CO2 emissions, primary energy consumption and structure of used energy sources, it is unrealistic to expect a significant reduction in energy consumption on a global scale. At present, there are still several countries that are achieving a population boom. There are also a number of countries (especially in Africa) still waiting for their development opportunity. In these cases, it is impossible to expect that population growth and the desired increase in living standards will not be supported by an increase in the consumption of available and cheap primary energy sources.
One of the ways to mitigate or slow down the effects of climate change is to reduce energy consumption at the local level (this is happening, for example, in Western European countries), or to adjust the energy mix so that most of the consumed energy has a low-carbon origin. In some sectors, such as industry or transport (especially aviation and shipping) it is a difficult and costly problem, but in the production of electricity with use of present technologies and methods it is a solvable problem. Especially in the current efforts “to green” a large number of processes and technologies by their gradual electrification, the electricity generation sector will become increasingly important. The possibilities of adjusting the energy mix with regard to reducing CO2 emissions are illustrated in the example of the Slovak Republic, which is compared within neighboring countries grouped in the so-called Visegrad Four (Slovakia, Czechia, Poland, Hungary) and extended by the close neighboring country of Austria, which often forms a comprehensive group with the Visegrad Four countries on an international scale.
3. General View of Slovak Republic Energy Mix and Emissions
The Slovak Republic was established in 1993 by the split of Czechoslovakia, which created two independent countries, the Slovak Republic, and the Czech Republic. Since 2000 Slovakia has been a member of the Organization for Economic Cooperation and Development (OECD), since 2004 a member of the European Union, and since 2007 a member of the International Energy Agency (IEA). The Slovak Republic is a country in a temperate climate zone with a predominantly mountainous relief, which fundamentally determines the hydrological conditions. Approximately 5.5 million inhabitants live in Slovakia, almost half of whom live in urban settlements. The Slovak Republic is an industrial-agricultural state with a market economy. The basic building blocks of industry are the production of electrical components, the automotive and metallurgical industries. Gross domestic product per capita is USD 34 815 [72].
The industrial use of energy resources occurred with the development of mining and metal processing in the 12th, respectively, 13th century. Another significant milestone was the post-war transformation of the country based on the planned economy, when it was necessary to ensure sufficient electricity and fuels for the growing heavy industry. Electrification in the territory of the Slovak Republic (then still in the territory of Austria-Hungary) began in 1884 in Bratislava and ended in 1960 (already as part of the Czechoslovak Socialist Republic), when the last village was connected to the electricity grid system.
3.1. Historical Development and Current Situation in Energy Sector
The current energy policy is ruled by a government document approved in 2014, which sets out the goals and priorities of the energy sector by 2035 and by 2050. The strategic goal is to achieve competitive low-carbon energy ensuring a secure, reliable, and efficient supply of all forms of energy at affordable prices, taking into account consumer protection and sustainable development. The updated Integrated National Energy and Climate Plan for 2021–2030 takes into account more realistic targets as well as the incorporation of comments and climate commitments towards the European Union. This document will be approved in II.Q of 2021.
The main goal across the European Union is to reduce greenhouse gas emissions by 40% (compared to 1990) by 2030, another goal is to achieve a share of RES in total primary energy consumption of 32%, but each member state must reach the share of RES in transport at least 14% [73]. The Slovak Republic has set indicators for reducing emissions by 20% and the share of RES in final consumption at 20%. In the electricity generation sector, the target for RES is then set at 27.3% by a subsequent conversion, taking into account technical possibilities and real potential [73]. At present, the share of RES in primary energy consumption is 19.7%, and in transport 8.9%.
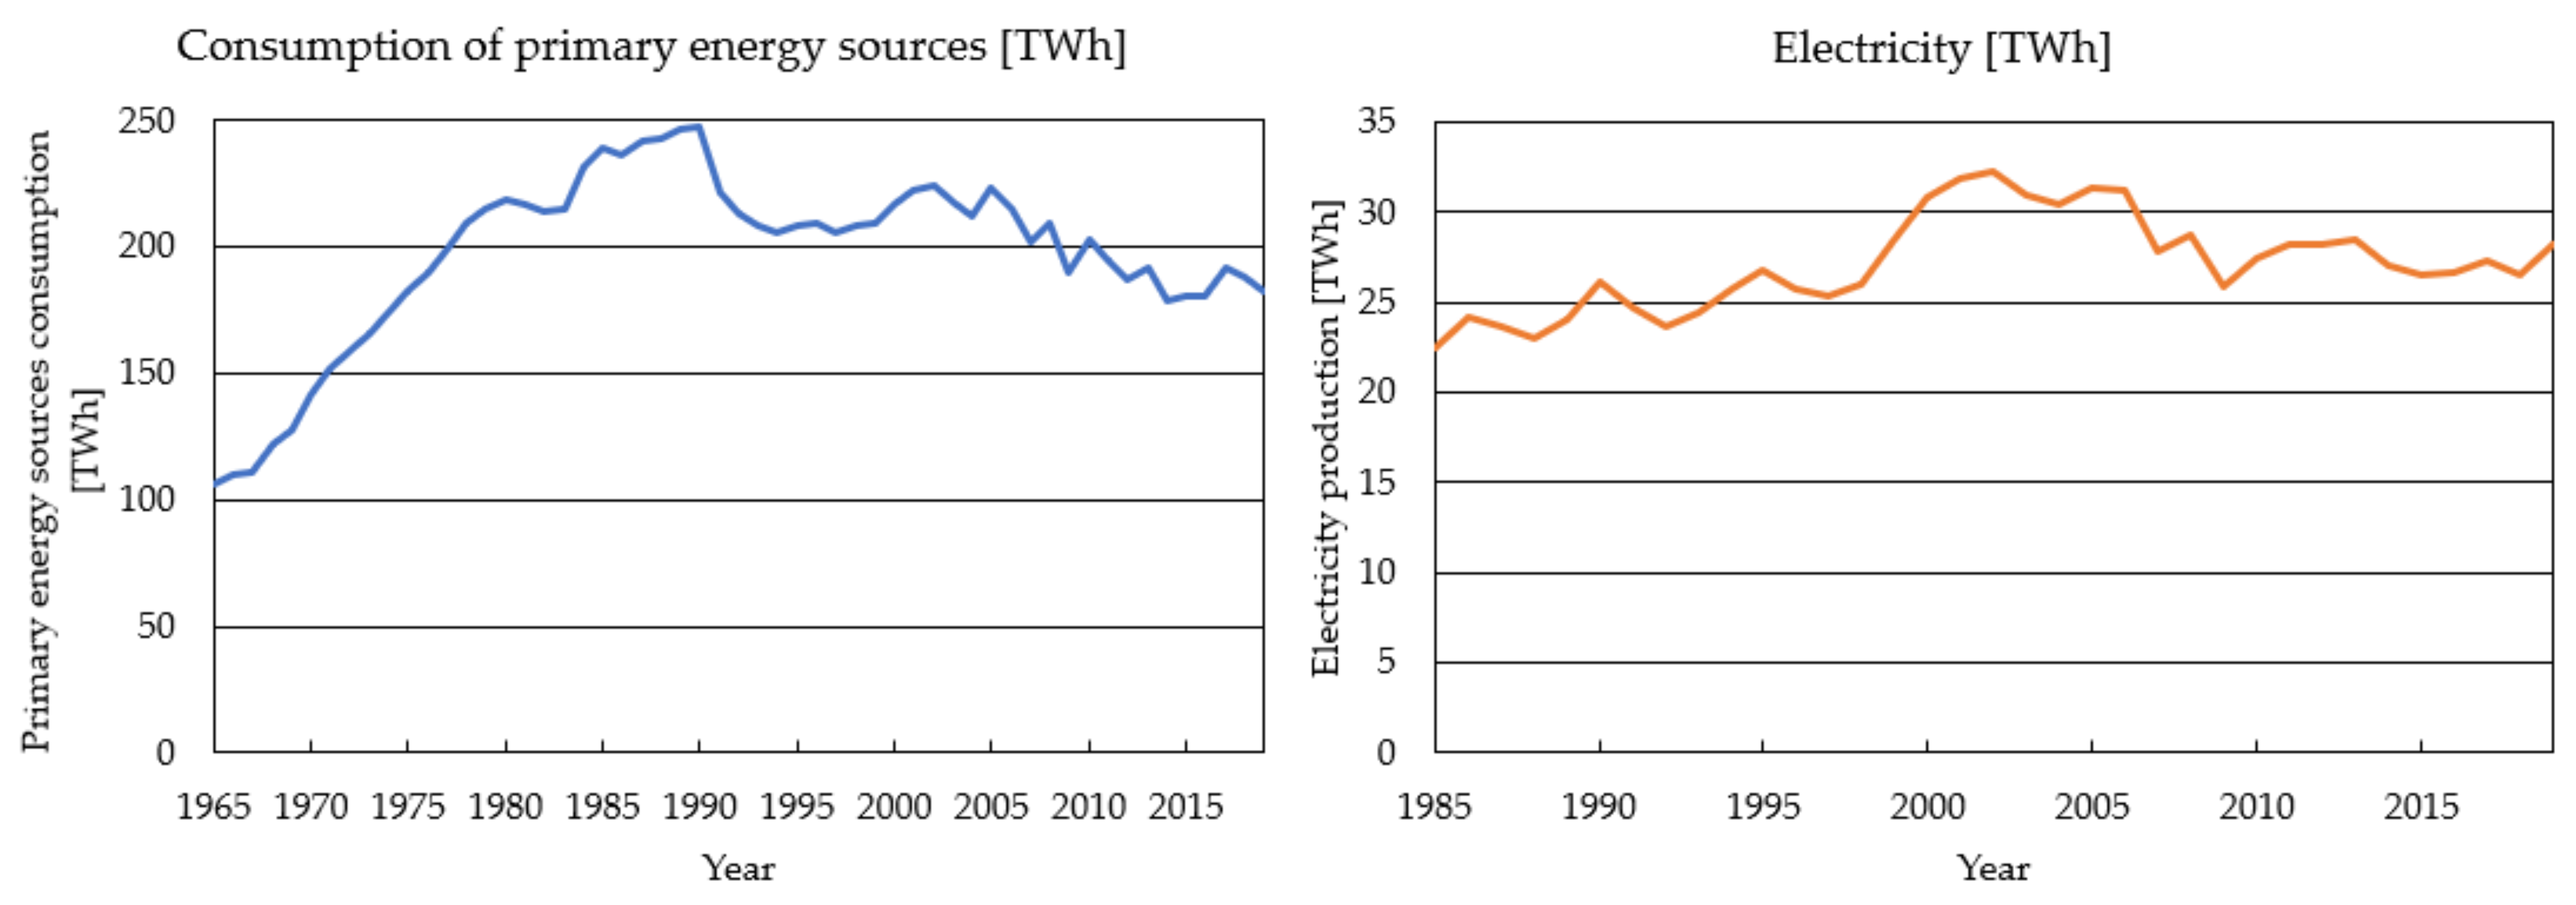
Primary energy consumption in 2020 was 183 TWh [49] and electricity 28.61 TWh [74], Figure 5 shows the historical development of these fundamental energy characteristics beginning in 1965 and 1985, respectively. It should be noted that the data before 1993 refer to the territory of the Slovak Republic, then included in Czechoslovakia.
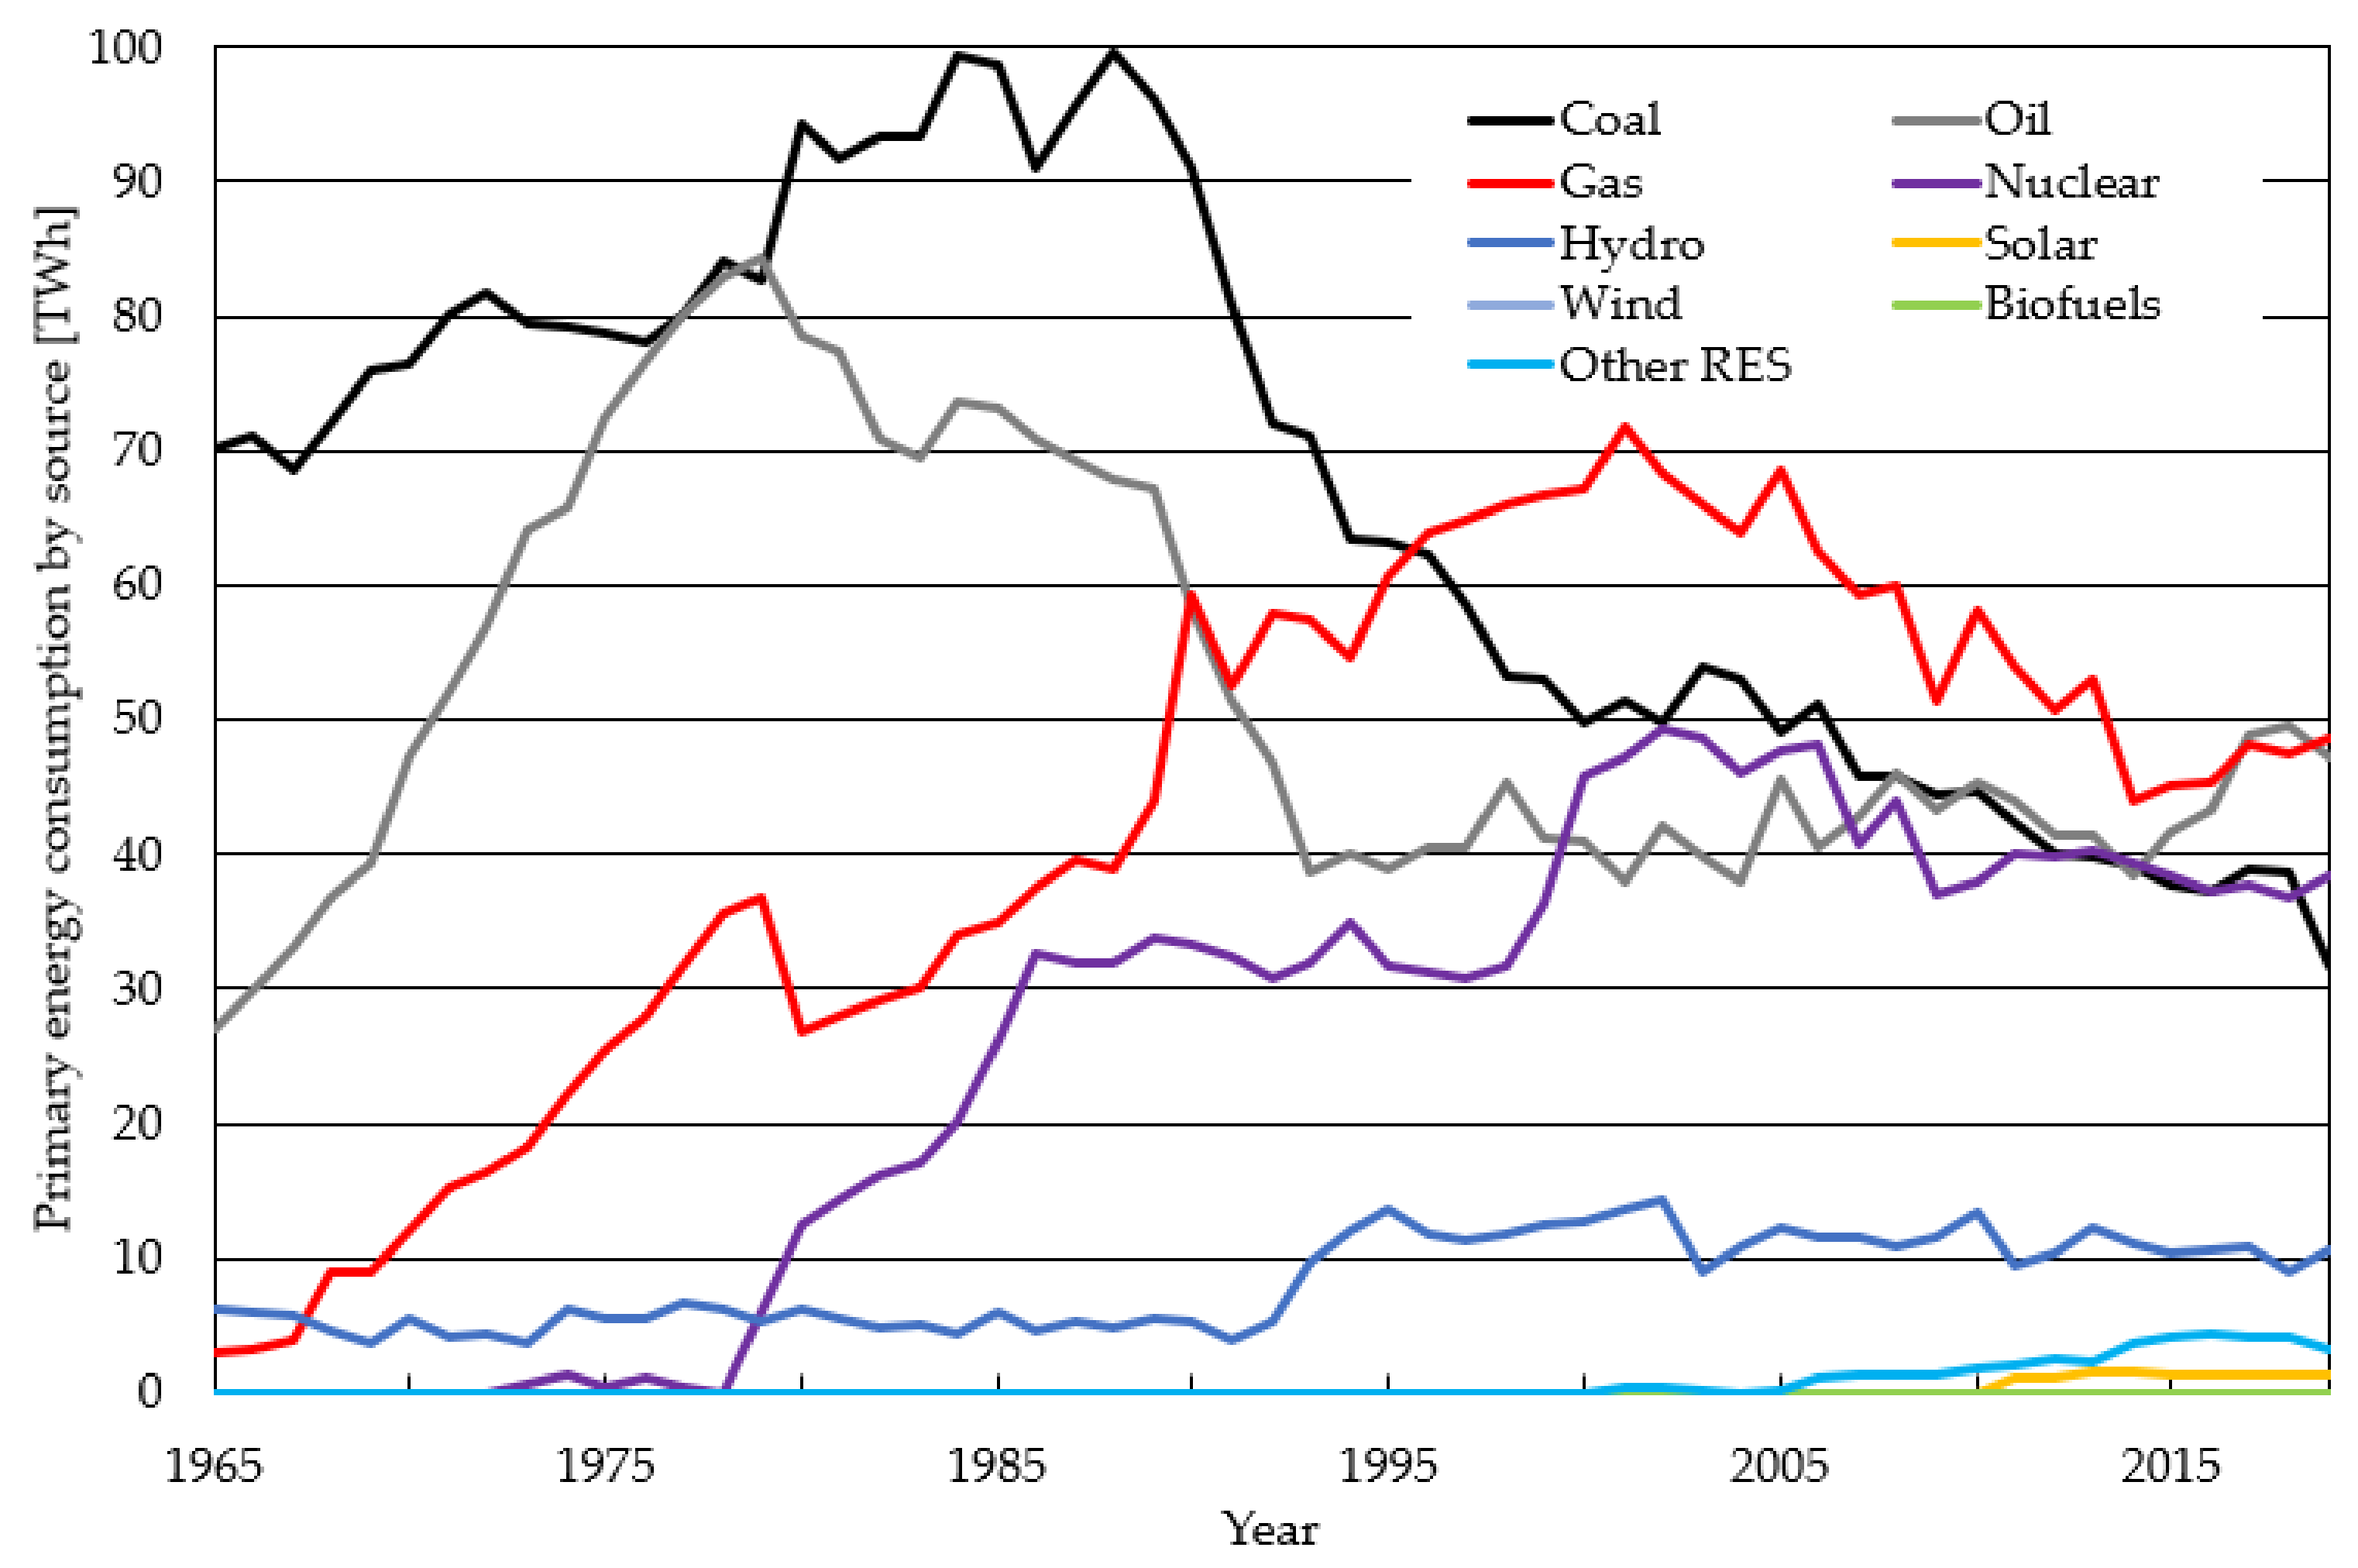
The graph of primary energy consumption has shown a sharp increase since the beginning of the period under review, which culminated around 1990, when a revolutionary wave took place in the country, changing the political establishment from communism to democratic establishment. The change also included the transition from a planned economy to a market-driven economy. This change was negative for many sectors of the economy, but especially for heavy and military industry [75]. Another factor was the rise of the environmental movement and the adoption of laws to increase environmental protection. In the following years of rebirth and independence, we can talk about stagnation in terms of energy consumption. A significant increase, which is also visible in the graph of electricity production, occurred in the years around the 2000, when the country entered a period of economic growth thanks to the right-wing pro-reform government [76]. In this period (1998/1999), two reactor blocks of the Mochovce nuclear power plant were also launched, which contributed to energy stability at the time. Another more turbulent period characterized by a drop in consumption or electricity production is associated with the economic crisis at the turn of 2008/2009. The current development is more or less stable with only small fluctuations in both directions. The structure of energy consumed as well as its long-term development are presented in Figure 6.
From the point of view of long-term development and efforts towards decarbonization, the massive drop in coal consumption is a positive factor. For other fossil fuels, i.e., natural gas and oil, their consumption has stabilized with only small fluctuations after slight declining periods. An important role is represented by the use of nuclear energy, in which we can identify four significant milestones, which are clearly visible in the graphical representation of development. The first is the launching of the first two reactors of the Jaslovské Bohunice nuclear power plant in 1978 and 1980, the second is the commissioning of third and fourth reactors in 1984 and 1985. Other nuclear reactors were launched in the territory of independent Slovakia in 1998 and 1999 at the Mochovce nuclear power plant. So far, the last milestone is the shutdown of the first two reactors of the Jaslovské Bohunice nuclear power plant, which ended its operation in 2006 and 2008, respectively. From the point of view of hydropower, the most significant event is the building and launching of the Gabčíkovo hydroelectric power plant in 1992.
Other renewables contribute to the total primary energy consumption to a small extent, with a significant percentage in this group representing the use of solar energy and biomass in the form of biofuels but also traditional wood biomass.
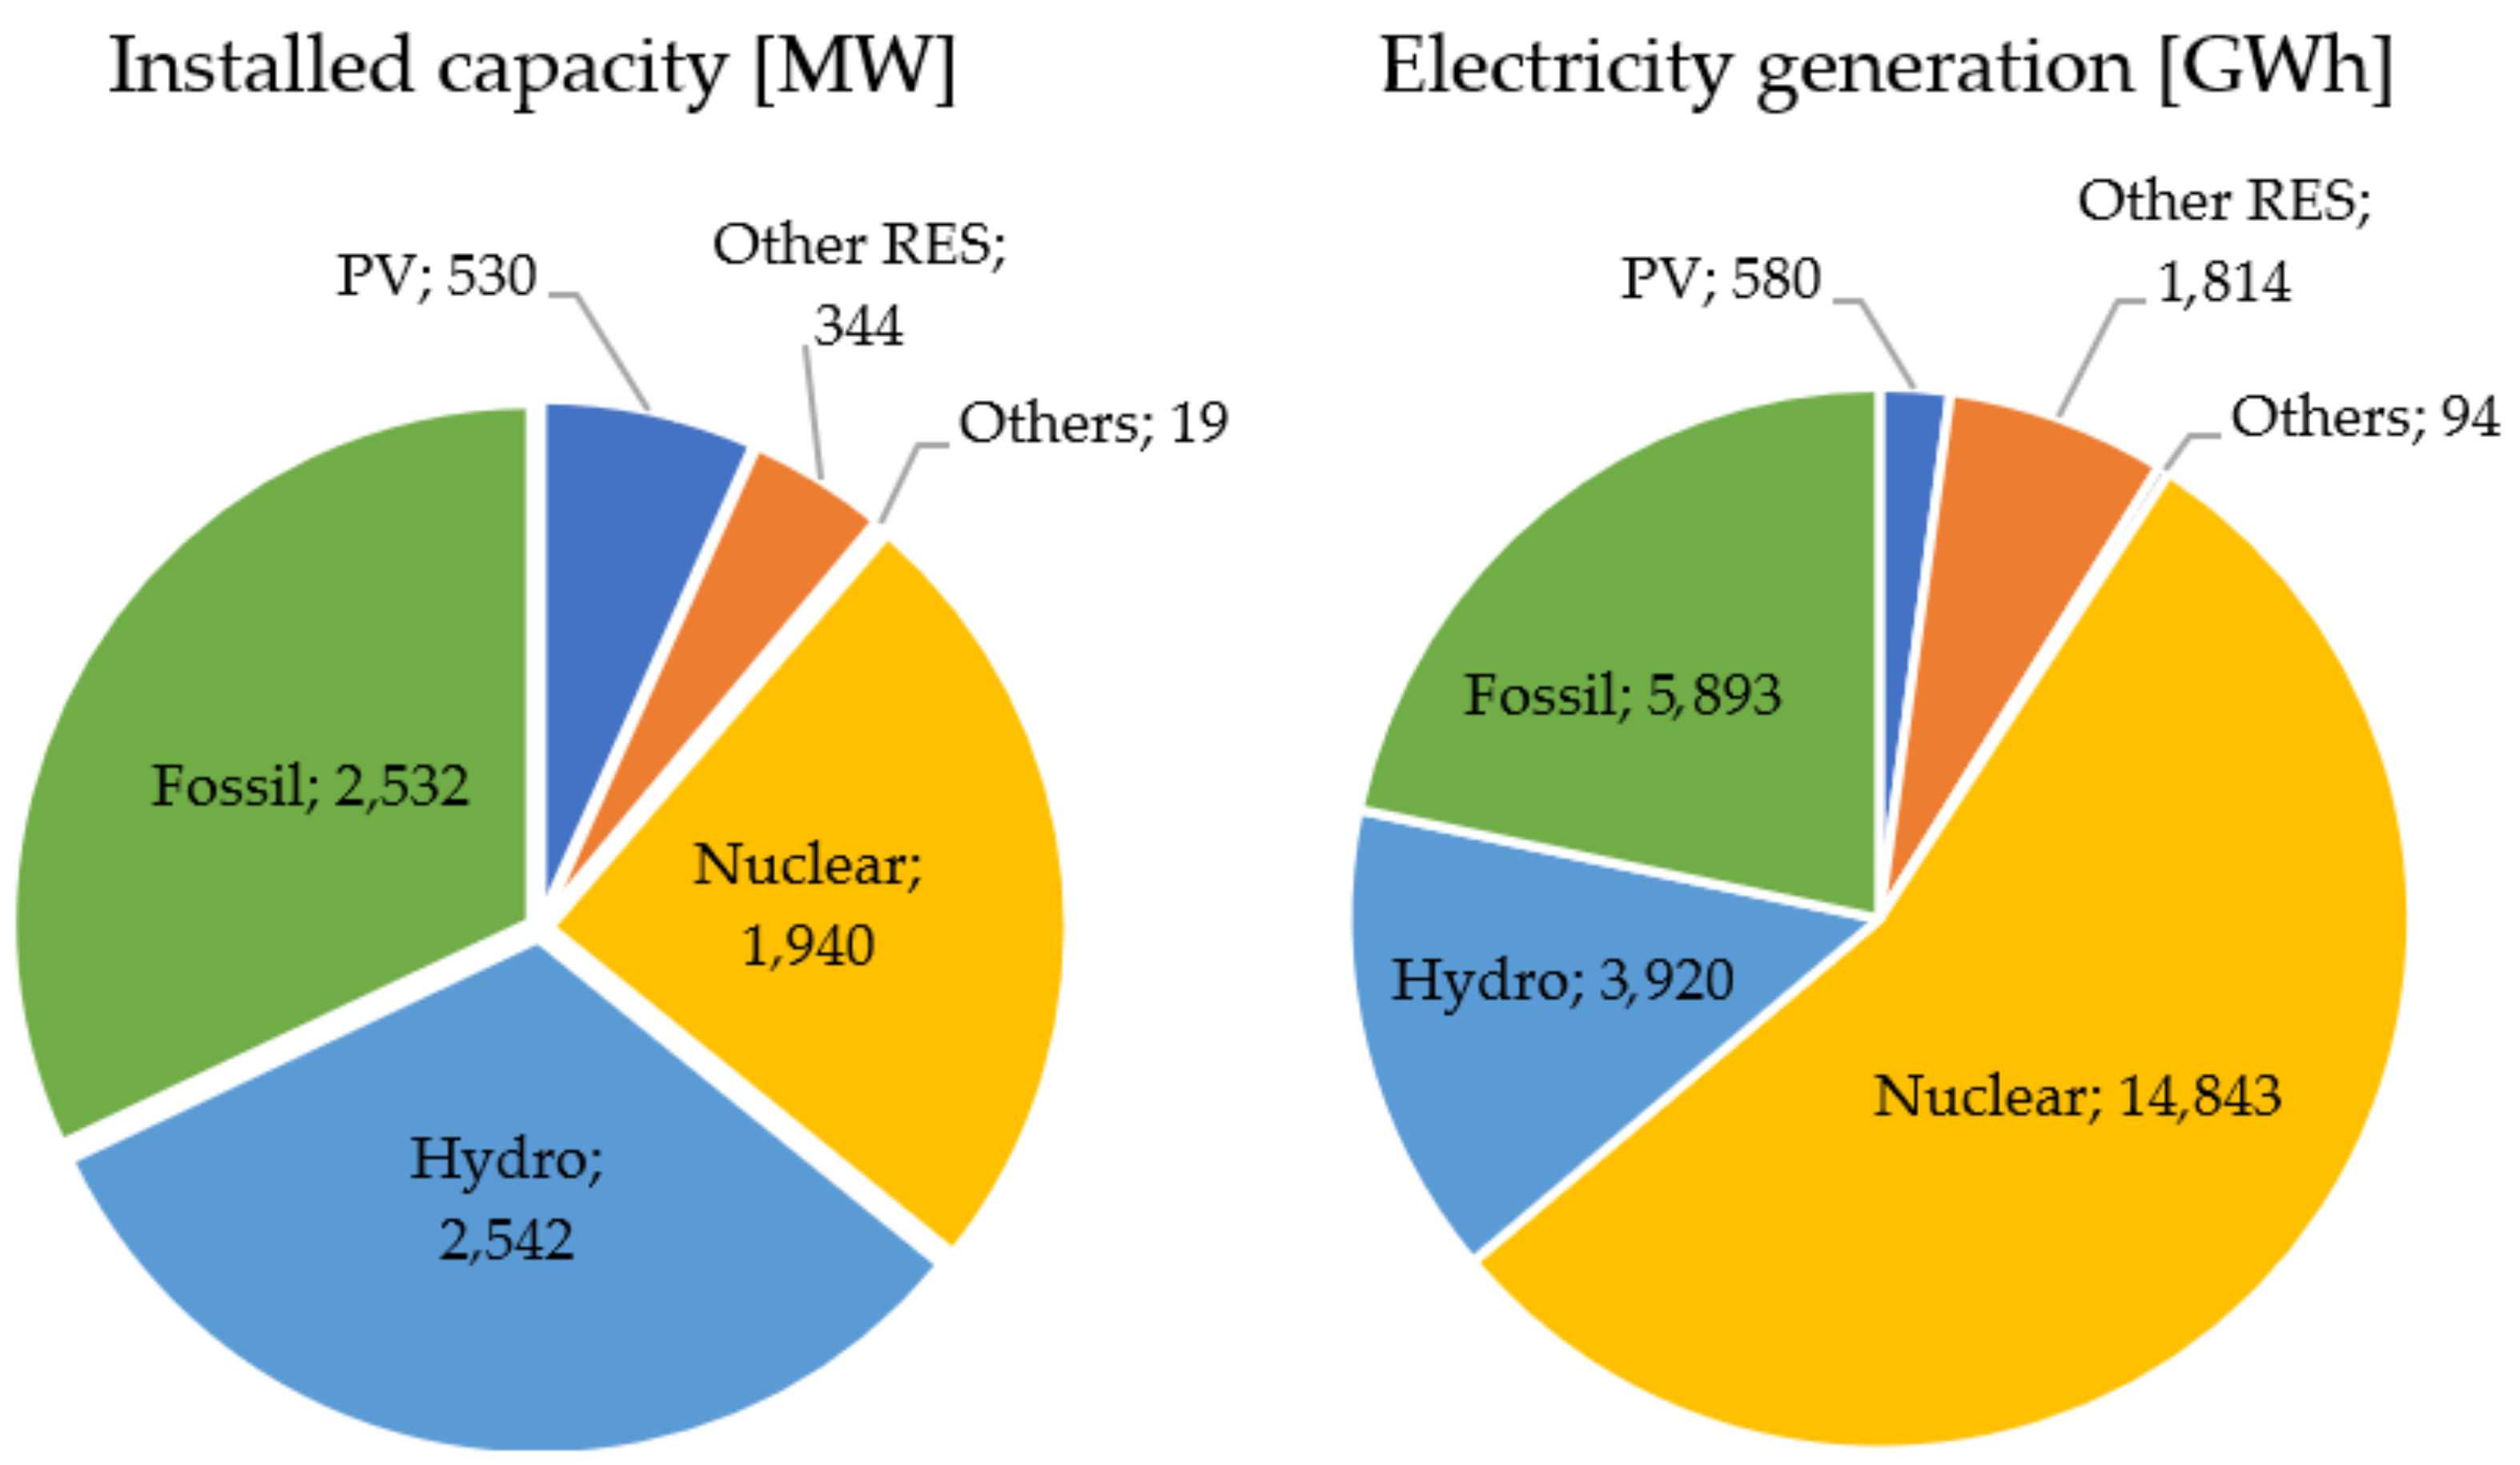
The installed capacity of the power system is around 7.7 GW, while the average load of the power system is at the level of 3.5 GW and a maximum of 4.5 GW [74]. From the point of view of the stability of the electricity distribution system, the most important power plants are listed in Table 1. The structure of installed capacity and electricity generation is shown in Figure 7.
The Slovak Republic does not have significant reserves of fossil fuels and more than 90% are imports, especially from the countries of the former Soviet Union. The transport of coal is carried out by a broad-gauge railway connected to the railway network of the countries of the former Soviet Union. Oil and gas are transported via Druzhba oil pipeline and the Bratstvo (Brotherhood) gas pipeline which passes through the Slovak Republic [77]. The territory of the Slovak Republic is also connected by pipelines with the Adria oil pipeline and gas pipelines of the surrounding countries (especially the connection to Hungary and Austria). As part of increasing energy security, natural gas storage facilities were built in natural rock structures with a total capacity of 35.6 TWh (calculated using the energy density of natural gas).
3.2. Greenhouse Gas Emissions
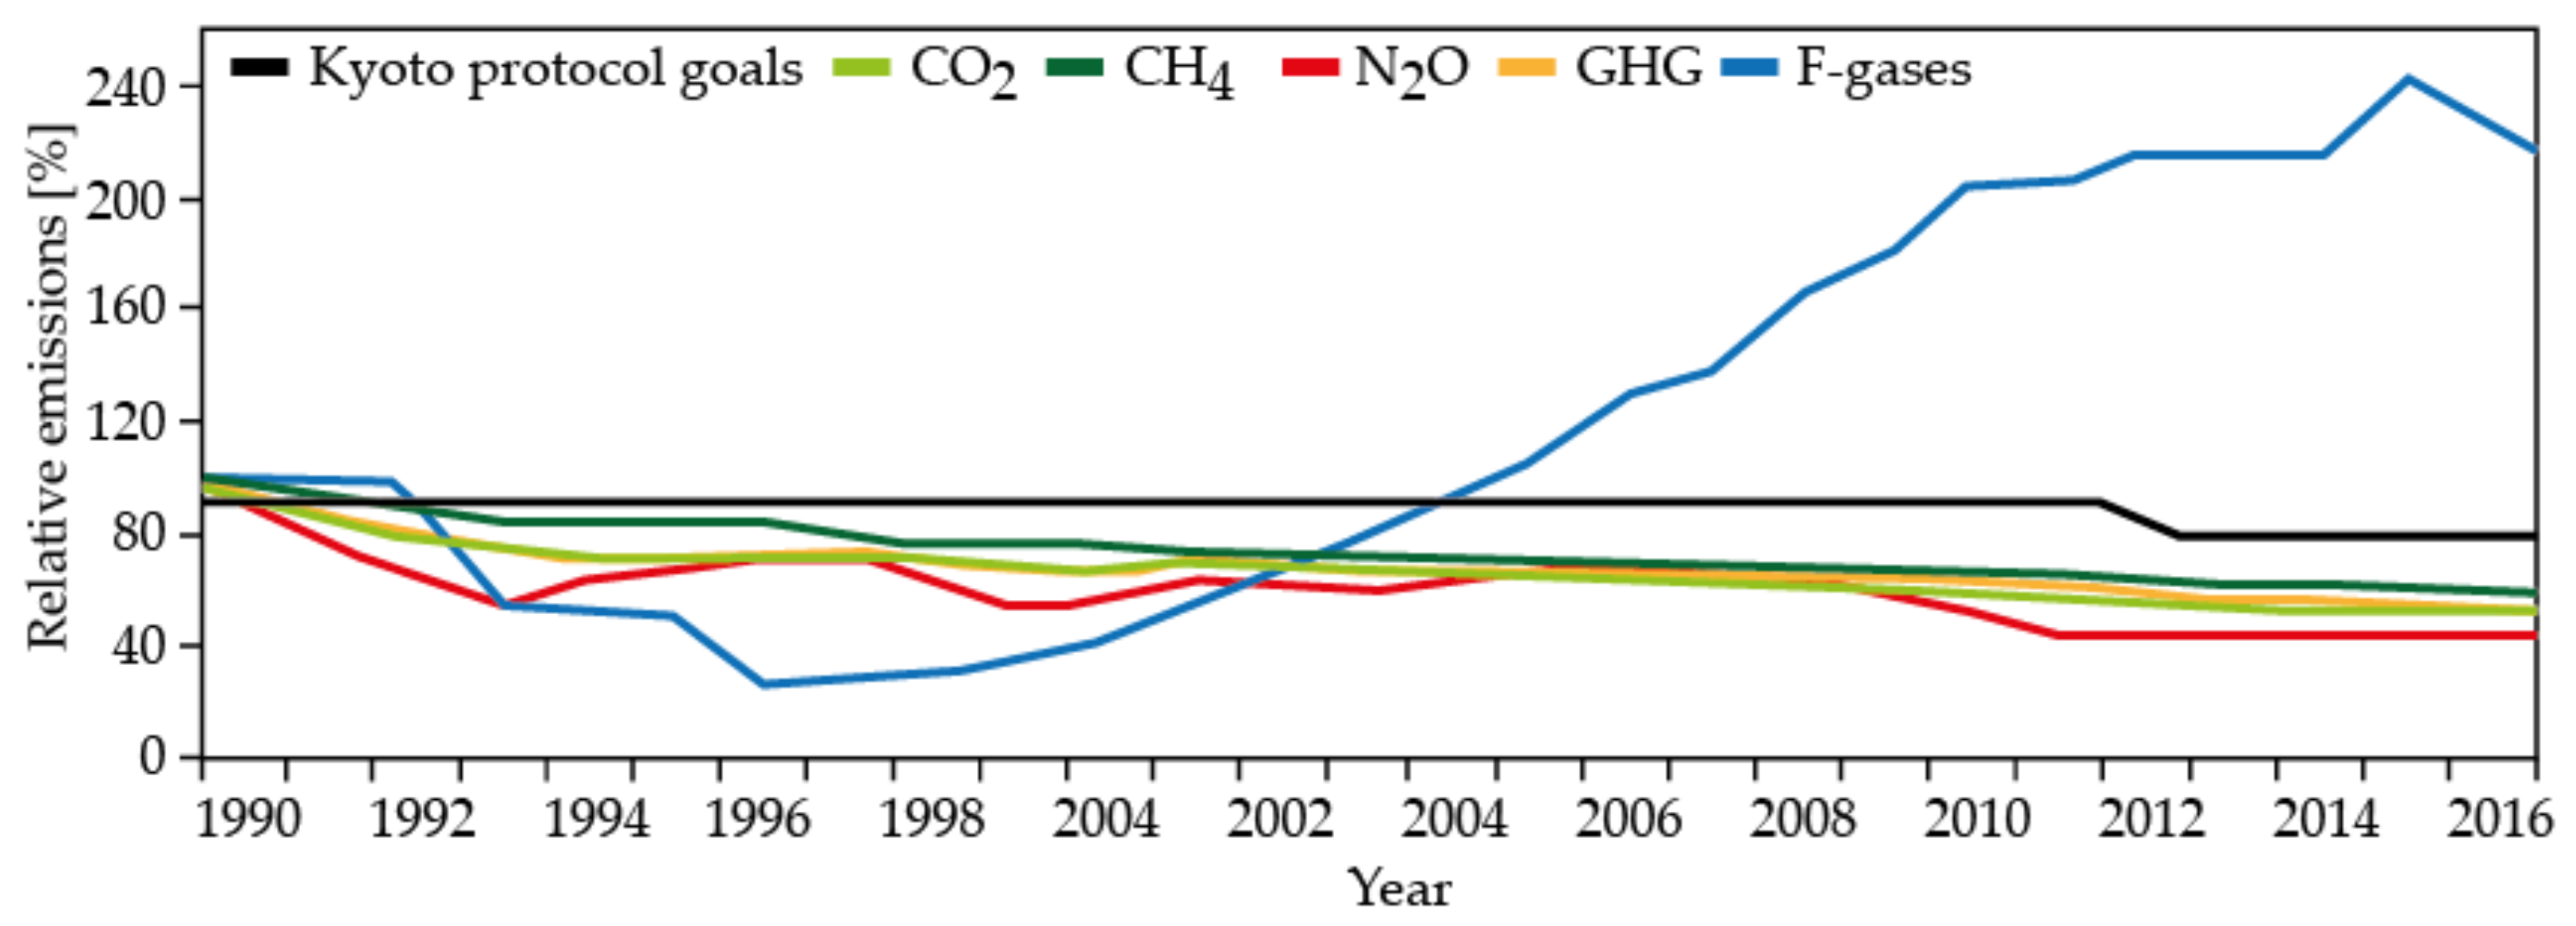
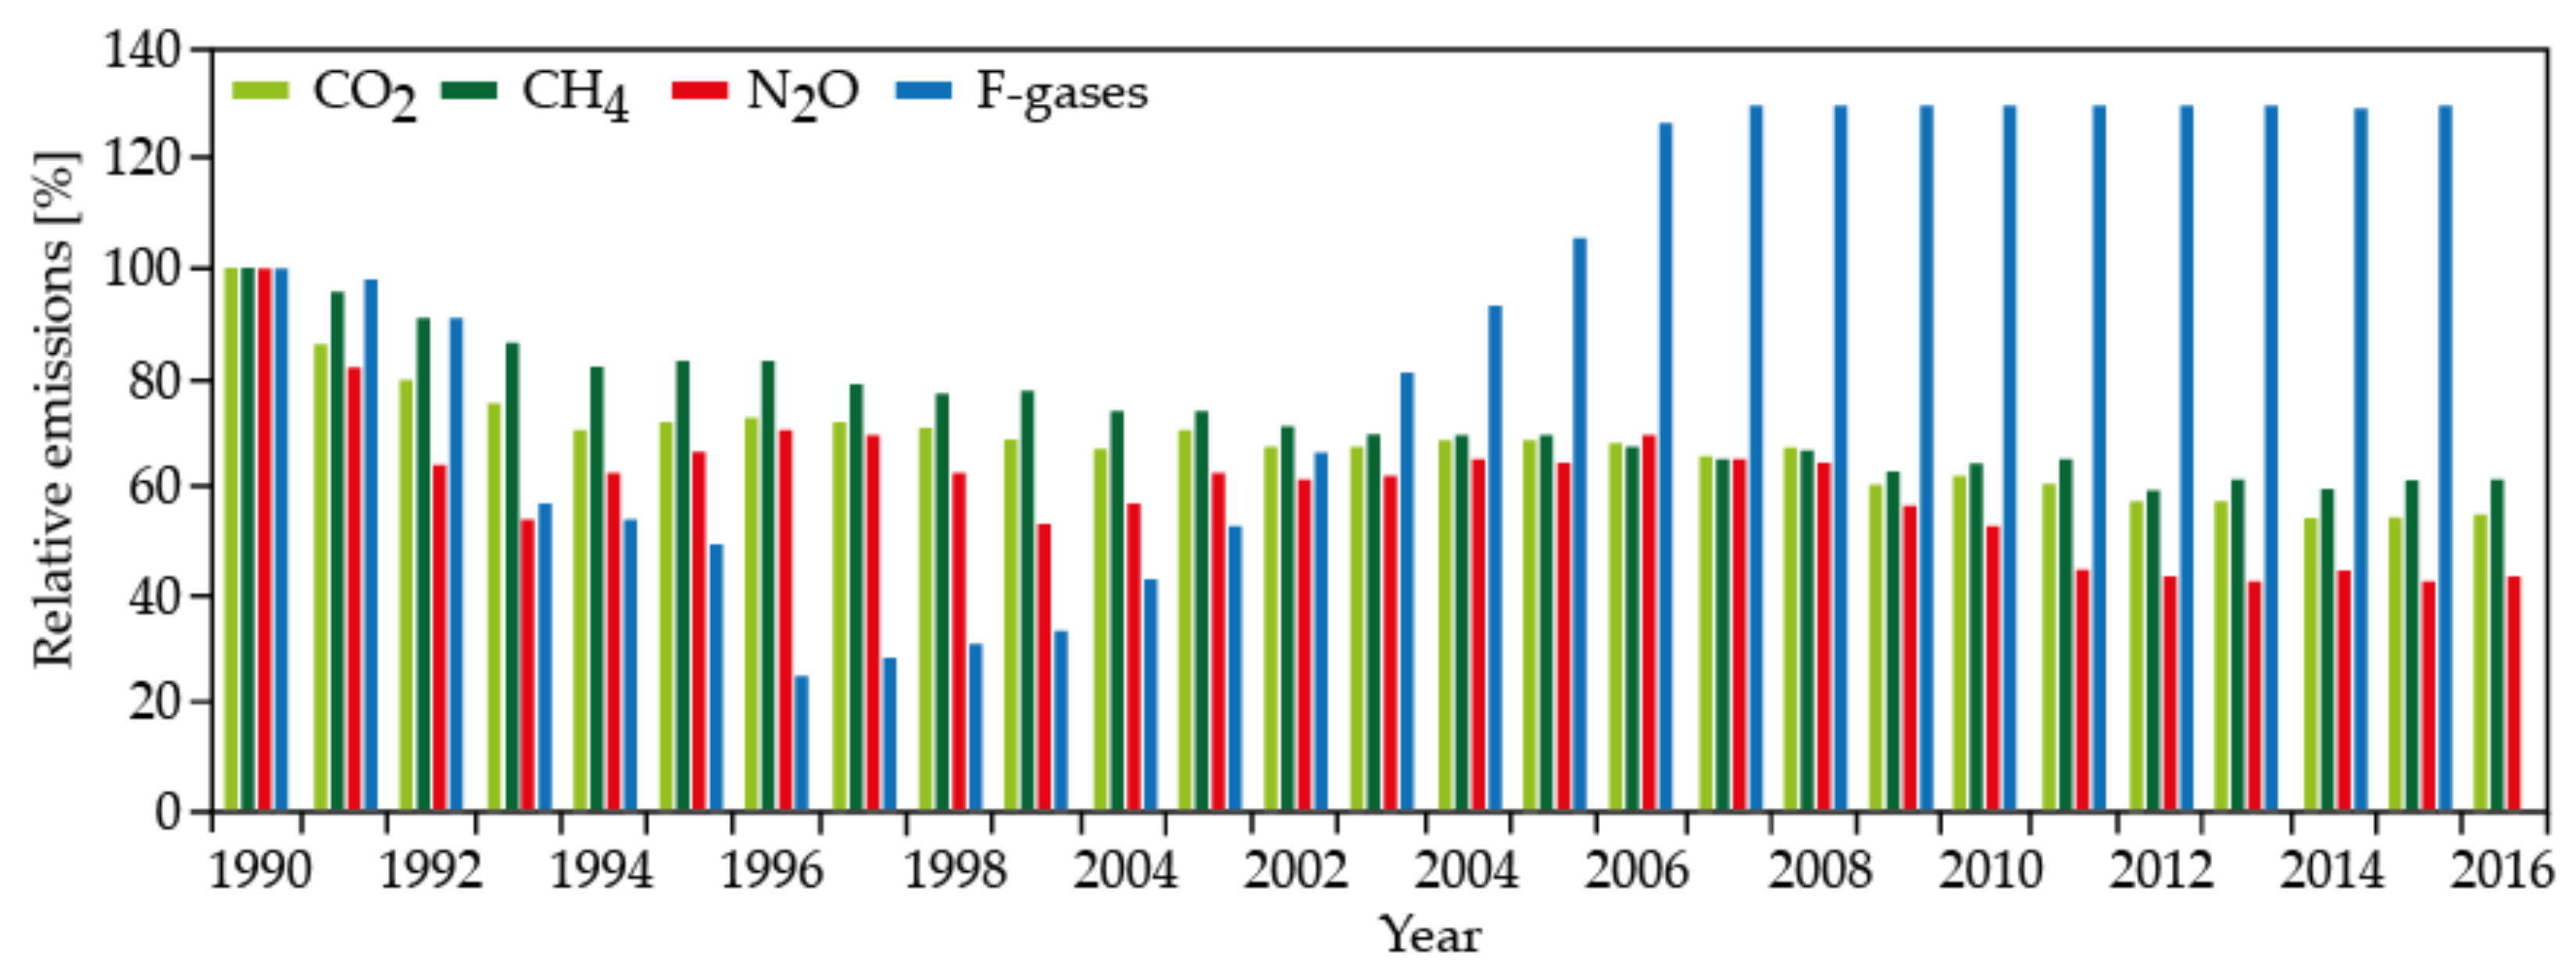
The latest actualized national greenhouse gas inventory in 2016 shows total greenhouse gas emissions of 41,037 Gg CO2 eq. [73]. This represents a decrease of 44.5% compared to the 1990 reference year, which is the basic benchmark for European Union strategies. In total, between 1991 and 2015, emissions did not exceed the level of 1990 for a single year, with exception of F-gases (fluorinated gases: HFC, PFC, SF6). A graph expressing trends in greenhouse gas emissions (in relative terms) is shown in Figure 8.
The reduction in emissions by 2005 was mainly due to industrial and technological restructuring linked to the transition from coal and oil to natural gas. The driving force behind this reduction was adoption of new environmental laws. After 2005, the amount of greenhouse gas emissions has been declining mainly due to the restructuring of the economy and the transition to less energy-intensive industrial sectors. The sector in which there is an annual increase in the amount of greenhouse gases emissions is transportation. Anthropogenic sources of carbon dioxide emissions in 2016 were at the level of 33,996 Gg CO2 (which is a decrease of 45.2% compared to 1990). Other components of the greenhouse gases such as methane decreased by 39.1% and N2O by 56% compared to 1990 [73].
Total anthropogenic emissions of the F-gases showed a significant increase during the considered period. The trends of individual emissions according to the 1990 level are shown in Figure 9.
The most important sector responsible for total greenhouse gas emissions is energy, including transport, with 67%, while transport is responsible for 16% of total emissions. Another significant source of emissions is the industrial processes and product use sector, which accounts for 23% of total greenhouse gas emissions. In this sector, emissions are produced mainly from the technological process of mineral processing, chemical production and the production of steel and iron. Agriculture accounts for 6% and waste treatment for 4% [73].
In terms of carbon dioxide emissions, a key sector is road transport using diesel engines, which is responsible for 24% of total CO2 emissions, followed by fuel combustion (17%) and iron production (16%). More than an absolute expression of the number of emissions, it is more interesting to look at the changes in the trend compared to 1990, where road transport shows an increase of 30%, fuel combustion a decrease of 35% and iron production by 50% [73].
3.3. Projections of Future Development of Key Energy and Ecology Indicators
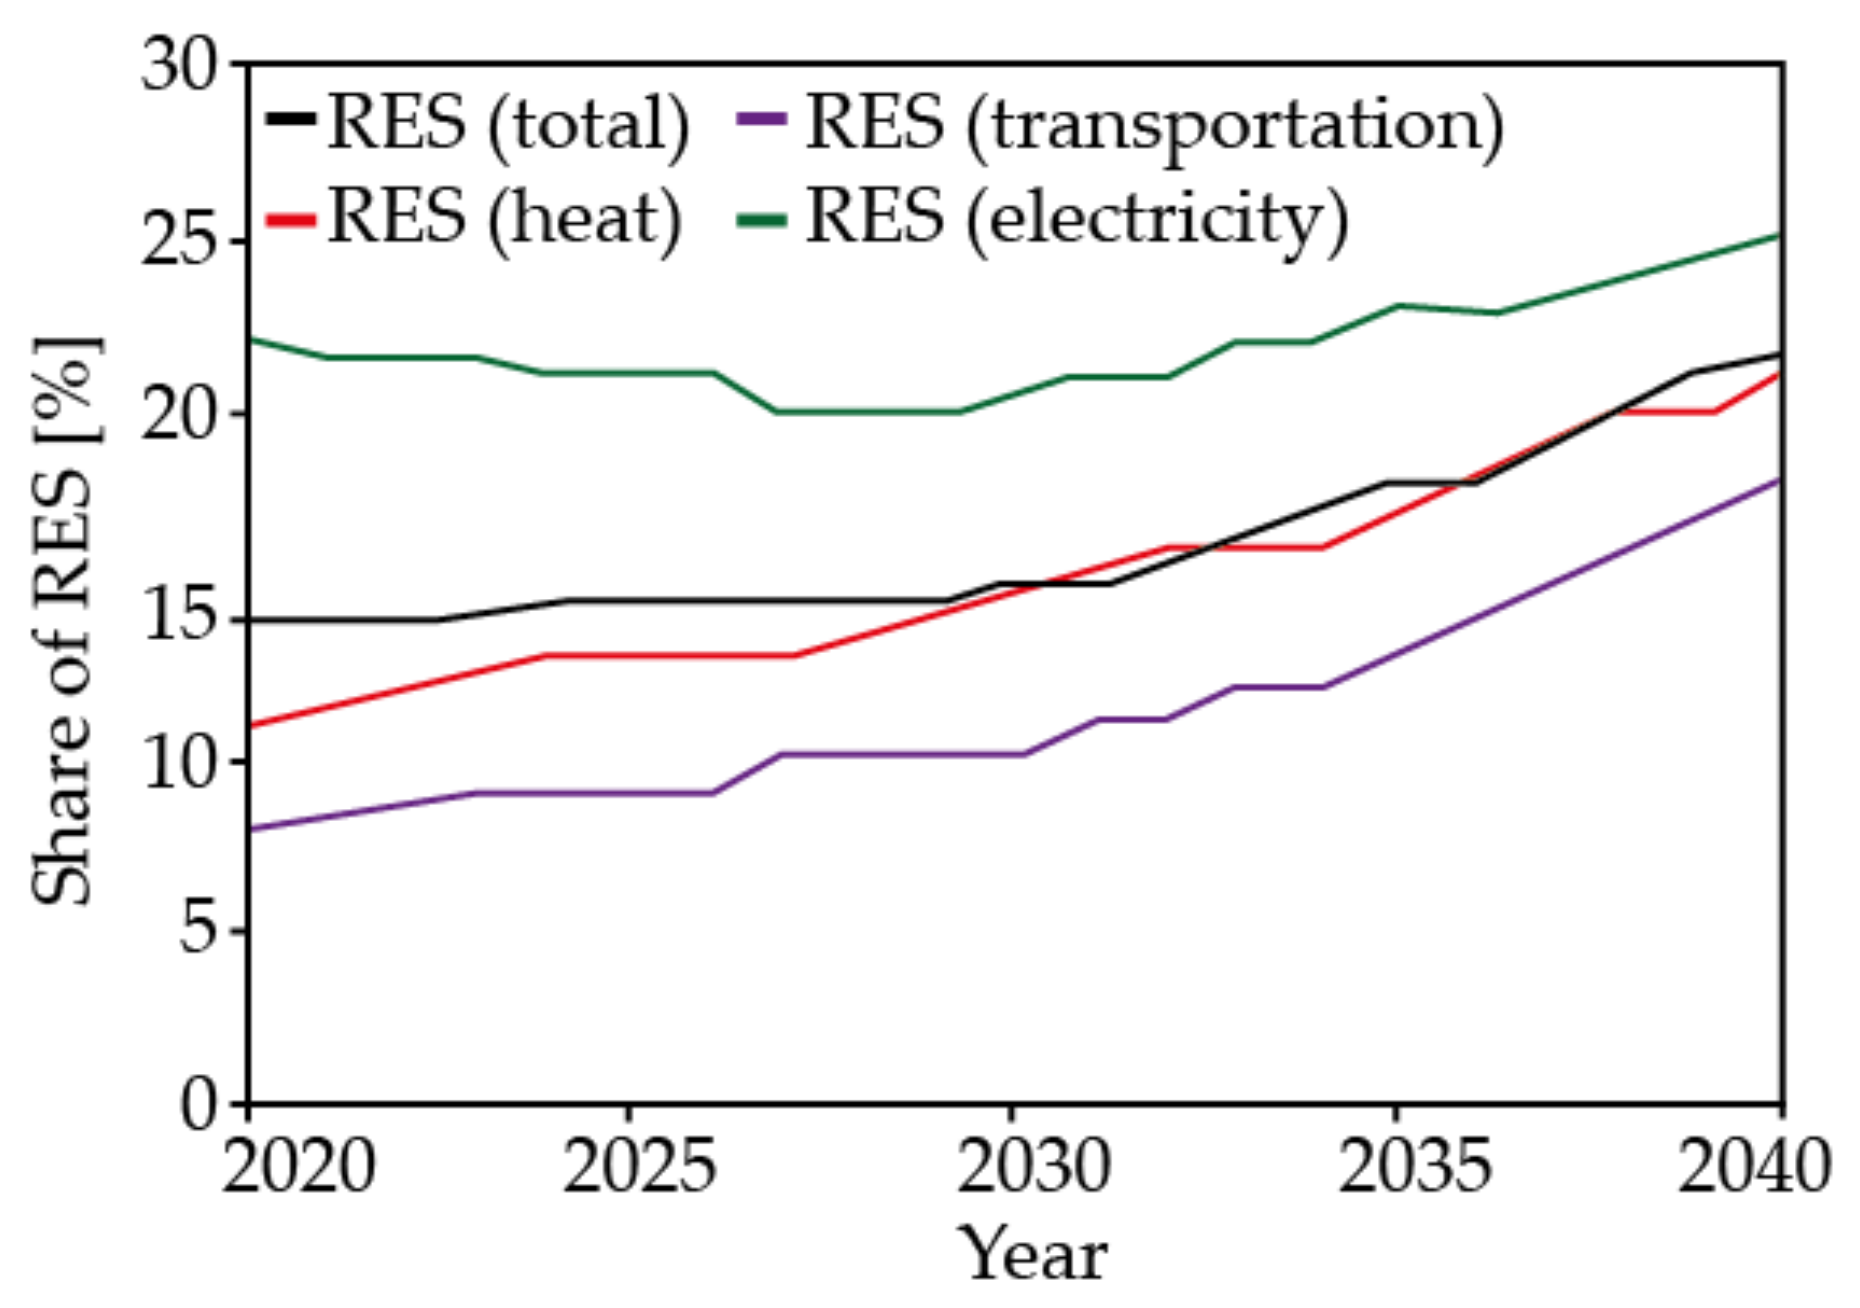
The future development of the energy mix of the Slovak Republic will depend mainly on the effort to comply with the established ecological goals of the EU and the effort to ensure cheap, ecological, and stable electricity for industry and the population. A significant shaping factor will also be the reduction of emissions in the transport sector, where high legislative support for electromobility can be expected, which may endanger the stability of the electricity system. The future threat to the stability of the electricity system is based on both an increase in consumption points with high power-outputs levels but also an increasing share of renewable sources in the energy mix, which are characterized by fluctuations in production. The long-term forecast of the development of the use of renewable energy sources assumes that the share of RES in total energy consumption in 2040 will be at the level of 22%, and the share in electricity production at the level of 25%. The forecast for the development of this key area is shown in Figure 10.
The most fundamental change in the energy mix, which will define the energy sector of the Slovak Republic for several decades, is the expected launch of the third and fourth reactors of the Mochovce nuclear power plant with an installed capacity of 2 × 470 MW. The start of commercial operation of the third reactor is expected in IV. Q 2021, the fourth reactor should be launched in 2023 according to the current pace of work. After the completion of these energy sources, Slovakia will become an export country, from the point of view of electricity production. In 2030, the installed capacity is expected to increase to 8720 MW, of which RES will contribute to 4630 MW. The energy concept assumes an increase in the load on the electricity system up to 5250 MW [73].
The future concept does not envisage the use of the Nováky thermal power plant, the Vojany thermal power plant will be used only if its conversion to the use of more environmentally friendly fuels (wood chips, waste) is an economically advantageous decision and the price of electricity produced in this way will be adequate for its use in the distribution network. The high price of gas and the low price of electricity do not indicate the development of the use of the steam-gas cycle. The hydropotential of the Slovak Republic is used to 71% and theoretically it would be possible to build new hydropower electricity plants with a total installed capacity of 241 MW and a production of 1900 GWh [73], but high investment intensity, negative public attitude reflected in complicated EIA process mean a low probability of significant development of this energy sector.
The period around 2030, when there will be a loss of financial support for photovoltaic power plants built in 2010–2012, seems unstable. In total, up to 530 MW of installed capacity is at risk, which may be missing both in the Slovakia’s EU targets for RES and in the electricity production system, of course only in the case if owners decide to end their operation after the loss of the government financial support.
In the long term, the concept also envisages the construction of another nuclear power source, but it does not envisage it until the end of operation of last two reactors of the Jaslovské Bohunice nuclear power plant after 2045. The new nuclear power plant should have an installed capacity of 1200 MW and should be located near the decommissioned nuclear power plant in Jaslovské Bohunice. However, such a large installed capacity would currently represent a high load on electricity systems, which is why the construction of a 560 MW pumped-storage hydroelectricity power plant is being considered in the future, which should be able to work with a weekly cycle by accumulating the weekend surplus from nuclear power plants and use it during demand peak in working days. This pumped storage power plant would also play an important role in balancing the production of future wind and photovoltaic power plants.
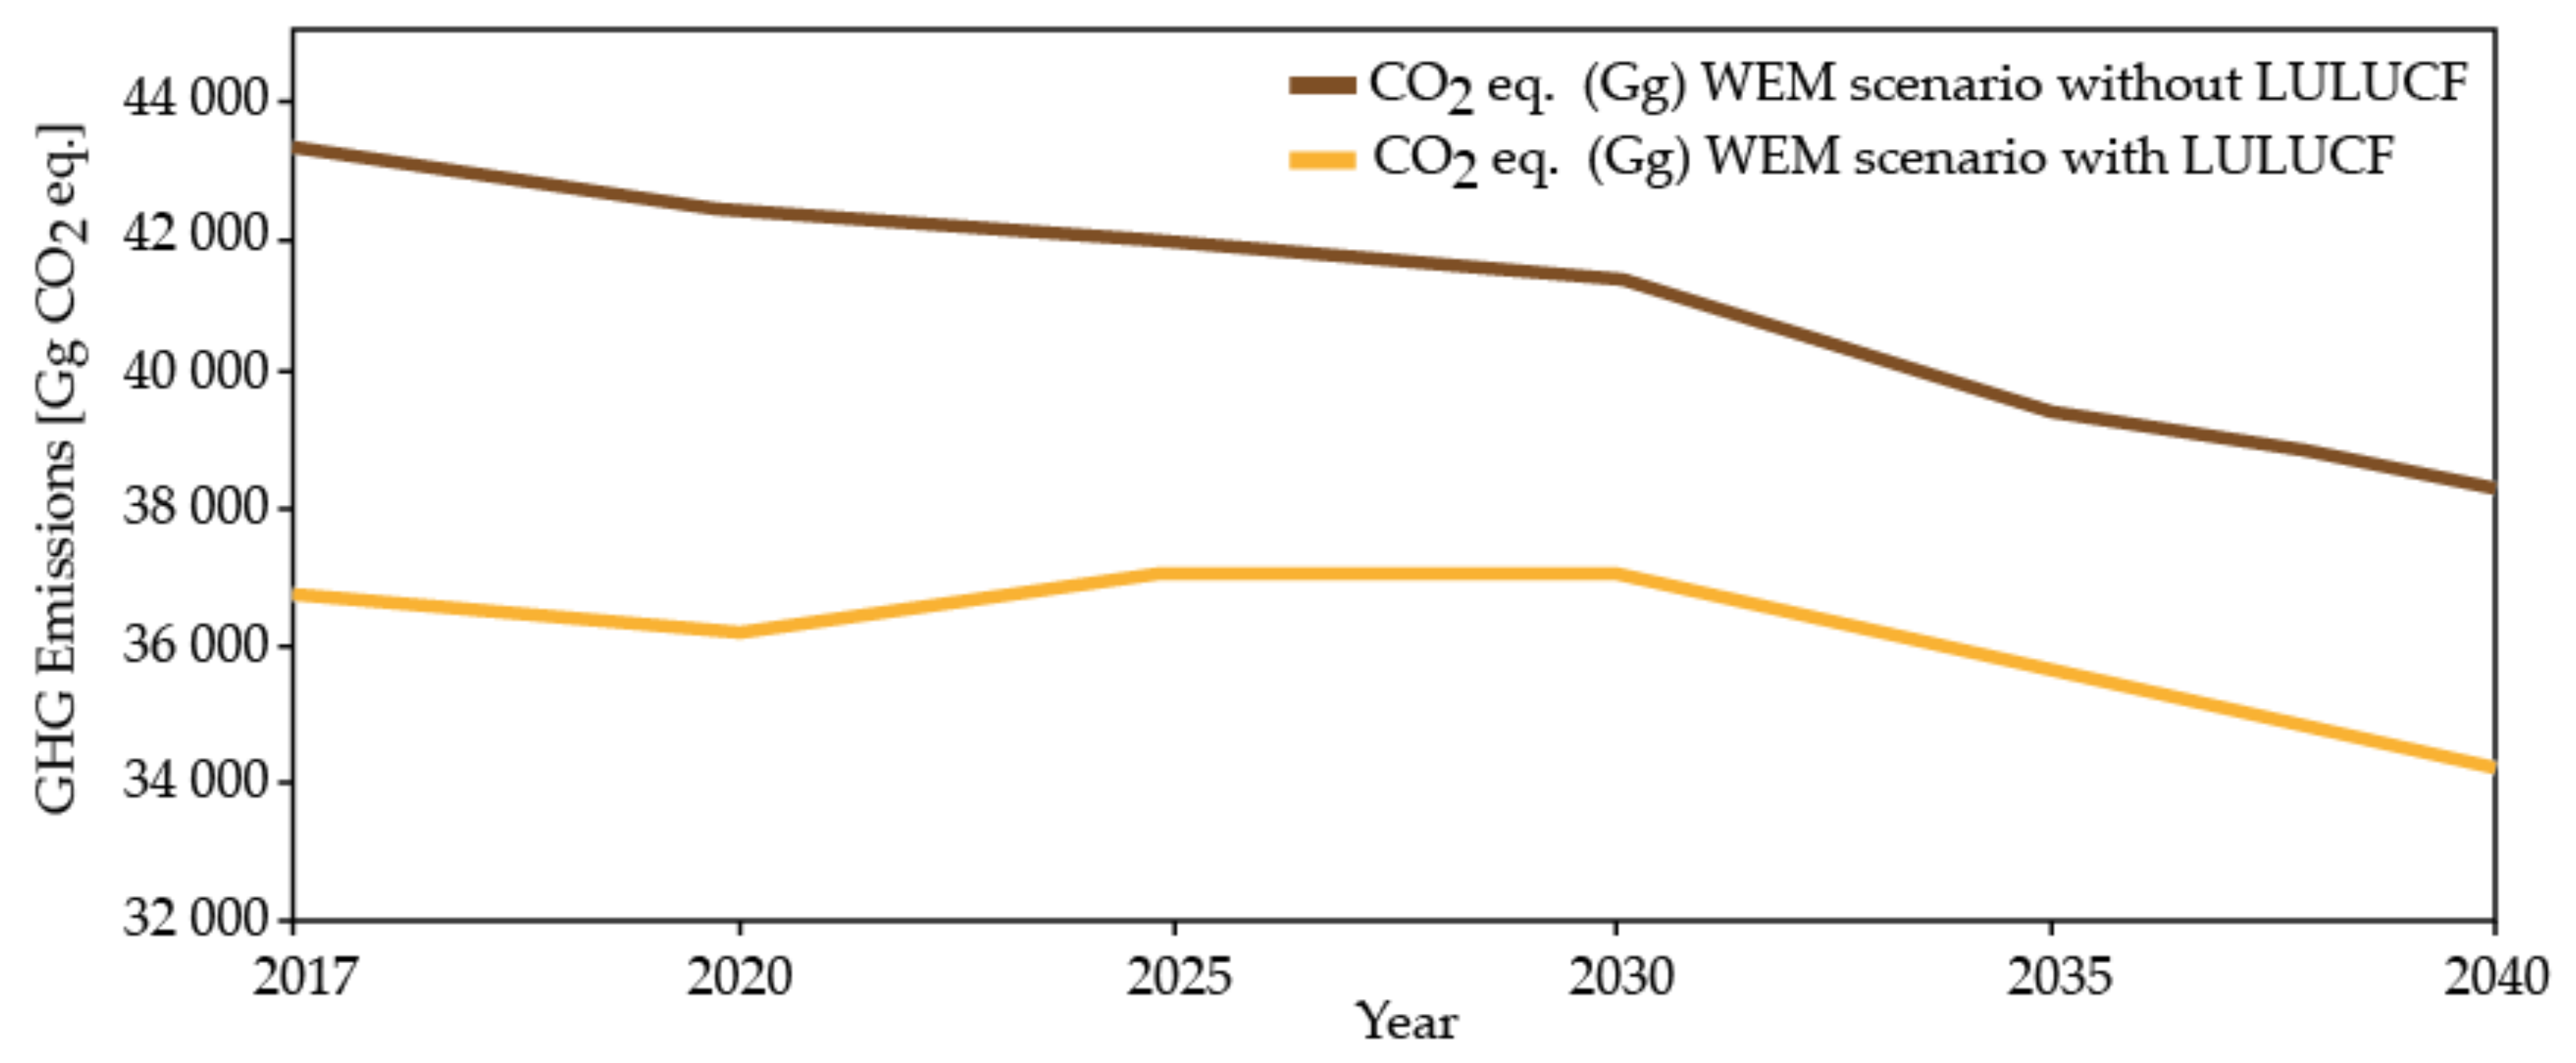
The development of the amount of greenhouse gas emissions within the Integrated National Energy and Climate Plan of the Slovak Republic is projected according to two scenarios—WEM (scenario with the application of existing measures) and WAM (scenario with the application of other measures). Projections of greenhouse gas emissions prepared according to the WEM scenario, which is equivalent to the EU reference scenario 2016 (EU 2016 RS) for the years 2015–2040 (with a view to 2050) are shown in Figure 11. Year 2016 was designated as the reference year for modeling greenhouse gas emissions for all scenarios for which verified data sets from the national greenhouse gas emissions inventory were available. The scenario is based on the logic of the EU 2016 RS scenario and includes policies and measures adopted and implemented at EU and national level by the end of 2016, including the measures needed to achieve the 2020 renewable energy and energy efficiency targets.
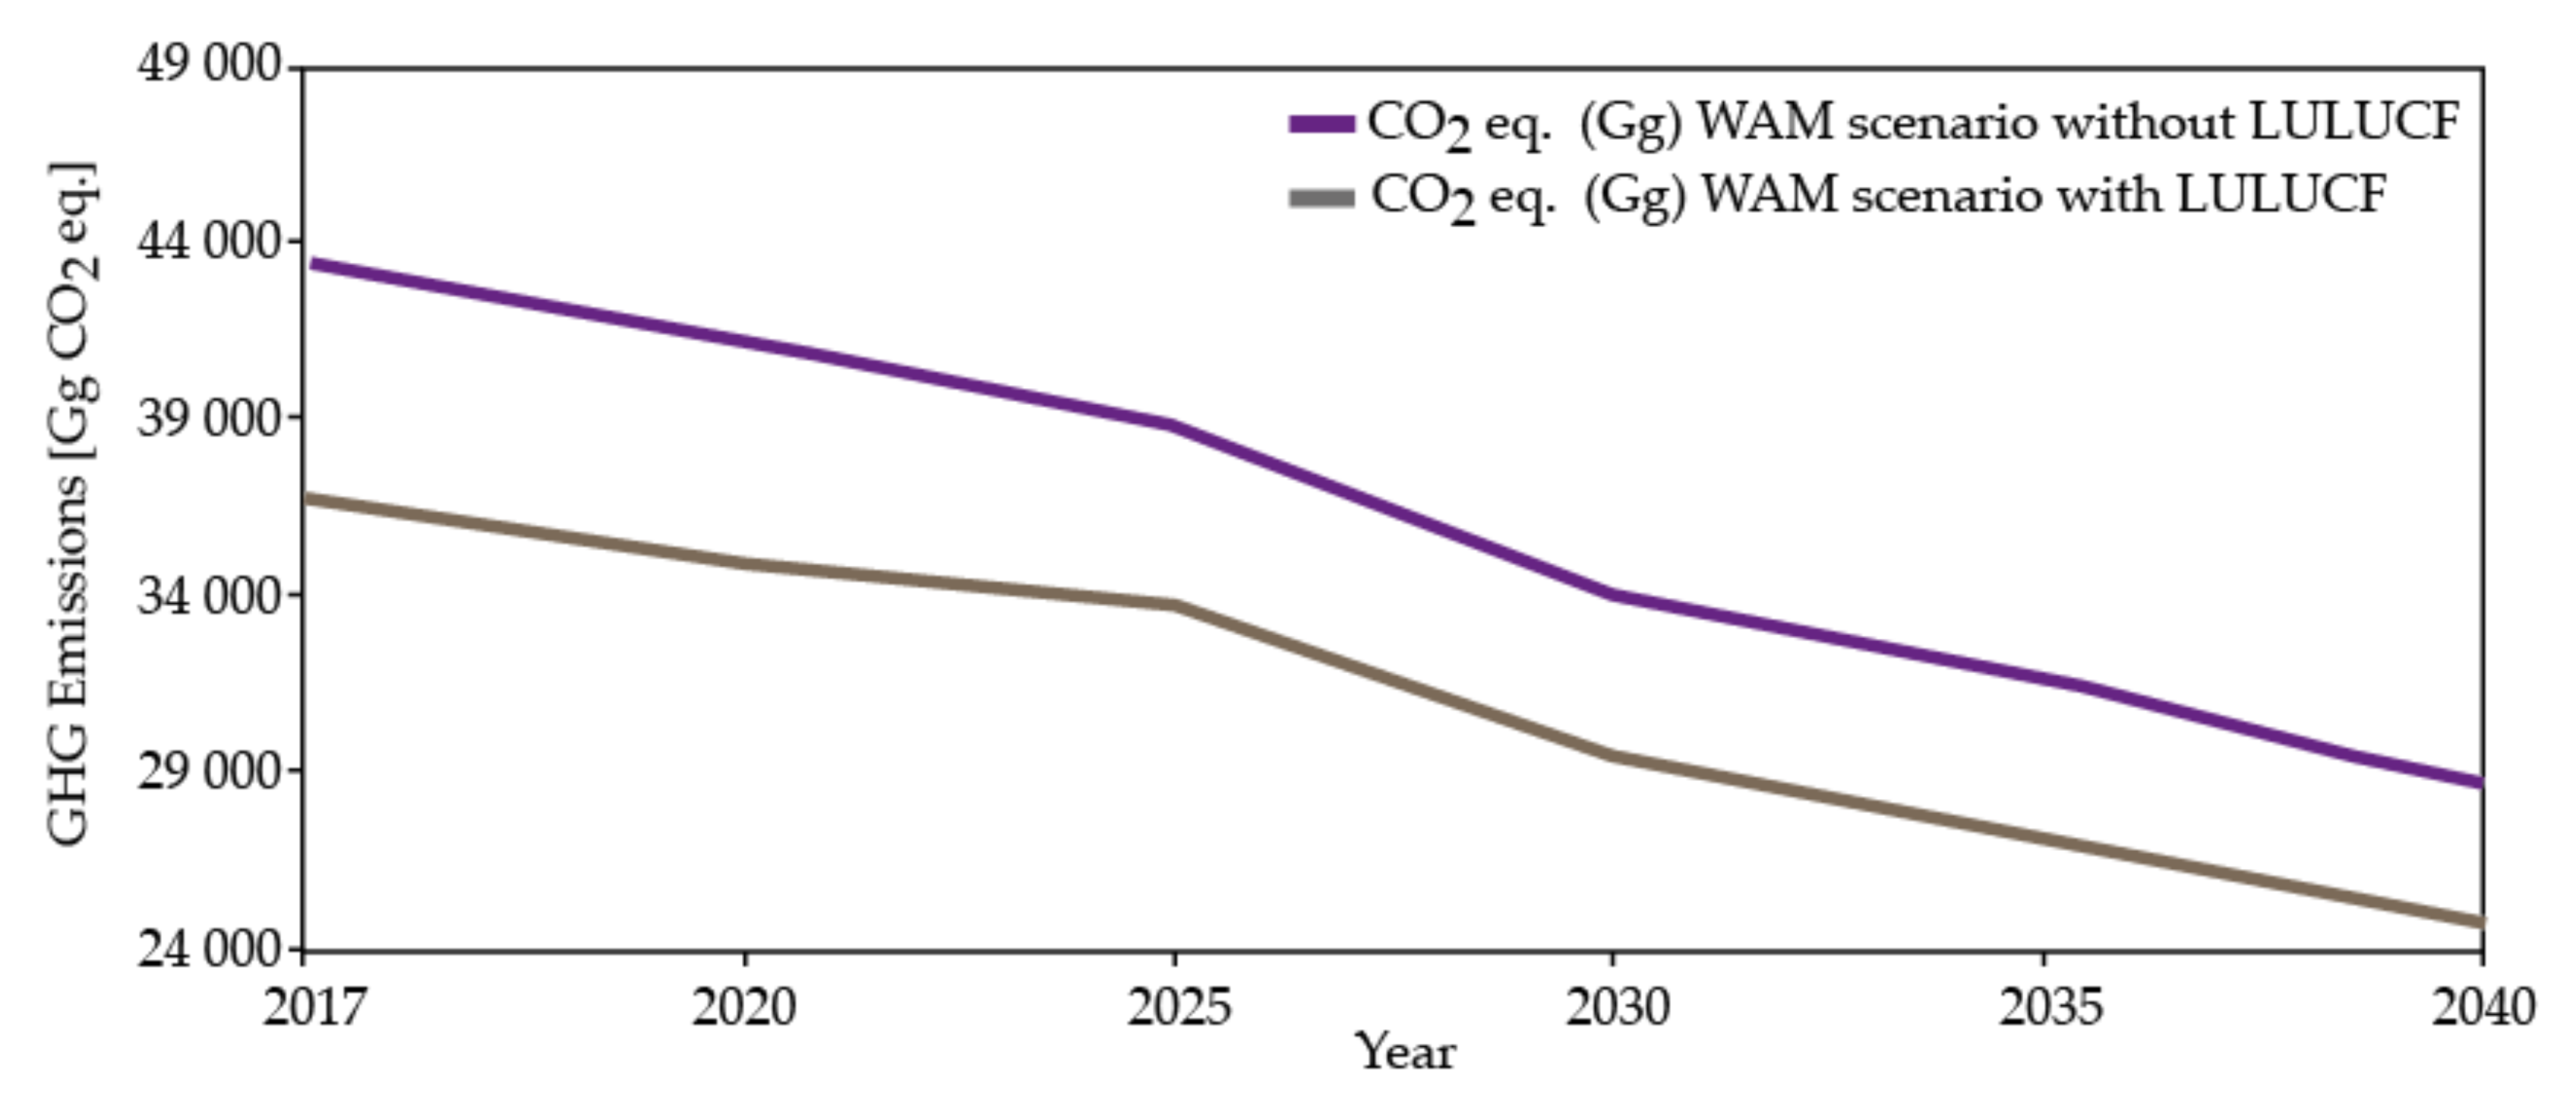
The WAM scenario includes ways to achieve various combinations of ambitious energy efficiency, renewable energy and 2030 emission reduction targets. The WAM scenario analyzes the possibility of achieving the EU’s 2050 emission reduction targets (i.e., carbon neutrality). The scenario includes Slovakia’s participation in the EU emissions trading system after 2020 and intermediate targets for renewable energy sources and energy efficiency, construction of new capacities for nuclear energy production, while maintaining its key role in the production mix. The projection of emissions according to the WAM scenario is shown in Figure 12.
Both scenarios work with the division of total emissions with the implementation or omission of LULUCF measures, i.e., land use, land-use change, and forestry. These are measures that can, by their nature, reduce greenhouse gas emissions, by capturing CO2 as biomass grows.
4. Comparison of the Energy Mixes of the “Visegrad Four” Countries (Extended by Austria)
The energy mix of the Slovak Republic is relatively unconventional in other European countries with a high share of nuclear energy in electricity production (approximately 55%). Only countries such as France (67%), Ukraine (52%), Hungary (47%) and Bulgaria (41%) have the closest values of the share of nuclear energy [49]. For better clarity, the energy mix of Slovakia will be compared with other countries of the Visegrad Four (Czech Republic, Hungary, Poland), which will be extended by Austria. In addition to energy mixes, available indicators quantifying greenhouse gas emissions will also be compared. The most current essential economic and energy indicators characterizing the compared countries are summarized in Table 2.
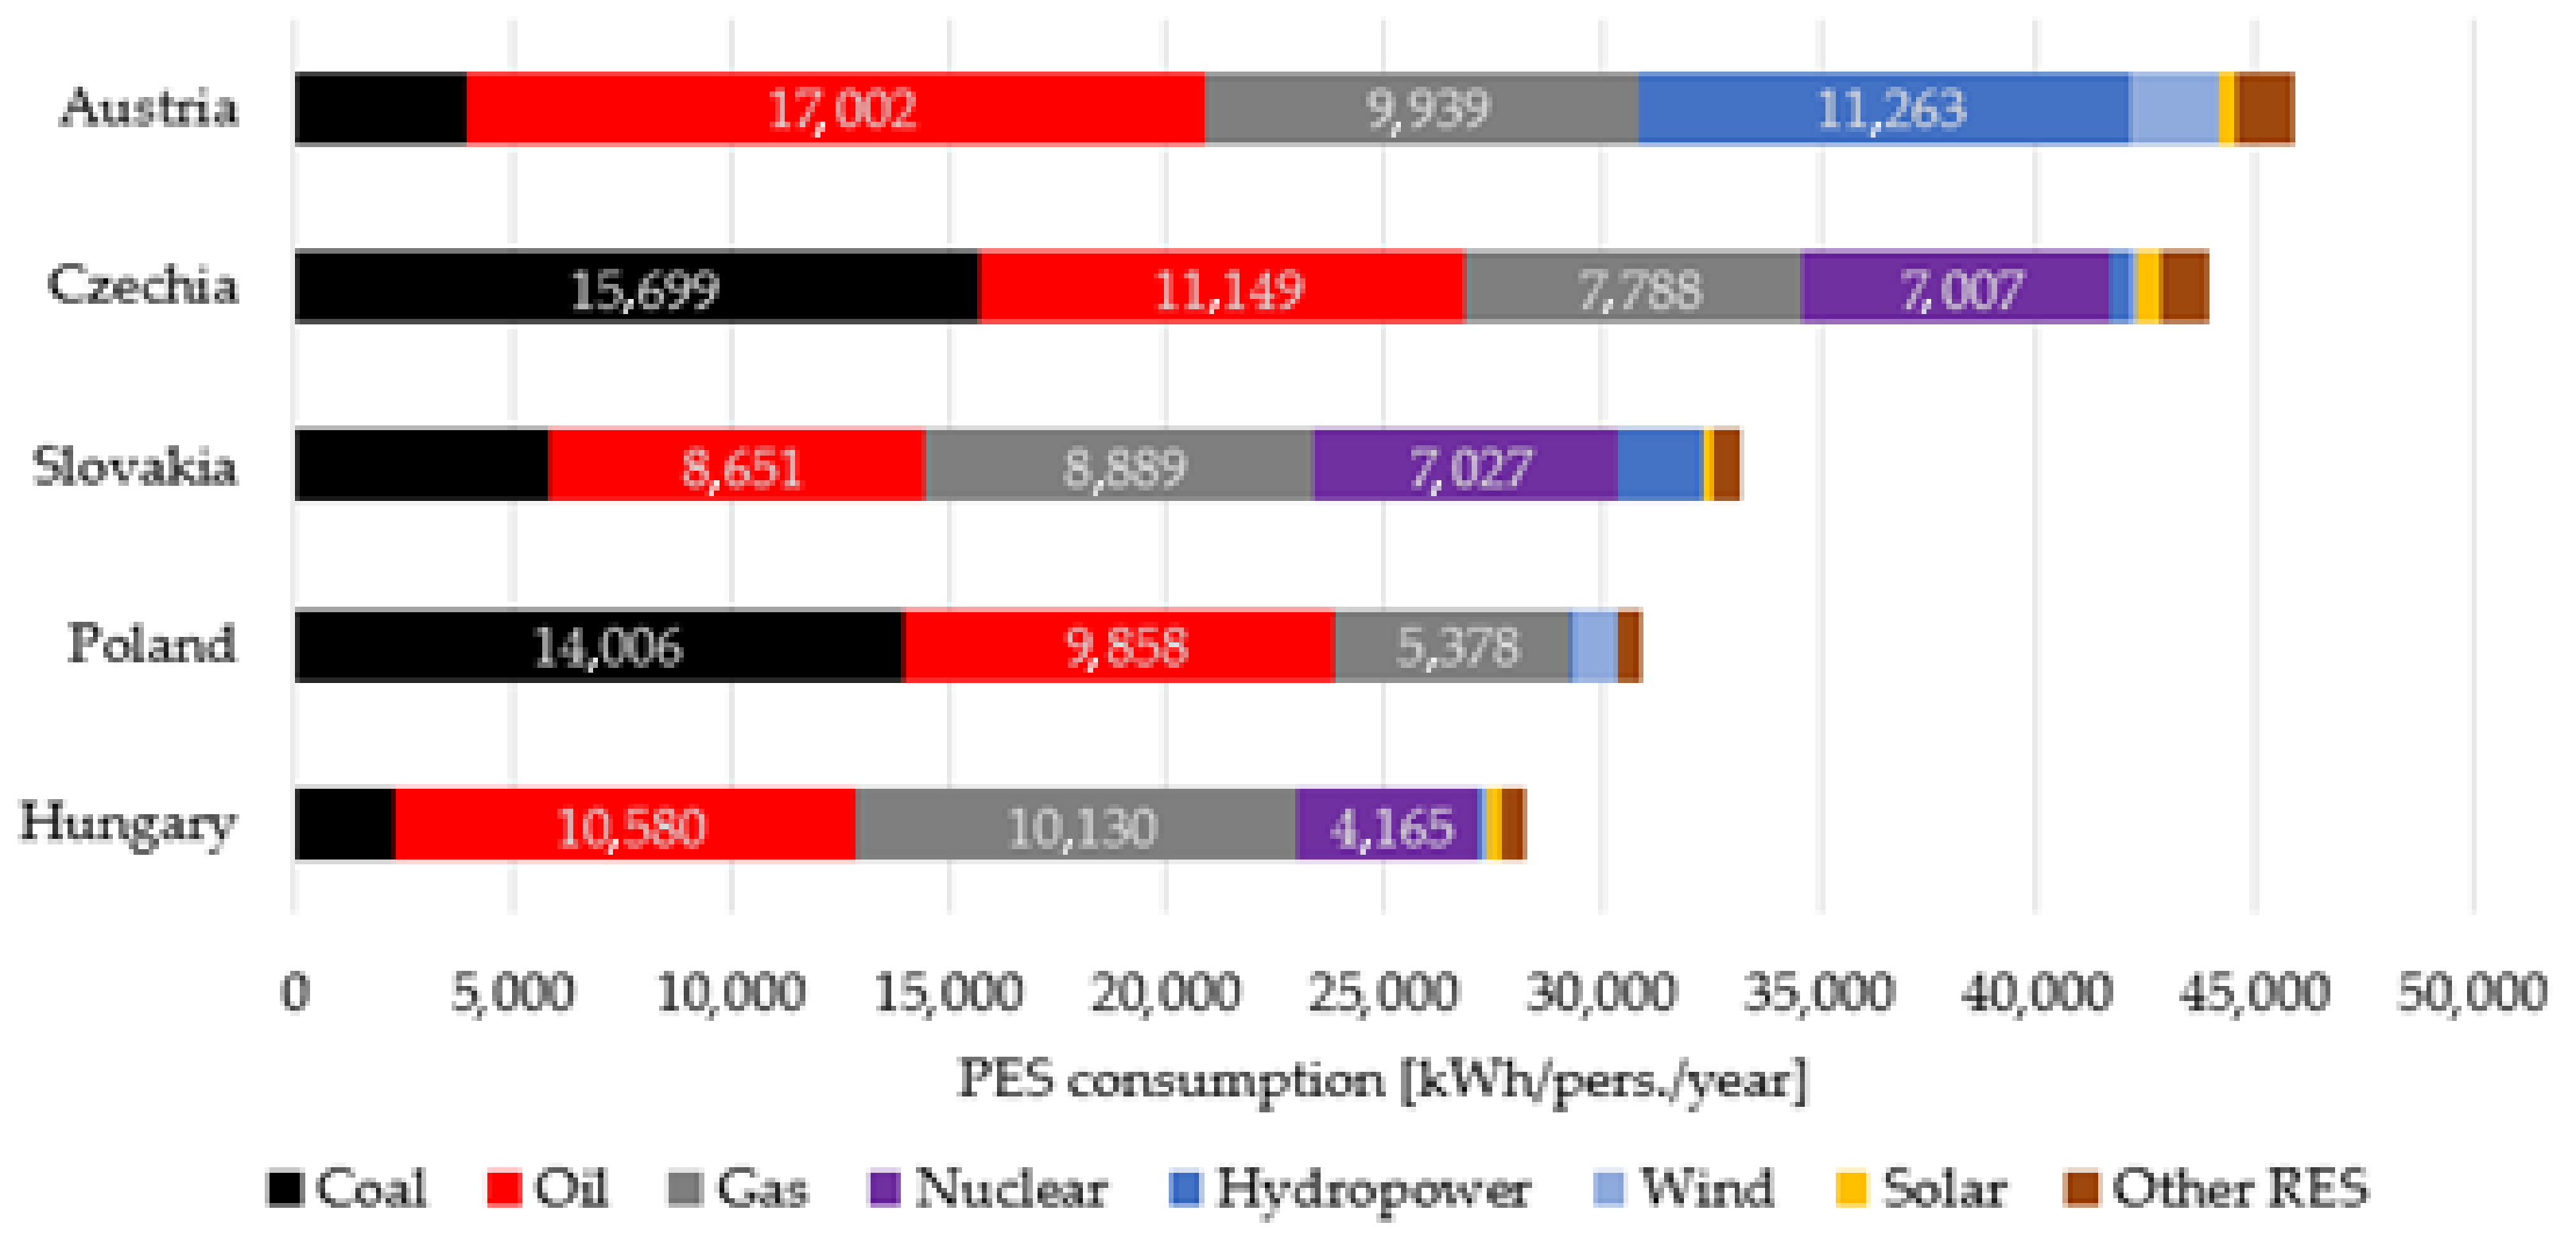
Figure 13 and Table 3 show the structure as well as the absolute per capita consumption of primary energy of each country. The size of energy consumption reflects the position of countries in terms of their economic performance as well as the structure of the economy. In this comparison, Austria has the highest primary energy consumption of 45,862 kWh per capita, followed by the Czech Republic (43,940 kWh per capita), Slovakia (33,171 kWh per capita) and Poland with 30,880 kWh per capita, the last country in this comparison is Hungary with 28,278 kWh per capita.
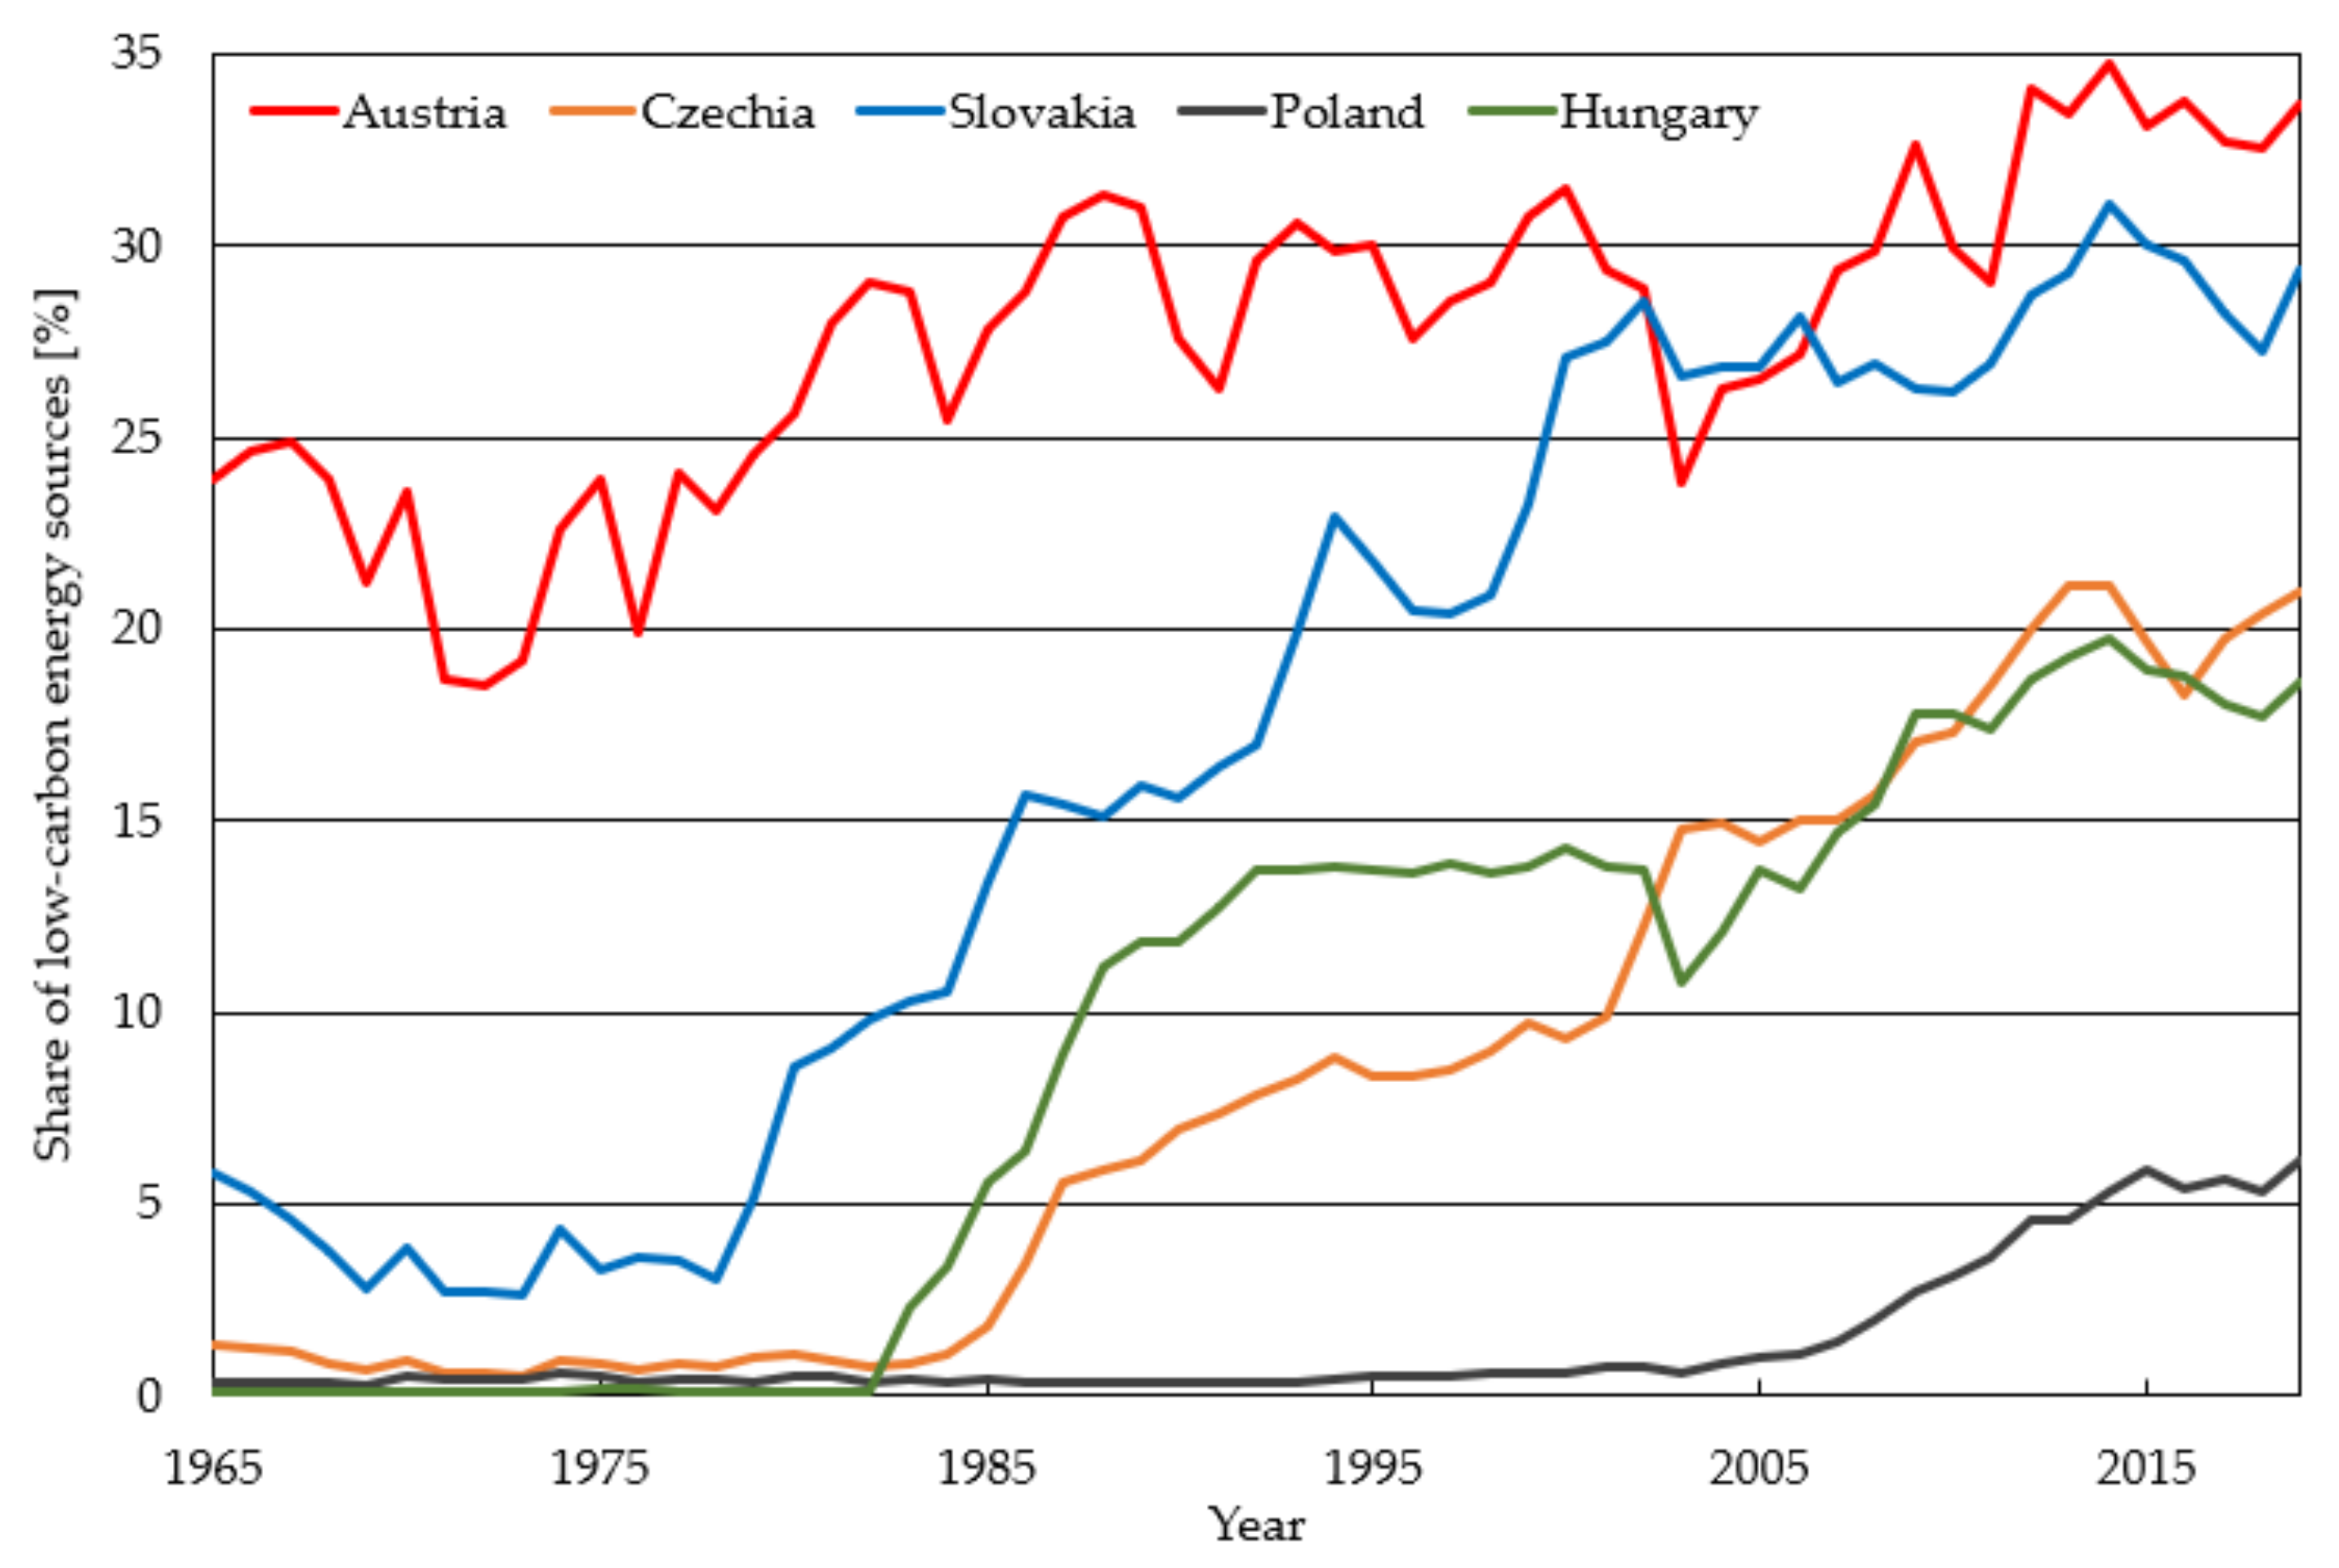
All the considered countries are members of the European Union and are subject to the same obligations arising from the effort to reduce greenhouse gas emissions. From this point of view, an interesting view of the share of low-emission sources in the total primary energy consumption is shown in Figure 14. The category of low-emission sources includes the use of nuclear energy and renewable energy sources (except for the use of traditional biomass). A positive finding is the trend of increasing use of low-emission sources among all countries. By synthesizing the information from Figure 13 and Figure 14, we get a realistic idea of the low-emission approach, as well as the mutual position of countries. The worst position in this comparison is Poland, whose low-emission energy sources represent only about 6% of total primary energy consumption. Poland has long been a country without a nuclear energy source and uses domestic coal reserves in many thermal power plants. Renewable sources are mainly represented by the use of wind energy and other RES (geothermal energy in the southern part of the country). With more than 18% following Hungary, it has a lower use of renewables than Poland, but generates electricity at the Paks nuclear power plant with an installed capacity of 4 × 500 MW. The third place belongs to the Czech Republic, which uses 21% of low-emission sources, in the case of the Czech Republic the situation is again positively affected by the existence of a pair of nuclear power plants Dukovany (4 × 510 MW) and Temelín (2 × 1082 MW) which are supplemented by the use of renewable sources energy in the form of hydropower, solar energy and biomass. Slovakia follows with a significant leap with almost 30% of low-emission sources, which is caused by the massive share of nuclear energy in electricity production, but also by the use of hydropower. In the first place is Austria, which ensures 33% of primary energy consumption through low emission sources. In the case of Austria, which does not have a nuclear power plant, as was the case in previous countries (except for Poland), this share is more interesting. In terms of its geographical location and morphology, Austria has significant potential for the use of hydropower in the Alpine region, as well as for the use of wind energy in the eastern flat part of the country. Significant state support also enables the efficient use of solar energy and biomass.
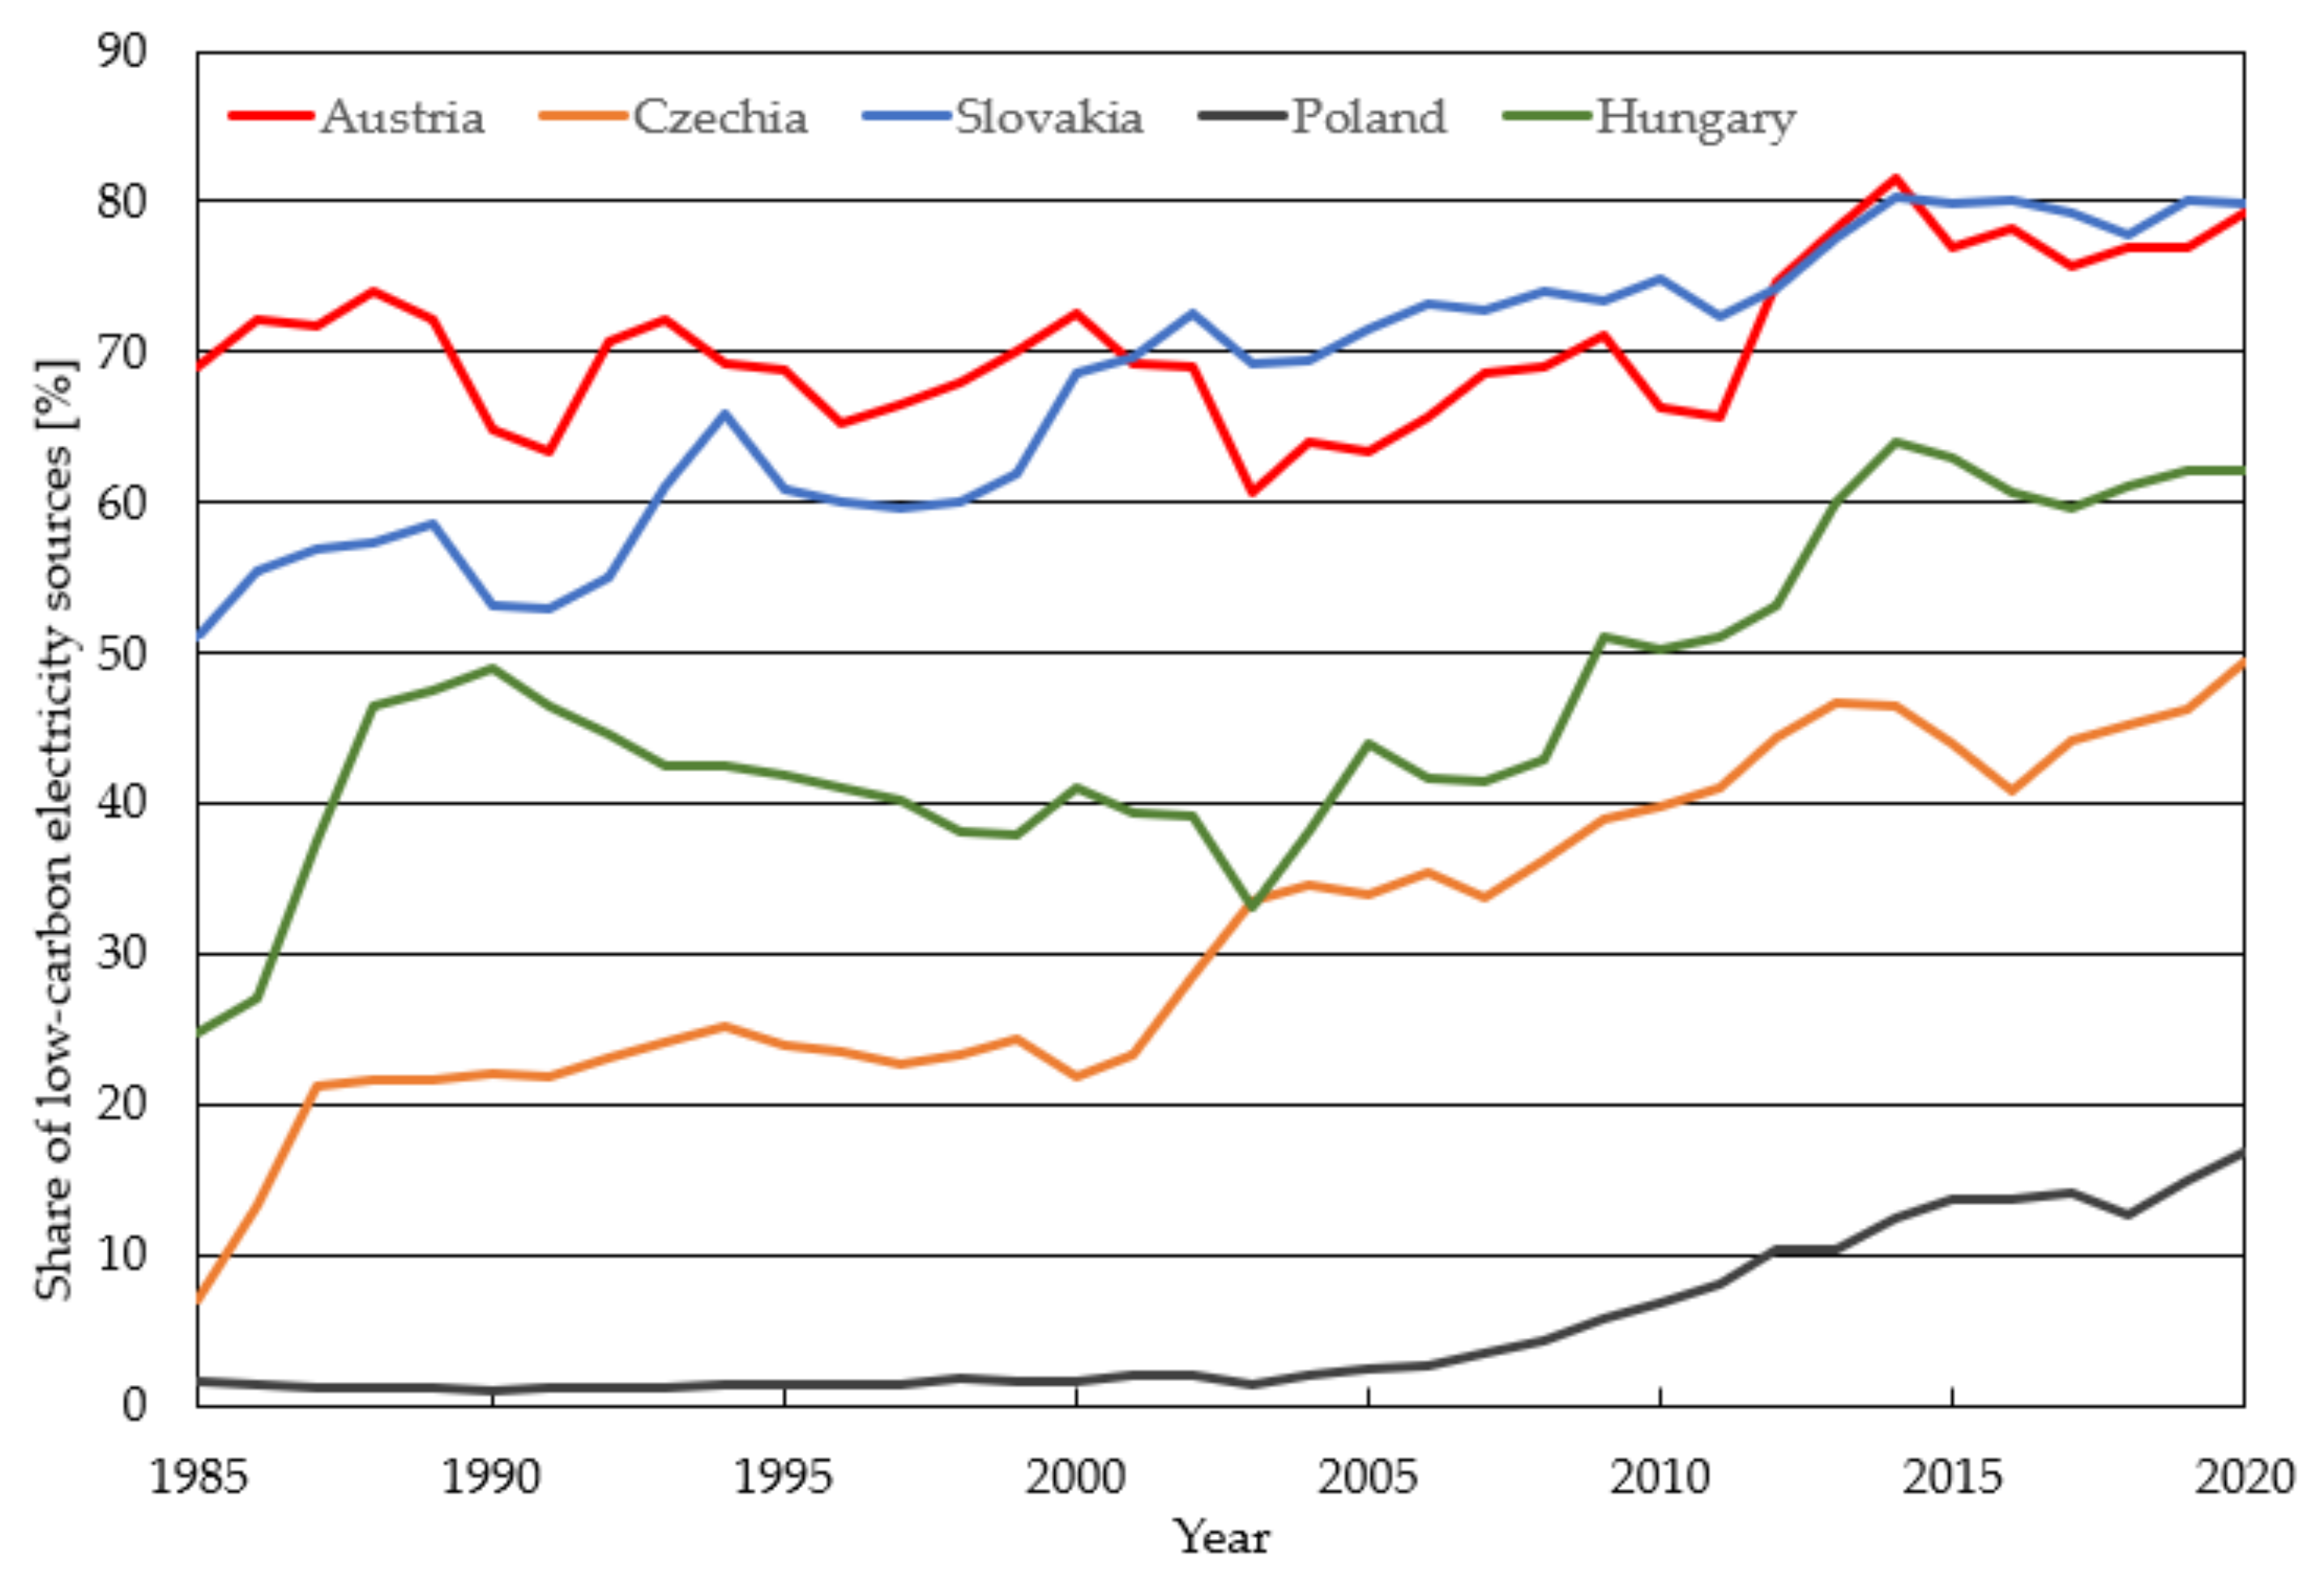
In the production of electricity, where the development is shown in Figure 15, the situation is different. Slovakia and Austria are in first and second place with almost 80% use of low-emission sources for electricity production, with Hungary following 62%, the Czech Republic 49% and Poland 16%. In this comparison, two factors come to the fore—the use of nuclear energy (Slovakia, Czechia, Hungary) and the existence of significant potential for RES in the country (Austria).
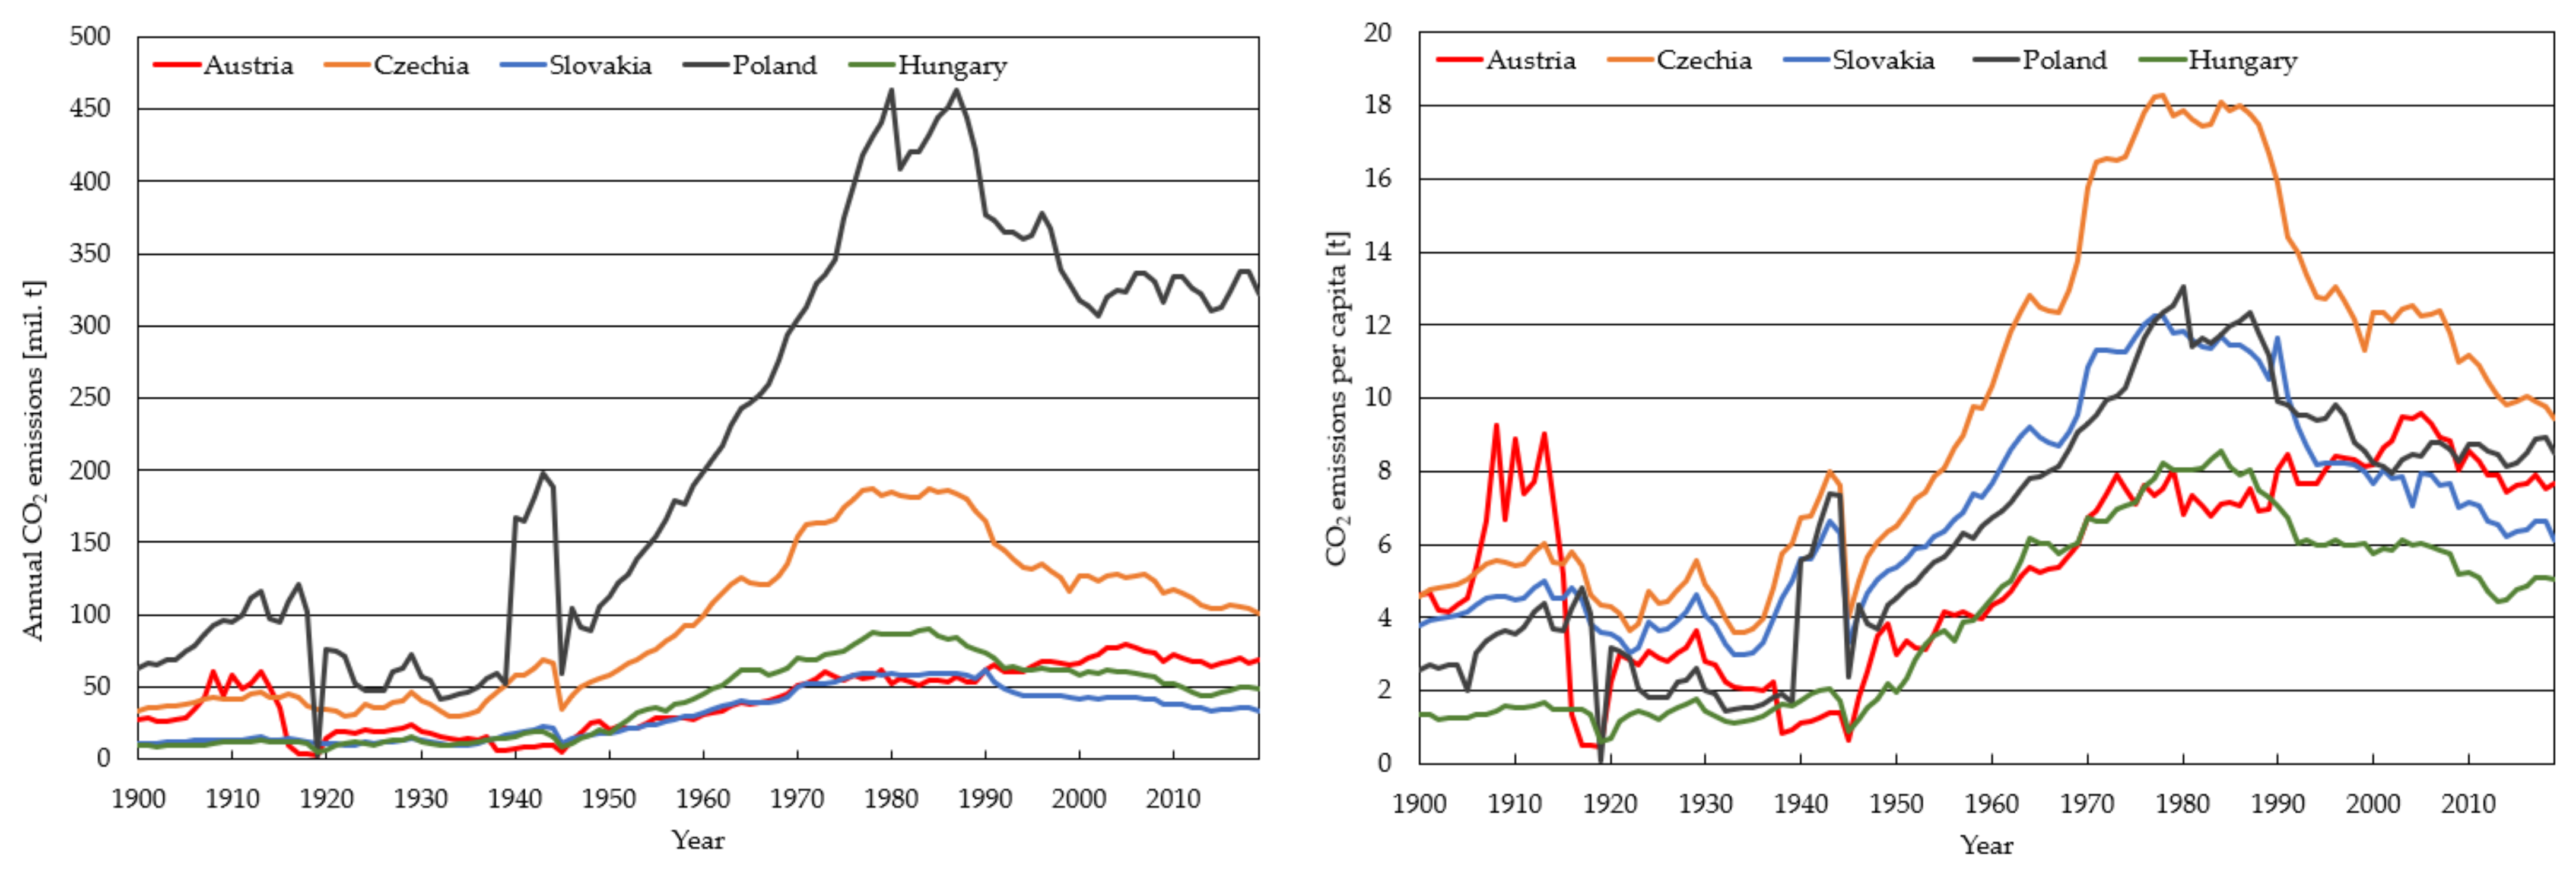
Unsurprisingly, the biggest polluter in terms of CO2 emissions is Poland, which emitted 322 million tons of carbon dioxide into the atmosphere in 2019. It is followed by the Czech Republic with more than 100 million tons, Austria 68 million tons, Hungary 49 million tons and Slovakia at last place with 33 million tons. Looking at the last period of development shown in Figure 16 (left), it is possible to speak of a steady course with relatively small fluctuations caused, for example, by the decline in economic activity in 2008, when the global economic crisis swept the world. However, the absolute values do not necessarily indicate the real state of the issue, if we look at the number of emissions per capita, the Czech Republic will significantly come to the fore. The development of this indicator is shown in Figure 16 (right).
The above summary and the development of key indicators have highlighted several interesting findings in the approach to ensuring a balance between the supply of stable and cheap electricity and, on the other hand, reducing CO2 emissions. From the point of view of efforts to move away from the direct use of fossil fuels, especially in transportation sector and their replacement by electromobility or hydrogen, the provision of stable low-emission sources of electricity is a very important factor. On the example of the compared countries, we see two directions in this approach.
The first is the building of large hydro and wind energy sources (marginally also solar farms) in Austria. In this case, there is a synergistic effect of the work of pumped storage hydropower plants (more than 5 GW of installed capacity) built in the Alpine region, with large wind farms in the eastern part of the country. Pumped storage power stations allow to accumulate the electricity produced by wind power at a time of large supply but low demand for electricity. Later, at electricity load peak times, pumped storage plants supply this energy to the distribution network. It should be noted that Austria has specific possibilities in terms of geomorphology and hydrology. Nevertheless, total CO2 emissions as well as per capita emissions are higher than, for example, in Slovakia or Hungary, which is caused by high standard of living of the population of Austria. With a high standard of living, there is always an increase in energy consumption, whether in the housing sector, but also in transport and leisure. Reducing emissions in these segments will be a difficult task for Austria’s government, as it will have to persuade the population to reduce frequency of their energy intense habits or to pay more for the same but more environmentally friendly activities.
The second approach is a significant share of nuclear energy, as we see in the case of Slovakia, where nuclear energy contributes more than 50% to electricity production and the low-emission part of the energy mix is supplemented by hydropower and only marginally by other renewable energy sources with unstable nature of the operation. On the example of these countries, we see a completely different approach to the structure of the energy mix as well as to its further direction. It is likely that Austria will address the increase in energy consumption as well as the agenda for reducing greenhouse gas emissions mainly from renewable energy sources, as nuclear energy is not popular in the country. Resistance to nuclear energy peaked in 1978, when residents in a referendum rejected the launch of the completed nuclear power plant Zwentendorf [80], which is a unique situation in the global perspective. On the contrary, from the above presented information it is clear that the Slovak Republic expects to launch and build additional nuclear resources. In this view, it is an interesting cross-border relationship between a strong opponent and a supporter, which brings complications in the form of behind-the-scenes as well as open political struggle on the international stage. In efforts to achieve a low-emission or carbon-neutral future, both countries rely on proven practices or on the overall potential of the territory, which translates into technically usable renewable energy potential, which is estimated at between 219 and 359 TWh/year [81] for Austria and 56 TWh/year for Slovakia [82].
If we accept the fact that the low-emission future of most processes (especially transport and industry) is associated with their massive electrification, both countries will have to continue to use stable sources of electricity. From the comparison of the potential of RES, it is clear that a massive retreat from nuclear energy in Slovakia is not technically possible and would pose a threat to the stability of the transmission and distribution system (taking into account the small potential for the expansion of stable hydropower electricity sources). Based on available information, other Visegrad Four countries are also planning a low-emission future of the energy mix based on the model of Slovakia. Thus, building a strong base in nuclear energy (new planned 1000 MW nuclear power plant in Poland, extending the life of nuclear reactors in the Czech Republic and building a new nuclear power plant until 2037, new nuclear reactors in Hungary in 2027, etc.), complemented by strong renewable source and a smaller proportion of other renewables of regional importance, which complement the overall energy mix and which are easily replaced by hot reserves (e.g., gas power plants) of small installed capacities or regulated by pumped storage. In the case of Slovakia, the use of hydropower is a strong renewable source; in the case of Poland, it could be wind farms in the north of the country in the Baltic region, and Hungary could use the potential in wind or solar energy. More problematic is the Czech Republic, which, due to its geographical location and morphology, does not have significant potential in one major and stable renewable energy source. An approach embodying the interconnection of nuclear energy and renewables is thus likely to dominate the evaluated area of the east part of the European Union, which will allow operation of a stable interconnected electricity system.
However, a similar approach is not only dominated by the countries of the former “Eastern bloc”, the situation has long been similar in France but also in Finland, which is completing the construction of new nuclear reactors. The second approach in the form of the widest possible use of renewables is represented in Norway, Denmark, or Sweden, which use the huge potential of renewables (hydropower, wind energy, biomass energy). Germany has a slightly different position, which does not have a dominant, strong and stable renewable resource. It seeks to combine many sources, which contribute to the complexity of electricity system management as well as enormous financial costs for energy sources themselves. Complication also brings the building of new lines of high-voltage transmission system that must transfer electricity from the Baltic Sea wind farms to the industrial south.
The success of individual approaches in terms of reducing greenhouse gas emissions, i.e., the promotion of nuclear energy or the promotion of exclusively renewable energy sources, will be possible to evaluate only in the future, when it will be possible to compare the predicted scenarios with reality. However, we are already seeing a few examples of countries that have nuclear-based energy (France), nuclear energy and renewables (Sweden) and whose emissions are among the lowest in Europe. On the contrary, countries like Germany with a huge installed capacity in renewable energy sources, despite enormous efforts and financial costs, still produce a large amount of greenhouse gas emissions. On this basis, it can be predicted that the European energy sector (as well as global energy sector) will not be able to achieve the required reductions in greenhouse gas emissions without the use of nuclear energy, as not every country has the potential and opportunities to use renewable energy sources. It is these countries that will have to rely on nuclear energy when switching from fossil fuels. Closely related to this is the speed of transition to low-emission sources. The construction of photovoltaic power plants or wind farms is relatively timesaving in comparison with the construction of nuclear power plants or hydroelectric power plants. This fact is visible especially in the construction of nuclear power plants in Europe, when almost every currently constructed project is not only extended but also more expensive (for example, Flamanville, Olkiluoto, Mochovce). Delays and frequent construction errors that need to be corrected may to some extent be linked to the inexperience of companies with similar types of contracts, as there has been a slowdown in the construction of nuclear power plants in the past and know-how acquired over the years has been lost. However, these problems can be solved by the increased intensity of construction of these energy sources as well as the introduction of modular construction of reactors of uniform European design. However, even in trouble-free construction, it is often necessary to consider a construction time of 7–10 years. The transition to zero-emission energy therefore brings problems of long construction times of energy resources as well as investment costs. These investment costs will have an impact on energy users in the form of increasing final prices due to various surcharges and charges for energy consumed or reserved capacity. However, it is the increase in prices that can be another impetus in the effort to reduce the consumption of primary energy sources, which is a highly desirable phenomenon. In addition to the undesirable financial consequences, the transition to zero-emission energy is accompanied by fears of possible threats to the stability of the electricity system due to a geographical imbalance in electricity production and consumption.
Both presented approaches have their advantages and disadvantages. The question remains what the costs will be for rebuilding the energy mixes of the countries, which will translate into a final price for the consumer and how stable the European common distribution network will operate. These are all questions that we will receive answers to in the next decade.
5. Conclusions
Global climate change brings many negative effects that fundamentally change the living environment and way of life of human society. Negative impacts in the form of loss of living space due to rising sea levels, lack of drinking water for personal consumption as well as agriculture and industry, extreme weather events and long-term changes in temperature profile, spread of new diseases, famine, migration or deteriorating air quality expose to adaptive pressure large amounts of biological communities, including humans. Today, most scientific organizations and leading scientists in the field of climate already attribute the global climate change to anthropogenic human activity associated with the use of fossil fuels and rising levels of carbon dioxide in the atmosphere. According to various studies, it is important to keep the global temperature rise to 1.5 °C compared to the temperature before the Industrial Revolution. This is also the aim of the efforts of the countries of the European Union, which have set themselves an ambitious goal in reducing emissions by 2050 and in the wider use of renewable energy sources. In addition to energy savings, a change in the structure of the energy mix is a fundamental prerequisite for success on the path to a carbon-neutral or negative future. The presented article dealt with the possibilities of changing the structure of used energy sources in the long term. The comparison of selected countries—Slovakia, Czechia, Poland, Hungary, and Austria—brought two different approaches to the issue. The first is the massive use of the potential of renewable energy sources in the form of hydropower and wind energy in Austria. In this case, the country uses to the maximum extent geomorphological and hydrogeological conditions, while not yet fulfilling the technical potential for their use. The use of hydropower in the production of electricity is a stable element that positively affects the security of the transmission system, and in addition, pumped storage hydropower plants can properly regulate the volatile production of electricity from large wind farms in the east of the country. On the contrary, other countries do not have such a significant potential in renewables, and in the pursuit of emission-free energy they must rely on the use and further development of nuclear energy, which is supplemented to a lesser extent by renewables. From this point of view, an interesting example is the case of the Slovak Republic, which uses a significant share of nuclear and hydropower to produce electricity. An emission-free approach to electricity generation will be crucial for the future, as most efforts to greening processes is their electrification, whether it is passenger and freight transport, various types of industrial processes or the production of hydrogen as the green fuel of the future.
Author Contributions
Conceptualization, methodology, investigation, resources, data curation, writing—original draft preparation, writing—review and editing, visualization, M.B., R.R. All authors have read and agreed to the published version of the manuscript.
Funding
This paper was created in connection with the project VEGA 1/0290/21 Study of the behavior of heterogeneous structures based on PCM and metal foams as heat accumulators with application potential in technologies for obtaining and processing of the earth resources. This research was funded by Scientific Grant Agency of the Ministry of Education, Science, Research and Sport of the Slovak Republic (VEGA). This paper was created in connection with the project 048TUKE-4/2021 Universal educational-competitive platform.
Conflicts of Interest
The authors declare no conflict of interest.
References
- Kumar, V. Development of Precise Indices for Assessing the Potential Impacts of Climate Change. Atmosphere 2020, 11, 1231. [Google Scholar] [CrossRef]
- Nightingale, A.J. Power and politics in climate change adaptation efforts: Struggles over authority and recognition in the context of political instability. Geoforum 2017, 84, 11–20. [Google Scholar] [CrossRef]
- Brigode, P.; Oudin, L.; Perrin, C. Hydrological model parameter instability: A source of additional uncertainty in estimating the hydrological impacts of climate change? J. Hydrol. 2013, 476, 410–425. [Google Scholar] [CrossRef] [Green Version]
- Se Min Suh, S.; Chapman, D.A.; Lickel, B. The role of psychological research in understanding and responding to links between climate change and conflict. Curr. Opin. Psychol. 2021, 42, 43–48. [Google Scholar]
- Heimann, M. Charles David Keeling 1928–2005. Nature 2005, 437, 331. [Google Scholar] [CrossRef]
- Pales, J.C.; Keeling, C.D. The concentration of atmospheric carbon dioxide in Hawaii. J. Geophys. Res. 1965, 70, 6053–6076. [Google Scholar] [CrossRef]
- Godebo, T.R.; Jeuland, M.A.; Paul, C.J.; Belachew, D.L.; McCornick, P.G. Water Quality Threats, Perceptions of Climate Change and Behavioral Responses among Farmers in the Ethiopian Rift Valley. Climate 2021, 9, 92. [Google Scholar] [CrossRef]
- You, Q.; Kang, S.; Pepin, N.; Flügel, W.A.; Sanchez-Lorenzo, A.; Yan, Y.; Zhang, Y. Climate warming and associated changes in atmospheric circulation in the eastern and central Tibetan Plateau from a homogenized dataset. Glob. Planet. Chang. 2010, 72, 11–24. [Google Scholar] [CrossRef]
- Adkins, J.F.; Ingersoll, A.P.; Pasquero, C. Rapid climate change and conditional instability of the glacial deep ocean from the thermobaric effect and geothermal heating. Quat. Sci. Rev. 2005, 24, 581–594. [Google Scholar] [CrossRef]
- Hunt, C. Instability of response to climate change by tropical lowland forest: Evidence from the Great Cave of Niah, Sarawak. Quat. Int. 2012, 279–280, 212. [Google Scholar] [CrossRef]
- Butler, C.J. A Review of the Effects of Climate Change on Chelonians. Diversity 2019, 11, 138. [Google Scholar] [CrossRef] [Green Version]
- Shafer, C.L. From non-static vignettes to unprecedented change: The U.S. National Park System, climate impacts and animal dispersal. Environ. Sci. Policy 2014, 40, 26–35. [Google Scholar] [CrossRef]
- Lovejoy, T.E.; Hannah, L.J. Climate Change and Biological Diversity; Yale University Press: New Haven, CT, USA, 2005. [Google Scholar]
- Ani, C.J.; Robson, B. Responses of marine ecosystems to climate change impacts and their treatment in biogeochemical ecosystem models. Mar. Pollut. Bull. 2021, 166, 112223. [Google Scholar] [CrossRef]
- Gauthier, S.; May, B.; Vasseur, L. Ecosystem-Based Adaptation to Protect Avian Species in Coastal Communities in the Greater Niagara Region, Canada. Climate 2021, 9, 91. [Google Scholar] [CrossRef]
- Lazic, D.; Hipp, A.L.; Carlson, J.E.; Gailing, O. Use of Genomic Resources to Assess Adaptive Divergence and Introgression in Oaks. Forests 2021, 12, 690. [Google Scholar] [CrossRef]
- Łubek, A.; Kukwa, M.; Jaroszewicz, B.; Czortek, P. Shifts in Lichen Species and Functional Diversity in a Primeval Forest Ecosystem as a Response to Environmental Changes. Forests 2021, 12, 686. [Google Scholar] [CrossRef]
- Melamed, Y.; Kislev, M.; Weiss, E.; Simchoni, O. Extinction of water plants in the Hula Valley: Evidence for climate change. J. Hum. Evol. 2011, 60, 320–327. [Google Scholar] [CrossRef]
- Robert, R.; Schleyer-Lindenmann, A. How ready are we to cope with climate change? Extent of adaptation to sea level rise and coastal risks in local planning documents of southern France. Land Use Policy 2021, 104, 105354. [Google Scholar] [CrossRef]
- Tehrani, M.J.; Helfer, F.; Jenkins, G. Impacts of climate change and sea level rise on catchment management: A multi-model ensemble analysis of the Nerang River catchment, Australia. Sci. Total Environ. 2021, 777, 146223. [Google Scholar] [CrossRef]
- Ranjbar, M.H.; Etemad-Shahidi, A.; Kamranzad, B. Modeling the combined impact of climate change and sea-level rise on general circulation and residence time in a semi-enclosed sea. Sci. Total Environ. 2020, 740, 140073. [Google Scholar] [CrossRef]
- Mallin, M.A.F. From sea-level rise to seabed grabbing: The political economy of climate change in Kiribati. Mar. Policy 2018, 97, 244–252. [Google Scholar] [CrossRef] [Green Version]
- Leveque, B.; Burnet, J.-B.; Dorner, S.; Bichai, F. Impact of climate change on the vulnerability of drinking water intakes in a northern region. Sustain. Cities Soc. 2021, 66, 102656. [Google Scholar] [CrossRef]
- Hashempour, Y.; Nasseri, M.; Mohseni-Bandpei, A.; Motesaddi, S.; Eslamizadeh, M. Assessing vulnerability to climate change for total organic carbon in a system of drinking water supply. Sustain. Cities Soc. 2020, 53, 101904. [Google Scholar] [CrossRef]
- Delpla, I.; Jung, A.-V.; Baures, E.; Clement, M.; Thomas, O. Impacts of climate change on surface water quality in relation to drinking water production. Environ. Int. 2009, 35, 1225–1233. [Google Scholar] [CrossRef] [PubMed]
- Grusson, Y.; Wesström, I.; Joel, A. Impact of climate change on Swedish agriculture: Growing season rain deficit and irrigation need. Agric. Water Manag. 2021, 251, 106858. [Google Scholar] [CrossRef]
- Golfam, P.; Ashofteh, P.S.; Loáiciga, H.A. Modeling adaptation policies to increase the synergies of the water-climate-agriculture nexus under climate change. Environ. Dev. 2021, 37, 100612. [Google Scholar] [CrossRef]
- Pastor-Paz, J.; Noy, I.; Sin, I.; Sood, A.; Fleming-Munoz, D.; Owen, S. Projecting the effect of climate change on residential property damages caused by extreme weather events. J. Environ. Manag. 2020, 276, 111012. [Google Scholar] [CrossRef] [PubMed]
- Calheiros, T.; Pereira, M.G.; Nunes, J.P. Assessing impacts of future climate change on extreme fire weather and pyro-regions in Iberian Peninsula. Sci. Total Environ. 2021, 754, 142233. [Google Scholar] [CrossRef]
- Yaduvanshi, A.; Nkemelang, T.; Bendapudi, R.; New, M. Temperature and rainfall extremes change under current and future global warming levels across Indian climate zones. Weather Clim. Extrem. 2021, 31, 100291. [Google Scholar] [CrossRef]
- Vaughan, A. Global warming will drive extreme wet weather in summer. New Sci. 2019, 243, 9. [Google Scholar] [CrossRef]
- Sorgho, R.; Jungmann, M.; Souares, A.; Danquah, I.; Sauerborn, R. Climate Change, Health Risks, and Vulnerabilities in Burkina Faso: A Qualitative Study on the Perceptions of National Policymakers. Int. J. Environ. Res. Public Health 2021, 18, 4972. [Google Scholar] [CrossRef]
- Santos-Guzman, J.; Gonzalez-Salazar, F.; Martínez-Ozuna, G.; Jimenez, V.; Luviano, A.; Palazuelos, D.; Fernandez-Flores, R.I.; Manzano-Camarillo, M.; Picazzo-Palencia, E.; Gasca-Sanchez, F.; et al. Epidemiologic Impacts in Acute Infectious Disease Associated with Catastrophic Climate Events Related to Global Warming in the Northeast of Mexico. Int. J. Environ. Res. Public Health 2021, 18, 4433. [Google Scholar] [CrossRef]
- Kurane, I. The Effect of Global Warming on Infectious Diseases. Osong Public Health Res. Perspect. 2010, 1, 4–9. [Google Scholar] [CrossRef] [PubMed] [Green Version]
- Khanal, U.; Wilson, C.; Rahman, S.; Lee, B.L.; Hoang, V.N. Smallholder farmers’ adaptation to climate change and its potential contribution to UN’s sustainable development goals of zero hunger and no poverty. J. Clean. Prod. 2021, 281, 124999. [Google Scholar] [CrossRef]
- Woodward, A.; Porter, J.R. Food, hunger, health, and climate change. Lancet 2016, 387, 1886–1887. [Google Scholar] [CrossRef]
- Hermans, K.; McLeman, R. Climate change, drought, land degradation and migration: Exploring the linkages. Curr. Opin. Environ. Sustain. 2021, 50, 236–244. [Google Scholar] [CrossRef]
- Stoler, J.; Brewis, A.; Kangmennang, J.; Keough, S.B.; Pearson, A.L.; Rosinger, A.Y.; Stauber, C.; Stevenson, E.G.J. Connecting the dots between climate change, household water insecurity, and migration. Curr. Opin. Environ. Sustain. 2021, 51, 36–41. [Google Scholar] [CrossRef]
- Puškár, M.; Jahnátek, A.; Kádárová, J.; Soltesova, N.; Kovanic, L.; Krivosudska, J. Environmental study focused on the suitability of vehicle certifications using the new European driving cycle (NEDC) with regard to the affair “dieselgate” and the risks of NOx emissions in urban destinations. Air Qual. Atmos. Health 2019, 12, 251–257. [Google Scholar] [CrossRef]
- Sinay, J.; Puškár, M.; Kopas, M. Reduction of the NOx emissions in vehicle diesel engine in order to fulfill future rules concerning emissions released into air. Sci. Total Environ. 2018, 624, 1421–1428. [Google Scholar] [CrossRef] [PubMed]
- Cook, J.; Oreskes, N.; Doran, P.T.; Anderegg, W.R.L.; Verheggen, B.; Maibach, E.W.; Carlton, J.S.; Lewandowsky, S.; Skuce, A.G.; Green, S.A.; et al. Consensus on consensus: A synthesis of consensus estimates on human-caused global warming. Environ. Res. Lett. 2016, 11, 048002. [Google Scholar] [CrossRef]
- Cook, J.; Nuccitelli, D.; Green, S.A.; Richardson, M.; Winkler, B.; Painting, R.; Way, R.; Jacobs, P.; Skuce, A. Quantifying the consensus on anthropogenic global warming in the scientific literature. Environ. Res. Lett. 2013, 8, 024024. [Google Scholar] [CrossRef] [Green Version]
- Anderegg, W.R.L. Expert Credibility in Climate Change. Proc. Natl. Acad. Sci. USA 2010, 107, 12107–12109. [Google Scholar] [CrossRef] [Green Version]
- Doran, P.T.; Zimmerman, M.K. Examining the Scientific Consensus on Climate Change. EOS Trans. Am. Geophys. Union 2009, 90, 22–23. [Google Scholar] [CrossRef]
- List of Worldwide Scientific Organizations Accepted that Climate Change Has Been Caused by Human Action. Available online: http://www.opr.ca.gov/facts/list-of-scientific-organizations.html (accessed on 7 May 2021).
- Abram, N.J.; McGregor, H.V.; Tierney, J.E.; Evans, M.N.; McKay, N.P.; Kaufman, D.S. The PAGES 2k Consortium. Early onset of industrial-era warming across the oceans and continents. Nature 2016, 536, 411–418. [Google Scholar] [CrossRef] [Green Version]
- Wrigley, E.A. Energy and the English Industrial Revolution. Philos. Trans. R. Soc. A 2013, 371, 20110568. [Google Scholar] [CrossRef]
- Smil, V. Energy Transitions: Global and National Perspectives, 2nd ed.; Praeger: Westport, CT, USA, 2016. [Google Scholar]
- BP Statistical Review of World Energy. Available online: https://www.bp.com/en/global/corporate/energy-economics/statistical-review-of-world-energy.html (accessed on 5 May 2021).
- Global Temperature Anomaly. NASA’s Goddard Institute for Space Studies. Available online: https://climate.nasa.gov/vital-signs/global-temperature/ (accessed on 1 May 2021).
- Masson-Delmotte, V.; Zhai, P.; Pörtner, H.O.; Roberts, D.; Skea, J.; Shukla, P.R.; Pirani, A.; Moufouma-Okia, W.; Péan, C.; Pidcock, R.; et al. (Eds.) Intergovernmental Panel on Climate Change, 2018: Global Warming of 1.5 °C. An IPCC Special Report on the Impacts of Global Warming of 1.5 °C Above Pre-Industrial Levels and Related Global Greenhouse Gas Emission Pathways, in the Context of Strengthening the Global Response to the Threat of Climate Change, Sustainable Development, and Efforts to Eradicate Poverty; Intergovernmental Panel on Climate Change: Geneva, Switzerland, 2018.
- Gawlik, L.; Mokrzycki, E. Changes in the Structure of Electricity Generation in Poland in View of the EU Climate Package. Energies 2019, 12, 3323. [Google Scholar] [CrossRef] [Green Version]
- Son, D.; Kim, J.; Jeong, B. Optimal Operational Strategy for Power Producers in Korea Considering Renewable Portfolio Standards and Emissions Trading Schemes. Energies 2019, 12, 1667. [Google Scholar] [CrossRef] [Green Version]
- Ranzani, A.; Bonato, M.; Patro, E.R.; Gaudard, L.; De Michele, C. Hydropower Future: Between Climate Change, Renewable Deployment, Carbon and Fuel Prices. Water 2018, 10, 1197. [Google Scholar] [CrossRef] [Green Version]
- Jesse, B.-J.; Morgenthaler, S.; Gillessen, B.; Burges, S.; Kuckshinrichs, W. Potential for Optimization in European Power Plant Fleet Operation. Energies 2020, 13, 718. [Google Scholar] [CrossRef] [Green Version]
- Ghandriz, T.; Jacobson, B.; Islam, M.; Hellgren, J.; Laine, L. Transportation-Mission-Based Optimization of Heterogeneous Heavy-Vehicle Fleet Including Electrified Propulsion. Energies 2021, 14, 3221. [Google Scholar] [CrossRef]
- Drożdż, W.; Elżanowski, F.; Dowejko, J.; Brożyński, B. Hydrogen Technology on the Polish Electromobility Market. Legal, Economic, and Social Aspects. Energies 2021, 14, 2357. [Google Scholar] [CrossRef]
- Korberg, A.D.; Skov, I.R.; Mathiesen, B.V. The role of biogas and biogas-derived fuels in a 100% renewable energy system in Denmark. Energy 2020, 199, 117426. [Google Scholar] [CrossRef]
- Mortensen, A.W.; Mathiesen, B.V.; Hansen, A.B.; Pedersen, S.L.; Grandal, R.D.; Wenzel, H. The role of electrification and hydrogen in breaking the biomass bottleneck of the renewable energy system—A study on the Danish energy system. Appl. Energy 2020, 275, 115331. [Google Scholar] [CrossRef]
- Figenbaum, E.; Assum, T.; Kolbenstvedt, M. Electromobility in Norway: Experiences and Opportunities. Res. Transp. Econ. 2015, 50, 29–38. [Google Scholar] [CrossRef]
- BP Statistical Review of World Energy Methodology. Available online: https://www.bp.com/en/global/corporate/energy-economics/statistical-review-of-world-energy/using-the-review/methodology.html#accordion_primary-energy-methodology (accessed on 12 July 2021).
- Demirel, Y. Energy Production, Conversion, Storage, Conservation, and Coupling, 2nd ed.; Springer: Cham, Switzerland, 2016; p. 445. [Google Scholar]
- Cengel, Y.; Boles, M. Thermodynamics: An Engineering Approach, 8th ed.; McGraw-Hill Education: New York, NY, USA, 2014. [Google Scholar]
- Impram, S.; Nese, S.V.; Oral, B. Challenges of renewable energy penetration on power system flexibility: A survey. Energy Strategy Rev. 2020, 31, 100539. [Google Scholar] [CrossRef]
- Cole, W.; Frazier, A.W. Impacts of increasing penetration of renewable energy on the operation of the power sector. Electr. J. 2018, 31, 24–31. [Google Scholar] [CrossRef]
- Peng, P.; Lu, F.; Cheng, S.; Yang, Y. Mapping the global liquefied natural gas trade network: A perspective of maritime transportation. J. Clean. Prod. 2021, 283, 124640. [Google Scholar] [CrossRef]
- McFarlan, A. Techno-economic assessment of pathways for liquefied natural gas (LNG) to replace diesel in Canadian remote northern communities. Sustain. Energy Technol. Assess. 2020, 42, 100821. [Google Scholar]
- The Future of Hydrogen. IEA Report. Available online: https://www.iea.org/reports/the-future-of-hydrogen (accessed on 25 April 2021).
- Martino, M.; Ruocco, C.; Meloni, E.; Pullumbi, P.; Palma, V. Main Hydrogen Production Processes: An Overview. Catalysts 2021, 11, 547. [Google Scholar] [CrossRef]
- Rapier, R. Life Cycle Emissions of Hydrogen. Available online: https://4thgeneration.energy/life-cycles-emissions-of-hydrogen/ (accessed on 25 April 2021).
- Hoes, O.A.C.; Meijer, L.J.J.; van der Ent, R.J.; van de Giesen, N.C. Systematic high-resolution assessment of global hydropower potential. PLoS ONE 2017, 12, e0171844. [Google Scholar] [CrossRef]
- International Monetary Fund. World Economic Outlook—GDP Per Capita; International Monetary Fund: Washington, DC, USA, 2021. [Google Scholar]
- Slovak Ministry of Economy. Integrated National Energy and Climate Plan (2021–2030); Slovak Ministry of Economy: Bratislava, Slovakia, 2019. [Google Scholar]
- International Energy Agency—Slovak Republic Review. Available online: https://www.iea.org/countries/slovak-republic (accessed on 21 April 2021).
- Morvay, A. Economic Transformation: The Experience of Slovakia; Repro-Print: Bratislava, Slovakia, 2005. [Google Scholar]
- Kotulic, R.; Kravcakova Vozarova, I.; Nagy, J.; Huttmanova, E.; Vavrek, R. Performance of The Slovak Economy in Relation to Labor Productivity and Employment. Procedia Econ. Financ. 2015, 23, 970–975. [Google Scholar] [CrossRef] [Green Version]
- IEA—Slovak Republic Energy System Overview. Available online: https://euagenda.eu/upload/publications/untitled-69956-ea.pdf (accessed on 7 April 2021).
- International Labour Organization, ILOSTAT Database. Available online: http://data.worldbank.org/data-catalog/world-development-indicators (accessed on 7 April 2021).
- Friedlingstein, P.; O’Sullivan, M.; Friedlingstein, P.; Jones, M.W.; Andrew, R.M.; Hauck, J.; Olsen, A.; Peters, W.; Pongratz, J.; Sitch, S. Global Carbon Budget 2020. Earth Syst. Sci. Data. 2020, 12, 3269–3340. [Google Scholar] [CrossRef]
- Behrsin, I. Controversies of justice, scale, and siting: The uneven discourse of renewability in Austrian waste-to-energy development. Energy Res. Soc. Sci. 2020, 59, 101252. [Google Scholar] [CrossRef]
- Geyer, R.; Knöttner, S.; Diendorfer, C.; Drexler-Schmid, G.; Alton, V. 100% Renewable Energy for Austria’s Industry: Scenarios, Energy Carriers and Infrastructure Requirements. Appl. Sci. 2021, 11, 1819. [Google Scholar] [CrossRef]
- Soltesova, K. Renewable Energy Sources in Slovakia (Slovak Energy Agency). Available online: www.sea.gov.sk/NLCCollection (accessed on 15 March 2021).
Figure 1.
Number of published papers with keywords “climate change” and “global warming” (1998–2020).
Figure 1.
Number of published papers with keywords “climate change” and “global warming” (1998–2020).

Figure 2.
Development of primary energy consumption, CO2 emissions and global temperature anomaly (1800–2019) [48,49,50].


Figure 4.
Global electricity production by source (1985–2020) [49].
Figure 4.
Global electricity production by source (1985–2020) [49].

Figure 5.
Primary energy consumption and electricity production of the Slovak republic [49].
Figure 5.
Primary energy consumption and electricity production of the Slovak republic [49].

Figure 6.
Historical development of primary energy consumption of the Slovak Republic (1965–2019) [49].
Figure 6.
Historical development of primary energy consumption of the Slovak Republic (1965–2019) [49].

Figure 7.
Structure of Slovak installed capacity and electricity generation in 2019 [73].
Figure 7.
Structure of Slovak installed capacity and electricity generation in 2019 [73].

Figure 8.
Comparison of relative greenhouse gas emissions trends with Kyoto protocol goals [73].
Figure 8.
Comparison of relative greenhouse gas emissions trends with Kyoto protocol goals [73].

Figure 9.
Trends of individual emissions according to the 1990 level [73].
Figure 9.
Trends of individual emissions according to the 1990 level [73].

Figure 10.
Future trends of RES share in total energy mix [73].
Figure 10.
Future trends of RES share in total energy mix [73].

Figure 11.
Projections of greenhouse gas emissions prepared according to the WEM scenario [73].
Figure 11.
Projections of greenhouse gas emissions prepared according to the WEM scenario [73].

Figure 12.
The projection of emissions according to the WAM scenario [73].
Figure 12.
The projection of emissions according to the WAM scenario [73].

Figure 13.
Structure of per capita primary energy consumption of compared countries in 2019 [49].
Figure 13.
Structure of per capita primary energy consumption of compared countries in 2019 [49].

Figure 14.
Share of low-emission sources in primary energy consumption (1965–2019) [49].
Figure 14.
Share of low-emission sources in primary energy consumption (1965–2019) [49].

Figure 15.
Share of low-emission sources in electricity production (1965–2019) [49].
Figure 15.
Share of low-emission sources in electricity production (1965–2019) [49].

Figure 16.
Historical development of total (left) and per capita (right) carbon dioxide emissions [79].
Figure 16.
Historical development of total (left) and per capita (right) carbon dioxide emissions [79].


Table 1.
Key power plants in the Slovak Republic.
| Name of the Power Plant | Installed Power | Type |
|---|---|---|
| Jaslovské Bohunice V2 | 2 × 505 MWe | Nuclear |
| Mochovce 1 and 2 | 2 × 470 MWe | Nuclear |
| Gabčíkovo | 720 MW | Hydro |
| Liptovská Mara | 198 MW | Pumped-storage hydro |
| Čierny Váh | 735 MW | Pumped-storage hydro |
| Nováky | 266 MWe | Coal thermal |
| Vojany | 2 × 110 MWe | Coal thermal |
| Indicator | Slovakia | Czechia | Poland | Hungary | Austria |
|---|---|---|---|---|---|
| Number of populations (mil.) | 5.45 | 10.72 | 37.80 | 9.63 | 9.04 |
| GDP per capita (USD) | 34,815 | 42,956 | 35,957 | 35,088 | 57,891 |
| Electricity consumption per capita (kWh) | 5241 | 7534 | 4159 | 3500 | 7716 |
| Employment in industry (%) | 36.34 | 37.87 | 31.33 | 30.18 | 25.62 |
| Employment in services (%) | 60.75 | 59.27 | 58.11 | 64.84 | 70.07 |
| Employment in agriculture (%) | 2.91 | 2.87 | 10.56 | 4.98 | 4.31 |
Table 3.
Per capita primary energy consumption by source of the compared countries in 2019 [49].
Table 3.
Per capita primary energy consumption by source of the compared countries in 2019 [49].
| Country | Primary Energy Consumption by Source (kWh/pers./year) | |||||||
|---|---|---|---|---|---|---|---|---|
| Coal | Oil | Gas | Nuclear | Hydro | Wind | Solar | Other RES | |
| Austria | 3904 | 17,002 | 9939 | 0 | 11,263 | 2056 | 374 | 1324 |
| Czechia | 15,699 | 11,149 | 7788 | 7007 | 465 | 162 | 529 | 1141 |
| Slovakia | 5813 | 8651 | 8889 | 7027 | 1927 | 1 | 267 | 596 |
| Poland | 14,006 | 9858 | 5378 | 0 | 128 | 983 | 47 | 480 |
| Hungary | 2258 | 10,580 | 10,130 | 4165 | 56 | 186 | 354 | 549 |
Publisher’s Note: MDPI stays neutral with regard to jurisdictional claims in published maps and institutional affiliations. |
© 2021 by the authors. Licensee MDPI, Basel, Switzerland. This article is an open access article distributed under the terms and conditions of the Creative Commons Attribution (CC BY) license (https://creativecommons.org/licenses/by/4.0/).
Share and Cite
MDPI and ACS Style
Beer, M.; Rybár, R. Development Process of Energy Mix towards Neutral Carbon Future of the Slovak Republic: A Review. Processes 2021, 9, 1263. https://0-doi-org.brum.beds.ac.uk/10.3390/pr9081263
AMA Style
Beer M, Rybár R. Development Process of Energy Mix towards Neutral Carbon Future of the Slovak Republic: A Review. Processes. 2021; 9(8):1263. https://0-doi-org.brum.beds.ac.uk/10.3390/pr9081263
Chicago/Turabian StyleBeer, Martin, and Radim Rybár. 2021. "Development Process of Energy Mix towards Neutral Carbon Future of the Slovak Republic: A Review" Processes 9, no. 8: 1263. https://0-doi-org.brum.beds.ac.uk/10.3390/pr9081263
Note that from the first issue of 2016, this journal uses article numbers instead of page numbers. See further details here.