Article

Polyphenolic Characterization and Antioxidant Capacity of Laurus nobilis L. Leaf Extracts Obtained by Green and Conventional Extraction Techniques

by
Erika Dobroslavić
,
Ivona Elez Garofulić
*,
Zoran Zorić
,
Sandra Pedisić
and
Verica Dragović-Uzelac
Faculty of Food Technology & Biotechnology, University of Zagreb, Pierottijeva 6, 10 000 Zagreb, Croatia
*
Author to whom correspondence should be addressed.
Submission received: 24 September 2021 / Revised: 12 October 2021 / Accepted: 14 October 2021 / Published: 16 October 2021
(This article belongs to the Section Biological Processes and Systems)

Abstract

:
Laurus nobilis L. is an evergreen Mediterranean shrub whose leaves have been known for various health-promoting effects mainly attributed to polyphenols. Microwave- (MAE) and ultrasound-assisted extraction (UAE) are green extraction techniques that enable effective isolation of polyphenols from plant material. Therefore, the aim of this research was to optimize the extraction conditions of MAE (ethanol percentage, temperature, extraction time, microwave power) and UAE (ethanol percentage, extraction time, amplitude) of polyphenols from Laurus nobilis L. leaves and to assess their polyphenolic profile by ultra performance liquid chromatography- tandem mass spectrometry (UPLC-MS/MS) and antioxidant capacity by oxygen radical absorbance capacity (ORAC) assay. Optimal MAE conditions were 50% ethanol, 80 °C, 10 min and 400 W. Optimal UAE conditions were 70% ethanol, 10 min and 50% amplitude. Spectrophotometric analysis showed the highest total phenolic content in the extracts was obtained by MAE, compared to conventional heat-reflux extraction (CRE) and UAE. The polyphenolic profile of all obtained extracts included 29 compounds, with kaempferol and quercetin glycosides being the most abundant. UPLC-MS/MS showed the highest total phenolic content in the extracts obtained by CRE. ORAC assay showed the highest antioxidant capacity in extracts obtained by CRE, which is in agreement with the polyphenolic profile determined by UPLC-MS/MS.

1. Introduction

Laurus nobilis L., a representative of the family Lauraceae, is an evergreen shrub native to the Mediterranean area. The leaves of this plant have traditionally been used in folk medicine to treat various health conditions, mainly respiratory and gastrointestinal disorders [1]. Due to their beneficial effects, which nowadays can be attributed to various biological activities of leaf extracts and essential oils including antioxidant [2,3], anti-inflammatory [4,5], antimicrobial and antifungal [6,7], the chemical composition of Laurus nobilis L. leaves has been studied to a greater extent than that of other plant parts. Laurus nobilis L. leaves comprise the aforementioned essential oils, alkaloids, norisoprenoids, sugars, polysaccharides, organic acids, tocopherols and a wide range of polyphenols including different flavonoids, phenolic acids, tannins and lignans [8]. Polyphenols are a group of compounds that are of particular interest due to their redox properties, as they can act as antioxidant agents [9] and, thus, are largely responsible for the antioxidant activity of Laurus nobilis L. [3,10,11]. Plant material usually contains a wide range of polyphenols, including simple to highly polymerized compounds which can also be conjoined with various other components, making their recovery a challenging process [12]. Establishing an optimal methodology for the isolation of polyphenols is a crucial step for the utilization of their beneficial properties, and various techniques can be applied in order to achieve their effective recovery. Conventional extraction techniques, such as heat-reflux, although easily applicable, are often time-, energy- and solvent-consuming with difficulties when it comes to scale-up processes [13]. These techniques also carry the risk of thermal degradation of heat-sensitive polyphenolic compounds [14]. In recent years, advanced green extraction techniques, such as microwave-assisted (MAE) and ultrasound-assisted extraction (UAE), have been in focus when it comes to the extraction of polyphenols from different plant materials [15,16,17,18,19]. The main advantage of both MAE and UAE over conventional heat-reflux extraction (CRE) is the reduction in extraction time, resulting in lower solvent consumption and higher extraction efficiency along with less thermal degradation of sensitive compounds [20,21]. In MAE, the dipole rotation induced by the electromagnetic wave radiation leads to homogeneous heating of the sample, which leads to disruption of the plant cell and release of the targeted compounds from the plant matrix [22]. In UAE, the cell disruption is caused by ultrasonic waves, which generate cavitation bubbles that burst near the sample tissue. The distribution of ultrasonic waves is not homogenous and the wave power decreases with the increase in distance between the sample and radiating surface, which is why shaking and agitation are useful during UAE [23]. The efficiency of both MAE and UAE depends on their parameters (e.g., extraction time, temperature, solvent type, microwave power (MAE), frequency and amplitude of ultrasonic waves (UAE)), which should be chosen with respect to the properties of the plant material and the targeted compounds. In addition to the isolation of polyphenols, chemical characterization of the obtained extracts, including the identification and quantification of individual compounds and evaluation of their antioxidant capacity, is also of great interest. Combined chromatographic and spectral techniques, such as UPLC-MS/MS, have been shown to be the most effective for chemical characterization of even the most complex of polyphenolic structures such as flavonoid glycosides and proanthocyanidins [24]. Antioxidant capacity can be determined using several assays divided into two categories: single electron transfer (SET) assays (DPPH, FRAP, ABTS) and hydrogen atom transfer (HAT) assays (ORAC, TRAP, TOSC, CL) [25]. ORAC (oxygen radical absorbance capacity) is a method that uses the most biologically prevalent peroxyl radical as a source of free radicals [26] and can measure both hydrophilic and lipophilic antioxidants [27], making it one of the most significant assays in terms of its biological relevance. Therefore, ORAC has been established as an assay of choice for determining the antioxidant capacity of plant material and food.
The aim of this research, therefore, was to investigate the influence of different extraction parameters in MAE (solvent, temperature, extraction time and microwave power) and UAE (solvent, extraction time and amplitude) on the total phenolic content of Laurus nobilis L. leaf extracts and to establish optimal extraction conditions for both extraction techniques. Moreover, data on the polyphenolic profile of Laurus nobilis L. leaves obtained by MAE and UAE are scarce [28,29,30], and, to our knowledge, no comparison of the polyphenolic profiles obtained between the two techniques has been reported so far. Hence, the aim of this research was to determine and compare the UPLC-MS/MS polyphenolic profile of the extracts obtained with MAE, UAE and CRE and to determine their antioxidant capacity using the ORAC assay.

2. Materials and Methods

2.1. Chemicals and Reagents

Ethanol (96%) was purchased from Lach-ner (Neratovice, Czech Republic), HPLC grade acetonitrile from J.T. Baker Chemicals (Deventer, Netherlands) and formic acid (98–100%) from T.T.T. d.o.o. (Sveta Nedjelja, Croatia). Distilled water was purified by Milli-Q water purification system (Millipore, Bedford, MA, USA). Folin–Ciocalteu reagent was obtained from Merck (Darmstadt, Germany), anhydrous sodium carbonate (≥99.5%) and sodium phosphate (96%) from Kemika (Zagreb, Croatia), 6-hydroxy-2,5,7,8-tetramethylchroman-2-carboxylic acid (Trolox) from Acros Organics (Thermo Fisher Scientific, Geel, Belgium), 2,20-Azobis (2-amidinopropane) hydrochloride from Sigma-Aldrich (Steinheim, Germany) and fluorescein sodium salt from Honeywell Riedel-de-Haën (Bucharest, Romania). Authentic standards of quercetin-3-glucoside, myricetin, caffeic acid, gallic acid, ferulic acid, protocatechuic acid, syringic acid, rosmarinic acid, chlorogenic acid and p-coumaric acid were purchased from Sigma-Aldrich (St. Louis, MO, USA). Catechin, epigallocatechin gallate, epicatechin gallate, kaempferol-3-glucoside, rutin, apigenin, procyanidin B2 and luteolin were procured from Extrasynthese (Genay, France). All standards were prepared as methanol stock solution except apigenin, which was dissolved in ethanol with 0.5% (v/v) dimethyl sulfoxide. Working standard solutions were prepared by dilution of the stock solutions to produce five concentrations.

2.2. Plant Material

A sample of dry leaves of Laurus nobilis L., collected in November 2020 in the Rijeka region, Croatia, was purchased from Šafram d.o.o (Zagreb, Croatia). The dry leaves were stored at room temperature and ground into fine powder using an electric grinder (GT11, Tefal, Rumilly, France) before extraction. The obtained powder was analyzed for total solids by drying to constant mass at 103 ± 2 °C [31]. Content of dry matter in the sample was >95%.

2.3. Conventional Heat-Reflux Extraction (CRE)

The polyphenols of Laurus nobilis L. leaves were extracted from 1 g of ground sample with 40 mL of aqueous ethanol solution (50% and 70% v/v) in a flat bottom Erlenmeyer flask. The solvents for all extractions were selected based on previous literature reports showing that 50% and 70% aqueous ethanol were suitable for isolation of polyphenols from Laurus nobilis leaves and similar plant material [29,32]. The mixture was extracted with reflux for 30 min, filtered through Whatman No. 40 filter paper (Whatman International Ltd., Kent, UK) and made up to 50 mL in volumetric flasks with the extraction solvent. The extracts were transferred into plastic Falcon tubes and stored at −18 °C in nitrogen gas atmosphere. All extracts were prepared in duplicate.

2.4. Microwave-Assisted Extraction (MAE)

The MAE of polyphenols from Laurus nobilis L. leaves was performed using Ethos Easy (Milestone, Italy) microwave reactor. General extraction parameters: the time required to achieve extraction temperature, stirring and ventilation after extraction were kept constant at 2 min, 50% and 1 min, respectively. The varied extraction parameters were temperature (40, 60 and 80 °C), microwave power (400 and 800 W) and time (5, 10 and 15 min). For each extraction, 1 g of ground sample was mixed with 40 mL of ethanol solution in the extraction vessel with a magnetic stirrer and placed into the microwave reactor. After cooling at room temperature, the obtained extracts were filtered through Whatman No. 40 filter paper into 50 mL volumetric flasks, made up to volume with solvent, transferred into plastic Falcon tubes and stored at −18 °C in nitrogen gas atmosphere. All extracts were prepared in duplicate.

2.5. Ultrasound-Assisted Extraction

For the UAE of polyphenols from Laurus nobilis L. leaves, 1 g of ground sample was mixed with 40 mL of the extraction solvent in a glass beaker. UAE was performed using an ultrasonic processor (UP) 400 S (Dr. Hielscher GmbH, Teltow, Germany) that has maximal nominal output power 400 W and the ultrasonic frequency 24 kHz. The UP is equipped with an ultrasonic probe (surface 3.8 cm2), which was immersed 1 cm into the beaker with sample mixture. The varied parameters were extraction time (5, 10 and 15 min) and amplitude (50, 75 and 100%). The temperature was monitored using an infrared thermometer and it did not exceed 30 °C, which was achieved by placing the beaker in a cooling bath with ice during the extraction. The extracts were filtered through Whatman No. 40 filter paper, made up to 50 mL in volumetric flasks, transferred to plastic Falcon tubes and stored at −18 °C in nitrogen gas atmosphere. All extracts were prepared in duplicate.

2.6. Determination of Total Phenolic Content

Total phenolic content of Laurus nobilis L. leaves was determined by the spectrophotometric Folin–Ciocalteu method previously described by Shortle et al. (2014) [33] with some modifications. A 100 µL aliquot of sample extract (solvent extraction for blank) was mixed with 200 µL Folin–Ciocalteu reagent and 2 mL distilled water. After 3 min, 1 mL of 20% w/v sodium carbonate solution was added into the mixture. After tempering for 25 min at 50 °C in a water bath, the absorbance was read at 765 nm. All measurements were performed in duplicate. A gallic acid standard calibration curve (y = 0.0035x, R2 = 0.9995) was prepared from working standard solutions in concentration range from 50 to 500 mg L−1. Total phenolic content (TPC) of the samples was calculated and expressed as mean value in mg gallic acid equivalents (GAE) per g of sample ± standard deviation.

2.7. Identification and Quantification of Polyphenols

Identification and quantification of polyphenols in extracts obtained at optimized conditions were performed on UPLC-MS/MS in positive and negative ionization mode on Agilent 6430 Triple Quad LC/MS mass spectrometer (Agilent, Santa Clara, CA, USA) connected to UPLC system (Agilent series 1290 RRLC instrument) consisting of binary pump, autosampler and a column compartment thermostat. Ionization of the analytes was performed by ESI ion source and nitrogen was used as desolvation and collision gas with following parameters: drying gas temperature 300 °C, flow rate 11 L h−1, capillary voltage 4000/−3500 V and the nebulizer pressure 40 psi. Agilent’s Zorbax Eclipse Plus C18 column (100 × 2.1 mm; particle size 1.8 µm) was used for separations with following conditions: column temperature 35 °C, injection volume 2.5 µm. The composition of solvents as well as gradient conditions that were used were previously described by Elez Garofulić et al. (2018) [34]. Instrument control and data processing was performed using Agilent MassHunter Workstation Software (ver. B.04.01). The identification and quantitative determination was carried out on the basis of the calibration curves of the standards: myricetin, caffeic acid, gallic acid, ferulic acid, protocatechuic acid, syringic acid, rosmarinic acid, chlorogenic and p-coumaric acid, quercetin-3-glucoside, quercetin-3-rutinoside, kaempferol-3-glucoside, catechin, epigallocatechin gallate, epicatechin gallate, apigenin, procyanidin B2 and luteolin. For compounds lacking reference standards, identification was based on mass spectral data and literature reports of mass fragmentation patterns, while quantification was performed as follows: kaempferol-3-rutinoside, kaempferol-3-O-hexoside, kaempferol-3-O-deoxyhexoside and kaempferol-3-O-pentoside were calculated according to kaempferol-3-glucoside, apigenin-6-C-(O-deoxyhexosyl)-hexoside according to apigenin, luteolin-6-C-glucoside according to luteolin, isorhamnetin-3-hexoside, quercetin-3-rhamnoside and quercetin-3-pentoside according to quercetin-3-glucoside, epicatechin according to catechin, 3,4- dihydroxybenzoic acid hexoside according to protocatehuic acid while p-hydroxybenzoic acid was calculated as gallic acid equivalent. Quality parameters for the analytical method, including calibration curves, instrumental detection (LOD) and quantification (LOQ) limits, were reported previously [34]. Concentrations of analyzed compounds were expressed as mg per 100 g of sample as mean value ± standard deviation. All analyses were performed in duplicate.

2.8. Oxygen Radical Absorbance Capacity (ORAC) Assay

The oxygen radical absorbance capacity (ORAC) assay was carried out on an automated plate reader (BMG LABTECH, Offenburg, Germany) following a previously reported method [35] and the data analysis was performed using MARS 2.0 software. In total, 75 μM phosphate buffer (pH 7.4) was used for preparation of 240 mM 2,20-Azobisradical (2-amidinopropane) dihydrochloride (AAPH) solution, 70.3 nM fluorescein solution and different dilutions (3.12–103.99 μM) of 6-hydroxy-2,5,7,8-tetramethylchroman-2-carboxylic acid (Trolox). Briefly, Trolox standard or appropriately diluted sample were added into a 96-well microplate containing 150 µL of fluorescein and the plate was incubated at 37 °C for 30 min. After the first three cycles (baseline signal), AAPH solution was injected to generate the peroxyl radical. During the total measurement period (120 min), the fluorescence intensity (excitation at 485 nm and emission at 528 nm) was monitored every 90 s. Determinations were performed in duplicate (n = 4) and the results were expressed as μmol Trolox equivalent (TE) per g of sample as mean value ± standard deviation.

2.9. Statistical Analysis

Statistica ver. 10.0 software (StatSoft Inc., Tulsa, OK, USA) was used for statistical analysis. Total phenolic content was the dependent variable, while the independent variables were: (a) solvent (50% and 70% ethanol) for all extraction techniques, (b) time (MAE and UAE, 5, 10 and 15 min), (c) temperature (40, 60 and 80 °C) and microwave power (400 and 800 W) for MAE and (d) amplitude (50, 75 and 100%) for UAE. Multifactorial analysis of variance (MANOVA) was used for the continuous variable analysis while marginal means were compared using Tukey’s HSD multiple comparison test. One-way analysis of variance (ANOVA) and post-hoc Tukey’s HSD multiple comparison test was carried out for comparison of the ORAC values, and individual and total phenolic contents obtained by CRE, MAE and UAE. All of the tests were significant at p ≤ 0.05.

3. Results and Discussion

This study examined the influence of different extraction parameters of MAE and UAE on the content of polyphenols in Laurus nobilis L. leaf extracts compared to conventional heat-reflux extraction. The total phenolic content of the obtained extracts was measured by the Folin–Ciocalteu spectrometric method (Table 1) and the optimal extraction conditions were determined by statistical analysis. The identification and quantification of polyphenols in extracts obtained at optimized extraction conditions was assessed by UPLC-MS/MS and their antioxidant capacity was characterized by ORAC assay.
The total phenolic content of the Laurus nobilis L. leaf extract obtained by CRE was 42.21−42.35 mg GAE g−1, which is higher than the 10.23 mg GAE g−1 reported by Muniz-Marquez et al. (2014) [11] and similar to the 46.79 mg GAE g−1 reported by Lu et al. (2011) [36]. The total phenolic content obtained by MAE ranged from 30.88 to 53.57 mg GAE g−1, which is higher than the 10.63 mg GAE g−1 reported by Muniz-Marquez et al. (2018) [29] and the 21.56 mg GAE g−1 reported by Rincon et al. (2019) [37]. The values of total phenolic content obtained by UAE ranged from 24.43 to 36.74 mg GAE g−1 which is higher than the 17.32 mg GAE g−1 reported by Muniz-Marquez et al. (2013) [28] and similar to the 24.77 mg GAE g−1 reported by Rincon et al. (2019) [37].

3.1. Conventional Heat-Reflux Extraction (CRE)

The influence of ethanol concentration used for MAE and UAE (50% and 70%) on the yield of polyphenols was also examined in extracts obtained by CRE (Table 2). It was shown that ethanol concentration had no statistically significant influence on the yield of polyphenols, which was also observed in the conventional extraction of polyphenols from Olea europaea L. leaves [38] with 50% and 70% aqueous ethanol, as well as in the conventional extraction of polyphenols from Limnophila aromatica [39] when 50% and 75% aqueous ethanol were used. Therefore, 50% aqueous ethanol solution was chosen as optimal to obtain maximum total phenolic content in the Laurus nobilis L. leaf extracts obtained by CRE.

3.2. Microwave-Assisted Extraction (MAE) Optimization

Ethanol concentration (50 and 70%), temperature (40, 60 and 80 °C), time (5, 10 and 15 min) and microwave power (400 and 800 W) were varied during MAE of polyphenols from Laurus nobilis L. leaves. The obtained results were statistically analyzed and the results are shown in Table 2. There was no statistically significant difference in the total phenolic content of the extracts obtained with 50 and 70% aqueous ethanol. Lovrić et al. (2017) reported the same observation during MAE of polyphenols from Prunus spinosa L. flowers [40], while Shang et al. (2020) [41] reported a higher total phenolic content of the Lithocarpus polystachyus Rehd. extracts obtained with 60% ethanol in comparison to 50% ethanol. In addition, Ismail-Suhaimy et al. (2021) [42] reported an increase in total phenolic content of Barleria lupulina L. extracts with the increase in ethanol concentration from 40% to 80%. On the other hand, Dahmoune et al. (2015) [43] observed a decline in total phenolic content in Myrtus communis L. leaf extracts with the increase in ethanol concentration from 40% to 60%. The differences in the results obtained by these authors might be attributed to different content and polarity of polyphenols of the investigated plants considering the ‘‘like dissolves like’’ principle and the fact that the polarity of the hydroethanolic solvent mixtures depends on the ethanol–water ratio [44].
Temperature plays a key role in MAE by influencing the desorption rate, solubility and degradation of targeted compounds. Most often, elevated temperatures result in higher extraction yields due to increased diffusion of the solvent into the plant matrix and enhanced solubility and desorption of the targeted compounds from the matrix [45]. However, degradation of heat-sensitive compounds may occur when higher temperatures are applied [46]. The influence of temperature on the total phenolic content of Laurus nobilis L. leaf extracts was significant (p ≤ 0.01). Increasing the temperature from 40 to 80 °C resulted in higher total phenolic content of the obtained extracts. This is in accordance with the aforementioned effects of elevated temperature, with the absence of degradation effects since different plant extracts and standard solutions of phenolic compounds were shown to be relatively stable during exposure to temperatures in the range of 60–100 °C [47]. Other authors have also reported similar results. Dobrinčić et al. (2020) [48] reported a higher content of total phenolic compounds extracted from Olea europaea L. leaves with the increase temperature from 45 to 80 °C, while Putnik et al. (2016) [49] observed an increase in total phenolic content of Salvia officinalis L. extracts with the increase in temperature from 30 to 80 °C.
Generally, increased extraction time results in higher yields of targeted compounds until the optimal level of efficiency is achieved, after which the extraction yields may decrease due to degradation of thermolabile compounds [45]. In our study, extraction time significantly (p ≤ 0.01) influenced the total phenolic content of the extracts. Maximum total phenolic content was obtained after 10 min, which is in agreement with results reported by Muniz-Marquez et al. (2018) [29] where a maximum total phenolic content in Laurus nobilis L. leaf extract was achieved after 9 min of extraction. Saraktsianos et al. (2020) [50] reported that 10 min of MAE resulted in the highest total phenolic content of Sideritis raeseri, Sideritis scardica and Origanum vulgare L. extracts. Putnik et al. (2016) [49] also reported a maximum total phenolic yield of Salvia officinalis L. extracts after 10 min of MAE.
Microwave power is another important factor that enhances the extraction efficiency by increasing molecular interactions between the sample and the electromagnetic field [51]. However, degradation of some phenolic compounds may occur during prolonged exposure of the sample to a higher microwave power [52]. Microwave power was also a significant parameter (p ≤ 0.01) in the MAE of polyphenols from Laurus nobilis L. leaves. The total phenolic content of the extracts was lower when 800 W was applied compared to 400 W. Other authors also reported a decrease in total phenolic content in extracts of different plant material when microwave power higher than 600 W was applied [16,41,42,43].
Considering the results of statistical analysis, optimal MAE parameters for obtaining the highest content of polyphenols from Laurus nobilis L. leaves were: 50% ethanol, temperature 80 °C, time 10 min and microwave power 400 W.

3.3. Ultrasound-Assisted Extraction (UAE) Optimization

Ethanol concentration (50 and 70%), time (5, 10 and 15 min) and amplitude (50, 75 and 100%) were varied during the UAE of polyphenols from Laurus nobilis L. leaves and the statistically analyzed results are shown in Table 2. Ethanol concentration significantly (p ≤ 0.05) influenced the yield of the obtained polyphenols. A higher total phenolic content of the extracts was achieved in 70% ethanol, which is different than results reported by Muniz-Marquez et al. (2013) [28] where a maximum total phenolic content of 17.32 mg GAE g−1 from dry leaves in Laurus nobilis L. extracts obtained by UAE was achieved in 35% ethanol. The achieved total phenolic content in the mentioned study was significantly lower than those achieved under various conditions in our study. This difference might be attributed to a variation in the content of polyphenols in the plant material, possibly due to different phenological phases and environmental growth conditions such as soil quality and climate [53], as well as other extraction parameters including sample-to-solvent ratio, ultrasonic power and extraction time, which can affect the quality and quantity of targeted compounds [54]. Cao et al. (2021) [55], Bouadia-Madi et al. (2019) [56] and Ghitescu et al. (2015) [57] achieved maximum total phenolic content using 70% ethanol during UAE from Triarrhena lutarioriparia, Myrtus communis L. pericarp and Picea abies L. wood bark, respectively. These results are in accordance with our observations.
Extraction time is an important factor in UAE. Prolonged exposure of the sample to the solvent promotes the diffusion of targeted compounds, thus enhancing the extraction yield [58], but may also cause oxidation of phenolic compounds [59], so it is crucial to establish the optimal extraction time for the plant material of interest. Extraction time had a significant (p ≤ 0.01) effect on the total phenolic content of Laurus nobilis L. extracts obtained by UAE. The highest concentration of polyphenols was achieved after 10 min of sonication and prolongation of time to 15 min had no significant effect. This can be explained by the application of Fick’s second law of diffusion, which states that final equilibrium is established after a certain time between the solid and the bulk solution [60]. Muniz-Marquez et al. (2013) [28] observed the same trend of achieving maximum concentration at medium time value with no effect of further prolongation of time during the UAE of polyphenols from Laurus nobilis L. In accordance with our results, Falleh et al. (2012) [61] reported that 10 min of UAE was optimal for achieving the highest concentration of polyphenols from Mesembryanthemum edule L. Aizoaceae, while Bouadia-Madi (2019) [56] reported that 7.5 min was optimal for the UAE of polyphenols from Myrtus communis L. pericarp.
Amplitude is a parameter that indicates the height of the ultrasonic waves and represents the intensity of sonication that is transmitted to the plant material [62]. The cavitation effect of the ultrasonic waves enhances the extraction rate by increasing local temperature and pressure, which results in breakage of the plant material’s cell walls and improved mass transfer rate [63]. This effect is caused by the compression and rarefaction cycle of the waves that depends on their amplitude and, generally, a higher amplitude results in higher extraction efficiency [64]. In our study, the amplitude within the selected range had no significant effect on the total phenolic content of the obtained extracts. Borras-Enriquez et al. (2021) [19] reported the same results when a range of 30–90% amplitude was applied for the UAE of polyphenols from Mangifera indica L. var. Manililla residues. On the other hand, several authors reported a positive influence of higher amplitude on the yield of polyphenols from different plant material [48,56,65]. The different observations might be attributed to variations in the polyphenolic contents of different plant material. Moreover, in our study, the temperature was constantly kept under 30 °C, which might have reduced the effect of temperature provoked by higher amplitude on the mass transfer rate, thus resulting in the absence of amplitude influence on the concentration of the obtained polyphenols.
Based on the results of statistical analysis, the optimal parameters for the UAE of polyphenols from Laurus nobilis L. leaves were selected as follows: 70% aqueous ethanol, 10 min and 50% amplitude.

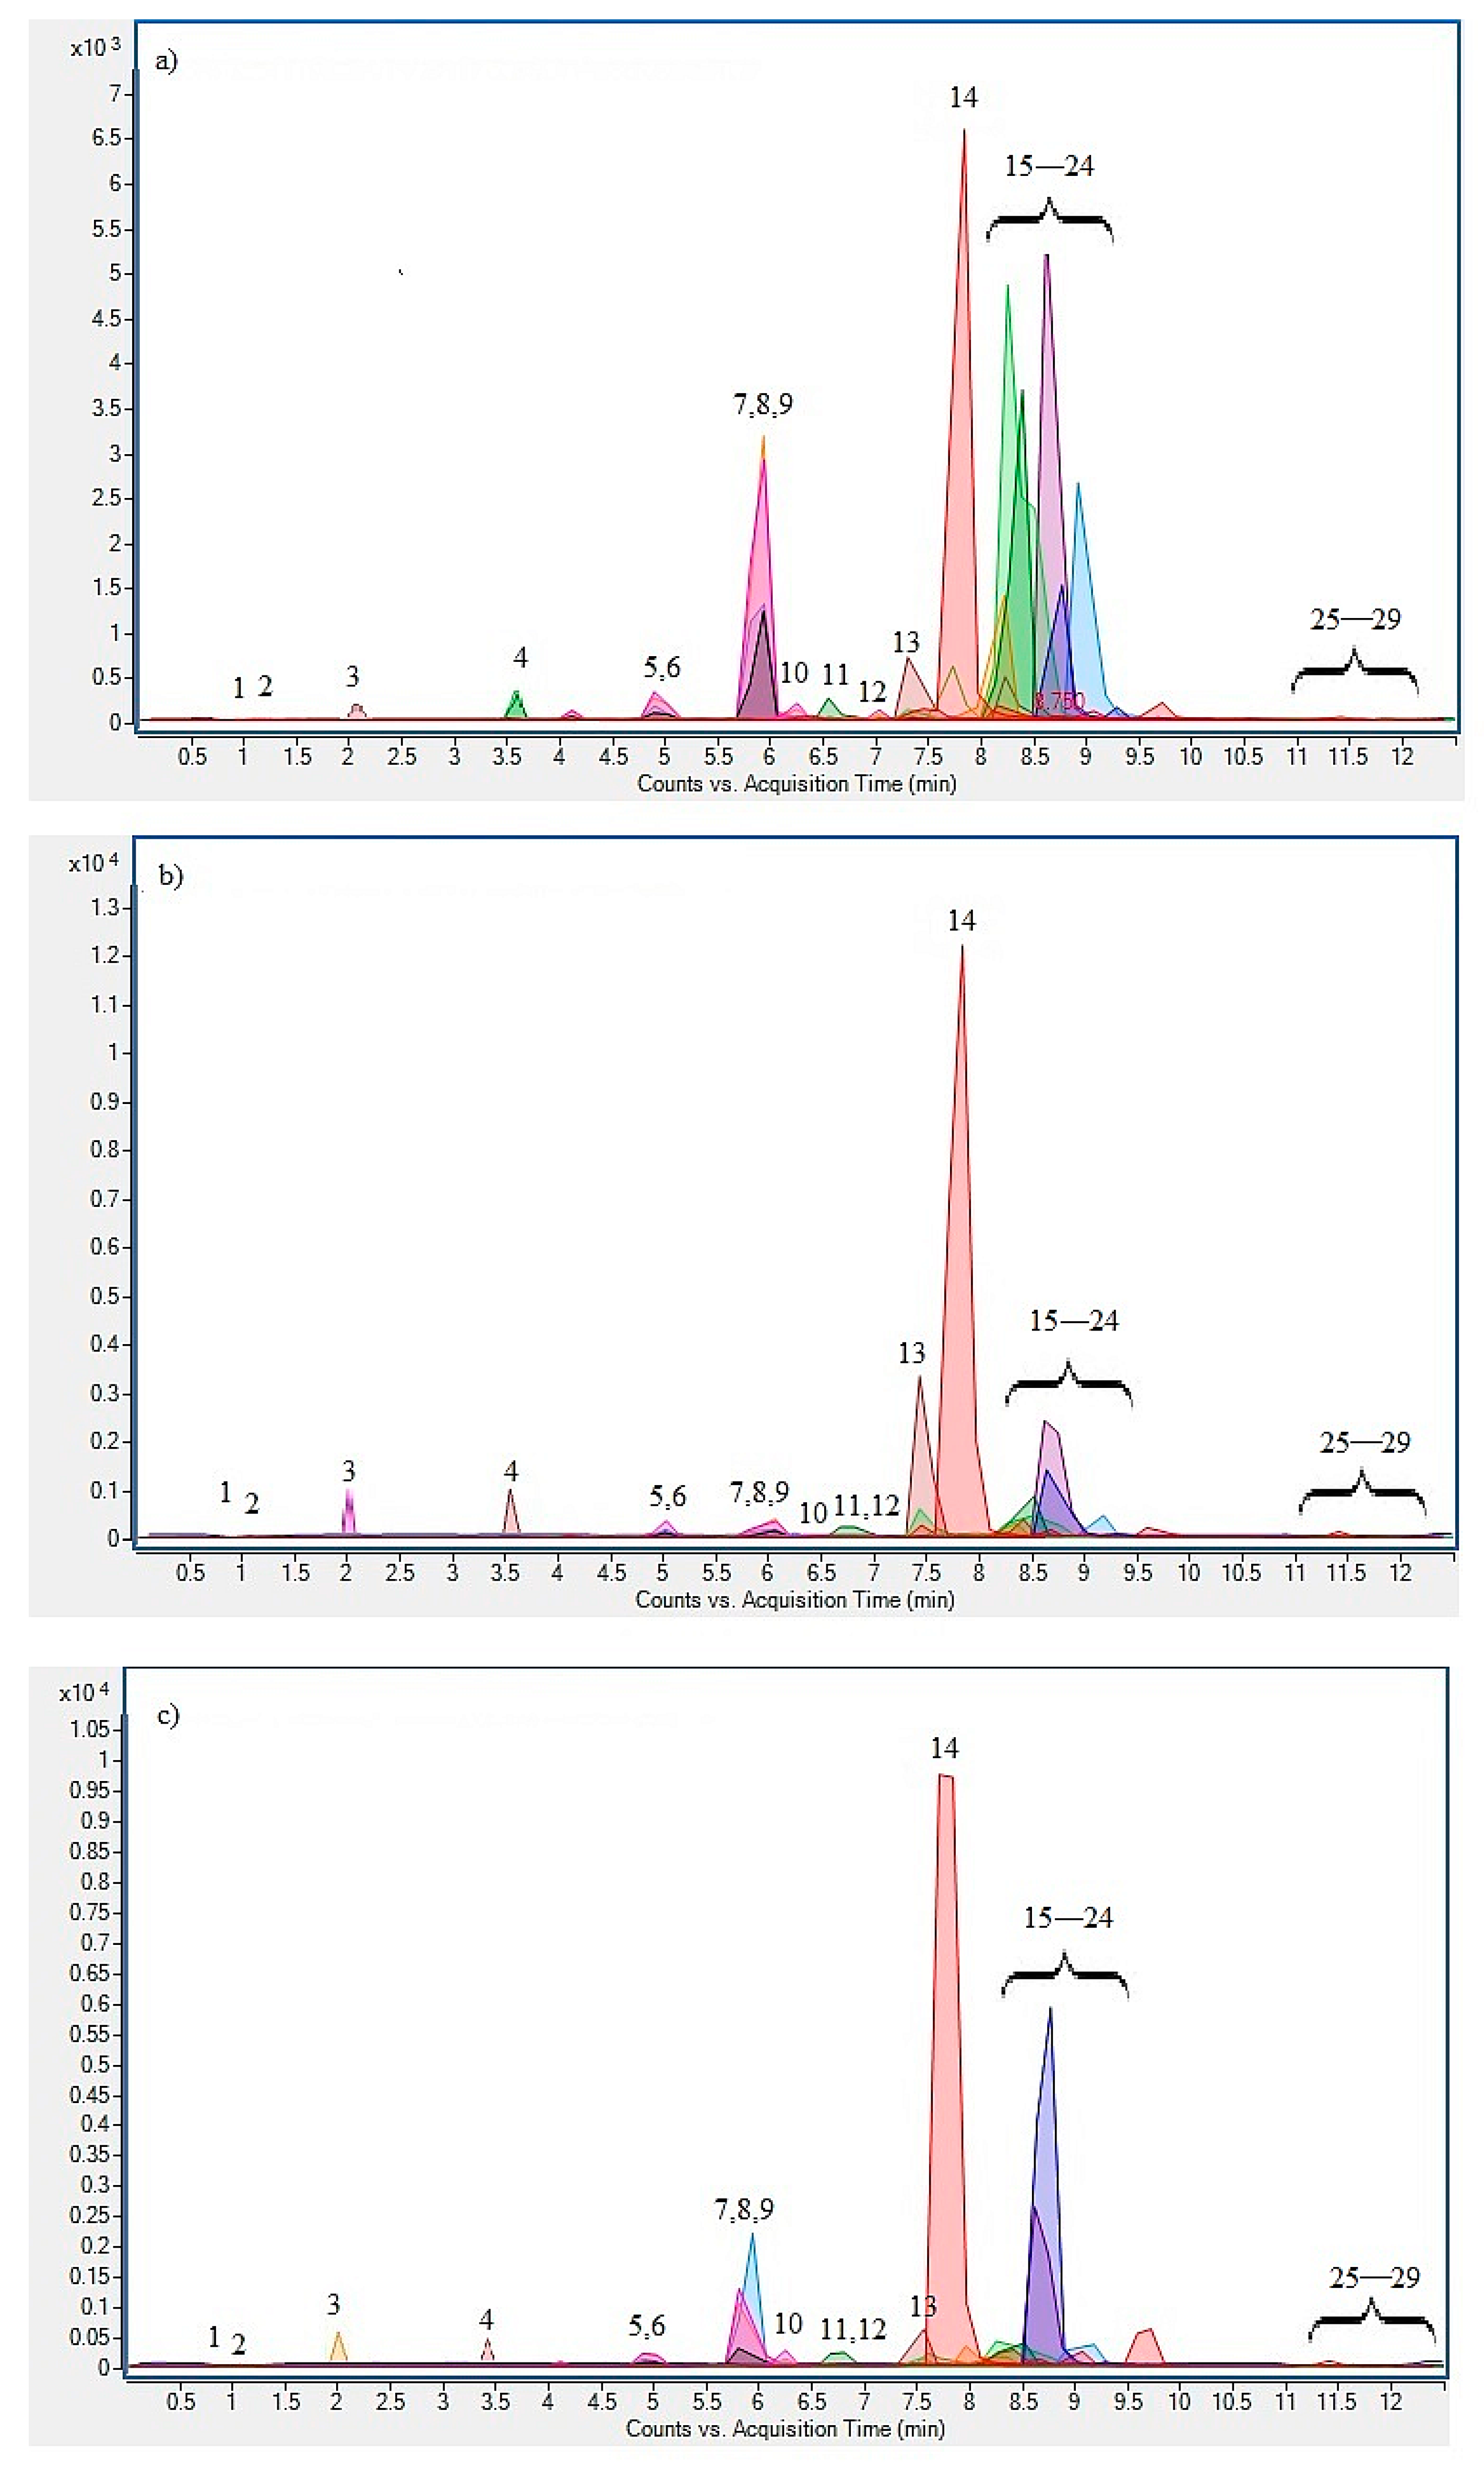
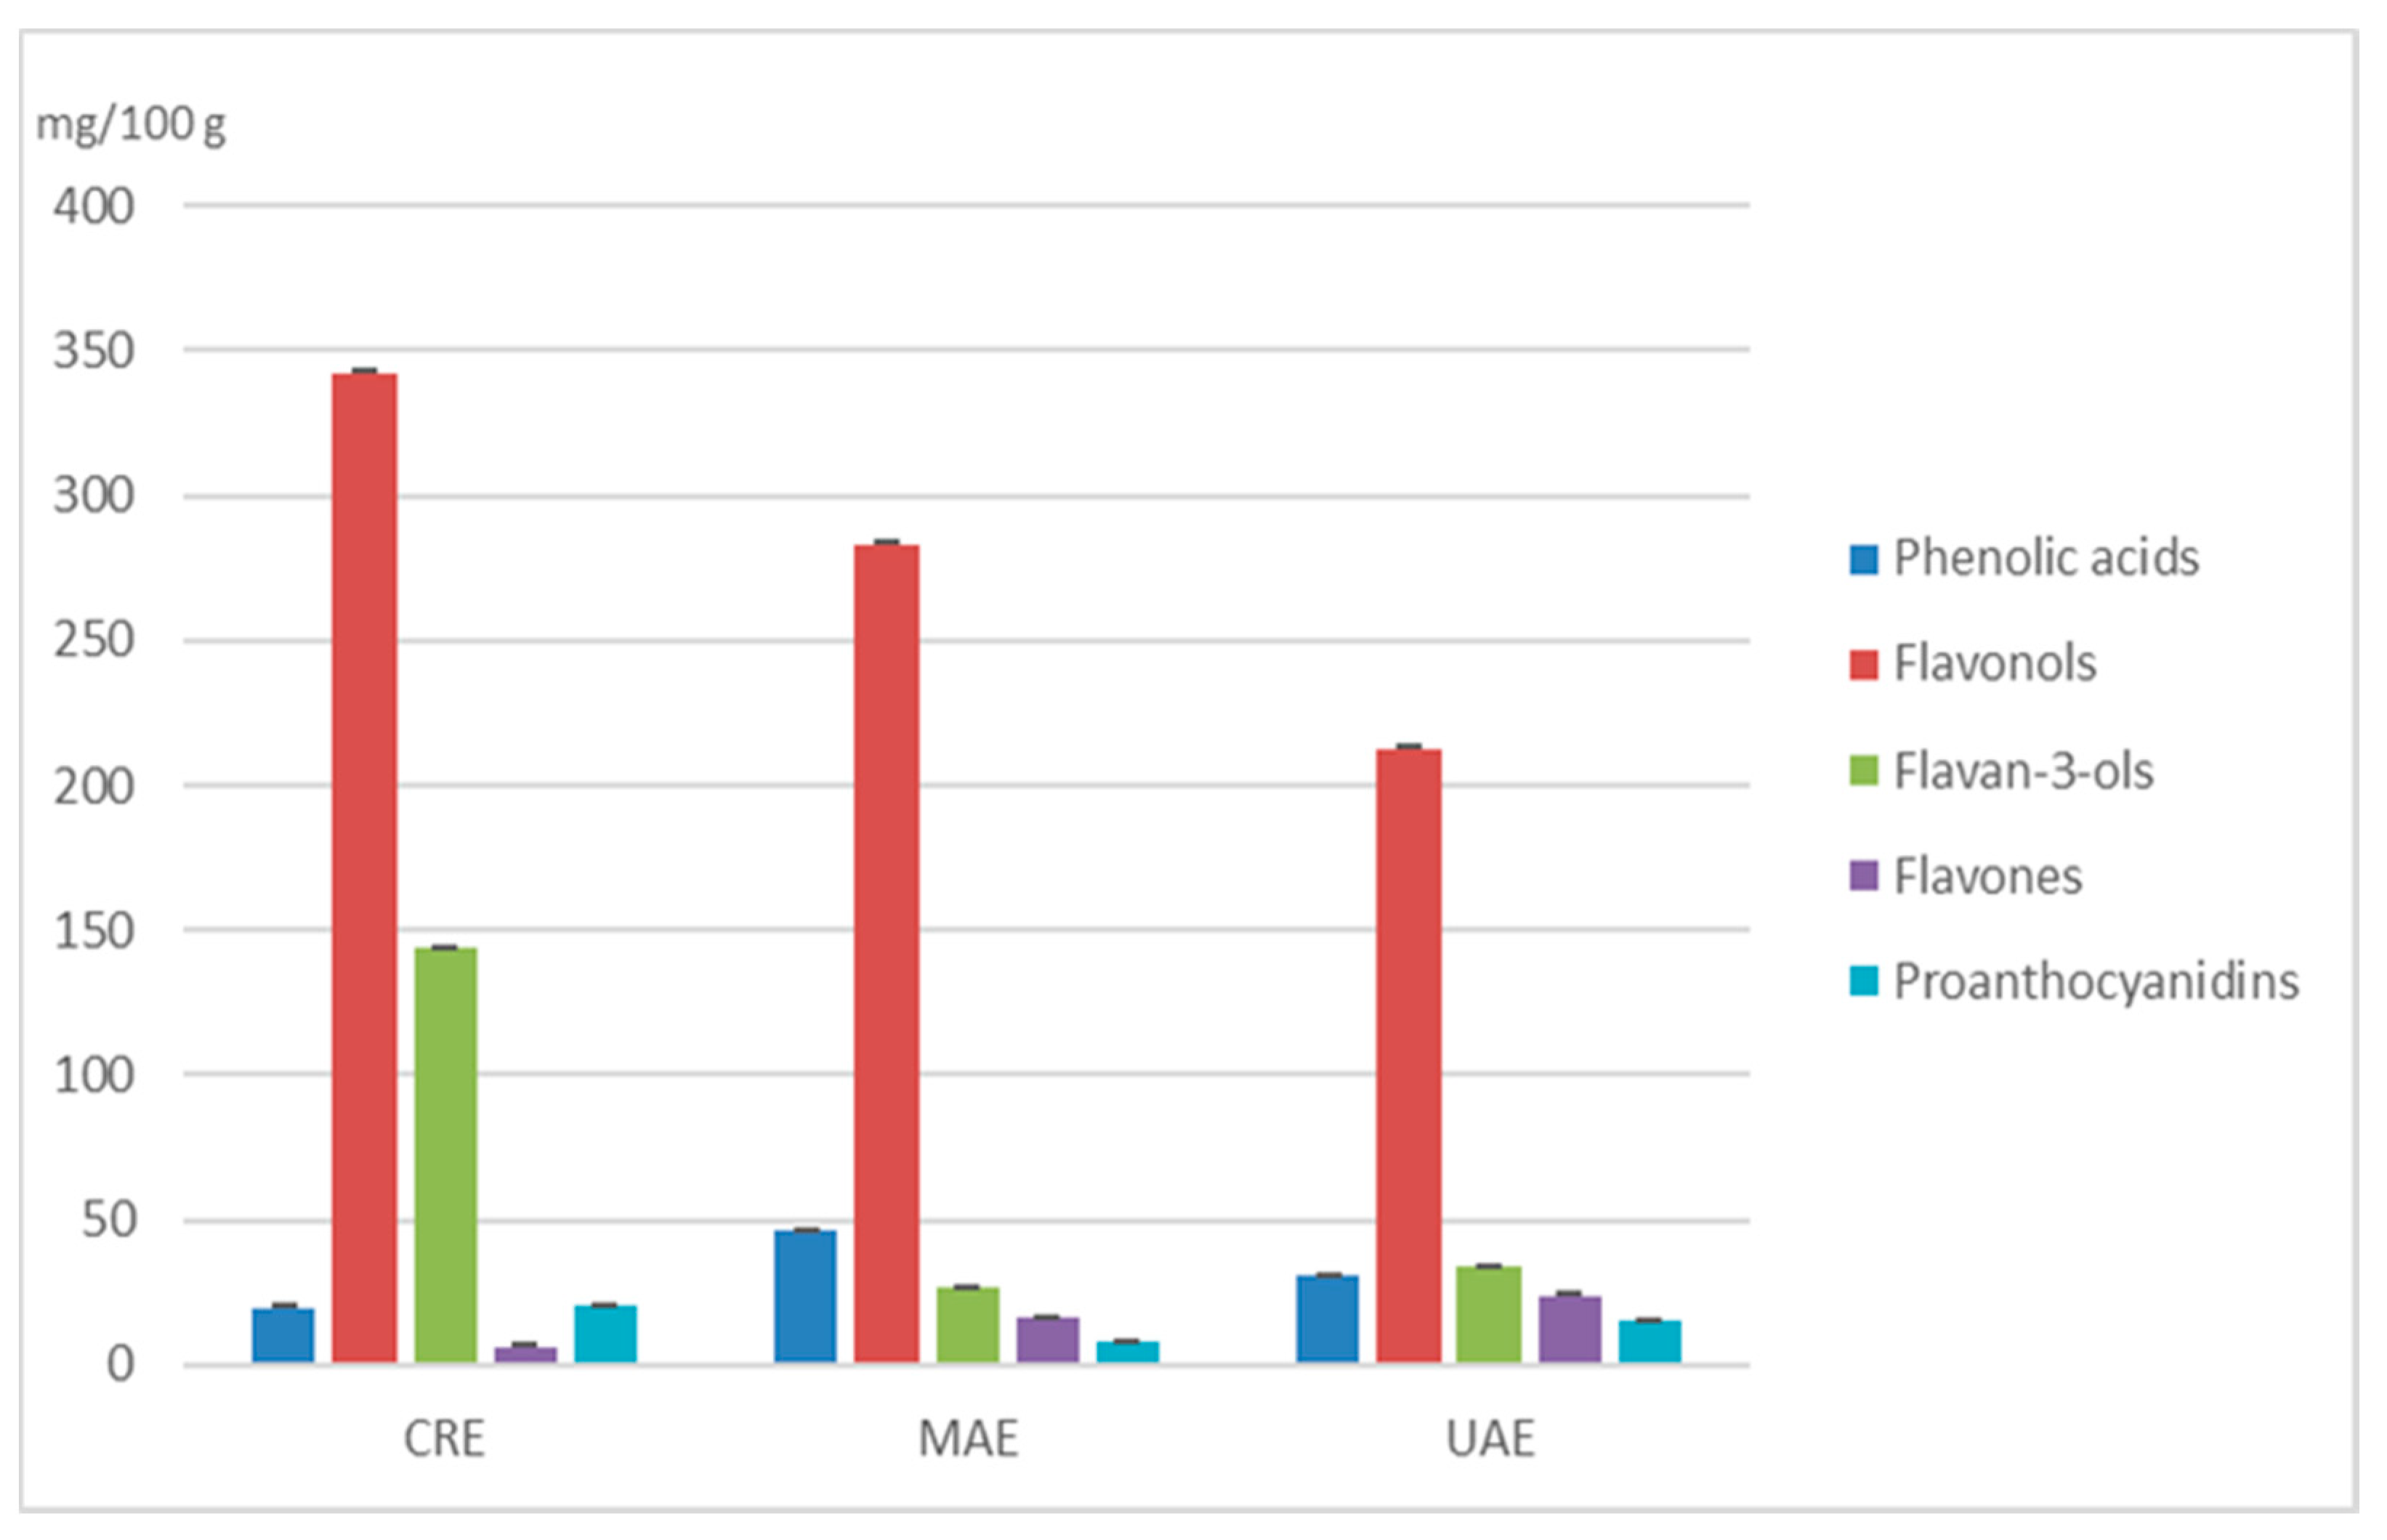
3.4. Polyphenolic Characterization

In order to investigate the polyphenolic profile of the Laurus nobilis L. leaf extracts obtained at defined optimal extraction parameters, UPLC/MS-MS analysis was carried out (Table 3). A total of 29 phenolic compounds, consisting of phenolic acids, flavonols, flavan-3-ols, flavones and proanthocyanidins, were identified in extracts obtained by all three extraction techniques (Figure 1).
Among the phenolic acids, compounds 1, 2, 4, 5, 7, 13, 17 and 25 were identified through comparison with authentic standards as rosmarinic, syringic, protocatechuic, chlorogenic, caffeic, p-coumaric, ferulic and gallic acid, respectively. Compound 3 was tentatively assigned as 3,4-dihidrobenz-A hexoside based on a fragment ion at 153 m/z and fragmentation loss of -162 amu, characteristic of hexose residue [66]. Compound 6 was assigned as p-hydroxybenzoic acid due to the previously described fragmentation pattern [67]. All of the detected phenolic acids were previously found in Laurus nobilis L. leaves in varying amounts [30,68,69,70]. Among the flavonols, compounds 14 and 28 were identified through comparison with authentic standards as rutin and myricetin. Compounds 12, 19, 21 and 24 were distinguished by a specific fragment ion at m/z 287 consistent with kaempferol. They were tentatively assigned, due to the specific loss of sugar moieties, as kaempferol-3-O-deoxyhexoside (deoxyhexose -146 amu), kaempferol-3-rutinoside (rhamnose −146 amu; glucose −162 amu), kaempferol-3-glucoside (glucose −162 amu) and kaempferol-3-pentoside (pentose −132 amu) [35], respectively. Compounds 16, 20 and 23 were tentatively assigned as quercetin-3-glucoside, quercetin-3-pentoside and quercetin-3-rhamnoside due to a characteristic fragment ion at m/z 303 and specific loss of sugar moieties: glucose (−162 amu), pentose (−132 amu) and rhamnose (−146 amu), respectively. Compound 17 was identified by a precursor ion at m/z 479 and fragment ion at m/z 317 corresponding to the loss of hexose (−162 amu) as isorhamnetin-3-hexoside.
Flavonols, mainly kaempferol and quercetin glycosides, were the most abundant compounds detected in our study. This is in accordance with previous reports that have shown the presence of various flavonol glycosides in Laurus nobilis L. leaves, kaempferol glycosides being the most diverse [8,71]. To our knowledge, the presence of myricetin in Laurus nobilis L. leaves was only reported by Stefanova et al. (2020) [69] in leaves grown in Greece and Georgia. In their study, the amount of myricetin was comparable to that of quercetin, while in our study it was significantly lower. As for flavan-3-ols, compounds 9, 27 and 29 were identified through comparison with authentic standards as catechin, epicatechin gallate and epigallocatechin gallate, respectively. Compound 8 was tentatively assigned as epicatechin due to a precursor ion at m/z 291 and fragment ion at m/z 139. All detected flavan-3-ols have previously been found in Laurus nobilis L. leaves [3,70,72,73]. Catechin and epicatechin were the most abundant with similar concentrations, which is in agreement with results reported by Vallverdu-Queralt et al. (2014) [70].
Among flavones, compounds 15 and 18 were identified through comparison with authentic standards as apigenin and luteolin. Compound 11 was tentatively assigned as luteolin-6-C-glucoside due to a precursor ion at m/z 449 and fragment ion at m/z 329 corresponding with the loss of −120 amu, characteristic for hexose residue in C-glycosylation [74]. Different authors have reported the presence of these flavones in Laurus nobilis L. leaves [3,30,69]. Compound 26 was tentatively identified as apigenin-6-C-(O-deoxyhexosyl)-hexoside due to a precursor ion at m/z 579 and fragment ion at m/z 459 consistent with the fragmentation pattern previously described by Pacifico et al. (2014) [68] during the identification of phenolic compounds in Laurus nobilis L. leaves. Among proanthocyanidins, only compound 10 was detected and tentatively assigned as procyanidin trimer due to a precursor ion at m/z 865 and fragment ion at m/z 713 produced by previously described retro Diels–Alder (RDA) fission of the heterocyclic ring system subunits [75]. Vinha et al. (2015) [10] reported the presence of various proanthocyanidins in Laurus nobilis L. leaves, with dimeric proanthocyanidins being the most abundant, followed by trimers. Dias et al. (2014) [3] also confirmed the presence of different proanthocyanidins, including procyanidin trimer with the same fragmentation pattern as in our study.
The highest total concentration of phenolic compounds, according to UPLC-MS/MS results, was achieved in the extract obtained by CRE. Even though the MAE and UAE are generally considered to increase the phenolic content of plant extracts, it is possible that the application of microwaves and ultrasonic waves resulted in the degradation of certain constituents in Laurus nobilis L. leaves. The concentration of flavonols and flavan-3-ols was significantly higher in CRE extracts than in MAE and UAE extracts (Figure 2). The presence of hydroxyl-substituents in these compounds [76] was shown to increase the degradation of polyphenols caused by microwaves [20], which could explain the lower concentration obtained by MAE. As for UAE, it was shown that a frequency over 20 kHz might cause the degradation of phenolic compounds [21]. This can occur due to the increased generation of hydrogen atoms (H) and hydroxyl radicals (OH*), which promote the decomposition and polymerization of polyphenolic compounds [54]. The mentioned generation of free radicals can also influence biological activity of the extracts obtained by UAE [77]. On the other hand, another possible explanation for CRE suitability is related to plant material properties. Laurus nobilis L. leaves are stiff and leathery, so their firm structure allows the application of more intense extraction conditions, such as in CRE, providing better extraction yield in terms of polyphenols.
The total phenolic content in the extracts determined by the Folin–Ciocalteu (FC) spectrometry method was significantly higher than that revealed by the UPLC-MS/ MS analysis, which can be explained by the fact that some non-phenolic compounds, such as various polysaccharides, sugars and organic acids, present in the leaves of Laurus nobilis L. [8], are known to be detectable by spectrophotometer, resulting in a higher reported polyphenolic concentration [25,78]. In addition, El-Hamidi et al. (2016) [79] reported the interaction of chlorophyll with the Folin–Ciocalteu reagent, leading to an apparent increase in the total polyphenol content of chlorophyll-rich plants, which provides an additional explanation for the observed differences between polyphenol content determined by the spectrophotometric and chromatographic techniques.

3.5. Antioxidant Capacity

The oxygen radical absorbance capacity (ORAC) assay was performed on the extracts obtained at defined optimal extraction conditions in order to determine their antioxidant capacity. As shown in Table 3, the antioxidant capacity of the extracts obtained by CRE, MAE and UAE ranged between 86.04 and 100.09 μmol TE g−1, showing that a similar antioxidant capacity can be achieved with less time and energy expenditure since the extraction time at optimal MAE and UAE conditions was three times shorter than in CRE, which is important for potential scale-up processes. The antioxidant capacity of Laurus nobilis L. leaves determined by ORAC assay reported in the literature has varied significantly. For example, Zheng et al. (2001) [80] reported the value of 37.7 μmol TE g−1 for phosphate buffer (75 mM, pH 7) Laurus nobilis L. leaf extract where the total phenolic content was also significantly lower than in our study (4.04 mg GAE g−1). On the other hand, Kratchanova et al. (2010) [81] reported a higher ORAC value of 170 μmol TE g−1 for a water extract with the total phenolic content of 17.66 mg GAE g−1, which is lower than in our study. Moreover, Kim and Kim (2021) [82] and Dudonne et al. (2009) [83] reported significantly higher ORAC values of 2600 μmol TE g−1 in DMSO extract and 2963 μmol TE g−1 in a water extract, with total phenolic contents similar to those in our study, 44.07 and 59.85 mg GAE g−1, respectively. There are several explanations for the discrepancies between the total phenolic contents, which were shown to correlate with the antioxidant capacity in Laurus nobilis L. leaf extracts [30,81], and the reported ORAC values. First, different environmental growth factors, harvesting season and the choice of the extraction method could have influenced the presence of other non-phenolic antioxidants such as tocopherols organic acids and volatile compounds in the extracts [8]. Moreover, the possible synergistic or antagonistic mechanisms between the constituents in the extracts cannot be represented solely by the amount of total polyphenols present, so further qualitative research in this regard is needed [84,85]. Apart from influencing the presence of non-phenolic compounds, the previously mentioned factors could have also influenced the content of individual polyphenolic compounds whose antioxidant capacity may differ significantly depending on their structural features [86]. This effect can be observed in the results of our study since the extracts obtained by CRE showed slightly higher antioxidant capacity than those obtained by both MAE and UAE that can be brought into connection with the concentration of flavonols and flavan-3-ols determined by the UPLC/MS-MS, which were shown to influence the antioxidant activity [87], as well as procyanidin trimer content, which was the highest of the CRE extracts. It was shown that procyanidin dimers and trimers were more effective against different radical species than monomeric flavonoids due to the higher polymerization degree [88]. Muniz-Marquez et al. (2018) [29] observed that Laurus nobilis L. leaf extracts obtained by CRE (76.86%) were slightly more efficient in lipid peroxidation inhibition than those obtained by MAE (70.71%), which, as the authors explained, was in agreement with the phenolic content of the extracts. In another study by Muniz-Marquez et al. (2014) [28], the lipid peroxidation inhibition of the Laurus nobilis L. leaf extracts obtained by UAE was 73.55%, which is also lower than the inhibition percentage previously reported for CRE. These results are in accordance with the trend observed in our study.

4. Conclusions

MAE and UAE, as green extraction techniques, were optimized for the rapid and effective isolation of the polyphenols of Laurus nobilis L. leaves and were compared with CRE. The determined optimal MAE conditions were 50% ethanol, temperature 80 °C, time 10 min and microwave power 400 W, while for UAE they were 70% ethanol, 10 min and 50% amplitude. The polyphenolic profile of Laurus nobilis L. leaves, regardless of the extraction technique used, included 29 compounds belonging to the classes of phenolic acids, flavonols, flavan-3-ols, flavones and proanthocyanidins. Flavonols were the most abundant phenolic group consisting mainly of kaempferol and quercetin glycosides. Although according to the spectrophotometric determination of the total phenolic content MAE was shown to be the most effective technique, the individual polyphenolic profile revealed that the highest polyphenolic yield and, consequently, the highest antioxidant capacity was obtained by CRE. Although green extraction techniques have not overcome the CRE yield, they produced polyphenol rich extracts with similar antioxidant capacity in a significantly shorter time, demonstrating their advantages in reducing time and energy consumption.

Author Contributions

Conceptualization, E.D. and I.E.G.; Methodology, E.D., I.E.G., Z.Z. and S.P.; Formal analysis, E.D., Z.Z. and S.P.; Data curation, E.D. and Z.Z.; Writing—Original draft preparation, E.D; Writing—Review and editing, I.E.G. and V.D.-U.; Supervision, I.E.G.; Project administration, V.D.-U. All authors have read and agreed to the published version of the manuscript.

Funding

This work was supported by the project “Bioactive molecules of medical plant as natural antioxidants, microbicides and preservatives” (KK.01.1.1.04.0093), co-financed by the Croatian Government and the European Union through the European Regional Development Fund—Operational Programme Competitiveness and Cohesion (KK.01.1.1.04.).

Institutional Review Board Statement

Not applicable.

Informed Consent Statement

Not applicable.

Data Availability Statement

Not applicable.

Acknowledgments

Authors would like to thank Zoran Herceg for the support in providing laboratory equipment used for the experiments through the project “Equipping the Semi-Industrial Practice Laboratory for the Development of New Food Technologies” (KK.01.1.1.02.0001) financed by the European Union.

Conflicts of Interest

The authors declare no conflict of interest. The funders had no role in the design of the study; in the collection, analyses, or interpretation of data; in the writing of the manuscript, or in the decision to publish the results.

References

  1. Sharma, A.; Singh, J.; Kumar, S. Bay leaves. In Handbook of Herbs and Spices; KV, P., Ed.; Woodhead Publishing Ltd.: Oxford, UK, 2012; pp. 73–85. [Google Scholar]
  2. Brahmi, N.; Scognamiglio, M.; Pacifico, S.; Mekhoukhe, A.; Madani, K.; Fiorentino, A.; Monaco, P. 1 H NMR based metabolic profiling of eleven Algerian aromatic plants and evaluation of their antioxidant and cytotoxic properties. Food Res. Int. 2015, 76, 334–341. [Google Scholar] [CrossRef]
  3. Dias, M.I.; Barros, L.; Dueñas, M.; Alves, R.C.; Oliveira, B.; Santos-Buelga, C.; Ferreira, I.C. Nutritional and antioxidant contributions of Laurus nobilis L. leaves: Would be more suitable a wild or a cultivated sample? Food Chem. 2014, 156, 339–346. [Google Scholar] [CrossRef] [Green Version]
  4. Mazzio, E.A.; Li, N.; Bauer, D.; Mendonca, P.; Taka, E.; Darb, M.; Thomas, L.; Williams, H.; Soliman, K.F.A. Natural product HTP screening for antibacterial (E.coli 0157:H7) and anti-inflammatory agents in (LPS from E. coli O111:B4) activated macrophages and microglial cells; focus on sepsis. BMC Complement. Altern. Med. 2016, 16, 467. [Google Scholar] [CrossRef] [Green Version]
  5. Matsuda, H.; Kagerura, T.; Toguchida, I.; Ueda, H.; Morikawa, T.; Yoshikawa, M. Inhibitory effects of sesquiterpenes from bay leaf on nitric oxide production in lipopolysaccharide-activated macrophages: Structure requirement and role of heat shock protein induction. Life Sci. 2000, 66, 2151–2157. [Google Scholar] [CrossRef]
  6. Sıdıka, E.; Oktay, Y.; Hatice, E.T.; Aslı, A.; Merve, A.U. Chemical composition, antimicrobial activity and antioxidant capacity of some medicinal and aromatic plant extracts. Afr. J. Microbiol. Res. 2013, 7, 383–388. [Google Scholar] [CrossRef] [Green Version]
  7. Houicher, A.; Hechachna, H.; Teldji, H.; Ozogul, F. In Vitro Study of the Antifungal Activity of Essential Oils Obtained from Mentha spicata, Thymus vulgaris, and Laurus nobilis. Recent Pat. Food. Nutr. Agric. 2016, 8, 99–106. [Google Scholar] [CrossRef]
  8. Alejo-Armijo, A.; Altarejos, J.; Salido, S. Phytochemicals and biological activities of laurel tree (Laurus nobilis). Nat. Prod. Commun. 2017, 12, 743–757. [Google Scholar] [CrossRef] [Green Version]
  9. Sang, S.; Hou, Z.; Liebert, J.D.; Yang, C.S. Redox Properties of Tea Polyphenols and Related Biological Activities. Antioxid. Redox Signal. 2005, 7, 1704–1714. [Google Scholar] [CrossRef]
  10. Vinha, A.F.; Guido, L.F.; Costa, A.S.G.; Alves, R.C.; Oliveira, M.B.P.P. Monomeric and oligomeric flavan-3-ols and antioxidant activity of leaves from different Laurus sp. Food Funct. 2015, 6, 1944–1949. [Google Scholar] [CrossRef] [Green Version]
  11. Muñiz-Márquez, D.B.; Rodríguez, R.; Balagurusamy, N.; Carrillo, M.L.; Belmares, R.; Contreras, J.C.; Nevárez, G.V.; Aguilar, C.N. Phenolic content and antioxidant capacity of extracts of Laurus nobilis L., Coriandrum sativum L. and Amaranthus hybridus L. CYTA J. Food 2014, 12, 271–276. [Google Scholar] [CrossRef] [Green Version]
  12. Routray, W.; Orsat, V. Preparative extraction and separation of phenolic compounds. In Natural Products: Phytochemistry, Botany and Metabolism of Alkaloids, Phenolics and Terpenes; Ramawat, G.K., Mérillon, J.-M., Eds.; Springer: Berlin/Heidelberg, Germany, 2013; pp. 2013–2045. ISBN 9783642221439/3642221432. [Google Scholar]
  13. Selvamuthukumaran, M.; Shi, J. Recent advances in extraction of antioxidants from plant by-products processing industries. Food Qual. Saf. 2017, 1, 61–81. [Google Scholar] [CrossRef]
  14. Garofulić, I.E.; Dragović-Uzelac, V.; Jambrak, A.R.; Jukić, M. The effect of microwave assisted extraction on the isolation of anthocyanins and phenolic acids from sour cherry Marasca (Prunus cerasus var. Marasca). J. Food Eng. 2013, 117, 437–442. [Google Scholar] [CrossRef]
  15. Dragović-Uzelac, V.; Garofulić, I.E.; Jukić, M.; Penić, M.; Dent, M. Utjecaj ekstrakcije potpomognute mikrovalovima na izolaciju polifenola kadulje (Salvia officinalis L.). Food Technol. Biotechnol. 2012, 50, 377–383. [Google Scholar]
  16. Filip, S.; Pavlić, B.; Vidović, S.; Vladić, J.; Zeković, Z. Optimization of Microwave-Assisted Extraction of Polyphenolic Compounds from Ocimum basilicum by Response Surface Methodology. Food Anal. Methods 2017, 10, 2270–2280. [Google Scholar] [CrossRef]
  17. Zoubi, Y.E.; Fadil, M.; Bousta, D.; Lalami, A.E.O.; Lachkar, M.; Farah, A. Ultrasound-Assisted Extraction of Phenolic Compounds from Moroccan Lavandula stoechas L.: Optimization Using Response Surface Methodology. J. Chem. 2021, 2021. [Google Scholar] [CrossRef]
  18. Monzón, L.; Becerra, G.; Aguirre, E.; Rodríguez, G.; Villanueva, E. Ultrasound-assisted extraction of polyphenols from avocado residues: Modeling and optimization using response surface methodology and artificial neural networks. Sci. Agropecu. 2021, 12, 33–40. [Google Scholar] [CrossRef]
  19. Borrás-Enríquez, A.J.; Reyes-Ventura, E.; Villanueva-Rodríguez, S.J.; Moreno-Vilet, L. Effect of Ultrasound-Assisted Extraction Parameters on Total Polyphenols and Its Antioxidant Activity from Mango Residues (Mangifera indica L. var. Manililla). Separations 2021, 8, 94. [Google Scholar] [CrossRef]
  20. Liazid, A.; Palma, M.; Brigui, J.; Barroso, C.G. Investigation on phenolic compounds stability during microwave-assisted extraction. J. Chromatogr. A 2007, 1140, 29–34. [Google Scholar] [CrossRef]
  21. Handa, S.; Khanuja, S.P.; Longo, G.; Rakesh, D.D. Extraction Technologies for Medicinal and Aromatic Plants; United Nations Industrial Development Organization and the International Centre for Science and High Technology: Trieste, Italy, 2008. [Google Scholar]
  22. Mandal, V.; Mohan, Y.; Hemalatha, S. Microwave Assisted Extraction—An Innovative and Promising Extraction Tool for Medicinal Plant Research. Pharmacogn. Rev. 2007, 1, 7–18. [Google Scholar]
  23. Mason, T.J.; Paniwnyk, L.; Lorimer, J.P. The uses of ultrasound in food technology. Ultrason. Sonochem. 1996, 3, S253–S260. [Google Scholar] [CrossRef]
  24. López-Fernández, O.; Domínguez, R.; Pateiro, M.; Munekata, P.E.S.; Rocchetti, G.; Lorenzo, J.M. Determination of Polyphenols Using Liquid Chromatography–Tandem Mass Spectrometry Technique (LC–MS/MS): A Review. Antioxidants 2020, 9, 479. [Google Scholar] [CrossRef]
  25. Prior, R.L.; Wu, X.; Schaich, K. Standardized Methods for the Determination of Antioxidant Capacity and Phenolics in Foods and Dietary Supplements. J. Agric. Food Chem. 2005, 53, 4290–4302. [Google Scholar] [CrossRef]
  26. Prior, R.L. Oxygen radical absorbance capacity (ORAC): New horizons in relating dietary antioxidants/bioactives and health benefits. J. Funct. Foods 2015, 18, 797–810. [Google Scholar] [CrossRef]
  27. Huang, D.; Ou, B.; Prior, R.L. The Chemistry behind Antioxidant Capacity Assays. J. Agric. Food Chem. 2005, 53, 1841–1856. [Google Scholar] [CrossRef]
  28. Muñiz-Márquez, D.B.; Martínez-Ávila, G.C.; Wong-Paz, J.E.; Belmares-Cerda, R.; Rodríguez-Herrera, R.; Aguilar, C.N. Ultrasound-assisted extraction of phenolic compounds from Laurus nobilis L. and their antioxidant activity. Ultrason. Sonochem. 2013, 20, 1149–1154. [Google Scholar] [CrossRef]
  29. Muñiz-Márquez, D.B.; Wong-Paz, J.E.; Contreras-Esquivel, J.C.; Rodríguez-Herrera, R.; Aguilar, C.N. Bioactive compounds from bay leaves (Laurus nobilis) extracted by microwave technology. Z. Nat. C 2018, 73, 401–407. [Google Scholar] [CrossRef]
  30. Papageorgiou, V.; Mallouchos, A.; Komaitis, M. Investigation of the antioxidant behavior of air- and freeze-dried aromatic plant materials in relation to their phenolic content and vegetative cycle. J. Agric. Food Chem. 2008, 56, 5743–5752. [Google Scholar] [CrossRef]
  31. AOAC. Official Methods of Analysis: Changes in Official Methods of Analysis Made at the Annual Meeting; Association of Official Analytical Chemists: Rockville, MD, USA, 1990; Volume 15. [Google Scholar]
  32. Altıok, E.; Bayçın, D.; Bayraktar, O.; Ülkü, S. Isolation of polyphenols from the extracts of olive leaves (Olea europaea L.) by adsorption on silk fibroin. Sep. Purif. Technol. 2008, 62, 342–348. [Google Scholar] [CrossRef] [Green Version]
  33. Shortle, E.; O’Grady, M.N.; Gilroy, D.; Furey, A.; Quinn, N.; Kerry, J.P. Influence of extraction technique on the anti-oxidative potential of hawthorn (Crataegus monogyna) extracts in bovine muscle homogenates. Meat Sci. 2014, 98, 828–834. [Google Scholar] [CrossRef]
  34. Garofulić, I.E.; Zorić, Z.; Pedisić, S.; Brnčić, M.; Dragović-Uzelac, V. UPLC-MS 2 Profiling of Blackthorn Flower Polyphenols Isolated by Ultrasound-Assisted Extraction. J. Food Sci. 2018, 83, 2782–2789. [Google Scholar] [CrossRef]
  35. Garofulić, I.E.; Kruk, V.; Martić, A.; Martić, I.; Zorić, Z.; Pedisić, S.; Dragović, S.; Dragović-Uzelac, V. Evaluation of Polyphenolic Profile and Antioxidant Activity of Pistacia lentiscus L. Leaves and Fruit Extract Obtained by Optimized Microwave-Assisted Extraction. Foods 2020, 9, 1556. [Google Scholar] [CrossRef]
  36. Lu, M.; Yuan, B.; Zeng, M.; Chen, J. Antioxidant capacity and major phenolic compounds of spices commonly consumed in China. Food Res. Int. 2011, 44, 530–536. [Google Scholar] [CrossRef]
  37. Rincón, E.; Balu, A.M.; Luque, R.; Serrano, L. Mechanochemical extraction of antioxidant phenolic compounds from Mediterranean and medicinal Laurus nobilis: A comparative study with other traditional and green novel techniques. Ind. Crops Prod. 2019, 141, 111805. [Google Scholar] [CrossRef]
  38. Elboughdiri, N. Effect of Time, Solvent-Solid Ratio, Ethanol Concentration and Temperature on Extraction Yield of Phenolic Compounds From Olive Leaves. Eng. Technol. Appl. Sci. Res. 2018, 8, 2805–2808. [Google Scholar] [CrossRef]
  39. Do, Q.D.; Angkawijaya, A.E.; Tran-Nguyen, P.L.; Huynh, L.H.; Soetaredjo, F.E.; Ismadji, S.; Ju, Y.-H. Effect of extraction solvent on total phenol content, total flavonoid content, and antioxidant activity of Limnophila aromatica. J. Food Drug Anal. 2014, 22, 296–302. [Google Scholar] [CrossRef] [Green Version]
  40. Lovrić, V.; Putnik, P.; Bursać Kovačević, D.; Jukić, M.; Dragović-Uzelac, V. The Effect of Microwave-Assisted Extraction on the Phenolic Compounds and Antioxidant Capacity of Blackthorn Flowers. Food Technol. Biotechnol. 2017, 55. [Google Scholar] [CrossRef] [PubMed]
  41. Shang, A.; Luo, M.; Gan, R.Y.; Xu, X.Y.; Xia, Y.; Guo, H.; Liu, Y.; Li, H. Bin Effects of microwave-assisted extraction conditions on antioxidant capacity of sweet tea (Lithocarpus polystachyus rehd.). Antioxidants 2020, 9, 678. [Google Scholar] [CrossRef] [PubMed]
  42. Ismail-Suhaimy, N.W.; Gani, S.S.A.; Zaidan, U.H.; Halmi, M.I.E.; Bawon, P. Optimizing conditions for microwave-assisted extraction of polyphenolic content and antioxidant activity of barleria lupulina lindl. Plants 2021, 10, 682. [Google Scholar] [CrossRef] [PubMed]
  43. Dahmoune, F.; Nayak, B.; Moussi, K.; Remini, H.; Madani, K. Optimization of microwave-assisted extraction of polyphenols from Myrtus communis L. leaves. Food Chem. 2015, 166, 585–595. [Google Scholar] [CrossRef] [PubMed]
  44. Zhang, B.; Yang, R.; Liu, C.-Z. Microwave-assisted extraction of chlorogenic acid from flower buds of Lonicera japonica Thunb. Sep. Purif. Technol. 2008, 62, 480–483. [Google Scholar] [CrossRef]
  45. Llompart, M.; Garcia-Jares, C.; Celeiro, M.; Dagnac, T. Extraction | Microwave-Assisted Extraction, 3rd ed.; Elsevier Inc.: Amsterdam, The Netherlands, 2019; ISBN 9780081019832. [Google Scholar]
  46. Xu, D.-P.; Zheng, J.; Zhou, Y.; Li, Y.; Li, S.; Li, H.-B. Ultrasound-assisted extraction of natural antioxidants from the flower of Limonium sinuatum: Optimization and comparison with conventional methods. Food Chem. 2017, 217, 552–559. [Google Scholar] [CrossRef]
  47. Volf, I.; Ignat, I.; Neamtu, M.; Popa, V. Thermal stability, antioxidant activity, and photo-oxidation of natural polyphenols. Chem. Pap. 2014, 68. [Google Scholar] [CrossRef]
  48. Dobrinčić, A.; Repajic, M.; Elez Garofulić, I.; Tuđen, L.; Dragović-Uzelac, V.; Levaj, B. Comparison of Different Extraction Methods for the Recovery of Olive Leaves Polyphenols. Processes 2020, 8, 1008. [Google Scholar] [CrossRef]
  49. Putnik, P.; Kovačević, D.B.; Penić, M.; Fegeš, M.; Dragović-Uzelac, V. Microwave-Assisted Extraction (MAE) of Dalmatian Sage Leaves for the Optimal Yield of Polyphenols: HPLC-DAD Identification and Quantification. Food Anal. Methods 2016, 9, 2385–2394. [Google Scholar] [CrossRef]
  50. Sarakatsianos, I.; Adamopoulos, K.; Samanidou, V.; Goula, A.; Ninou, E. Optimization of Microwave-Assisted Extraction of Phenolic Compounds from Medicinal and Aromatic Plants: Sideritis raeseri, Sideritis scardica and Origanum vulgare. Curr. Anal. Chem. 2020, 16, 106–111. [Google Scholar] [CrossRef]
  51. Flórez, N.; Conde, E.; Domínguez, H. Microwave assisted water extraction of plant compounds. J. Chem. Technol. Biotechnol. 2015, 90, 590–607. [Google Scholar] [CrossRef]
  52. Routray, W.; Orsat, V. Microwave-Assisted Extraction of Flavonoids: A Review. Food Bioprocess Technol. 2012, 5, 409–424. [Google Scholar] [CrossRef]
  53. Muchuweti, M.; Kativu, E.; Mupure, C.H.; Chidewe, C.; Ndhlala, A.R.; Benhura, M.A.N. Phenolic composition and antioxidant properties of some spices. Am. J. Food Technol. 2007, 2, 414–420. [Google Scholar] [CrossRef]
  54. Dzah, C.S.; Duan, Y.; Zhang, H.; Wen, C.; Zhang, J.; Chen, G.; Ma, H. The effects of ultrasound assisted extraction on yield, antioxidant, anticancer and antimicrobial activity of polyphenol extracts: A review. Food Biosci. 2020, 35, 100547. [Google Scholar] [CrossRef]
  55. Cao, Q.; Yan, J.; Sun, Z.; Gong, L.; Wu, H.; Tan, S.; Lei, Y.; Jiang, B.; Wang, Y. Simultaneous optimization of ultrasound-assisted extraction for total flavonoid content and antioxidant activity of the tender stem of Triarrhena lutarioriparia using response surface methodology. Food Sci. Biotechnol. 2021, 30, 37–45. [Google Scholar] [CrossRef]
  56. Bouaoudia-Madi, N.; Boulekbache-Makhlouf, L.; Madani, K.; Silva, A.M.S.; Dairi, S.; Oukhmanou-Bensidhoum, S.; Cardoso, S.M. Optimization of ultrasound-assisted extraction of polyphenols from myrtus communis L. Pericarp. Antioxidants 2019, 8, 205. [Google Scholar] [CrossRef] [Green Version]
  57. Ghitescu, R.-E.; Volf, I.; Carausu, C.; Bühlmann, A.-M.; Gilca, I.A.; Popa, V.I. Optimization of ultrasound-assisted extraction of polyphenols from spruce wood bark. Ultrason. Sonochem. 2015, 22, 535–541. [Google Scholar] [CrossRef]
  58. Xi, J.; Shen, D.; Zhao, S.; Lu, B.; Li, Y.; Zhang, R. Characterization of polyphenols from green tea leaves using a high hydrostatic pressure extraction. Int. J. Pharm. 2009, 382, 139–143. [Google Scholar] [CrossRef]
  59. Naczk, M.; Shahidi, F. Extraction and analysis of phenolics in food. J. Chromatogr. A 2004, 1054, 95–111. [Google Scholar] [CrossRef]
  60. da Silva, E.M.; Rogez, H.; Larondelle, Y. Optimization of extraction of phenolics from Inga edulis leaves using response surface methodology. Sep. Purif. Technol. 2007, 55, 381–387. [Google Scholar] [CrossRef]
  61. Falleh, H.; Ksouri, R.; Lucchessi, M.E.; Abdelly, C.; Magné, C. Ultrasound-assisted extraction: Effect of extraction time and solvent power on the levels of polyphenols and antioxidant activity of Mesembryanthemum edule L. Aizoaceae shoots. Trop. J. Pharm. Res. 2012, 11, 243–249. [Google Scholar] [CrossRef] [Green Version]
  62. Ho, S.; Tan, C.; Thoo, Y.; Abas, F.; Ho, C. Ultrasound-Assisted Extraction of Antioxidants in Misai Kucing (Orthosiphon stamineus). Molecules 2014, 19, 12640–12659. [Google Scholar] [CrossRef]
  63. Lazar, L.; Talmaciu, A.I.; Volf, I.; Popa, V.I. Kinetic modeling of the ultrasound-assisted extraction of polyphenols from Picea abies bark. Ultrason. Sonochem. 2016, 32, 191–197. [Google Scholar] [CrossRef]
  64. Al-Dhabi, N.A.; Ponmurugan, K.; Jeganathan, P.M. Development and validation of ultrasound-assisted solid-liquid extraction of phenolic compounds from waste spent coffee grounds. Ultrason. Sonochem. 2017, 34, 206–213. [Google Scholar] [CrossRef]
  65. Rodsamran, P.; Sothornvit, R. Extraction of phenolic compounds from lime peel waste using ultrasonic-assisted and microwave-assisted extractions. Food Biosci. 2019, 28, 66–73. [Google Scholar] [CrossRef]
  66. Akyuz, E.; Şahin, H.; Islamoglu, F.; Kolayli, S.; Sandra, P. Evaluation of phenolic compounds in Tilia rubra Subsp. caucasica by HPLC-UV and HPLC-UV-MS/MS. Int. J. Food Prop. 2013, 17, 331–343. [Google Scholar] [CrossRef]
  67. Repajić, M.; Cegledi, E.; Zorić, Z.; Pedisić, S.; Garofulić, I.E.; Radman, S.; Palčić, I.; Dragović-Uzelac, V. Bioactive compounds in wild nettle (Urtica dioica l.) leaves and stalks: Polyphenols and pigments upon seasonal and habitat variations. Foods 2021, 10, 190. [Google Scholar] [CrossRef] [PubMed]
  68. Pacifico, S.; Gallicchio, M.; Lorenz, P.; Duckstein, S.M.; Potenza, N.; Galasso, S.; Marciano, S.; Fiorentino, A.; Stintzing, F.C.; Monaco, P. Neuroprotective potential of Laurus nobilis antioxidant polyphenol-enriched leaf extracts. Chem. Res. Toxicol. 2014, 27, 611–626. [Google Scholar] [CrossRef] [PubMed]
  69. Stefanova, G.; Girova, T.; Gochev, V.; Stoyanova, M.; Petkova, Z.; Stoyanova, A.; Zheljazkov, V.D. Comparative study on the chemical composition of laurel (Laurus nobilis L.) leaves from Greece and Georgia and the antibacterial activity of their essential oil. Heliyon 2020, 6, e05491. [Google Scholar] [CrossRef] [PubMed]
  70. Vallverdú-Queralt, A.; Regueiro, J.; Martínez-Huélamo, M.; Alvarenga, J.F.R.; Leal, L.N.; Lamuela-Raventos, R.M. A comprehensive study on the phenolic profile of widely used culinary herbs and spices: Rosemary, thyme, oregano, cinnamon, cumin and bay. Food Chem. 2014, 154, 299–307. [Google Scholar] [CrossRef] [PubMed]
  71. Konovalov, D.A.; Alieva, N.M. Phenolic compounds of Laurus nobilis (Review). Pharm. Pharmacol. 2019, 7, 244–259. [Google Scholar] [CrossRef]
  72. Škerget, M.; Kotnik, P.; Hadolin, M.; Hraš, A.R.; Simonič, M.; Knez, Ž. Phenols, proanthocyanidins, flavones and flavonols in some plant materials and their antioxidant activities. Food Chem. 2005, 89, 191–198. [Google Scholar] [CrossRef]
  73. Dall’Acqua, S.; Cervellati, R.; Speroni, E.; Costa, S.; Guerra, M.C.; Stella, L.; Greco, E.; Innocenti, G. Phytochemical composition and antioxidant activity of Laurus nobilis L. leaf infusion. J. Med. Food 2009, 12, 869–876. [Google Scholar] [CrossRef] [PubMed]
  74. Ferreres, F.; Sousa, C.; Valentão, P.; Andrade, P.B.; Seabra, R.M.; Gil-Izquierdo, Á. New C-deoxyhexosyl flavones and antioxidant properties of Passiflora edulis leaf extract. J. Agric. Food Chem. 2007, 55, 10187–10193. [Google Scholar] [CrossRef]
  75. Rue, E.A.; Rush, M.D.; van Breemen, R.B. Procyanidins: A comprehensive review encompassing structure elucidation via mass spectrometry. Phytochem. Rev. 2018, 17, 1–16. [Google Scholar] [CrossRef]
  76. Pietta, P.; Minoggio, M.; Bramati, L. Plant Polyphenols: Structure, Occurrence and Bioactivity. Stereoselective Synth. (Part K) 2003, 257–312. [Google Scholar] [CrossRef]
  77. Fernando, C.D.; Soysa, P. Extraction Kinetics of phytochemicals and antioxidant activity during black tea (Camellia sinensis L.) brewing. Nutr. J. 2015, 14, 74. [Google Scholar] [CrossRef] [Green Version]
  78. Cilliers, J.; Singleton, V.L.; Lamuela-Raventos, R.M. Total Polyphenols in Apples and Ciders; Correlation with Chlorogenic Acid. J. Food Sci. 1990, 55, 1458–1459. [Google Scholar] [CrossRef]
  79. El-Hamidi, M.; Zaher, F.A. Comparison Between Some Common Clays as Adsorbents of Carotenoids, Chlorophyll and Phenolic Compounds from Vegetable Oils. Am. J. Food Technol. 2016, 11, 92–99. [Google Scholar] [CrossRef]
  80. Zheng, W.; Wang, S.Y. Antioxidant Activity and Phenolic Compounds in Selected Herbs. J. Agric. Food Chem. 2001, 49, 5165–5170. [Google Scholar] [CrossRef]
  81. Kratchanova, M.; Denev, P.; Ciz, M.; Lojek, A.; Mihailov, A. Evaluation of antioxidant activity of medicinal plants containing polyphenol compounds. Comparison of two extraction systems. Acta Biochim. Pol. 2010, 57, 229–234. [Google Scholar] [CrossRef] [Green Version]
  82. Kim, S.J.; Kim, G.H. Inhibitory effects of Tunisian plants extracts on oxidative stress and lipid accumulation in HepG2 cells. Korean J. Food Preserv. 2021, 28, 403–415. [Google Scholar] [CrossRef]
  83. Dudonné, S.; Vitrac, X.; Coutière, P.; Woillez, M.; Mérillon, J.-M. Comparative Study of Antioxidant Properties and Total Phenolic Content of 30 Plant Extracts of Industrial Interest Using DPPH, ABTS, FRAP, SOD, and ORAC Assays. J. Agric. Food Chem. 2009, 57, 1768–1774. [Google Scholar] [CrossRef] [PubMed]
  84. Shan, B.; Cai, Y.Z.; Sun, M.; Corke, H. Antioxidant Capacity of 26 Spice Extracts and Characterization of Their Phenolic Constituents. J. Agric. Food Chem. 2005, 53, 7749–7759. [Google Scholar] [CrossRef] [PubMed]
  85. Moure, A.; Cruz, J.M.; Franco, D.; Domínguez, J.M.; Sineiro, J.; Domínguez, H.; José Núñez, M.; Parajó, J.C. Natural antioxidants from residual sources. Food Chem. 2001, 72, 145–171. [Google Scholar] [CrossRef]
  86. Ou, B.; Huang, D.; Hampsch-Woodill, M.; Flanagan, J.A.; Deemer, E.K. Analysis of Antioxidant Activities of Common Vegetables Employing Oxygen Radical Absorbance Capacity (ORAC) and Ferric Reducing Antioxidant Power (FRAP) Assays: A Comparative Study. J. Agric. Food Chem. 2002, 50, 3122–3128. [Google Scholar] [CrossRef] [PubMed]
  87. Pietta, P.G. Flavonoids as antioxidants. J. Nat. Prod. 2000, 63, 1035–1042. [Google Scholar] [CrossRef] [PubMed]
  88. Heim, K.E.; Tagliaferro, A.R.; Bobilya, D.J. Flavonoid antioxidants: Chemistry, metabolism and structure-activity relationships. J. Nutr. Biochem. 2002, 13, 572–584. [Google Scholar] [CrossRef]
Figure 1. UPLC-MS/MS chromatogram in MRM acquisition mode of Laurus nobilis L. leaf extracts obtained by optimized extraction conditions of CRE (a), MAE (b) and UAE (c): (1) rosmarinic acid, (2) syringic acid, (3) 3,4-dihidrobenzoic acid hexoside, (4) protocatechuic acid, (5) chlorogenic acid, (6) p-hydroxybenzoic acid, (7) caffeic acid, (8) epicatechin, (9) catechin, (10) procyanidin trimer, (11) luteolin-6-C-glucoside, (12) kaempferol-3-O-deoxyhexoside, (13) p-coumaric acid, (14) rutin, (15) apigenin, (16) quercetin-3-glucoside, (17) ferulic acid, (18) luteolin, (19) kaempferol-3-rutinoside, (20) quercetin-3-pentoside, (21) kaempferol-3-O-hexoside, (22) isorhamnetin-3-hexoside, (23) quercetin-3-rhamnoside, (24) kaempferol-3-O-pentoside, (25) gallic acid, (26) apigenin-6-C-(O-deoxyhexosyl)-hexoside, (27) epicatechin gallate, (28) myricetin, (29) epigallocatechin gallate.
Processes 09 01840 g001
Figure 2. The content of different groups of polyphenolic compounds determined by UPLC-MS/MS in extracts obtained by CRE, MAE and UAE.
Processes 09 01840 g002
Table 1. Total phenolic content of L. nobilis L. leaf extracts obtained by different extraction parameters and techniques.
Extraction
Technique
Extraction ParametersTPC
(mg GAE g−1)
CRE%EtOH
50% 42.35 ± 0.86
70% 42.21 ± 0.65
MAE%EtOHTime (min)Temperature (°C)Microwave power (W)
5054040038.75 ± 1.01
5054080032.91 ± 1.21
50104040033.88 ± 0.35
50104080039.99 ± 1.25
50154040039.63 ± 2.06
50154080033.30 ± 1.36
5056040036.91 ± 0.70
5056080035.57 ± 0.70
50106040036.15 ± 0.60
50106080036.60 ± 0.80
50156040036.86 ± 2.47
50156080036.91 ± 0.95
5058040040.90 ± 0.40
5058080039.74 ± 1.36
50108040053.57 ± 1.01
50108080043.75 ± 0.25
50158040049.44 ± 2.11
50158080044.51 ± 1.81
7054040033.60 ± 0.80
7054080040.17 ± 0.80
70104040033.31 ± 0.50
70104080031.87 ± 1.15
70154040030.88 ± 1.61
70154080034.29 ± 0.30
7056040041.08 ± 1.31
7056080036.64 ± 1.01
70106040038.40 ± 0.75
70106080042.68 ± 0.76
70156040042.13 ± 0.65
70156080039.13 ± 0.40
7058040042.79 ± 0.95
7058080043.36 ± 1.05
70108040046.17 ± 0.55
70108080044.21 ± 0.15
70158040046.51 ± 1.91
70158080046.53 ± 1.71
UAE%EtOHTime (min)Amplitude (%)
50550 24.43 ± 1.31
5057531.18 ± 1.41
50510027.46 ± 0.50
50105029.78 ± 1.16
50107531.70 ± 1.71
501010029.12 ± 1.11
50155036.74 ± 2.12
50157533.96 ± 1.01
501510028.89 ± 0.30
7055030.16 ± 1.16
7057525.23 ± 1.31
70510027.77 ± 0.25
70105032.85 ± 1.16
70107532.52 ± 0.61
701010035.04 ± 0.10
70155031.98 ± 0.20
70157531.88 ± 0.55
701510033.36 ± 0.96
TPC = total phenolic content, CRE = conventional heat-reflux extraction, MAE = microwave-assisted extraction, UAE = ultrasound-assisted extraction. Results are expressed as mean ± SD.
Table 2. Influence of extraction parameters on total phenolic content of L. nobilis leaf extracts.
Extraction TechniqueSource of VariationTotal Phenolic Content (mg GAE g−1)
CRE% EtOHp = 0.86
50% w/w42.35 ± 0.54 a
70% w/w42.21 ± 0.55 a
MAE% EtOHp = 0.38
50% w/w39.41 ± 0.19 a
70% w/w39.65 ± 0.19 a
Temperature (°C)p ≤ 0.01
40 °C35.22 ± 0.24 a
60 °C38.25 ± 0.24 b
80 °C45.12 ± 0.24 c
Time(min)p ≤ 0.01
5 min38.53 ± 0.24 a
10 min40.05 ± 0.24 b
15 min40.01 ± 0.24 b
Microwave power (W)p ≤ 0.01
400 W40.05 ± 0.19 b
800 W39.01 ± 0.19 a
UAE% EtOHp ≤ 0.05
50% w/w30.36 ± 0.26 a
70% w/w31.20 ± 0.26 b
Time (min)p ≤ 0.01
5 min27.70 ± 0.31 a
10 min31.84 ± 0.31 b
15 min32.80 ± 0.31 b
Amplitude (%)p = 0.17
50%30.99 ± 0.31 a
70%31.10 ± 0.31 a
100%30.27 ± 0.31 a
CRE = conventional heat-reflux extraction, MAE = microwave-assisted extraction, UAE = ultrasound-assisted extraction. Results are expressed as mean ± SE. Values with different letters are statistically different at p ≤ 0.05. Statistically significant variable at p ≤ 0.05. Statistically insignificant variable at p ≤ 0.05.
Table 3. Mass spectrometric data and identification of phenolic compounds in Laurus nobilis L. leaves obtained by optimized extraction conditions.
CompoundRT MinPrecursor Ion (m/z)Fragment Ions (m/z)Tentative IdentificationConcentration mg 10−2 g−1
CREMAEUAE
Phenolic acids
10.874359.1161rosmarinic acid *0.53 ± 0.03 a1.25 ± 0.07 b1.44 ± 0.07 b
21.145197182syringic acid *0.03 ± 0.00 a0.04 ± 0.01 a,b0.06 ± 0.00 b
32.0523171553,4-dihidrobenzoic acid hexoside1.75 ± 0.14 a2.89 ± 0.14 b2.49 ± 0.09 b
43.508153109protocatehuic acid *2.80 ± 0.18 b3.54 ± 0.16 c2.04 ± 0.02 a
54.913353191chlorogenic acid *0.38 ± 0.01 a0.38 ± 0.01 a0.39 ± 0.03 a
65.07413793p-hydroxybenzoic acid0.72 ± 0.02 a1.02 ± 0.01 b1.30 ± 0.07 c
75.711179135caffeic acid *2.55 ± 0.00 a34.31 ± 0.52 c20.73 ± 0.49 b
137.28163119p-coumaric acid *1.40 ± 0.07 b0.83 ± 0.04 a0.82 ± 0.01 a
177.917193134ferulic acid *9.44 ± 0.24 b0.78 ± 0.00 a1.10 ± 0.03 a
2511.443169125gallic acid *0.45 ± 0.02 a1.05 ± 0.03 b0.48 ± 0.00 a
Flavonols
126.831433286kaempferol-3-O-deoxyhexoside0.14 ± 0.01 c0.06 ± 0.01 a0.10 ± 0.00 b
147.301611303Rutin *28.07 ± 0.57 a98.21 ± 2.04 b23.14 ± 0.46 a
167.839465303.1quercetin-3-glucoside51.34 ± 0.64 a102.74 ± 2.18 c91.83 ± 0.70 b
198.219595287kaempferol-3-rutinoside24.17 ± 0.21 c5.78 ± 0.35 a7.52 ± 0.21 b
208.39435303quercetin-3-pentoside28.32 ± 0.57 c8.62 ± 0.28 b5.43 ± 0.14 a
218.51449287kaempferol-3-O-hexoside111.63 ± 1.13 c18.73 ± 0.28 b14.25 ± 0.35 a
228.616479317isorhamnetin-3-hexoside40.56 ± 0.35 c25.10 ± 0.35 b21.62 ± 0.35 a
238.767449303quercetin-3-rhamnoside12.74 ± 0.21 a14.34 ± 0.28 a39.96 ± 1.33 b
249.048419287kaempferol-3-O-pentoside43.90 ± 0.35 b8.37 ± 0.21 a7.92 ± 0.14 a
2812.045319273Myricetin *0.65 ± 0.05 a0.73 ± 0.05 a0.78 ± 0.05 a
Flavan-3-ols
85.93291139epicatechin71.17 ± 0.42 b13.65 ± 0.35 a13.90 ± 0.28 a
95.937291139catechin *72.37 ± 0.42 c12.62 ± 0.18 a19.88 ± 0.70 b
2712.028442.9139epicatechin gallate *0.10 ± 0.02 a0.45 ± 0.02 c0.26 ± 0.02 b
2912.268459289epigallocatechin gallate *0.49 ± 0.05 b0.22 ± 0.02 a0.08 ± 0.04 a
Flavones
116.677449329luteolin-6-C-glucoside2.10 ± 0.07 a5.23 ± 0.28 c4.04 ± 0.28 b
157.77271153apigenin *0.65 ± 0.07 a3.74 ± 0.07 b8.52 ± 0.21 c
188.157287153luteolin *3.80 ± 0.21 a7.17 ± 0.21 b11.36 ± 0.35 c
2611.998579459apigenin-6-C- (O-deoxyhexosyl)-hexoside0.09 ± 0.01 a0.13 ± 0.04 a0.10 ± 0.01 a
Proanthocyanidins
106.249865713procyanidin trimer20.33 ± 0.28 c7.72 ± 0.21 a15.20 ± 0.42 b
Total phenols UPLC-MS/MS (mg 10−2 g−1)----531.35 ± 1.84 c375.74 ± 5.55 b311.47 ± 7.47 a
Total phenols A = 765 nm
(mg GAE g−1)
----42.35 ± 0.86 b53.57 ± 1.01 c32.85 ± 1.16 a
ORAC (μmol TE g−1)----100.09 ± 0.21 b86.04 ± 1.26 a90.27 ± 1.11 a
CRE = conventional heat-reflux extraction, MAE = microwave-assisted extraction, UAE = ultrasound-assisted extraction. Results are expressed as mean ± SD. * identification confirmed using authentic standards. Values with different letters are statistically different at p ≤ 0.05.
Publisher’s Note: MDPI stays neutral with regard to jurisdictional claims in published maps and institutional affiliations.

