The transport system is complex and large and includes several subsystems: city passenger public transport, route network, road network, traffic light management, including intelligent transport systems, traffic flow of cars and trucks, buses belonging to individual owners, organizations, and taxi companies. It has a combination of properties: organization, integrity, emergence, functionality, structure, sustainability, reliability, survivability, and adaptability. The authors conducted research on the environmental sustainability of one of the subsystems of the urban transport system—the traffic management system.
An analysis of previous studies showed that the environmental sustainability of the urban transport system to changes in the weather, climate, transport, and road conditions of car operation should take into account the influence of a large number of external and internal factors. External factors include sociodemographic, economic, and weather–climatic groups of factors.
The main internal factors affecting the environmental sustainability of the transport system include:
If transport demand and supply were unbalanced, the time for correspondence by cars increased. This led to traffic congestion, an increase in vehicle traffic unevenness, and, consequently, an increase in the amount of harmful substances emitted with the ICE exhaust gases.
In the case of an imbalanced demand for free parking and the availability of parking for traveling with a full-time work purpose, several options are possible on the part of residents. They can:
3.1. Methodological Approach to Assessing the Environmental Sustainability of the Transport System
Environmental sustainability is one of the partial coefficients
ke of the integral indicator of the transport system sustainability, estimated by the coefficient
Ki, [
31], which was determined taking into account the degree of weight λ
i (0 ≤ λ
i ≤ 1;
) of each factor; Equation (1):
where
n—number of criteria involved in the assessment. Where
Ki—partial sustainability coefficient,
λi—will be different for different transport systems of municipalities and can be determined by expert estimates based on the aim of the study.
When assessing environmental sustainability, the work took into account the environmental situation in the entire city and in certain sections of the road network. Assessment of the environmental situation in certain areas is advisable in places with a large number of pedestrians (pedestrian crossings, public transport stops). To assess the environmental sustainability of the transport system, the authors proposed introducing the coefficient
Ke, which was determined by the relative change in damage caused by harmful substances from exhaust gases; Equation (2):
where
D′e,
De—environmental damage to atmospheric air,
G′i Gi—the actual mass of the ith harmful substance entering the atmospheric air with the exhaust car gases during the considered period of time, respectively, in the current conditions and after changing the functioning of the transport system.
The environmental sustainability coefficient shows how many times the amount of emissions of harmful substances from automobile exhaust gases decreases when a set of measures is taken to reduce the negative impact of transport on the environment.
When assessing the environmental situation using simulation, the amount of emissions of Carbon dioxide (CO2) and harmful substances with exhaust gases of internal combustion engines of cars was calculated by their type:
Carbon monoxide CO;
Nitrogen oxide NOx;
Hydrocarbons CH;
Other harmful substances (Ammoniac NH3, Nonmethane hydrocarbon (NMHC), PM, Sulfur dioxide SO2, Methane CH4, Nitrous oxide N2O, Benzene).
During simulation at the macro level, the influence of different transportation modes on the emissions of individual pollutants was neglected. This reduced the assessment reliability, but increased the availability of the method, because there was no need for large amounts of additional information for calculations. The amount of harmful substance emissions during macromodeling was calculated according to the Handbook Emission Factors for Road Transport 3.3 (HBEFA) method, which takes into account the mileage emissions when driving cars and emissions in idle mode [
47]. This took into account the composition of the traffic flow, fuel types, service level, road class, traffic speed, load on the road network. The change in the amount of emissions of harmful substances during simulation correlated with the indicator of fuel consumption by cars.
3.2. Methodological Approach to Assessing the Impact of the Parking Cost and the Number of Parking Spaces on the Effectiveness of Traffic Management and the Environmental Sustainability of the Transport System
The introduction of parking fees for cars in the road network has been used worldwide for over 85 years. In the Russian Federation, this procedure has become widespread relatively recently. Moscow has the most widespread paid parking system in the Russian Federation. As of 2020, paid parking has become widespread to some degree in 19 cities (
Table 1). Moscow and St. Petersburg have the highest cost of parking (from 30 to 380 rubles). In other cities of the Russian Federation, the cost of parking for personal vehicles averages 30–50 rubles per 1 h.
Municipal authorities in the Russian Federation note that the introduction of a parking fee is not for replenishing the budget of cities. The main goal of paid parking is to demotivate the use of cars by citizens and stimulate the use of public transport, taxis, car sharing, cycling, or walking to the city center. Moscow has the largest empirical experience with paid parking. Since the introduction of parking fees, tariffs in certain areas of Moscow have increased from 80 to 380 rubles. With the development of car sharing, the occupancy rate of parking lots for these cars has increased.
The hypothesis of the study is that with an increase in the area and cost of paid parking in the city center, the demand is redistributed by means of transport (an increase in the share of travel by public transport and taxis and a decrease in travel by cars). As a result, the unevenness of traffic with respect to time is reduced, the proportion of time when cars are moving at a constant speed increases, and the number of stops, acceleration, and braking is reduced. Reducing the time the cars are idling and the traffic is uneven reduces the amount of emissions of harmful substances from the exhaust gases of ICE cars. This leads to the increased environmental sustainability of the city’s transport system.
Traffic simulation allows us to evaluate the change in the parameters of the urban transport system when external and internal conditions affecting the system change.
Table 2 presents the changes in the number of transport correspondences when introducing parking fees and expanding the paid parking zone in the city.
Table 3 presents the changes in the number of transport correspondences when introducing parking fees and expanding the paid parking zone in the city center.
When the number of correspondence changes, the structure of transport demand changes by modes of transport and ways of movement in the city (
Table 4).
The introduction of a fee for cars parking within the road network in the center of the city led to a redistribution of demand by means of transport and transportation methods when performing transport correspondence to this area. The share of travel by cars decreased by 1.2%. The share of travel by public transport increased by 0.9%. Pedestrian traffic changed by 0.2%. At first glance, such slight changes in transport demand are due to an estimate for the entire city and all travel, which concern not only the area of introduction of paid parking but the city as a whole. Changes in transport demand in the area of introduction of paid parking are more significant (
Table 5 and
Table 6).
With the introduction of the paid parking zone within the boundaries of the historical city center, there was an increase in the share of travel by public transport by 3.9% and a decrease for cars by 5.4%. The share of pedestrian traffic increased by 1.5% (
Table 5). Due to the peculiarities of simulation modeling, the approach to the public transport stop and the travel by public transport were considered as two independent movements; therefore, the total number of correspondences increased. With the expansion of the paid parking zone, the redistribution in absolute terms increased, but the relative value decreased slightly. This is due to the presence of parking spaces outside the paid parking zone and that drivers can park their car in the neighboring area without payment. The effect of loading parking lots in the areas adjacent to the paid parking zone was observed with the introduction of paid parking in Moscow and St. Petersburg in 2018–2019. A significant increase in the share of cycling (15%) for the paid parking zone in the central part of the city was caused by its very small initial value (the low base effect in the calculation) (
Table 6).
A decrease in the number of journeys by cars led to an increase in the average traffic speed by 1.9% and a decrease in the average travel time by 2.25% in the entire city. A slight increase in speed was due to the high base effect and a small share of vehicles that moved within the road network in the area of paid parking from the total number of vehicles in the city’s transport system.
The introduction of paid parking led to a decrease in transport demand for travel by personal vehicles, which led to a decrease in traffic congestion and an increase in the efficiency of traffic management. As a result, there was a decrease in fuel consumption and emissions of harmful substances from exhaust gases of ICE cars. This was due to two factors:
Car traffic decreased;
The irregularity of car traffic, the number of stops, accelerations, and braking decreased (the proportion of time when cars were moving in an unsteady mode of operation decreased).
Table 7 provides changes in the amount of emissions of harmful substances from the exhaust gases of ICE cars in the entire city with the introduction of paid parking and the expansion of its zone in the morning rush hour.
With the introduction of a parking fee in the historical center, the total amount of harmful substance emissions in the city as a whole decreased by 1.6%, and with the expansion of the zone—by 1.9%. The value of the coefficients of environmental sustainability Ke will be 1.02.
Practice of introducing paid parking showed that there was a change in demand for paid parking over time. At the initial stage, there was a decrease in demand. Some car owners refused to use cars and use other modes of transport instead. Having gained experience and having estimated the expense of journeys by new transport modes, former car owners decided to continue journeys to work using new modes of transport or use cars again. Several factors played an important role here:
Level of development and quality of work of public transport (remoteness of work and place of residence from public transport stops, presence of a direct transport route without transfers, waiting time);
Travel time (depends on the remoteness of the person’s place of residence from work, presence of light rail transport, compliance of the carrying capacity with transport demand);
Number of journeys per day, including for purposes other than work (cultural, etc.);
Need to travel with family members (take children to school, kindergarten, clubs, etc.);
Financial possibilities of the family budget to use paid parking.
The cost of 1 h of parking plays an important role in deciding whether to use a paid parking space when traveling from home to work and back or not. An increase in the cost of parking led to a decrease in the number of journeys by cars and an increase in other means of transport and other methods of transportation (
Table 8 and
Table 9).
The change in the number of journeys from home to work and back and the structure of transport demand with increasing parking costs was nonlinear and depended on several factors: the availability of free parking within walking distance, the presence of high-paid workers (the structure of job placement by field of activity and employee income) in the coverage area of paid parking, and others.
With an increase in the cost of parking due to a decrease in the number of journeys by personal transport, traffic congestion decreased and traffic parameters improved. This led to a decrease in the amount of emissions of harmful substances from the exhaust gases of ICE vehicles (
Table 10). The amount of emissions of the three most common harmful substances was reduced from 11% to 22%.
With the expansion of the paid parking zone from the boundaries of the historical city center to the boundaries of the central part, the number of parking spaces increased from 3400 to 5980 (by 66%). This then led to an increase in the intensity of changes in the number of correspondences by mode of transport (
Table 11) and transportation methods (
Table 12) when corresponding to the central part of the city. The structure of transport demand in the city as a whole changed less significantly under the influence of the cost of paid parking (
Table 13).
As can be seen from the simulation results, an increase in the cost of parking led to a decrease in the share of use of cars and an increase in the share of journeys by public transport and pedestrian traffic. The share of journeys by personal transport in the city as a whole was greater than the corresponding value for transport correspondence to the central part of the city. The intensity of changes in demand by means of transport in the city as a whole was lower than for the central part of the city with a paid parking zone.
The constant value of the bicycle traffic share in the entire city with an increase in the cost of paid parking was due to the insufficient development of cycling infrastructure. If bicycle lanes develop, there will be an increase in the share of bicycle rides at the expense of other modes of transport. A change in the demand structure by means of transport with the expansion of the paid parking zone led to an increase in the efficiency of traffic management, and, consequently, to a reduction in air pollution by emissions of harmful substances (
Table 14).
The estimated value of the coefficient k
e of environmental sustainability of the transport system for paid parking areas is 1.23. The values of indicators given in
Table 2,
Table 3,
Table 4,
Table 5,
Table 6,
Table 7,
Table 8,
Table 9,
Table 10,
Table 11,
Table 12 and
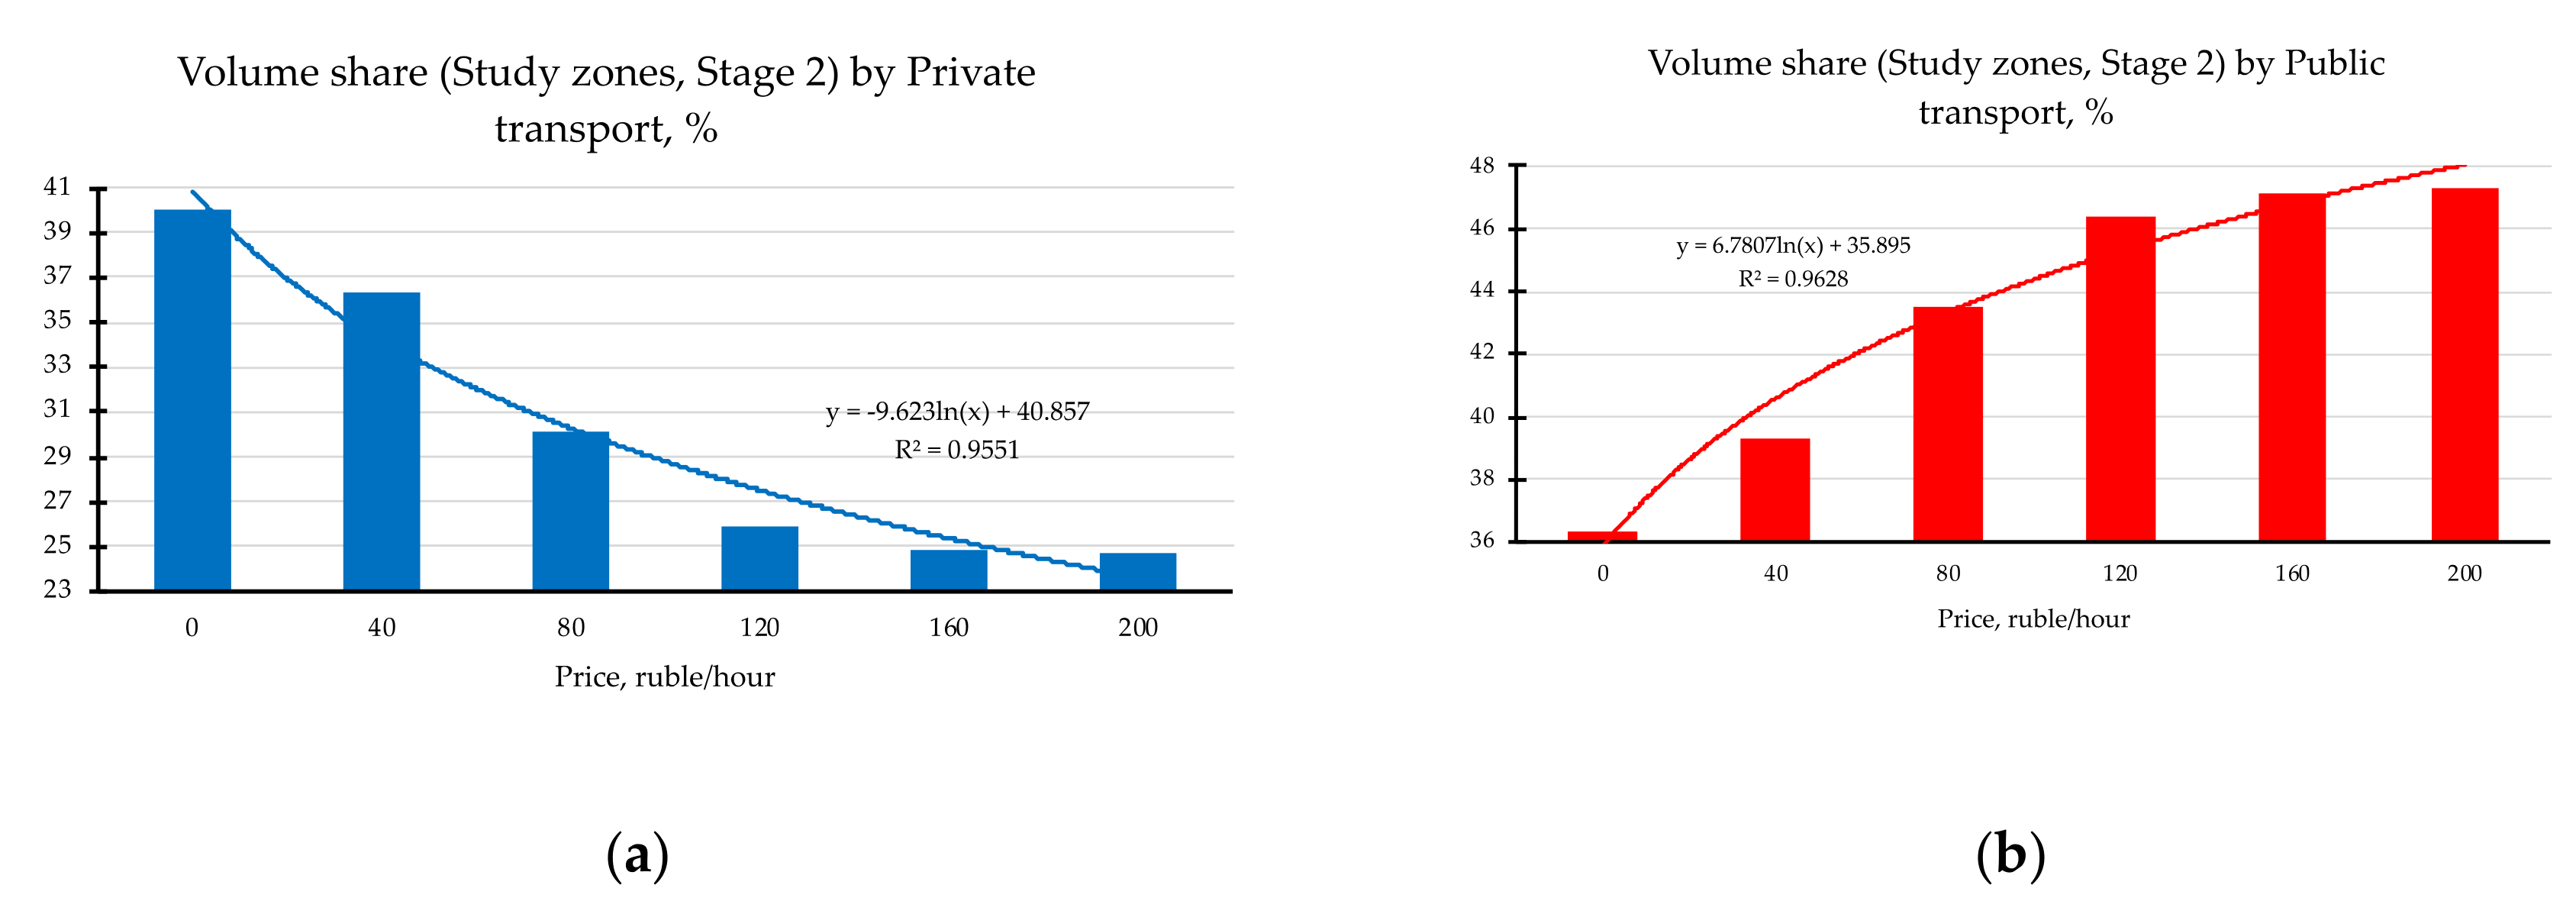
Table 13 characterize the simulated system as a whole (city) and the largest part of the system (large area of the city). In some sections of the road network, the change in indicators were even more significant. The impact of parking costs on transport demand and the amount of emissions of harmful substances for two zones with a different number of parking spaces differed in the dynamics of changes (
Figure 2 and
Figure 3).
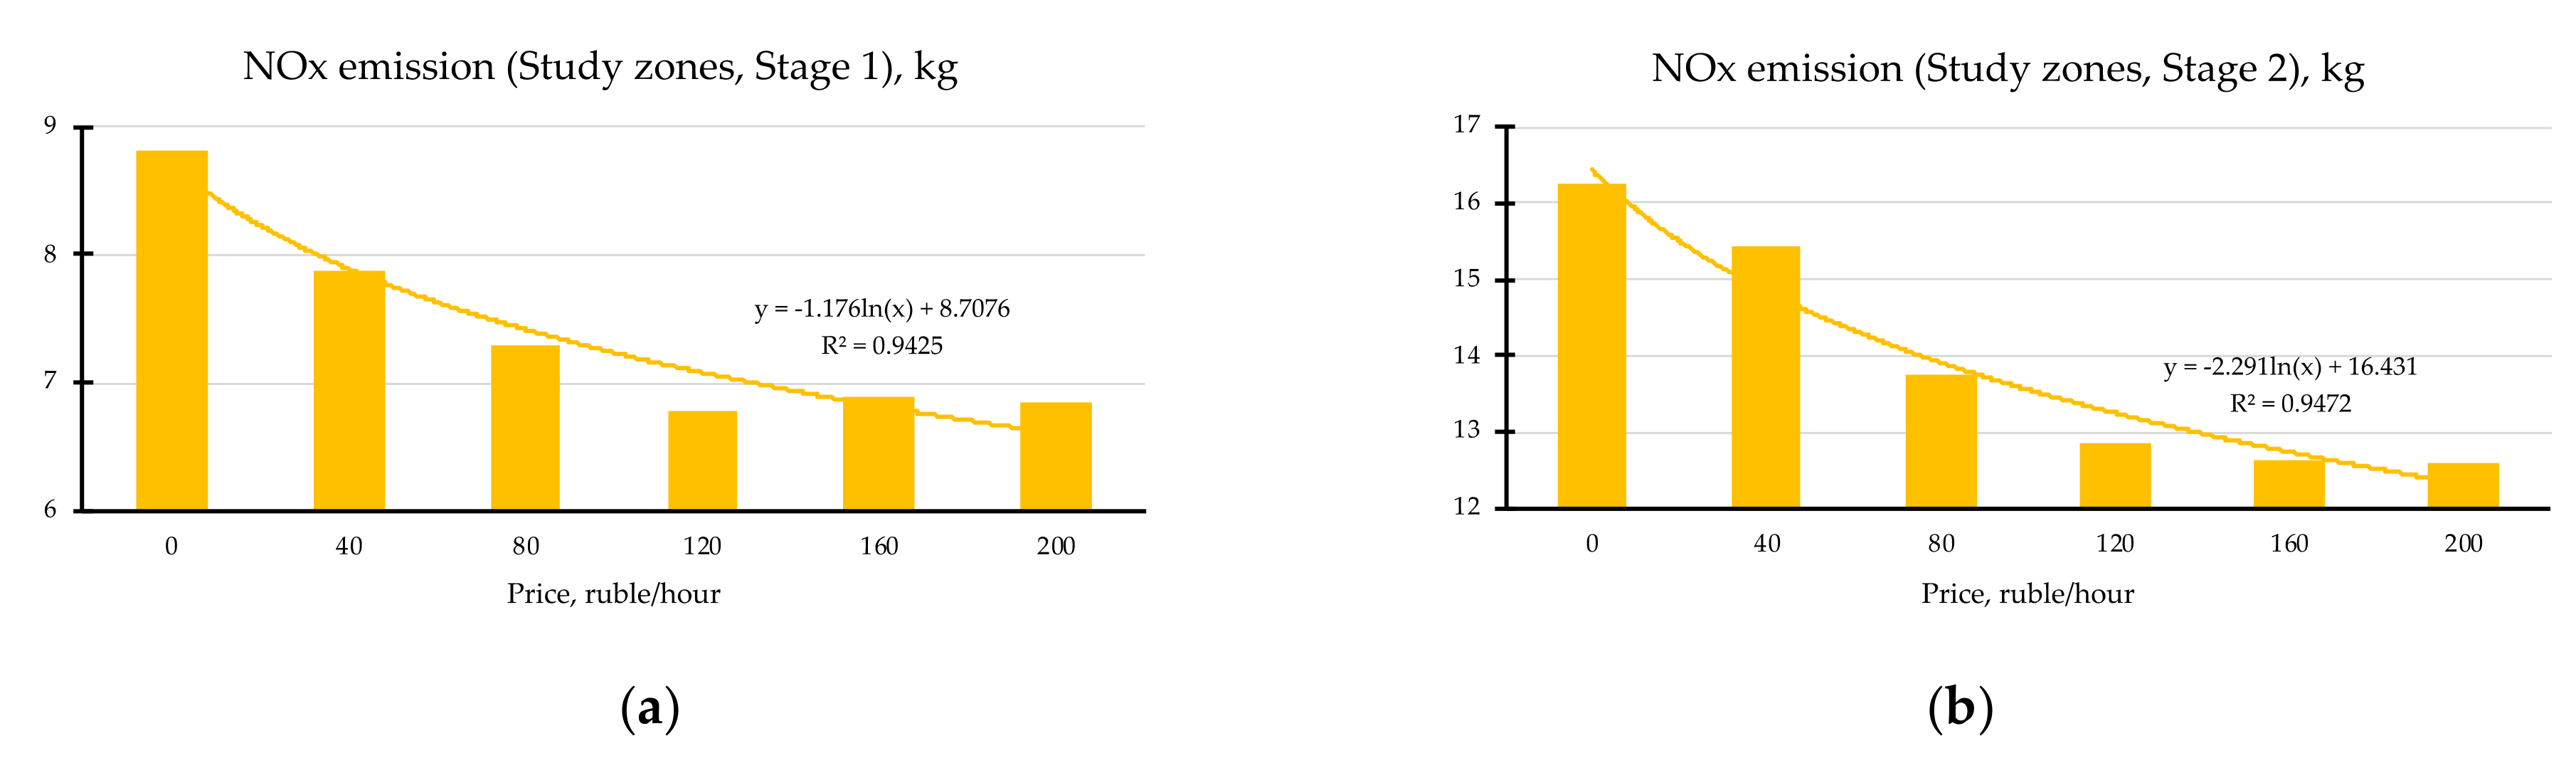
The impact of parking costs on emissions of nitrogen oxides and total emissions of harmful substances from automobile exhaust gases for two zones with a different number of parking spaces differed in the dynamics of changes (
Figure 4).
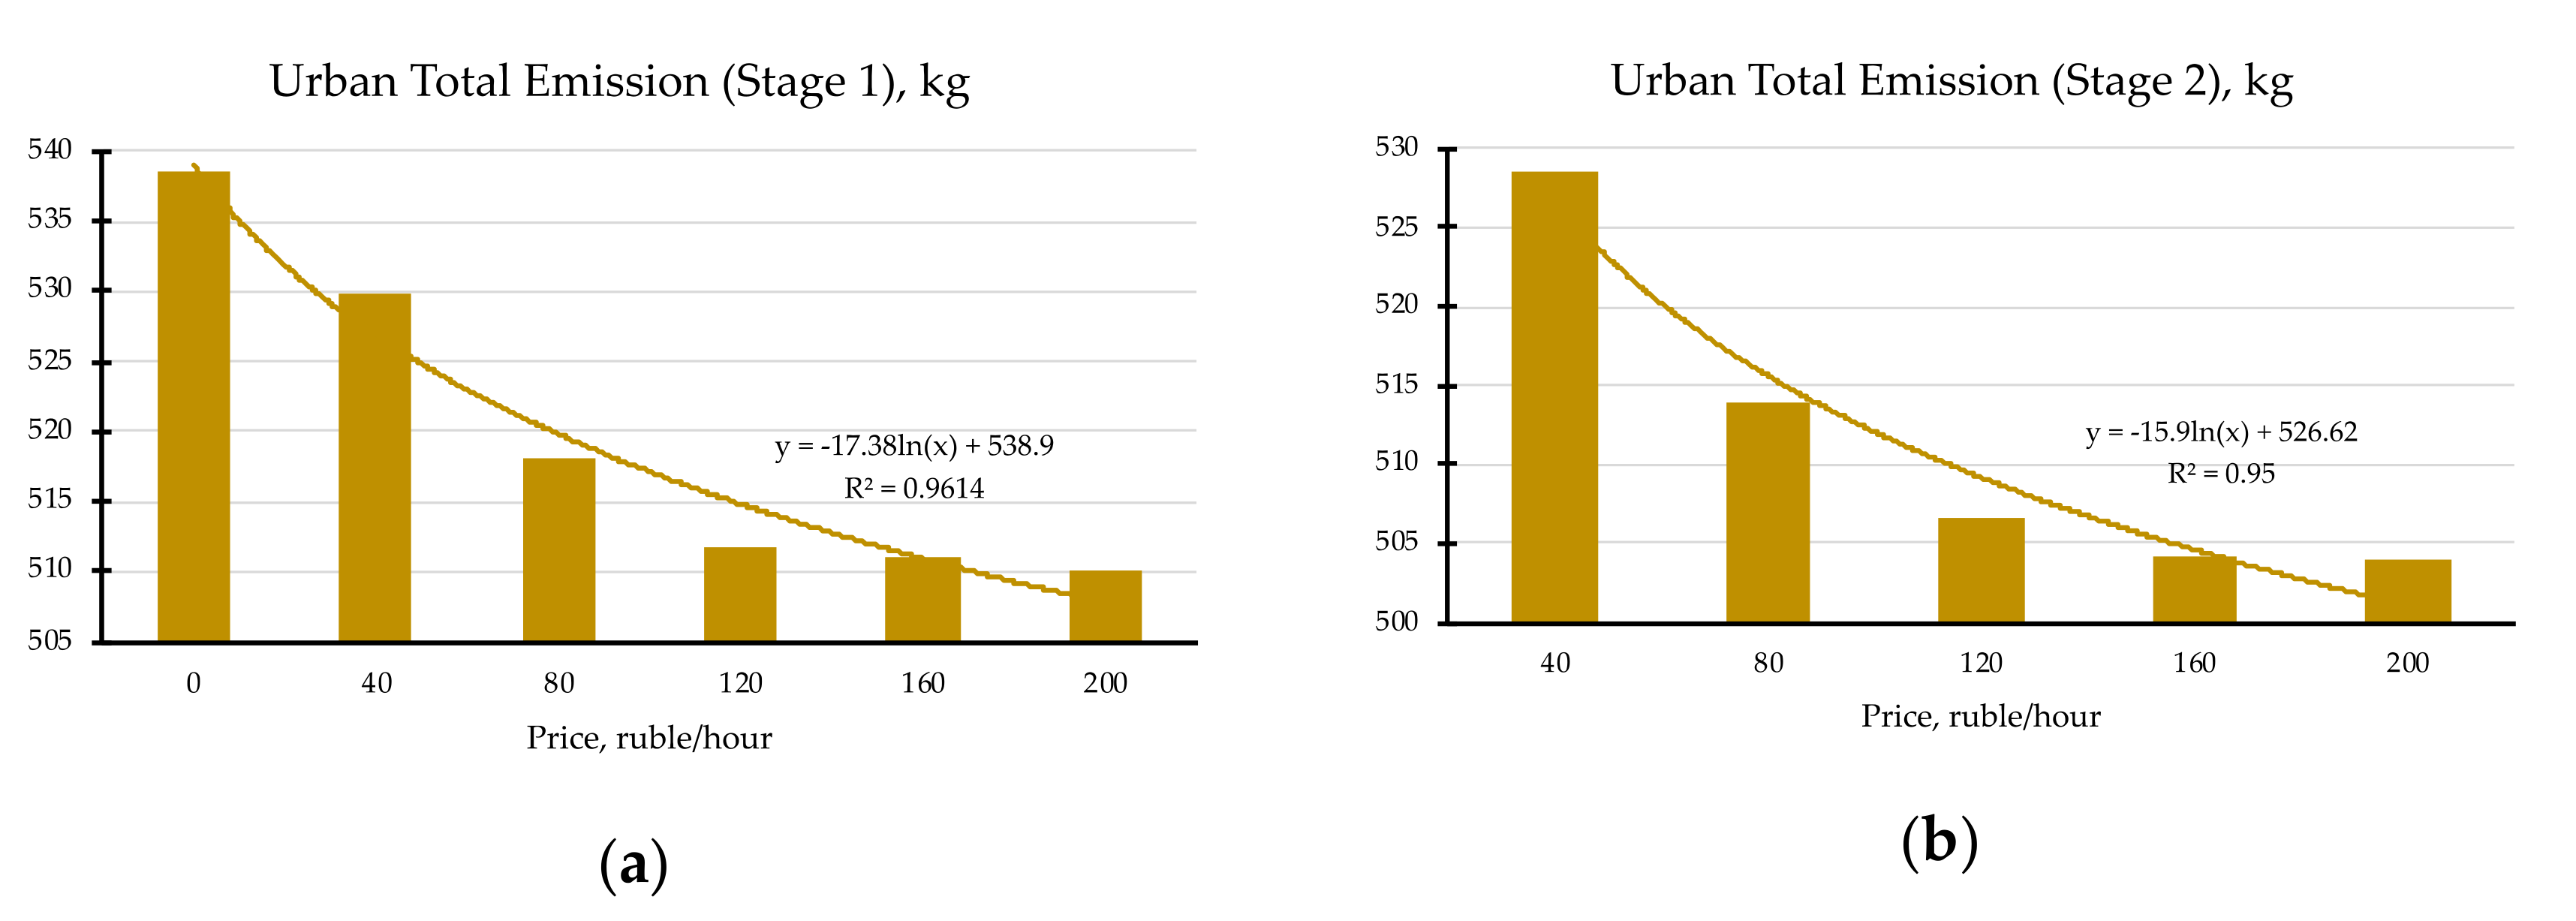
With the expansion of the paid parking zone and increase in its cost, nitrogen oxide emissions and the total emissions of harmful substances from automobile exhaust gases in the city generally decreased (
Figure 5 and
Figure 6).
An analysis of the simulation results shows that the cost of parking and its coverage area affect the transport demand to varying degrees.
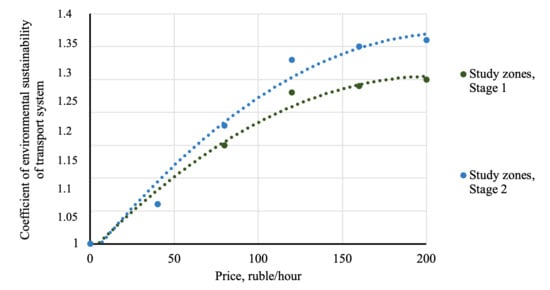
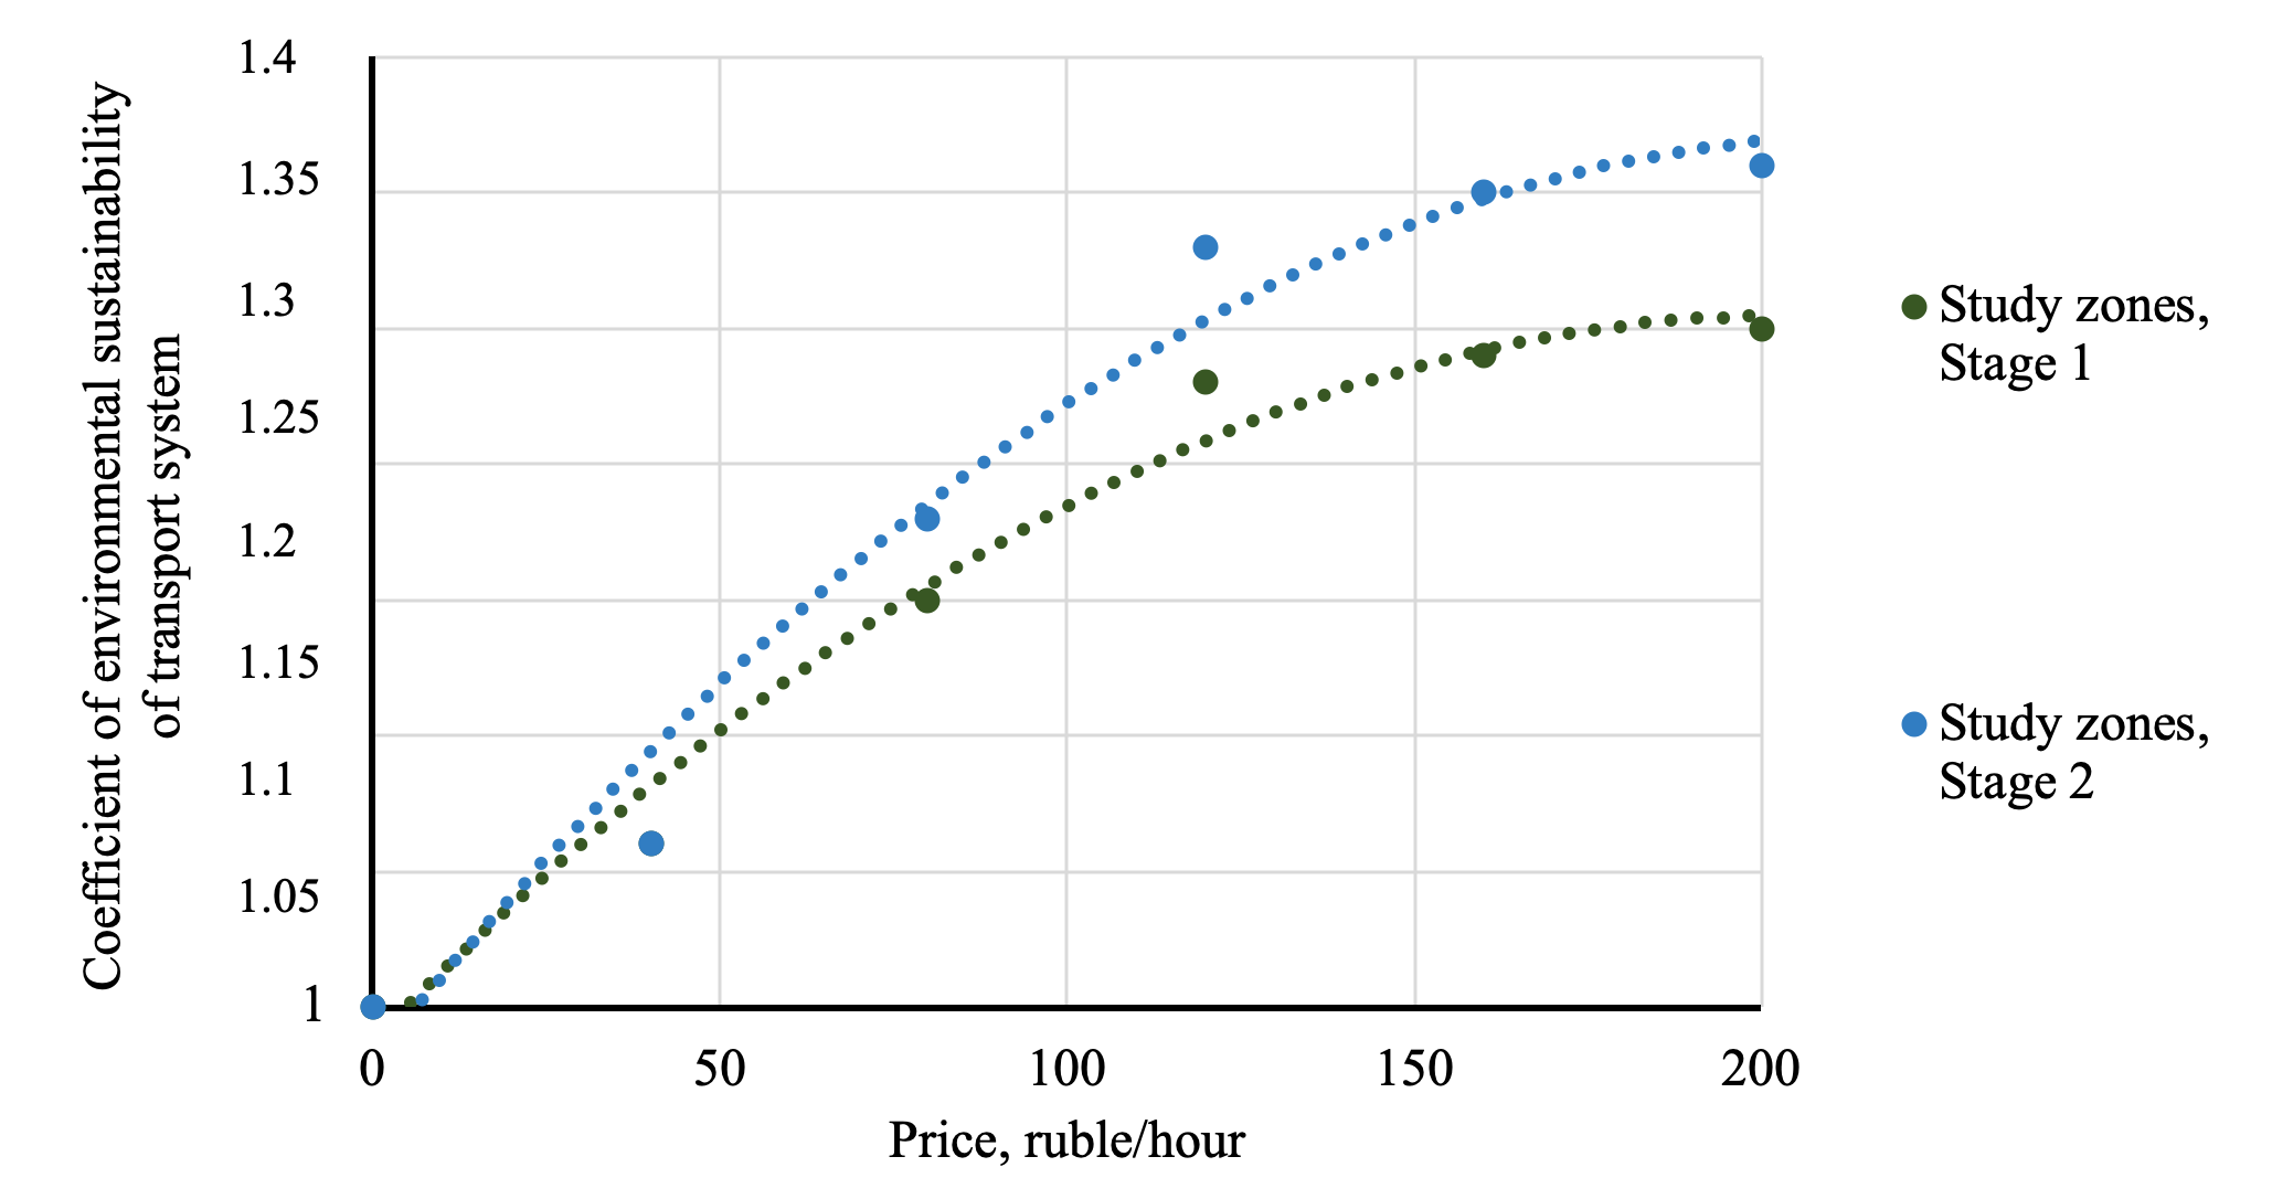
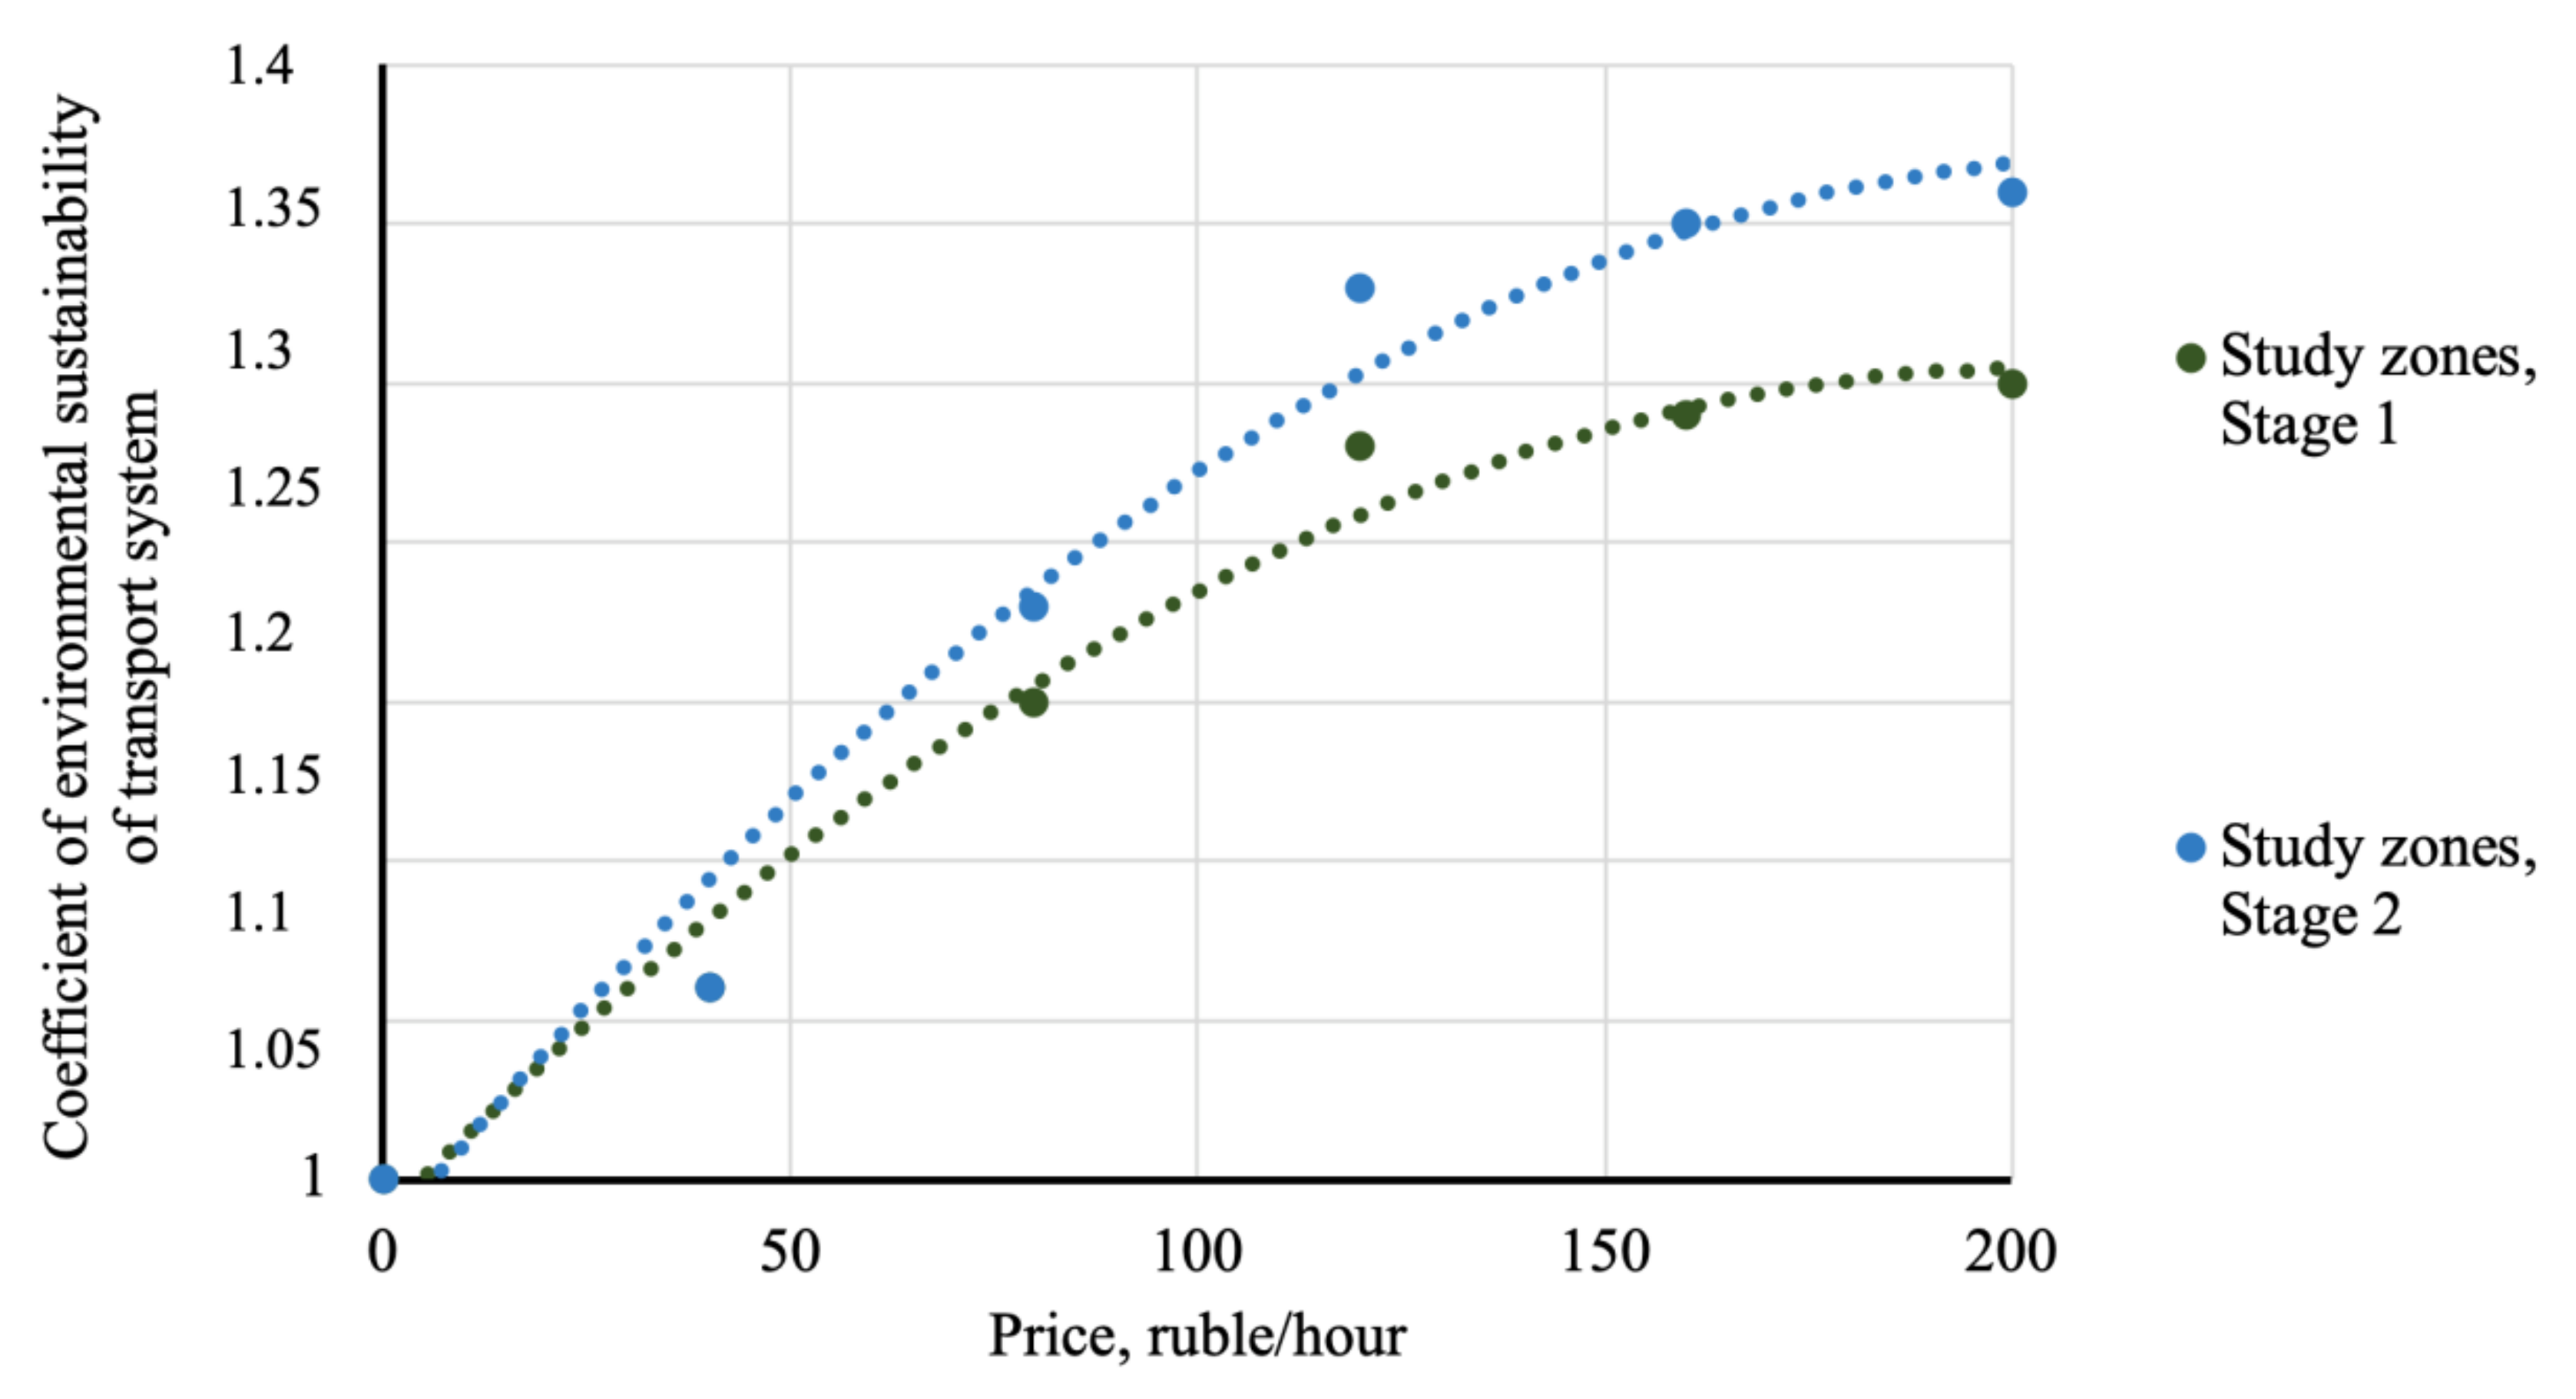
Figure 7 shows changes in the environmental sustainability indicator
ke of the transport system with changes in the cost and expansion of the area of paid parking.
The indicator changed in the range of 1.00–1.25 (for the historical part of the city) and in the range of 1.00–1.31 (for the central part of the city). The intensity of increasing environmental sustainability increased with the increasing cost of parking and the expansion of its coverage area. As can be seen from the graph (
Figure 7), the cost of parking had a greater impact on environmental sustainability than its coverage area. A change in cost from 0 to 200 rubles increased the coefficient of environmental sustainability by 31%, and the expansion of the paid parking area by 6%.
We can increase the environmental sustainability of the transport system with significant transport demand by reducing the number of journeys by private residents and using fixed-route transport. In this case, the environmental sustainability of the public transport system may slightly deteriorate as the quantity of rolling stock increases. However, the negative effect of public transport will be significantly lower than the positive effect of reducing emissions from cars. Improving the efficiency of traffic management by reducing the number of individual vehicles on highways will improve the technical and operational performance of the public transport rolling stock and the quality of passenger transportation and ride comfort.
Thus, the management of transport demand by regulating the cost of parking and the number of parking spaces can improve the environmental sustainability of the transport system. All measures that increase the environmental sustainability of the city’s transport system can be divided into groups according to several criteria.


