Article

Evaluation of RGB, Color-Infrared and Multispectral Images Acquired from Unmanned Aerial Systems for the Estimation of Nitrogen Accumulation in Rice

National Engineering and Technology Center for Information Agriculture, Key Laboratory for Crop System Analysis and Decision Making, Ministry of Agriculture, Jiangsu Key Laboratory for Information Agriculture, Jiangsu Collaborative Innovation Center for Modern Crop Production, Nanjing Agricultural University, Nanjing 210095, Jiangsu, China
*
Author to whom correspondence should be addressed.
Submission received: 3 April 2018 / Revised: 19 May 2018 / Accepted: 23 May 2018 / Published: 25 May 2018
(This article belongs to the Special Issue Remote Sensing for Precision Nitrogen Management)

Abstract

:
Unmanned aerial system (UAS)-based remote sensing is one promising technique for precision crop management, but few studies have reported the applications of such systems on nitrogen (N) estimation with multiple sensors in rice (Oryza sativa L.). This study aims to evaluate three sensors (RGB, color-infrared (CIR) and multispectral (MS) cameras) onboard UAS for the estimation of N status at individual stages and their combination with the field data collected from a two-year rice experiment. The experiments were conducted in 2015 and 2016, involving different N rates, planting densities and rice cultivars, with three replicates. An Oktokopter UAS was used to acquire aerial photography at early growth stages (from tillering to booting) and field samplings were taken at a near date. Two color indices (normalized excess green index (NExG), and normalized green red difference index (NGRDI)), two near infrared vegetation indices (green normalized difference vegetation index (GNDVI), and enhanced NDVI (ENDVI)) and two red edge vegetation indices (red edge chlorophyll index (CIred edge), and DATT) were used to evaluate the capability of these three sensors in estimating leaf nitrogen accumulation (LNA) and plant nitrogen accumulation (PNA) in rice. The results demonstrated that the red edge vegetation indices derived from MS images produced the highest estimation accuracy for LNA (R2: 0.79–0.81, root mean squared error (RMSE): 1.43–1.45 g m−2) and PNA (R2: 0.81–0.84, RMSE: 2.27–2.38 g m−2). The GNDVI from CIR images yielded a moderate estimation accuracy with an all-stage model. Color indices from RGB images exhibited satisfactory performance for the pooled dataset of the tillering and jointing stages. Compared with the counterpart indices from the RGB and CIR images, the indices from the MS images performed better in most cases. These results may set strong foundations for the development of UAS-based rice growth monitoring systems, providing useful information for the real-time decision making on crop N management.

Graphical Abstract

1. Introduction

Nitrogen (N) plays a key role in crop growth and yield formation. Rice (Oryza sativa L.) is one of the largest consumers of N fertilizers [1]. Crop nitrogen accumulation (NA), as a product of nitrogen content (NC) and biomass includes not only information on the N status, but also canopy capacity during crop growth [2,3]. Therefore, the estimation of leaf nitrogen accumulation (LNA) and plant nitrogen accumulation (PNA) is not only useful for evaluating crop production capability and predicting grain quality, but also supporting diagnosis of N status in crop production.
Remote sensing (RS) techniques have been proved to be a promising approach for crop growth monitoring [4], nutrition diagnosis [5] and yield prediction [6] in different crops. RS data is widely used to monitor crop N status, including satellite imagery [7,8], aerial photographs [9] and canopy reflectance spectra [5,10]. For example, Yao et al. [5] used ground-based hyperspectral data to detect the leaf N concentration of various growth stages in winter wheat. Huang et al. [8] used FORMOSAT-2 satellite data to estimate aboveground biomass and plant N uptake at the panicle initiation stage of rice in northeast China. Boegh et al. [9] used airborne multispectral (MS) data to quantify canopy N concentration in agriculture. Although ground-based RS sensors are easy to operate and can be used to obtain high estimation accuracy for crop growth parameters, they are costly and labor intensive. Satellite imagery often provides insufficient spatial resolution to monitor crop growth status for smallholders and is easily affected by cloud conditions. Manned airborne platforms can be used to obtain imagery with high spatial and temporal resolutions, but they are limited by high operational complexity and costs.
Unmanned aerial systems (UAS) have become prevalent and offer numerous advantages in precision agriculture, such as the ultra-high spatial resolution (e.g., centimeters), relatively low operational costs and the near real-time image acquisition [11,12]. However, they also have a significantly low payload capacity, so light-weight compact sensors are required, and these sensors have been developed and mounted on various UAS for remote sensing applications [13,14,15,16]. The most affordable sensors are off-the-shelf digital cameras with red, green and blue bands. One of the successful applications of UAS in agricultural management was reported by Hunt et al. [11], who used a digital camera attached to a model aircraft to estimate the biomass of corn, alfalfa and soybean. They found a linear correlation between biomass and the normalized green–red difference index (NGRDI) derived from the RGB images. Zhu et al. [17] investigated the possibility of using digital imagery collected by a UAS to monitor N status in paddy fields. Córcoles et al. [18] measured canopy cover in an onion crop with RGB images from UAS and determined the relationship between canopy cover and leaf area index (LAI). However, reflectance in the near infrared (NIR) wavelengths varied most across the growing season due to increasing biomass at the canopy level [19], and numerous vegetation indices (VIs) proposed for biomass or LAI estimation included NIR bands [20,21,22]. Therefore, a few studies have attempted to modify RGB cameras by replacing the red or blue channel with a NIR filter to obtain color near-infrared (CIR) images. For instance, Hunt et al. [23] developed a digital CIR camera system and found a good correlation between LAI and green normalized difference vegetation index (GNDVI) from the imagery of winter wheat. This CIR camera system has also been used by Hunt et al. [24] to estimate the biomass of winter cover crops. Lebourgeois et al. [25] used a UAS equipped with two digital cameras (RGB and CIR cameras) to investigate sugarcane N status and determined the optimal VI to estimate leaf and canopy N content. Recently, mounting MS cameras has become a new alternative approach for precision agriculture. More complex analysis has been done using MS cameras with more spectral bands, allowing advanced vegetation studies. They were applied to water stress detection [26], disease detection [27] and vigor monitoring [28,29]. The UAS images in the aforementioned studies have been used to estimate the agronomic parameters LAI [30,31,32] and biomass [24,33]. N status, as one of the most important agronomic parameters in precision farming, needs to be addressed with UAS due to the low efficiency of other RS techniques.
Whether a UAS platform could be applied to monitor N status needs to be evaluated. Furthermore, the performance of multiple sensors onboard UAS for the same purpose has rarely been compared. Von Bueren et al. [34] evaluated the spectral quality of four different types of optical UAS-based sensors (RGB camera, CIR camera, six band MS camera and a high resolution spectrometer) and found that a MS camera can collect imagery with high radiometric quality in the red edge region. Although RGB and CIR cameras have been widely applied in precision agriculture, the stability of the models established with indices from RGB and CIR images needs to be validated with the test set. Most importantly, in order to better apply UAS to precision agriculture, we need to clarify how far these cameras can be used during the whole season or at a certain growth stage, and how to choose a proper camera for N status monitoring in terms of cost, data processing efficiency and study area size. Therefore, the objective of the present study was to evaluate the performance of different sensors onboard UAS on LNA and PNA estimation in rice. The anticipated results would provide guidance on how to choose a proper camera for N accumulation estimation, and lay foundations for developing non-destructive and rapid monitoring of N status with UAS in rice crops.

2. Materials and Methods

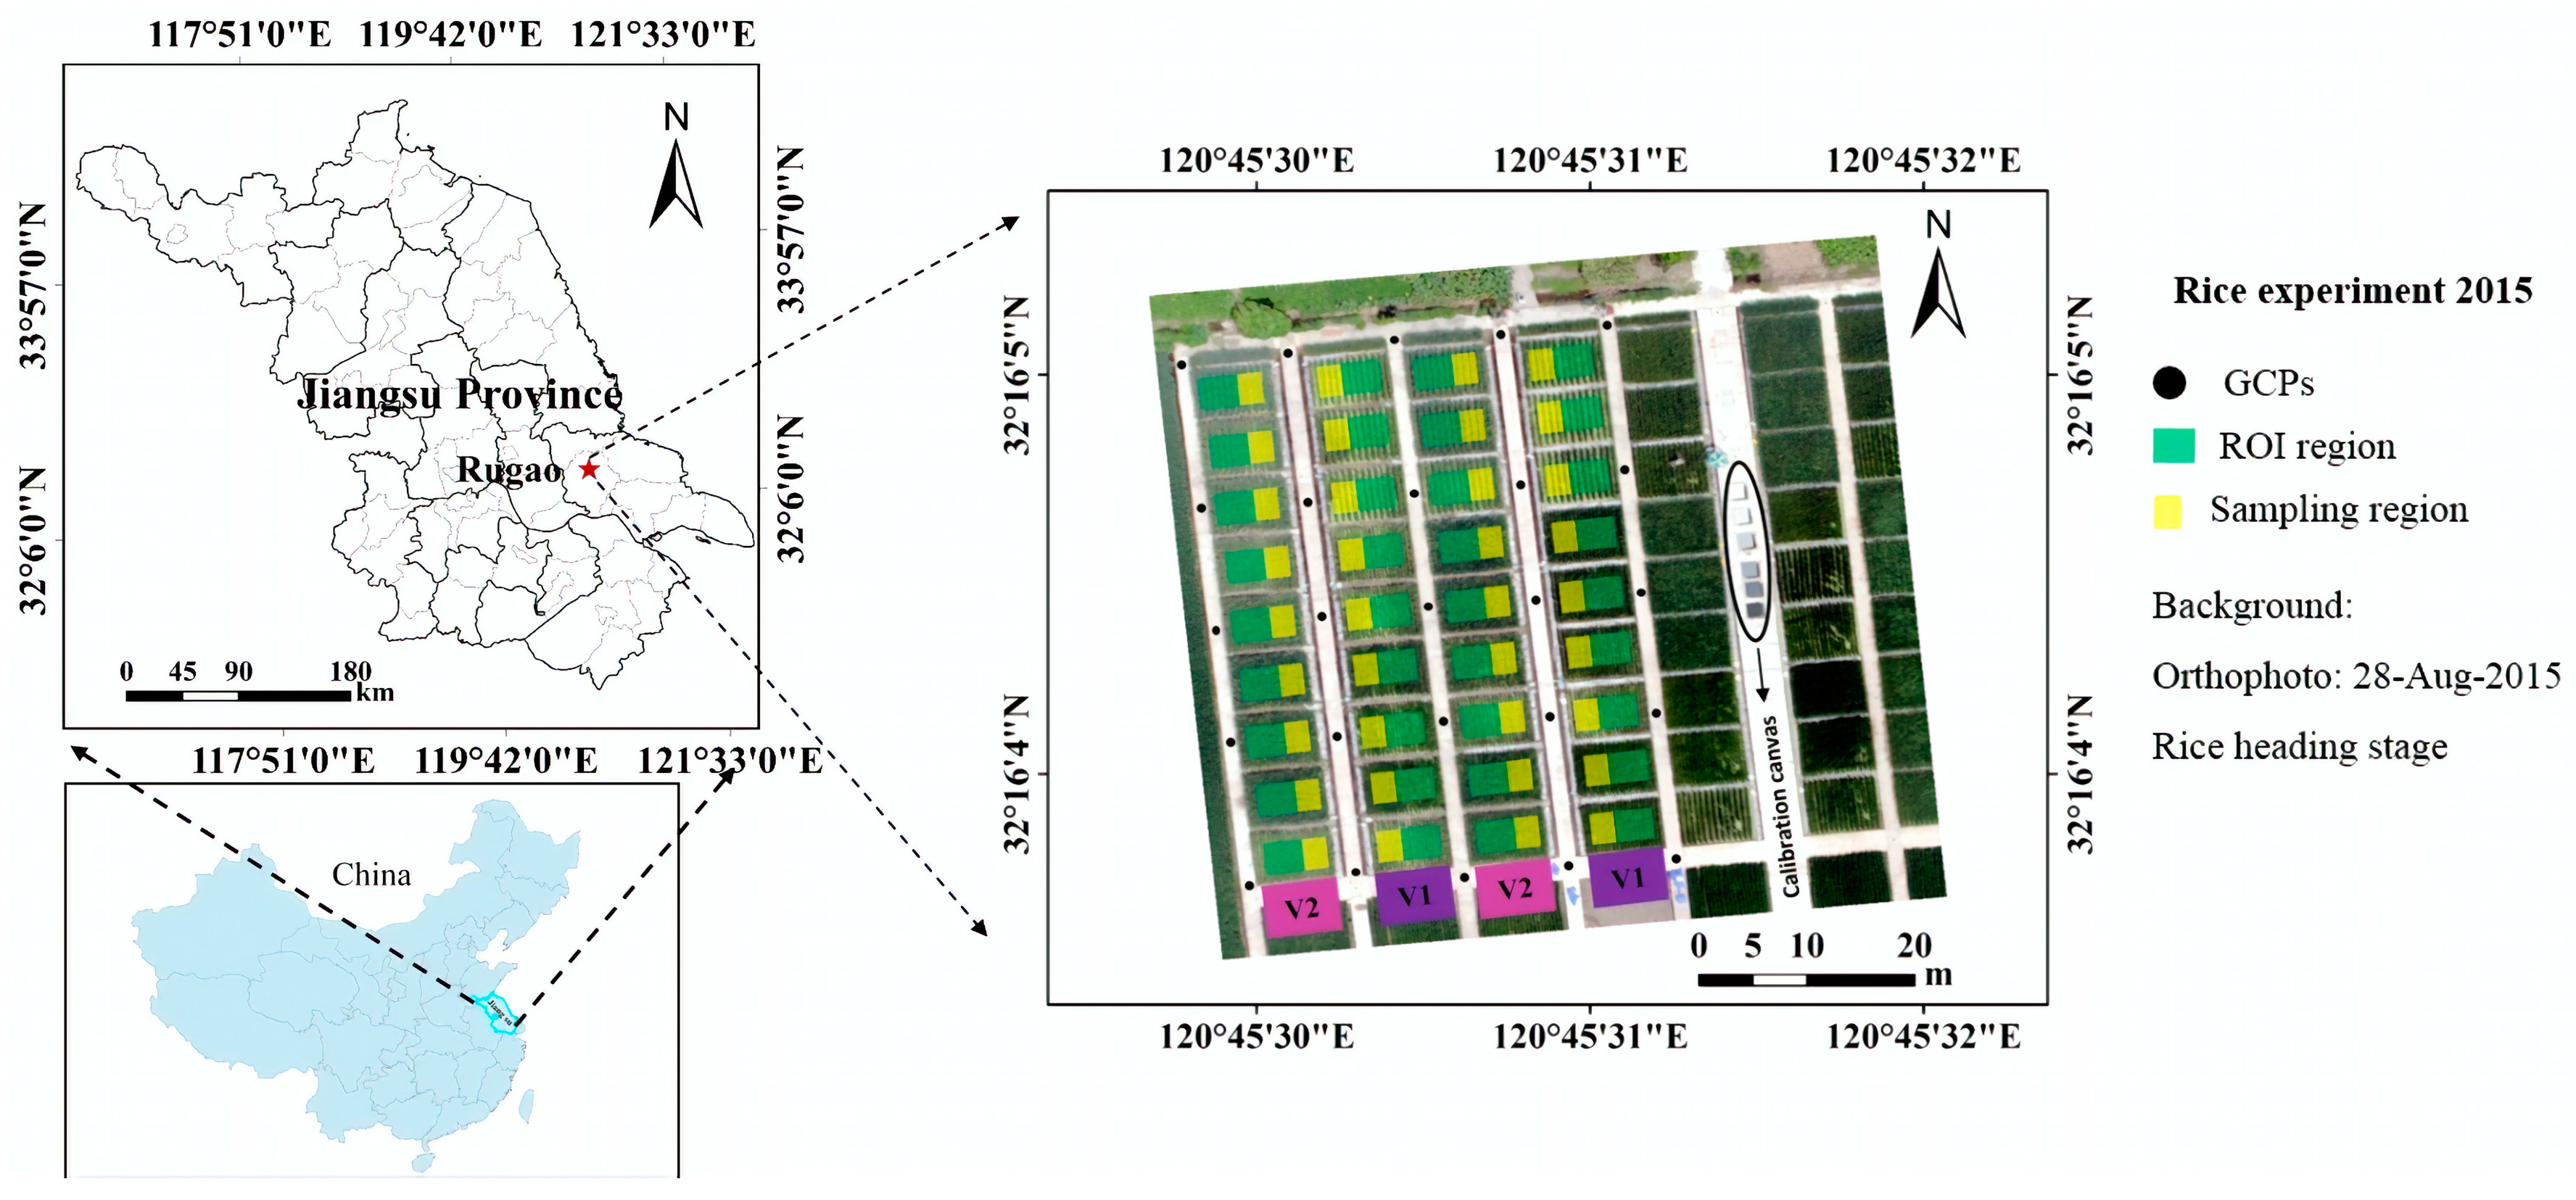
2.1. Experimental Design

Two field experiments were designed, involving different N rates, planting densities and rice cultivars. All the experiments were conducted in the experimental station of the National Engineering and Technology Center for Information Agriculture (NETCIA) located in Rugao city, Jiangsu province, China (120°45’E, 32°16’N) (Figure 1). In 2015, one japonica rice cultivar Wuyunjing24 (V1) and one indica rice cultivar Yliangyou1 (V2) were seeded at day of year (DOY) 136 and transplanted into the paddy field at DOY 166. Four N rates (0 (N0), 100 (N1), 200 (N2) and 300 (N3) kg N ha−1 as urea) were applied with one density (0.30 m × 0.15 m) for the minimum and maximum N rates and two densities (0.30 m × 0.15 m and 0.50 m × 0.15 m) for the intermediate N rates. The N fertilizers were applied in the form of urea: 40% as basal fertilizer before transplanting, 10% at the tillering stage, 30% at the jointing stage and 20% at the booting stage. The plot size was 30 m2 with 6 m in length and 5 m in width. In 2016, the experiment was conducted with the same plot size and rice cultivars. The two rice cultivars were seeded at DOY 138 and transplanted with two planting densities (0.30 m × 0.15 m and 0.50 m × 0.15 m) into the paddy field at DOY 168. Three N rates (0 (N0), 150 (N1) and 300 (N2) kg N ha−1 as urea) were applied with 40% as basal fertilizer before transplanting, 20% at the tillering stage, 20% at the jointing stage and 20% at the booting stage.

2.2. Field Measurements

The UAS flight dates were adjusted to the field sampling dates as much as weather conditions allowed (Table 1). Due to the poor weather conditions, we could only take high quality UAS images on 5 August, 2015. Although this was three days after the fertilization application, we believe significant N uptake by the rice plants has not yet occurred [35]. For the field destructive sampling, 3 hills of rice plants were randomly selected from the sampling region of each plot and separated into leaves and stems. All the samples were oven-dried for 30 min at 105 °C and later at 80 °C to a constant weight, then weighted, ground and stored in plastic bags for chemical analysis. The total N content in the leaf and stem tissues was determined using the micro-Keldjahl method [36]. The N accumulation (g m−2) of leaves (LNA) and plants (PNA) was calculated as the product of N content (%) and dry biomass (t ha−1) of leaves and whole aboveground plants, respectively.

2.3. UAV Campaigns and Sensors

The UAV used in this study was the Mikrokopter OktoXL [37], an eight-rotor aircraft with a maximum payload capacity of 2.5 kg. This UAV has a flight duration of 8–25 min, depending on the battery and actual payload. Three cameras were mounted onboard the UAV separately for image collection and their technical specifications were listed in Table 2. The Tetracam mini-MCA6 (Tetracam Inc., Chatsworth, CA, USA) MS camera has six channels and was evaluated in the literature for other purposes [32,38,39,40]. The camera has user configurable band pass filters (Andover Corporation, Salem, NH, USA) of 10-nm full-width at half-maximum and center wavelengths at blue (490 nm), green (550 nm), red (680 nm), red edge (720 nm), NIR1 (800 nm) and NIR2 (900 nm). The camera was run on a 3 s shutter release interval and collected images in a 10 bit RAW format. The other two cameras collected true color and CIR images in JPEG format, respectively. The true color camera was a Canon 5D Mark III (Canon Inc., Tokyo, Japan) with a 22.1 megapixel (MP) CMOS sensor. The CIR camera was a NIR–green–blue camera, which was a modified Canon PowerShot SX260 with a 12.1 MP CMOS sensor (www.maxmax.com). After filter modification, the red channel became near-infrared and the other two channels remained the same. These two cameras were set to continuous data capturing at 1 frame per second (fps), with an exposure time manually set for each flight according to light conditions.
The UAS was flown over the paddy field on three dates at the heights of 50 m and 100 m above ground level during the 2015 and 2016 growing seasons (Table 2). Flight speed and route planning were fixed during the whole season. Additionally, all flights were carried out in stable ambient light conditions between 11:00 a.m. and 1:30 p.m. when the sun elevation angle was in the range of 56–72°.

2.4. Image Processing

2.4.1. Image Preprocessing

After the flights, the MS images were downloaded from the memory cards and processed in the IDL/ENVI environment (Exelis Visual Information Solutions, Boulder, CO, USA). The image preprocessing workflows followed Kelcey and Lucieer [41]. In short, the following three corrections were applied: (i) noise reduction using dark current imagery; (ii) lens vignetting correction based on spatially dependent correction factors; and (iii) removal of lens distortion with a modified Brown–Conrady model. To reduce the band-to-band misalignment, the six bands were co-registered with a total of 25 ground control points marked on the concrete roads within the study area (Figure 1). Six spectrally flat calibration canvases (1.2 × 1.2 m) with reflectance intensities at 3%, 6%, 12%, 22%, 48% and 64% were placed within the UAS flight overpass. With these calibration canvases, the digital number (DN) values of the images were transformed into reflectance values by applying an empirical line correction method [37,42]. The empirical line correction coefficients established between the convoluted ASD-FieldSpec4 and the six acquired mini-MCA spectral bands were then applied per pixel to the MS images. The reflectance of each plot was represented by the average of the reflectance values over the non-sampling area of the plot.
RGB and CIR cameras are consumer-grade sensors and there is no rigorous pre-processing procedure for them. Dark offset imagery was generated for the two cameras in a totally dark environment and there is no need to do noise correction due to extremely low noise. The effect of lens vignetting and distortion could be ignored since the RGB and CIR images covered a large area and the photos with the sampling plots in the nadir area were selected for subsequent analysis. The DN values of the RGB and CIR images were not radiometrically corrected to surface reflectance using the calibration canvas due to the complexity of determining the spectral sensitivity for each channel. As the RGB and CIR images had higher spatial resolutions than the MS image, they were down-sampled to the same spatial resolution as that of the MS image (Figure 2). The DN value of each plot was represented by the average of DN values over the non-sampling area of the plot.

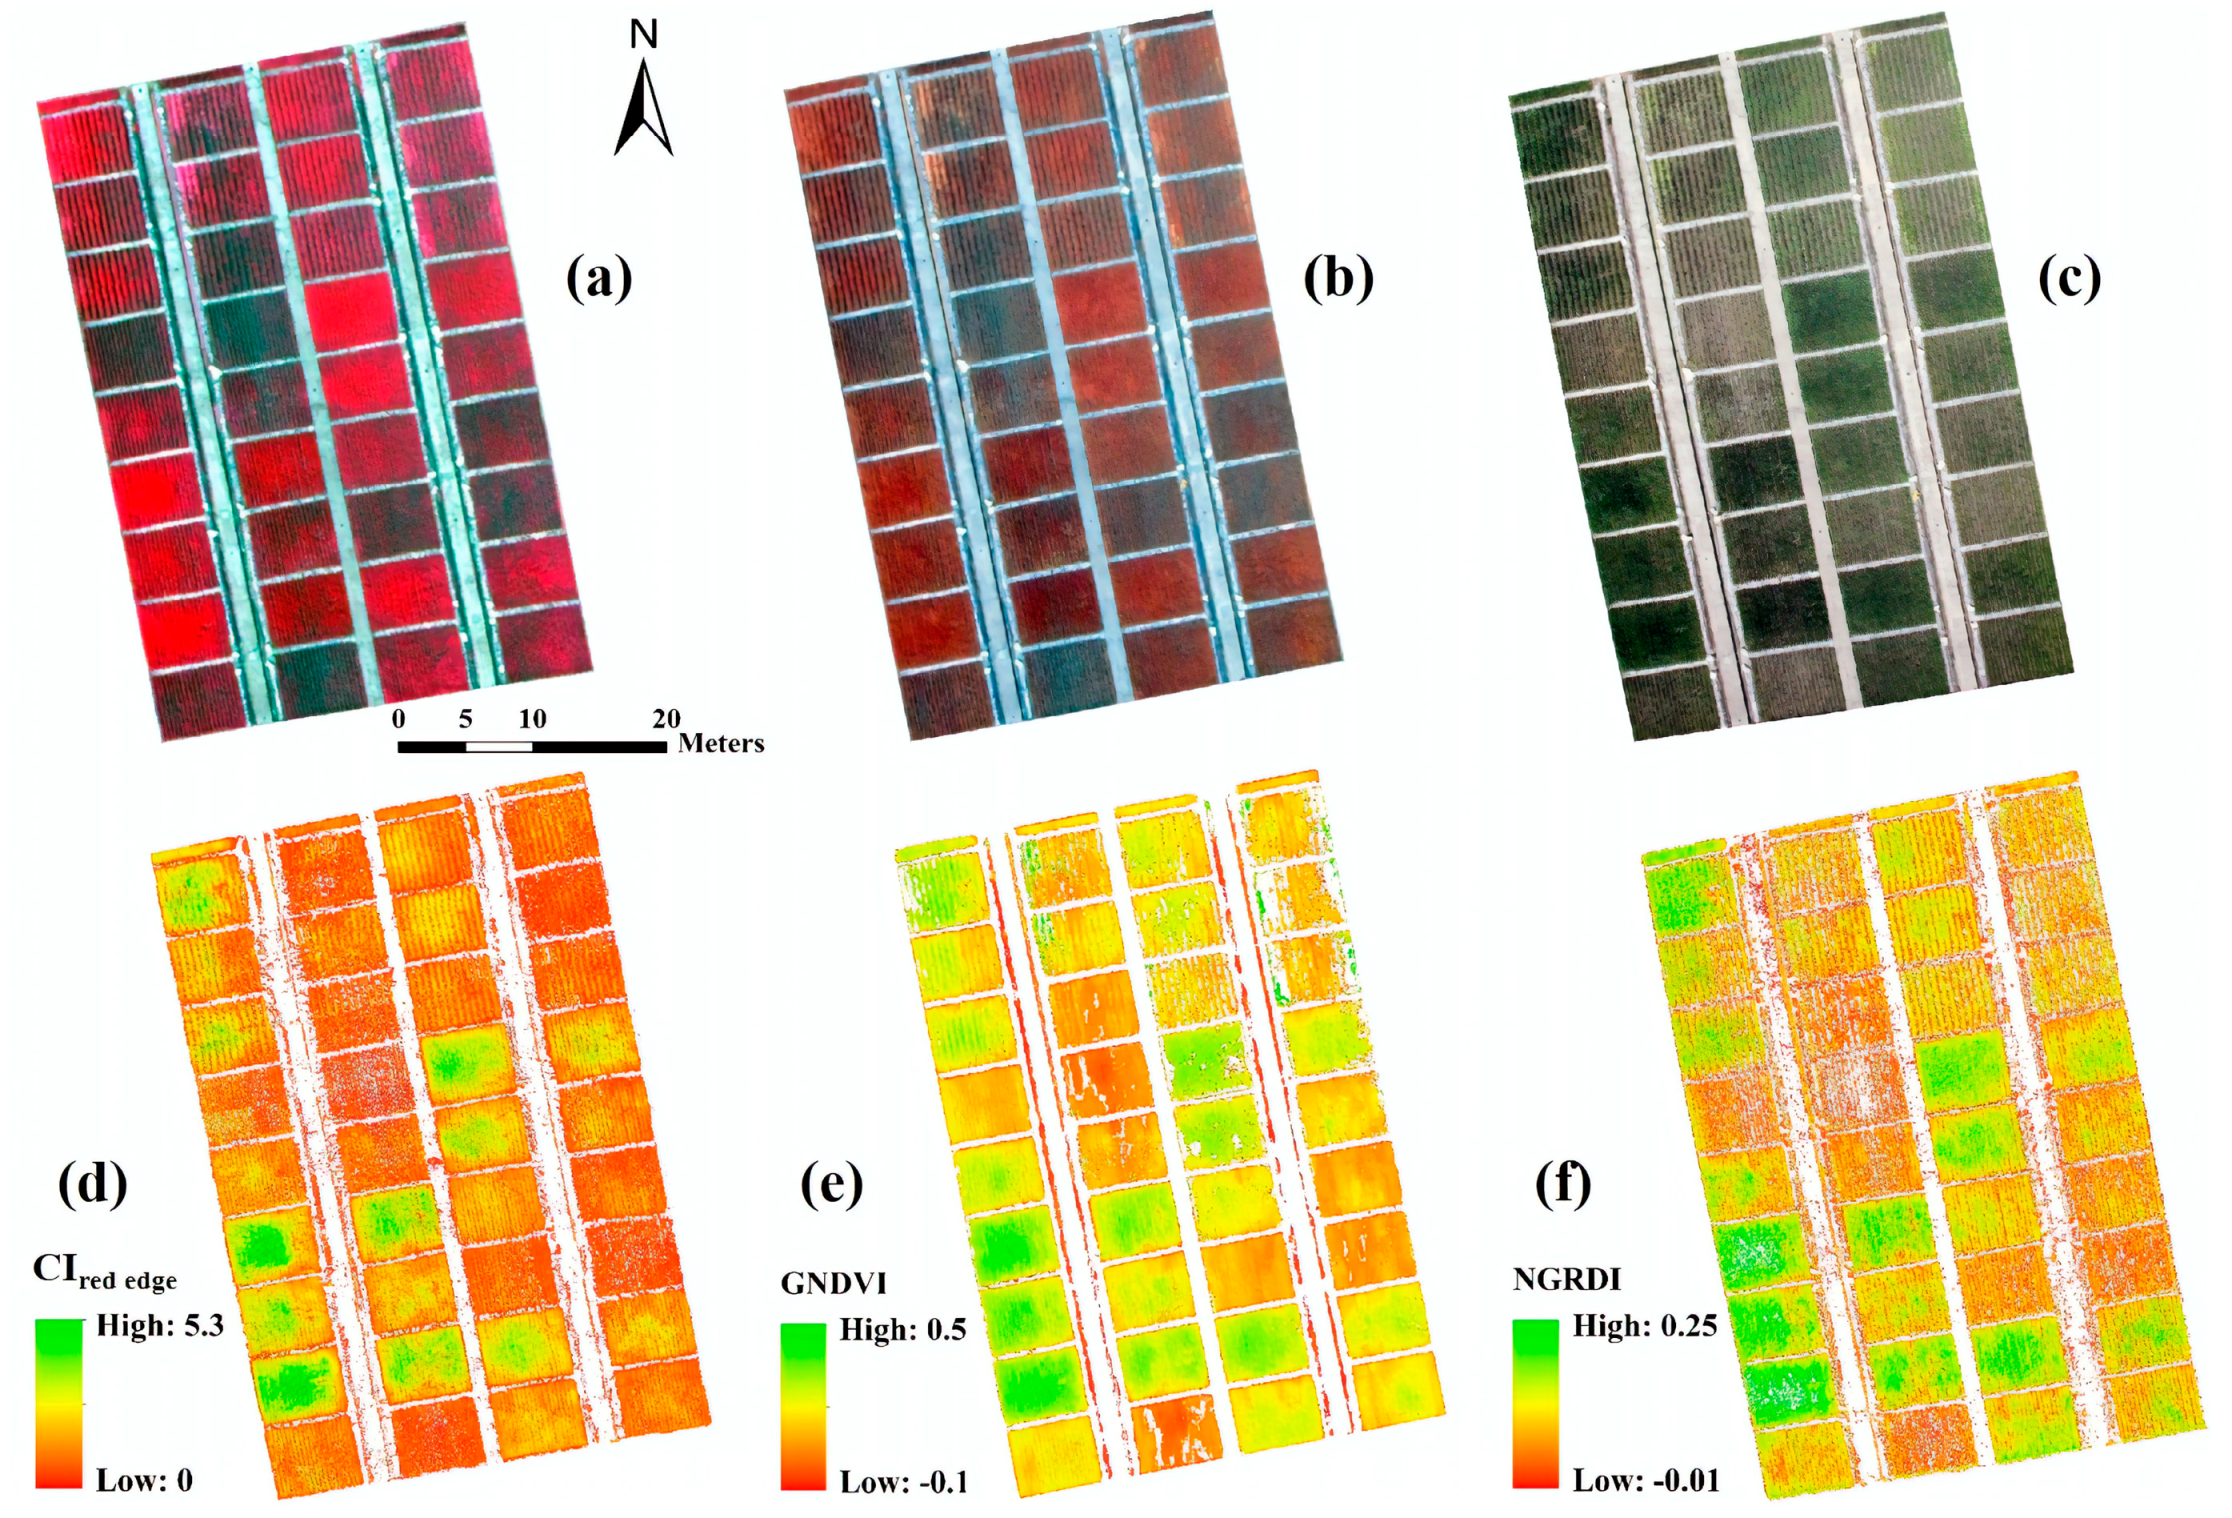
2.4.2. Calculation of Vegetation Indices

Given the specific band configurations of the three cameras, six VIs were examined for the estimation of LNA and PNA (Table 3). From the RGB images, we calculated two color indices, the normalized excess green index (NExG) [43] and NGRDI [44], because NExG has been proved to possess the ability to quantify crop responses under different conditions [45], and NGRDI was originally proposed for vegetation fraction estimation and found to be related to crop biomass before canopy closure with RGB imagery from UAS [11]. From the CIR images, we chose two NIR VIs, GNDVI [46] and enhanced NDVI (ENDVI), because GNDVI was shown to be linked to chlorophyll concentration, and ENDVI was recommended by the company that converted the cameras (www.maxmax.com) and also shown to detect vegetation vigor well [45]. For the MS images, we had more options for VIs due to the multiple bands. Except for the color indices and NIR VIs, two red edge VIs (CIred edge [47] and DATT [48]) were employed for N accumulation estimation, because they both had a strong capability in chlorophyll contents estimation in higher plants. The VIs from the MS images were calculated with reflectance values and those from the RGB and CIR images were with DN values.

2.5. Data Analysis

The correlations between agronomic parameters and VIs were analyzed using MATLAB R2010b software (The MathWorks, Inc., Natick, MA, USA). The experimental data collected in 2015 were used to develop the regression models and data collected in 2016 were subsequently used to validate the regression models. Generally, the estimation performance of the model was evaluated by comparing the differences in coefficient of determination (R2) and root mean square error (RMSE). The model performance was more accurate with an R2 near to 1, and an RMSE near to 0.

3. Results

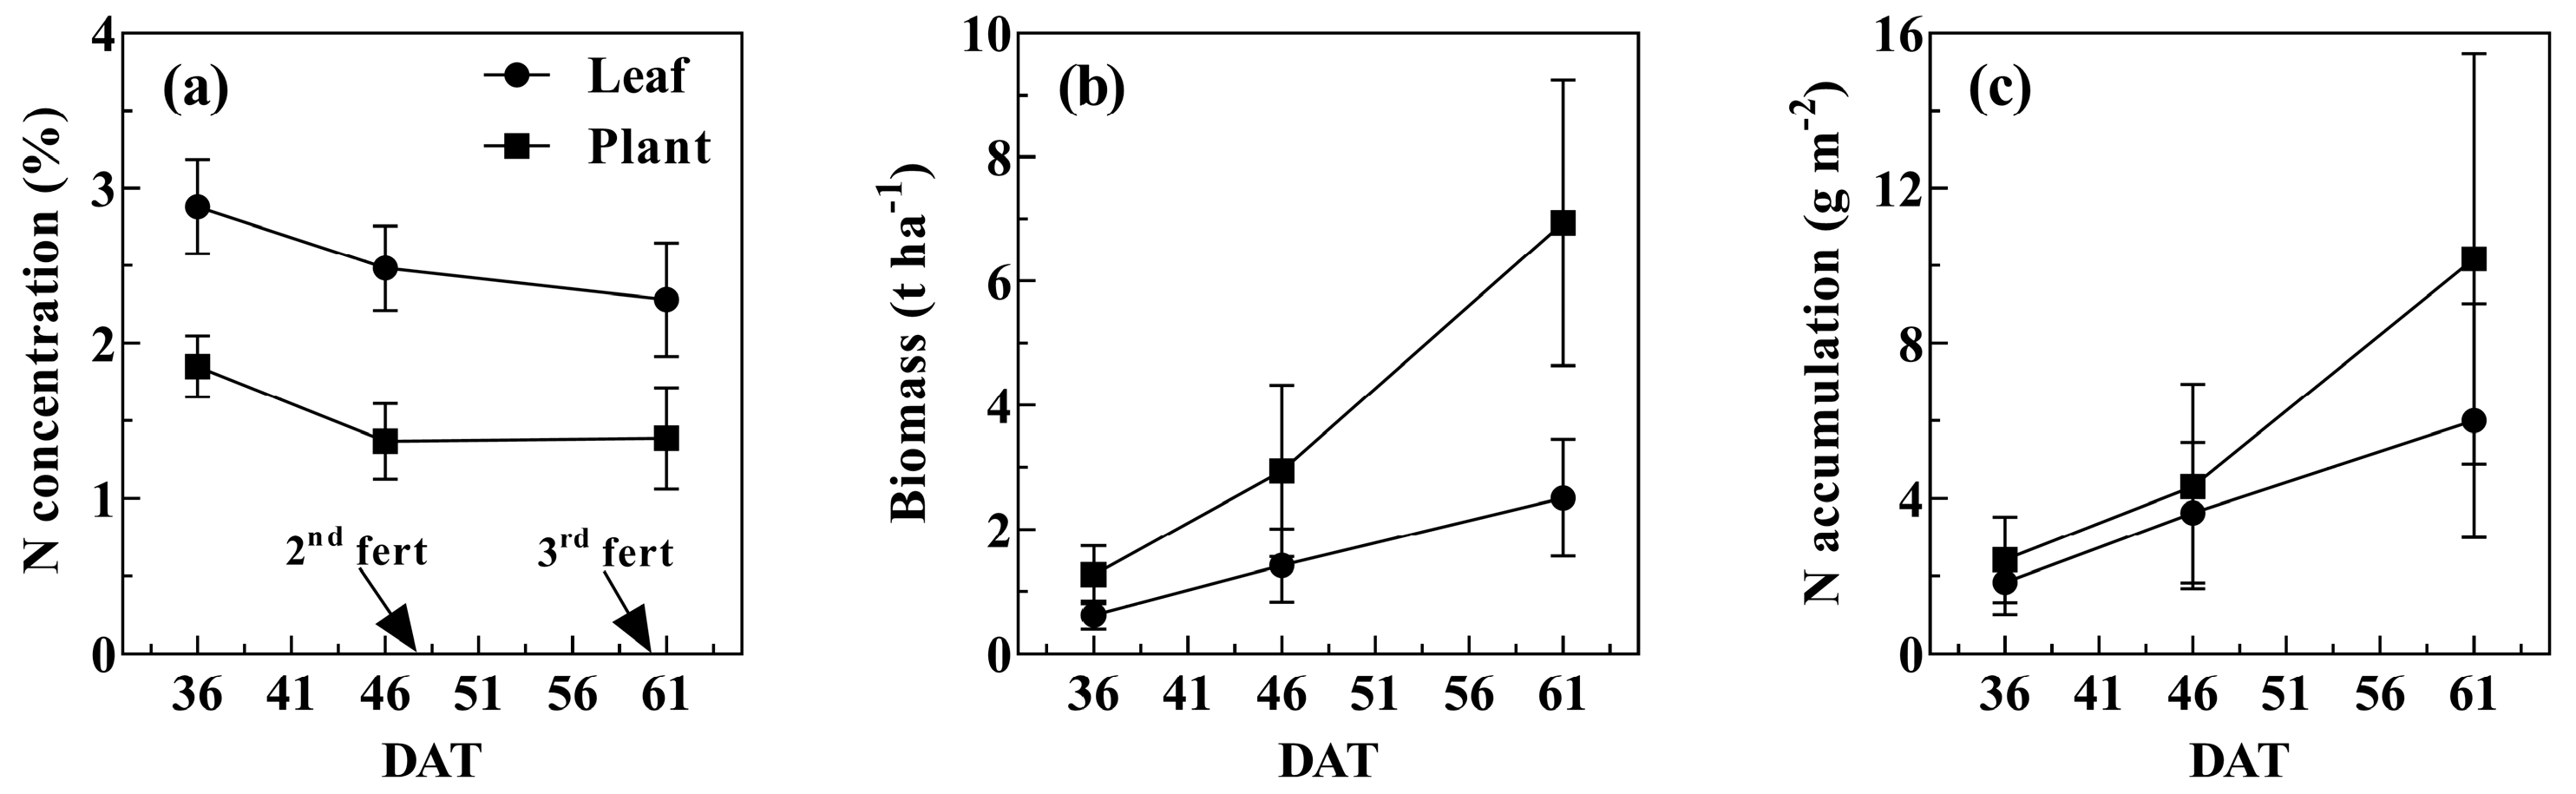
3.1. Variation of Agronomic Variables over the Three Growth Stages

Figure 3 shows the overall trend of leaf or plant N status and biomass from the 2015 field dataset. Leaf N concentration kept decreasing from the tillering stage (2.55%) to the booting stage (2.28%). Plant N concentration decreased from tillering (1.85%) to jointing (1.37%) and remained stable following the application of the second top-dressing fertilizer. Leaf biomass increased consistently as the rice plants developed (from 0.62 t ha−1 to 2.52 t ha−1). Plant biomass increased from 1.27 t ha−1 at the tillering stage to 2.95 t ha−1 at the jointing stage and then doubled after the second top-dressing. LNA and PNA were close at the tillering and jointing stages, but became significantly different after the second fertilization.

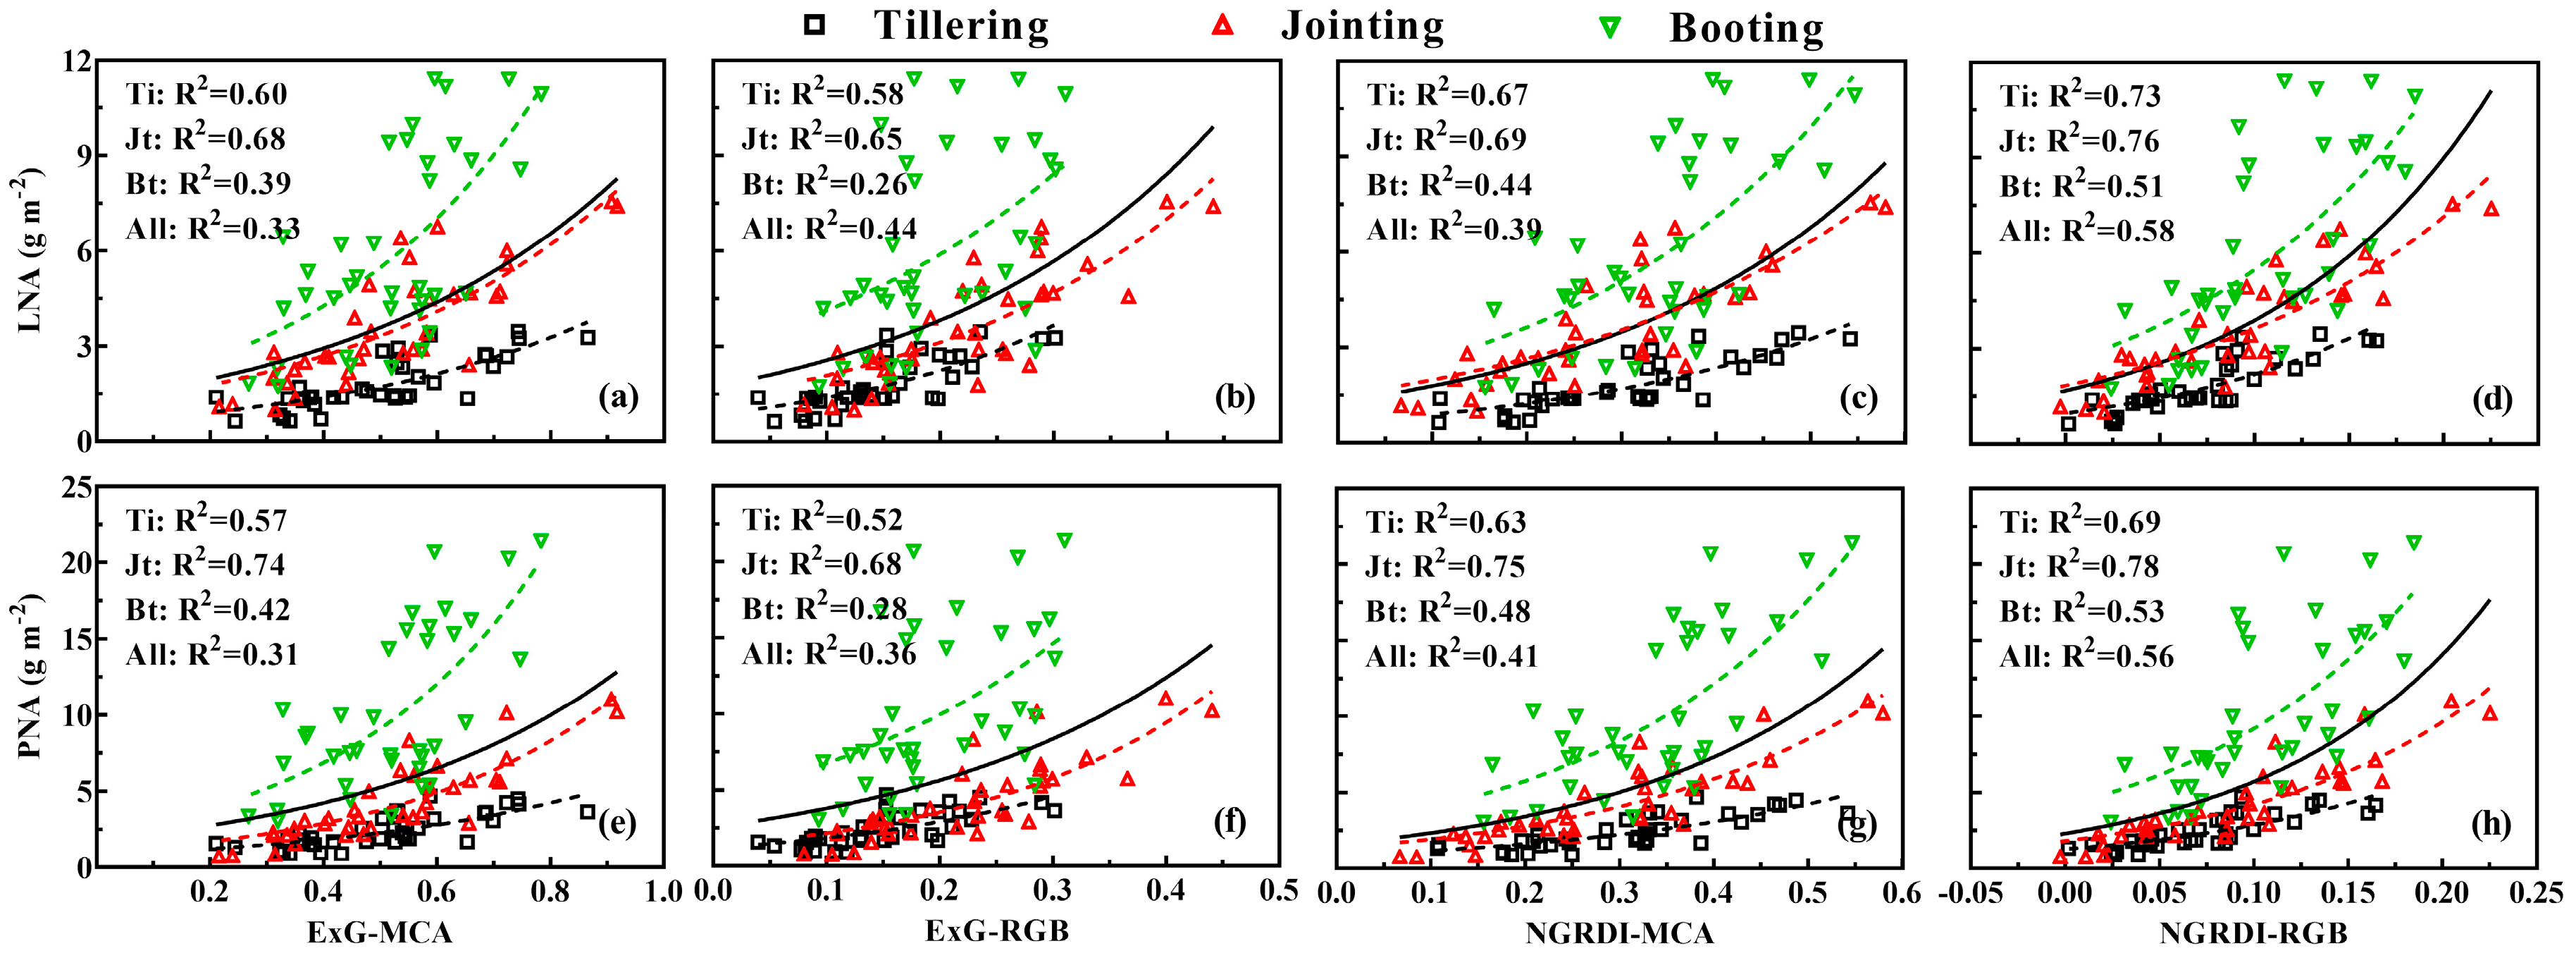
3.2. Comparison between Counterpart Indices from MS and RGB Images

Two counterpart indices (NExG and NGRDI), computed from the MS and RGB images, were employed to evaluate the capability of these two cameras in LNA and PNA estimation. Figure 4 shows that NExG-RGB had comparable performance to NExG-MCA in LNA and PNA estimation at the tillering and jointing stages. With regard to the pooled datasets across all growth stages, NExG-RGB performed slightly better than NExG-MCA. NGRDI-RGB was superior to NGRDI-MCA at individual stages, explaining 19% and 15% more variability of LNA and PNA for all growth stages, respectively. Obviously, the relationships between color indices and N accumulation exhibited a higher scattering of data points for the booting stage than for the tillering and jointing stages. Therefore, the correlation for the combination of the tillering and jointing stages (LNA: R2 = 0.71; PNA: R2 = 0.71) was significantly higher than that for all three stages (LNA: R2 = 0.44; PNA: R2 = 0.56). Additionally, color indices from both types of images exhibited the best performance in LNA and PNA estimation for the jointing stage (Figure 4).

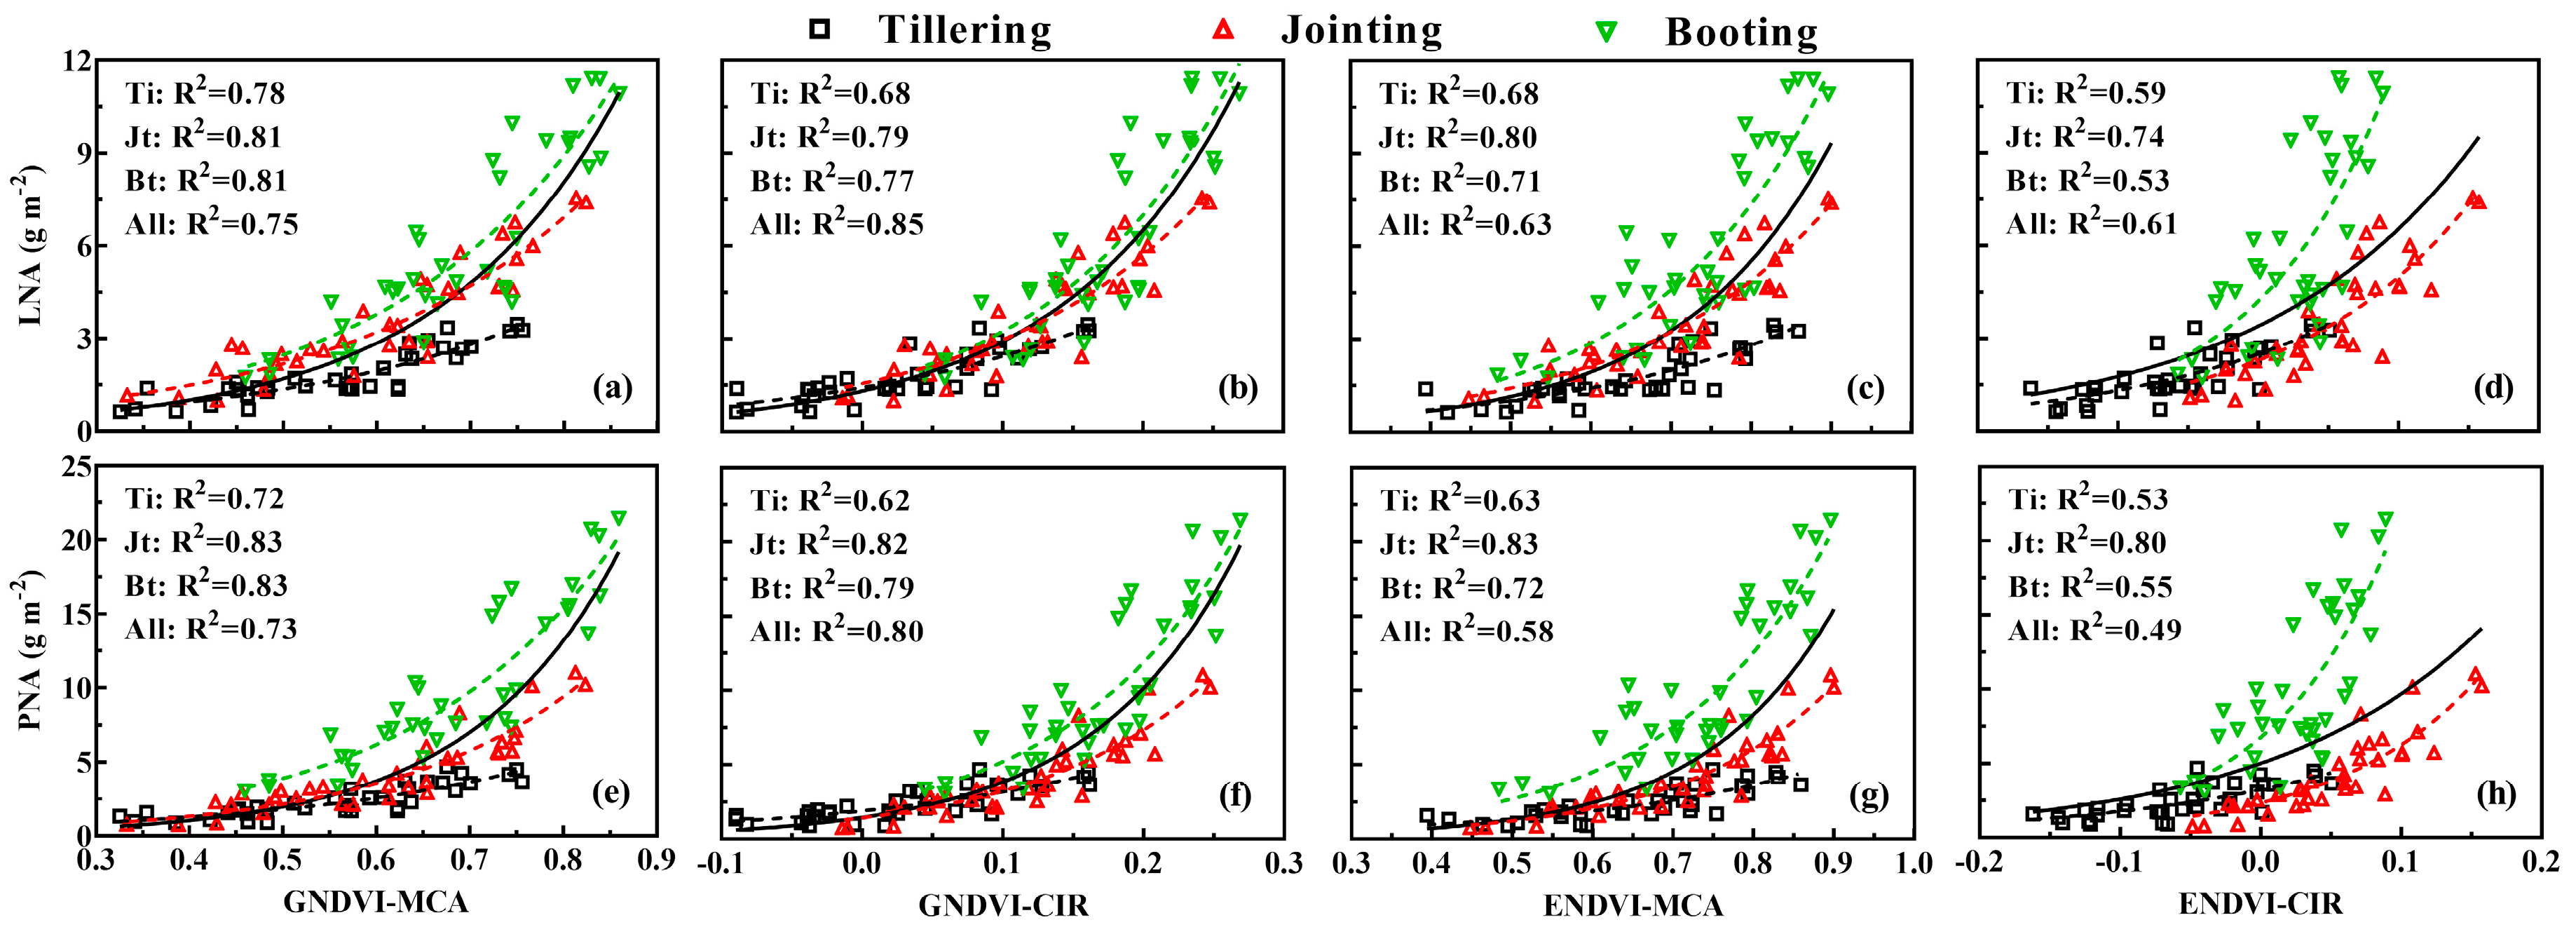
3.3. Comparison between Counterpart Indices from MS and CIR Images

To compare the capability of the MS and CIR cameras in estimating N accumulation, two counterpart VIs (GNDVI and ENDVI) were computed from the MS and CIR images and their performance is shown in Figure 5. Compared with GNDVI-CIR, GNDVI-MCA performed slightly better in the LNA and PNA estimation for individual stages and exhibited more consistent relationships with LNA (R2: 0.78–0.81) and PNA (R2: 0.72–0.83) across the three stages (Figure 5a,e). In contrast, when the data from all stages were pooled, GNDVI-CIR explained 10% and 7% more variation in LNA and PNA, respectively (Figure 5b,f). ENDVI-MCA was superior to ENDVI-CIR in LNA and PNA estimation across all three growth stages. Among the three growth stages, the best performance of LNA and PNA estimation was observed for the jointing stage with all the evaluated VIs.

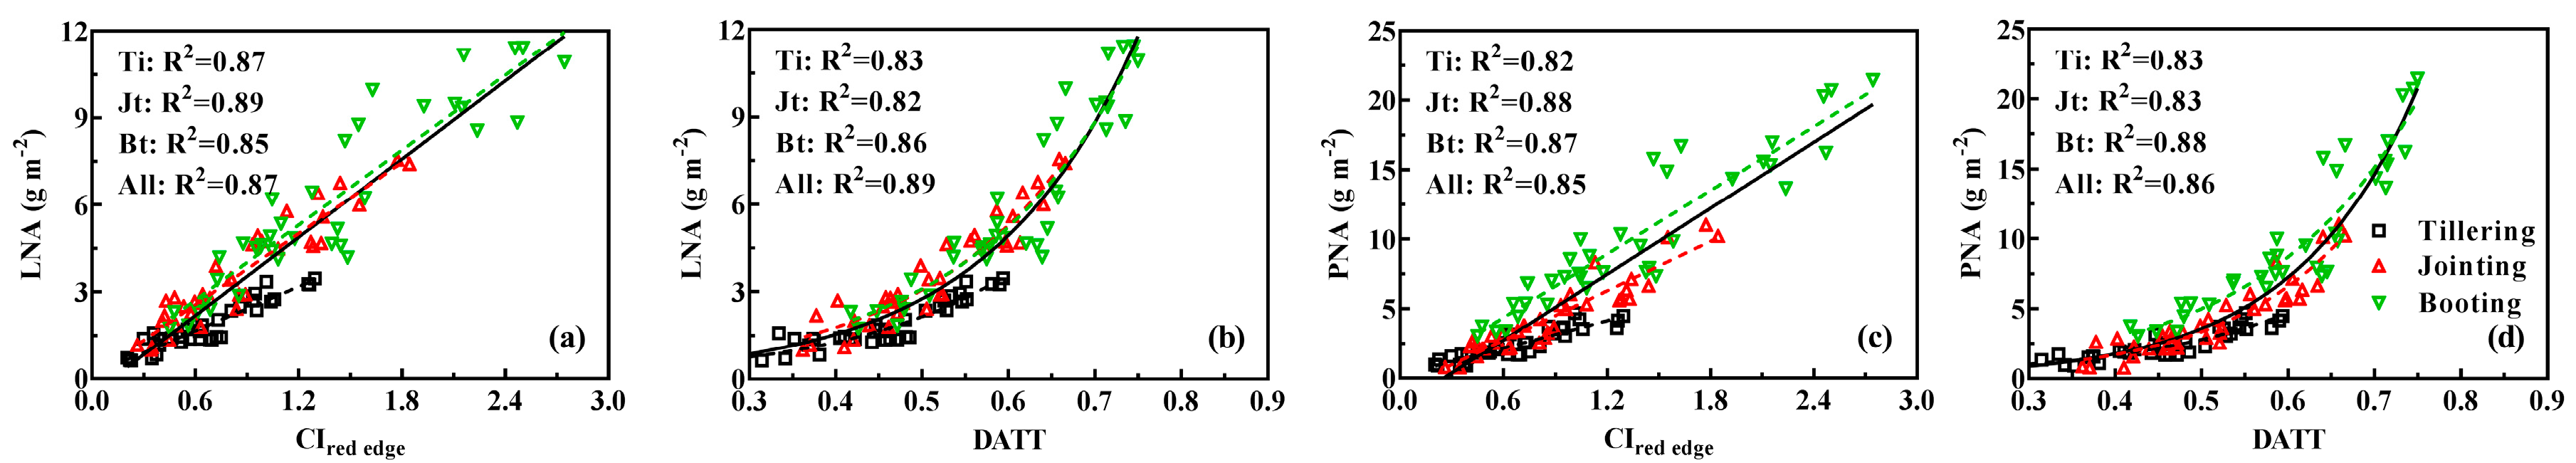
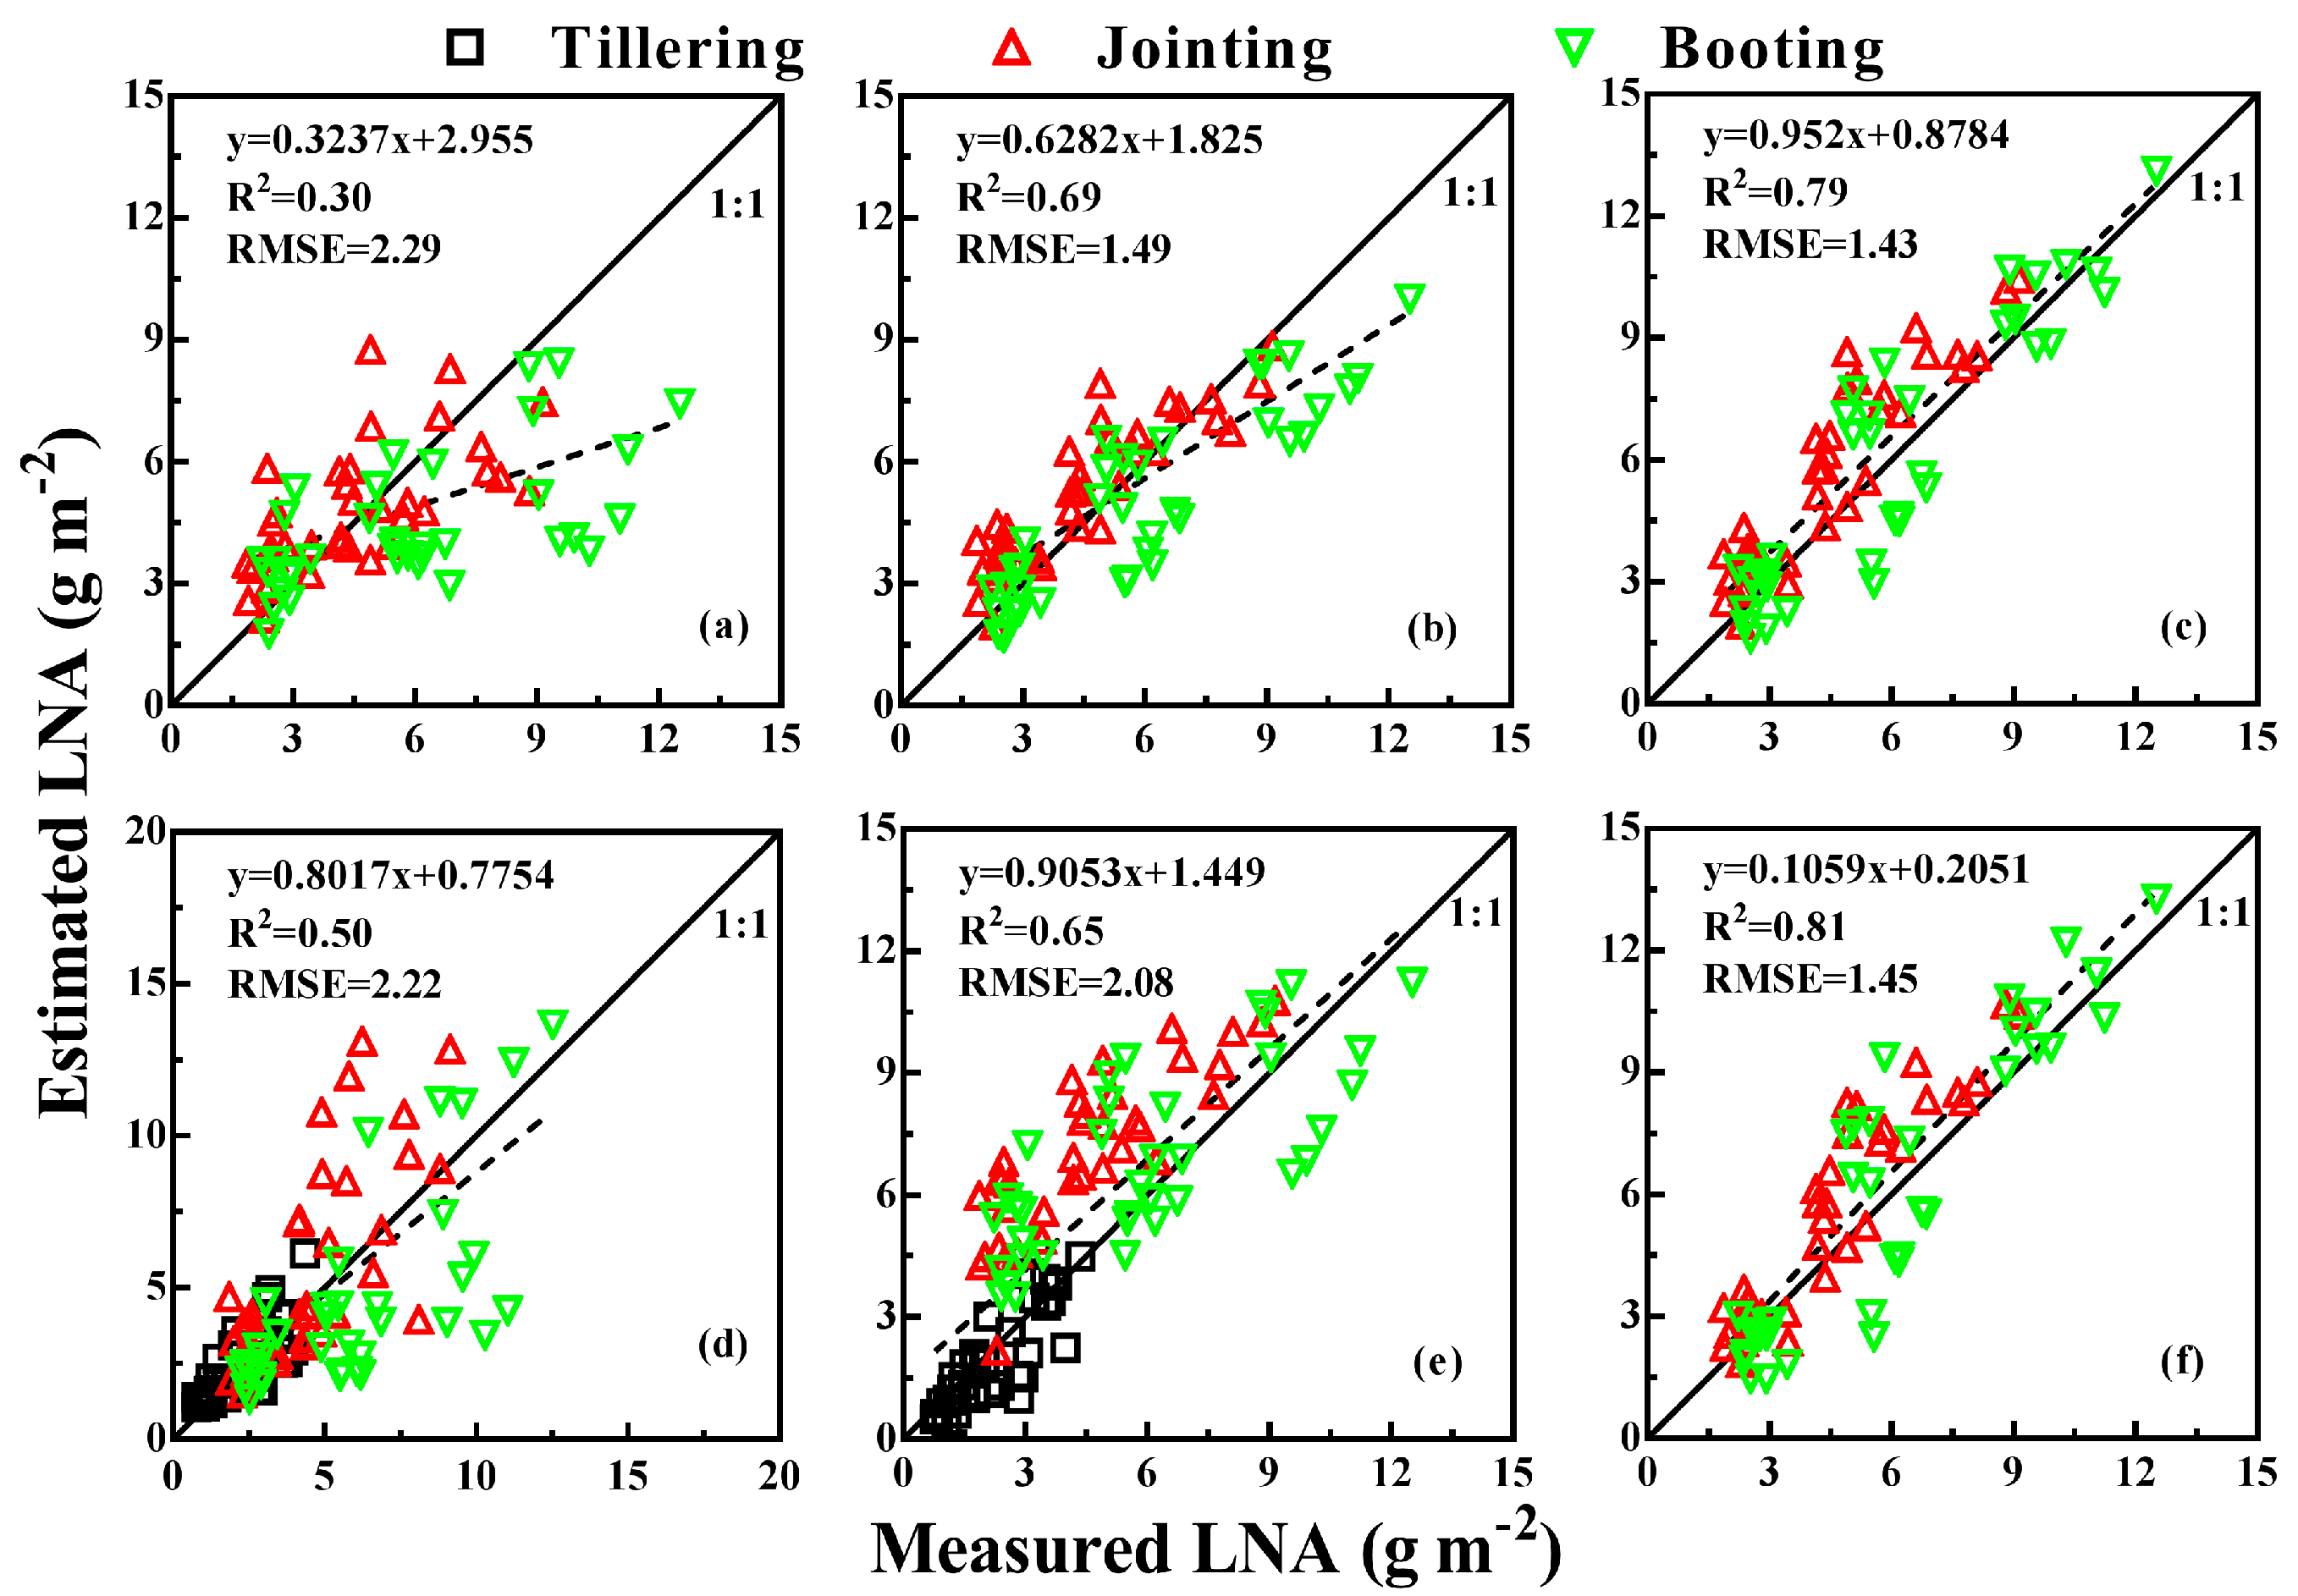
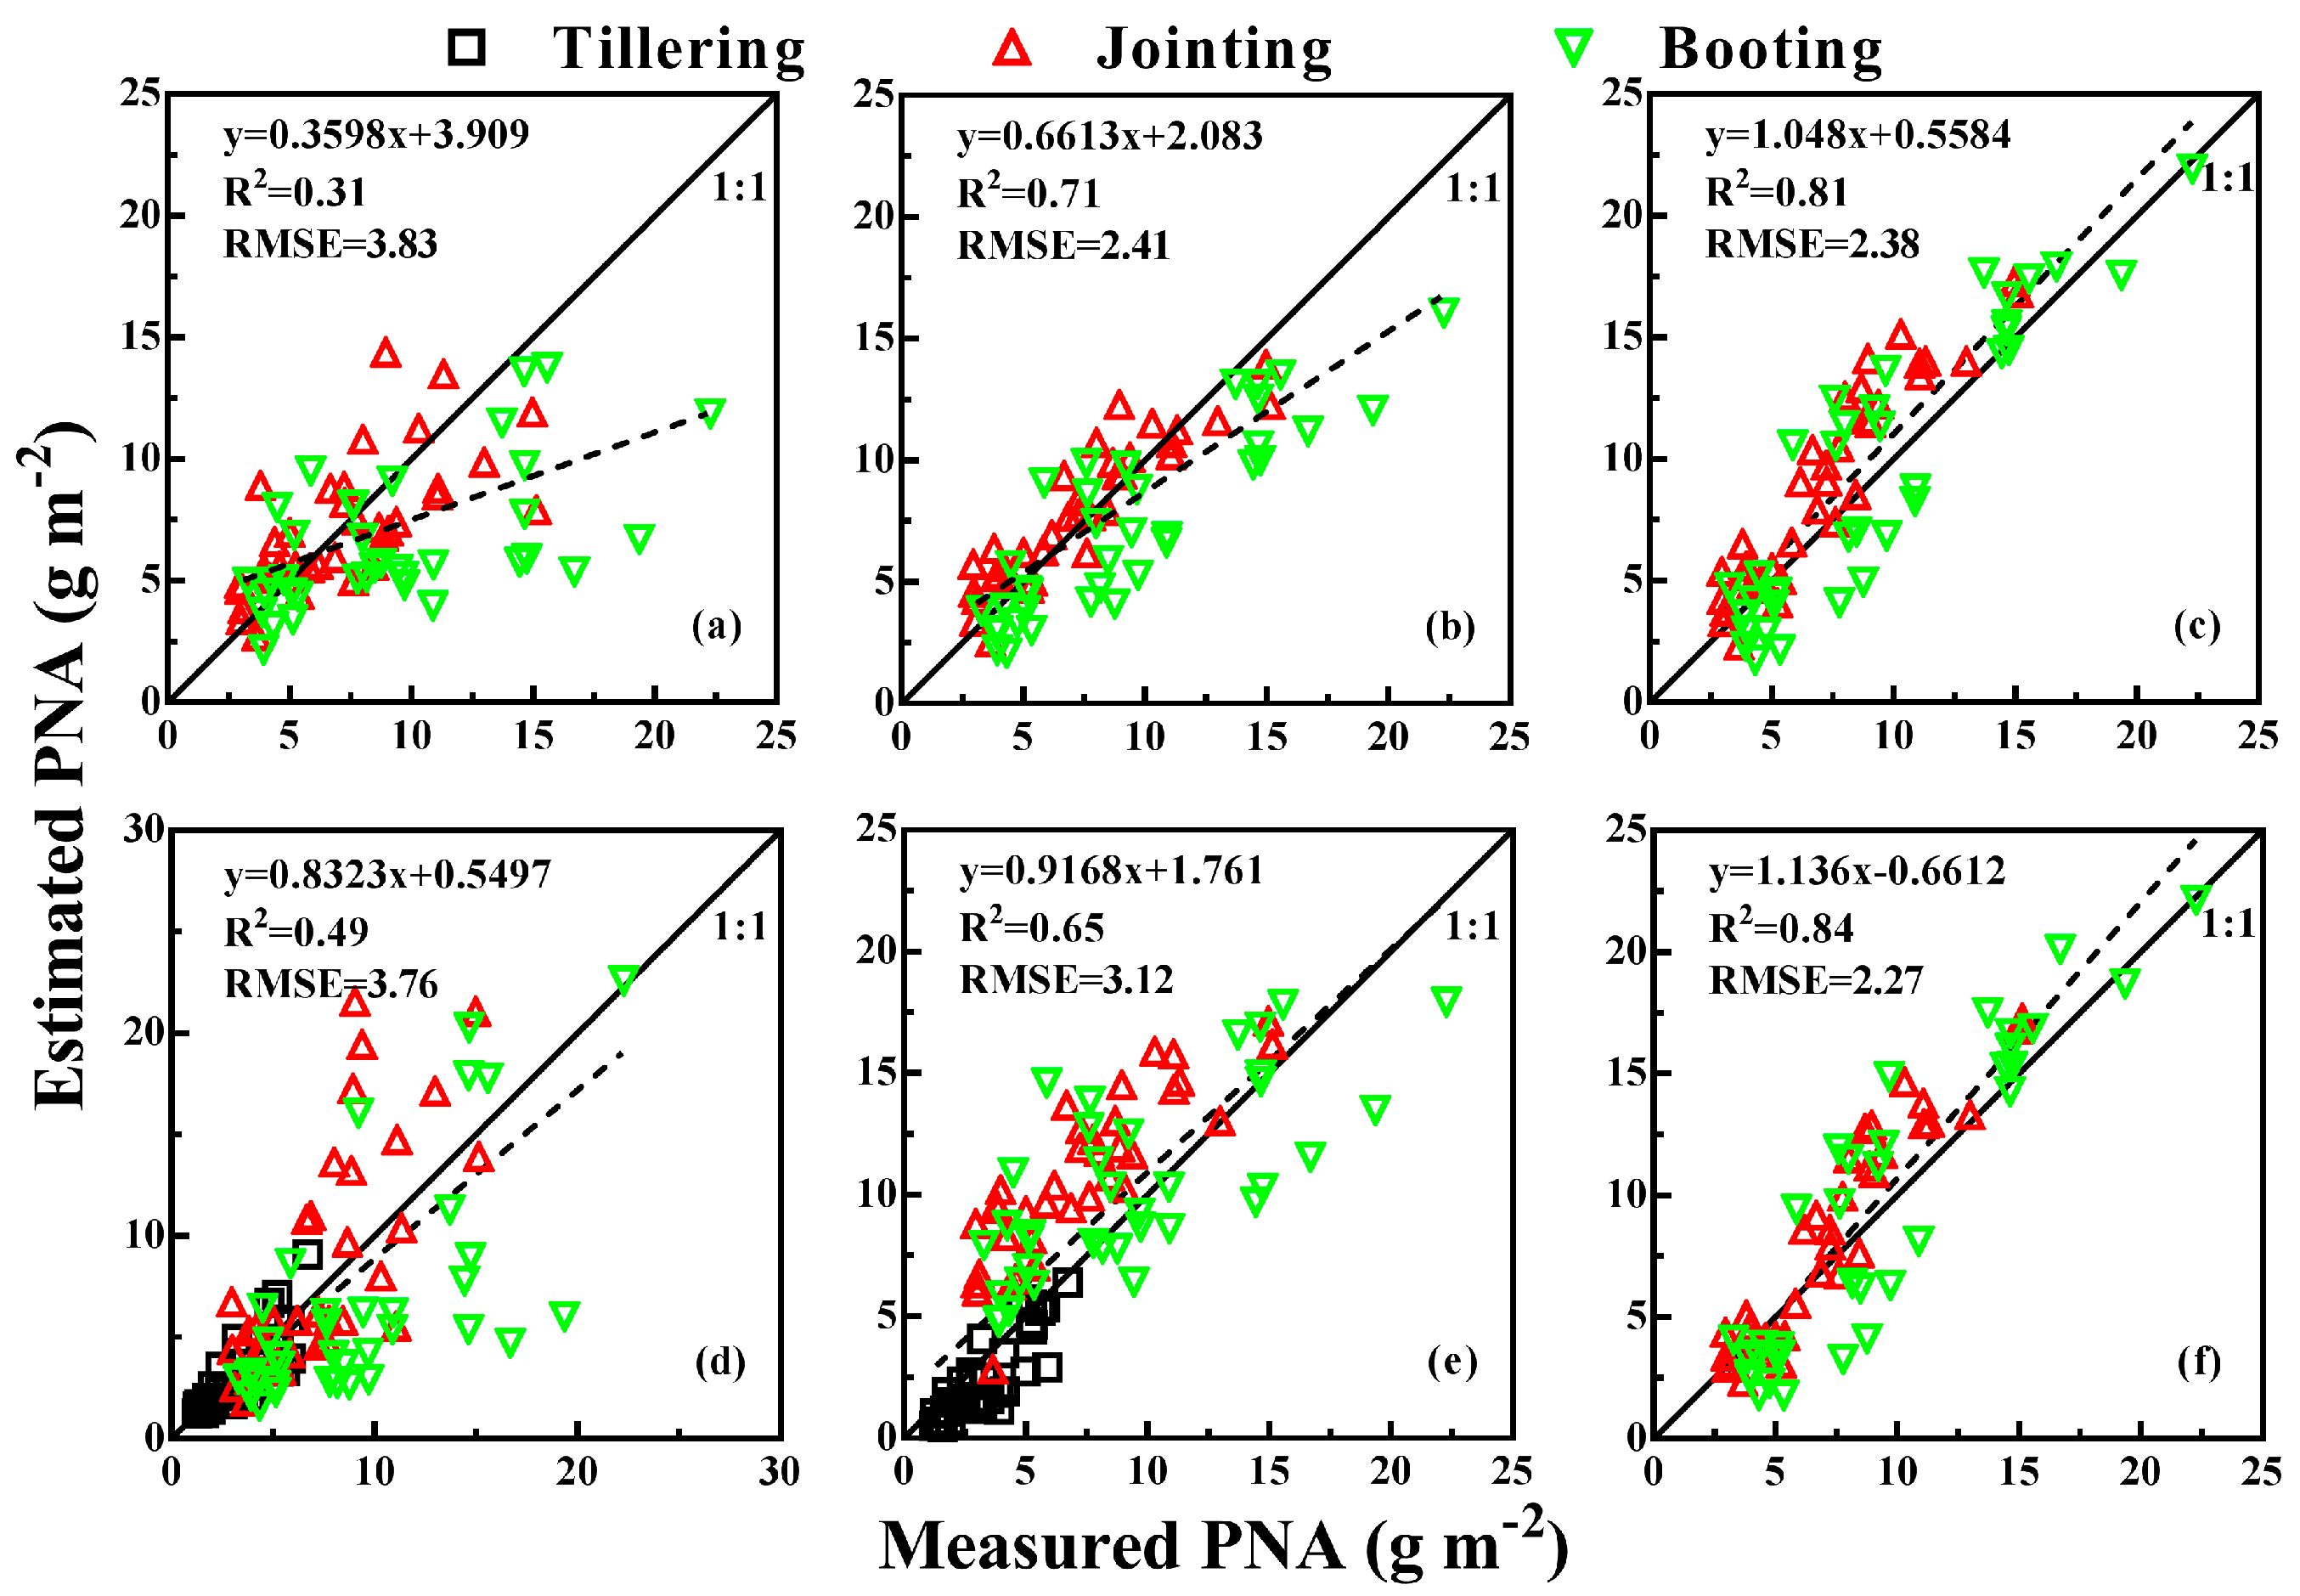
3.4. Evaluation of Red Edge Indices from Multispectral Images

Figure 6 exhibits that CIred edge and DATT performed consistently well in LNA (R2: 0.82–0.89) and PNA (R2: 0.82–0.88) estimation across different growth stages. An all-stage model of DATT could explain 89% of LNA variability and 86% of PNA variability, which was slightly higher than that of CIred edge. However, the relationship of LNA and PNA with CIred edge was linear, but that with DATT was nonlinear. Compared with the best performing index from the CIR images (GNDVI-CIR), DATT was slightly superior to GNDVI in LNA and PNA estimation. Specially, DATT could explain more than 30% of the variation in LNA and PNA compared to the best performing indices from RGB images (NGRDI-RGB).

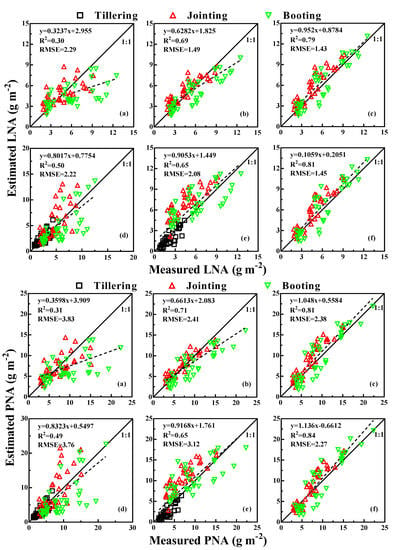
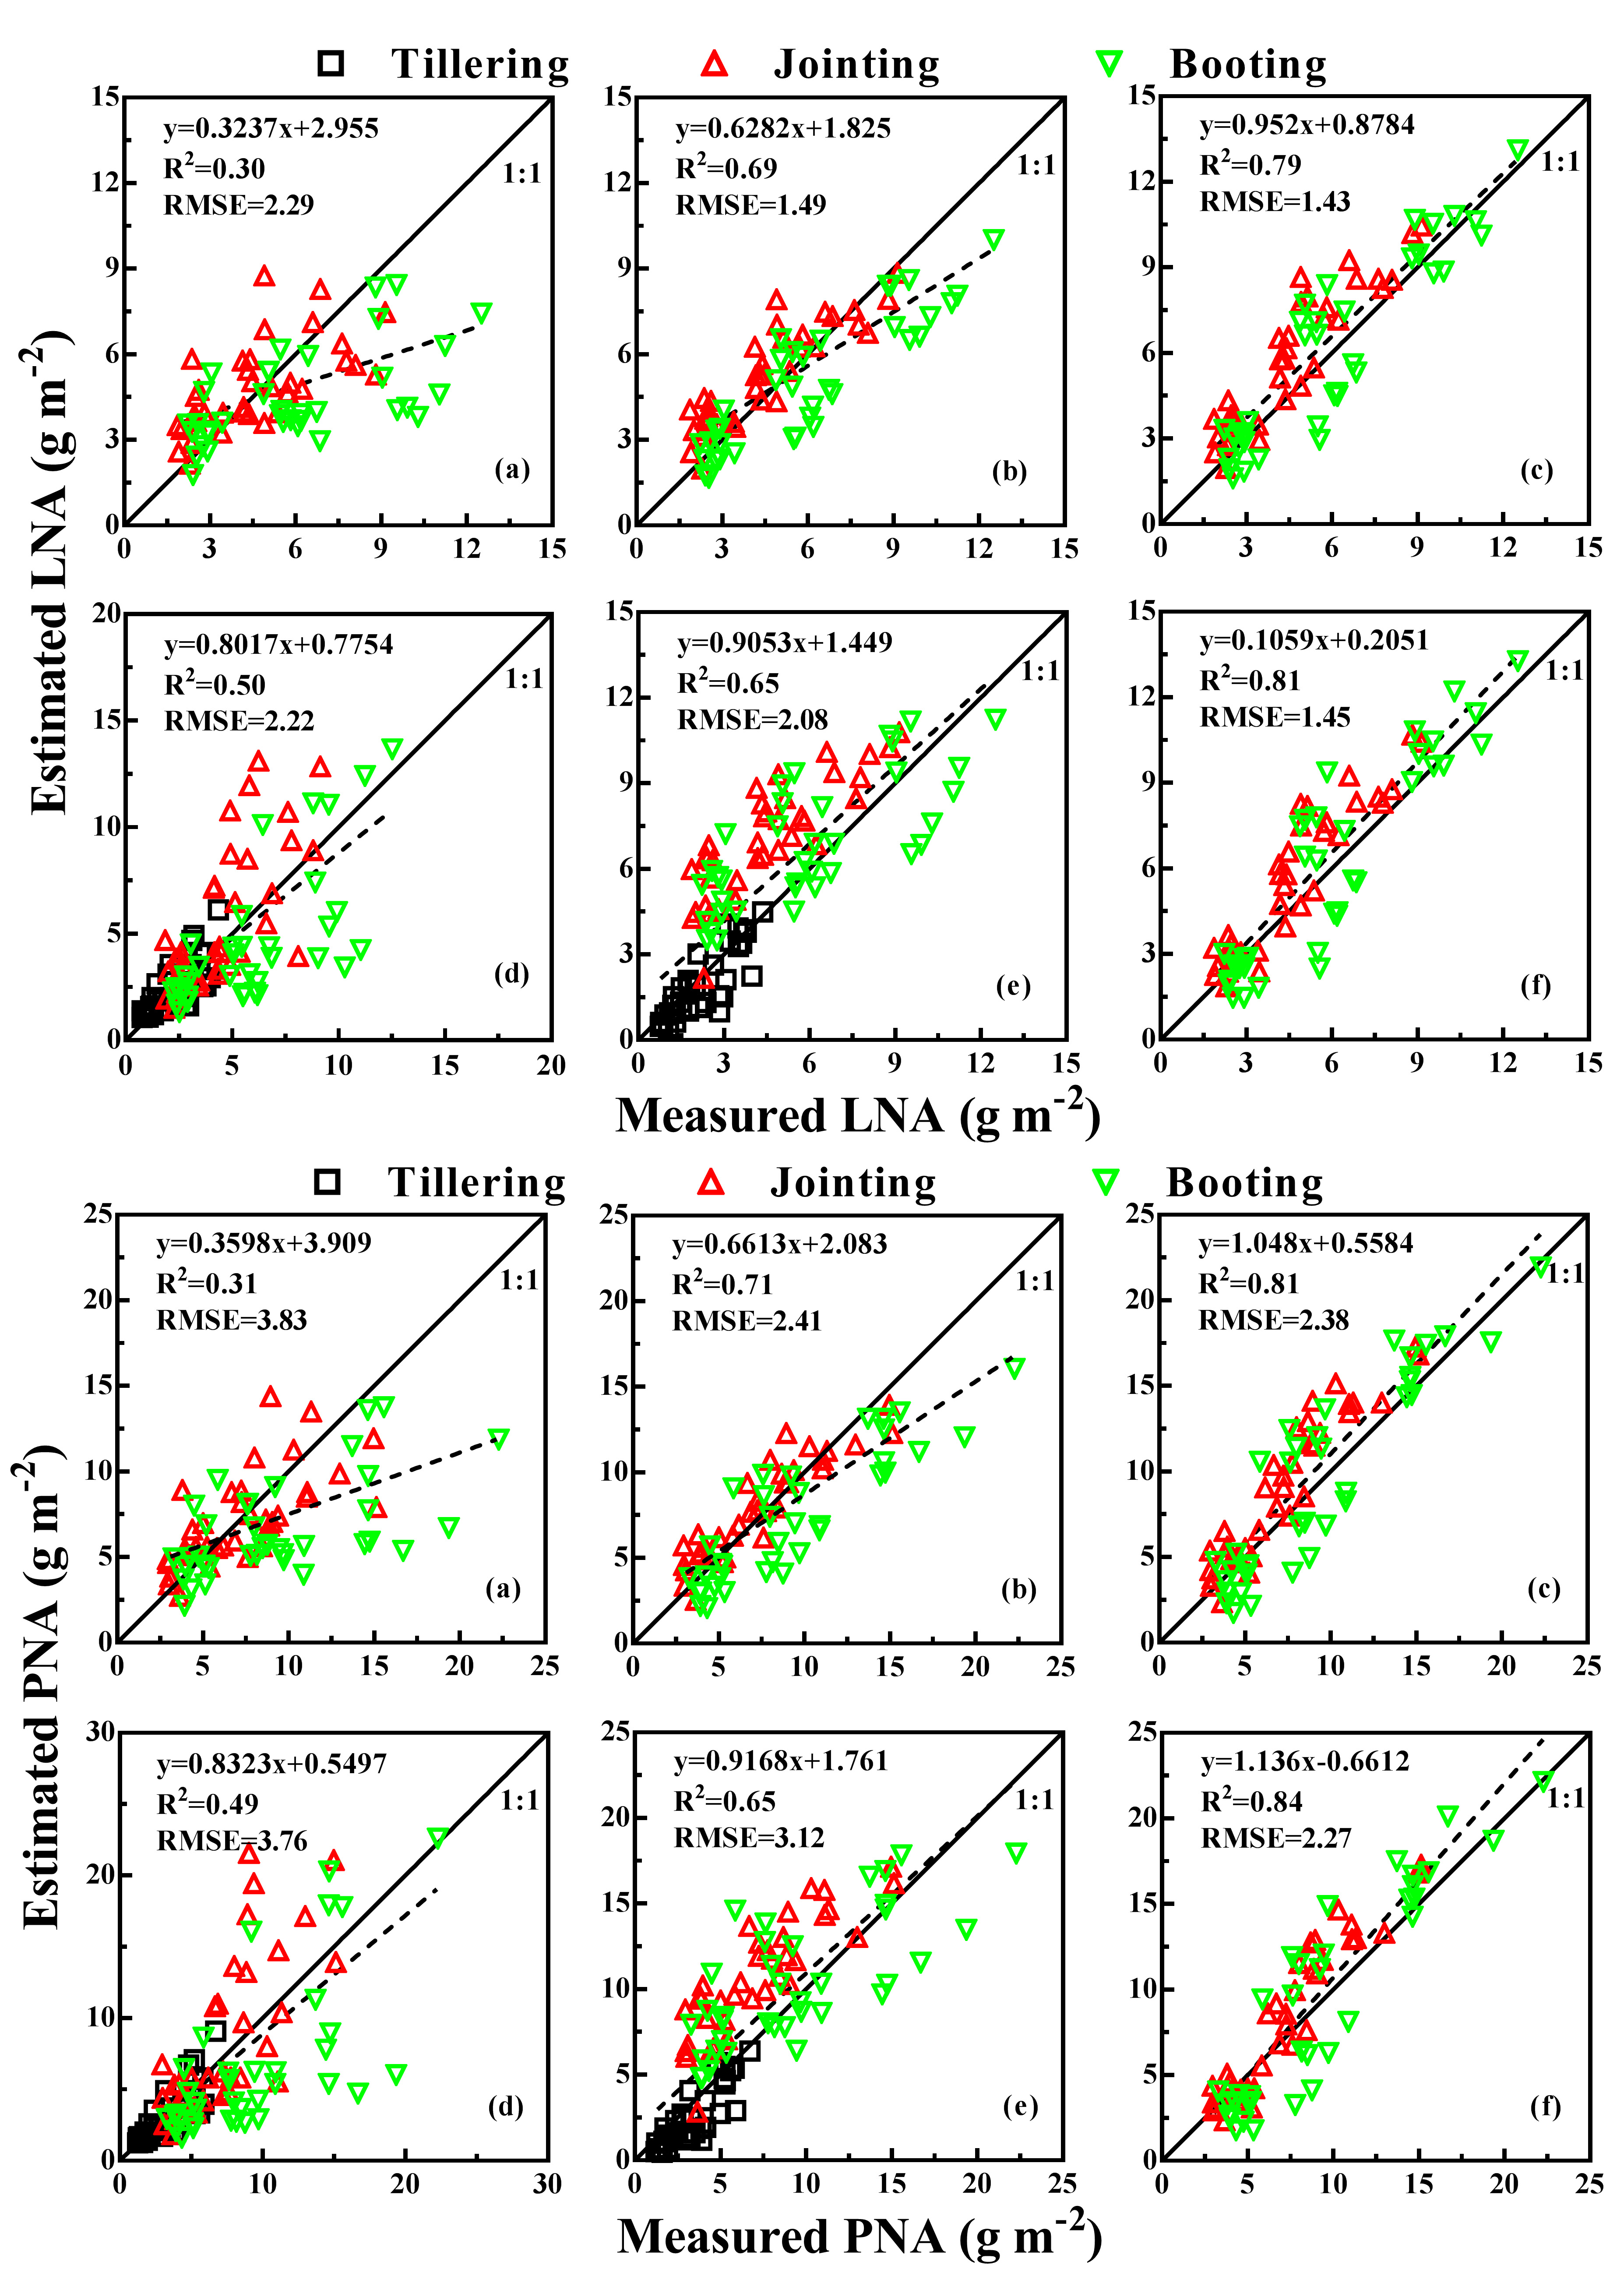
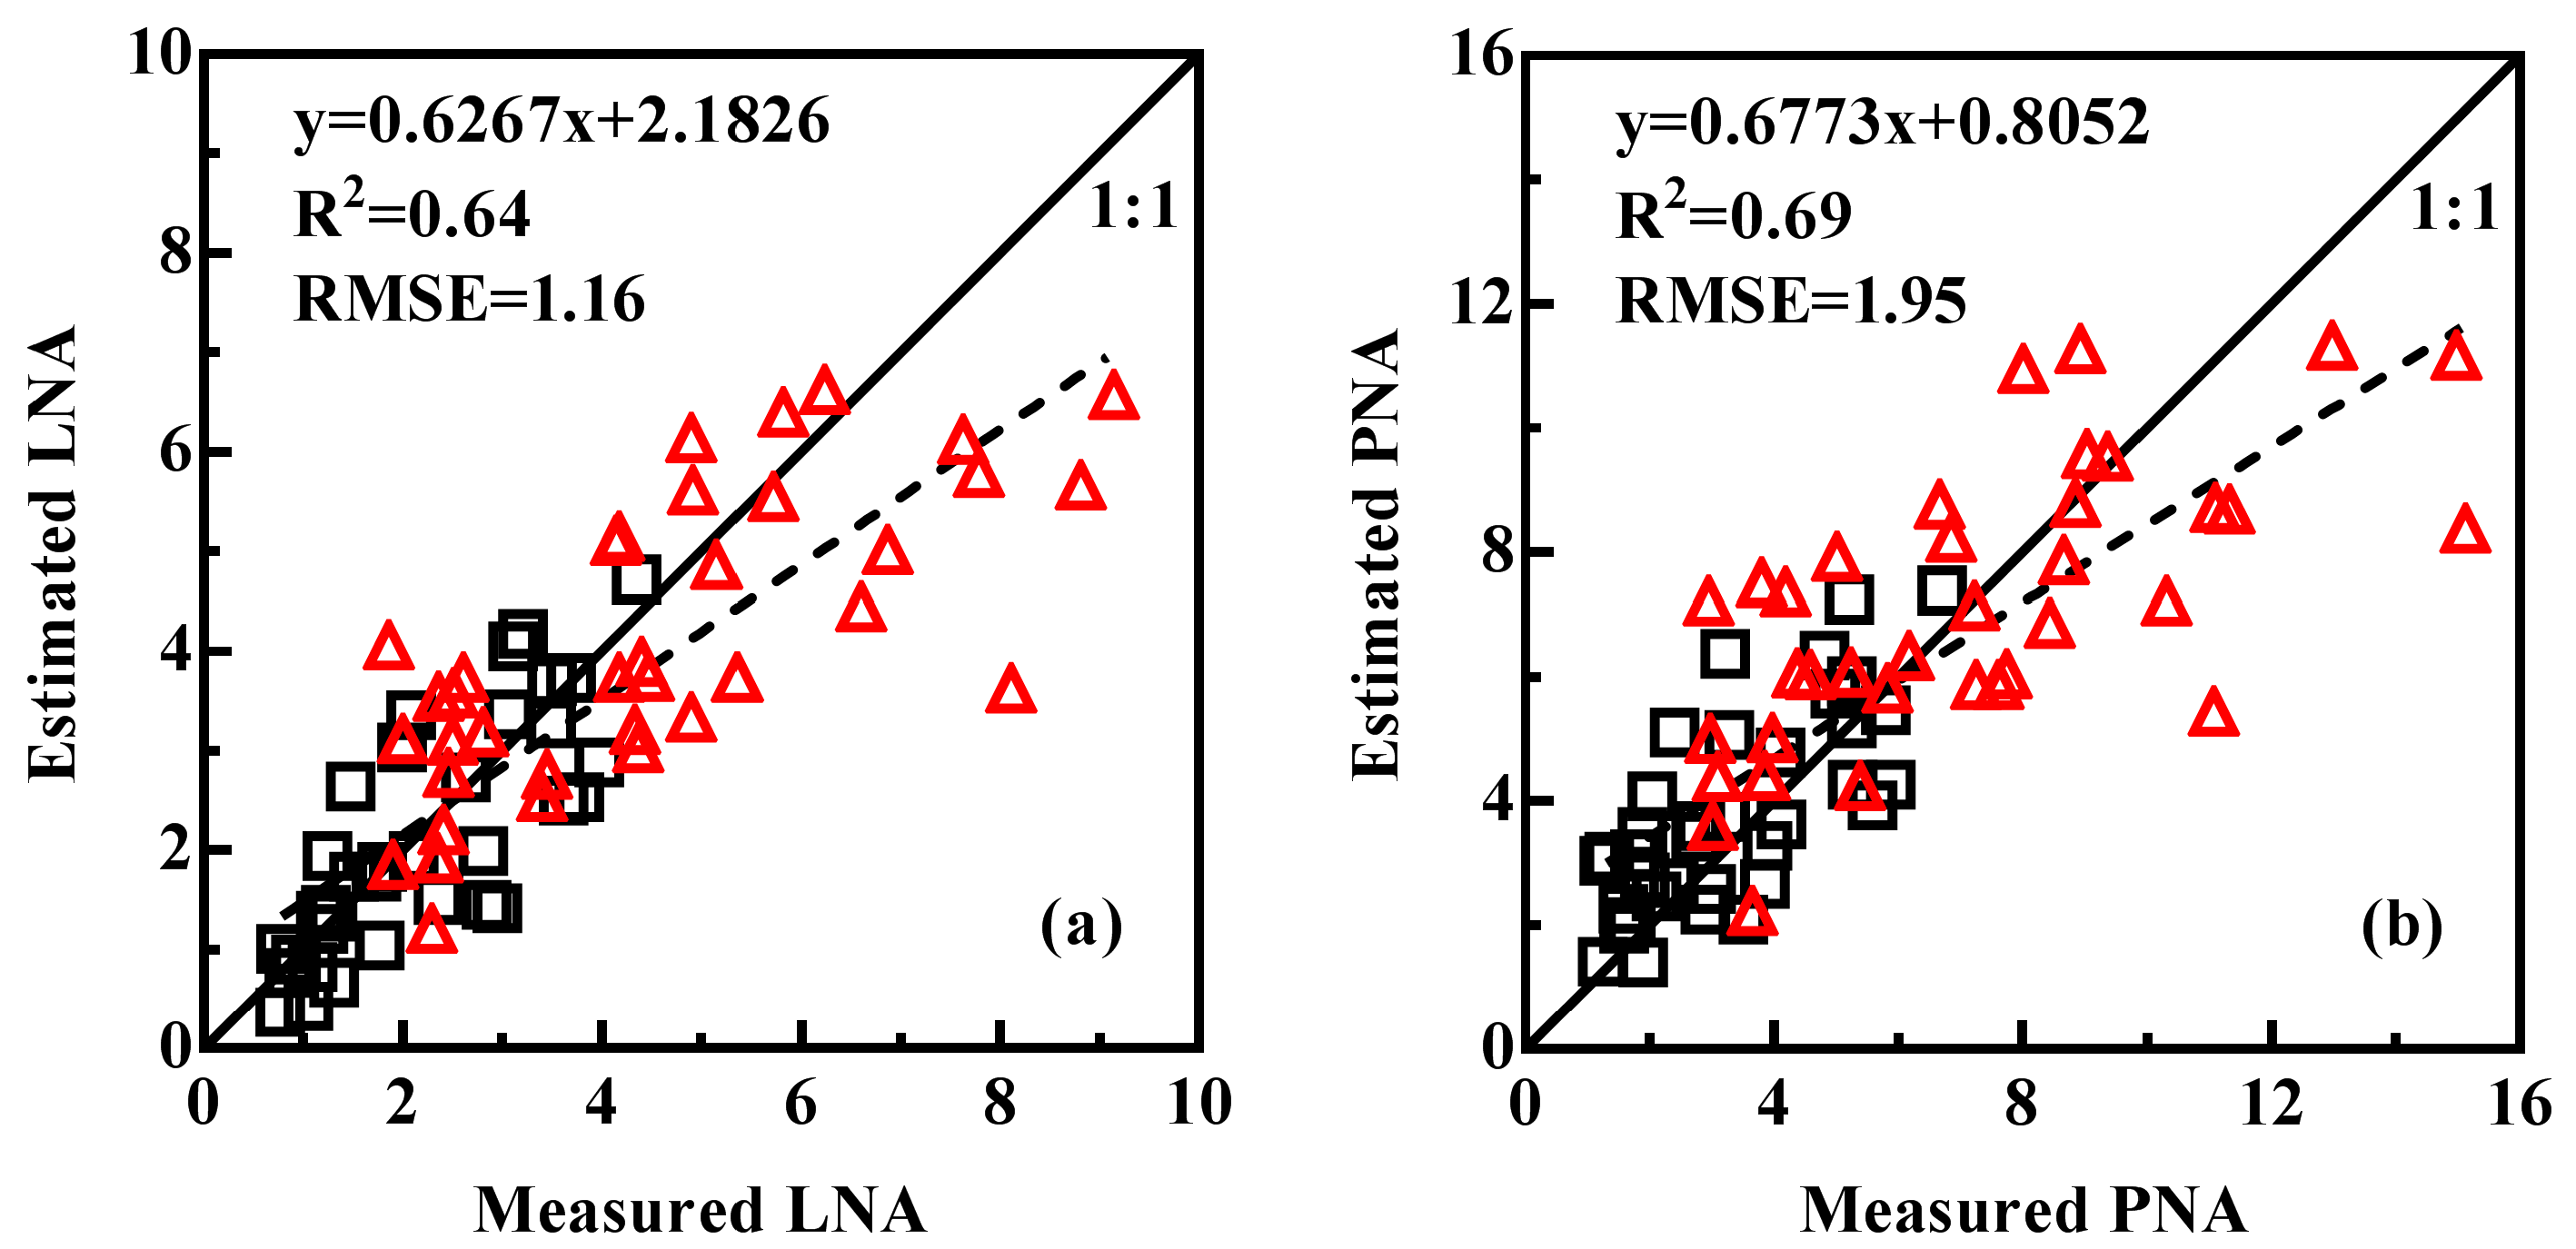
3.5. Model Validation

The derived regression models from the calibration datasets were validated with the test set for all models (Table 4). Color indices (NExG and NGRDI) from the MS and RGB images exhibited low estimation accuracies for LNA (R2 ≤ 0.58 and RMSE ≥ 0.92 g m−2) and PNA (R2 ≤ 0.66 and RMSE ≥ 1.18 g m−2) for both the individual stages and the all-stage group. The highest accuracy for LNA and PNA estimation was produced by NGRDI-RGB (R2 = 0.52 and RMSE = 1.61 g m−2) and NGRDI-MCA (R2 = 0.47 and RMSE = 2.44 g m−2) at the jointing stage, respectively. Compared with the counterpart indices from the RGB images, VI-MCA performed better in most cases (Figure 7 and Figure 8). However, the estimation accuracy improved significantly when only the tillering and jointing stages were considered. The NGRDI and NExG yielded satisfactory performance in LNA (R2 = 0.64 and RMSE = 1.16 g m−2) and PNA (R2 = 0.69 and RMSE = 1.95 g m−2), respectively (Figure 9a,b).
The GNDVI-CIR and ENDVI-CIR models performed poorly for both individual stages and the all-stage group. Only GNDVI-CIR obtained moderate estimation accuracy for LNA (R2 = 0.71 and RMSE = 0.75 g m−2) and PNA (R2 = 0.65 and RMSE = 3.12 g m−2) at the jointing stage and in the all-stage group, respectively. However, compared with VI-CIR, the counterpart indices from the MS images performed significantly better. GNDVI-MCA produced the highest estimation accuracy of LNA (R2 = 0.79 and RMSE = 1.36 g m−2) and PNA (R2 = 0.84 and RMSE = 1.67 g m−2) for the booting and jointing stages, respectively. Moreover, the two-stage group (booting and jointing) model of GNDVI-MCA yielded satisfactory performance in LNA and PNA estimation (Figure 7b and Figure 8b).
Obviously, the estimation accuracy of CIred edge and DATT was comparable and highest among all the evaluated indices across all growth stages except for the jointing stage in LNA estimation (Table 4). The two-stage model (jointing and booting) based on the CIred edge exhibited satisfactory performance in LNA (R2 = 0.79 and RMSE = 1.43 g m−2) and PNA (R2 = 0.81 and RMSE = 2.38 g m−2) estimation (Figure 7c and Figure 8c). Figure 10 shows the spatial distribution of LNA and PNA estimated by CIred edge in the study area for the jointing and booting stages. These figures highlight an increase of N accumulation between the two dates, and the spatial variability in N accumulation across N treatments.

4. Discussion

4.1. Feasibility of Fitting a Single VI-LNA or VI-PNA Model for All Growth Stages

Agronomic parameters (e.g., biomass and plant N uptake) were often estimated at the individual growth stage or stage groups separated by pre-heading and post-heading, and the model for the early stages performed better than the latter or the whole season [13,49,50,51]. In this study, we established both stage groups and individual stage models for LNA and PNA estimation. Color indices (NExG and NGRDI) from RGB images performed poorly in N accumulation estimation with pooled data from different stages, but the performance improved significantly when excluding the booting stage (Figure 9). Similar results were found in wheat plant N uptake [52] and barley biomass [13] estimation, because the reflectance in the visible region was easily saturated when the chlorophyll content was relatively higher at the booting stage [19]. The NIR VIs from the CIR images yielded better performance with the all-stage model than the individual-stage model, especially for GNDVI-CIR (Figure 7c and Figure 8c). Hunt et al. [24] also used GNDVI derived from CIR images to estimate winter cover crop biomass, but the correlations were not high due to much greater biomass variation within experimental strips than among strips.
For MS images, two red edge indices (CIred edge and DATT) produced quite satisfactory performance at the individual stage and stage groups. As shown in Figure 7 and Figure 8, the estimates of the red edge indices with two-stage models were closest to the 1:1 line, because N accumulation was dominated by biomass and biomass could be more accurately estimated with red edge indices than the NIR or visible VIs at a high canopy density [49,53,54]. Moreover, this MiniMCA camera could deliver MS imagery of high radiometric quality in the red edge region [34]. Considering the linear relationship with LNA and PNA, CIred edge could be considered a suitable indicator for rice N accumulation estimation from the UAV platform.

4.2. Performance of Counterpart Indices from Different Sensors

In this study, the counterpart VIs from MS images performed significantly better than that from RGB or CIR images (Table 4). That is partly due to the lack of radiometric correction for RGB and CIR images. The established models from RGB and CIR images had poorer stability in DN values than reflectance between the two years, because the DN values were significantly affected by the exposure sets on the digital cameras based on overall light intensity [11].
Although the DN-based models were presented in this study, they were also compared with the reflectance-based models, and the latter did not show a consistent improvement with radiometric calibration (data not shown). This is probably due to the inaccuracy in the spectral response function and the quality of the RGB and CIR cameras, which were not as well calibrated in-house as the MS cameras. In addition, radiometric calibration was difficult for the RGB and CIR cameras in this study due to the complexity of obtaining their spectral response functions for each channel. The use of a calibration canvas may not be practical when multiple flights are needed to cover a large area and solar illumination varies between flights [24]. On the other hand, the RGB and CIR cameras possessed much broader bandwidth (over 50 nm) than that of the MS camera (10 nm). Previous studies have also shown that narrow-band vegetation indices were superior to broad bandwidth indices in LAI [55] and N [56] estimation. Future work could focus on improving the stability and transitivity of models established with RGB and CIR images through different fields and years.
These VIs are structural indices, which are more related to biomass than N concentration, thus we found the VIs were weakly correlated with N concentration (data not shown), which corresponds with the findings in other studies [2,52]. Because N concentration monitoring is affected by many factors, such as canopy structural parameters (e.g., LAI, biomass). Knyazikhin et al. [57] proposed directional area scattering factor (DASF) to eliminate the influence of canopy structural parameters with hyperspectral data. However, DASF could not be obtained due to the limited bands in these sensors. N accumulation composed of N concentration and biomass, contains information on canopy structure and N status, thus it can be taken as a good indicator for a N nutrition assessment [2,58,59]. However, the only stress for rice growth in this study was N deficiency, because other practical management was the same for all the plots. Treatments within N stress were labeled with low N concentration and biomass, thus the low N accumulation provides a real statement of the N deficit.

4.3. Choice of an Appropriate Camera for Precision Agriculture

UAS have proven to be an ideal technique in precision agriculture for crop growth mapping [60,61] and monitoring [13,14,33]. Simultaneously, many aspects of sensor selection should be taken into consideration, such as band configuration and price. Digital cameras (both RGB and CIR cameras) are easy to use and are affordable for most researchers. Additionally, RGB and CIR images could be used after being downloaded from a memory card without any preprocessing (e.g., band registration) and a number of sophisticated commercial softwares (e.g., Agisoft Photoscan and Pix4D) have been developed to process the RGB and CIR images. These advantages make it more efficient to process the image data and easier to cover a large experimental area [34]. Furthermore, digital cameras could collect images with ultra-high spatial resolution to construct a high density point cloud, which has been used to estimate plant height [13,62]. Therefore, digital cameras are widely used for precision agriculture, as stated in the review by Zhang and Kovacs [63].
Crop growth condition at the early stages is very important for the yield formation and N management is practiced at the tillering and jointing stages [64], thus it is essential to provide farmers with N status in order to supply appropriate rate of fertilizer [65]. Given the low cost of RGB and CIR cameras and satisfactory performance in N accumulation estimation, we believe RGB cameras could be used to monitor N status for the two early stages of rice growth. CIR cameras would be a good choice for N accumulation estimation for all three stages, if the demand on estimation accuracy is not so strict and financial budget is tight. Besides, the CIR camera was also suited for LAI estimation in winter wheat [23].
Compared with the digital cameras, the MS camera performed significantly better in LNA and PNA estimation. However, the miniMCA (700 g) is much heavier than the commercial digital camera (270 g), which is a great burden for UAS energy supply [66]. Though MS images could be processed with the Pix4D and Photoscan software packages, the spatial coverage is not as efficient as that of the RGB images due to the narrow field of view. In addition, the channels in new MS cameras such as RedEdge are still designed in arrays, and much effort is still needed to correct for the band-to-band misalignment. New products may have better performance in hardware design, but we still face similar challenges in image collection and preprocessing. In this study, only one image was used for the small study area and whether or not the result from the small plot experiments could be applied to a larger area needs to be investigated with more data in the future.
Although a limited number of VIs was selected to estimate rice N accumulation in this study, they were a proper representation of the function of these sensors in N status monitoring. We would like to extend our study to use more VIs with the three sensors on this topic. Moreover, the emerging compact hyperspectral sensors (e.g., UHD 185, Rikola) might provide a better choice for UAS to monitor crop growth status, because they have been successfully applied to estimate aboveground biomass [67] and leaf N content [68] in winter wheat. In addition, N accumulation is composed of N concentration and biomass, and biomass could be related to N stress but also to many other stresses. Our future work will focus on detecting the N concentration directly to find a real statement of the N deficit with VIs.

5. Conclusions

In this study, we evaluated three sensors (RGB, CIR and MS cameras) onboard UAS for the estimation of LNA and PNA in rice. UAS images were acquired in two continuous years at the early three growth stages (tillering, jointing and booting). Six VIs (NExG, NGRDI, GNDVI, ENDVI, CIred edge and DATT) computed from the corresponding images were employed to estimate LNA and PNA for individual stages and stage groups, and the established VI-LNA and VI-PNA models were evaluated with the test set. The results demonstrated that both NGRDI-RGB and GNDVI-CIR had satisfactory performance in model calibration for the early two (tillering and jointing) and all three growth stages, respectively. NGRDI-RGB and EXG-RGB exhibited moderate estimation accuracy in LNA and PNA model validation for the early two stages (tillering and jointing), respectively. GNDVI-CIR yielded moderate estimation accuracy for all three stages. Red edge indices (CIred edge and DATT) from the MS images performed consistently well in model calibration and validation. Therefore, RGB and CIR cameras are good avenues for the qualitative monitoring of N status, due to their satisfactory performance in model calibration. Additionally, in consideration of their low cost and highly efficient data processing they are also good alternatives for quantitative N estimation only for the early two stages (tillering and jointing), due to the moderate estimation accuracy. The MS camera could be taken as a proper sensor for quantitative analysis of N status monitoring with red edge indices. These results further prove that UAS is a reliable approach for monitoring N accumulation, which is a good indicator for N diagnosis and subsequent N management. Future work should be directed to examining these established models with multi-year datasets to improve robustness and applicability.

Author Contributions

T.C., X.Y., Y.T., W.C., and Y.Z. conceived and designed the experiments; D.L., X.Z., and H.Z. performed the experiments; H.Z., X.Z., and D.L. analyzed the data; H.Z., T.C. and Y.Z. wrote the paper.

Acknowledgments

This work was supported by grants from the National Key Research and Development Program of China (2016YFD0300601), the Special Fund for Agro-scientific Research in the Public Interest (201303109), the Award for Jiangsu Distinguished Professor and the Priority Academic Program Development of Jiangsu Higher Education Institutions (PAPD), China. The Natural Science Foundation of Jiangsu Province (BK20150663).

Conflicts of Interest

The authors declare no conflict of interest.

References

  1. Janssen, B.H. Efficient use of nutrients: An art of balancing. Field Crops Res. 1998, 56, 197–201. [Google Scholar] [CrossRef]
  2. Chu, X.; Guo, Y.; He, J.; Yao, X.; Zhu, Y.; Cao, W.; Cheng, T.; Tian, Y. Comparison of different hyperspectral vegetation indices for estimating canopy leaf nitrogen accumulation in rice. Agron. J. 2014, 106, 1911–1920. [Google Scholar] [CrossRef]
  3. Wang, W.; Yao, X.; Tian, Y.C.; Liu, X.J.; Jun, N.I.; Cao, W.X.; Zhu, Y. Common Spectral Bands and Optimum Vegetation Indices for Monitoring Leaf Nitrogen Accumulation in Rice and Wheat. J. Integr. Agric. 2012, 11, 2001–2012. [Google Scholar] [CrossRef]
  4. Zheng, H.; Cheng, T.; Yao, X.; Deng, X.; Tian, Y.; Cao, W.; Zhu, Y. Detection of rice phenology through time series analysis of ground-based spectral index data. Field Crops Res. 2016, 198, 131–139. [Google Scholar] [CrossRef]
  5. Yao, X.; Ren, H.; Cao, Z.; Tian, Y.; Cao, W.; Zhu, Y.; Cheng, T. Detecting leaf nitrogen content in wheat with canopy hyperspectrum under different soil backgrounds. Int. J. Appl. Earth Obs. Geoinf. 2014, 32, 114–124. [Google Scholar] [CrossRef]
  6. Serrano, L.; Filella, I.; Penuelas, J. Remote sensing of biomass and yield of winter wheat under different nitrogen supplies. Crop Sci. 2000, 40, 723–731. [Google Scholar] [CrossRef]
  7. Blaes, X.; Chomé, G.; Lambert, M.-J.; Traoré, P.S.; Schut, A.G.; Defourny, P. Quantifying Fertilizer Application Response Variability with VHR Satellite NDVI Time Series in a Rainfed Smallholder Cropping System of Mali. Remote Sens. 2016, 8, 531. [Google Scholar] [CrossRef]
  8. Huang, S.; Miao, Y.; Zhao, G.; Yuan, F.; Ma, X.; Tan, C.; Yu, W.; Gnyp, M.L.; Lenz-Wiedemann, V.I.; Rascher, U. Satellite remote sensing-based in-season diagnosis of rice nitrogen status in Northeast China. Remote Sens. 2015, 7, 10646–10667. [Google Scholar] [CrossRef]
  9. Boegh, E.; Soegaard, H.; Broge, N.; Hasager, C.; Jensen, N.; Schelde, K.; Thomsen, A. Airborne multispectral data for quantifying leaf area index, nitrogen concentration, and photosynthetic efficiency in agriculture. Remote Sens. Environ. 2002, 81, 179–193. [Google Scholar] [CrossRef]
  10. Inoue, Y.; Sakaiya, E.; Zhu, Y.; Takahashi, W. Diagnostic mapping of canopy nitrogen content in rice based on hyperspectral measurements. Remote Sens. Environ. 2012, 126, 210–221. [Google Scholar] [CrossRef]
  11. Hunt, E.R.; Cavigelli, M.; Cst, D.; Mcmurtrey, J.I.; Walthall, C.L. Evaluation of digital photography from model aircraft for remote sensing of crop biomass and nitrogen status. Precis. Agric. 2005, 6, 359–378. [Google Scholar] [CrossRef]
  12. Lelong, C.C.; Burger, P.; Jubelin, G.; Roux, B.; Labbé, S.; Baret, F. Assessment of unmanned aerial vehicles imagery for quantitative monitoring of wheat crop in small plots. Sensors 2008, 8, 3557–3585. [Google Scholar] [CrossRef] [PubMed]
  13. Bendig, J.; Yu, K.; Aasen, H.; Bolten, A.; Bennertz, S.; Broscheit, J.; Gnyp, M.L.; Bareth, G. Combining UAV-based plant height from crop surface models, visible, and near infrared vegetation indices for biomass monitoring in barley. Int. J. Appl. Earth Obs. Geoinf. 2015, 39, 79–87. [Google Scholar] [CrossRef]
  14. Hunt, E.R.; Daughtry, C.S.T.; Mirsky, S.B.; Hively, W.D. Remote sensing with unmanned aircraft systems for precision agriculture applications. In Proceedings of the Second International Conference on Agro-Geoinformatics, Fairfax, VA, USA, 12–16 August 2013. [Google Scholar]
  15. Jin, X.; Liu, S.; Baret, F.; Hemerlé, M.; Comar, A. Estimates of plant density of wheat crops at emergence from very low altitude UAV imagery. Remote Sens. Environ. 2017, 198, 105–114. [Google Scholar] [CrossRef]
  16. Lebourgeois, V.; Bégué, A.; Labbé, S.; Mallavan, B.; Prévot, L.; Roux, B. Can commercial digital cameras be used as multispectral sensors? A crop monitoring test. Sensors 2008, 8, 7300–7322. [Google Scholar] [CrossRef] [PubMed] [Green Version]
  17. Zhu, J.; Wang, K.; Deng, J.; Harmon, T. Quantifying Nitrogen Status of Rice Using Low Altitude UAV-Mounted System and Object-Oriented Segmentation Methodology. In Proceedings of the ASME 2009 International Design Engineering Technical Conferences and Computers and Information in Engineering Conference, San Diego, CA, USA, 30 August–2 September 2009. [Google Scholar]
  18. Córcoles, J.I.; Ortega, J.F.; Hernández, D.; Moreno, M.A. Estimation of leaf area index in onion (Allium cepa L.) using an unmanned aerial vehicle. Biosyst. Eng. 2013, 115, 31–42. [Google Scholar] [CrossRef]
  19. Hatfield, J.L.; Gitelson, A.A.; Schepers, J.S.; Walthall, C.L. Application of Spectral Remote Sensing for Agronomic Decisions. Agron. J. 2008, 100, 117–131. [Google Scholar] [CrossRef]
  20. Jordan, C.F. Derivation of leaf area index from quality of light on the forest floor. Ecology 1969, 50, 663–666. [Google Scholar] [CrossRef]
  21. Tucker, C.J. Red and photographic infrared linear combinations for monitoring vegetation. Remote Sens. Environ. 1979, 8, 127–150. [Google Scholar] [CrossRef]
  22. Huete, A.R. A soil-adjusted vegetation index (SAVI). Remote Sens. Environ. 1988, 25, 295–309. [Google Scholar] [CrossRef]
  23. Hunt, E.R.; Hively, W.D.; Fujikawa, S.J.; Linden, D.S.; Daughtry, C.S.; McCarty, G.W. Acquisition of NIR-green-blue digital photographs from unmanned aircraft for crop monitoring. Remote Sens. 2010, 2, 290–305. [Google Scholar] [CrossRef]
  24. Hunt, E.R.; Hively, W.D.; McCarty, G.W.; Daughtry, C.S.T.; Forrestal, P.J.; Kratochvil, R.J.; Carr, J.L.; Allen, N.F.; Fox-Rabinovitz, J.R.; Miller, C.D. NIR-green-blue high-resolution digital images for assessment of winter cover crop biomass. GISci. Remote Sens. 2011, 48, 86–98. [Google Scholar] [CrossRef]
  25. Lebourgeois, V.; Bégué, A.; Labbé, S.; Houlès, M.; Martiné, J.F. A light-weight multi-spectral aerial imaging system for nitrogen crop monitoring. Precis. Agric. 2012, 13, 525–541. [Google Scholar] [CrossRef]
  26. Suárez, L.; Zarco-Tejada, P.; González-Dugo, V.; Berni, J.; Fereres, E. Detecting water stress in orchard crops using PRI from airborne imagery. In Proceedings of the 6th EARSeL SIG IS Workshop Imaging Spectroscopy: Innovative Tool for Scientific and Commercial Environmental Applications, Tel-Aviv, Israel, 16–19 March 2009. [Google Scholar]
  27. Calderón, R.; Navas-Cortés, J.A.; Lucena, C.; Zarco-Tejada, P.J. High-resolution airborne hyperspectral and thermal imagery for early detection of Verticillium wilt of olive using fluorescence, temperature and narrow-band spectral indices. Remote Sens. Environ. 2013, 139, 231–245. [Google Scholar] [CrossRef]
  28. Rey, C.; Martín, M.P.; Lobo, A.; Luna, I.; Diago, M.P.; Millan, B.; Tardáguila, J. Multispectral imagery acquired from a UAV to assess the spatial variability of a Tempranillo vineyard. In Precision Agriculture ’13; Wageningen Academic Publishers: Wageningen, The Netherlands, 2013. [Google Scholar]
  29. Candiago, S.; Remondino, F.; de Giglio, M.; Dubbini, M.; Gattelli, M. Evaluating Multispectral Images and Vegetation Indices for Precision Farming Applications from UAV Images. Remote Sens. 2015, 7, 4026–4047. [Google Scholar] [CrossRef]
  30. Hunt, E.; Hively, W.D.; Daughtry, C.S.; McCarty, G.W.; Fujikawa, S.J.; Ng, T.; Tranchitella, M.; Linden, D.S.; Yoel, D.W. Remote sensing of crop leaf area index using unmanned airborne vehicles. In Proceedings of the Pecora 17 Symposium, Denver, CO, USA, 18–20 November 2008. [Google Scholar]
  31. Mathews, A.J.; Jensen, J.L.R. Visualizing and Quantifying Vineyard Canopy LAI Using an Unmanned Aerial Vehicle (UAV) Collected High Density Structure from Motion Point Cloud. Remote Sens. 2013, 5, 2164–2183. [Google Scholar] [CrossRef]
  32. Yao, X.; Wang, N.; Liu, Y.; Cheng, T.; Tian, Y.; Chen, Q.; Zhu, Y. Estimation of Wheat LAI at Middle to High Levels Using Unmanned Aerial Vehicle Narrowband Multispectral Imagery. Remote Sens. 2017, 9, 1304. [Google Scholar] [CrossRef]
  33. Bendig, J.; Bolten, A.; Bennertz, S.; Broscheit, J.; Eichfuss, S.; Bareth, G. Estimating Biomass of Barley Using Crop Surface Models (CSMs) Derived from UAV-Based RGB Imaging. Remote Sens. 2014, 6, 10395–10412. [Google Scholar] [CrossRef]
  34. Von Bueren, S.; Burkart, A.; Hueni, A.; Rascher, U.; Tuohy, M.; Yule, I. Comparative validation of UAV based sensors for the use in vegetation monitoring. Biogeosci. Discuss. 2014, 11, 3837–3864. [Google Scholar] [CrossRef] [Green Version]
  35. Gastal, F.; Lemaire, G.; Durand, J.-L.; Louarn, G. Quantifying crop responses to nitrogen and avenues to improve nitrogen-use efficiency. In Crop Physiology (Second Edition); Academic Press: Cambridge, MA, USA, 2005. [Google Scholar]
  36. Bremner, J.M.; Mulvancy, C.S. Nitrogen-total. In Methods of Soil Analysis. Part 2 Chemical and Microbiological Properties; American Society of Agronomy: Madison, WI, USA, 1982; pp. 595–624. [Google Scholar]
  37. Zhou, X.; Zheng, H.B.; Xu, X.Q.; He, J.Y.; Ge, X.K.; Yao, X.; Cheng, T.; Zhu, Y.; Cao, W.X.; Tian, Y.C. Predicting grain yield in rice using multi-temporal vegetation indices from UAV-based multispectral and digital imagery. ISPRS J. Photogram. Remote Sens. 2017, 130, 246–255. [Google Scholar] [CrossRef]
  38. Pérez-Ortiz, M.; Peña, J.; Gutiérrez, P.; Torres-Sánchez, J.; Hervás-Martínez, C.; López-Granados, F. A semi-supervised system for weed mapping in sunflower crops using unmanned aerial vehicles and a crop row detection method. Appl. Soft Comput. 2015, 37, 533–544. [Google Scholar] [CrossRef]
  39. Severtson, D.; Callow, N.; Flower, K.; Neuhaus, A.; Olejnik, M.; Nansen, C. Unmanned aerial vehicle canopy reflectance data detects potassium deficiency and green peach aphid susceptibility in canola. Precis. Agric. 2016, 17, 659–677. [Google Scholar] [CrossRef]
  40. Garcia-Ruiz, F.; Sankaran, S.; Maja, J.M.; Lee, W.S.; Rasmussen, J.; Ehsani, R. Comparison of two aerial imaging platforms for identification of Huanglongbing-infected citrus trees. Comput. Electron. Agric. 2013, 91, 106–115. [Google Scholar] [CrossRef]
  41. Kelcey, J.; Lucieer, A. Sensor Correction of a 6-Band Multispectral Imaging Sensor for UAV Remote Sensing. Remote Sens. 2012, 4, 1462–1493. [Google Scholar] [CrossRef]
  42. Smith, G.M.; Milton, E.J. The use of the empirical line method to calibrate remotely sensed data to reflectance. Int. J. Remote Sens. 1999, 20, 2653–2662. [Google Scholar] [CrossRef]
  43. Woebbecke, D.; Meyer, G.; von Bargen, K.; Mortensen, D. Color indices for weed identification under various soil, residue, and lighting conditions. Trans. ASAE 1995, 38, 259–269. [Google Scholar] [CrossRef]
  44. Gitelson, A.A.; Kaufman, Y.J.; Stark, R.; Rundquist, D. Novel algorithms for remote estimation of vegetation fraction. Remote Sens. Environ. 2002, 80, 76–87. [Google Scholar] [CrossRef]
  45. Rasmussen, J.; Ntakos, G.; Nielsen, J.; Svensgaard, J.; Poulsen, R.N.; Christensen, S. Are vegetation indices derived from consumer-grade cameras mounted on UAVs sufficiently reliable for assessing experimental plots? Eur. J. Agron. 2016, 74, 75–92. [Google Scholar] [CrossRef]
  46. Gitelson, A.A.; Kaufman, Y.J.; Merzlyak, M.N. Use of a green channel in remote sensing of global vegetation from EOS-MODIS. Remote Sens. Environ. 1996, 58, 289–298. [Google Scholar] [CrossRef]
  47. Gitelson, A.A.; Gritz, Y.; Merzlyak, M.N. Relationships between leaf chlorophyll content and spectral reflectance and algorithms for non-destructive chlorophyll assessment in higher plant leaves. J. Plant Physiol. 2003, 160, 271–282. [Google Scholar] [CrossRef] [PubMed]
  48. Datt, B. Visible/near infrared reflectance and chlorophyll content in Eucalyptus leaves. Int. J. Remote Sens. 1999, 20, 2741–2759. [Google Scholar] [CrossRef]
  49. Cheng, T.; Song, R.; Li, D.; Zhou, K.; Zheng, H.; Yao, X.; Tian, Y.; Cao, W.; Zhu, Y. Spectroscopic Estimation of Biomass in Canopy Components of Paddy Rice Using Dry Matter and Chlorophyll Indices. Remote Sens. 2017, 9, 319. [Google Scholar] [CrossRef]
  50. Li, F.; Gnyp, M.L.; Jia, L.; Miao, Y.; Yu, Z.; Koppe, W.; Bareth, G.; Chen, X.; Zhang, F. Estimating N status of winter wheat using a handheld spectrometer in the North China Plain. Field Crops Res. 2008, 106, 77–85. [Google Scholar] [CrossRef]
  51. Tilly, N.; Aasen, H.; Bareth, G. Fusion of Plant Height and Vegetation Indices for the Estimation of Barley Biomass. Remote Sens. 2015, 7, 11449–11480. [Google Scholar] [CrossRef]
  52. Cao, Q.; Miao, Y.; Feng, G.; Gao, X.; Li, F.; Liu, B.; Yue, S.; Cheng, S.; Ustin, S.L.; Khosla, R. Active canopy sensing of winter wheat nitrogen status: An evaluation of two sensor systems. Comput. Electron. Agric. 2015, 112, 54–67. [Google Scholar] [CrossRef]
  53. Gitelson, A.A.; Andrés, V.; Arkebauer, T.J.; Rundquist, D.C.; Galina, K.; Bryan, L. Remote estimation of leaf area index and green leaf biomass in maize canopies. Geophys. Res. Lett. 2003, 30, 335–343. [Google Scholar] [CrossRef]
  54. Mutanga, O.; Skidmore, A.K. Narrow band vegetation indices overcome the saturation problem in biomass estimation. Int. J. Remote Sens. 2004, 25, 3999–4014. [Google Scholar] [CrossRef]
  55. Elvidge, C.D.; Chen, Z. Comparison of broad-band and narrow-band red and near-infrared vegetation indices. Remote Sens. Environ. 1995, 54, 38–48. [Google Scholar] [CrossRef]
  56. Perry, E.M.; Roberts, D.A. Sensitivity of Narrow-Band and Broad-Band Indices for Assessing Nitrogen Availability and Water Stress in an Annual Crop. Agron. J. 2008, 100, 1211–1219. [Google Scholar] [CrossRef]
  57. Knyazikhin, Y.; Schull, M.A.; Stenberg, P.; Mõttus, M.; Rautiainen, M.; Yang, Y.; Marshak, A.; Carmona, P.L.; Kaufmann, R.K.; Lewis, P.; et al. Hyperspectral remote sensing of foliar nitrogen content. Proc. Natl. Acad. Sci. USA 2013, 110, 185–192. [Google Scholar] [CrossRef] [PubMed]
  58. Bajwa, S.; Mishra, A.; Norman, R. Canopy reflectance response to plant nitrogen accumulation in rice. Precis. Agric. 2010, 11, 488–506. [Google Scholar] [CrossRef]
  59. Yu, K.; Li, F.; Gnyp, M.L.; Miao, Y.; Bareth, G.; Chen, X. Remotely detecting canopy nitrogen concentration and uptake of paddy rice in the Northeast China Plain. ISPRS J.Photogramm. Remote Sens. 2013, 78, 102–115. [Google Scholar] [CrossRef]
  60. Luna, I.; Lobo, A. Mapping Crop Planting Quality in Sugarcane from UAV Imagery: A Pilot Study in Nicaragua. Remote Sens. 2016, 8, 500. [Google Scholar] [CrossRef]
  61. Torres-Sánchez, J.; Peña, J.M.; Castro, A.I.D.; López-Granados, F. Multi-temporal mapping of the vegetation fraction in early-season wheat fields using images from UAV. Comput. Electron. Agric. 2014, 103, 104–113. [Google Scholar] [CrossRef]
  62. Holman, F.H.; Riche, A.B.; Michalski, A.; Castle, M.; Wooster, M.J.; Hawkesford, M.J. High Throughput Field Phenotyping of Wheat Plant Height and Growth Rate in Field Plot Trials Using UAV Based Remote Sensing. Remote Sens. 2016, 8, 1031. [Google Scholar] [CrossRef]
  63. Zhang, C.; Kovacs, J.M. The application of small unmanned aerial systems for precision agriculture: A review. Precis. Agric. 2012, 13, 693–712. [Google Scholar] [CrossRef]
  64. Ding, Y.F.; Zhao, C.H.; Wang, Q.S. Effect of application stage of panicle fertilizer on rice grain yield and the utilization of nitrogen. J. Nanjing Agric. Univ. 2003, 26, 5–8. [Google Scholar]
  65. Haboudane, D.; Miller, J.R.; Tremblay, N.; Zarco-Tejada, P.J.; Dextraze, L. Integrated narrow-band vegetation indices for prediction of crop chlorophyll content for application to precision agriculture. Remote Sens. Environ. 2002, 81, 416–426. [Google Scholar] [CrossRef]
  66. Torres-Sánchez, J.; López-Granados, F.; de Castro, A.I.; Peña-Barragán, J.M. Configuration and specifications of an Unmanned Aerial Vehicle (UAV) for early site specific weed management. PLoS ONE 2013, 8, e58210. [Google Scholar] [CrossRef] [PubMed]
  67. Yue, J.; Yang, G.; Li, C.; Li, Z.; Wang, Y.; Feng, H.; Xu, B. Estimation of Winter Wheat Above-Ground Biomass Using Unmanned Aerial Vehicle-Based Snapshot Hyperspectral Sensor and Crop Height Improved Models. Remote Sens. 2017, 9, 708. [Google Scholar] [CrossRef]
  68. Liu, H.; Zhu, H.; Wang, P. Quantitative modelling for leaf nitrogen content of winter wheat using UAV-based hyperspectral data. Int. J. Remote Sens. 2017, 38, 2117–2134. [Google Scholar] [CrossRef]
Figure 1. Study site: rice experiment at the NETCIA experimental station in 2015. GCPs, ground control points used for band to band registration.
Remotesensing 10 00824 g001
Figure 2. UAS images acquired from three cameras: MS image (a), CIR image (b) and RGB image (c) and their corresponding VI maps: red edge chlorophyll index (CIred edge) map (d), GNDVI map (e) and NGRDI map (f). Study area (36 plots) was extracted from the three images. MS image is displayed with NIR, G and B bands.
Remotesensing 10 00824 g002
Figure 3. Average measurements of leaf or plant N concentration (a), biomass (b) and N accumulation (c) derived from the 2015 field dataset. Vertical bars denote standard deviation; arrows indicate dates of N top-dressing fertilization. DAT denotes days after transplantation.
Remotesensing 10 00824 g003
Figure 4. Leaf N accumulation (LNA, g m−2) and plant N accumulation (PNA, g m−2) plotted against vegetation indices from RGB and MS images: NExG-MCA (a,e), NExG-RGB (b,f), NGRDI-MCA (c,g) and NGRDI-RGB (d,h). The black solid line is for pooled data and the dashed lines are for individual stages. All regressions are statistically significant (p < 0.01).
Remotesensing 10 00824 g004
Figure 5. Leaf N accumulation (LNA, g m−2) and plant N accumulation (PNA, g m−2) plotted against vegetation indices from CIR and MS images: GNDVI-MCA (a,e), GNDVI-CIR (b,f), ENDVI-MCA (c,g) and ENDVI-CIR (d,h). The black solid line is for pooled data and the dashed lines are for individual stages. All regressions are statistically significant (p < 0.01).
Remotesensing 10 00824 g005
Figure 6. Leaf N accumulation (LNA, g m−2) and plant N accumulation (PNA, g m−2) plotted against red edge indices from MS images: CIred edge (a,c) and DATT (b,d). The black solid line is for pooled data and the dashed lines are for individual stages. All regressions are statistically significant (p < 0.01).
Remotesensing 10 00824 g006
Figure 7. The 1:1 relationship between the estimated and measured leaf N accumulation (LNA, g m−2) in rice based on NGRDI-MCA (a), GNDVI-MCA (b), CIred edge (c), NGRDI-RGB (d), GNDVI-CIR (e), and DATT (f). Only RGB and CIR images have tillering data. The solid line indicates the 1:1 line and the dashed line indicates the regression line.
Remotesensing 10 00824 g007
Figure 8. The 1:1 relationship between the estimated and measured plant N accumulation (PNA, g m−2) in rice based on NGRDI-MCA (a), GNDVI-MCA (b), CIred edge (c), NGRDI-RGB (d), GNDVI-CIR (e), and DATT (f). Only RGB and CIR images have tillering data. The solid line indicates the 1:1 line and the dashed line indicates the regression line.
Remotesensing 10 00824 g008
Figure 9. The 1:1 relationship between the estimated and measured leaf N accumulation (LNA, g m−2) and plant N accumulation (PNA, g m−2) in rice based on two-stage (tillering and jointing) model using color indices derived from the RGB images: NGRDI-LNA model (a) and NExG-PNA model (b). The solid line indicates the 1:1 line and the dashed line indicates the regression line.
Remotesensing 10 00824 g009
Figure 10. N accumulation maps using the derived generic relationship between CIred edge and N accumulation at different growth stages, LNA at jointing stage (a) and booting stage (b); PNA at jointing stage (c) and booting stage (d).
Remotesensing 10 00824 g010
Table 1. Synthesis of field management and data acquisition calendar.
YearSeedlingN FertilizerUAS Flight DateField Sampling DateGrowth StageImage Acquisition
MSRGBCIR
201516 May23 June21 July21 JulyTillering
2 August5 August31 JulyJointing
14 August14 August15 AugustBooting
201618 May25 June21 July21 JulyTillering-
4 August6 August6 AugustJointing
14 August14 August14 AugustBooting
Note: MS, RGB and CIR represent multispectral, red–green–blue and color infrared.
Table 2. Technical specifications of the three cameras and image captures from the UAS.
CameraVersionField of ViewImage SizeAltitude (m)Coverage (Single Image) (ha)Pixel Size (on the Ground) (mm)
RGBCanon 5D Mark Ш74° × 53°3840 × 5760500.7513
Color infraredCanon PowerShot SX26072° × 52°3000 × 40001001.4136
MultispectralMini-MCA38° × 31°1024 × 12801000.3854
Table 3. Spectral vegetation indices evaluated in this study.
IndexNameFormulaReferencesCamera
NExGNormalized Excess green index(2*G − R − B)/(G + R + B)[43,45]MS, RGB
NGRDINormalized green-red difference index(G − R)/(G + R)[21,44]MS, RGB
GNDVIGreen normalized difference vegetation index(NIR − G)/(NIR + G)[46]MS, CIR
ENDVIEnhanced normalized difference vegetation index(NIR + G − 2*B)/(NIR + G + 2*B)(www.maxmax.com)MS, CIR
CIred edgeRed edge chlorophyll indexNIR/RE-1[47]MS
DATTDATT(NIR − RE)/(NIR − R)[48]MS
Note: For RGB and CIR images, NIR, R, G and B are the radiometric normalized pixel values of the NIR, red, green and blue band, respectively. For multispectral images, NIR, RE, R, G and B are the reflectance values of the near infrared, red edge, red, green and blue bands, respectively.
Table 4. Accuracy assessment with the determination coefficient (R2) and root mean squared error (RMSE) values for the estimation of rice leaf N accumulation (LNA, g m−2) and plant N accumulation (PNA, g m−2) with vegetation indices in 2016.
IndicesLNA (g m−2)PNA (g m−2)
TilleringJointingBootingJointing & BootingAll Three StagesTilleringJointingBootingJointing & BootingAll Three Stages
R2RMSER2RMSER2RMSER2RMSER2RMSER2RMSER2RMSER2RMSER2RMSER2RMSE
NExG-MCA--0.291.740.213.410.165.16----0.333.090.195.060.174.63--
NExG-RGB0.421.040.344.020.214.700.196.140.302.040.661.180.416.270.199.060.168.920.297.44
NGRDI-MCA--0.411.740.362.580.302.29----0.472.440.334.810.313.83--
NGRDI-RGB0.580.920.521.610.512.500.412.660.502.220.581.620.562.600.464.630.374.530.493.76
GNDVI-MCA--0.781.250.791.360.691.49----0.841.670.772.560.712.41--
GNDVI-CIR0.710.750.702.340.552.670.462.500.652.080.741.600.742.390.525.130.453.730.653.12
ENDVI-MCA--0.641.330.631.800.492.02----0.712.460.613.210.513.52--
ENDVI-CIR0.551.760.372.040.143.820.102.340.452.180.602.770.404.250.127.030.104.100.453.75
CIred edge--0.851.530.821.330.791.43----0.881.150.832.720.812.38--
DATT--0.861.900.831.380.811.45----0.901.690.822.580.842.27--
Note: The number in bold denotes the maximal R2 or minimal RMSE in each column.

