Modeling Photosynthetically Active Radiation from Satellite-Derived Estimations over Mainland Spain

 ,
,
Abstract
:
1. Introduction
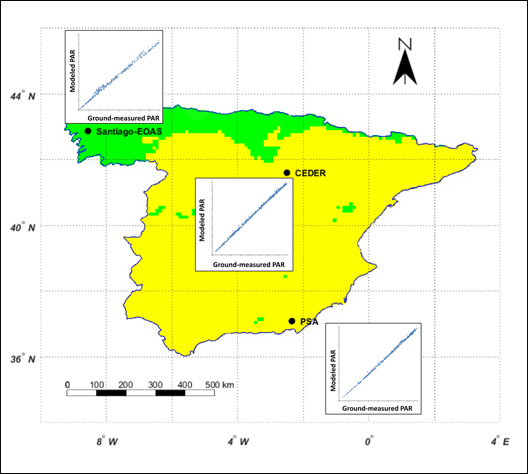
2. Data
3. Methodology
3.1. Steps Followed
- Step 1: Obtaining GHI and PAR Estimations
- Step 2: Clustering Analysis
- Step 3: Obtaining Regression Models
- Step 4: Validation
- (a)
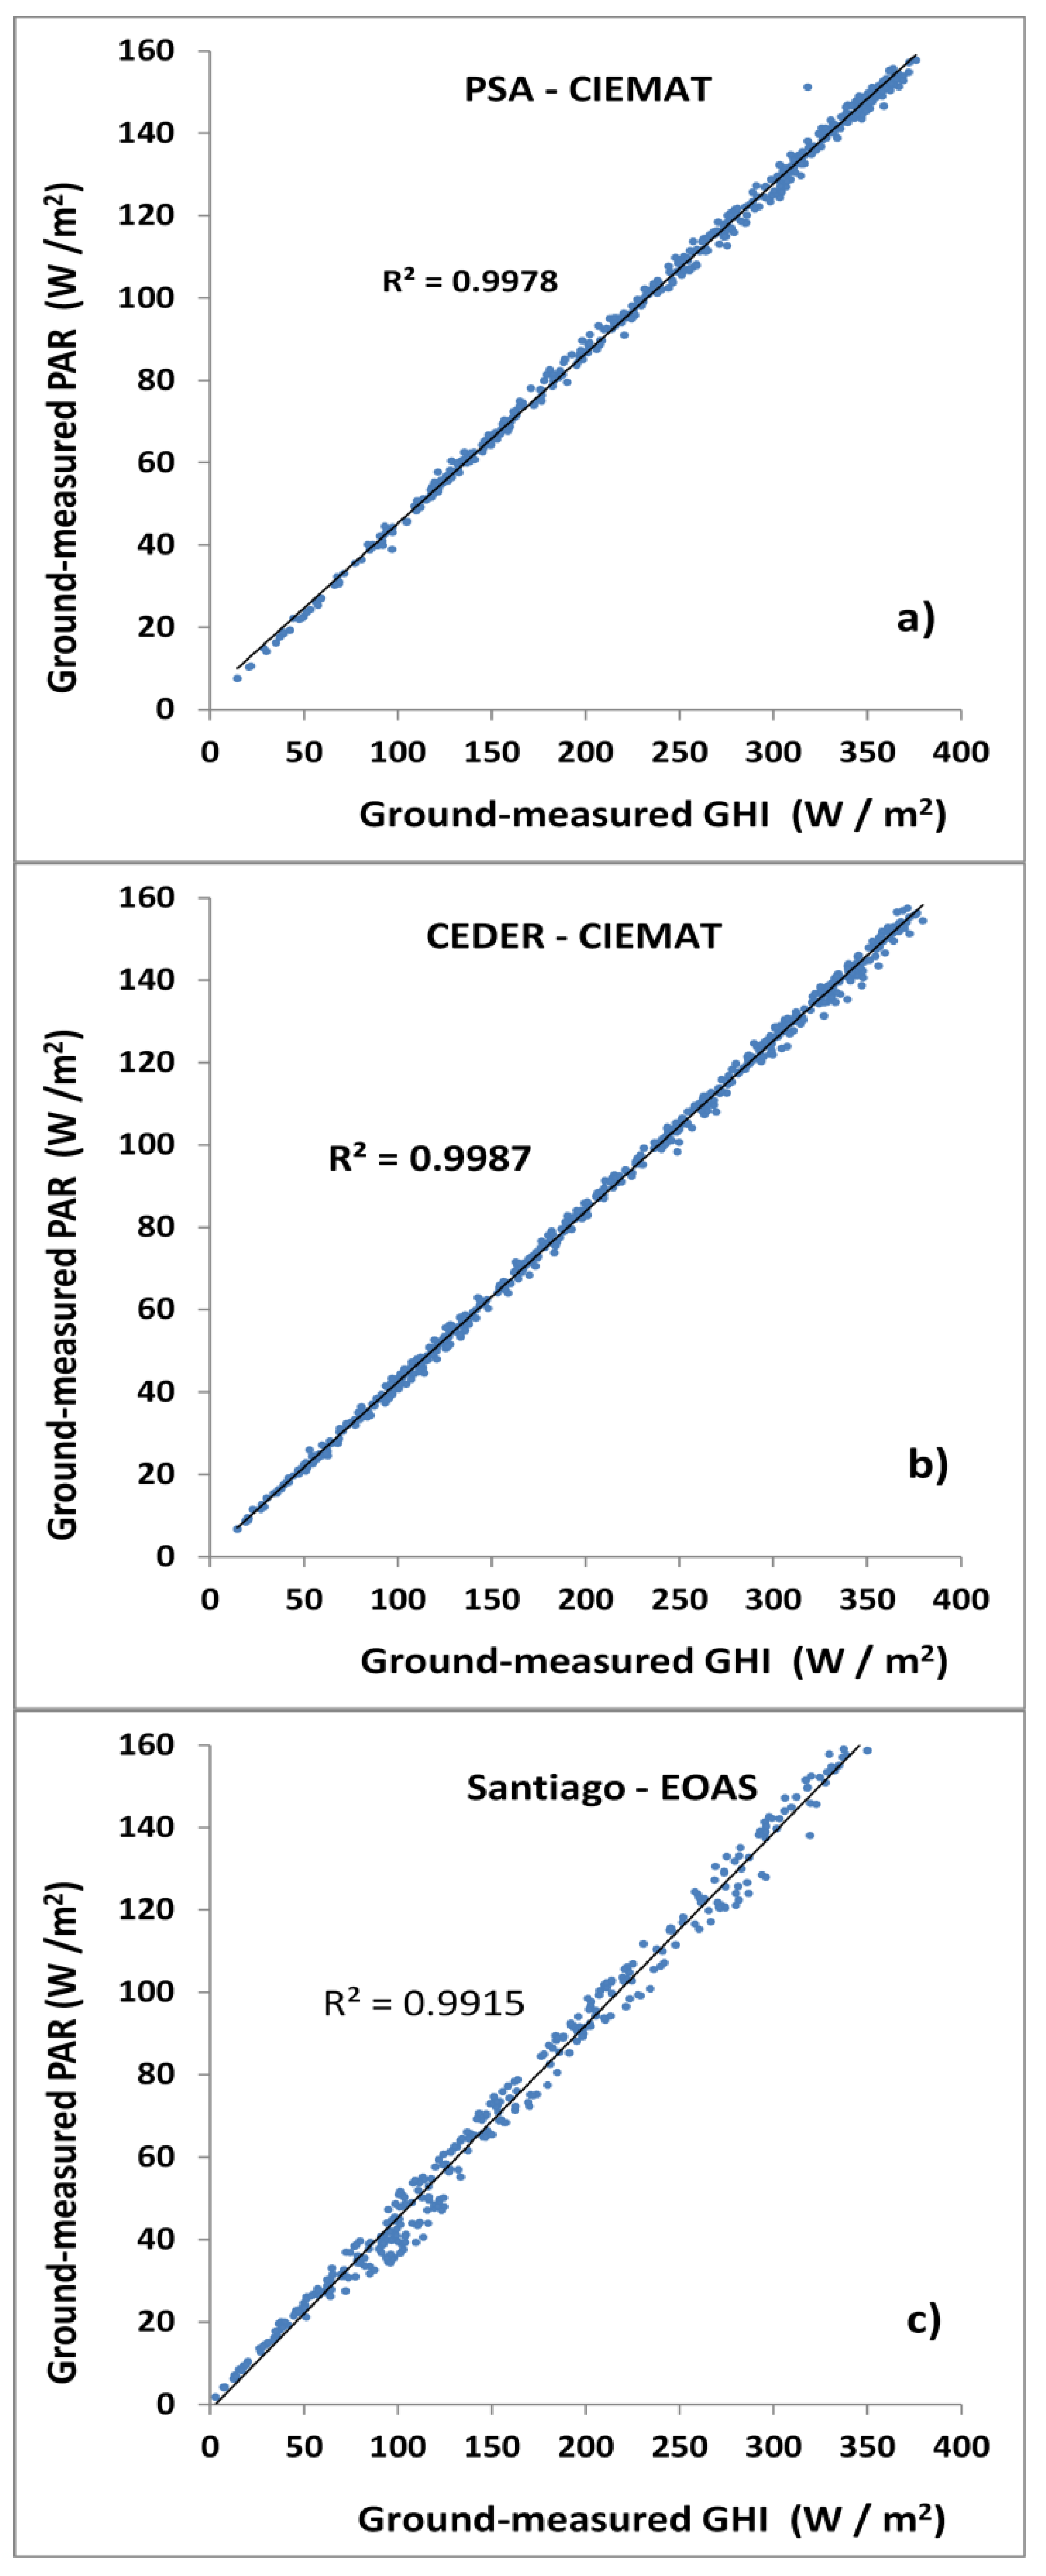
- Obtaining the regression line between PAR measured versus GHI measured;
- (b)
- Obtaining the distances between the PAR measured values and PAR values obtained by the regression line;
- (c)
- Obtaining the interquartile range and the 25th and 75th percentiles of these distances; and
- (d)
- Determining the points with a PAR measured that is either higher than the 75th percentile plus three times the interquartile range or lower than the 25th percentile minus three times this interquartile range. These points are the extreme values [35].
3.2. Justification of Method
3.3. Limitations of Method
- The lack of more ground measurements prevents correcting the model using such measurements. In fact, this work is supported by the Spanish Ministry of Economy, Industry and Competitiveness (Project CGL2016-79284-P AEI/FEDER/UE), which is devoted to reducing this lack of measurements via the installation of a network of stations.
- The assumption of the PAR/GHI ratio estimation provided by the satellite is accurate enough and, thus, a model based on this ratio can be used to obtain PAR from ground GHI values. This assumption is based on the fact that both satellite-derived radiation types are obtained by the same method (summing Kato bands). However, there are no simultaneous ground and satellite data that can be used to assess this accuracy.
4. Results and Discussion
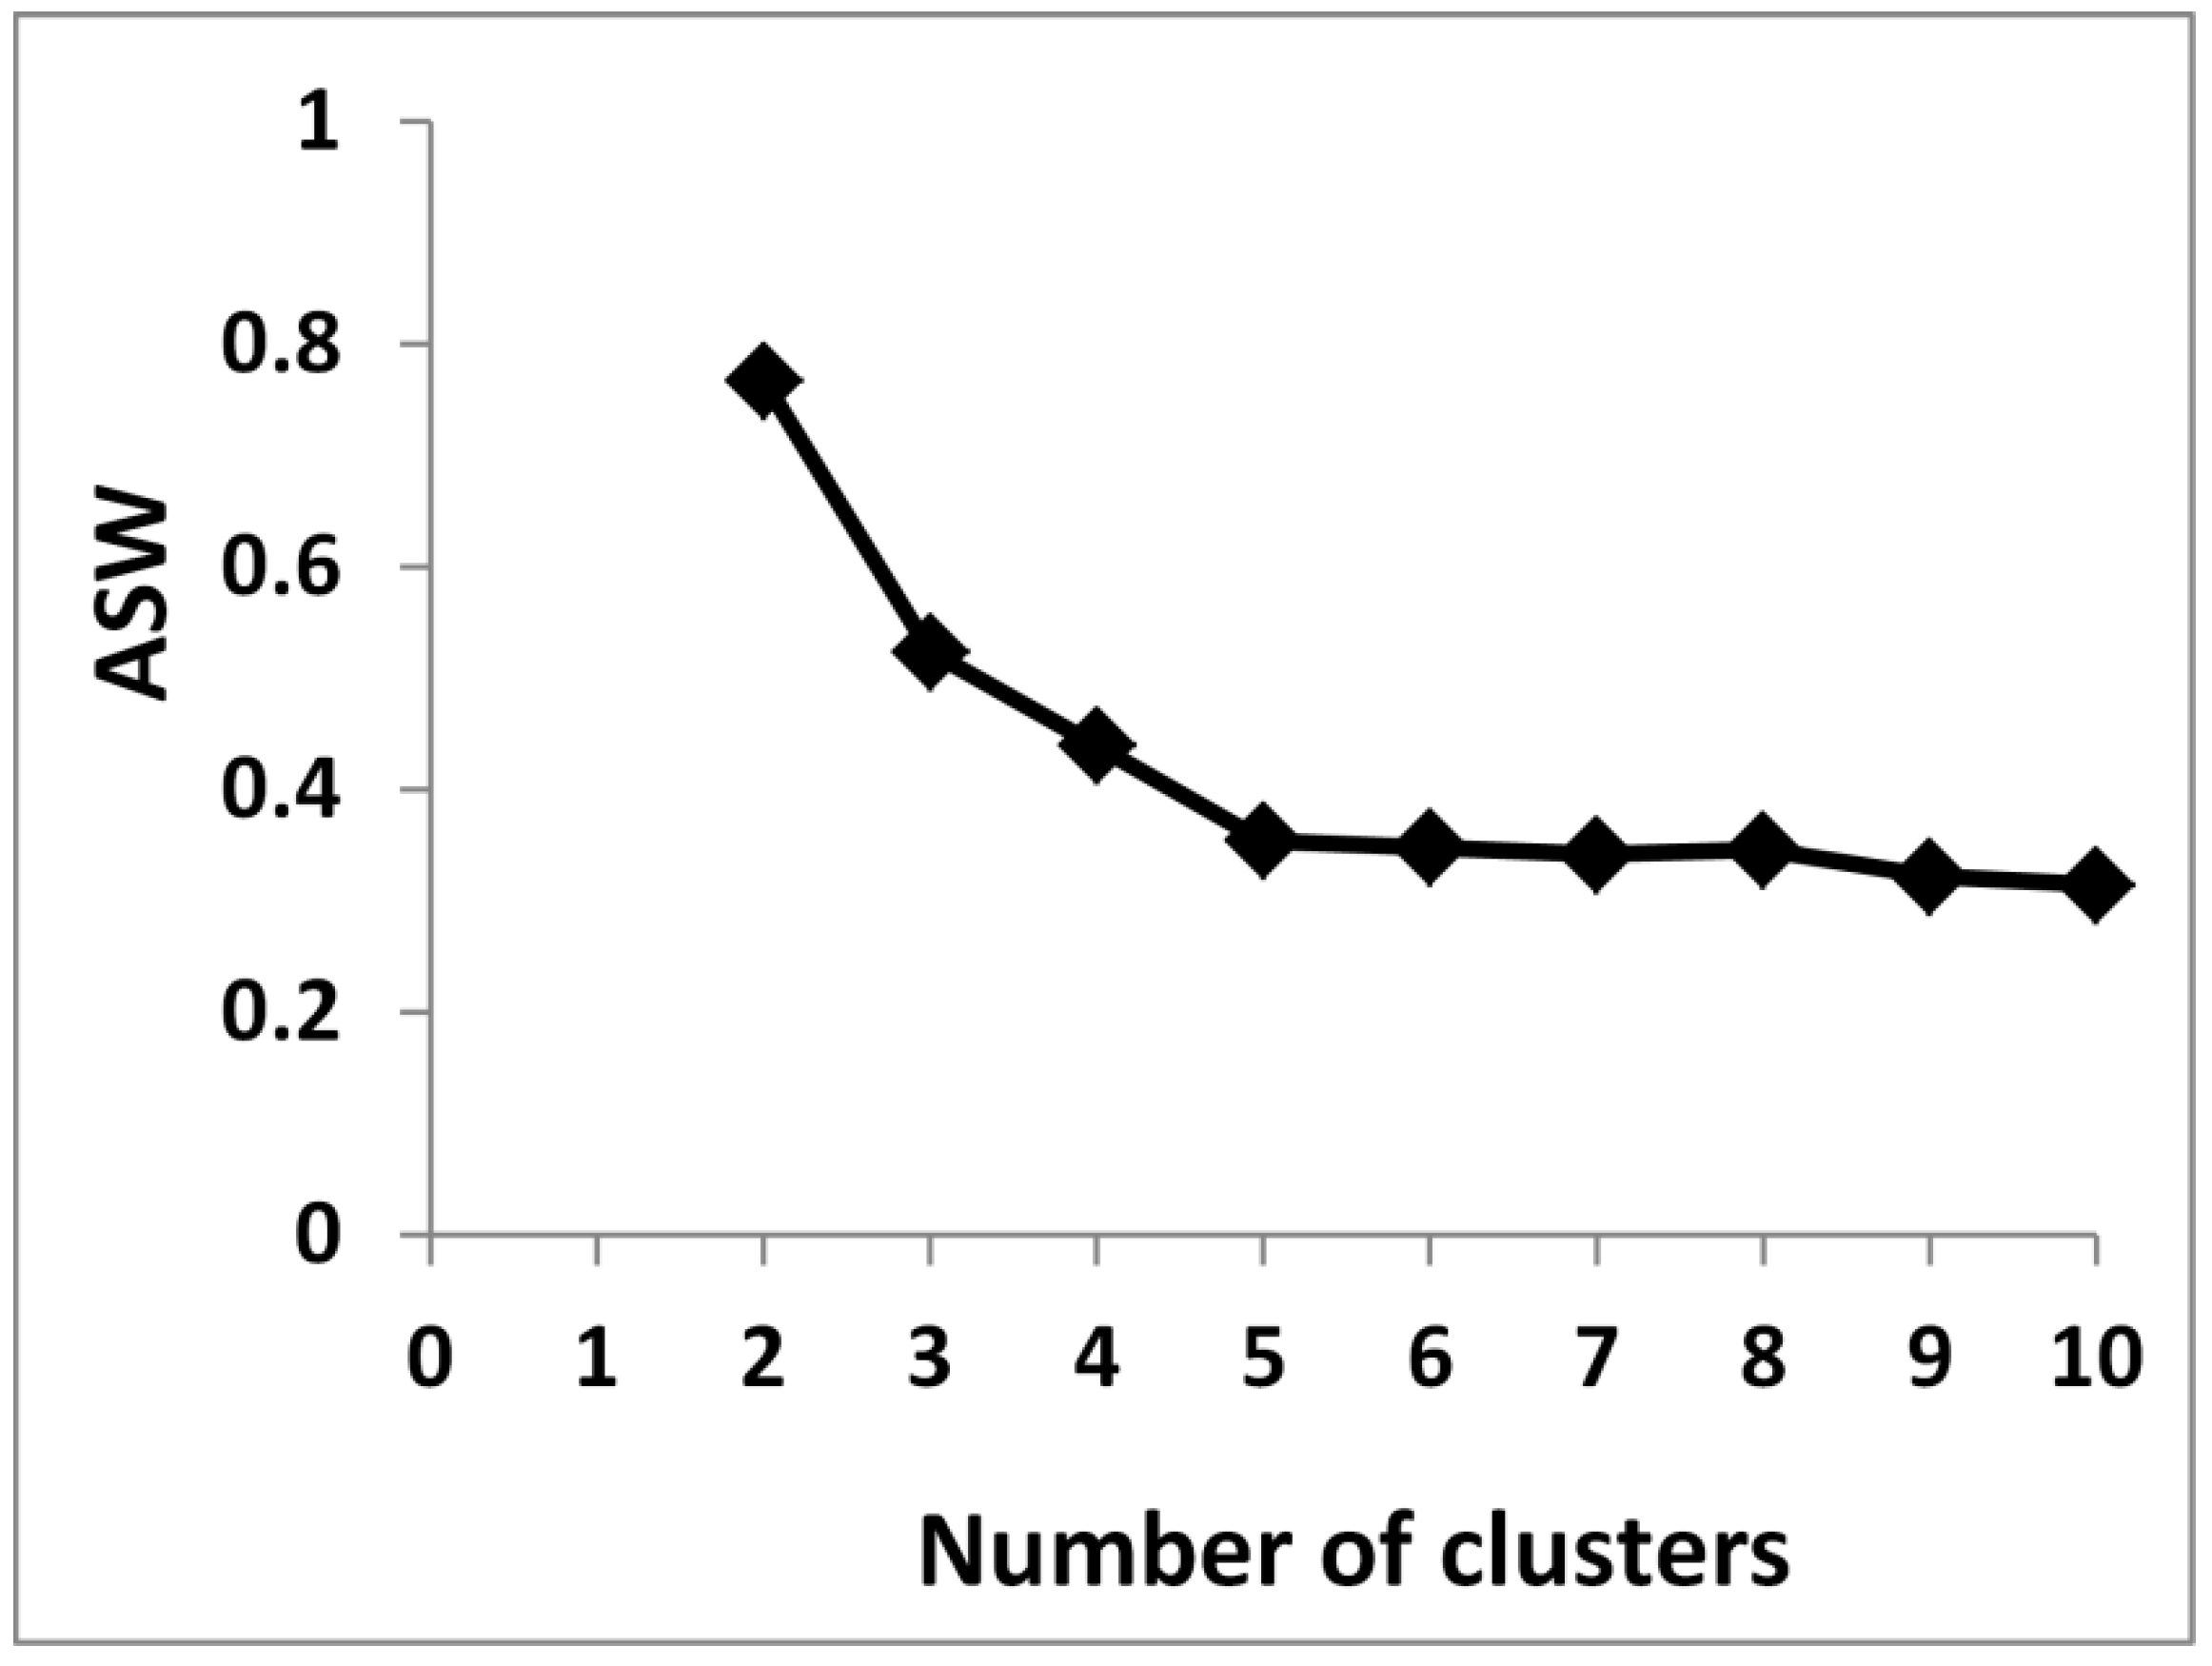
4.1. Determination of the Optimal Number of Clusters According to the Silhouette Method
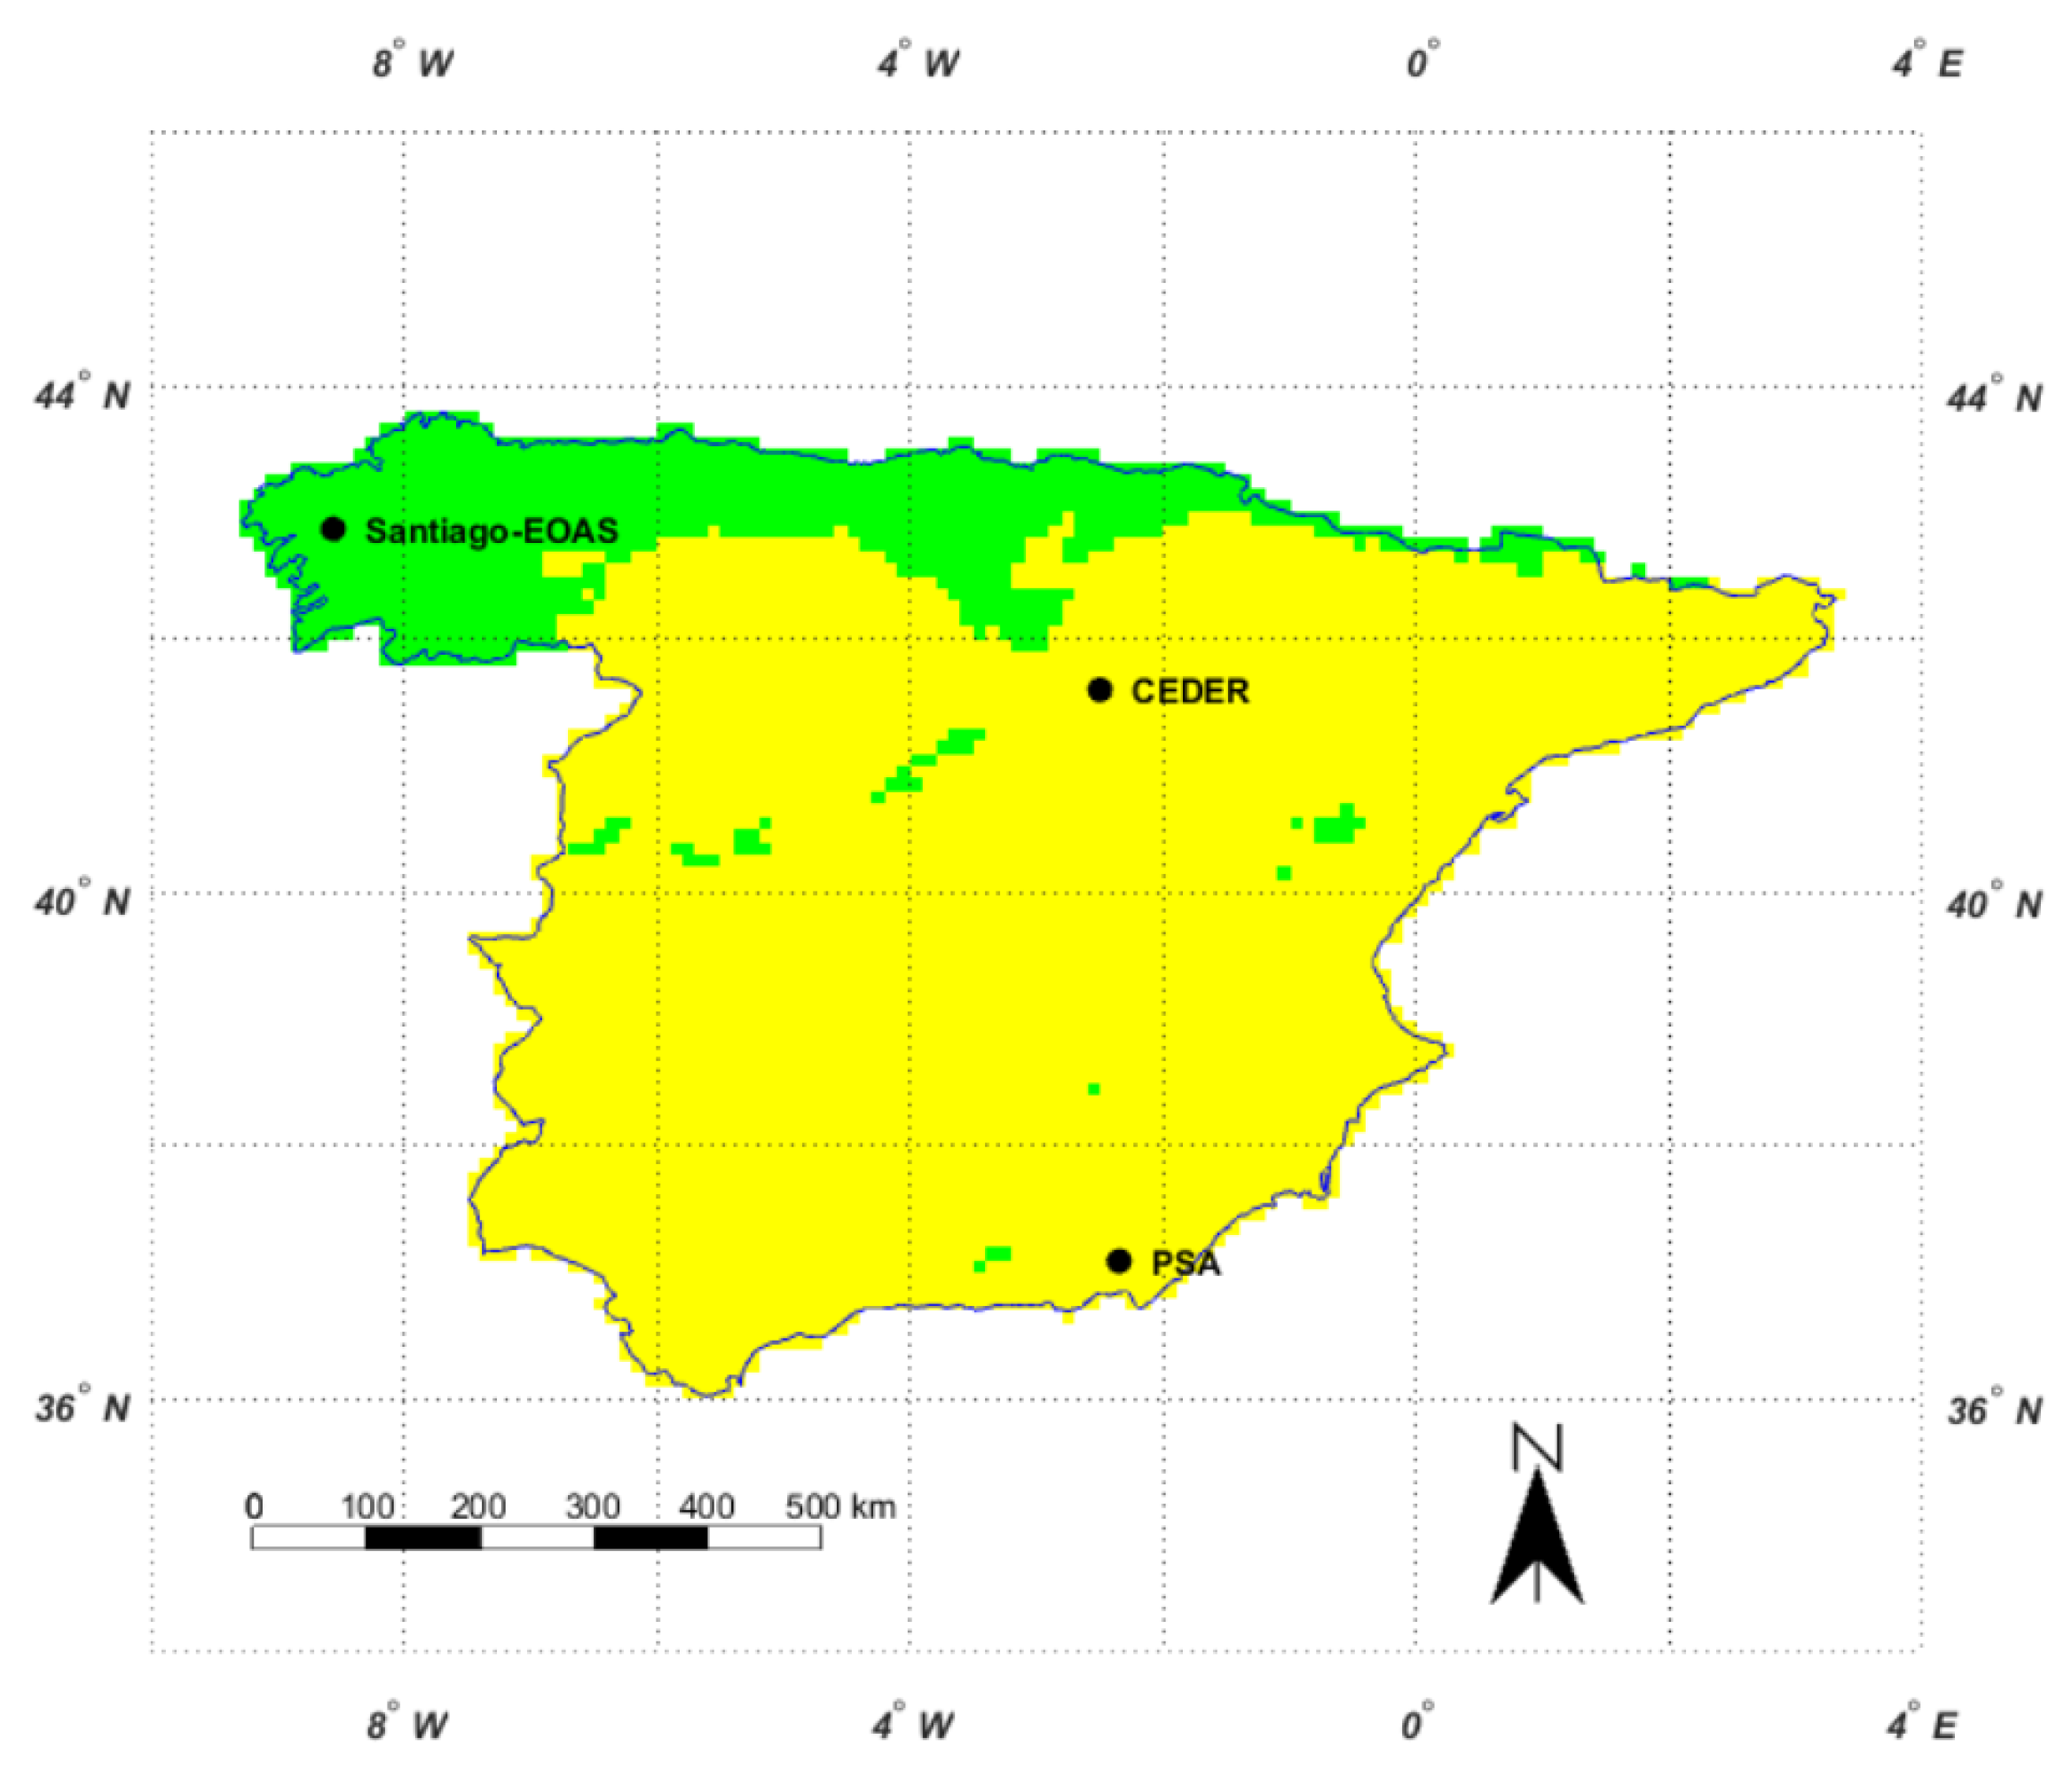
4.2. Clustering Analysis
4.3. Regression Model
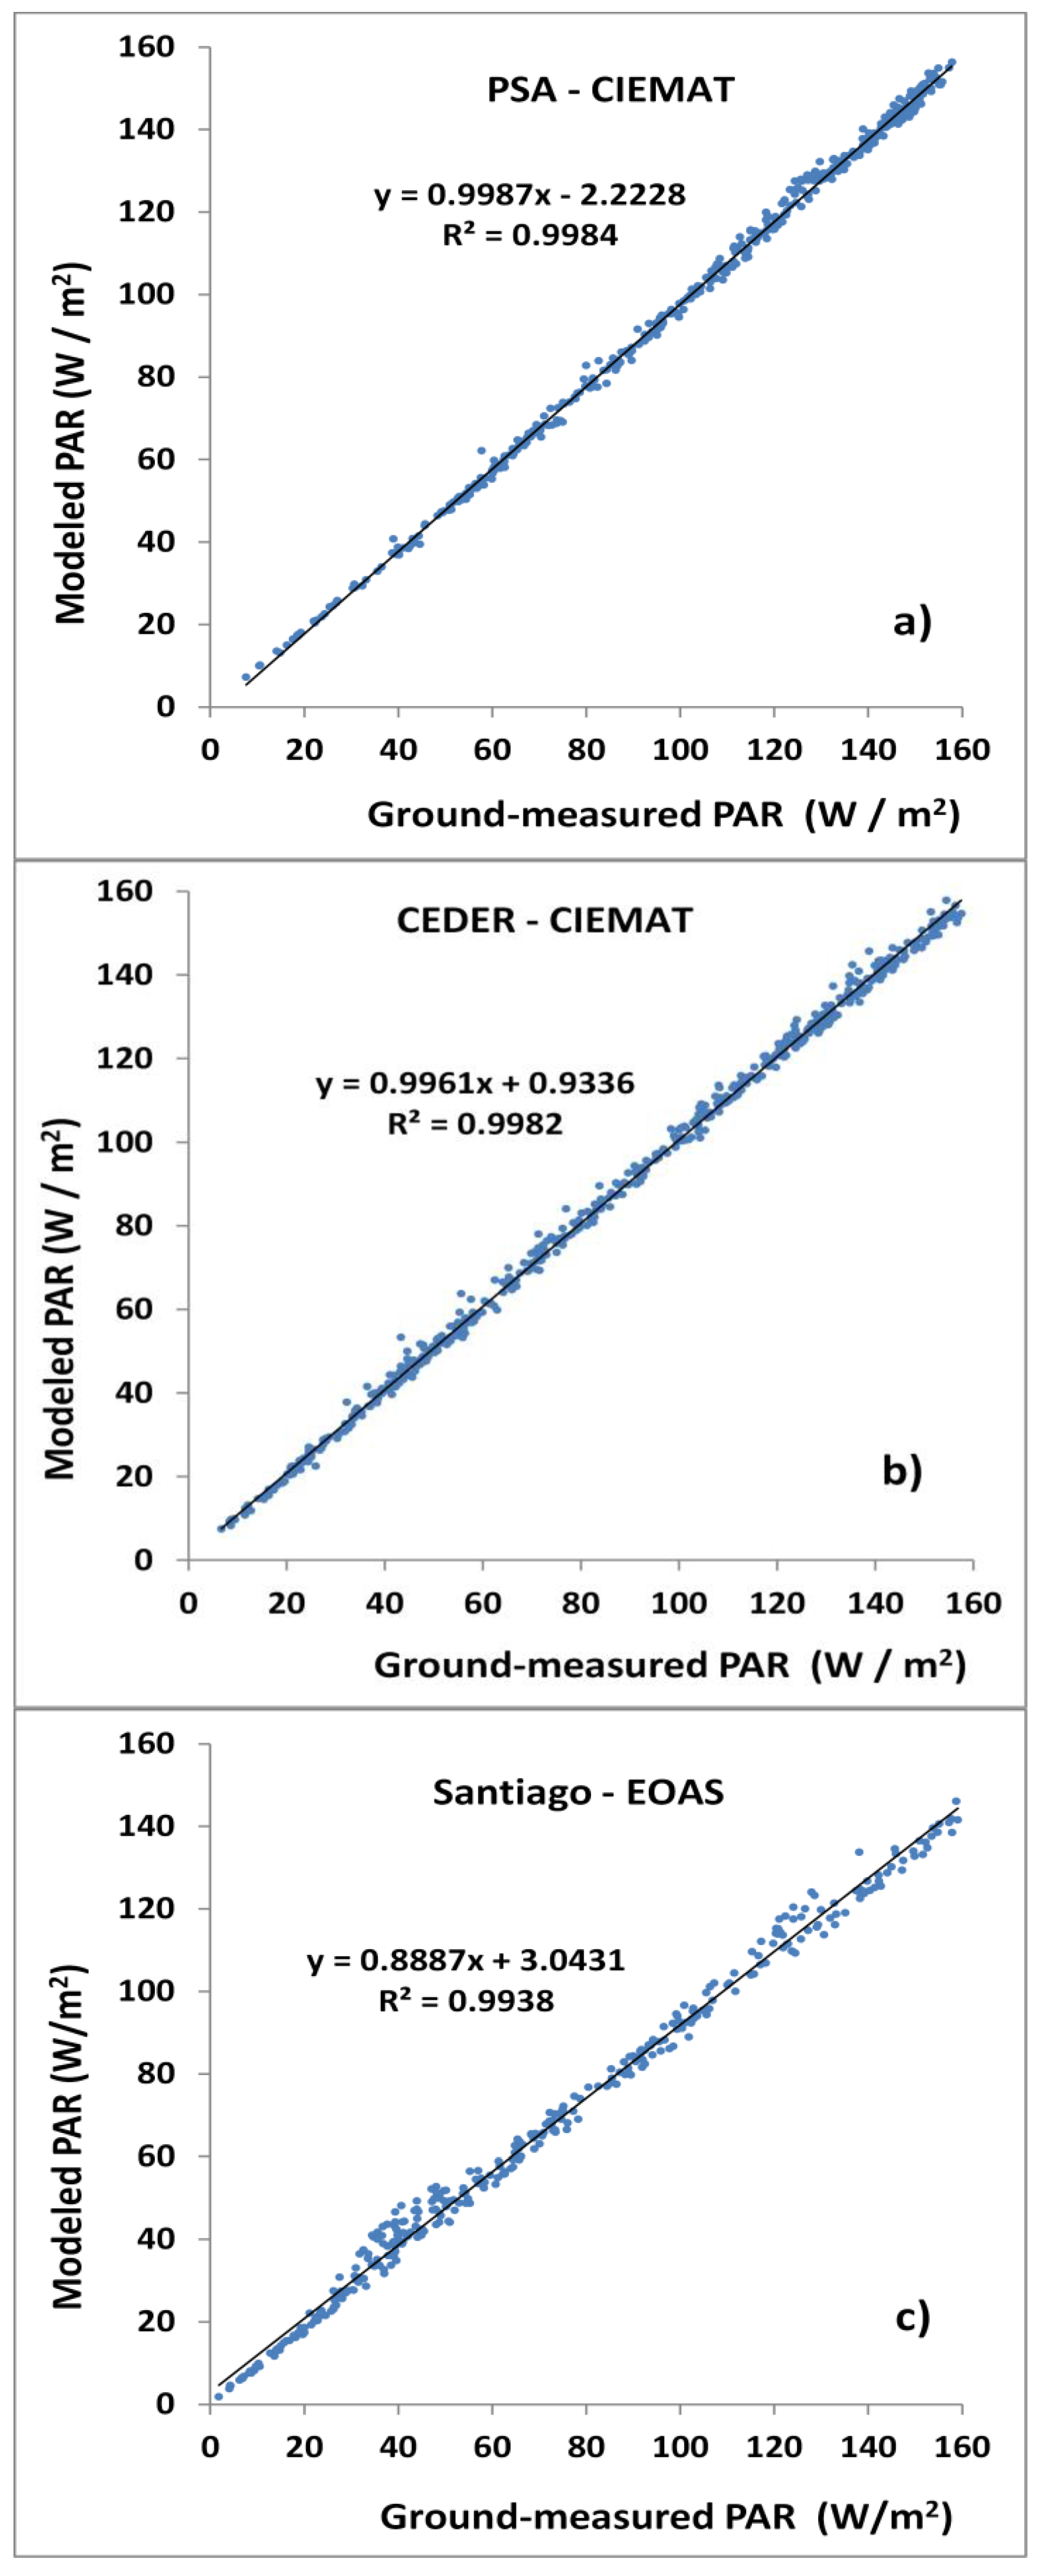
4.4. Validation
5. Conclusions
Author Contributions
Acknowledgments
Conflicts of Interest
References
- Akitsu, T.; Kume, A.; Hirose, Y.; Ijima, O.; Nasahara, K.N. On the stability of radiometric ratios of photosynthetically active radiation to global solar radiation in Tsukuba, Japan. Agric. For. Meteorol. 2015, 209, 59–68. [Google Scholar] [CrossRef]
- Alados, I.; Foyo-Moreno, I.; Alados-Arboledas, L. Photosynthetically active radiation: Measurements and modelling. Agric. For. Meteorol. 1996, 78, 121–131. [Google Scholar] [CrossRef]
- Escobedo, J.F.; Gomes, E.N.; Oliveira, A.P.; Soares, J. Modeling hourly and daily fractions of UV, PAR and NIR to global solar radiation under various sky conditions at Botucatu, Brazil. Appl. Energy 2009, 86, 299–309. [Google Scholar] [CrossRef]
- Hu, B.; Wang, Y.; Liu, G. Measurements and estimations of photosynthetically active radiation in Beijing. Atmos. Res. 2007, 85, 361–371. [Google Scholar] [CrossRef]
- Jacovides, C.P.; Tymvios, F.S.; Boland, J.; Tsitouri, M. Artificial Neural Network models for estimating daily solar global UV, PAR and broadband radiant fluxes in an eastern Mediterranean site. Atmos. Res. 2015, 152, 138–145. [Google Scholar] [CrossRef]
- Sudhakar, K.; Srivastava, T.; Satpathy, G.; Premalatha, M. Modelling and estimation of photosynthetically active incident radiation based on global irradiance in Indian latitudes. Int. IJEEE 2013, 4, 21. [Google Scholar] [CrossRef]
- Zhang, X.; Zhang, Y.; Zhoub, Y. Measuring and modelling photosynthetically active radiation in Tibet Plateau during April-October. Agric. For. Meteorol. 2000, 102, 207–212. [Google Scholar] [CrossRef]
- Liang, S.; Zheng, T.; Liu, R.; Fang, H.; Tsay, S.-C.; Running, S. Estimation of incident photosynthetically active radiation from Moderate Resolution Imaging Spectrometer data. J. Geophys. Res. Atmos. 2006, 111, D15208. [Google Scholar] [CrossRef]
- Zheng, T.; Liang, S.; Wang, K. Estimation of incident photosynthetically active radiation from GOES visible imagery. J. Appl. Meteorol. Climatol. 2008, 47, 853–868. [Google Scholar] [CrossRef]
- Rubio, M.A.; López, G.; Tovar, J.; Pozo, D.; Batlles, F.J. The use of satellite measurements to estimate photosynthetically active radiation. Phys. Chem. Earth Parts A/B/C 2005, 30, 159–164. [Google Scholar] [CrossRef]
- Alados-Arboledas, L.; Olmo, F.J.; Alados, I.; Perez, M. Parametric models to estimate photosynthetically active radiation in Spain. Agric. For. Meteorol. 2000, 101, 187–201. [Google Scholar] [CrossRef]
- Wandji, W.; Espinar, B.; Blanc, P.; Wald, L. Estimating the photosynthetically active radiation under clear skies by means of a new approach. Adv. Sci. Res. 2015, 12, 5–10. [Google Scholar] [CrossRef] [Green Version]
- Seiji, K.; Ackerman, Y.P.; Mather, J.H.; Clothiaux, E.E. The k-distribution method and correlated-k approximation for a shortwave radiative transfer model. J. Quant. Spectrosc. Radiat. Transf. 1999, 62, 109–121. [Google Scholar]
- López, G.; Rubio, M.A.; Martínez, M.; Batlles, F.J. Estimation of hourly global photosynthetically active radiation using artificial neural network models. Agric. For. Meteorol. 2001, 107, 279–291. [Google Scholar] [CrossRef]
- Gastón-Romeo, M.; Leon, T.; Mallor, F.; Ramírez-Santigosa, L. A Morphological Clustering Method for daily solar radiation curves. Sol. Energy 2011, 85, 1824–1836. [Google Scholar] [CrossRef]
- Ghayekhloo, M.; Ghofrani, M.; Menhaj, M.B.; Azimi, R. A novel clustering approach for short-term solar radiation forecasting. Sol. Energy 2015, 122, 1371–1383. [Google Scholar] [CrossRef]
- Jiménez-Pérez, P.F.; Mora-López, L. Modeling and forecasting hourly global solar radiation using clustering and classification techniques. Sol. Energy 2016, 135, 682–691. [Google Scholar] [CrossRef]
- Polo, J.; Gastón, M.; Vindel, J.M.; Pagola, I. Spatial variability and clustering of global solar irradiation in Vietnam from sunshine duration measurements. Renew. Sustain. Energy Rev. 2015, 42, 1326–1334. [Google Scholar] [CrossRef]
- Stengel, M.; Kniffka, A.; Meirink, J.F.; Lockhoff, M.; Tan, J.; Hollmann, R. Claas: The CM SAF cloud property dataset using SEVIRI. Atmos. Chem. Phys. Discuss. 2013, 13, 26451–26487. [Google Scholar] [CrossRef]
- Posselt, R.; Mueller, R.; Stöckli, R.; Trentmann, J. Spatial and Temporal Homogeneity of Solar Surface Irradiance across Satellite Generations. Remote Sens. 2011, 3, 1029–1046. [Google Scholar] [CrossRef]
- Müller, R.; Pfeifroth, U.; Träger-Chatterjee, C.; Cremer, R.; Trentmann, J.; Hollmann, R. Surface Solar Radiation Data Set—Heliosat (SARAH)—Edition 1; EUMETSAT: Darmstadt, Germany, 2015. [Google Scholar]
- Perez, R.; Ineichen, P.; Moore, K.; Kmiecik, M.; Chain, C.; George, R.; Vignola, F. A new operational model for satellite-derived irradiances: Description and validation. Sol. Energy 2002, 73, 307–317. [Google Scholar] [CrossRef]
- Zelenka, A.; Perez, R.; Seals, R.; Renné, D. Effective accuracy of satellite-derived hourly irradiances. Theor. Appl. Climatol. 1999, 62, 199–207. [Google Scholar] [CrossRef]
- Mueller, R.; Behrendt, T.; Hammer, A.; Kemper, A. A New Algorithm for the Satellite-Based Retrieval of Solar Surface Irradiance in Spectral Bands. Remote Sens. 2012, 4, 622–647. [Google Scholar] [CrossRef]
- Mueller, R.; Behrendt, T. Algorithm Theoretical Baseline Document: Spectrally Resolved Solar Surface Irradiance SRI. 2013. Available online: http://www.cmsaf.eu/EN/Documentation/Documentation/ATBD/pdf/SAF_CM_DWD_ATBD_SRI_1.pdf?__blob=publicationFile&v=4 (accessed on 4 April 2018). [CrossRef]
- Riihelä, A.; Carlund, T.; Trentmann, J.; Müller, R.; Lindfors, A.V. Validation of CM SAF Surface Solar Radiation Datasets over Finland and Sweden. Remote Sens. 2015, 7, 6663–6682. [Google Scholar] [CrossRef]
- Vindel, J.M.; Navarro, A.A.; Valenzuela, R.X.; Ramírez, L. Temporal scaling analysis of irradiance estimated from daily satellite data and numerical modelling. Atmos. Res. 2016, 181, 154–162. [Google Scholar] [CrossRef]
- Bojanowski, J.S.; Vrieling, A.; Skidmore, A.K. A comparison of data sources for creating a long-term time series of daily gridded solar radiation for Europe. Sol. Energy 2014, 99, 152–171. [Google Scholar] [CrossRef]
- Pettazzi, A.; Souto, J.A.; Salsón, S.; Pérez Muñuzuri, V. EOAS, a shared joint atmospheric observation site of MeteoGalicia. In Proceedings of the 4th International Conference on Experiences with Automatic Weather Stations, Lisboa, Portugal, 24–26 May 2006. [Google Scholar]
- Andenberg, M.R. Cluster Analysis for Applications; Academic: New York, NY, USA, 1973. [Google Scholar]
- Adam, F.; Celebi, M.E. An Accelerated Nearest Neighbor Search Method for the K-Means Clustering Algorithm. In Proceedings of the Twenty-Sixth International Florida Artificial Intelligence Research Society Conference, St. Pete Beach, FL, USA, 22–24 May 2013; AAAI Press: Palo Alto, CA, USA, 2013. [Google Scholar]
- Macqueen, J. Some methods for classification and analysis of multivariate observations. In Proceedings of the Fifth Berkeley Symposium on Mathematical Statistics and Probability, Berkeley, CA, USA, 7 January 1966; Le, L.M., Neyman, J., Eds.; University of California Press: Berkeley, CA, USA, 1967; pp. 281–297. [Google Scholar]
- Rousseeuw, P.J. Silhouettes: A graphical aid to the interpretation and validation of cluster analysis. J. Comput. Appl. Math. 1987, 20, 53–65. [Google Scholar] [CrossRef]
- Wandji, W.; Espinar, B.; Blanc, P.; Wald, L. How close to detailed spectral calculations is the k-distribution method and correlated-k approximation of Kato et al. (1999) in each spectral interval? Meteorol. Z. 2014, 23, 547–556. [Google Scholar] [CrossRef] [Green Version]
- He, X. Quartiles and Boxplots (Modified). Normal Quantile Plots (QQ-Plot). 2012. Available online: http://www.stat.purdue.edu/~xuanyaoh/stat350/xyJan27Lec6.pdf (accessed on 4 April 2018).
- Peña-Angulo, D.; Trigo, R.M.; Cortesi, N.; González-Hidalgo, J.C. The influence of weather types on the monthly average maximum and minimum temperatures in the Iberian Peninsula. Atmos. Res. 2016, 178–179, 217–230. [Google Scholar]
- Agencia Estatal de Meteorología (AEMET); Instituto de Meteorología de Portugal (IM). Iberian Climate Atlas; AEMET-Ministerio de Medio Ambiente y Medio Rural y Marino & IM: Madrid, Spain, 2011; ISBN 978-84-7837-079-5. [Google Scholar]
- Mueller, R.; Trentmann, J.; Träger-Chatterjee, C.; Posselt, R.; Stöckli, R. The Role of the Effective Cloud Albedo for Climate Monitoring and Analysis. Remote Sens. 2011, 3, 2305–2320. [Google Scholar] [CrossRef]
- Woodhous, I.H. Introduction to Microwave Remote Sensing; Taylor & Francis Group: Boca Raton, FL, USA, 2006. [Google Scholar]
- Hill, C.; Jones, R.L. Absorption of solar radiation by water vapor in clear and cloudy skies: Implications for anomalous absorption. J. Geophys. Res. 2000, 105, 9421–9428. [Google Scholar] [CrossRef]


| Kato Band | Wavelength Region (µm) |
|---|---|
| 7 | 0.408–0.452 |
| 8 | 0.452–0.518 |
| 9 | 0.518–0.540 |
| 10 | 0.540–0.550 |
| 11 | 0.550–0.567 |
| 12 | 0.567–0.605 |
| 13 | 0.605–0.625 |
| 14 | 0.625–0.667 |
| 15 | 0.667–0.684 |
| 16 | 0.684–0.704 |
| Region | N | January | February | March | April | May | June | July | August | September | October | November | December |
|---|---|---|---|---|---|---|---|---|---|---|---|---|---|
| green | 959 | 0.44 | 0.44 | 0.43 | 0.43 | 0.43 | 0.43 | 0.43 | 0.43 | 0.43 | 0.43 | 0.44 | 0.44 |
| yellow | 4515 | 0.43 | 0.43 | 0.42 | 0.43 | 0.42 | 0.42 | 0.42 | 0.42 | 0.42 | 0.43 | 0.43 | 0.43 |
| January | February | March | April | May | June | July | August | September | October | November | December | ||
|---|---|---|---|---|---|---|---|---|---|---|---|---|---|
| Green cluster | a | 0.41 | 0.41 | 0.40 | 0.41 | 0.39 | 0.39 | 0.39 | 0.40 | 0.41 | 0.42 | 0.41 | 0.42 |
| b | 0.99 | 1.76 | 2.75 | 2.88 | 7.61 | 8.69 | 10.18 | 6.38 | 4.50 | 1.68 | 1.36 | 0.65 | |
| Yellow cluster | a | 0.42 | 0.42 | 0.41 | 0.41 | 0.38 | 0.39 | 0.36 | 0.39 | 0.39 | 0.41 | 0.41 | 0.41 |
| b | 0.35 | 0.49 | 1.37 | 2.15 | 10.94 | 9.37 | 18.05 | 8.63 | 7.12 | 2.25 | 1.45 | 1.25 |
| Station | R2 | Slope | Intercept | MBE | RMSE | ||
|---|---|---|---|---|---|---|---|
| (W/m2) | (W/m2) | (%) | (W/m2) | (%) | |||
| PSA | 0.998 | 0.999 | −2.223 | −2.356 | −2.3 | 2.827 | 2.8 |
| CEDER | 0.998 | 0.996 | 0.934 | 0.598 | 0.7 | 1.912 | 2.2 |
| Santiago-EOAS | 0.994 | 0.889 | 3.043 | −4.741 | 6.8 | 7.247 | 10.4 |
© 2018 by the authors. Licensee MDPI, Basel, Switzerland. This article is an open access article distributed under the terms and conditions of the Creative Commons Attribution (CC BY) license (http://creativecommons.org/licenses/by/4.0/).
Share and Cite
Vindel, J.M.; Valenzuela, R.X.; Navarro, A.A.; Zarzalejo, L.F.; Paz-Gallardo, A.; Souto, J.A.; Méndez-Gómez, R.; Cartelle, D.; Casares, J.J. Modeling Photosynthetically Active Radiation from Satellite-Derived Estimations over Mainland Spain. Remote Sens. 2018, 10, 849. https://0-doi-org.brum.beds.ac.uk/10.3390/rs10060849
Vindel JM, Valenzuela RX, Navarro AA, Zarzalejo LF, Paz-Gallardo A, Souto JA, Méndez-Gómez R, Cartelle D, Casares JJ. Modeling Photosynthetically Active Radiation from Satellite-Derived Estimations over Mainland Spain. Remote Sensing. 2018; 10(6):849. https://0-doi-org.brum.beds.ac.uk/10.3390/rs10060849
Chicago/Turabian StyleVindel, Jose M., Rita X. Valenzuela, Ana A. Navarro, Luis F. Zarzalejo, Abel Paz-Gallardo, José A. Souto, Ramón Méndez-Gómez, David Cartelle, and Juan J. Casares. 2018. "Modeling Photosynthetically Active Radiation from Satellite-Derived Estimations over Mainland Spain" Remote Sensing 10, no. 6: 849. https://0-doi-org.brum.beds.ac.uk/10.3390/rs10060849