Article

Effective Airplane Detection in Remote Sensing Images Based on Multilayer Feature Fusion and Improved Nonmaximal Suppression Algorithm

1
Graduate College, Air Force Engineering University, Xi’an 710038, China
2
Unmanned System Research Institute, Northwestern Polytechnical University, Xi’an 710072, China
3
Aeronautics Engineering College, Air Force Engineering University, Xi’an 710038, China
4
Aviation Maintenance NCO Academy, Air Force Engineering University, Xinyang 464000, China
*
Author to whom correspondence should be addressed.
Submission received: 23 March 2019 / Revised: 30 April 2019 / Accepted: 2 May 2019 / Published: 5 May 2019
(This article belongs to the Special Issue Deep Transfer Learning for Remote Sensing)

Abstract

:
Aiming at the problem of insufficient representation ability of weak and small objects and overlapping detection boxes in airplane object detection, an effective airplane detection method in remote sensing images based on multilayer feature fusion and an improved nonmaximal suppression algorithm is proposed. Firstly, based on the common low-level visual features of natural images and airport remote sensing images, region-based convolutional neural networks are chosen to conduct transfer learning for airplane images using a limited amount of data. Then, the L2 norm normalization, feature connection, scale scaling, and feature dimension reduction are introduced to achieve effective fusion of low- and high-level features. Finally, a nonmaximal suppression method based on a soft decision function is proposed to solve the overlap problem of detection boxes. The experimental results show that the proposed method can effectively improve the representation ability of weak and small objects, as well as quickly and accurately detect airplane objects in the airport area.

Graphical Abstract

1. Introduction

With the rapid development of high-resolution satellite remote sensing technology, the resolution of remote sensing images has become higher, and the acquisition method has become more convenient and diversified, facilitating the detection of objects in remote sensing images [1,2]. Airplanes are a typical military and civil object in an optical remote sensing image; they have important functions in battlefield surveillance, aviation control, and transport. However, due to the uncertainty associated with the type, position, and dimension of an airplane and a complex background, airplane detection is always a challenging research topic.
To address this challenge, new methods are proposed constantly; they are divided into conventional and deep learning methods. The conventional methods mainly include the feature detection and the classification learning methods. In the feature detection methods, descriptor and decision criteria are designed based on geometrical or statistical features of an object to complete object detection. For instance, Li et al. [3] proposed a method that combined visual salience and symmetry to classify airplanes via shape matching. Bo et al. [4] proposed a region segmentation-based airplane detection method. Liu et al. [5] proposed an airplane recognition method based on coarse-to-fine edge detection. Tan et al. [6] used a directional local gradient distribution detector and a constant false alarm rate (CFAR)-type algorithm to detect objects. Wang et al. [7] proposed a novel method in two steps to overcome the problem of low aircraft detection precision in remote sensing images. The core concept of the classification learning method is to convert the detection problem into a classification problem; the most important steps are feature extraction and classifier training. For instance, based on sparse coding, Liu et al. [8] proposed a novel method to represent airplane features. First, radial gradient transformation was applied to dictionary learning; next, sparse coding and constraint pooling were combined to represent the features of an airplane; finally, a support vector machine (SVM) model was employed for classification. Yildiz et al. [9] combined a Gabor filter with an SVM for airplane detection. An et al. [10] proposed an automatic airplane detection system for high-resolution remote sensing images. First, a candidate object is located via a circular frequency filter; next, Histogram of Oriented Gradient (HOG) and AdaBoost algorithms are combined to detect the airplane. These conventional fixed models combine manual feature design with classifier training and have limitations such as a redundant sliding window and insufficient feature representation. Therefore, airplane detection accuracy and efficiency are low. In recent years, deep learning has been widely deployed to learn object features automatically. Particularly, the performance of convolutional neural networks (CNNs) in image classification and detection is significantly superior to that of conventional methods. Chen et al. [11] applied the deep belief network (DBN) to airplane detection; however, the DBN was only used as an object classifier and had undesirable detection performance and a long execution time. Wu et al. [12] proposed a binarized normed gradients (BING) detection method coupled with a CNN; however, the 2000–3000 candidate regions produced by BING incurred a high computing cost, which severely affected the speed of the algorithm. Li et al. [13] proposed airplane detection architecture based on reinforcement learning and CNNs; however, compared with the existing leading algorithm, the detection time was too long. Zhang et al. [14] proposed a weakly supervised learning boxwork based on coupled CNNs. Zhong et al. [15] proposed a model that achieved favorable detection accuracy, especially for partially occluded objects. However, this method requires optical images, so is not suitable for remote sensing images.
Due to the emergence of big data and the continuous performance improvements of software and hardware platforms, the performance of deep-learning-based natural image object detection technology improves constantly and remains in a leading position [16,17]. However, as data collection from remote sensing images is difficult and manually marked datasets are scarce, the technology to detect objects in a remote sensing image is always inferior to that for a natural image. The emergence of transfer learning technology [18] provides the possibility of applying a deep learning object detection model to a remote sensing image. As an airplane position has multiple orientations, learning the rotational invariance is critical to a classifier. To address this feature of airplanes, Zhang et al. [19] obtained rotation-invariant features via the gradient of an extended histogram. Wang et al. [20] obtained rotational invariance via a rotation-invariant matrix. Liu et al. [8] proposed a sparse-coding-based feature extraction method; although rotational invariance was extracted, it was not suitable for other objects. The majority of these methods designed or extracted rotation-invariant features. In this paper, multiple orientations of an airplane position are addressed via data-enhanced rotation and flip technology; similar to learning the image feature via a CNN, the rotation-invariant feature is learned directly. Thus, in this study, after using Faster R-CNN [21] as the basic framework and establishing a remote sensing image database, we improved and optimized the network model and ultimately improved effectively the representation ability of weak and small objects.
The main contributions of this study are as follows.
An effective detection model was developed for airplane detection based on remote sensing images. The method enables object detection to be unified in a deep network framework, and the entire network framework has end-to-end characteristics.
A remote sensing image database was established based on a data expansion technique, providing the data foundation for subsequent applications of the deep learning model in the field of airplane detection.
Multilayer feature fusion was introduced to improve the representation ability of weak and small objects. L2 norm normalization, feature connection, scale scaling, and feature dimension reduction were used to fuse the multilayer features.
Soft decision was introduced to improve the traditional nonmaximum suppression method, which reduced the missed detection rate of the network when the object was highly overlapped.

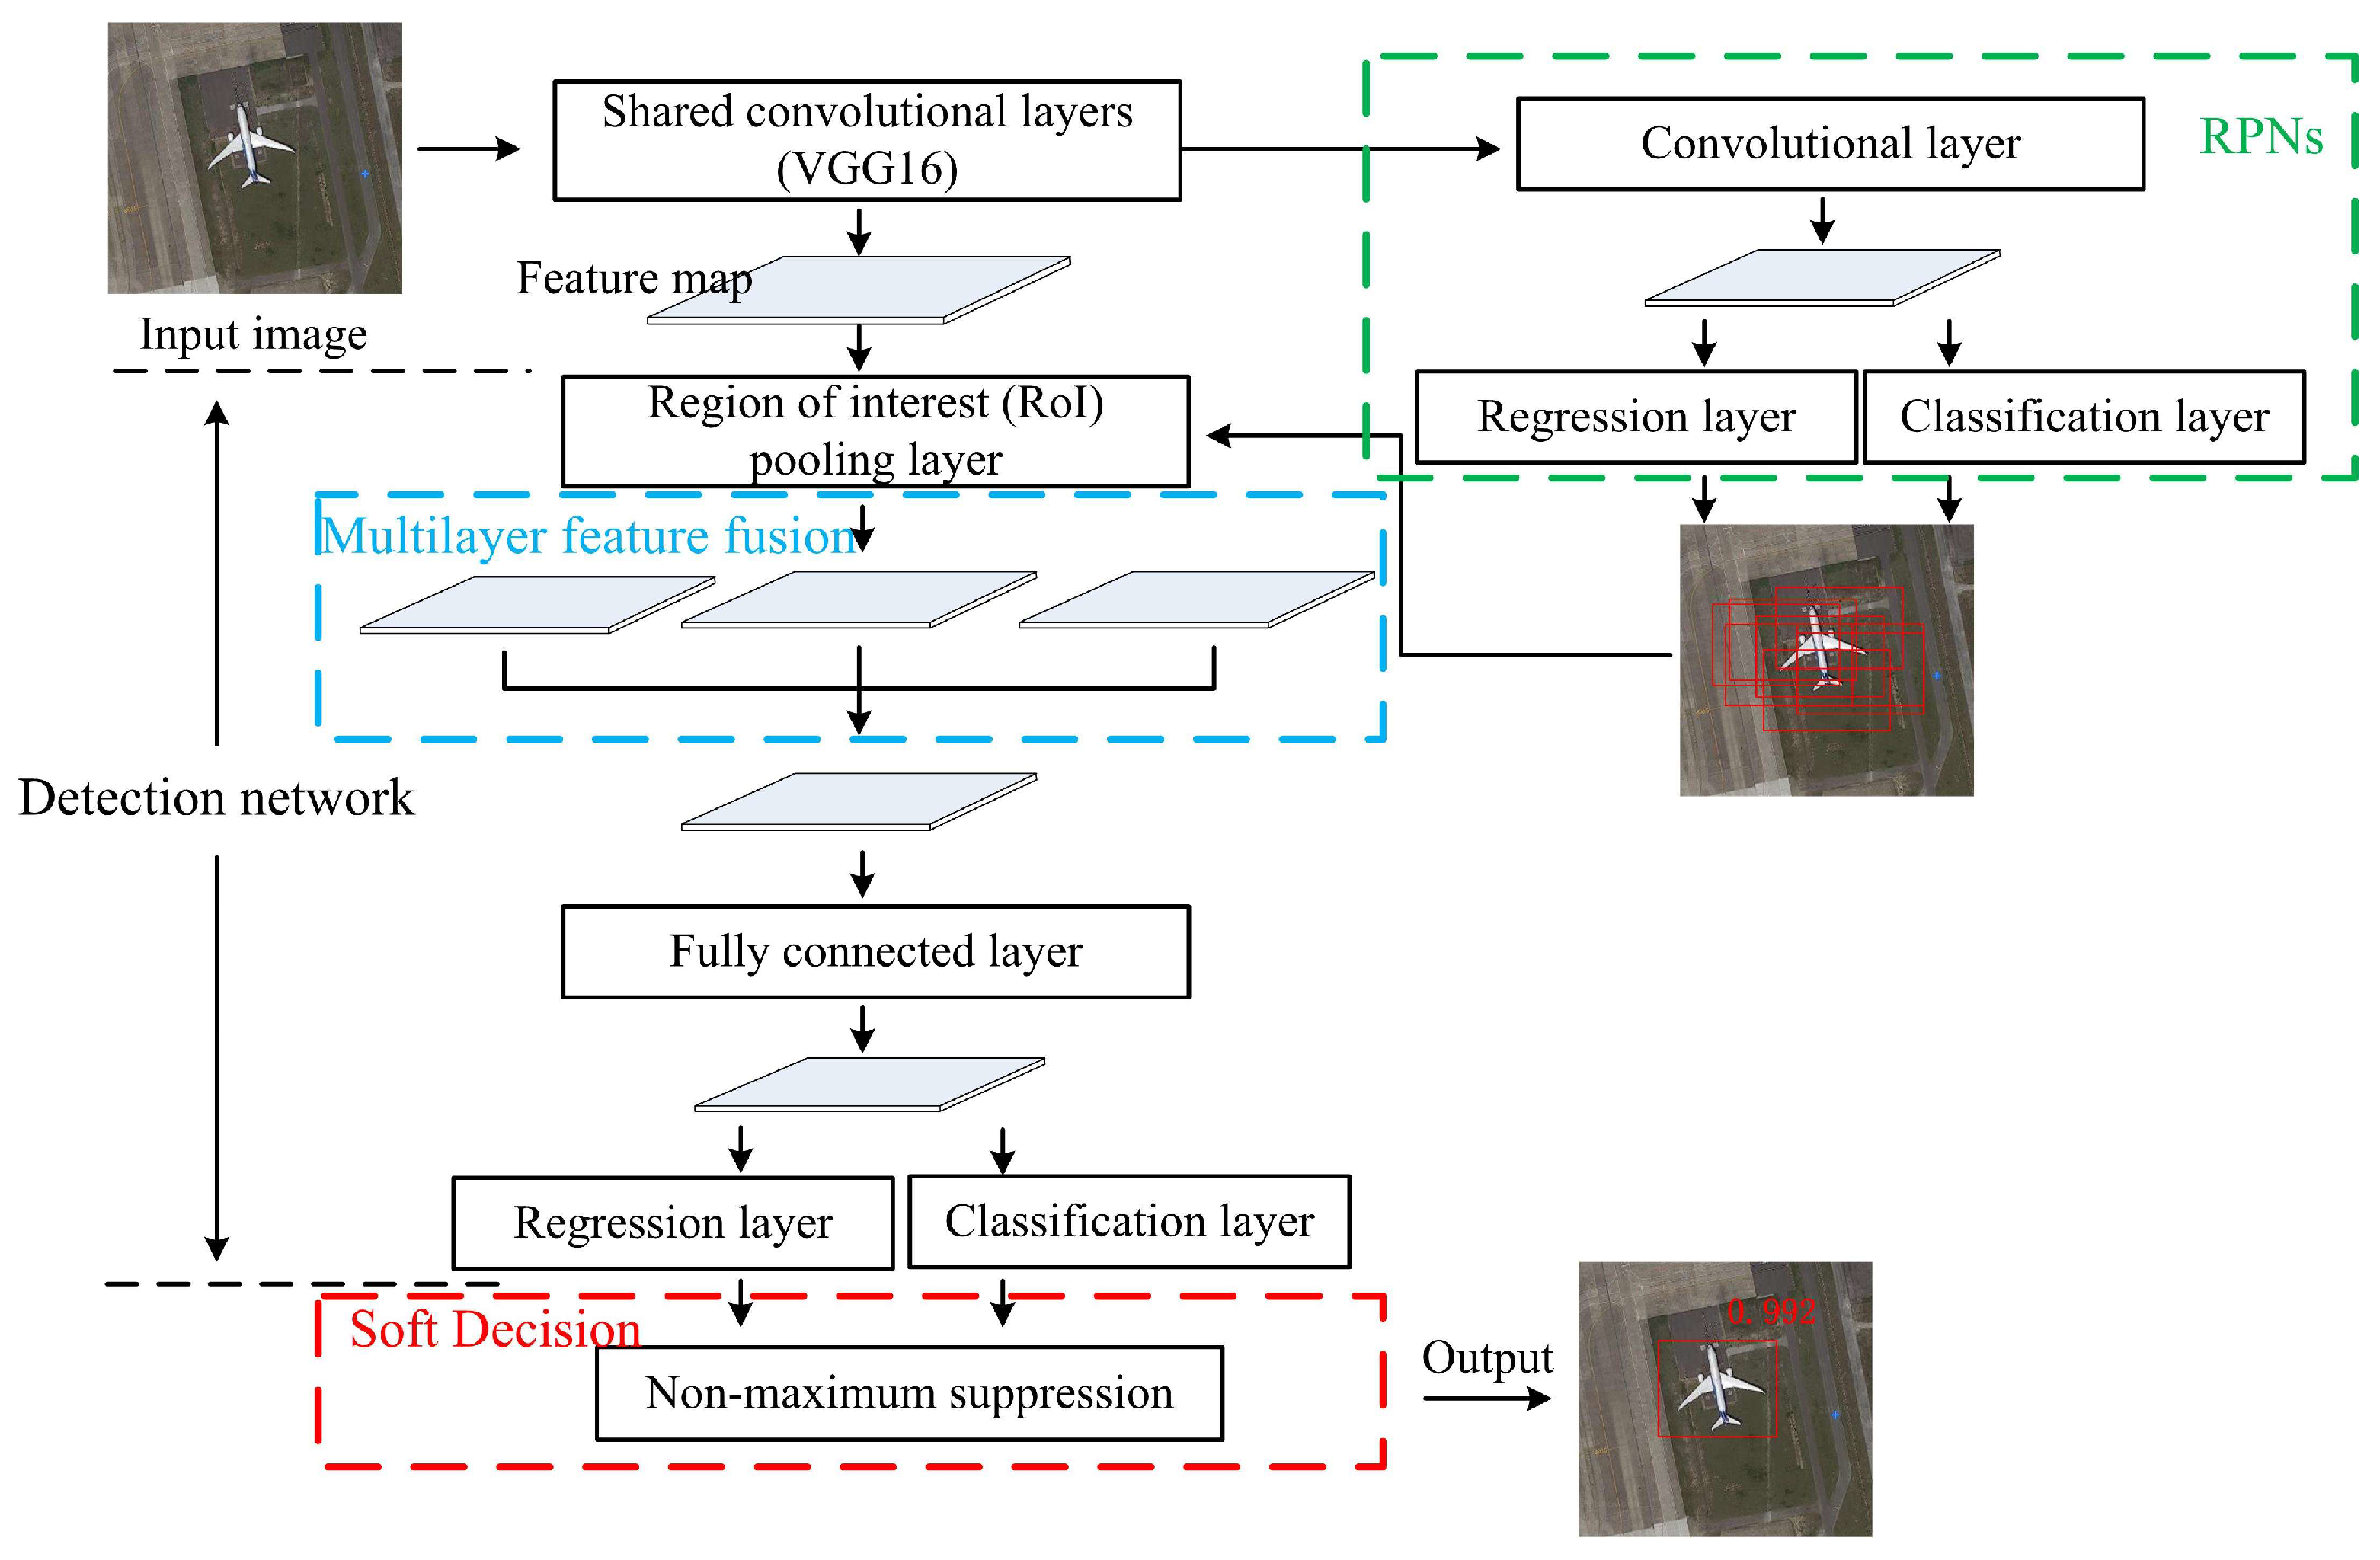
2. Materials and Methods Methodology

2.1. Related Work

The network architecture of Faster R-CNN is illustrated in Figure 1, which mainly involves shared convolutional layers, region proposal networks (RPNs), and a detection network. It takes a single image as the input and outputs the prediction probability value and object detection box of the desired object category. The shared convolutional layers are used to extract features. RPNs generate the rectangle candidate box sets. The detection network includes a region of interest (RoI) pooling layer, a fully connected layer, and a classification and regression layer. The RoI pooling layer maps the corresponding RoI feature vectors. Then, the mapped RoI feature vectors are input to the classification layer and the regression layer to achieve the object detection task.

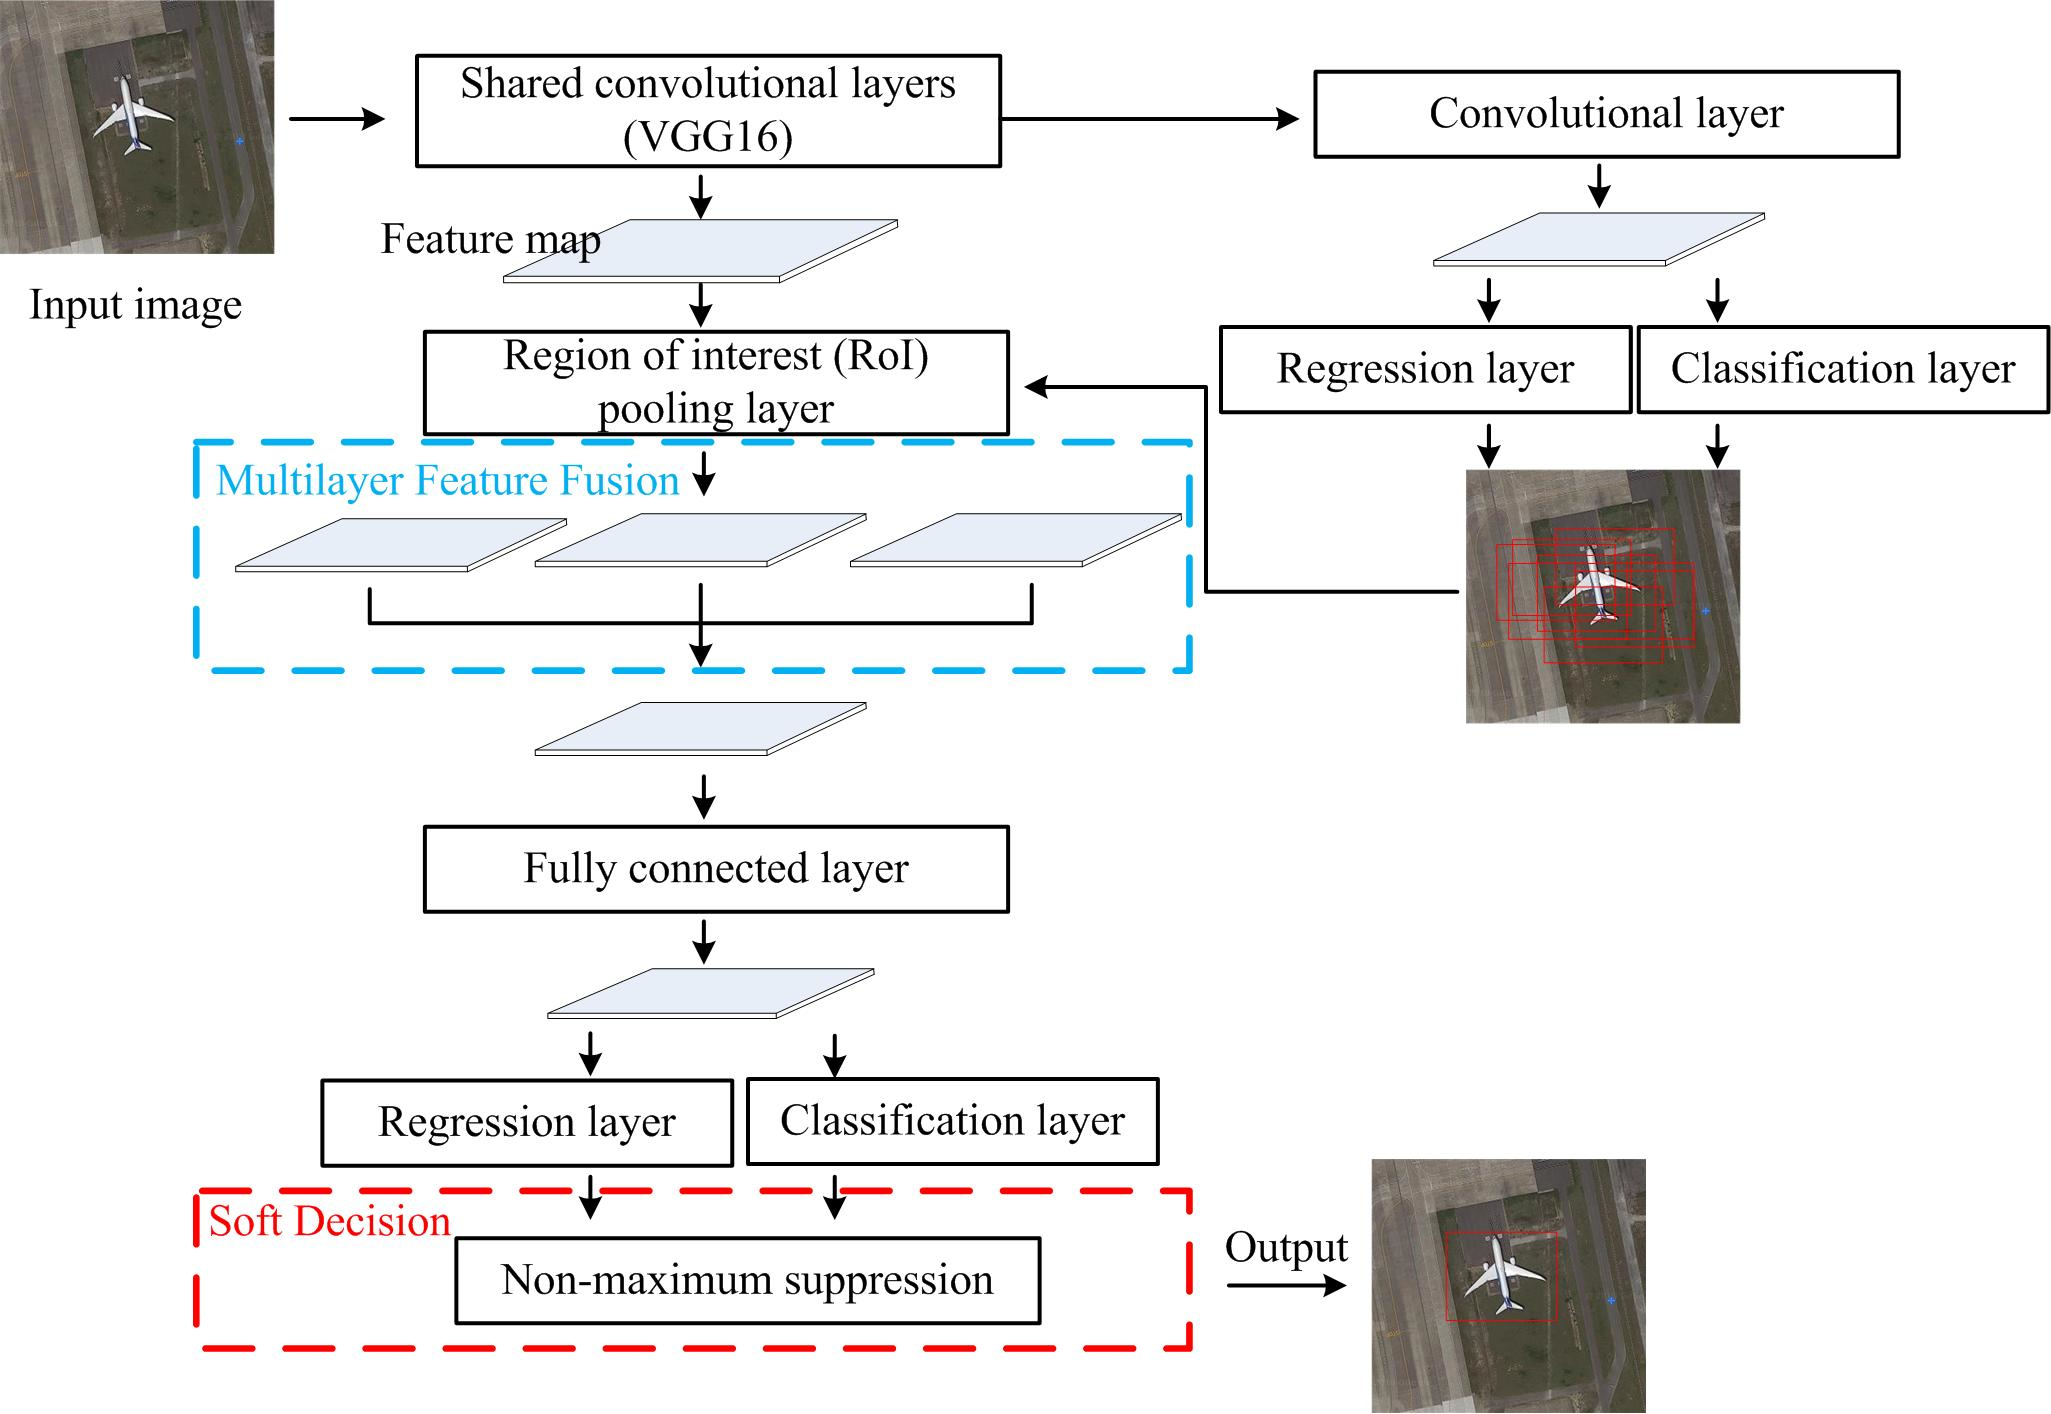
2.1.1. Region Proposal Networks

Region proposal methods rely on inexpensive features and economical inference schemes. In order to reduce the running time of region generation, RPNs [21] have been proposed. To generate the rectangle candidate box sets, RPNs use a 3 × 3 sliding window to perform a convolution operation on the convolutional feature map outputted by the last shared convolutional layer, where each sliding window is mapped to a lower-dimensional vector, as shown in Figure 2. Then, the lower-dimensional vector is input to classification layers and regression layers to achieve the task of object classification and position regression, respectively. RPNs use anchors with multiple sizes and aspect ratios to solve multiscale problems. By default, it uses three sizes and three aspect ratios.
In general, the intersection-over-union (IoU) formula [16] is used to measure the positioning accuracy of the bounding box. The IoU describes the degree of overlap between bounding box A and “ground truth” B, as shown in Figure 3.
The IoU is defined as follows:
IoU = ( A B ) / ( A B ) .
For training RPNs, a binary class label (being an object or not) is assigned to each anchor. A positive label is assigned to two types of anchors: (i) the anchor/anchors with the highest IoU overlap with a certain ground truth box, and (ii) the anchor that has an IoU overlap higher than 0.7 with any ground truth box. A negative label (nonobject) is assigned to any anchor that has an IoU lower than 0.3 for all ground truth boxes. The two tasks—object classification and candidate box regression—are simultaneously completed and, thus, the loss function of the RPNs is defined as follows:
L ( { p i } , { t i } ) = 1 N cls i L c l s ( p i , p i * ) + λ N reg i p i * L r e g ( t i , t i * )
where i is the index of an anchor in a minibatch and p i is the prediction probability of anchor i containing an object. If the true label of the anchor is positive, then p i = 1 . If the true label of the anchor is negative, then p i = 0 . t i represents the parameterized coordinates of the candidate box, and t i represents the coordinates of the ground truth box. N cls and N reg are normalization constants that represent the number of samples in the small batch and the number of anchors, respectively. λ is an adjustable equilibrium weight. The classification loss L c l s is the log loss over two classes (object or nonobject). The regression loss L r e g is defined as follows:
L r e g ( t i , t i * ) = { 0.5 ( t i t i * ) 2    i f | t i t i * | < 1 | t i t i * | 0.5         o t h e r w i s e .

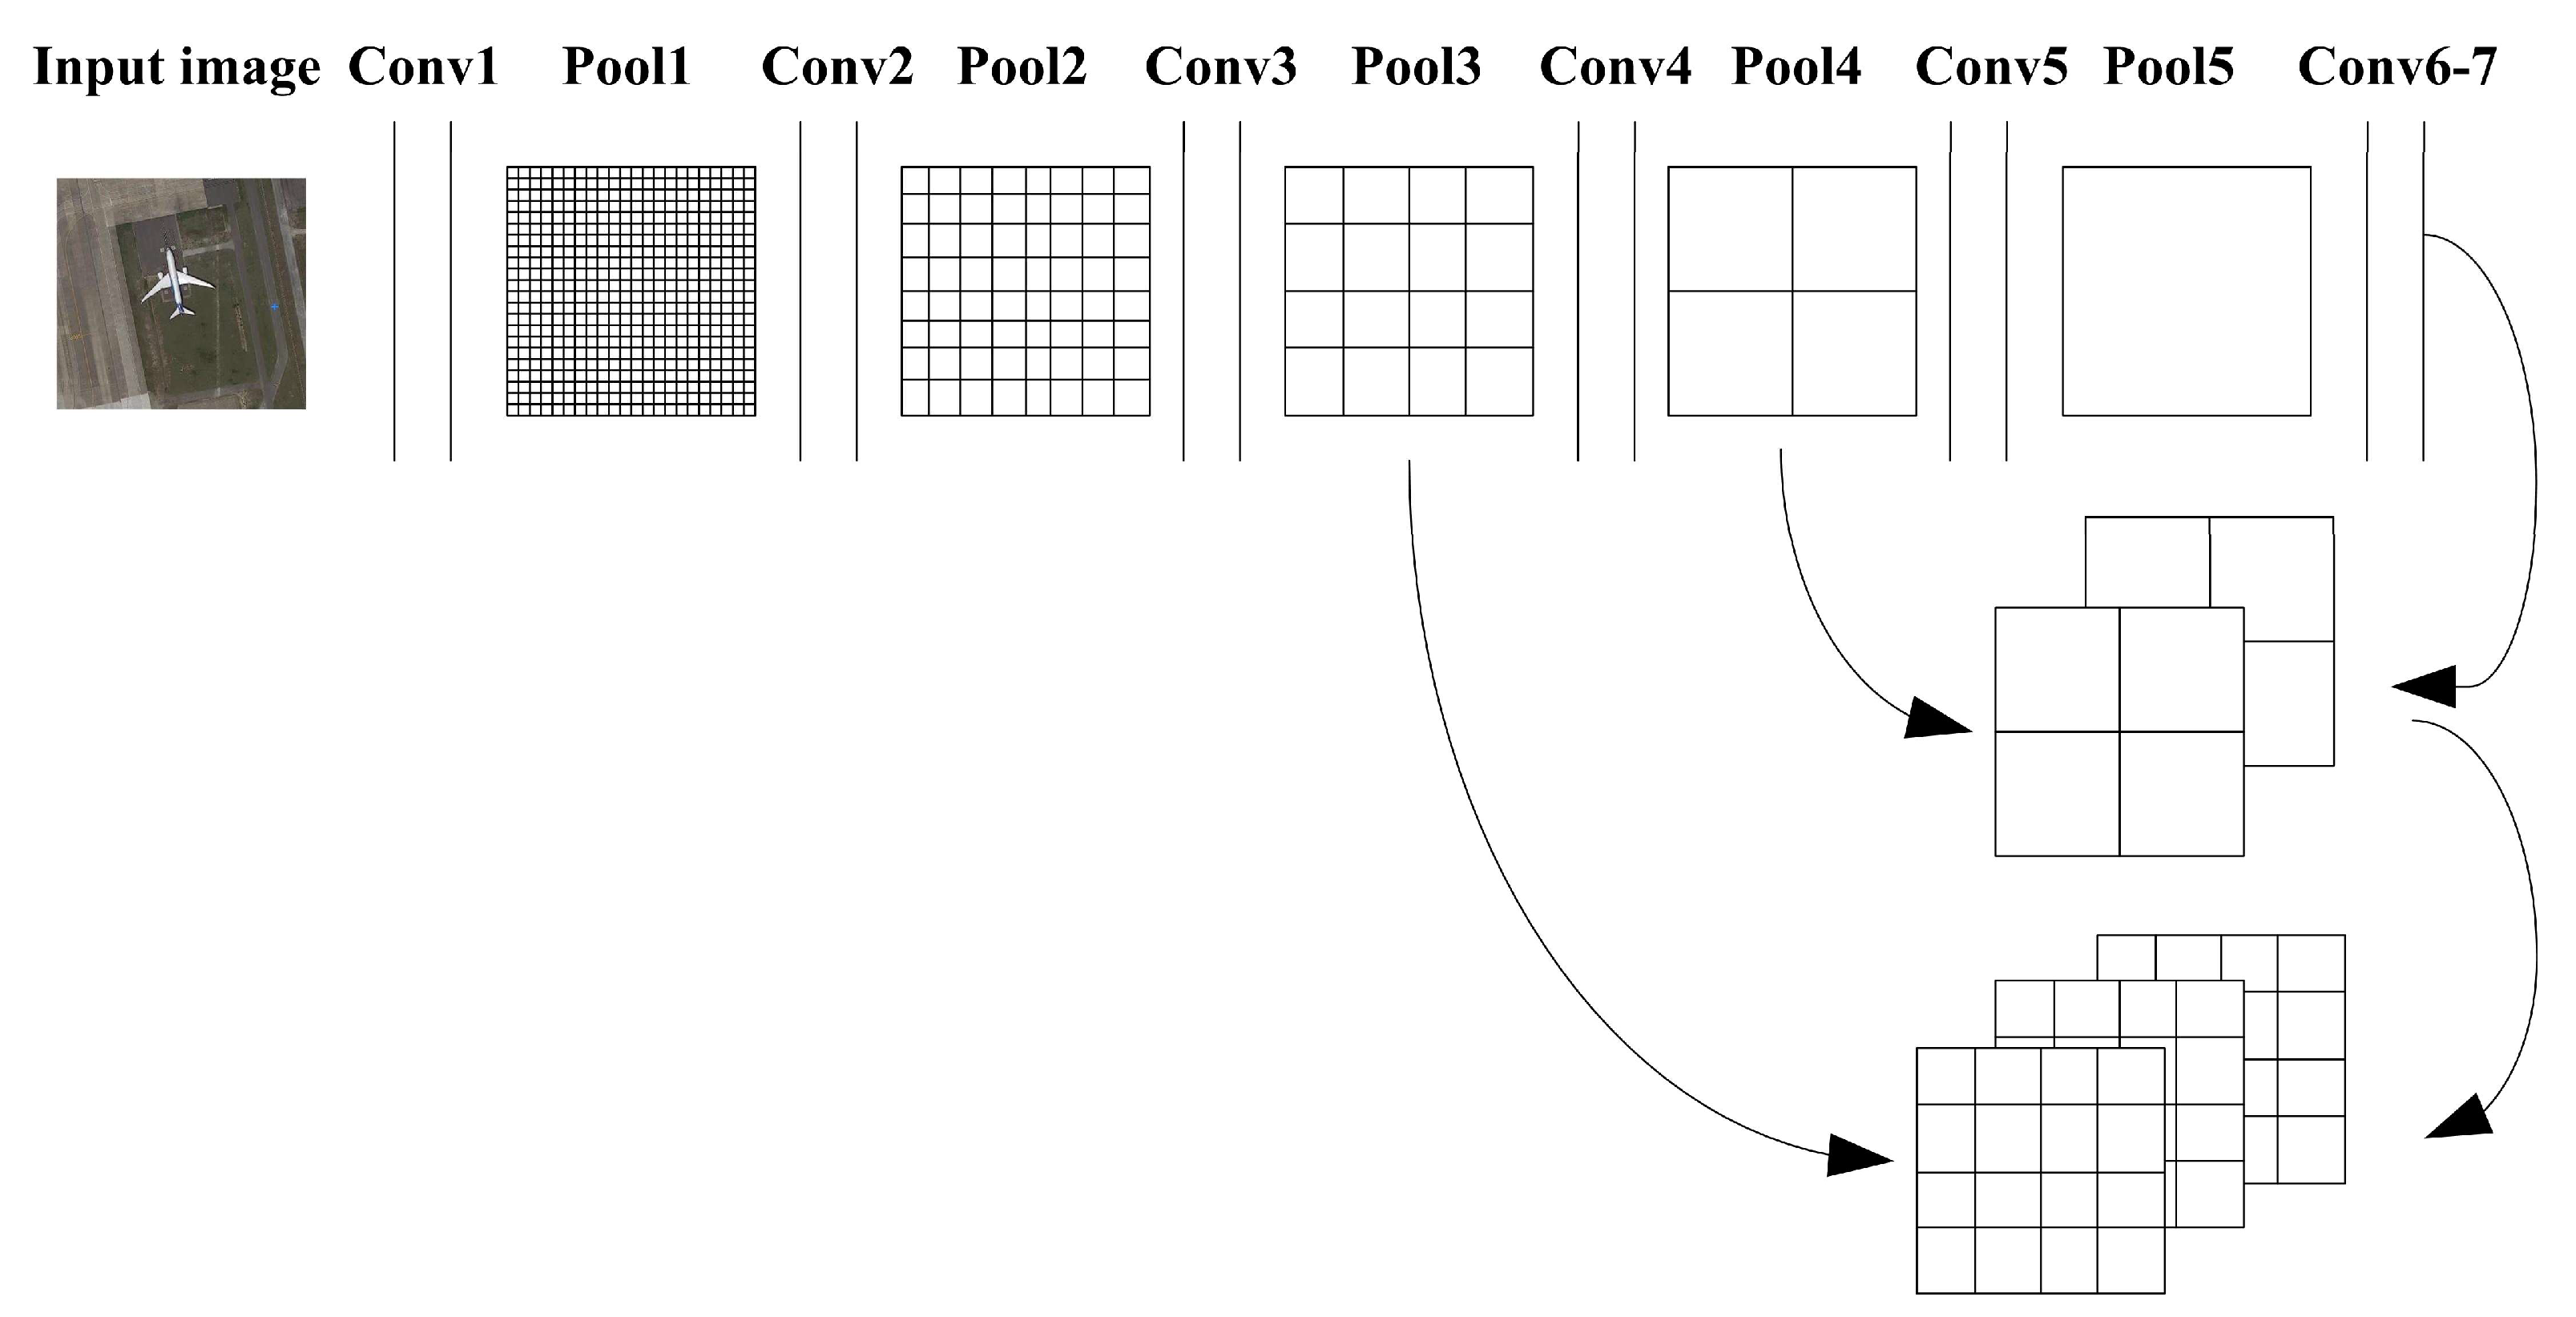
2.1.2. RoI Pooling Layer
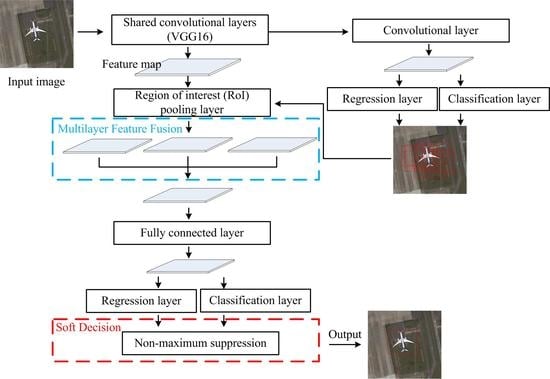
The biggest highlight in detection network is the RoI pooling layer [22], which directly maps the corresponding RoI feature vectors of the candidate regions according to the mapping relationship between the candidate region feature map and the complete feature map. Since the features need not be extracted repeatedly, the time cost is greatly reduced. Then, the mapped RoI feature vector is input to the classification layer and the regression layer to achieve the object detection task.

2.2. Methodology

The proposed airplane detection method mainly is divided into three parts, namely, the network architecture of Faster R-CNN, multilayer feature fusion, and nonmaximum suppression based on soft decision. The Faster R-CNN, mainly including shared convolutional layers, RPNs, and the RoI pooling layer, is the basic network framework of our method. The aim of the multilayer feature fusion is to improve representation ability of weak and small objects. The soft decision is introduced to reduce the missed detection rate. The flowchart of the framework is shown in Figure 4. The proposed method takes a single image as the input and outputs the prediction probability value and object detection box of the desired object category. Firstly, the convolution features of the input image are extracted by the shared convolutional layer. Secondly, the RPNs generate candidate regions and input them into the detection network. Then, the detection network performs feature mapping, multilayer feature fusion, and object detection successively. Specifically, feature mapping is implemented using the RoI pooling layer; multilayer feature fusion is implemented by the L2 norm normalization, feature connection, scale scaling, and feature dimension reduction; and the fully connected layer, classification layer, and regression layer are used to achieve object detection. Finally, the nonmaximum suppression based on soft decision is used to further reduce the number of detection frames.

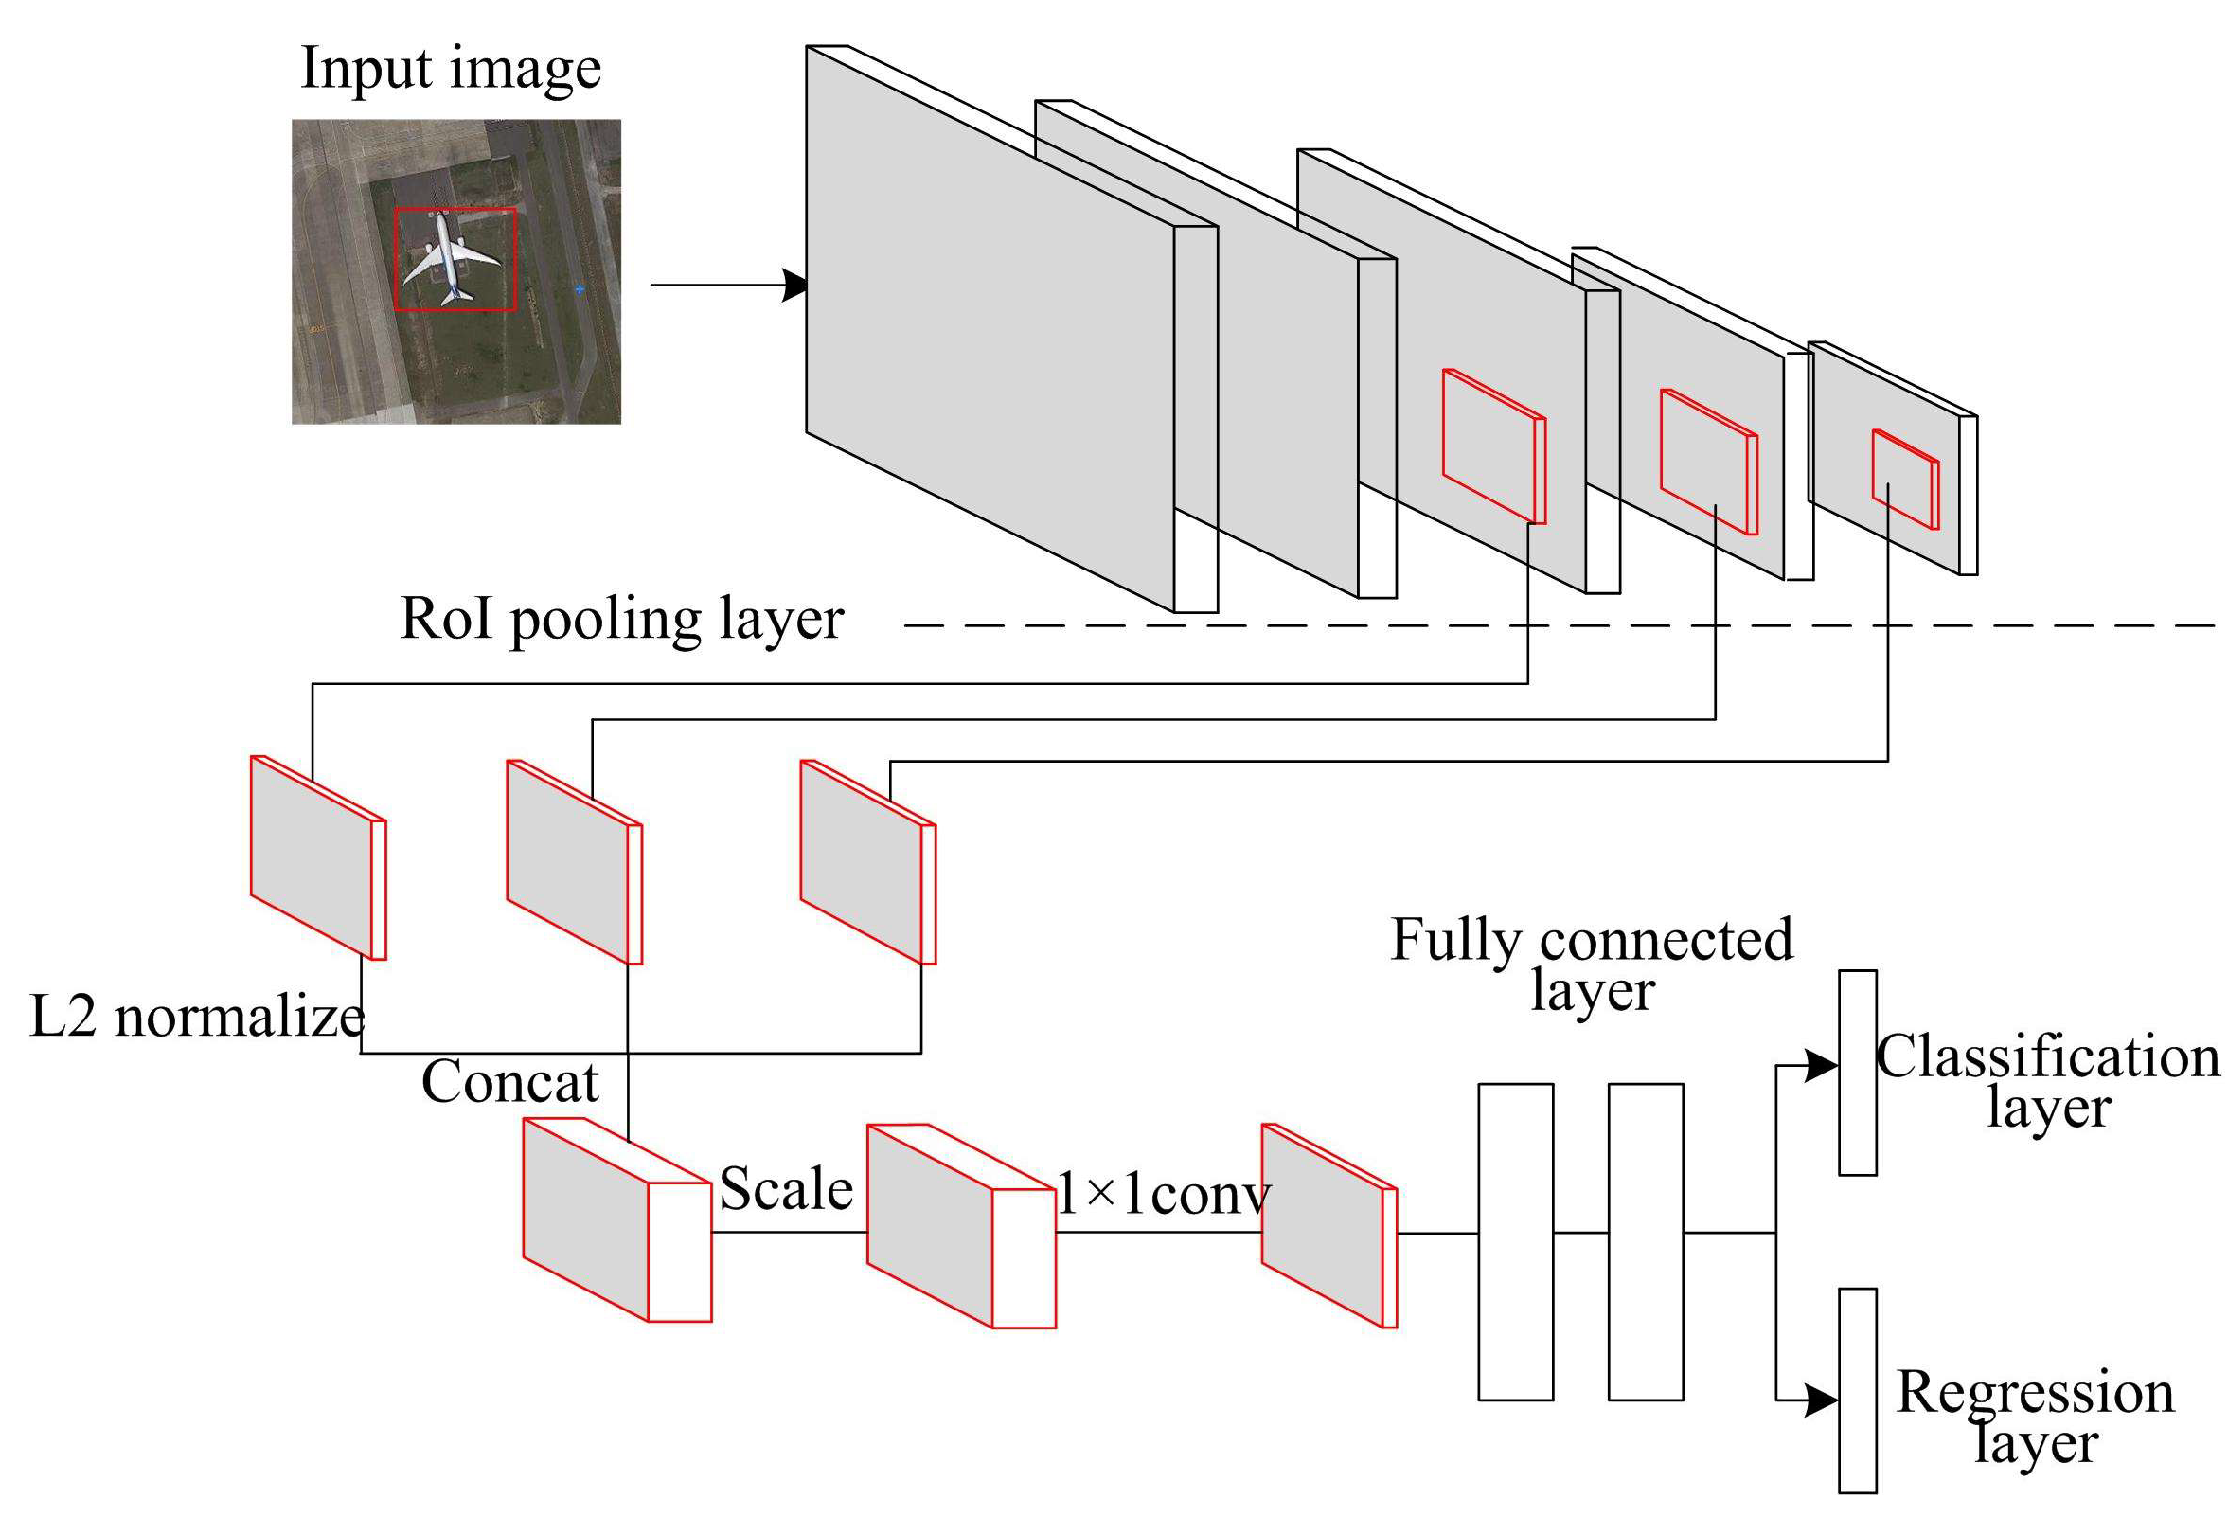
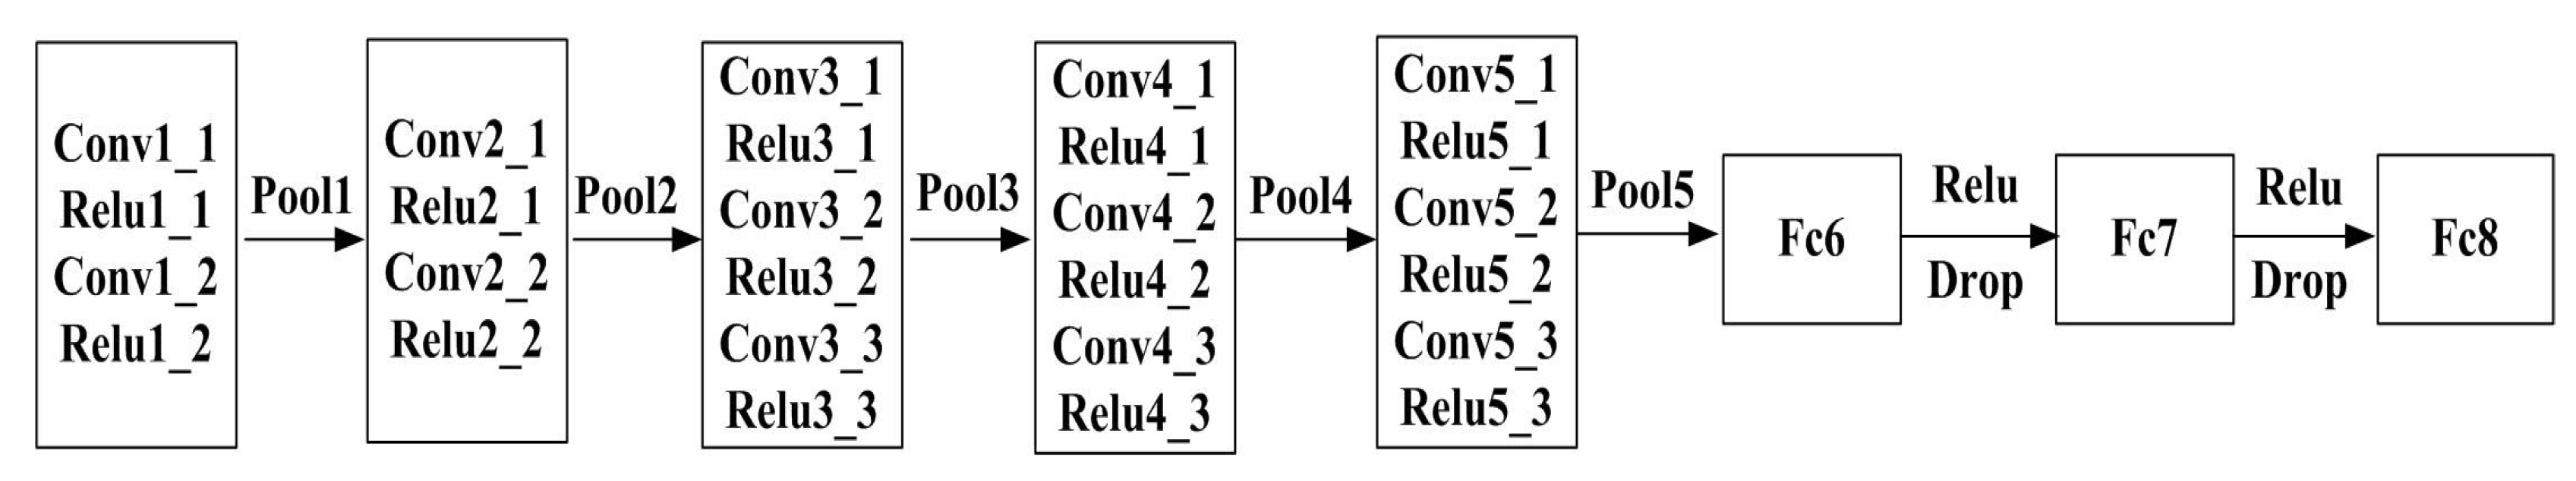
2.2.1. Multilayer Feature Fusion

The geometric dimensions of an airplane object constituted a small portion of the test image selected for this paper. The pixel size of an airplane object ranged from 32 × 32 pixels2 to approximately 64 × 64 pixels2. After a series of convolutional layer processing, the 32 × 32 airplane became 2 × 2 in the final layer of the convolutional feature image; thus, the feature map was very rough. Additionally, adjacent regions may have overlapped, which is unfavorable to airplane detection. A higher layer feature contains rich semantic information, which is favorable to object classification, while a lower layer feature has high spatial resolution, which is favorable to object positioning. Object detection is equivalent to classification plus positioning. Therefore, a well-designed object detection system should leverage both the lower and higher layer features simultaneously, particularly for small objects.
Skip-layer connection is a classic concept in neural networks and has been applied to both fully convolutional networks (FCNs) [23] and HyperNet [24]. The FCN combines rough higher layer information and precise lower layer information for semantic segmentation and demonstrates impressive performance, as shown in Figure 5.
HyperNet calculates feature mapping of the entire image via the convolutional layer of a pretrained model. Then, the maximum pooling and a deconvolutional operation (Deconv) are employed to aggregate the layered feature mapping and compress them into a unified space (Hyper Feature), as shown in Figure 6.
The result shows that the skip-layer connection in a network model is an effective way to implement multilayer feature fusion. Therefore, in this paper, based on the structure and features of the network model, the interlayer connection structure shown in Figure 7 was employed.
Liu et al. [25] extracted feature vectors of the same position from different convolutional layers. The activation response of lower layer features is significantly stronger than that of higher layers. This finding means that the same feature normally has different response scales in different layers. Therefore, during multilayer feature fusion, multilayer features cannot be simply added or combined. First, the fixed feature vectors corresponding to the candidate region are extracted from different convolutional layers (i.e., “conv3”, “conv4”, and “conv5”) via the RoI pooling layer. Next, L2 norm normalization, connection of the features in each layer, scale transformation, and feature dimension reduction are performed in sequence. Finally, the fused features are imported into the fully connected layer, as shown in Figure 7.
The D channel feature x = ( x 1 x d ) exported from the convolutional layer in each layer undergoes L2 norm normalization, as shown in Formula (4). Formula (5) shows an expression of the L2 norm:
x i = x i x 2
x 2 = ( i = 1 d | x i | 2 ) 1 / 2 .
Normalized features x = ( x 1 x d 1 ) , y = ( y 1 y d 2 ) of different layers are fused and connected via Formula (6):
z = ( x , y ) = ( x 1 x d 1 , y 1 y d 2 ) .
After multilayer feature fusion, the feature scale is small, which is unfavorable to network training. Therefore, a feature scaling process is required, as shown in Formula (7):
z i = γ z i
where γ is the scaling parameter and its value is the L2 norm of the convolutional feature in the last layer.
In this paper, a pretrained network model VGG16 [26] was employed to transfer learning for remote sensing data. Therefore, after fusion, the feature size should be consistent with the original network. In this paper, a 1 × 1 convolution kernel was used to reduce the dimensions and retain the size of the feature imported to the fully connected layer at 512 × 7 × 7. The 1 × 1 convolution kernel has been widely deployed in GoogLeNet [27] and ResNet [28]. It not only reduces the dimension while maintaining the feature scale but also leverages subsequent nonlinear activation functions to increase nonlinear network features and eventually integrate interchannel features.

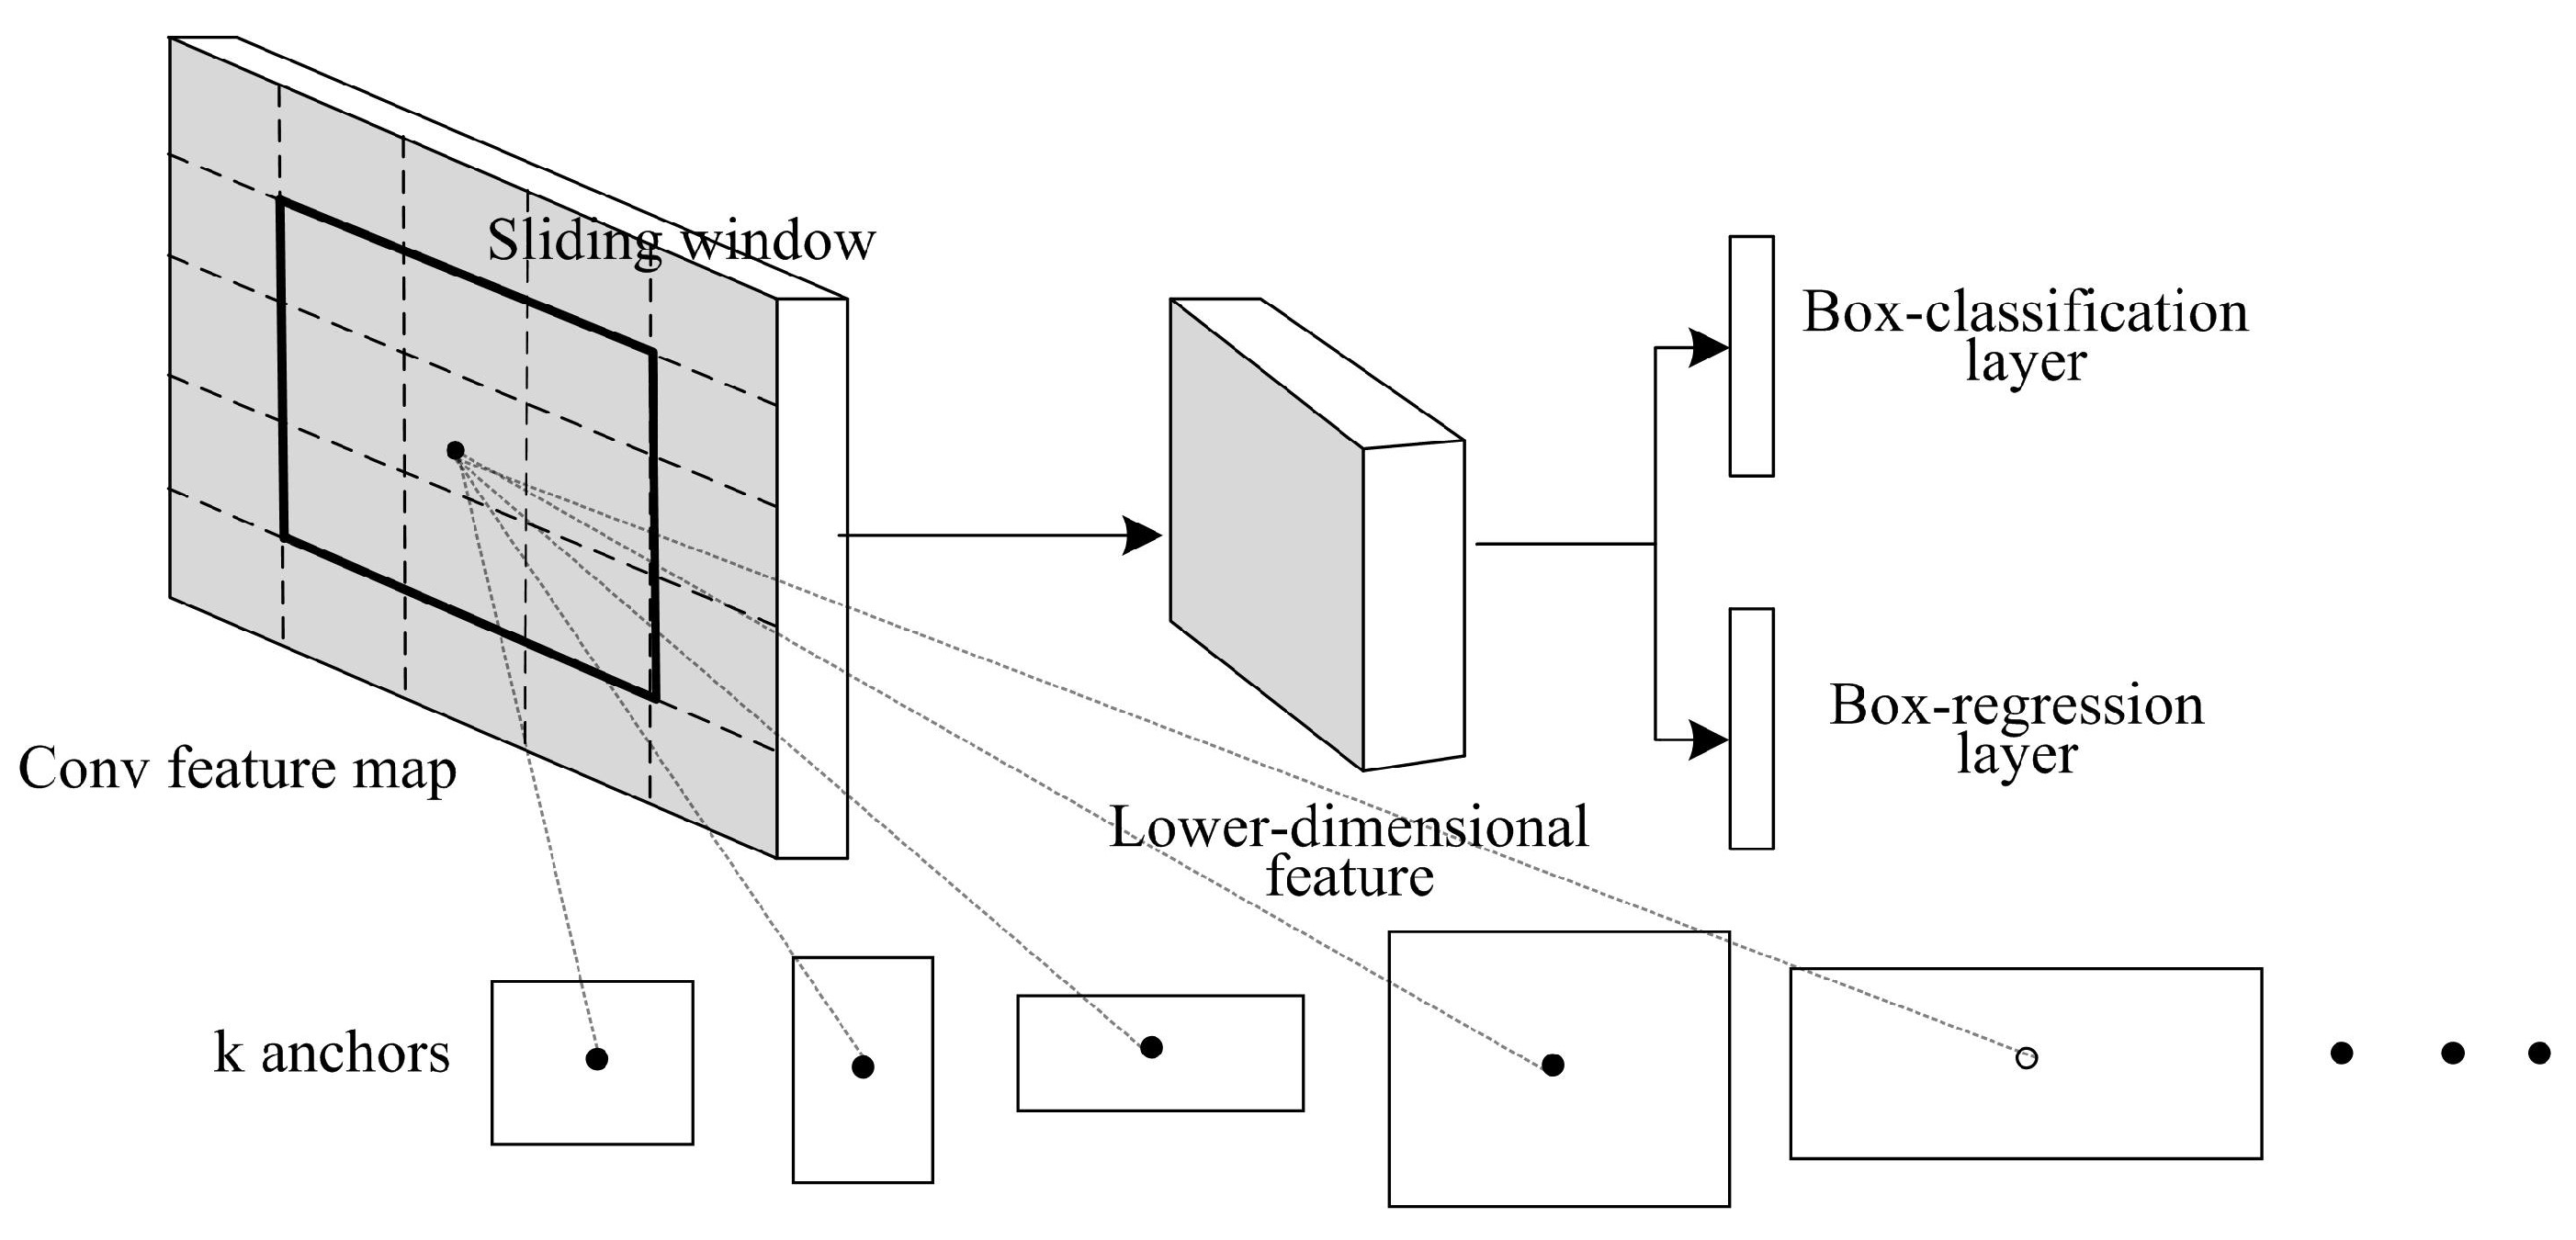
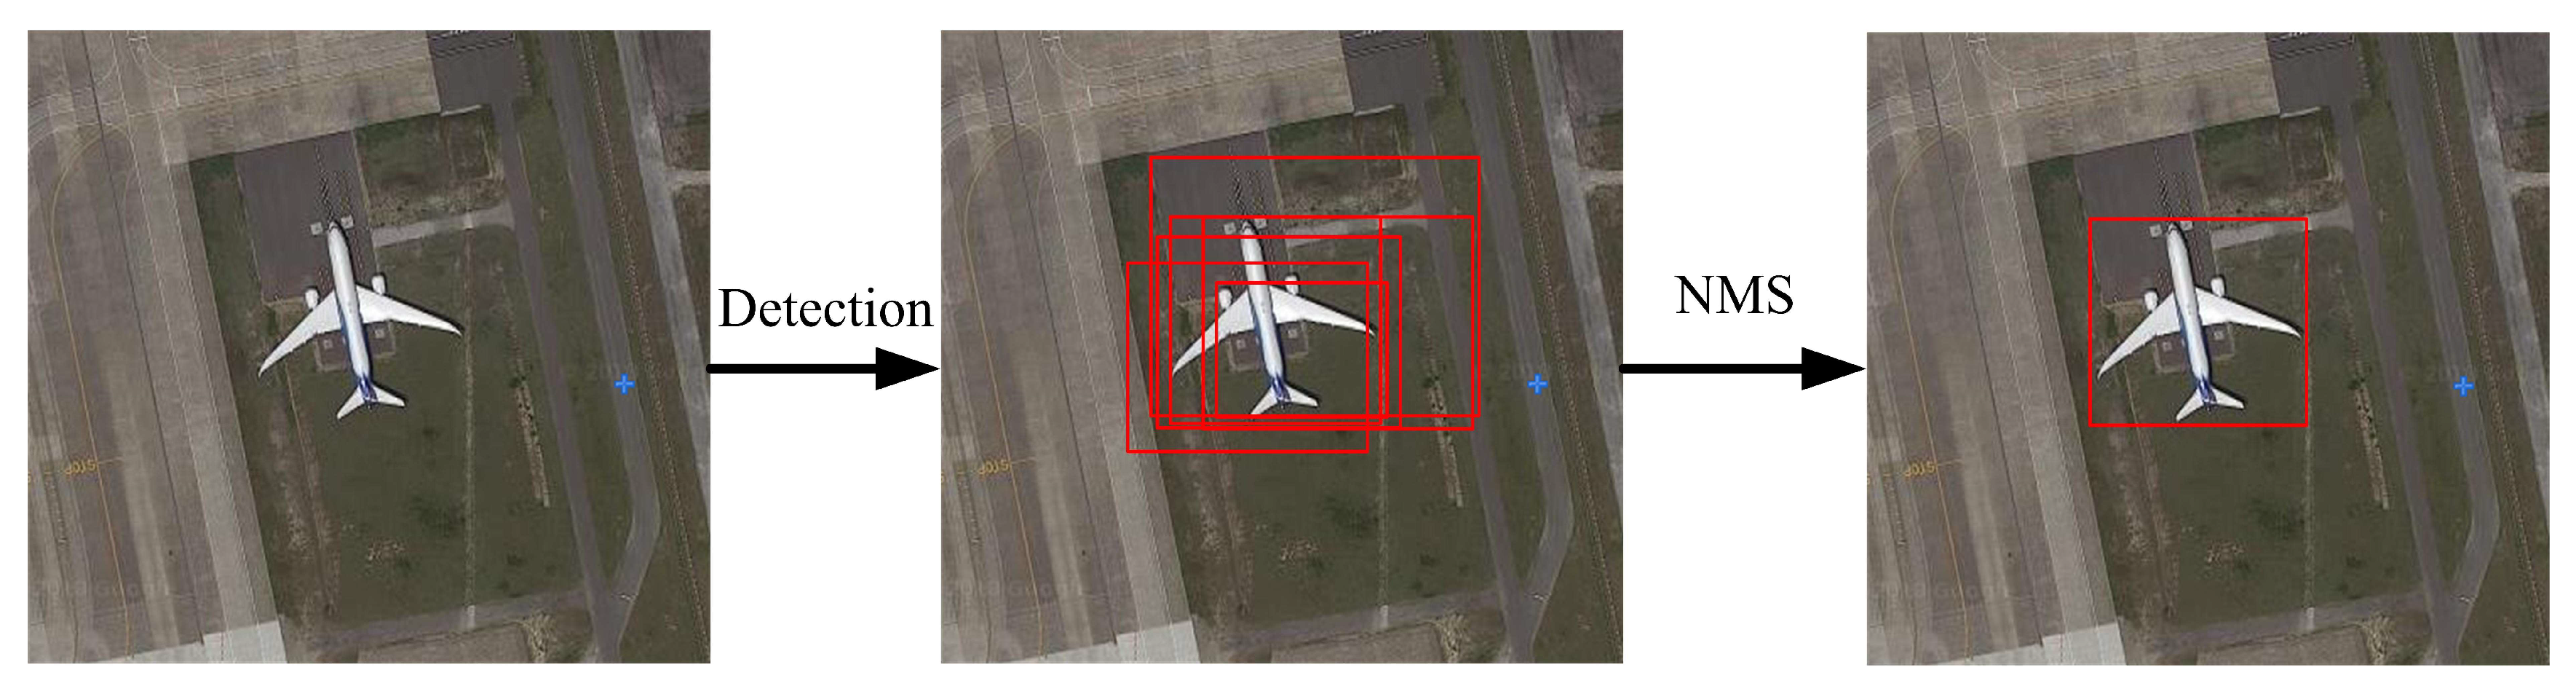
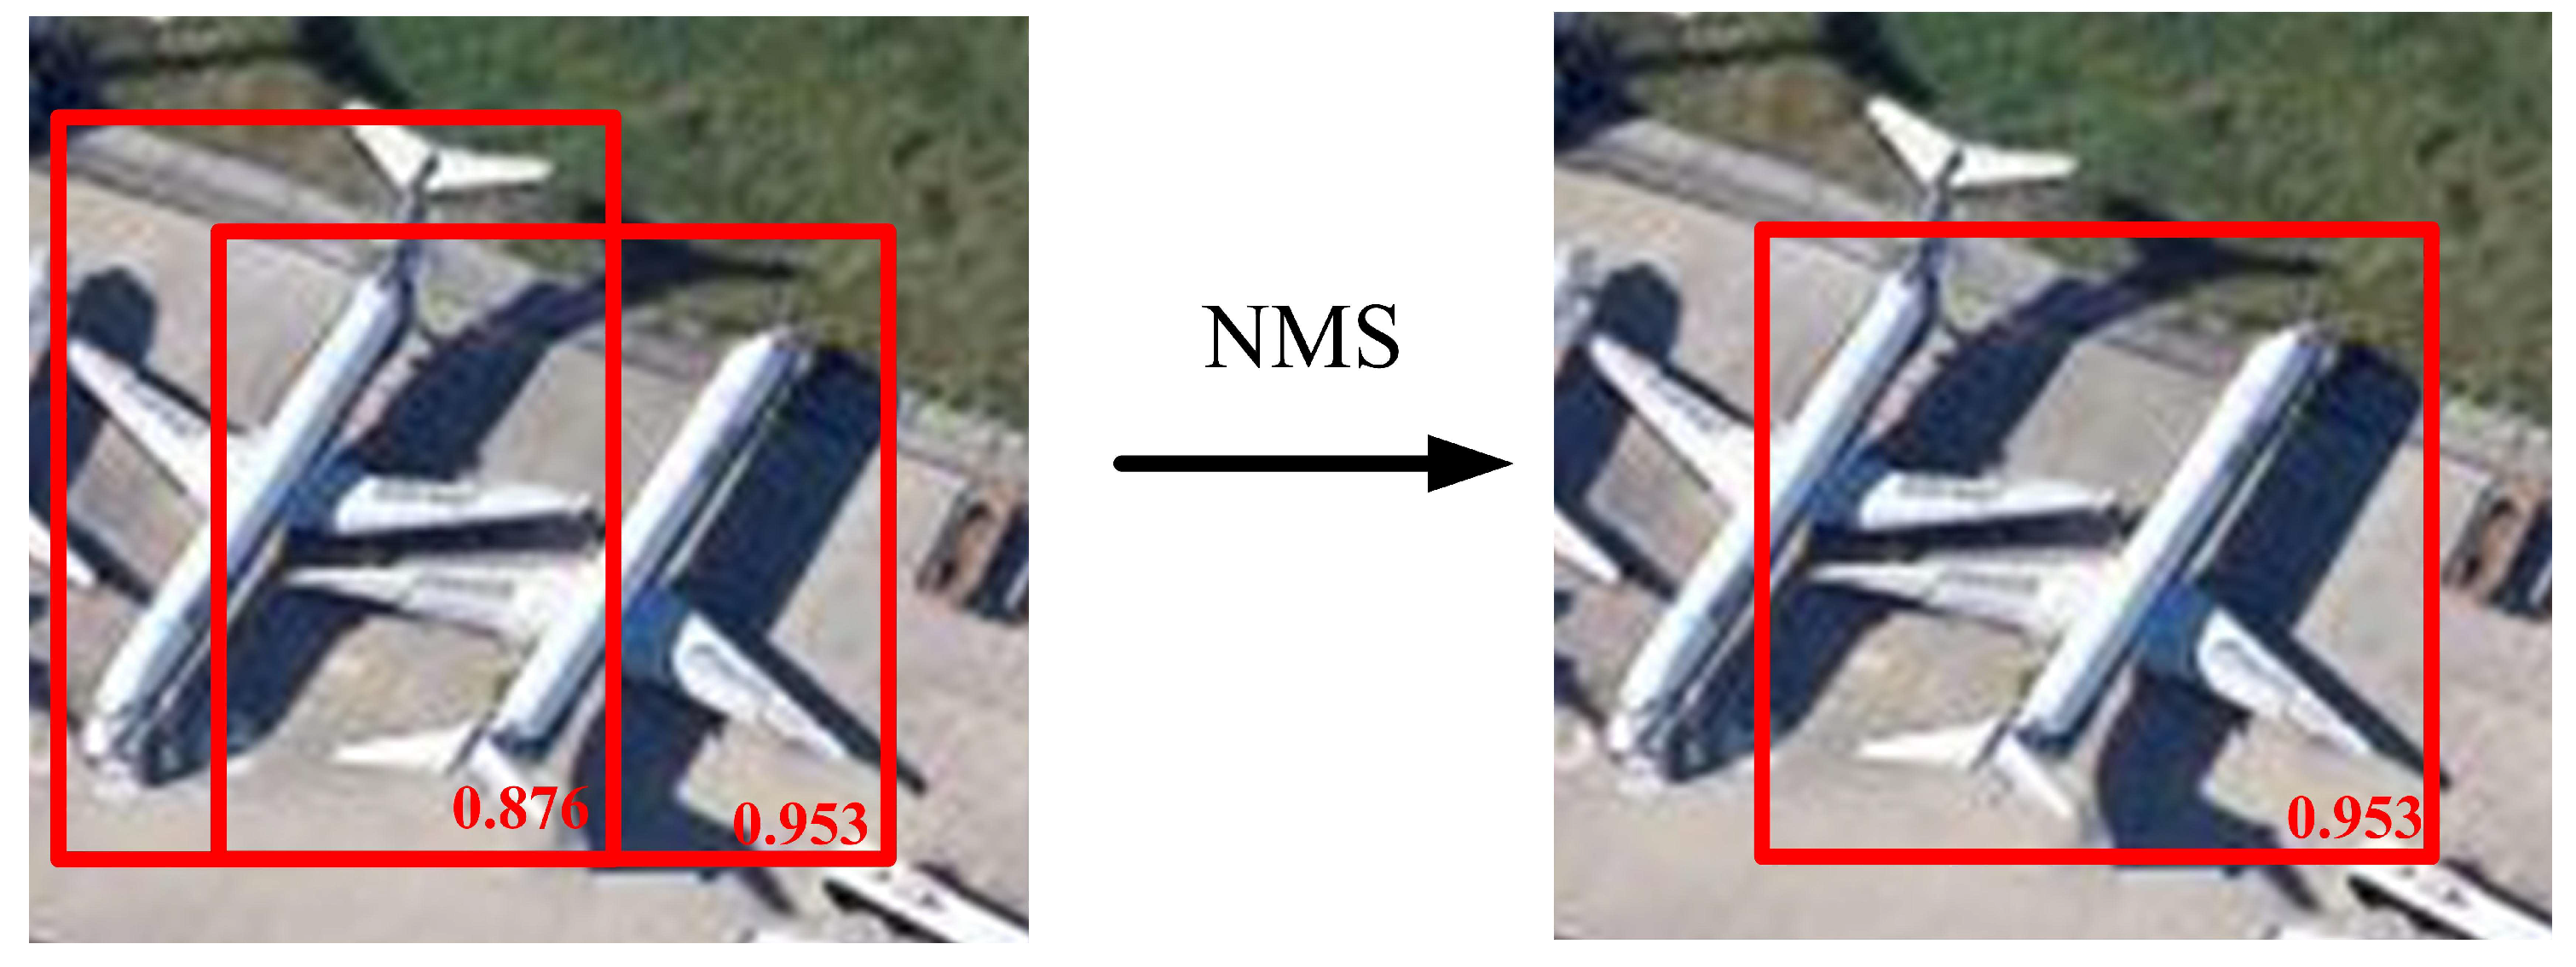
2.2.2. Nonmaximum Suppression Based on Soft Decision

As it is not mandatory that detection networks only produce a single detection box, multiple detection boxes may occur around the same object. To prevent false detection, nonmaximum suppression (NMS) [29] was employed to remove extra detection boxes and preserve the optimal detection box, as shown in Figure 8. Essentially, NMS is an iteration-traversal-elimination process in which the number of candidate boxes can be reduced through setting the IoU threshold without affecting the accuracy of airplane detection.
The NMS process is as follows: (1) The detection boxes in set A are sorted in descending order based on their classification scores. (2) Detection box M (with the highest score) is moved to set B. The IoU between detection box M and the other detection boxes is calculated. If IoU exceeds threshold T , then the detection box with the low score is removed; otherwise, there are multiple objects. (3) Of the remaining detection boxes in set A, the box with the highest score is preserved. Step 2 is repeated until there are no detection boxes in set A. Finally, the detection boxes in set B are output. During this process, if the overlapping area between two detection boxes is overlarge, the detection box for one of the objects may be removed, which results in a missed detection, as shown in Figure 9.
Although increasing threshold T alleviates this problem to some extent, false detection increases significantly, which negates the value of this approach. In conventional NMS, the score of an adjacent detection box is set to zero, which is a hard decision. Channel decoding algorithms are classified as hard decision decoding and soft decision decoding algorithms. The error correction capability of soft decision is significantly superior to that of hard decision. Therefore, in this paper, the principle of soft decision was leveraged to improve the conventional NMS algorithm, and an NMS algorithm based on soft decision was proposed. In the pseudocode in Table 1, the conventional NMS algorithm is in the blue rectangle, and the improved NMS algorithm is in the red rectangle. As the improved NMS algorithm proposed in this paper only modified the core decision function of the conventional NMS algorithm and did not increase the network model retraining time, it was simple to implement.
In the conventional NMS algorithm, the adjacent detection box decision function is as follows:
s i = { s i , IoU ( M , b i ) < T 0 , IoU ( M , b i ) T .
In Formula (8), a hard threshold T is set to decide if score s i of adjacent detection box b i is maintained at its original value or set to zero, M represents the detection box with the highest score, and IoU ( M , b i ) represents the IoU between adjacent detection box b i and detection box M .
When IoU ( M , b i ) exceeds the threshold, the zeroing score s i is replaced by the method of attenuating the score s i of the detection box b i . Therefore, when b i is surrounded by another object (different from the object surrounded by M ), it is not removed directly. However, if b i does not surround any other object, the score s i should be attenuated sufficiently small. Additionally, the higher the overlap with M , the more severe the attenuation of the detection box score should be. Therefore, a soft decision is introduced to improve the decision function. The definition is as follows:
s i = { s i , IoU ( M , b i ) < T s i ( 1 IoU ( M , b i ) ) , IoU ( M , b i ) T .
When the IoU between adjacent detection box b i and detection box M is under threshold T , the detection box score is preserved. When it exceeds or is equal to threshold T , the detection box score attenuates linearly. The formula shows that a larger IoU ( M , b i ) means a larger overlapping area and more severe attenuation of the detection box score; a small IoU ( M , b i ) means a small overlapping area and the detection box score is unaffected.
In Formula (9), the score of the detection box whose IoU ( M , b i ) exceeds the threshold is attenuated but not set to zero and eliminated. Although the score of this detection box is reduced, missed detection is prevented effectively. Additionally, the threshold of the detection box score is set to 0.45 to remove detection boxes with low scores and thus prevent false detection. In this paper, only the decision function was modified to improve conventional NMS. The algorithm is simple and has no additional computing cost.

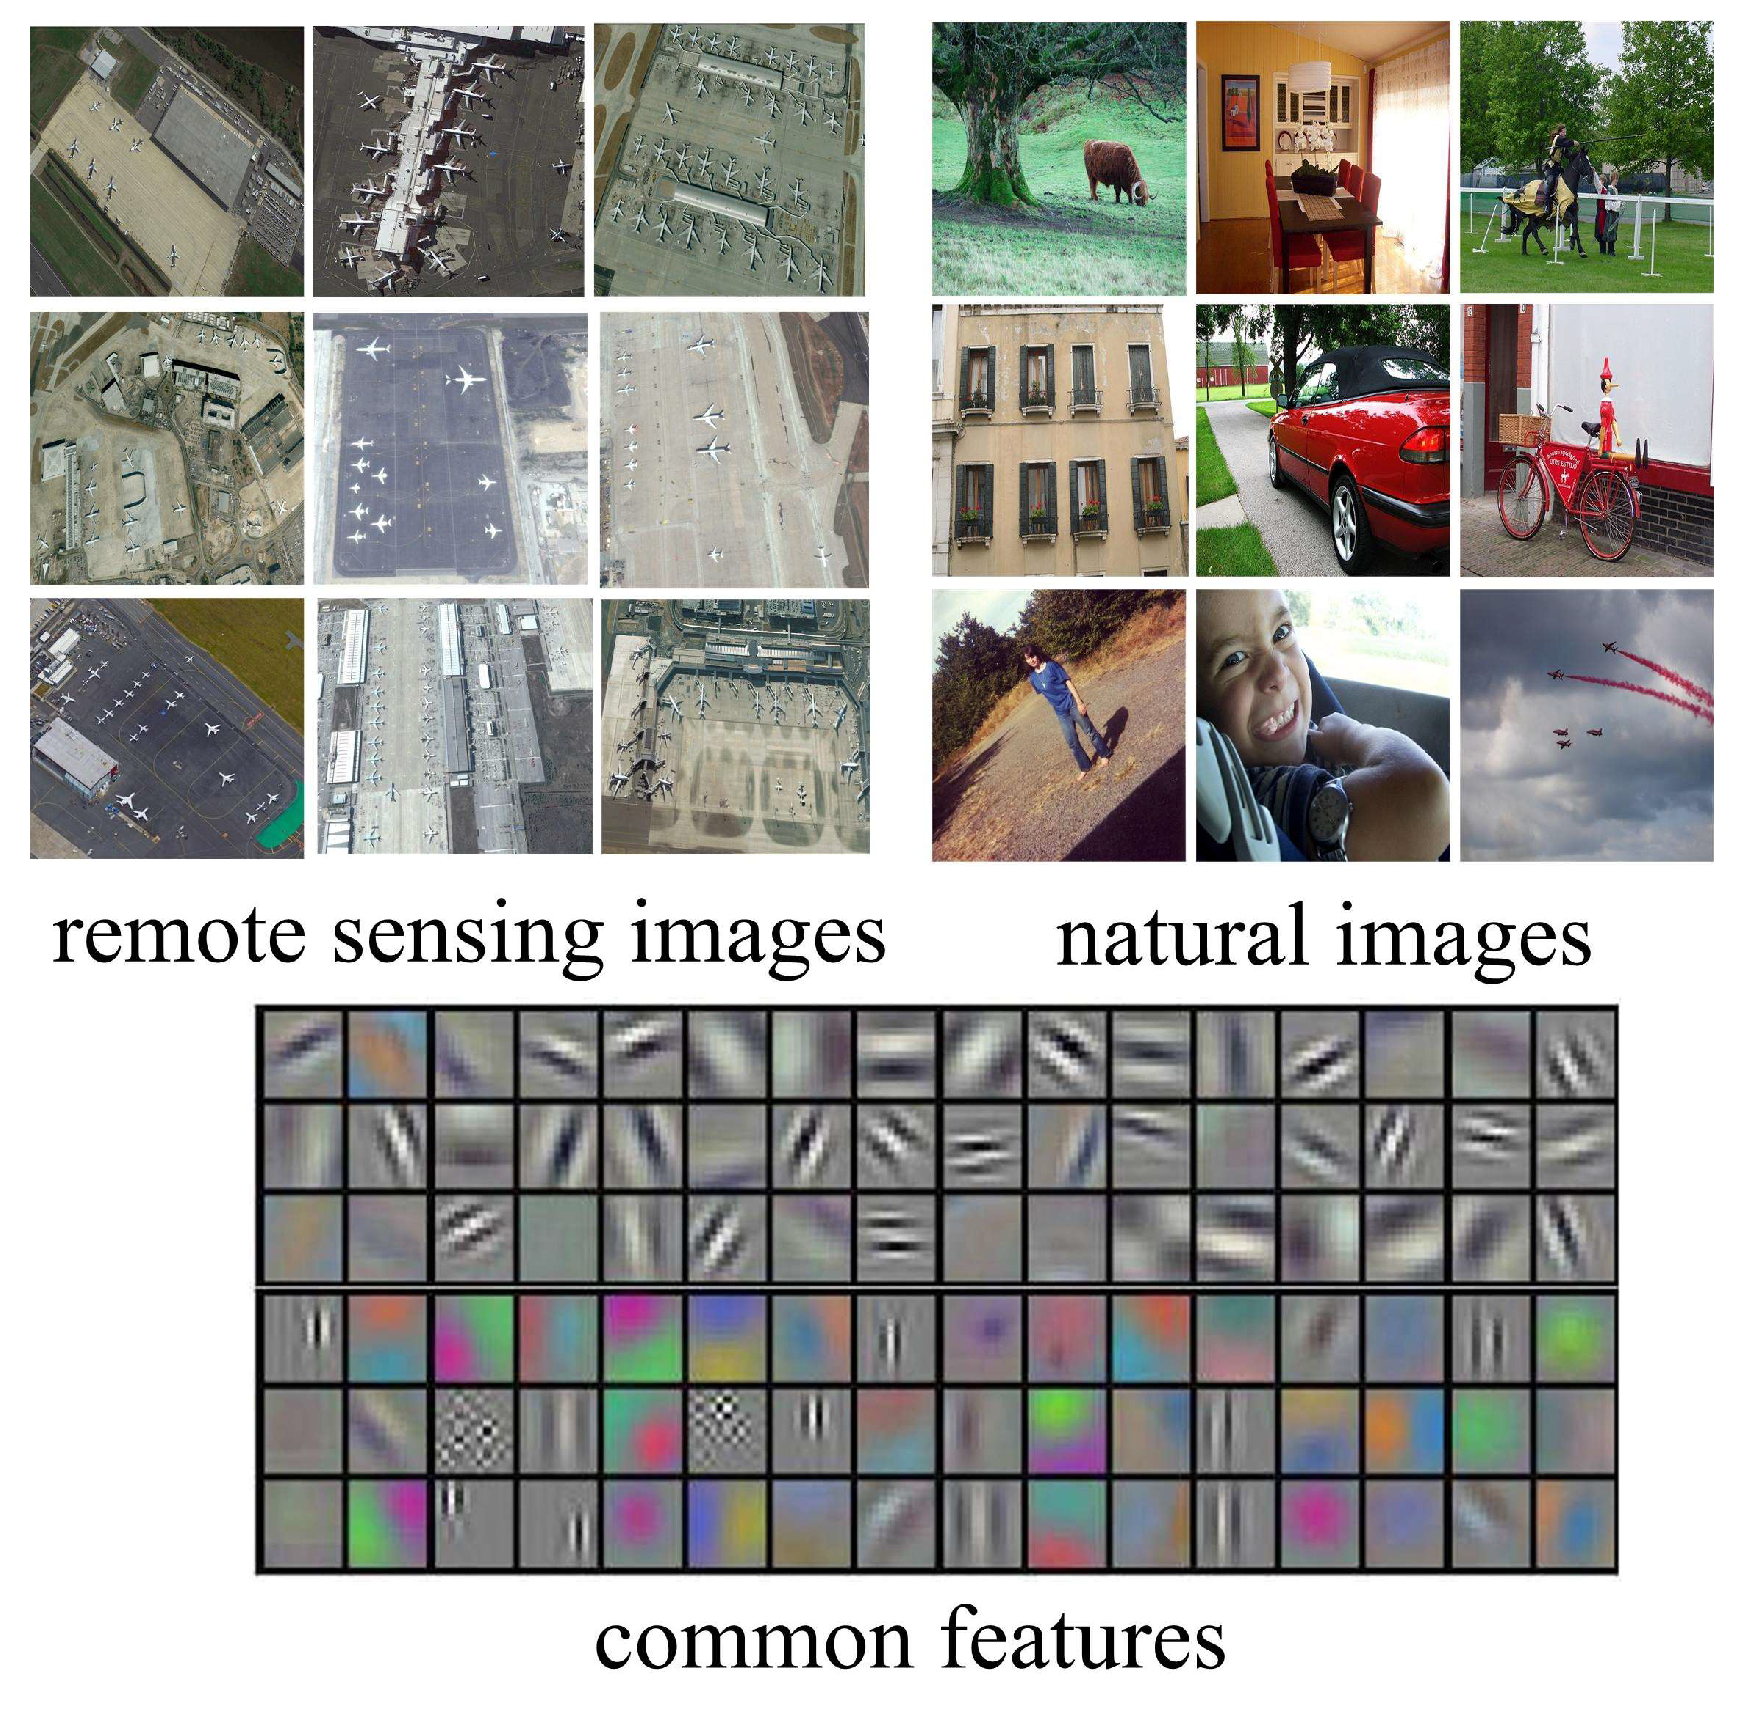
2.3. Transfer Learning and Network Training

Although remote sensing images have features such as varied scales, multiple orientations, small objects, and complex backgrounds, when compared with a natural image, they contain similar object features including low-level semantic features such as edge and color and abstract high-level semantic features. Similarly, the CNN can learn and extract low- or high-level semantic features from a remote sensing image. Additionally, the CNN can learn features such as scale variety, multiple orientations, and background complexity from test data via model training, which is similar to learning semantic features such as edge and color. Deep learning model-based object detection requires massive data training. Limited remote sensing data samples and the high labor cost of data marking are the main reasons that deep learning is rarely applied to remote sensing images. Therefore, remote sensing images were collected from Google Earth and data were marked manually. Retraining a new CNN with airplane remote sensing data has low efficiency and results in overfitting. The low convolutional layer learns low-level semantic features such as edge texture and color. These features are consistent for airplane remote sensing and ordinary natural images, as shown in Figure 10.
Therefore, a CNN can be pretrained with a large-scale natural image database [30] and the features learned by the network can be transferred to the new airplane detection task via transfer learning, which proves to be very efficient. The weights of the shared convolutional layers were initialized with the pretrained network VGG16, and the weights of the remaining layers were initialized based on a Gaussian distribution with a mean of 0 and a standard deviation of 0.01. The basic learning, momentum, and weight decay coefficients of the network were 0.001, 0.9, and 0.0005, respectively. VGG16 is one of the structures of VGGNet. It has 13 layers of convolutional layers and 3 layers of fully connected layers, totaling 16 layers. The structure diagram is shown in Figure 11.
In Figure 11, pool1–pool5 represent the maximum pooling. The pooling area was 2 × 2, the sliding step size was 2, and the probability of the dropout technique was 0.5. The parameters of each convolutional layer are shown in Table 2.
This paper used an alternate optimization strategy [21] to train the entire network in four steps. In the first step, we trained the RPNs. This network was initialized with the pretrained network VGG16 and fine-tuned end-to-end for the region proposal task. In the second step, we trained a separate detection network using the candidate boxes generated by the step-1 RPNs. This detection network was also initialized by the pretrained network VGG16. At this point, the two networks did not share convolutional layers. In the third step, we used the detector network to initialize RPN training, but we fixed the shared convolutional layers and only fine-tuned the layers unique to RPN. Now, the two networks shared convolutional layers. Finally, keeping the shared convolutional layers fixed, we fine-tuned the unique layers of detection. As such, both networks shared the same convolutional layers and formd a unified network.

3. Results

3.1. Computational Platform and Evaluation Index

The experimental environment included an i7-7700 processor running at 3.6 GHz, 16G of memory, and an NVIDIA GTX1060 (graphics card). The deep learning framework in this paper was open source Caffe, which is based on the Ubuntu14.04 operating system and a Python interface. The structure, performance, and code quality of the Caffe framework are outstanding, which significantly reduces the difficulty of deep learning research and development. First, the Caffe model structure is very stable and has excellent version compatibility. Next, Caffe has a well-written tutorial, which makes it easy for users to learn. Additionally, Caffe can be used in tandem with cuDNN and has a significant speed advantage. Finally, Caffe is such an open deep learning framework that users can obtain code of a required model easily and communicate with other users. Therefore, Caffe was selected for this study as the deep learning framework.
The evaluation indexes included accuracy (AC), false positive rate (FPR), missing ratio (MR), error ratio (ER), and average processing time (T) [14,31]. These indexes are defined as follows:
A C = n u m b e r o f d e t e c t e d a i r p l a n e n u m b e r o f a i r p l a n e × 100 %
F P R = n u m b e r o f f a l s e l y d e t e c t e d a i r p l a n e n u m b e r o f d e t e c t e d a i r p l a n e × 100 %
M R = n u m b e r o f m i s s i n g a i r p l a n e n u m b e r o f a i r p l a n e × 100 %
E R = F P R + M R .
In this paper, the threshold of IoU was set to 0.5. If the threshold was exceeded, it meant that the object was detected. In addition, the average processing time was the average of five experiments.

3.2. Test Data

All test data in this paper were remote sensing airport images from Google Earth, including 300 airports such as Beijing Capital International airport and Boston International airport in the United States, with a spatial resolution of 1.19 m. The image sizes were in the range of 375 × 375 to approximately 400 × 400, and there were a total of 1500 images. To prevent overfitting and to learn the rotation-invariant features of an airplane, the existing 1500 images were expanded via data enhancement. After being rotated by 90°, 180°, or 270° randomly and flipped horizontally or vertically with a probability of 0.5, the 1500 images were expanded to 5000 images, of which 2500 were randomly selected as training sets, and the remaining 1500 were verification sets. The image sizes were in the range of 900 × 800 to approximately 1000 × 900, and there were a total of 150 images, which were used as the test set. All the image labels were marked manually. Figure 12 shows an example of the data.

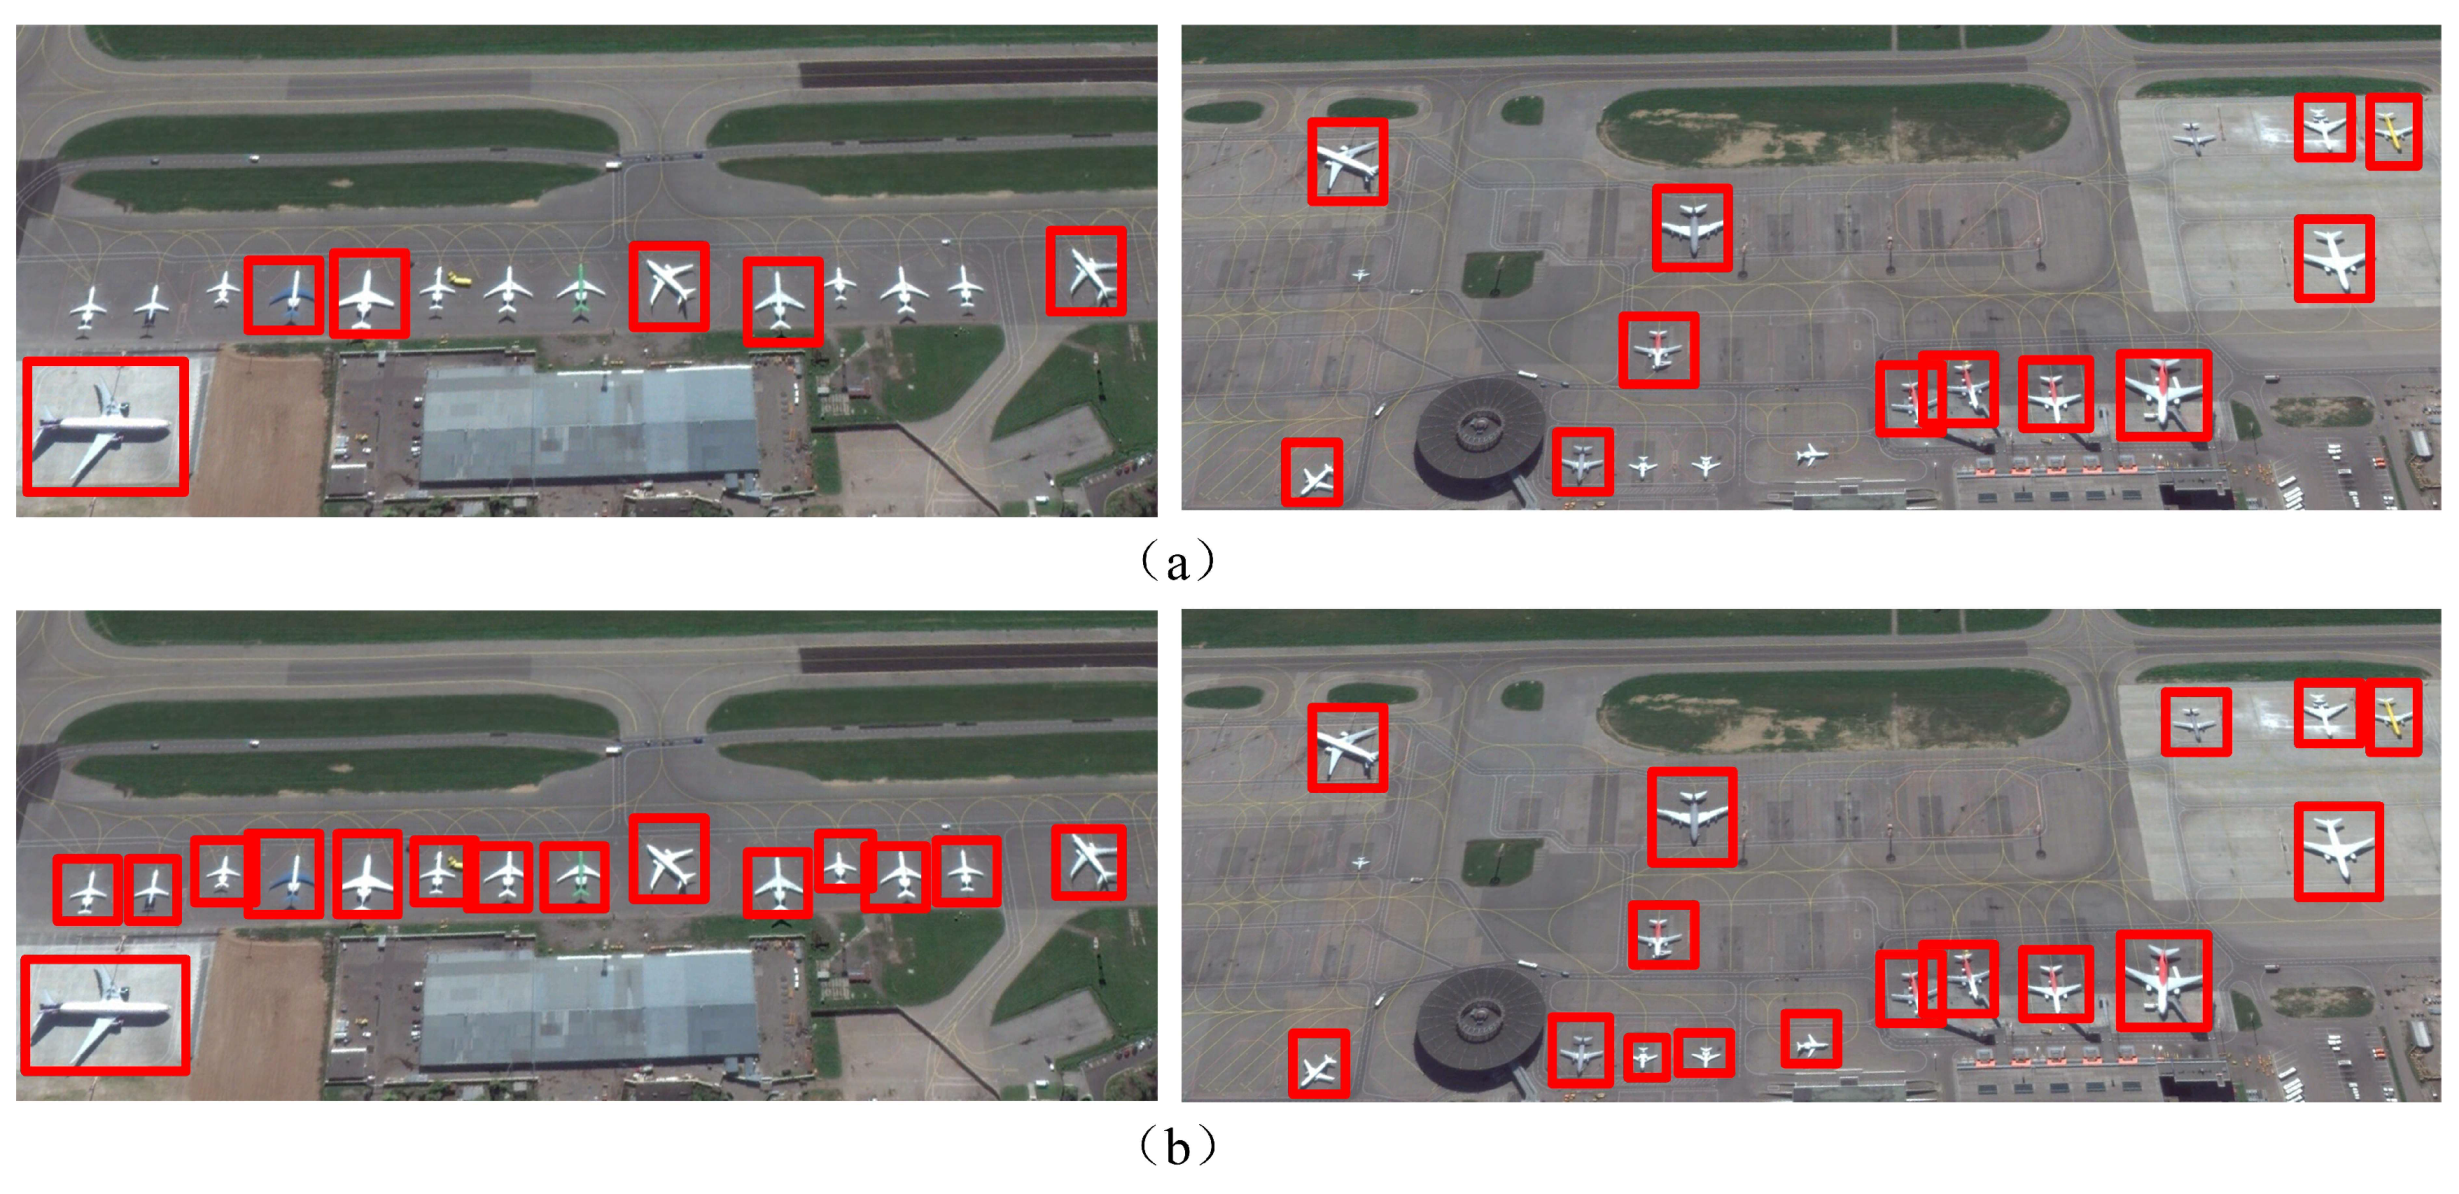
3.3. Comparison of Results

To prove the superiority of the proposed method, it was compared with existing airplane detection methods. Based on open source code of competing methods from the Internet, a simulation test was performed in the test environment described in this paper. The AC, FPR, MR, ER, and T of each method against the test set were recorded and compared (Table 3). The DBN-based method is a method based on a deep belief network [11]; BING+CNN is a method based on BING and CNN [12]; Faster R-CNN is the original method without multilayer feature fusion or NMS improvement; and YOLOv2 is a one-stage object detection method based on CNN [32].
The AC, FPR, MR, and ER of the proposed method were significantly superior to other methods, and our method also had better computational efficiency (Table 3). The DBN-based method remains based on a manual feature design plus a classifier, while the original simple classifier is replaced by a deep belief network. It continues to have problems such as insufficient capability to represent features manually and a redundant slip window; therefore, the accuracy and time performance remained inferior. The BING+CNN method first produces candidate regions via BING technology and then detects airplanes via a CNN. However, the quality of the candidate regions produced by BING was not as high as the quality of the regions produced by the RPN; additionally, BING had a longer execution time. Faster R-CNN and YOLOv2 integrate candidate region generation, feature extraction, object classification, and boundary regression into a deep CNN framework and fully leverage the powerful feature expression capability of a CNN to implement end-to-end airplane detection. Therefore, the accuracy and speed of Faster R-CNN, YOLOv2, and the proposed method were superior to those of the previous two methods. In this paper, multilayer feature fusion and a soft decision NMS algorithm were integrated to further improve the airplane detection performance of Faster R-CNN. Additionally, the improved method did not significantly increase the execution time. Therefore, our method was comparable in speed to Faster R-CNN, and the AC, FPR, MR, and ER were superior to those of Faster R-CNN and YOLOv2. However, compared with YOLOv2, this method was still unable to achieve real-time processing.

4. Discussion

4.1. Analysis of Multilayer Feature Fusion

To analyze the effect of multilayer feature fusion on detection results when other conditions are fixed, a control variable comparison test was performed. The results are listed in Table 4.
As Table 4 shows, the AC of multilayer feature fusion was superior to the AC of a single-layer feature (line 1), which demonstrates the effectiveness of multilayer feature fusion. After multilayer convolution and pooling, the feature scale of an airplane in a convolutional feature image in the last layer or the fifth layer was small, which is unfavorable for airplane positioning. The rough and high-level semantic in the high layer feature is favorable for object classification, while precise and high-resolution in the low layer feature is favorable for object positioning. Therefore, multilayer feature fusion can leverage the advantages of different layers to improve network detection capability, especially for small objects such as airplanes. A gradual increase in the fused layers can continually improve the AC; however, when increasing the fusion beyond the third layer, does not further improve the AC. This finding means that the fusion of features in layers 3, 4, and 5 has an optimal AC, while the fusion of more features in other layers does not provide additional useful information, and network performance improvement is saturated. In the following tests, unless specifically mentioned, the features of layers 3, 4, and 5 were fused by default.
To illustrate the importance of feature fusion more intuitively, detection results of different methods were compared, as shown in Figure 13. Figure 13a shows the detection result using the feature of the fifth layer, and Figure 13b shows the detection result based on the fusion of features in layers 3, 4, and 5. Figure 13 shows that, after multilayer feature fusion, the network can detect additional small objects, which improves the AC.

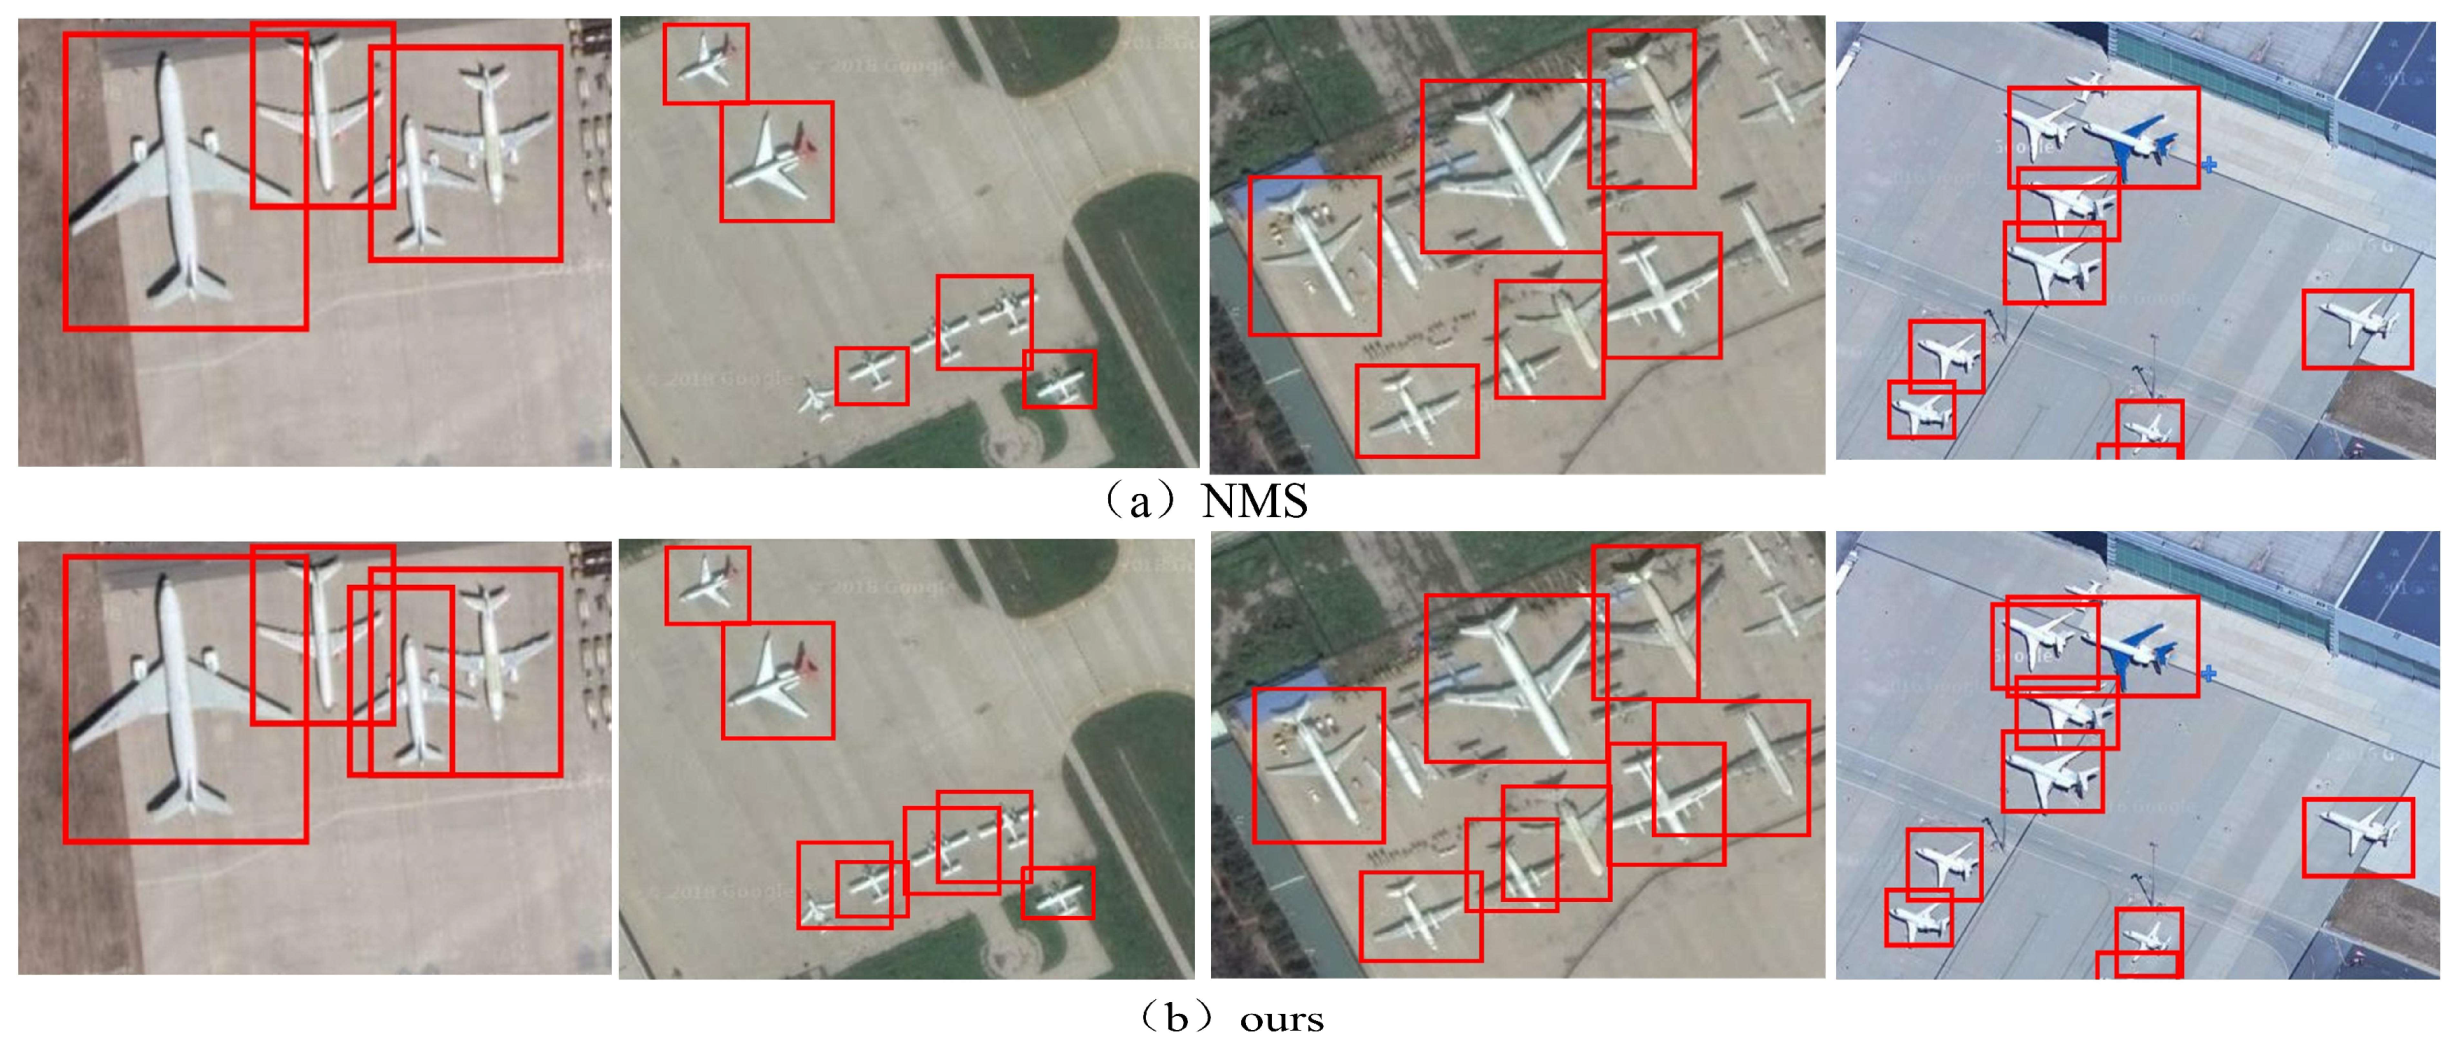
4.2. Analysis of NMS Algorithm Improvement

To demonstrate the effectiveness of the improved NMS algorithm, the airplane test set was used for a comparative test (Table 5).
The soft decision NMS algorithm in this paper improved the AC by 2.35% over the test set (Table 5) because in the conventional NMS algorithm, all detection frames whose overlapping areas with detection frame M exceeding the threshold were removed, which could cause some adjacent objects to be missed. By contrast, the improved NMS algorithm attenuated the adjacent detection frame classification score via an overlapping area function, which is different from forcing the adjacent detection frame to zero, as done by the conventional NMS algorithm, effectively reducing missed detection. Figure 14 shows the detection results before and after NMS improvement. The NMS algorithm incorrectly suppressed the adjacent detection frame, while the proposed method could detect the object accurately.

4.3. Method Analysis

Chen et al. [33] also carried out similar research on airplane detection using transfer learning in remote sensing images. Their airplane detection framework was based on the single shot multibox detector (SSD), and a method was proposed to solve the size restrictions of the input images. A big disadvantage of the SSD algorithm [34] is that it is not robust enough for small object detection, but Chen et al. did not mention this issue. Aiming at the problem of the insufficient representation ability of weak and small objects and overlapping detection boxes in airplane object detection, we carried out related research that has provided an original contribution to the field. We have done similar work before [2,35]. In the literature [2], we proposed an airport detection method combining cascade region proposal networks and multithreshold detection networks, which aimed to deal with the problems of complex background and inaccurate positioning. In the literature [35], we proposed an airplane detection method to deal with the issue of small objects, which used multilayer feature fusion in fully convolutional neural networks. This research fused multilayer features by adding a maximum pooling layer, a deconvolutional operation, and a convolutional layer, but it increased the time cost of the algorithm. From further analyzing and studying the Faster R-CNN structure, we found a simpler and more effective way to achieve multilayer feature fusion. As described in Section 2.2, we started with fixed feature vectors from different convolutional layers via the RoI pooling layer. Next, L2 norm normalization, connection of the features in each layer, scale transformation, and feature dimension reduction were performed in sequence. Finally, the fused features were imported into the fully connected layer. The proposed method has almost no additional time cost and is very simple to implement. At the same time, this paper also proposed the improved NMS method to solve the problem of overlapping detection boxes, which has always been ignored by previous aircraft inspection methods.

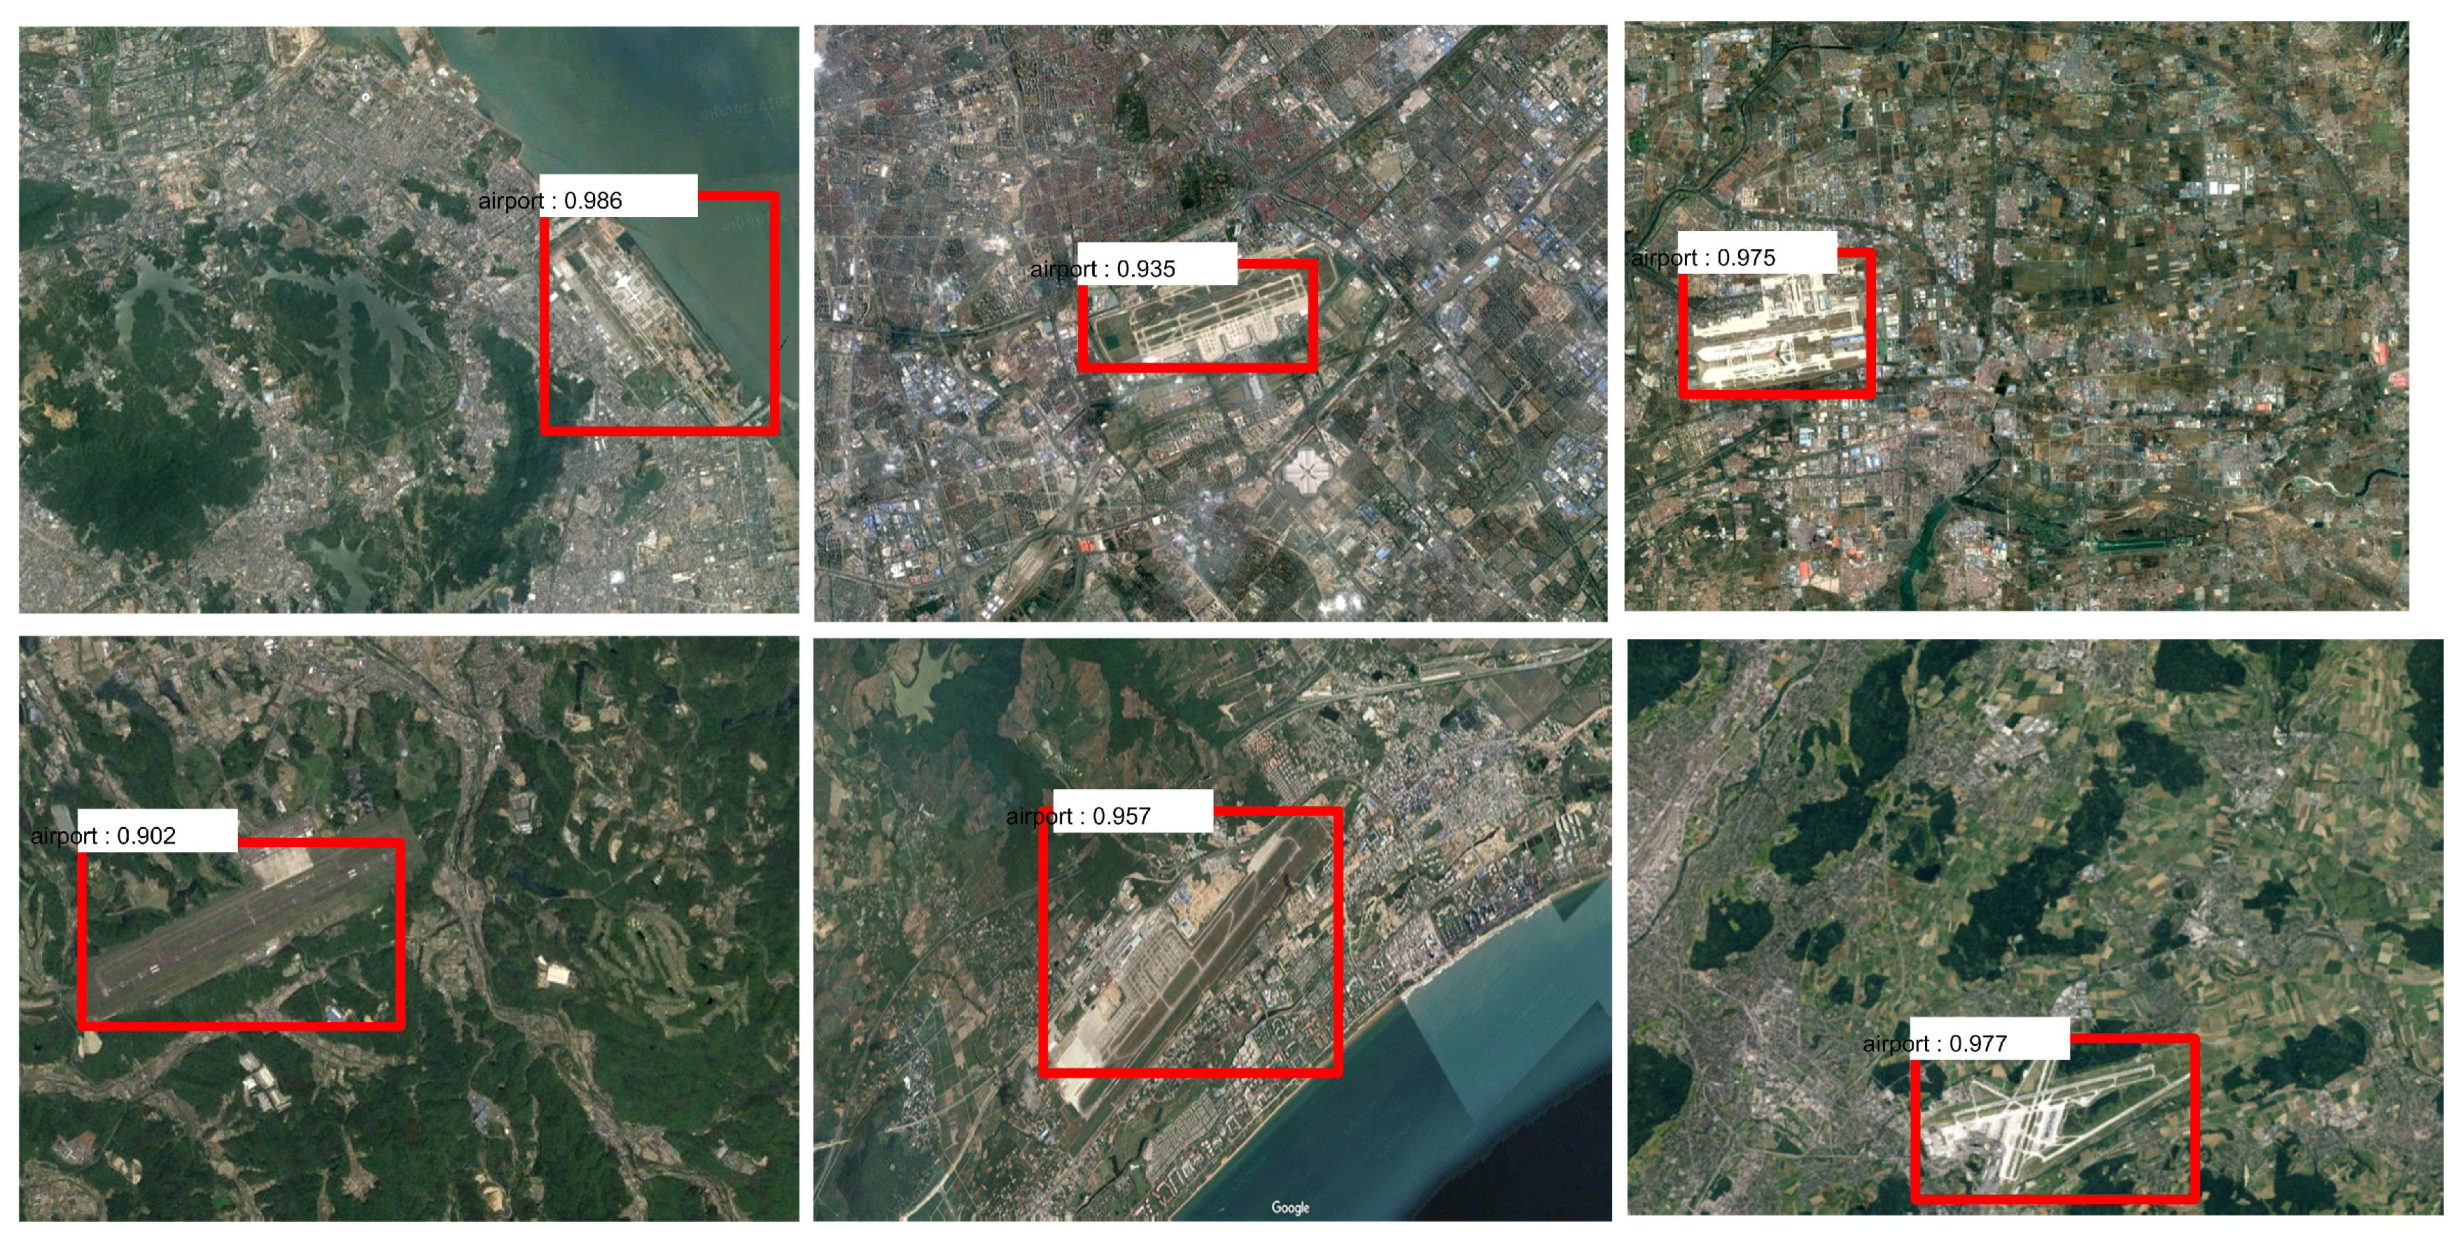
4.4. Application to Airports

To illustrate the generalization capabilities of the method, the proposed method was applied to an airport dataset. As shown in Figure 15, the proposed method can be applied to airport detection, which shows that the method can solve other object detection problems well.

5. Conclusions

In this paper, a remote sensing image airplane detection method based on the Faster R-CNN framework that combines multilayer feature fusion and soft decision was proposed. Region extraction, feature extraction, object classification, and positioning regression were integrated into an end-to-end deep network framework. L2 norm normalization, feature connection, scaling, and feature dimension reduction were applied in sequence to integrate multilayer features, which improved the network’s ability to detect small objects such as airplanes. Soft decision was introduced to improve the conventional NMS method, which reduced network missed ACs when there was significant object overlap. The effectiveness of the proposed method was confirmed by a simulation test. Compared with other airplane detection methods, our method significantly improved all the metrics; thus, it has theoretical and practical value for real-time and high-precision airplane detection.
With the continuous exploration and development of deep learning theory, some new model frameworks have emerged. Therefore, the next step is to enhance and improve the existing network method and architecture. Additionally, with the increase of the number of layers in the network, the model parameters and training time also increase sharply. How to optimize the network structure to balance the contradiction between performance and efficiency is a key issue to be considered next.

Author Contributions

Conceptualization, M.Z. and Y.X.; Methodology, M.Z. and Y.X.; Software, M.Z., S.L., H.M., and Y.H.; Validation, M.Z., Y.X., and S.L.; Formal Analysis, M.Z.; Investigation, S.M. and H.M.; Resources, Y.X. and S.M.; Data Curation, M.Z.; Writing—Original draft preparation, M.Z.; Writing—Review and editing, M.Z.; Visualization, M.Z.; Supervision, Y.X. and S.M.; Project Administration, Y.X. and S.M.; Funding Acquisition, Y.X. and S.M.

Funding

This research was funded by the Aeronautical Science Foundation of China, grant number 20175896022.

Acknowledgments

The authors would like to thank the Editor and anonymous reviewers for their helpful comments and suggestions to improve the paper.

Conflicts of Interest

The authors declare no conflict of interests.

References

  1. Song, M.Z.; Qu, H.S.; Jin, G. Weak ship object detection of noisy optical remote sensing image on sea surface. Acta Opt. Sin. 2017, 37, 101–1004. [Google Scholar]
  2. Xu, Y.L.; Zhu, M.M.; Li, S. End-to-end airport detection in remote sensing images combining cascade region proposal networks and multi-threshold detection networks. Remote Sens. 2018, 10, 1516. [Google Scholar] [CrossRef]
  3. Li, W.; Xiang, S.M.; Wang, H.B. Robust Airplane Detection in Satellite Images. In Proceedings of the International Conference on Image Processing (IEEE), Brussels, Belgium, 11–14 September 2011; pp. 2821–2824. [Google Scholar]
  4. Bo, S.K.; Jing, Y.J. Region-Based Airplane Detection in Remotely Sensed Imagery. In Proceedings of the International Congress on Image and Signal Processing, Yantai, China, 16–18 October 2010; pp. 1923–1926. [Google Scholar]
  5. Liu, G.; Sun, X.; Fu, K. Aircraft recognition in high-resolution satellite images using coarse-to-fine shape prior. IEEE Geosci. Remote Sens. Lett. 2013, 10, 573–577. [Google Scholar] [CrossRef]
  6. Tan, Y.; Li, Q.; Li, Y.; Tian, J. Aircraft detection in high-resolution sar images based on a gradient textural saliency map. Sensors 2015, 15, 23071–23094. [Google Scholar] [CrossRef] [PubMed]
  7. Wang, W.; Nie, T.; Fu, T.; Ren, J.; Jin, L. A novel method of aircraft detection based on high-resolution panchromatic optical remote sensing images. Sensors 2017, 17, 1047. [Google Scholar] [CrossRef] [PubMed]
  8. Liu, L.; Shi, Z.W. Airplane detection based on rotation invariant and sparse coding in remote sensing images. Optik Int. J. Light Electron Opt. 2014, 125, 5327–5333. [Google Scholar] [CrossRef]
  9. Yildiz, C.; Polat, E. Detection of Stationary Aircrafts from Satelitte Images. In Proceedings of the 2011 IEEE 19th Signal Processing and Communications Applications Conference (SIU), Antalya, Turkey, 20–22 April 2010. [Google Scholar]
  10. An, Z.Y.; Shi, Z.W.; Teng, X.C. An automated airplane detection system for large panchro-matic image with high spatial resolution. Optik 2014, 125, 2768–2775. [Google Scholar] [CrossRef]
  11. Chen, X.Y.; Xiang, S.M.; Liu, C.L. Aircraft Detection by Deep Belief Nets. In Proceedings of the Asian Conference on Pattern Recognition, Naha, Japan, 5–8 November 2013; pp. 54–58. [Google Scholar]
  12. Wu, H.; Zhang, H.; Zhang, J.F. Fast Aircraft Detection in Satellite Images Based on Convolutional Neural Networks. In Proceedings of the IEEE International Conference on Image Processing (IEEE), Quebec City, QC, Canada, 27–30 September 2015; pp. 4210–4214. [Google Scholar]
  13. Li, Y.; Fu, K.; Sun, H. An aircraft detection framework based on reinforcement learning and convolutional neural networks in remote sensing images. Remote Sens. 2018, 10, 243. [Google Scholar] [CrossRef]
  14. Zhang, F.; Du, B.; Zhang, L. Weakly supervised learning based on coupled convolutional neural networks for aircraft detection. IEEE Trans. Geosci. Remote Sens. 2016, 54, 5553–5563. [Google Scholar] [CrossRef]
  15. Zhong, J.; Lei, T.; Yao, G.; Jiang, P. Robust Aircraft Detection with a Simple and Efficient Model. Information 2018, 9, 74. [Google Scholar] [CrossRef]
  16. Girshick, R.; Donahue, J.; Darrell, T.; Malik, J. Rich Feature Hierarchies for Accurate Object Detection and Semantic Segmentation. In Proceedings of the IEEE Conference on Computer Vision and Pattern Recognition, Columbus, OH, USA, 23–28 June 2014; pp. 580–587. [Google Scholar]
  17. Wang, X.; Shrivastava, A.; Gupta, A. A-Fast -CNN: Hard Positive Generation via Adversary for Object Detection. In Proceedings of the IEEE Conference on Computer Vision and Pattern Recognition, Honolulu, HA, USA, 21–26 July 2017. [Google Scholar]
  18. Pan, S.; Yang, Q. A Survey on Transfer Learning. IEEE Trans. Knowl. Data Eng. 2010, 22, 1345–1359. [Google Scholar] [CrossRef] [Green Version]
  19. Zhang, W.C.; Sun, X.; Fu, K. Object detection in high-resolution remote sensing images using rotation invariant parts based model. IEEE Trans. Geosci. Remote Sens. 2014, 11, 74–78. [Google Scholar] [CrossRef]
  20. Wang, G.L.; Wang, X.C.; Fan, B. Feature extraction by rotation-invariant matrix representation for object detection in aerial image. IEEE Trans. Geosci. Remote Sens. 2017, 14, 851–855. [Google Scholar] [CrossRef]
  21. Ren, S.; He, K.; Girshick, R.; Sun, J. Faster R-CNN: Towards Real-time Object Detection with Region Proposal Networks. In Proceedings of the Advances in Neural Information Processing Systems, Montreal, QC, Canada, 7–12 December 2015; pp. 91–99. [Google Scholar]
  22. Girshick, R. Fast R-CNN. In Proceedings of the IEEE Conference on Computer Vision and Pattern Recognition, Santiago, Chile, 13–16 December 2015; pp. 1440–1448. [Google Scholar]
  23. Long, J.; Shelhamer, E.; Darrell, T. Fully Convolutional Networks for Semantic Segmentation. In Proceedings of the IEEE Conference on Computer Vision and Pattern Recognition, Santiago, Chile, 13–16 December 2015; pp. 3431–3440. [Google Scholar]
  24. Kong, T.; Yao, A.; Chen, Y. HyperNet: Towards Accurate Region Proposal Generation and Joint Object Detection. In Proceedings of the IEEE Conference on Computer Vision and Pattern Recognition, Las Vegas, NV, USA, 27–30 June 2016; pp. 845–853. [Google Scholar]
  25. Liu, W.; Rabinovich, A.; Berg, A.C. ParseNet: Looking wider to see Better. In Proceedings of the IEEE Conference on Computer Vision and Pattern Recognition, Santiago, Chile, 13–16 December 2015. [Google Scholar]
  26. Simonyan, K.; Zisserman, A. Very Deep Convolutional Networks for Large-Scale Image Recognition. arXiv 2015, arXiv:1409.1556v6. [Google Scholar]
  27. Szegedy, C.; Liu, W.; Jia, Y. Going deeper with convolutions. In Proceedings of the IEEE Conference on Computer Vision and Pattern Recognition, Santiago, Chile, 13–16 December 2015; pp. 1–9. [Google Scholar]
  28. He, K.; Zhang, X.; Ren, S. Deep Residual Learning for Image Recognition. In Proceedings of the IEEE Conference on Computer Vision and Pattern Recognition, Las Vegas, NV, USA, 27–30 June 2016; pp. 770–778. [Google Scholar]
  29. Rothe, R.; Guillaumin, M.; Van Gool, L. Non-maximum Suppression for Object Detection by Passing Messages Between Windows. In Proceedings of the 12th Asian Conference on Computer Vision—ACCV, Singapore, 1–5 November 2014; pp. 290–306. [Google Scholar]
  30. Deng, J.; Dong, W.; Socher, R. Imagnet: A large-scale hierarchical image database. In Proceedings of the 2009 IEEE Conference on Computer Vision and Pattern Recognition, Miami, FL, USA, 20–25 June 2009. [Google Scholar]
  31. Deng, Z.; Sun, H.; Zhou, S.; Zhao, J.; Lei, L.; Zou, H. Multi-scale object detection in remote sensing imagery with convolutional neural networks. ISPRS J. Photogramm. Remote Sens. 2018, 145, 3–22. [Google Scholar] [CrossRef]
  32. Redmon, J.; Farhadi, A. YOLO9000: Better, Faster, Stronger. In Proceedings of the IEEE Conference on Computer Vision and Pattern Recognition, Honolulu, HA, USA, 21–26 July 2017. [Google Scholar]
  33. Chen, Z.; Zhang, T.; Ouyang, C. End-to-end airport detection using transfer learining in remote sensing images. Remote Sens. 2018, 10, 139. [Google Scholar] [CrossRef]
  34. Fu, C.; Liu, W.; Ranga, A. DSSD: Deconvolutional Single Shot Detector. In Proceedings of the IEEE Conference on Computer Vision and Pattern Recognition, Honolulu, HA, USA, 21–26 July 2017. [Google Scholar]
  35. Xu, Y.L.; Zhu, M.M.; Xin, P. Rapid airplane detection in remote sensing images based on multilayer feature fusion in fully convolutional neural networks. Sensors 2018, 18, 2335. [Google Scholar] [CrossRef] [PubMed]
Figure 1. Faster R-CNN architecture.
Remotesensing 11 01062 g001
Figure 2. Schematic diagram of region proposal networks (RPNs).
Remotesensing 11 01062 g002
Figure 3. The schematic diagram of intersection-over-union (IoU).
Remotesensing 11 01062 g003
Figure 4. The flowchart of airplane detection method.
Remotesensing 11 01062 g004
Figure 5. The structure of a fully convolutional network (FCN).
Remotesensing 11 01062 g005
Figure 6. The structure of HyperNet.
Remotesensing 11 01062 g006
Figure 7. The structure of feature fusion.
Remotesensing 11 01062 g007
Figure 8. The nonmaximum suppression.
Remotesensing 11 01062 g008
Figure 9. The missed results.
Remotesensing 11 01062 g009
Figure 10. Transfer learning.
Remotesensing 11 01062 g010
Figure 11. The schematic diagram of VGG16.
Remotesensing 11 01062 g011
Figure 12. Examples of data.
Remotesensing 11 01062 g012
Figure 13. Results of different methods. (a): results with layer 5; (b): results with layers 3, 4, and 5.
Remotesensing 11 01062 g013
Figure 14. Airplane detection results. (a): results with traditional NMS; (b): results with improved NMS.
Remotesensing 11 01062 g014
Figure 15. Airport detection results.
Remotesensing 11 01062 g015
Table 1. The pseudocode of nonmaximum suppression (NMS) based on soft decision.
Input: B = { b i } is the list of initial detection boxes
       S = { s i } contains corresponding detection scores
       T is the NMS threshold
Output: D = { d i } contains all detection boxes
Initial: D is empty
While B empty do
     m = a r g m a x ( S ) ;
     M = b m ;
     D = D M ; B = B M ;
    For b i in B do
      If IoU ( M , b i ) T
     Remotesensing 11 01062 i001
     Remotesensing 11 01062 i002
      End if
    End for
End while
Return D,S
Table 2. The VGG16 network parameters for each convolutional layer.
FiltersKernel SizeStridePad
Conv1_164311
Conv1_264311
Conv2_1128311
Conv2_2128311
Con3_1256311
Conv3_2256311
Conv3_3256311
Conv4_1512311
Conv4_2512311
Conv4_3512311
Conv5_1512311
Conv5_2512311
Conv5_3512311
Table 3. Results comparison of different methods.
MethodAC (%)FPR (%)MR (%)ER (%)T (s)
DBN-based79.5424.1320.4644.59171.25
BING+CNN84.2518.6815.7534.436.41
Faster R-CNN86.288.7613.7222.480.15
YOLOv290.056.269.9516.210.03
Our method94.255.595.7511.340.16
Table 4. Combining features from different layers.
Layer2Layer3Layer4Layer5AC/%
86.28
90.30
91.90
91.90
Table 5. Results of different methods.
MethodAC/%
NMS91.90
Our method94.25

