Intellectual Structure of CORINE Land Cover Research Applications in Web of Science: A Europe-Wide Review


Faculty of Civil Engineering and Geodesy, Military University of Technology, Institute of Geodesy, gen. S. Kaliskiego 2st., 00908 Warsaw, Poland
*
Author to whom correspondence should be addressed.
Remote Sens. 2019, 11(17), 2017; https://0-doi-org.brum.beds.ac.uk/10.3390/rs11172017
Submission received: 19 July 2019
/
Revised: 20 August 2019
/
Accepted: 22 August 2019
/
Published: 27 August 2019
(This article belongs to the Special Issue CORINE Land Cover System: Limits and Challenges for Territorial Studies and Planning)
Abstract
:The objective of this paper is to manifest the intellectual and cognitive structure of CORINE Land Cover (CLC) research applications. Data from the Web of Science (WoS) was used to delimit publication on CLC during the period from 1985 until 2019 (29th April), retrieving a total of 873 documents. Through author citations, the origins and the most influential papers were identified. The main lines of research were identified from word co-occurrences extracted from the titles, keywords, and abstracts of the papers. In the view of both structures, it can be concluded that CORINE land cover constitutes a relatively young set of scientific data, with a constant expansion and a strongly interdisciplinary structure. The development of this application is dependent on the knowledge of such research areas as geography, remote sensing, ecology, forestry, agriculture, engineering, optics, and/or computer science. We believe that this information could be very useful for CLC users, as it reflects a large-scale analysis of the research lines of CLC and illuminates how research has changed over time in diverse areas of applications. Moreover, this study is intended to offer a useful tool for the CLC scientific community, showcasing the main research lines and the most noteworthy papers. Finally, the methodology used in this study can be replicated in many other fields of science to explore its intellectual and cognitive structure.
1. Introduction
The 2019–2020 year marks the 30th anniversary of establishing the first European land cover database—CORINE land cover—within the frame of CORINE (Coordination of Information on the Environment), the European Commission’s 1985 program. CORINE land cover (CLC) provides information on the biophysical characteristics of the Earth’s surface as well as its changes. The main source of data on land cover consists of images acquired by Earth observation satellites supported by several ancillary in situ data (e.g., topographic and thematic maps, orthoimages, ground survey data) [1,2,3]. The land cover nomenclature is suitable for purposes across the whole of Europe, including the great diversity of landscapes shaped by climatic, geological, and socio-economic conditions, changing from north to south and west to east [2].
Since the late 1980s, five CLC inventories have been released, in the reference years 1990, 2000, 2006, 2012, and 2018. CLC covers 39 EIONET (European Environment Information and Observation Network) and cooperating countries. As underlined by [4,5,6], the basic technical parameters of CLC have not changed since the beginning of the project (i.e., nomenclature, 25 ha minimum mapping unit for land cover patch, 5 ha for change in land cover, and 100 m minimum mapping width). Therefore, the results of each of the inventories are comparable. The method of mapping has changed, however. Since 2000, it has been based mainly on computer-assisted photo-interpretation, though some countries use a semi-automatic classification methodology [5] (e.g., Finland, Norway, UK, Ireland, Germany).
The Europe-wide spatial coverage, 30 years temporal range, high thematic accuracy (over 85%) as well as open-data policy provoke the most interest among the academic community, public administration, and commercial companies using CORINE land cover data. According to Feranec et al. [7], the statistics on data downloads and publications concerning CLC or CLC changes to inventories reveal that this data has become an integral part of research, planning, and decision-making. However, research has emphasized that the results of CORINE land cover applications should be interpreted with the necessary caution and an awareness of the limitations of mapping and change detection methodology. Jansen and Di Gregorio [8] turn to the inconsistency of land cover or land use delimitation criteria. Some researchers criticized the Mediterranean bias in the CORINE nomenclature [9,10], others claimed the land cover change maps are error-prone at a local scale [10] or inappropriate for detailed landscape analysis [11]. Of utmost importance is thematic and positional accuracy, which varies across land cover categories and regions [12,13,14].
Nevertheless, the possible applications of CLC data are manifold, even given its limitations. They cover such processes as urbanization, intensification, and extensification of agriculture, and deforestation and afforestation [15,16]. Particularly noteworthy are studies concerning land cover dynamics and its impact on the environment and economy [16], changes in ecosystems [17,18] and climate [19], hazards and risk assessment [20], water and soil properties [21], urban sprawl [22], and land take [16,23]. In addition, the CORINE land cover technology was successfully transferred to several African countries [24,25].
The scientific literature on CORINE land cover reflects the dynamic development of its applications in many research fields. However, the comprehensive analysis of the CORINE land cover application in research is still lacking. This study fills this gap by broad bibliometric analysis that allows users to present the current research development and trends of using CLC data in research domains, case studies, and their geographical locations. We conducted a bibliometric visualization review, and obtained an overall picture of this fast-growing application field, from the project launch in 1985, through 29th April, 2019, based on the WoS publications. The decision to use WoS was supported by its multidisciplinary function (i.e., wide and extensive indexing of the journals, books, and proceedings), the time range (since 1960), as well as a warranty of high-quality, indexed publications [26,27].
Furthermore, the Social Science Citation Index (SSCI), the Science Citation Index (SCI), and the Arts and Humanities Citation Index (A&HCI) databases provide a well-organized data sources for bibliometric analyses. The multivariate methods of bibliometrics, such as co-citation, bibliometric coupling, and co-occurrence supported by diverse coefficients and Moran’s I autocorrelation index, were used in publication pattern recognition of authors, countries, institutes, and journals that were present in CORINE land cover development and its applications during the period from 1989 until 2019. Moreover, the general publication patterns, including document type, language, subject category, and publication growth trends were analyzed. Findings from these investigations can help researchers to realize the breadth of research in the field and establish possible future research directions.
The main objective of this study is to analyze the intellectual structure and research performance of the European multi-temporal land use/land cover data, CORINE land cover, as reflected in the output publications from 1989 until 2019 (April). Intellectual structure analysis comprises general research-publication output, research hotspots, cooperation patterns that indicate research authorities (organizations, authors), hot papers, and research-themes clusters.
In particular, the study is focused on the following objectives:
- Examine the research output and its growth, rank, impact, and modes of communication
- Study the productivity and impact of many of the publishing institutions and authors
- Investigate the patterns of collaboration and geographical location of case studies
- Examine the CLC research frontiers and trends
The remainder of this paper is structured as follows: Section 2 describes the methods applied and materials used. Section 3 presents the results of performance including the visualization of the publications, journals, and sciences categories, the cooperation of authors, organizations, and countries, and hotspots researched. Section 4 displays CORINE land cover research application analysis and outlines the research frontiers. In Section 5, there is a discussion of the final results. Finally, the study is concluded in Section 6.
2. Methods and Materials
2.1. Methods
The methods used to reveal the research performance of CLC applications included the bibliometric mapping of scientific support using clustering techniques and statistical analysis. The concept of bibliometrics is defined as “the application of mathematics and statistical methods to books and other media of communication”, and was introduced and popularized in the science community in 1969 by Allan Prichard in his publication tilted Statistical Bibliography or Bibliometrics? [28]. An essential component of bibliometrics is citation analysis, as it is used to indicate the impact of publications and expresses the significance of the obtained results for other, later studies [29].
2.1.1. Citation Analysis
Citations exemplify a significant component of scientific communication and are perceived as a performance indicator of research evaluation. In general, they are acknowledgements that publications receive from one and another [30], and are measured by citation counts, citation per publication, or the h-index. Citation analysis relies on the examination of the occurrence, patterns, and graphs of citations in articles, conference proceedings, and books. Co-citation and bibliographic coupling are the most frequently used types of citation analysis for finding semantic similarities of documents that make use of citation relationships. Co-citation is defined as the frequency with which two documents are cited together by other documents. The more co-citations two documents receive, the higher their co-citation strength and the more likely they are semantically related [31]. This proves that a co-citation is a good indicator for the emergence of new scientific topics. Since its introduction, co-citation analysis has become a popular and widely used technique to examine the intellectual structure of research areas in Geospatial Information (GI) sciences, such as remote sensing [32,33,34,35], cartography [36], or spatial data quality [36]. The highly cited publications create the research front, while a cluster of cited documents is called an intellectual base [31].
Bibliographic coupling also occurs when two papers cite a common, third work in the bibliography sections, which means there is a high probability that the two works are focused on related subject matters. The "coupling strength" between two publications is related to the number of shared citations, the higher the number the greater. Bibliographic coupling is retrospective, whereas co-citation is essentially a forward-looking perspective [37].
The most productive and influential journals, authors, organizations and papers were identified using the total number of citations (TC), the average number of citations per publication (CPP) and the Hirsh index (h-index). Citation analysis of documents and authors was done in order to define research frontiers; the co-citation analysis of references was analyzed in order to set an established, intellectual base; the bibliographic coupling of the journals and authors was analyzed in order to find the similarities in the research. The citation analysis based on the association of strength coefficient sij is described in-depth in van Eck and Waltman [38].
The contributions of countries and institutions was explored by analyzing the authors’ affiliations. International collaboration was designated to authors who published with researchers from at least two countries, while national collaboration was assigned to those from separate institutions in the same country. Lack of collaboration was recorded when the authors were all affiliated with the same organization.
2.1.2. Co-occurrence Networks
Co-occurrence analysis is used to explore interactions between authors, organizations, countries, concepts, or other entities represented within the analyzed set of publications. In science, the co-occurrence of words is perceived as the carrier of meaning across different research fields [39]. It is based on text exploration methods [40] and is a simple counting of paired data within a collection of documents. Networks are generated by connecting pairs of terms using a set of criteria-defining co-occurrence, while the graphic representation of co-occurrence networks is visualized based on the relationships between items (authors, concepts, organizations, etc.). The co-occurrence between terms expressed by the strength coefficient ():
where: cij—the number of links (e.g., co-occurrence links, co-citation, bibliographic coupling) between nodes i and j (cij = cji ≥ 0); ci—the number of links of node i; m—the total number of links in the network.
The network of authors, organizations and terms used in papers’ titles and abstracts were explored by co-occurrence analysis.
2.1.3. Dispersion and Inequality Coefficients
The coefficient of dispersion () was used to quantify whether a set of observed occurrences are clustered or dispersed, as compared to a standard statistical model. It is expressed as the variance () divided by the mean :
The is equal to 1 for a random or Poisson distribution, < 1 indicates under-dispersion or an even distribution, while > 1 shows over-dispersion or aggregation.
GINI index Equation (5), a statistical measure of distribution introduced by the Italian statistician Corrado Gini in 1912, is most often used as a measure of economic inequality [41]. It is also possible to be used as an implementation in science evaluation [36]. GINI takes values from zero to one, with zero showing perfect equality and one representing perfect inequality. The coefficient was used as an indicator of the unequal distribution of publications in WoS research categories and scientific journals.
of ordered individuals with the size of individual i and , where: —number of WoS research categories or journals, —number of publications in a WoS research category or journal in ascending order , and —mean value.
2.2. Data
Data gathered from papers addressing CORINE land cover research applications were retrieved on April 29th, 2019 from the Web of Science (WoS) Core Collection with use of the online search application. The query: “CORINE land cover” was used to extract the relevant papers (Table 1). The WoS was searched through a general search interface, including such fields as: author(s), author identifier, title, abstract, keywords, keywords plus, publication name, document type, publication year, source name, addresses, organization-enhanced, references.
2.3. Workflow
The study was conducted in two subsequent stages, namely pre-processing and analysis, and was further divided into various research steps. The pre-processing stage included data retrieval, cleaning, and sorting. Data cleaning mainly involves the authors listed with the same surname but different initials, as well as checking various spellings of the names of organizations (e.g.: full name, abbreviation in English, or abbreviation in the local language). Publications that originate from England, Scotland, and Wales, were reclassified as the United Kingdom. Finally, to facilitate further analysis, publications of authors with different initials were merged. The cleaned data was then sorted by years, authors, organizations, document types, times cited, and the other bibliographic details.
Data analysis embraces: (1) general publication output and citation analysis from 1989 until April 29th, 2019; (2) the focus on research categories and in which research based on the CORINE land cover is of utmost importance in the presented the scientific disciplines; (3) data screening to find some of the most frequently cited papers and prominent authors, which displayed the most-cited, and hottest papers, as well as aided in the discovery of various research frontiers. In particular, the following aspects were considered to present the state of research applications using CLC data and to reveal the trends and intellectual structures.
- Publication output and citation analysis - by using the total number of publication (TP), the total number of citations (TC), the average number of citation per publication (CPP) as defined in INCites Indicator Handbook [42].
- Inequalities within subject categories and journals expressed by the number of publications (TP), coefficient of dispersion (), Lorentz curve, and GINI index.
- The most productive journals, conferences (NP, TC, CPP, IF,), analysis, as well as organizational cooperation expressed by the strength coefficient (sij) are shown as a cooperation network.
- Focus on the most prominent authors (h-index, NP, TC), their cooperation and similarities in research topics expressed by bibliographic coupling and co-citation.
- Keywords analysis, particularly co-occurrence between terms expressed by the strength coefficient (sij), and the number of uses in the 6-year window (the period between CLC inventories) that finally reveals the main research topics.
- The relation between geographical distribution of authors and CORINE land cover case studies expressed by Pearson correlation coefficient, the coefficient of dispersion and the Moran’s I, and the portrayal on choropleth maps after [43] suggestion.
- Intellectual base, research fronts formed by a group of highly cited papers and authors.
Bibliometric networks analysis of authors, organization, countries, and co-occurrence analysis of key terms in titles and abstracts was done by VOSviewer, the software dedicated to the analysis and visualization of intellectual structures of research in the field, developed by the Center for Science and Technology Studies of the University of Leiden, the Netherlands [38]. A fractional counting method was chosen as it equally weighted analyzed items (author, organization, country), regardless of the number of authors, citations, or references of a publication [44].
3. Results
3.1. General Publication Output
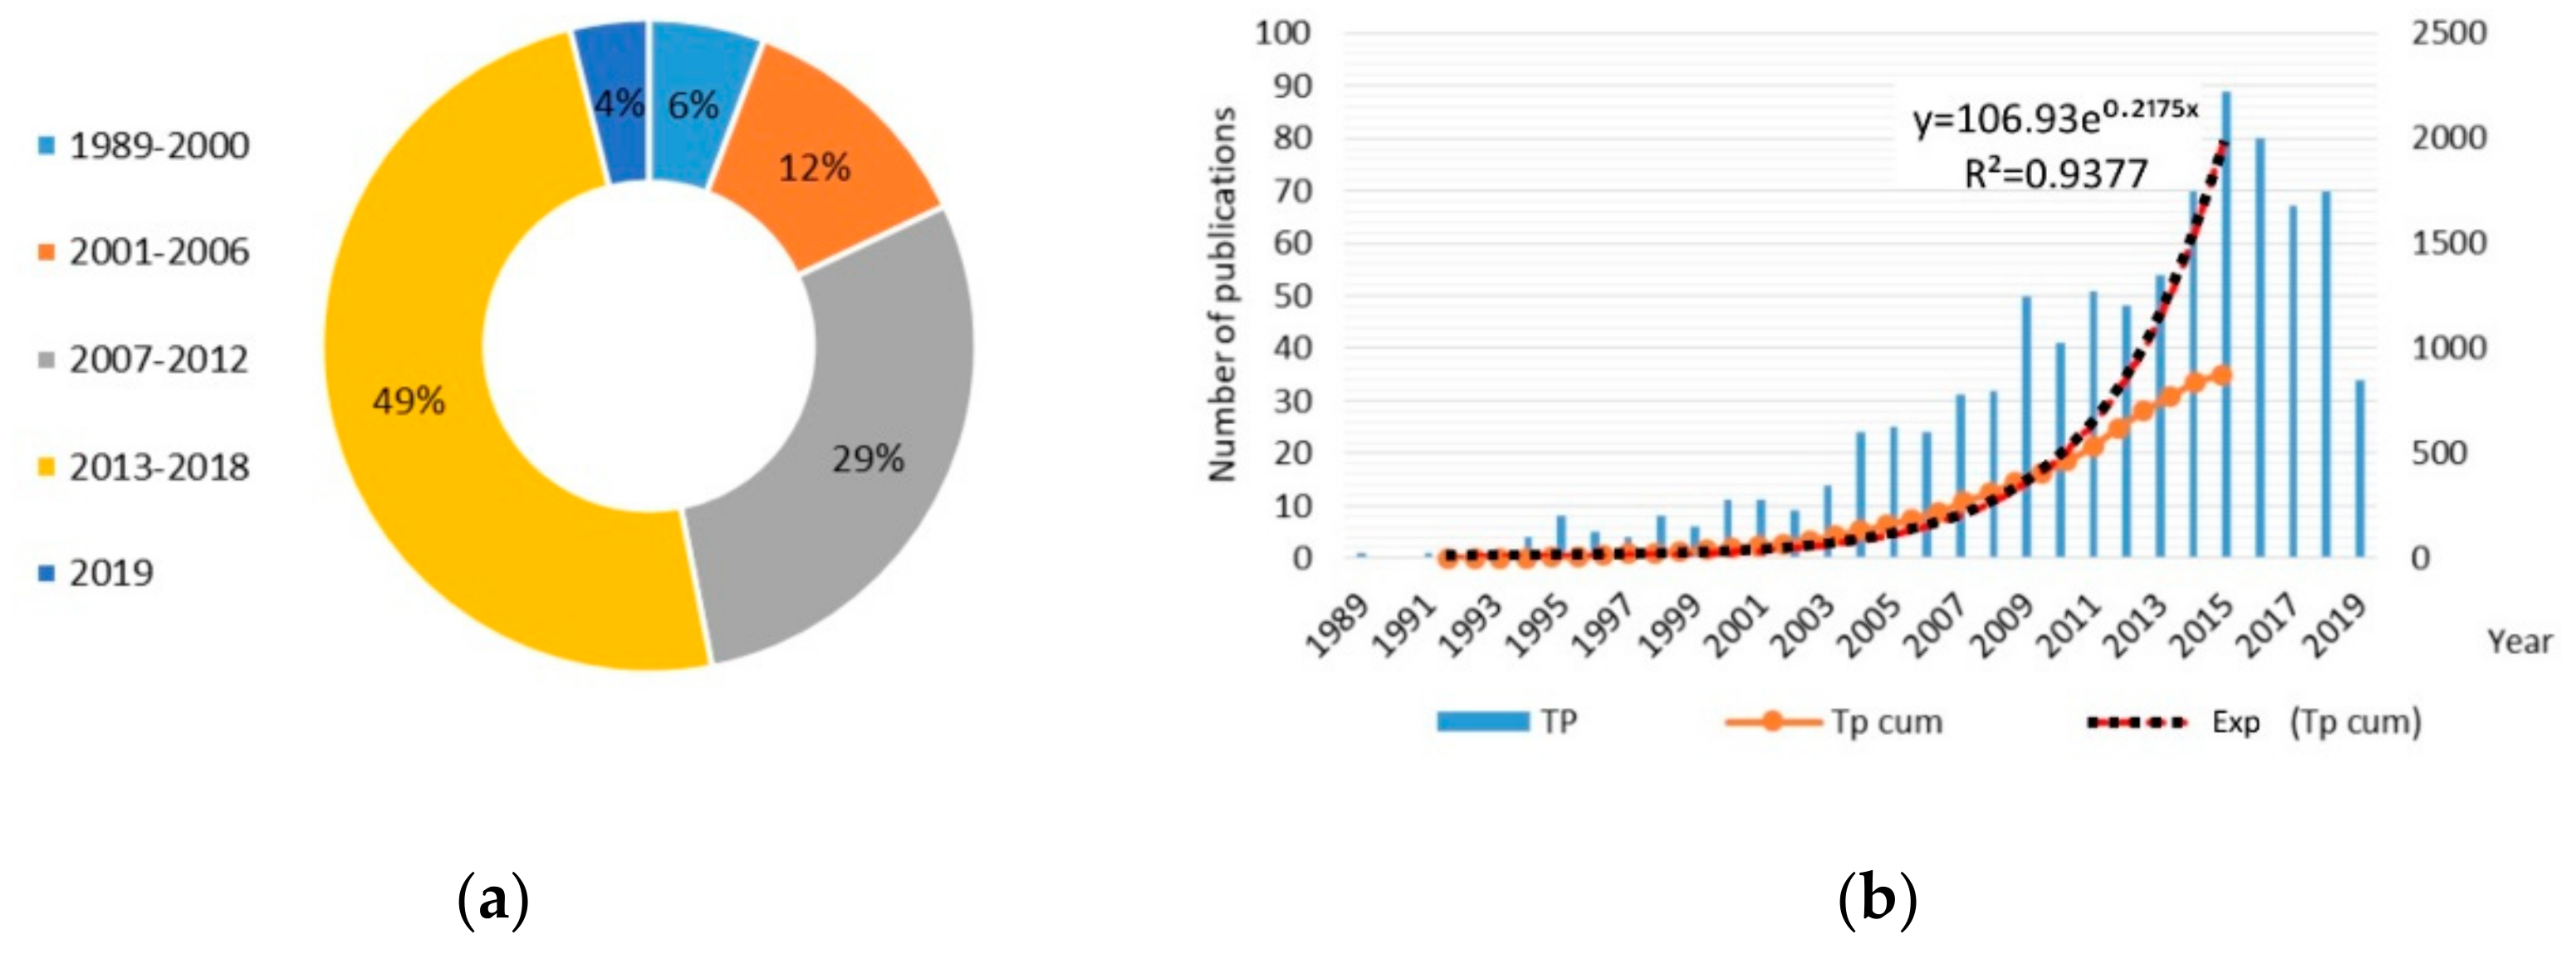
The total number of research publications (TP) related to CORINE land cover from 1989 until 29th April 2019 equals 873, which consists of as many as 1.32% of the worldwide research on land cover. Until 2000, the reference year of the first CLC updating, only 50 papers were published. Over the next several six-year gaps between subsequent inventories, the number of publications continued to double, from 107 articles published between 2001 and 2006, to 253 papers published between 2007 and 2012, and to as many as 430 items published between 2012 and 2018 (Figure 1a). The cumulative number of publication (see Figure 1b) is described by the exponential function (R-squared = 0.9485). The average article length of 11–12 pages (standard deviation (σ) is equal to 0.38) vary slightly with the coefficient of dispersion equal to 0.362. Since 1989, the average publication was written by two authors affiliated with only one organization. After 1999, the average number of authors per paper increased to four researchers from two countries. Research output is mainly documented in English (850 publications, 96.0%). However, other European languages were also used: Spanish (10 papers), French (6), German (6), Turkish (5), Polish (3), Czech (2), and Croatian, Italian, Slovak with one publication each.
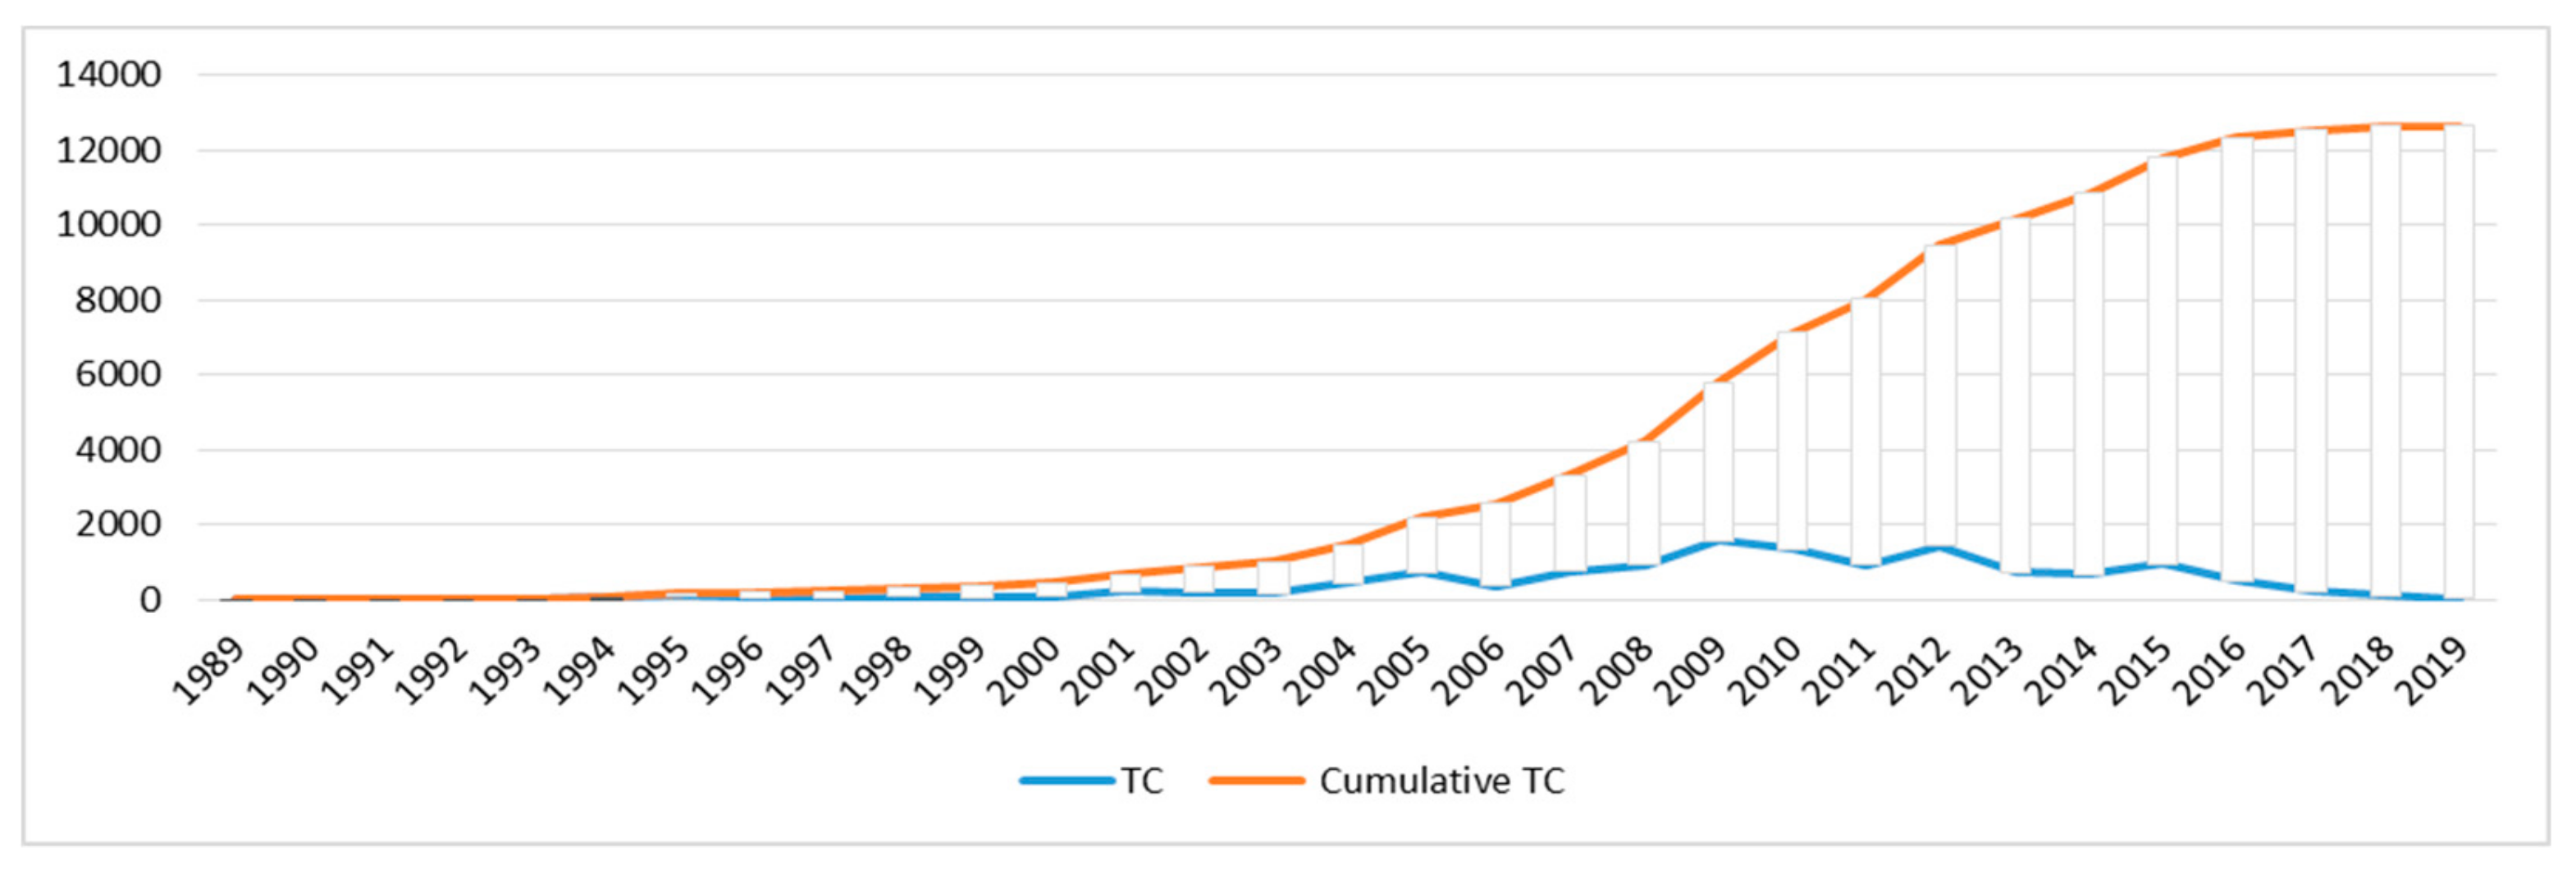
The 873 publications related to CLC were cited 12,695 times by 10,567 papers. The rate of self-citations was just 6.3%. As many as 497 (56.9%) publications were referred at least once a year, 16 of them were referred more than 10 times each year. Each of 53 research works has been quoted at least 53 times; therefore the h-index of publications amounts to 53. However, as many as 23.7% of publications were not cited at all, among them three papers published in conference proceedings in 1989, 1991, and 1993. The number of citations increased until 2009, with the peak value equaling 1558, and then slightly decreased, achieving the amount of 95 in 2018 (Figure 2). However, the total cumulative citation has been growing exponentially, according to equation . The distinct growth in the number of publications and the citations shows the steady increase and importance of CORINE land cover data in research applications over the past three decades (Table 2).
3.2. Science Categories, Journals, and Conferences
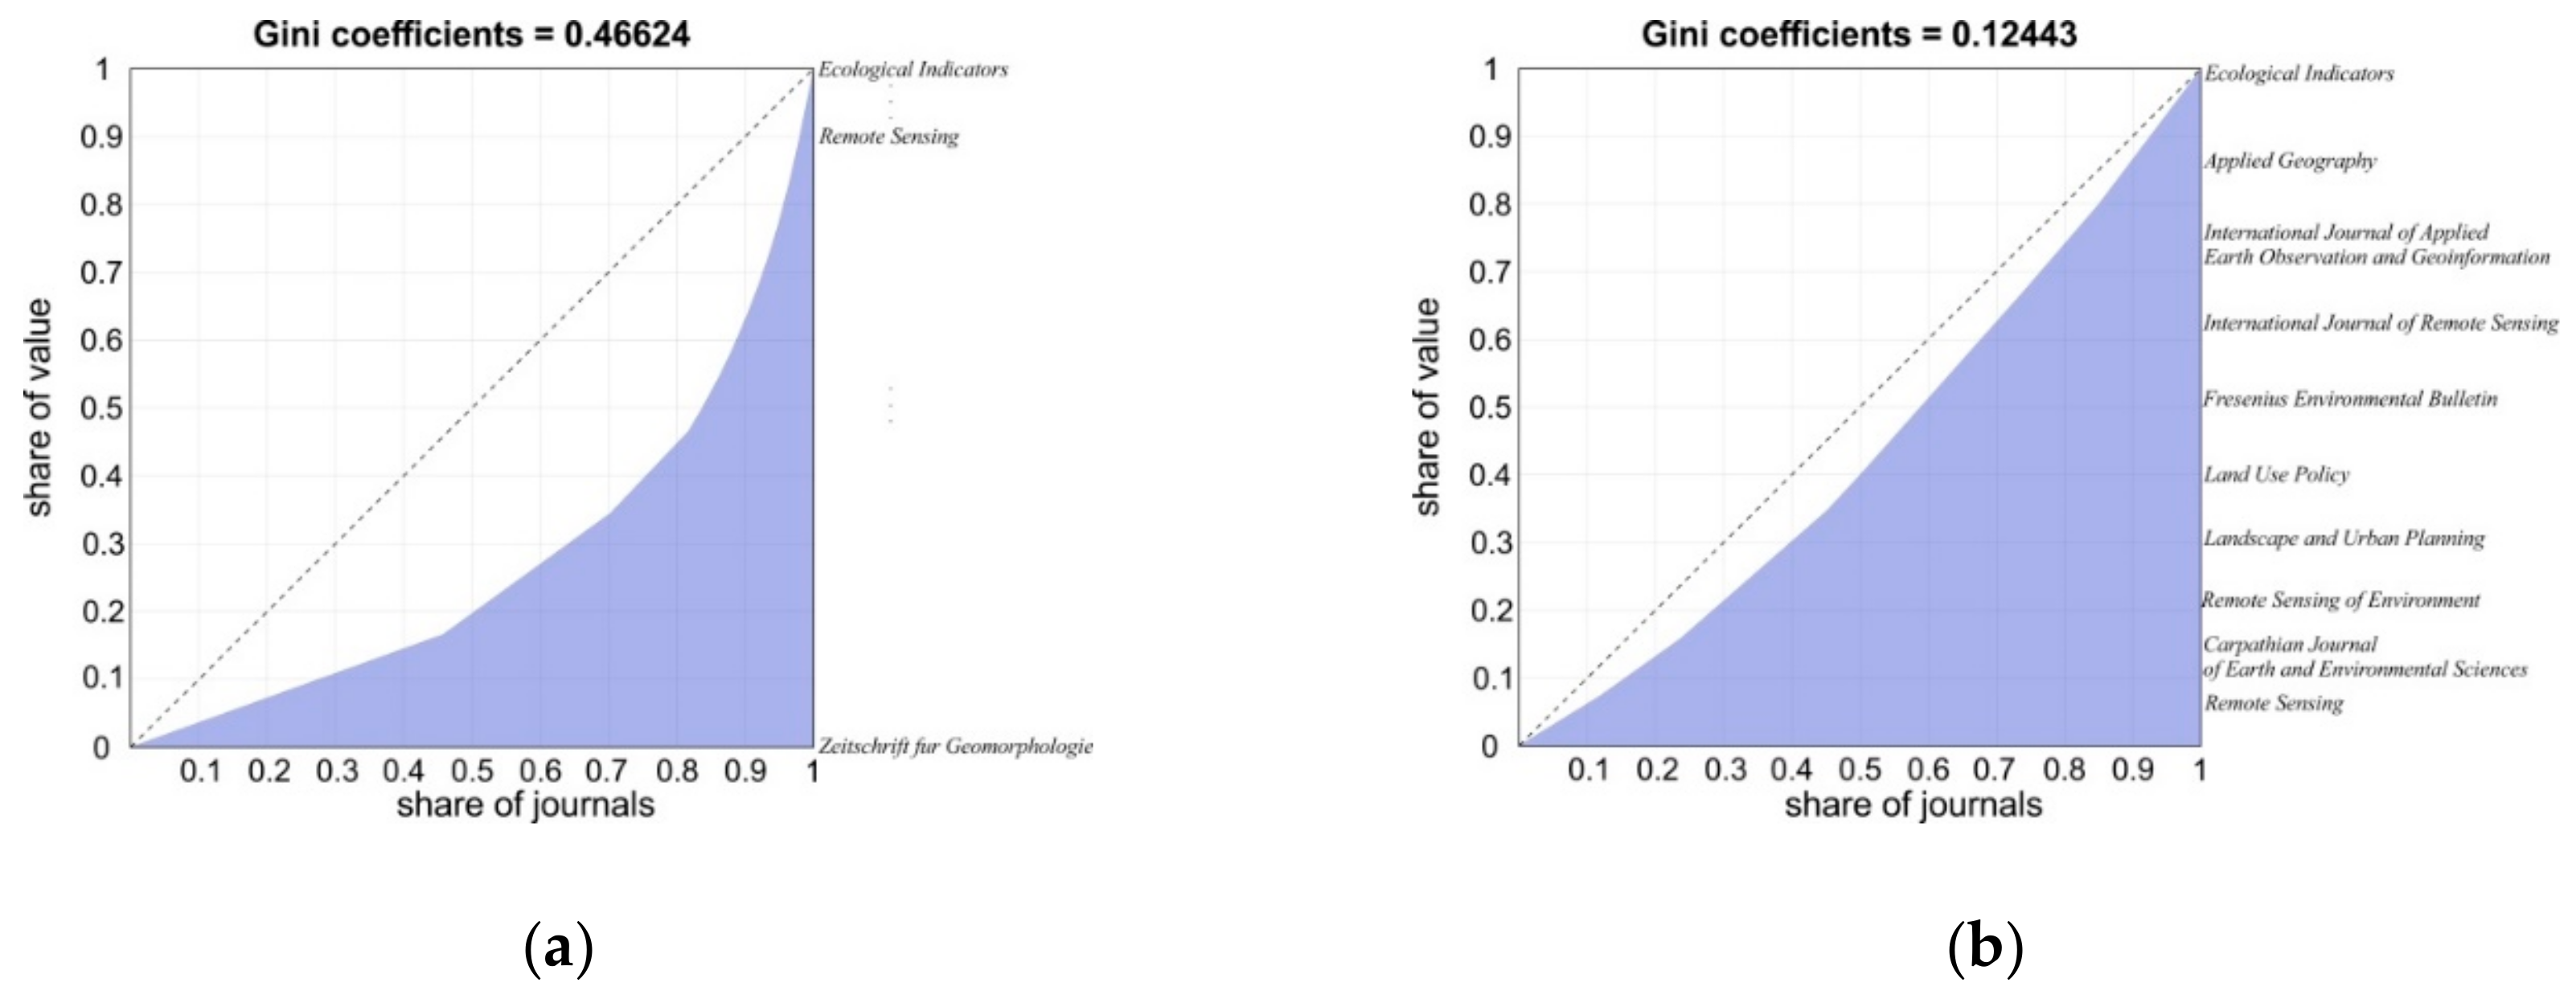
Global research dealing with CLC data span over 335 scientific journals and nearly 170 conferences, grouped in 102 Web of Science research categories, which accounts for 29.1% of all research areas. As many as 25.7% of authors declared that their publications are related to environmental sciences, 22.1% to remote sensing, and 14.0% to interdisciplinary geosciences. The GINI coefficient amounts to 0.75, which stressed the high dispersion of research areas where papers on CLC are published. Consequently, high inequality is observed when analysis of research papers spread among scientific journals and conferences is done. At least 22.2% of 873 output papers have been published in the 10 top journals (see Table 3) and as many as 3.5% in conference materials (i.e., proceedings, book chapters, etc.) (see Table 4). The discrepancy of publication sources of CLC papers is clearly visible in Figure 3a and underlined by GINI coefficient amounts to 0.47 for all analyzed journals. Nevertheless, the GINI coefficient of the top 10 journals decreases to 0.12, showing a relatively small dispersion in the number of papers (Figure 3b).
Ecological Indicators published the highest number of articles, but only 22 of which were pertaining to CORINE land cover, constituting just 3% of the total output. The journal ranks 49th out of 242 (Q1-first quartile) in WoS category Environmental Sciences. It is followed by Applied Geography (17 papers; 2%), International Journal of Applied Earth Observation and Geoinformation (17; 2%), and International Journal of Remote Sensing (17; 2%). On average, the percentage of the top 10 papers on CLC from the journals mentioned above slightly exceeds 1.2%. The most influential journals Remote Sensing of Environment and Landscape and Urban Planning, have a 5-year impact factor of 7.737, and 5.957, respectively. Additionally, the two journals provide highly cited articles with CPP equaling 50.9 and 44.0, respectively.
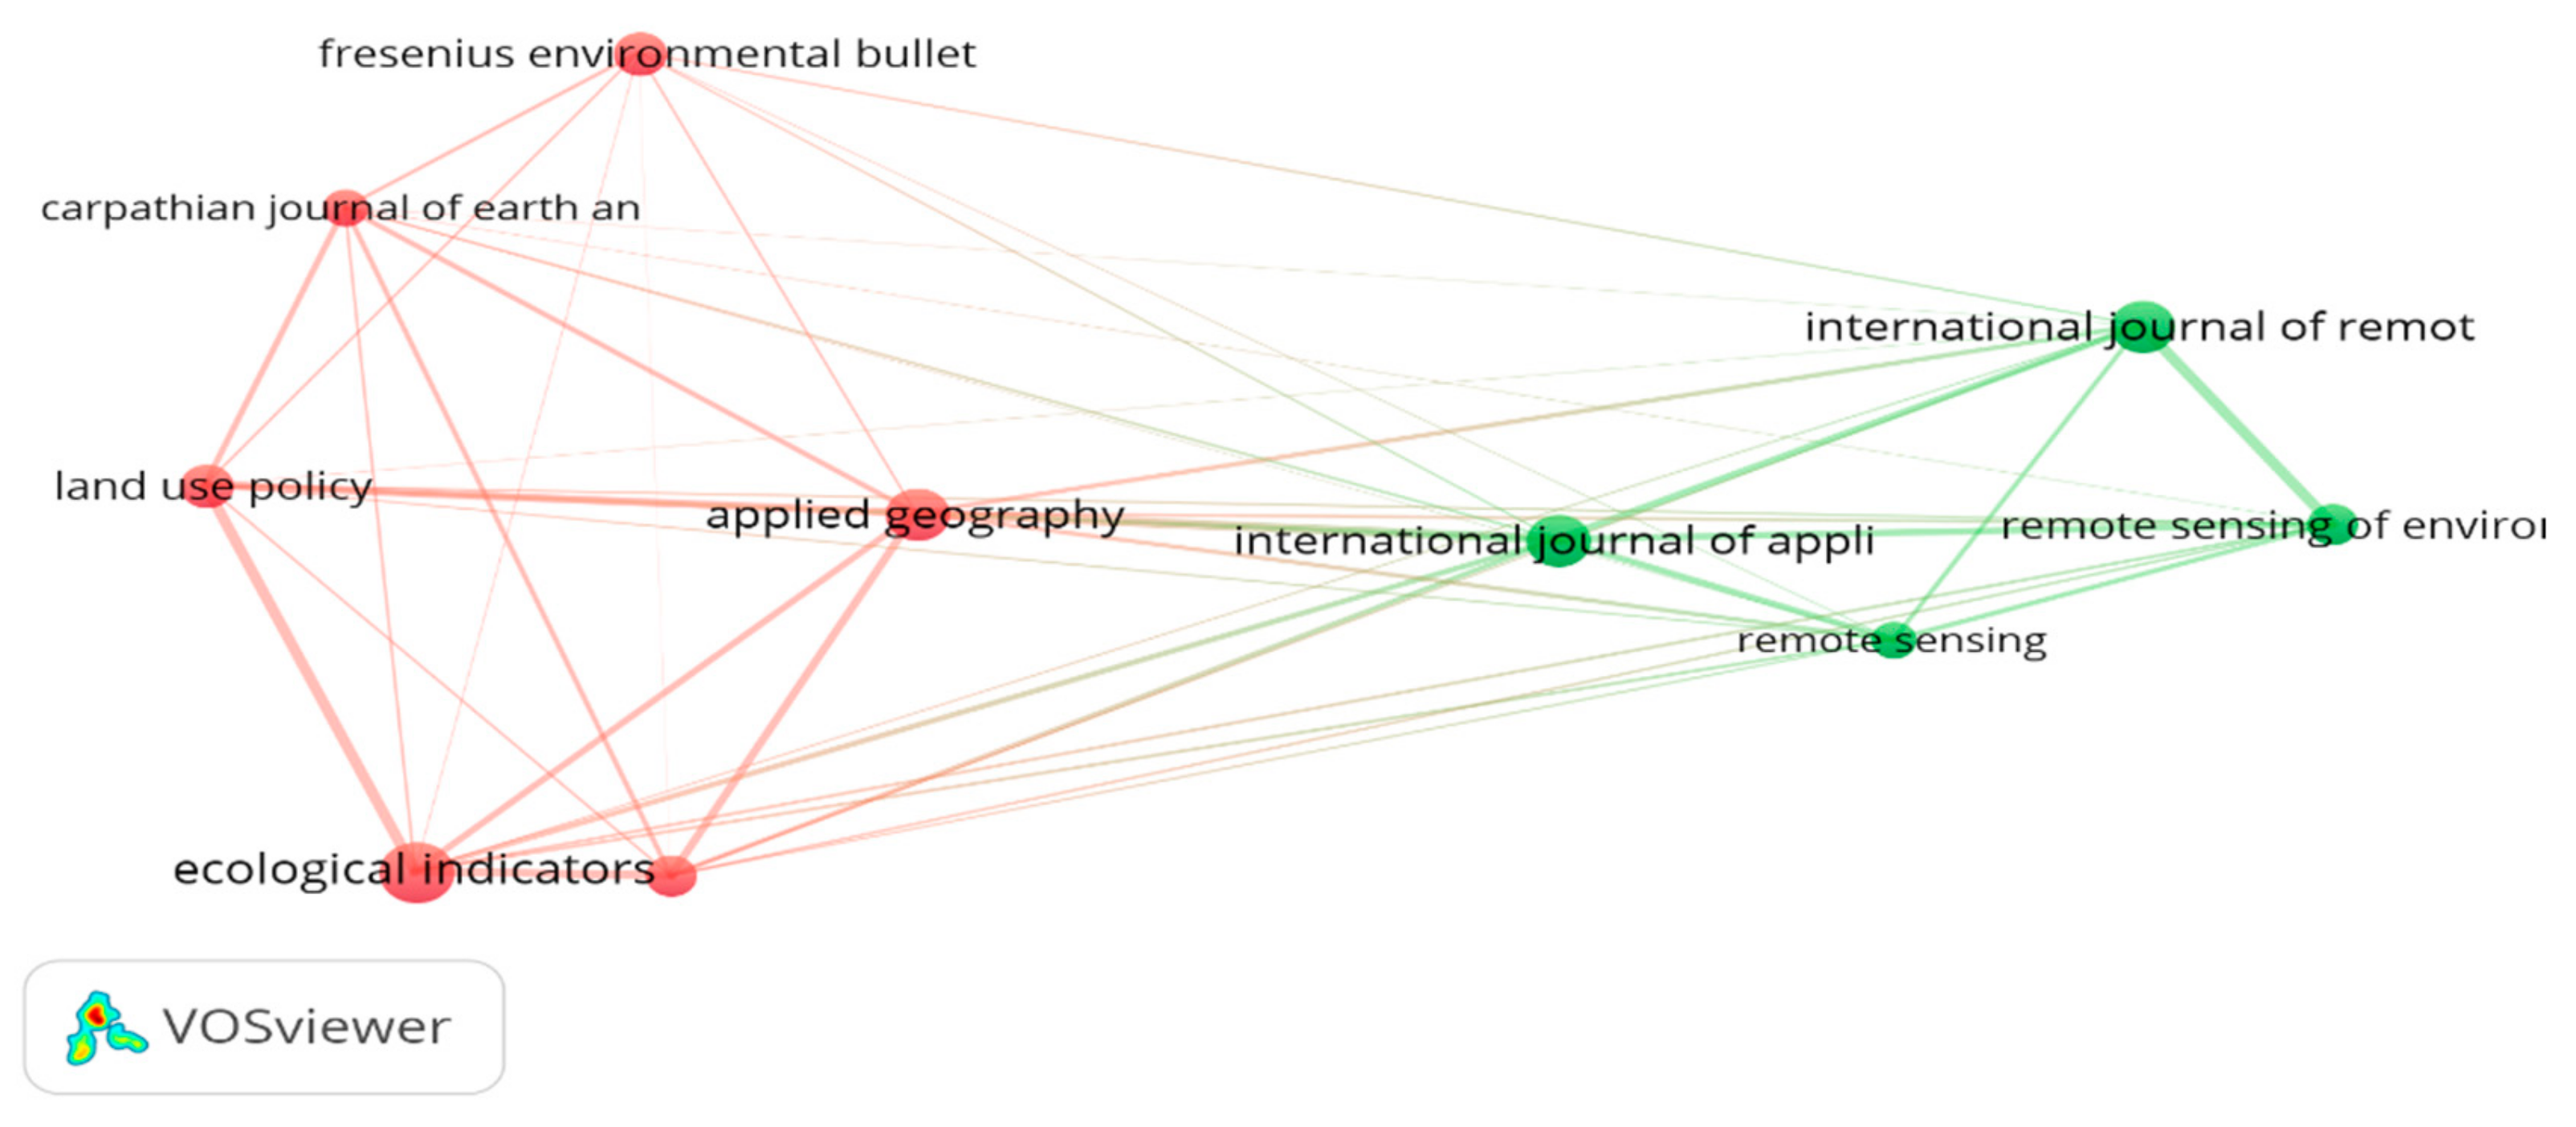
Articles published in the top journals were cited 27.58 times on average, with a considerable influence on further research studies. The journals are bibliographically coupled, which means that articles published make references to the common, previously printed oeuvres, and are grouped in two clusters (Figure 4). The green cluster comprises four journals directly related to remote sensing and published articles stressing those aspects of CORINE land cover that are strongly connected with the interpretation of land cover on satellite imageries. The red cluster gathers five journals with a more diverse scope. Hence, the publications address different types of CLC applications, further discussed in Section 4.
Research works related to CORINE land cover data was presented at 170 international conferences, with the average number of publications equaling 1.39. The highest number of papers, as many as 27, were published by the European Association of Remote Sensing Laboratories (EARSeL) in conferences proceedings or books, followed by the International Society for Optics and Photonics (SPIE) conferences proceedings (see Table 4). Conference papers were cited 943, with the average citation per publication being 4.1. The most-quoted paper (70 citations, 7.0 average citation per year) raises the concept of ecological services in Finland, where the CORINE land cover data is of the utmost importance [45].
3.3. Cooperation of Authors and Organizations
The number of authors who conducted research using CORINE LC data between 1989 and 29th April 2019 amounts to 2683. A vast majority of the authors, 83.4%, published just one paper. Only 10 authors have published six or more papers (see Table 5), and are therefore considered the most productive researchers in the field. Their contribution to CLC publications is 3.47% of the total papers, and they have made outstanding achievements in the field of CORINE land cover applications. Scientific interests of Jan Feranec and Jan Otahel, from the Slovak Academy of Science, are the most authors whose work is most related to the CORINE LC project, as CLC papers account for 65% and 44% of their WoS indexed publications. Moreover, Feranec received the highest citation rate, equaling 18.27. The most significant scientific authority, measured by h-index, belongs to Montanarella L. and Panagos P., both affiliated with the European Commission Joint Research Center (JRC), in Ispra, Italy. However, CLC application research consists of only a small fraction of their total output, amounting to 5% and 8%, correspondingly.
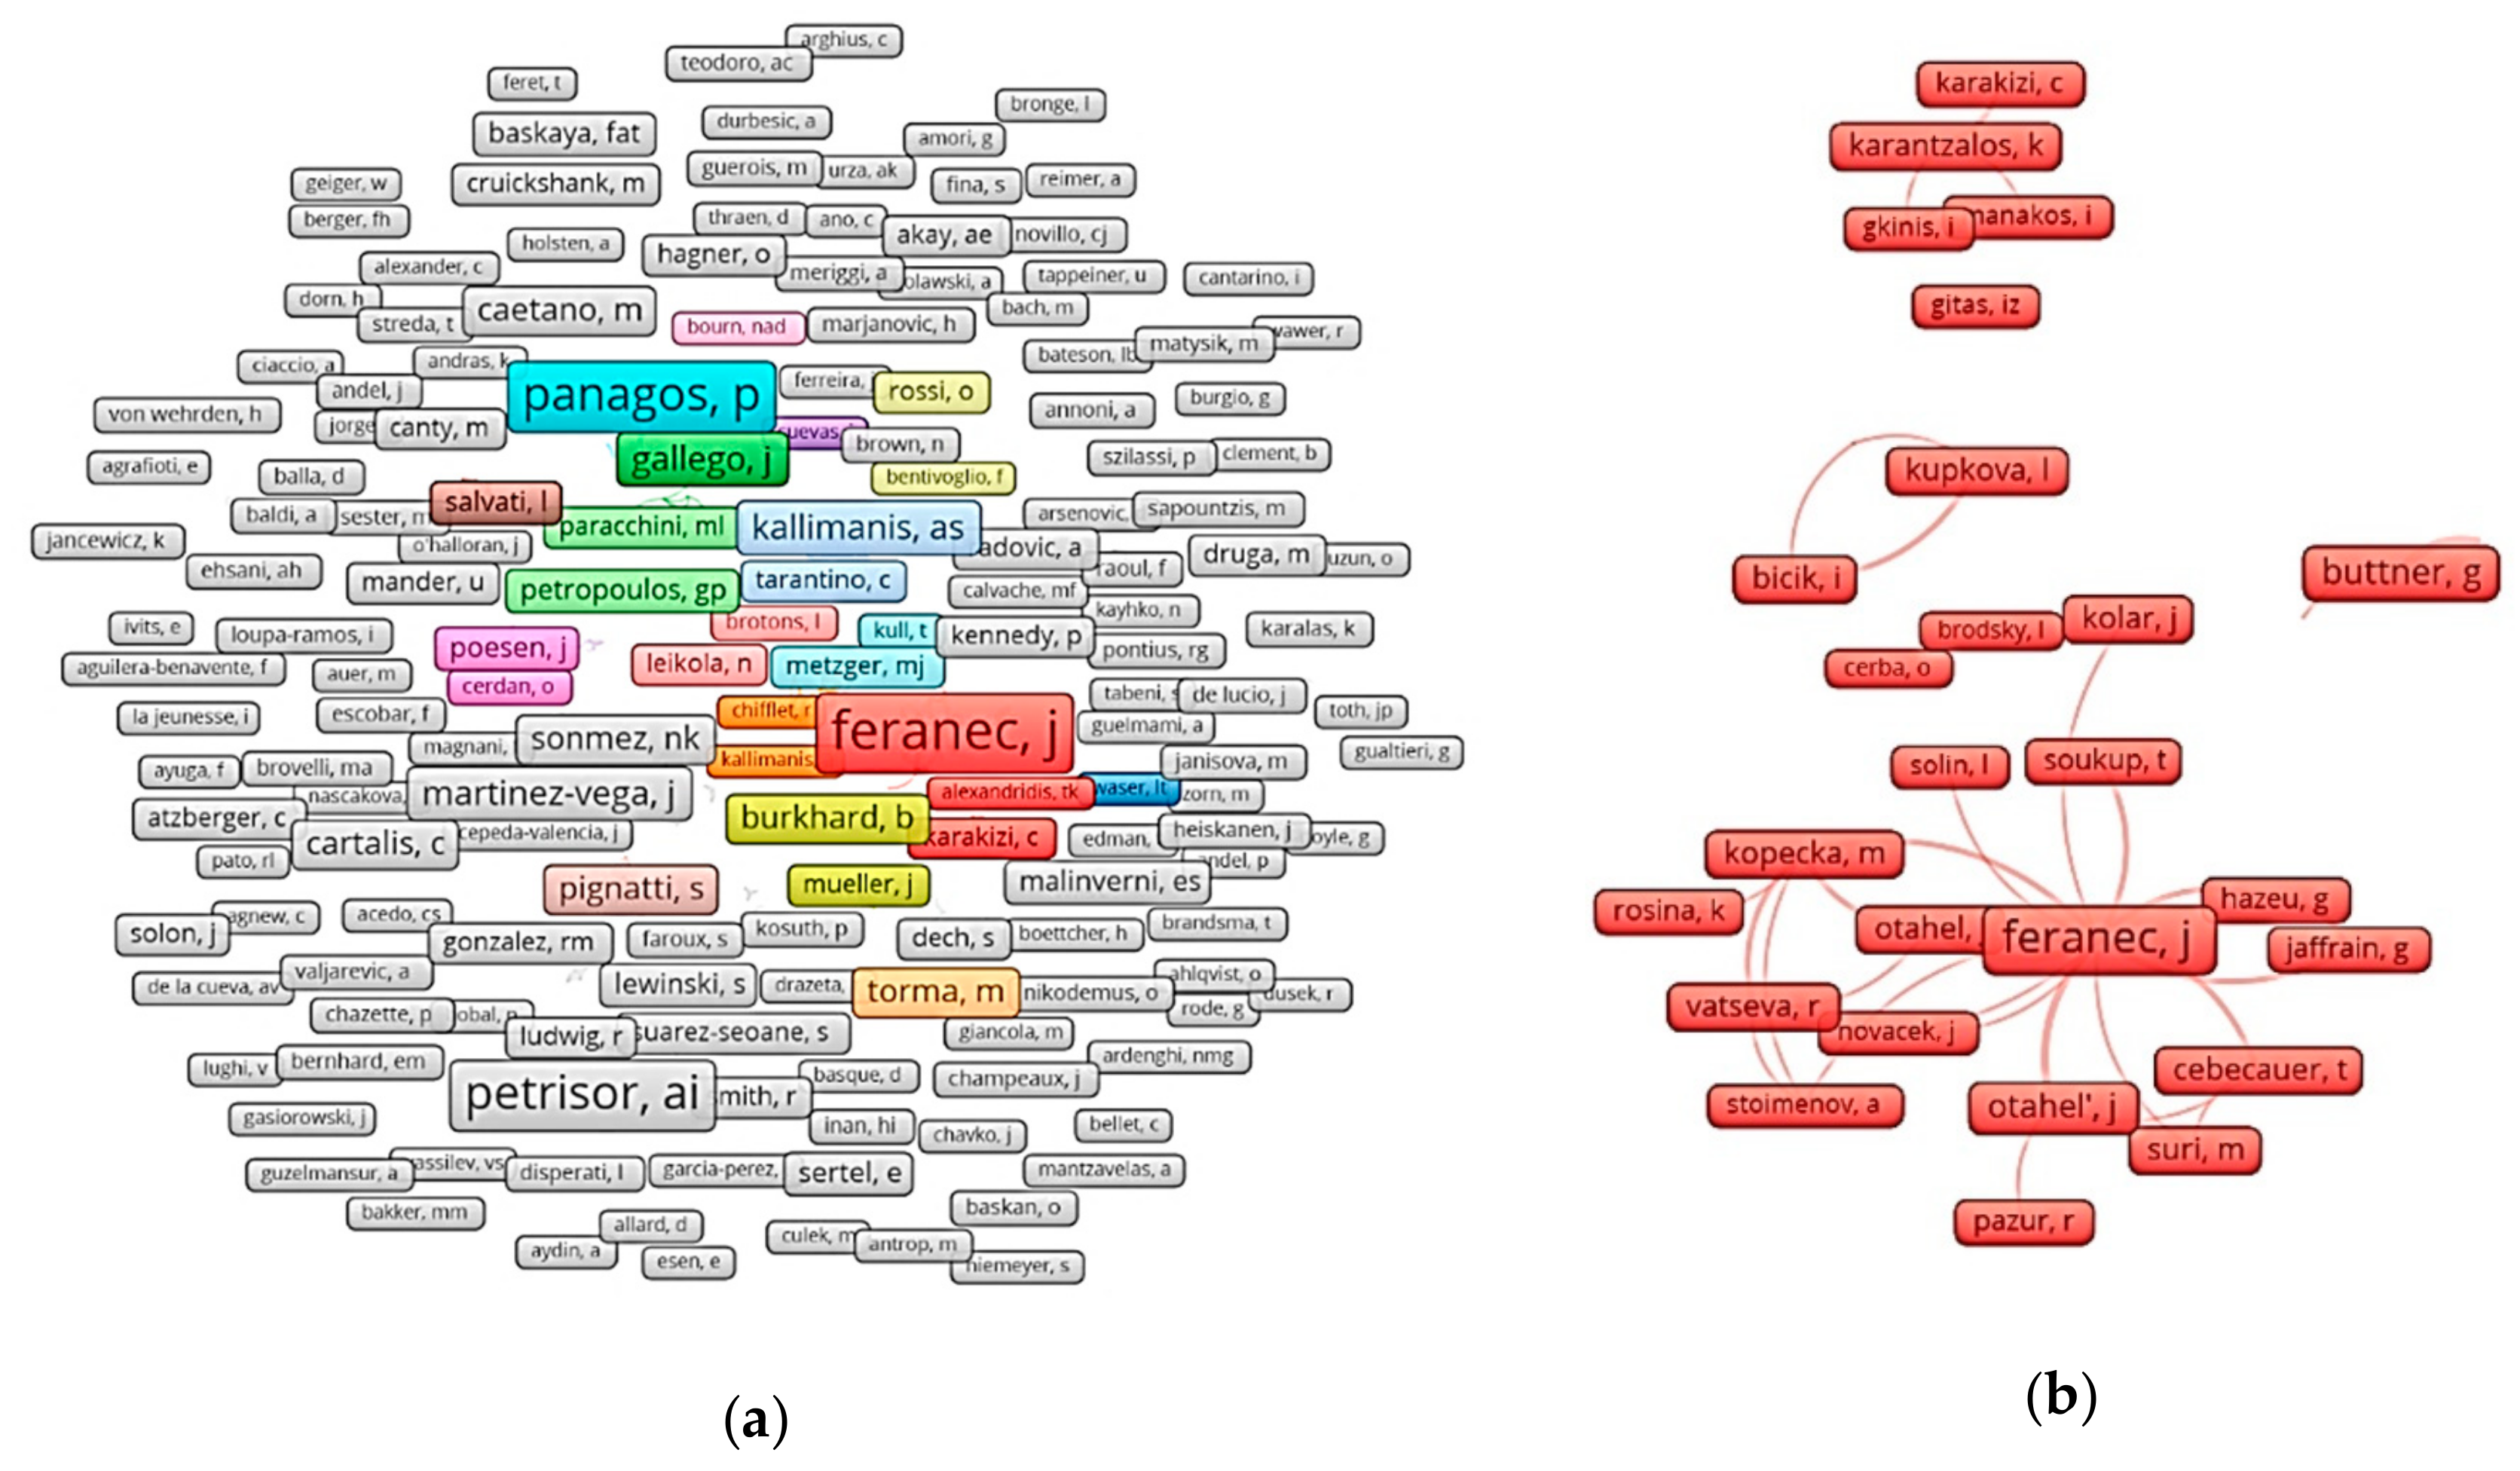
The cooperation of the authors is presented in Figure 6. Scientists dealing with CLC data are grouped in 396 clusters, 31 authors stand alone and did not cooperate with any other researcher. These are the authors who each published exactly one paper on CORINE land cover. 147 publications are the result of a cooperation between only two people, 335 of cooperation between three researchers, usually affiliated with the same institution. Only 25 scientists have cooperated broadly, internationally and nationally, which is highlighted by the frame size (see Figure 5a), their sij index is equal or greater than 25, for five of the authors the total link-strength exceeds 40. The biggest cooperation network is of 54 people, and was formed by Jan Feranec (sij = 48), as seen in Figure 5b. The people he cooperated with are both scientists from the Slovak Academy of Sciences, academics from various European universities and research institutions, as well those from commercial enterprises. Feranec has been involved in the CORINE land cover project from its launch in 1985. He is co-author of CLC nomenclature, from 2001–2009 he joined the Technical Team of central CORINE Land Cover Projects (CLC1990 and CLC2000). His research interests comprise methodology of remote sensing data interpretation, mainly land cover/use and its change mapping, landscape assessment, identification, and analysis of abandonment arable lands and grasslands.
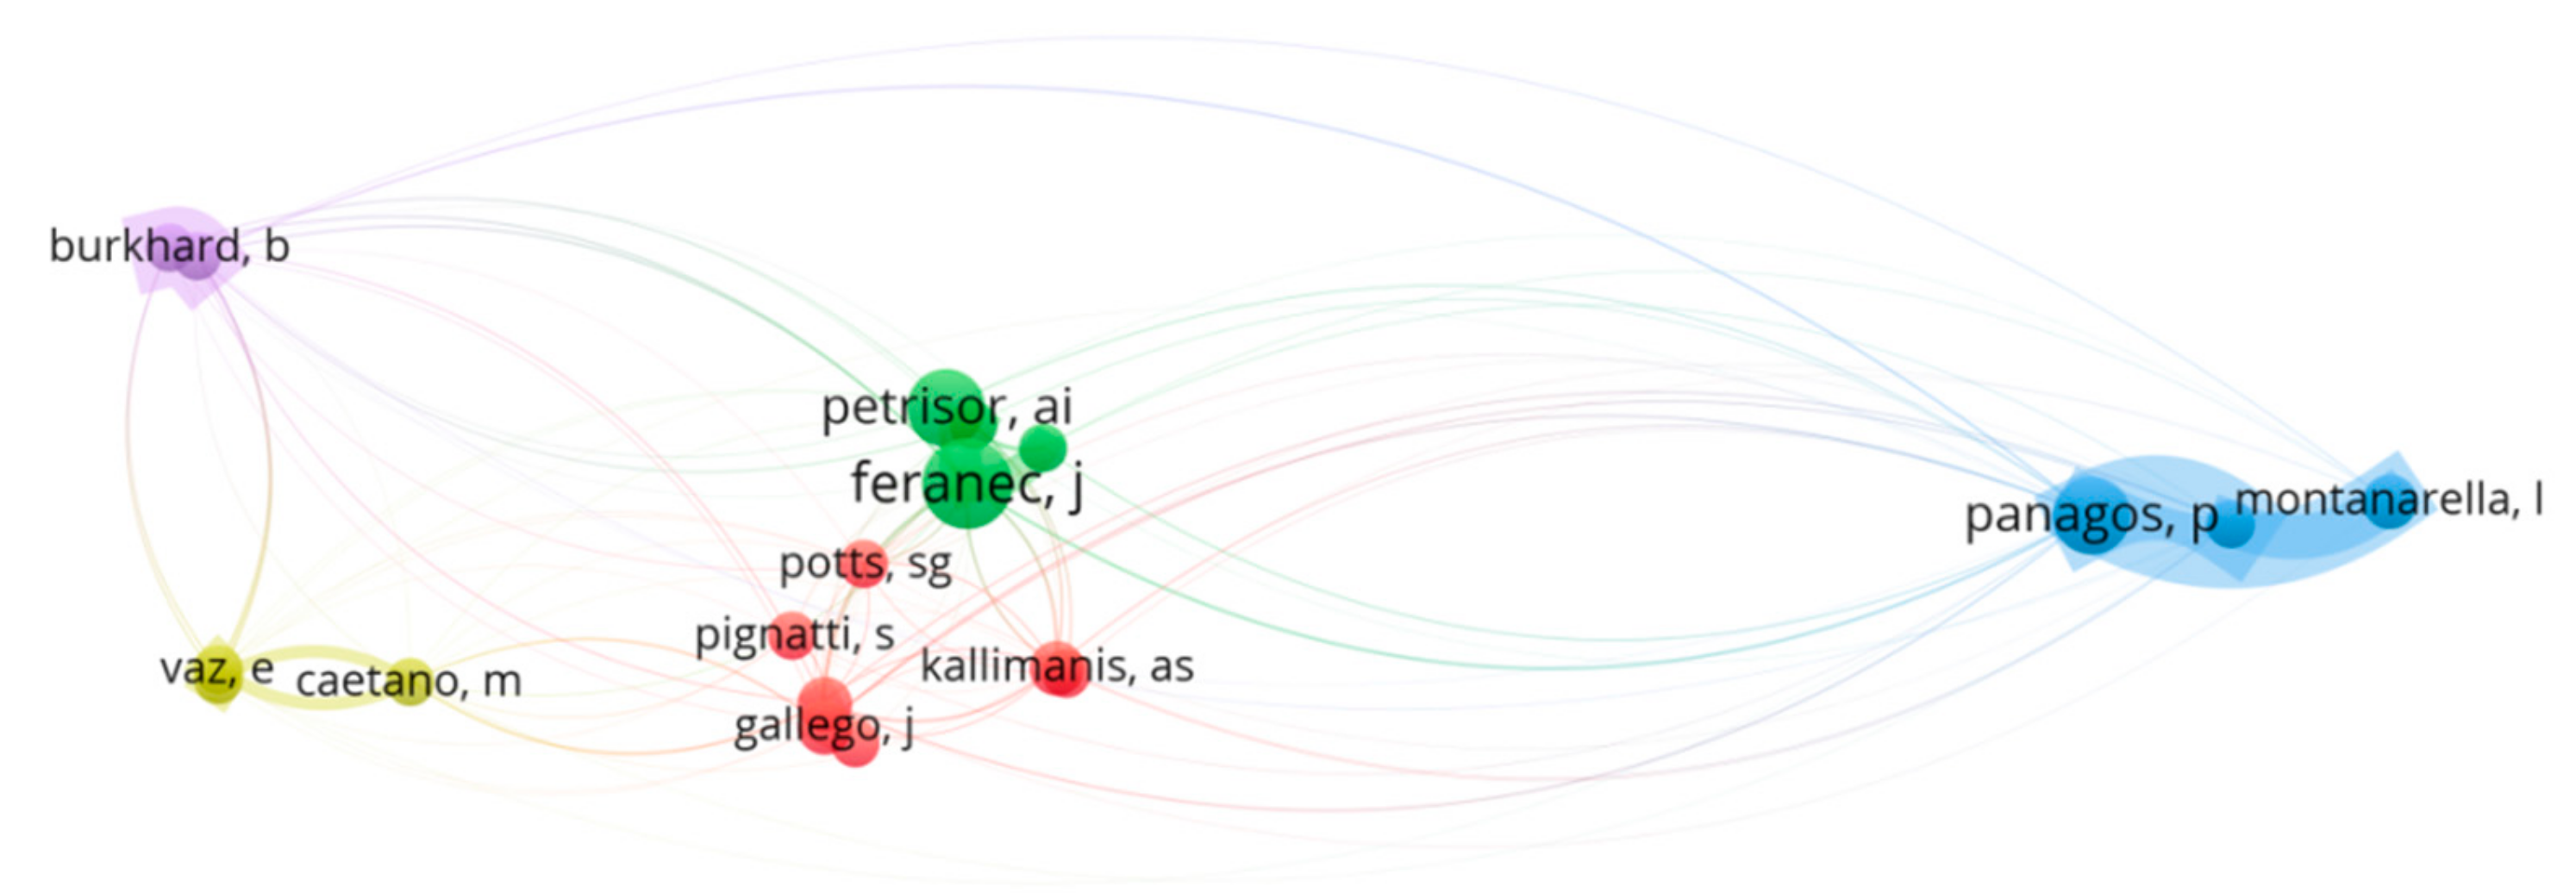
The similarities in the thematic scope of CLC research application are underlined by the bibliographic coupling of authors (Figure 6), which assumes that the more references two authors have in common in their oeuvres, the more similar their research is. Five clusters of scientists working with CORINE LC data are distinguished among those that published five or more papers and were cited at least 10 times each. The green cluster is led by Feranec, and comprises research working on land cover and landscape mapping, namely the dynamics, diversity, fragmentation, and connectivity. Similar scientific research is represented by people belonging to the yellow cluster. This group, however, is limited to research on Mediterranean regions (e.g., Mario Caetano from Portuguese Geographic Institute). The blue cluster groups those whose research pertained to soil erosion, the red cluster emphasizes the remote sources of land cover mapping, while research in the violet cluster is focused on the supply of ecosystem services.
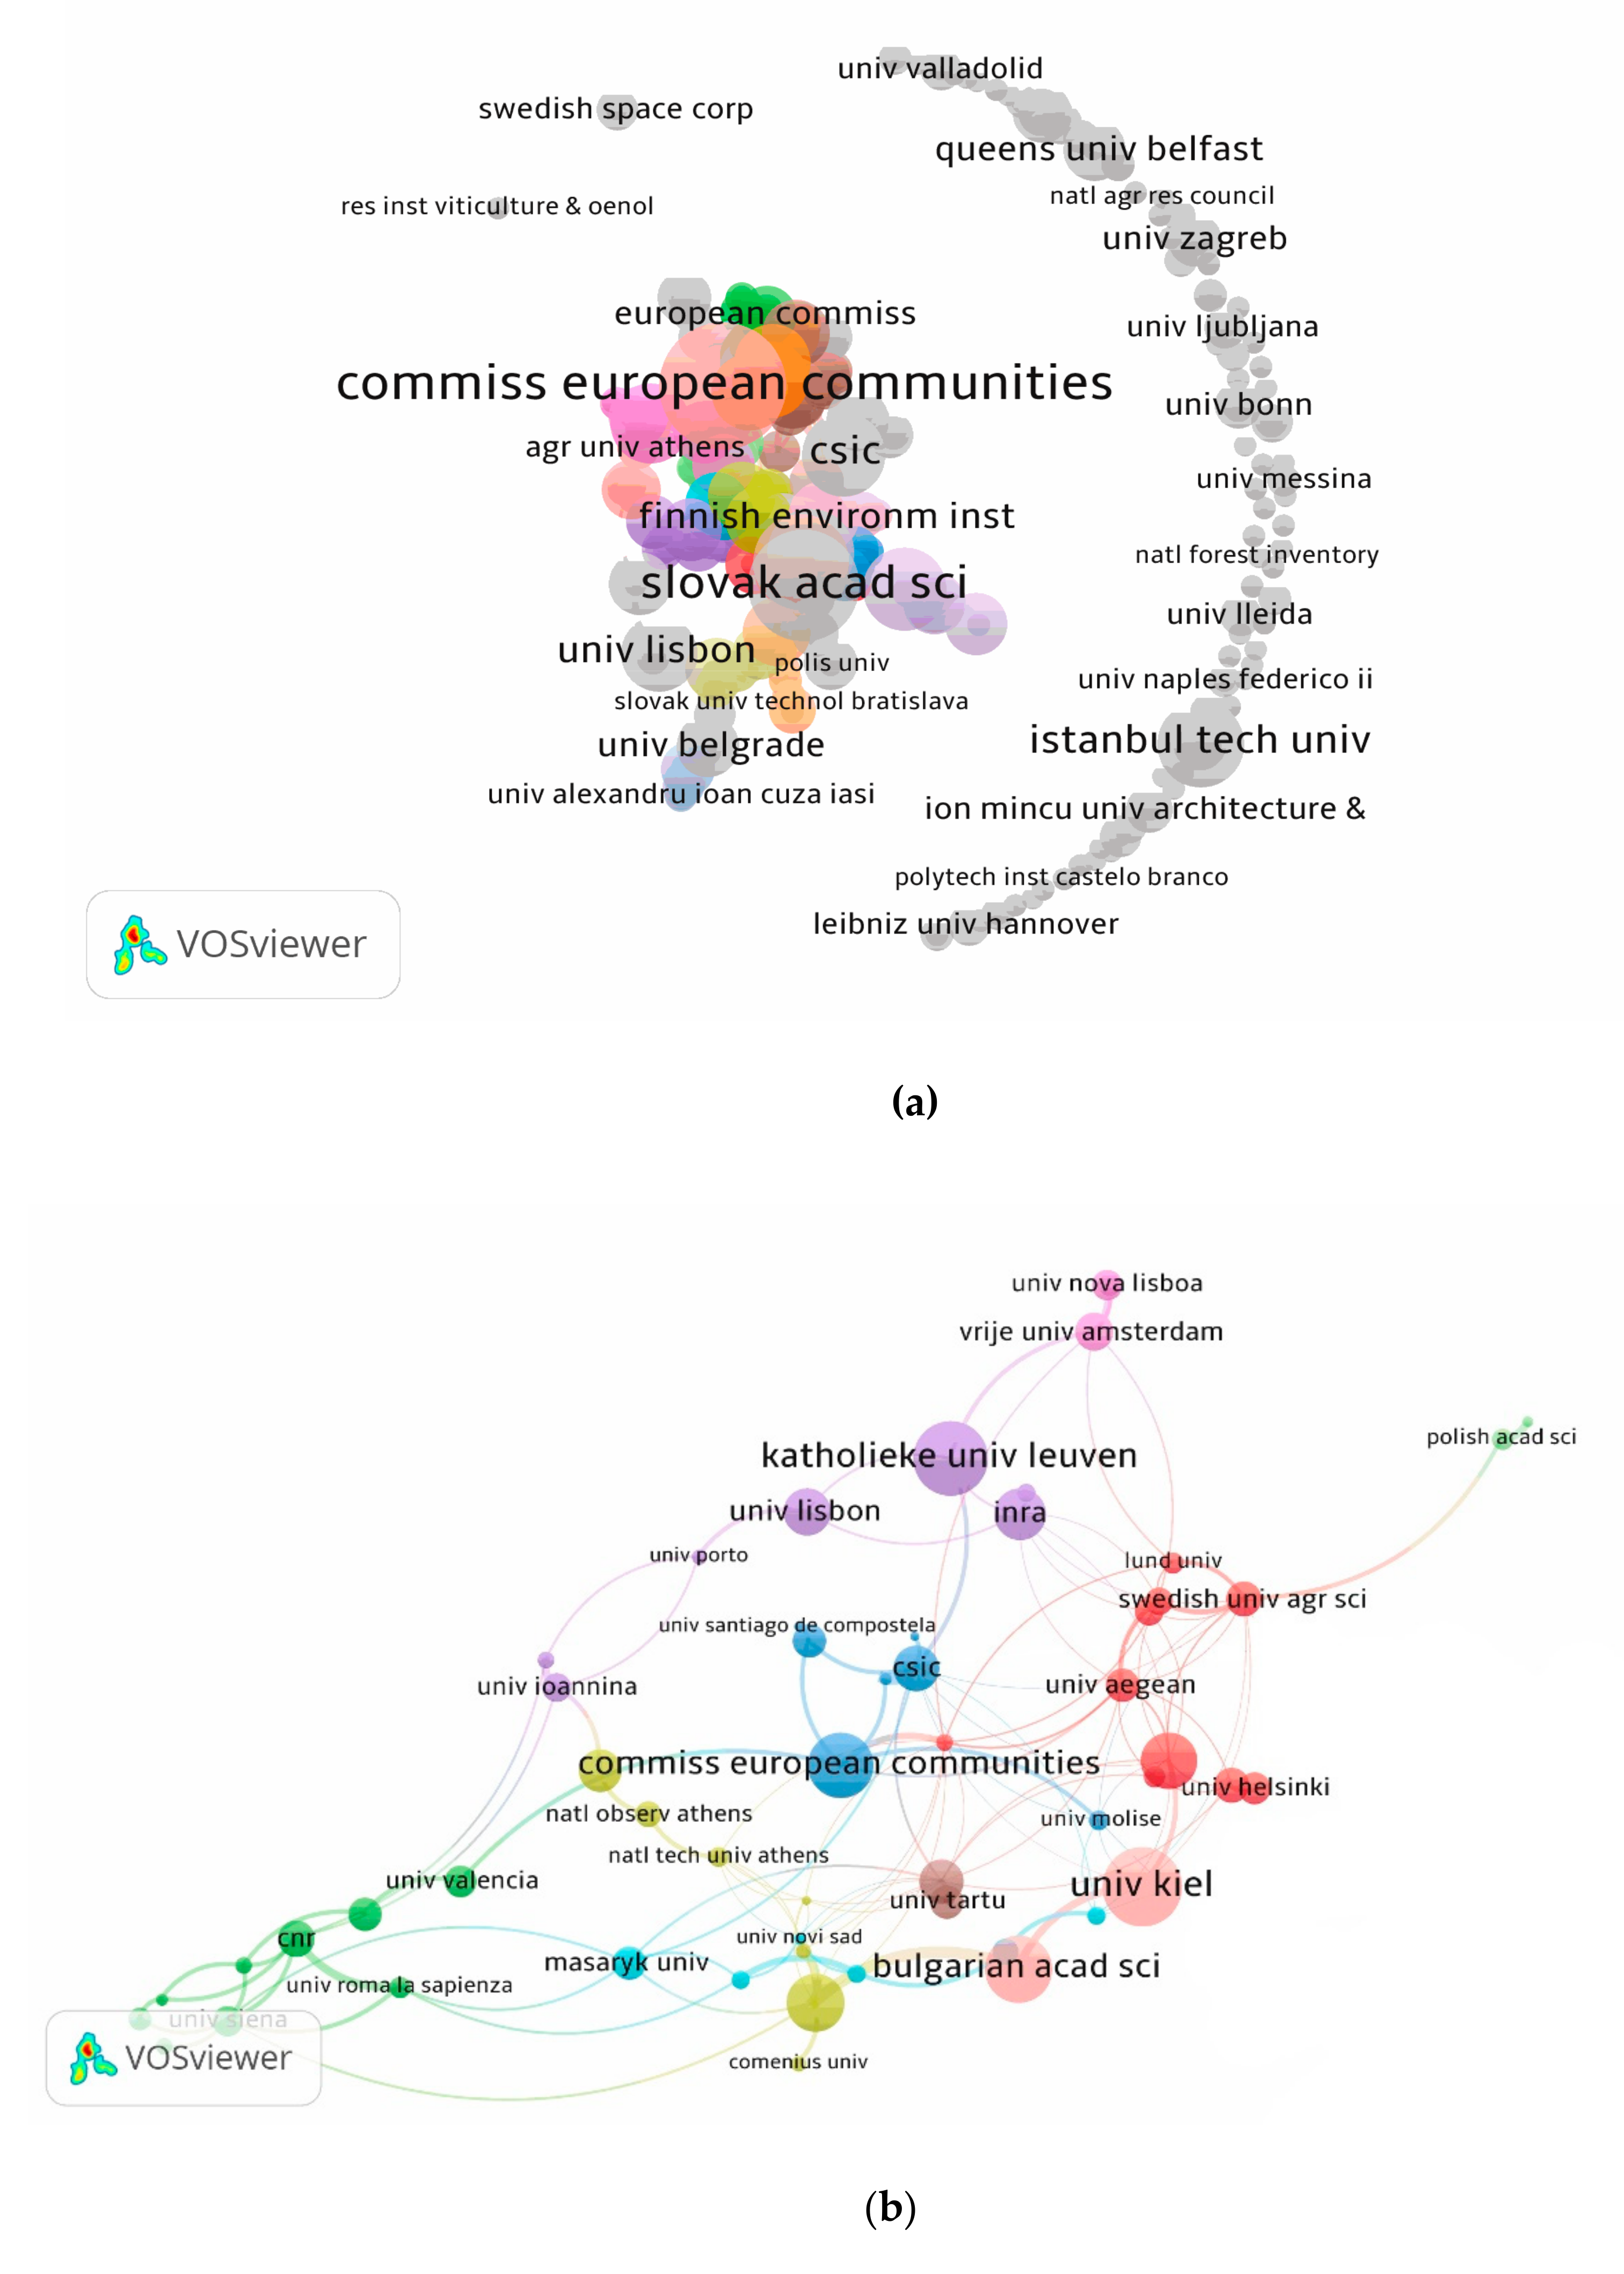
A total of 896 organizations used the CORINE LC data as part of research studies, out of which 33 conducted neither national nor international cooperation in the field of land cover mapping and analysis, and 266 cooperated with only a single institution, most often from the same country. Moreover, as many as 567 (63.3%) published just one paper, and only 22 research organizations published more than 10 papers. This unequal and clustered distribution is emphasized by GINI index amounts to 0.25, and the coefficient equaling 2.14. Scientists from European Commission Joint Research Center in Ispra and the French National Center for Scientific Research (Center National de la Recherche Scientifique, CNRS), the largest governmental research organization in France, the highest number of research papers dealing with the CLC data, amounting to 52 and 27 correspondingly. They are followed by the Helmholtz Association of German Research Centers (25 papers), the Slovak Academy of Science (25 papers), and Italian National Research Council (Consiglio Nazionale Delle Ricerche, CNR) with 21 publications. Each of these research institutions broadly cooperates with many universities and institutes, including non-European countries such as China, Canada, Australia, and the USA. The network of cooperation is presented in Figure 7a. A multitude of filamentous pathways connects clusters of organizations. The power of an organization is designated by the size of the circle and the label.
The distance between clusters is inversely proportional to the strength of bibliographic coupling (the relative frequency of shared references). The closeness of institutions (Figure 7b) indicates their relationship in the terms of citation links, the closer the institutions are, the stronger the cooperation. The most internationally collaborative organization is JRC, followed by the national scientific councils, universities, and research institutes.
3.4. Co-Word Analysis
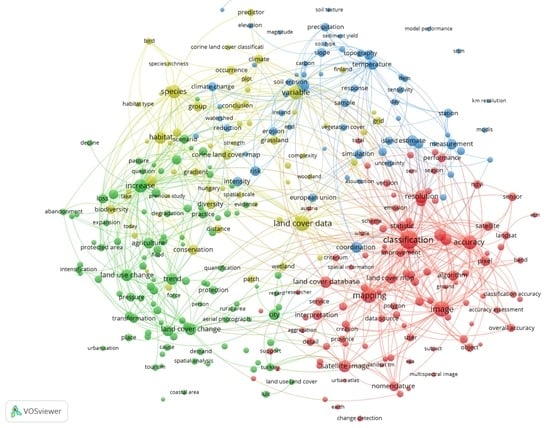
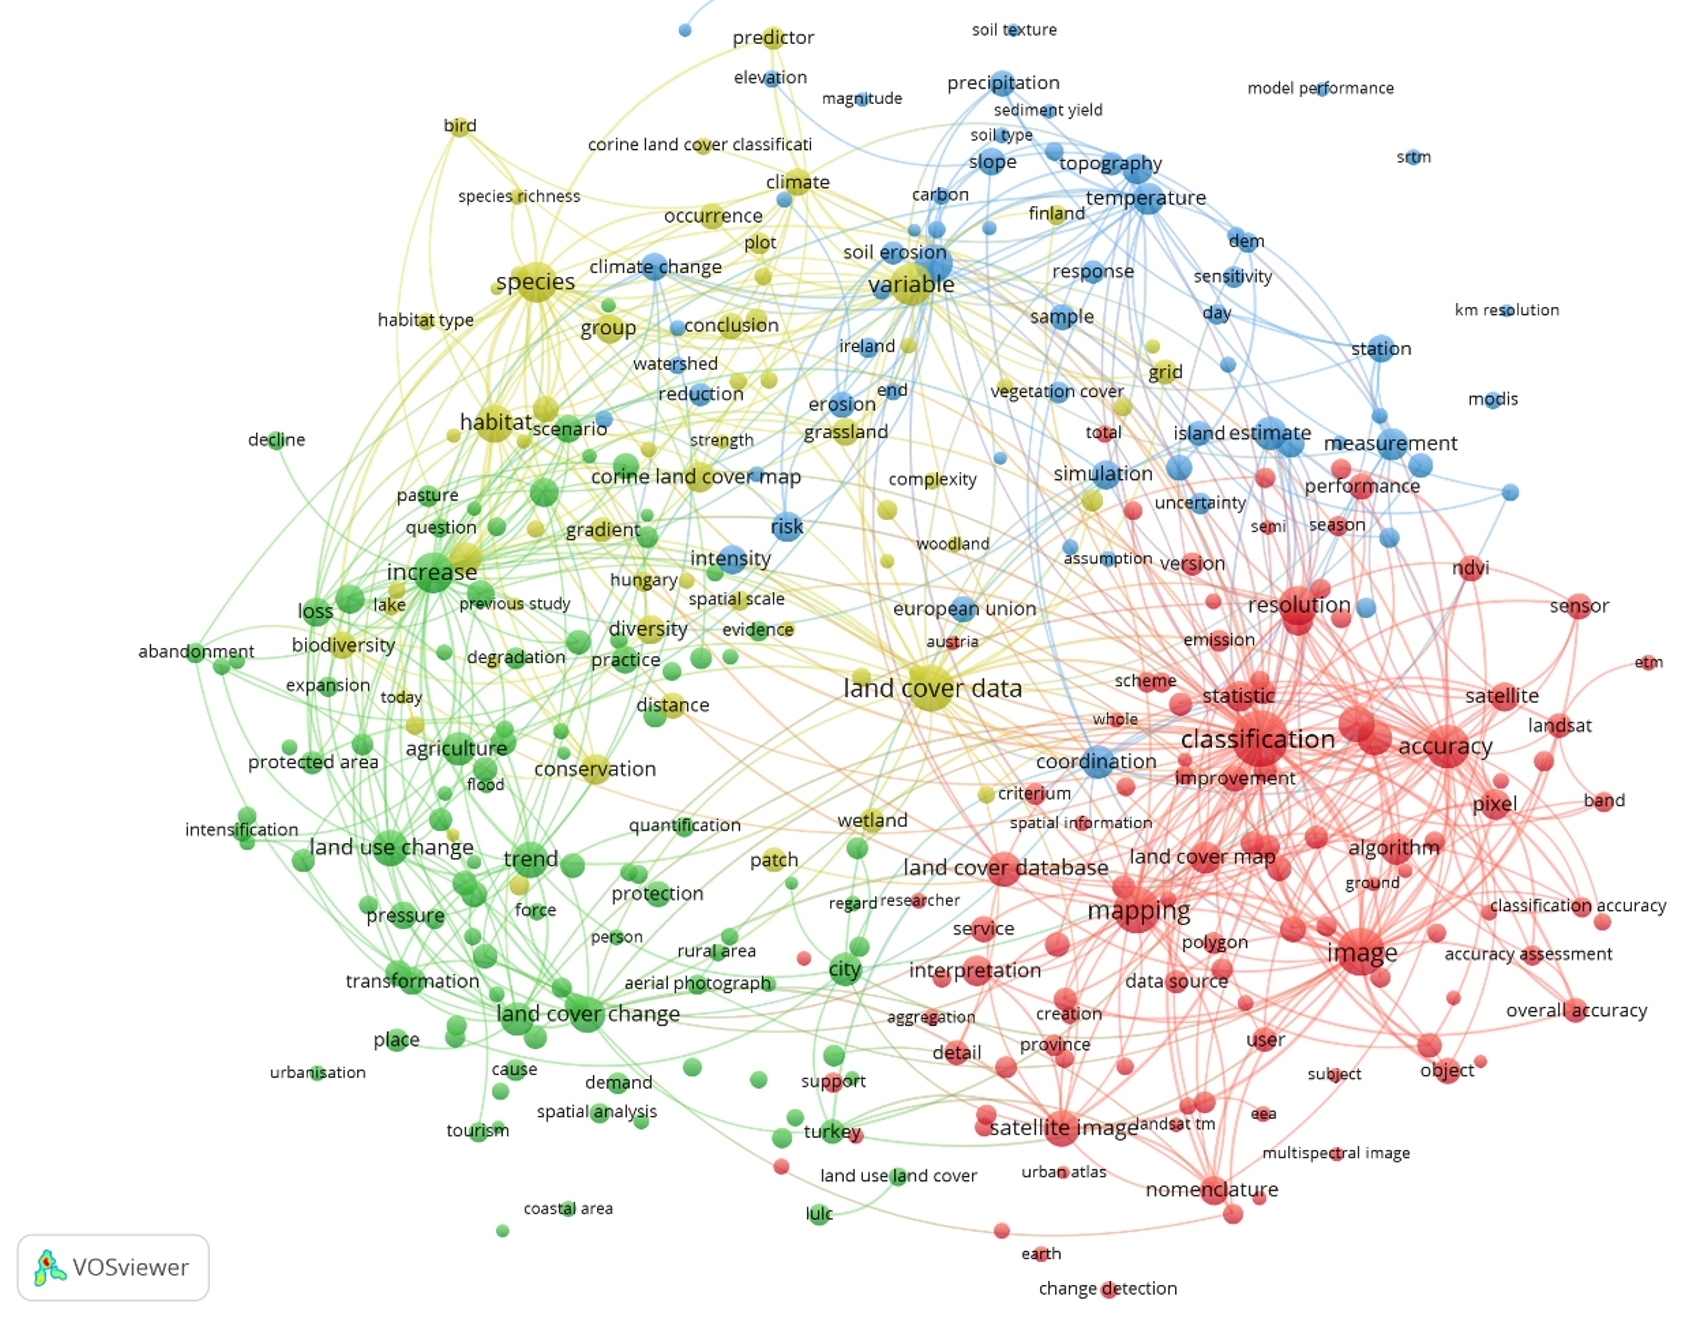
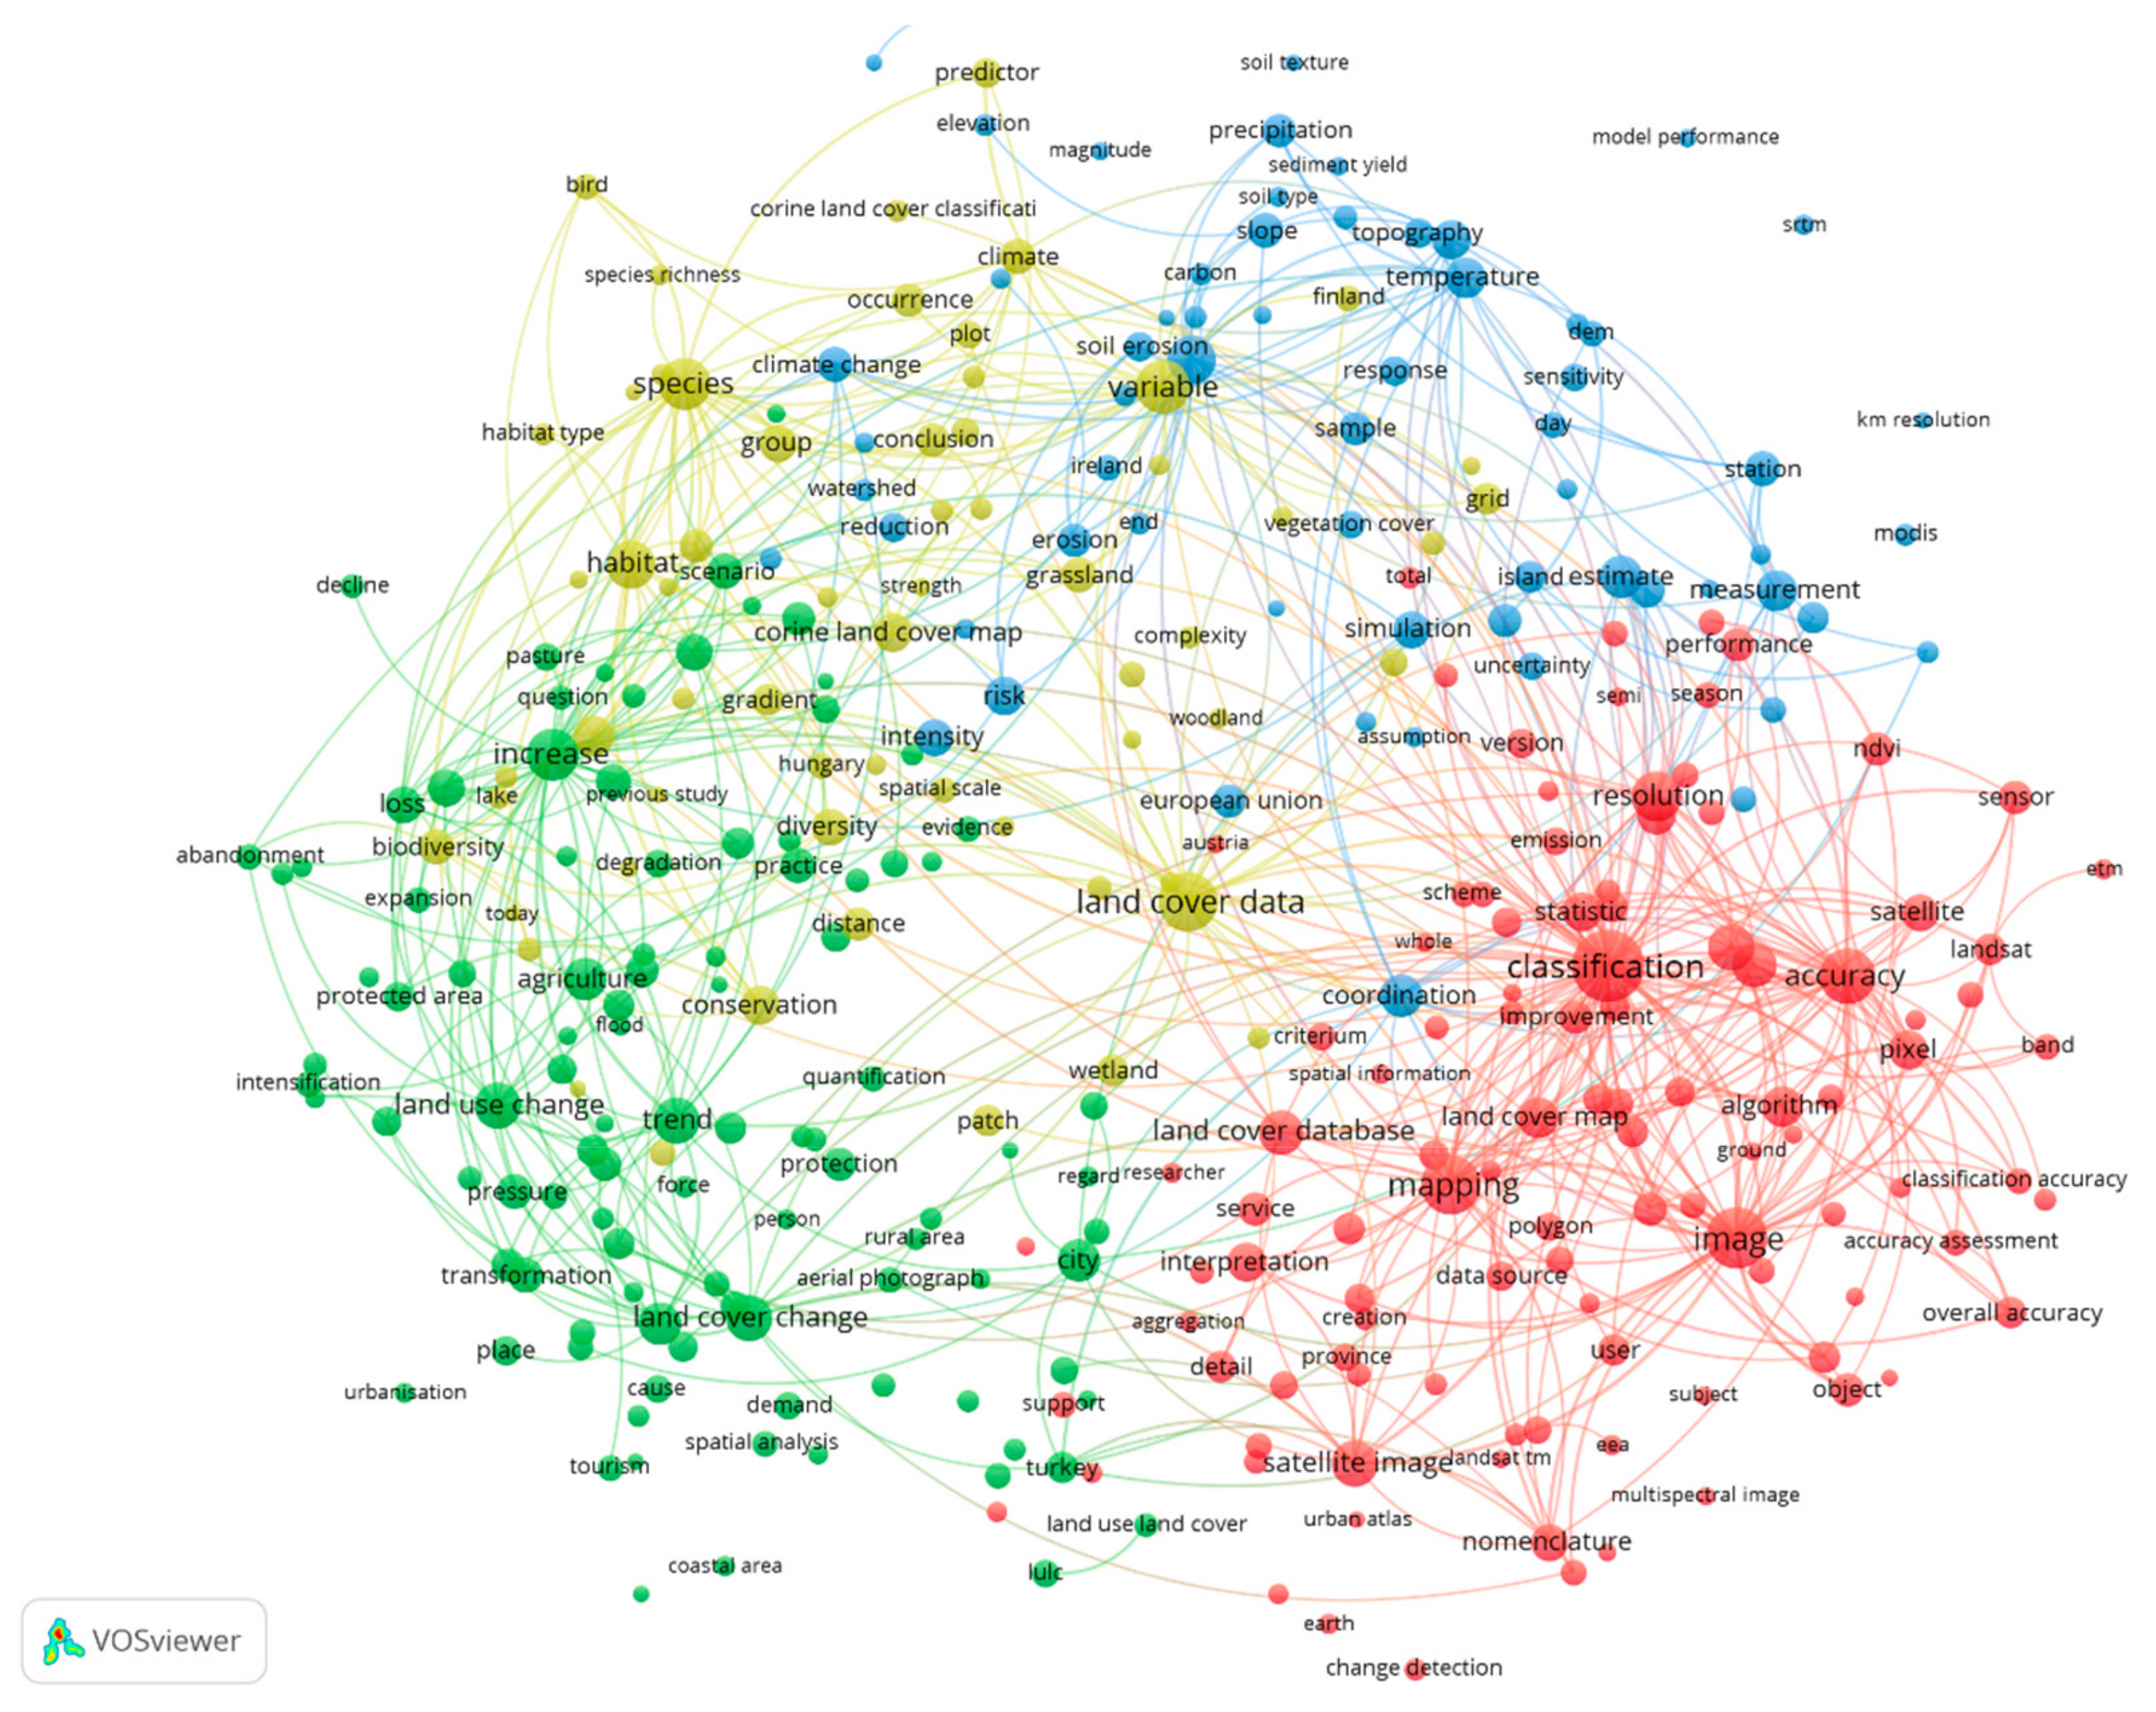
“Classification” is the word that dominates the list of 21,814 terms that were used in the titles and abstracts of the 873 documents. It was used 165 times with 316 total links, and strongly co-coupled (sij = 1891) with such words as: image, mapping, accuracy, spatial resolution, land cover database. Concepts associated with word classification form the red cluster (see Figure 8), which comprises 107 general terms related to the technological and methodological aspect of the CORINE land cover data acquisition, including data accuracy (sij = 1258) and validation (sij = 498). Although these words were used by many researchers, they were prominently observed in publication up until 2011. Words grouped in the green cluster underline the research focused on land cover changes ((sij = 867), land cover trends ((sij = 1918) and their impact on ecosystems and nature (sij = 372). They mainly represent papers published from 2012 until 2014. The yellow cluster includes concepts emphasizing the relatedness of land cover data and habitat types (sij = 209) (spices, birds, vegetation) located in different European regions (e.g., Mediterranean (sij = 169) or Central Europe (sij = 222)). The blue cluster comprises of words (as many as 64) strongly related to advanced geospatial analysis, such as estimation (sij = 665), prediction (sij = 647), simulation (sij = 495), reduction (sij = 451) in the context of climate (sij = 634) and climate change (sij = 554), soil erosion (sij = 375), topography (sij = 386) and its impact on soil loss, precipitation, temperature, and vegetation cover. These words were more prominent in research papers published after 2012.
The analysis of the most frequently used terms in titles and abstracts reveals that until 2000, authors mainly focused on promoting the CORINE land cover project. In 2000, the process of updating the CLC data began, based on the information regarding land cover derived from remote sensing data. Hence, the prominence of such words as: project, CORINE land cover, class, Europe, scale, basis, and order. This also promoted the stress on land cover mapping in Spain, North Ireland and the UK, Greece, Sweden, and Poland. The first application of CLC data labeled a soil erosion problem [46] as a critical hazard, affecting the environment, economic welfare, food security, and public health in European countries. Thus, CLC fulfilled MARS (Monitoring Agricultural ResourceS) project goals conducted by JRC since 1988 [47]. Between 2001 and 2006 the tendency of presenting the CORINE land cover inventories by particular countries was continued, which underlines the increase in the number of words used, i.e., CORINE land cover, project, class. Authors also raised the issue of accuracy and thematic quality of land cover interpretation in satellite imageries.
Moreover, many keywords emphasize the use of the CLC for analysis of forest fragmentation, soil loss, water contamination, and landscape. In the following period from 2007 until 2012, the quality of the interpretation was of high importance, as is was associated with the broadening scope of the CLC data applications including, in additional to the aforementioned: population distribution, land cover changes, urbanization, forest fire monitoring. After 2012, the number of applications for the CORINE data increased significantly. Land cover data was used in advanced, spatial analysis of land cover trends, landscape change, impact on climate, prediction of urban sprawl, biodiversity loss, and ecosystem services. Detailed keyword analysis reveals (Table 6) that most scientists focused their research on agriculture land analysis, especially land cover classification and mapping, land cover structure, and land cover changes. In urban areas, the research mainly concerns the intensification of urbanization. In forested areas, the focus was on the analysis of the structure of the forests, as well as the forest’s changes and threats, such as fire. Overall, the impact of land cover and its changes is thoroughly analyzed in the context of affecting climate, soil, and landscape.
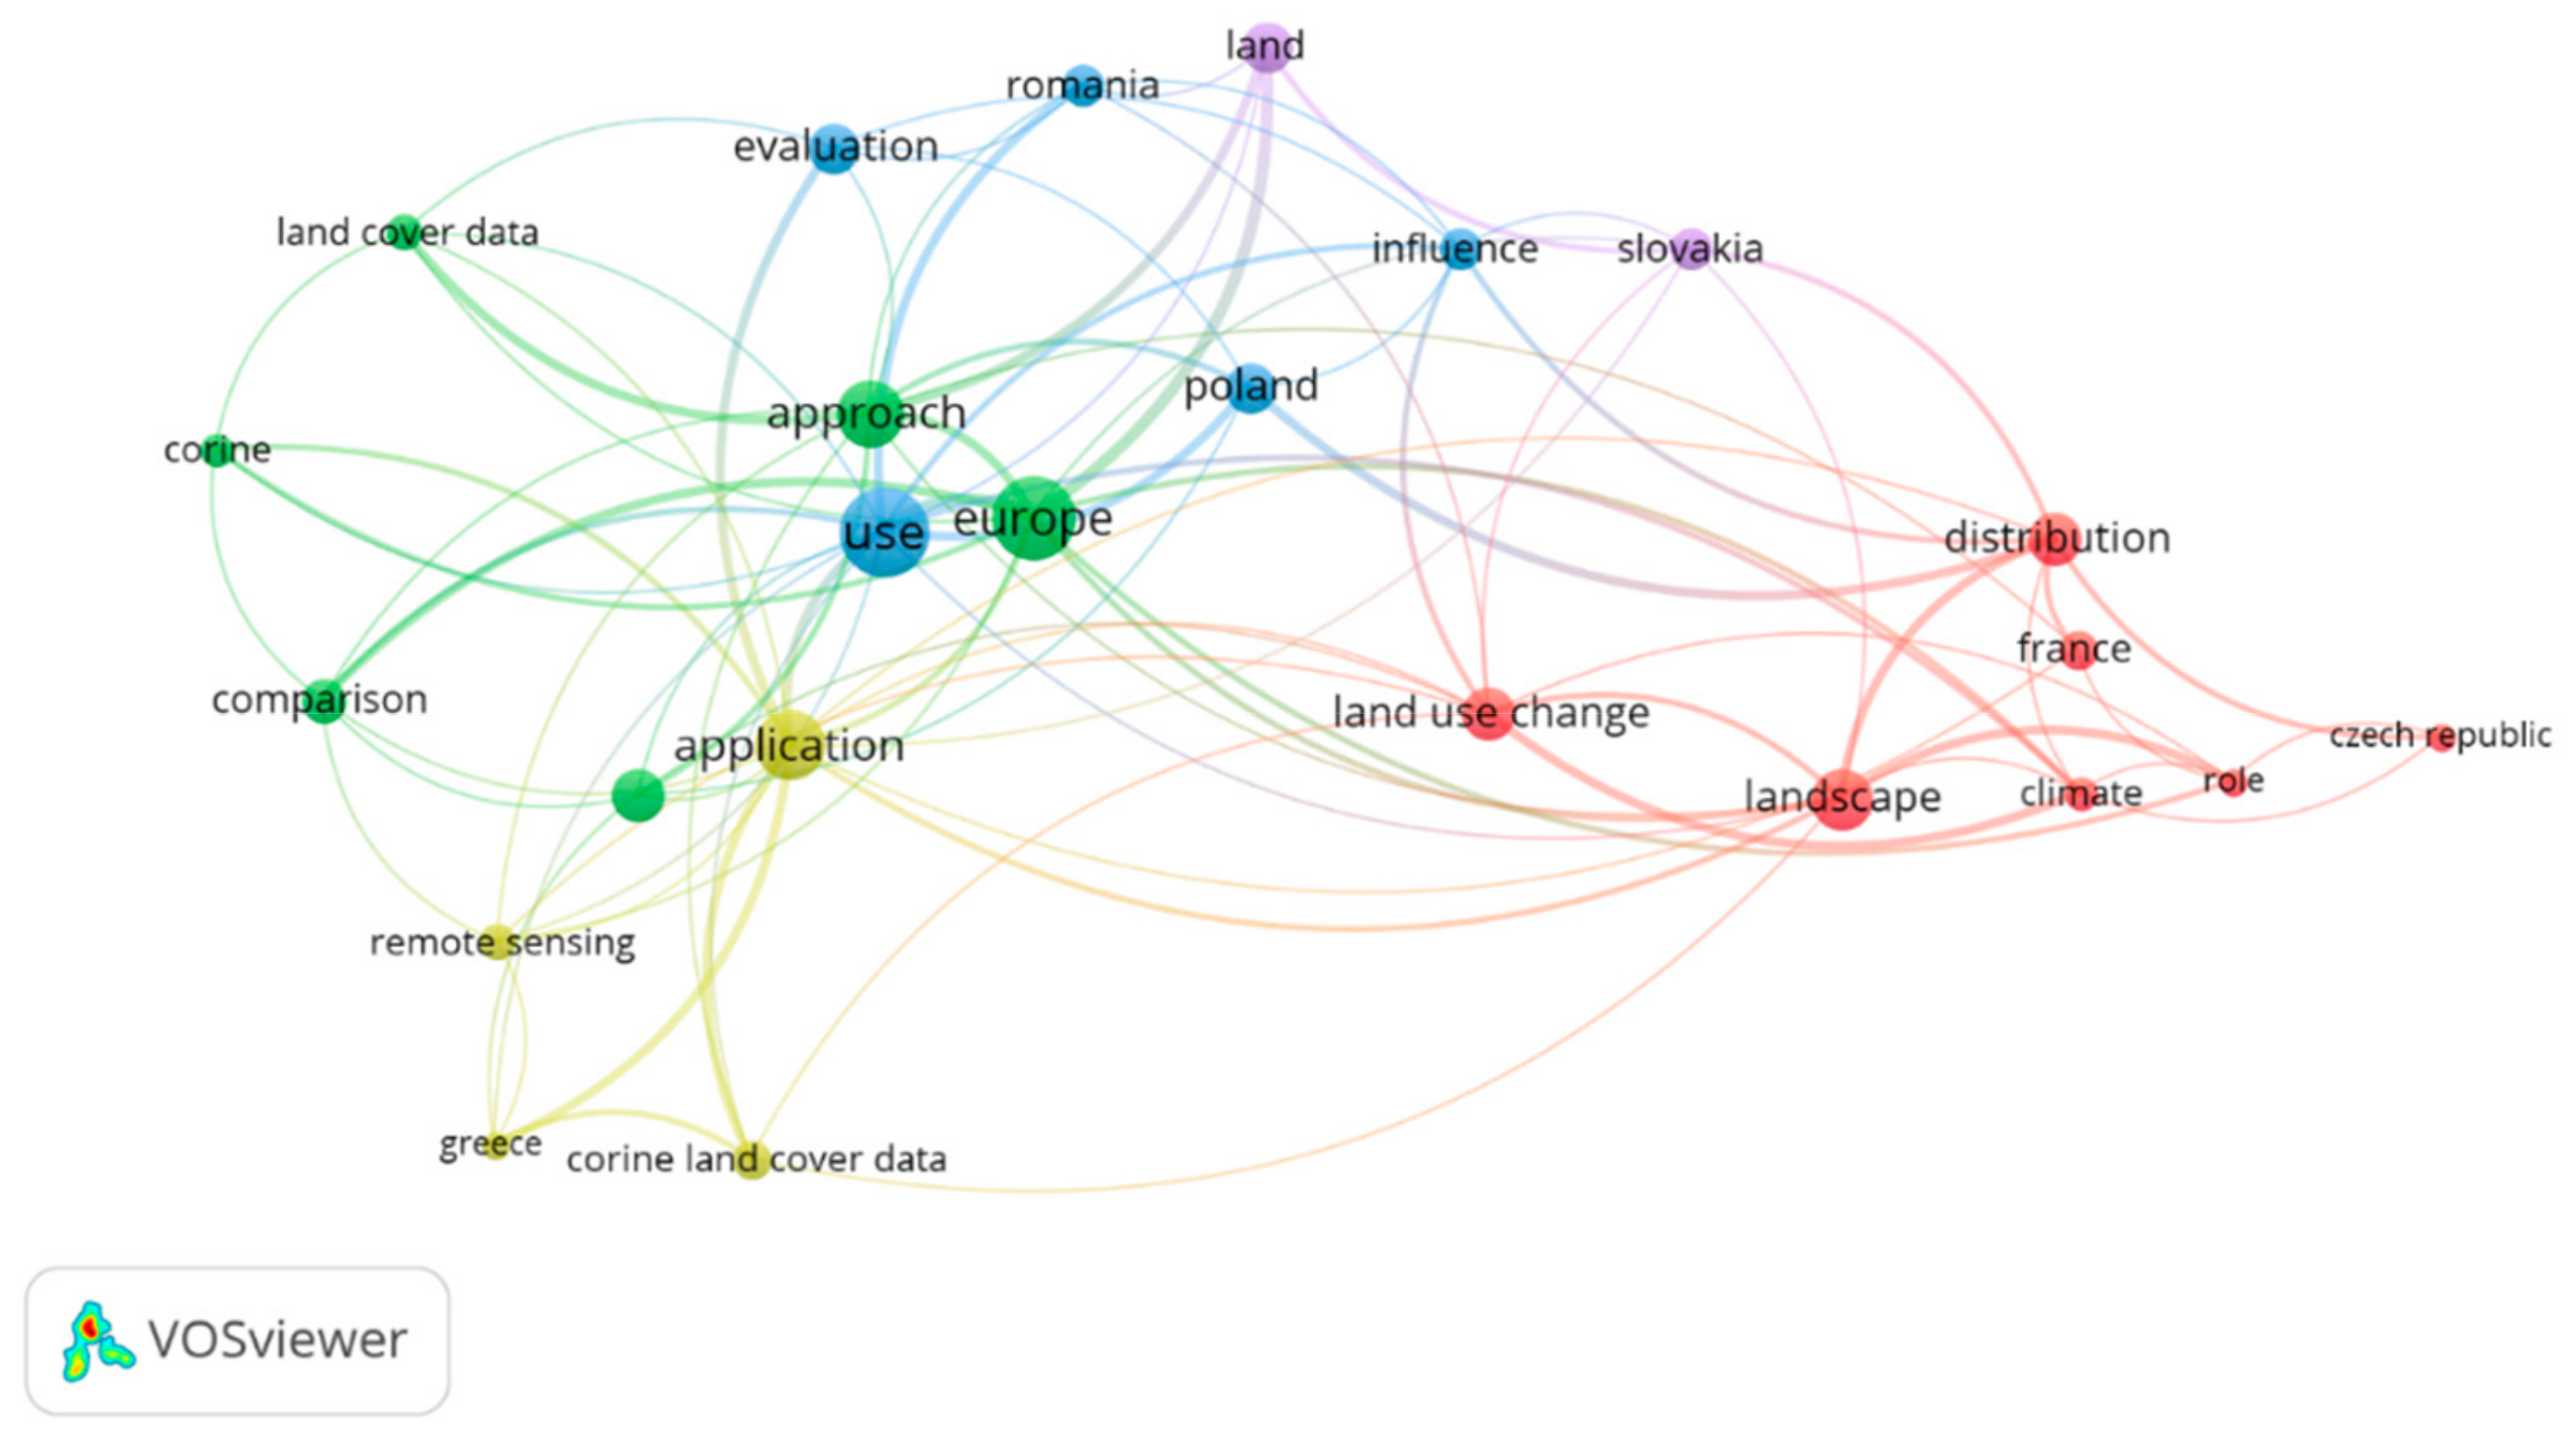
When analyzing words co-occurrence, it is important to pay special attention to words appearing in article titles, as their analysis leads to interesting conclusions. Among 2602 words, only 40 occur in titles at least 10 times (see Figure 9), most of them related to geographical location of application (Europe, Poland, Romania, Slovakia, France, the Czech Republic, and Greece) or data used (land cover data, CORINE land cover data, CORINE, remote sensing). Only a few of these 40 words are related to the kind of application. From a variety of CLC applications, as seen in Figure 10, the publication titles emphasize only landscape analysis, land use changes, climate, and the evaluation of data or result of investigations.
4. CORINE Land Cover Research Applications
4.1. The Geographical Location of CLC Applications
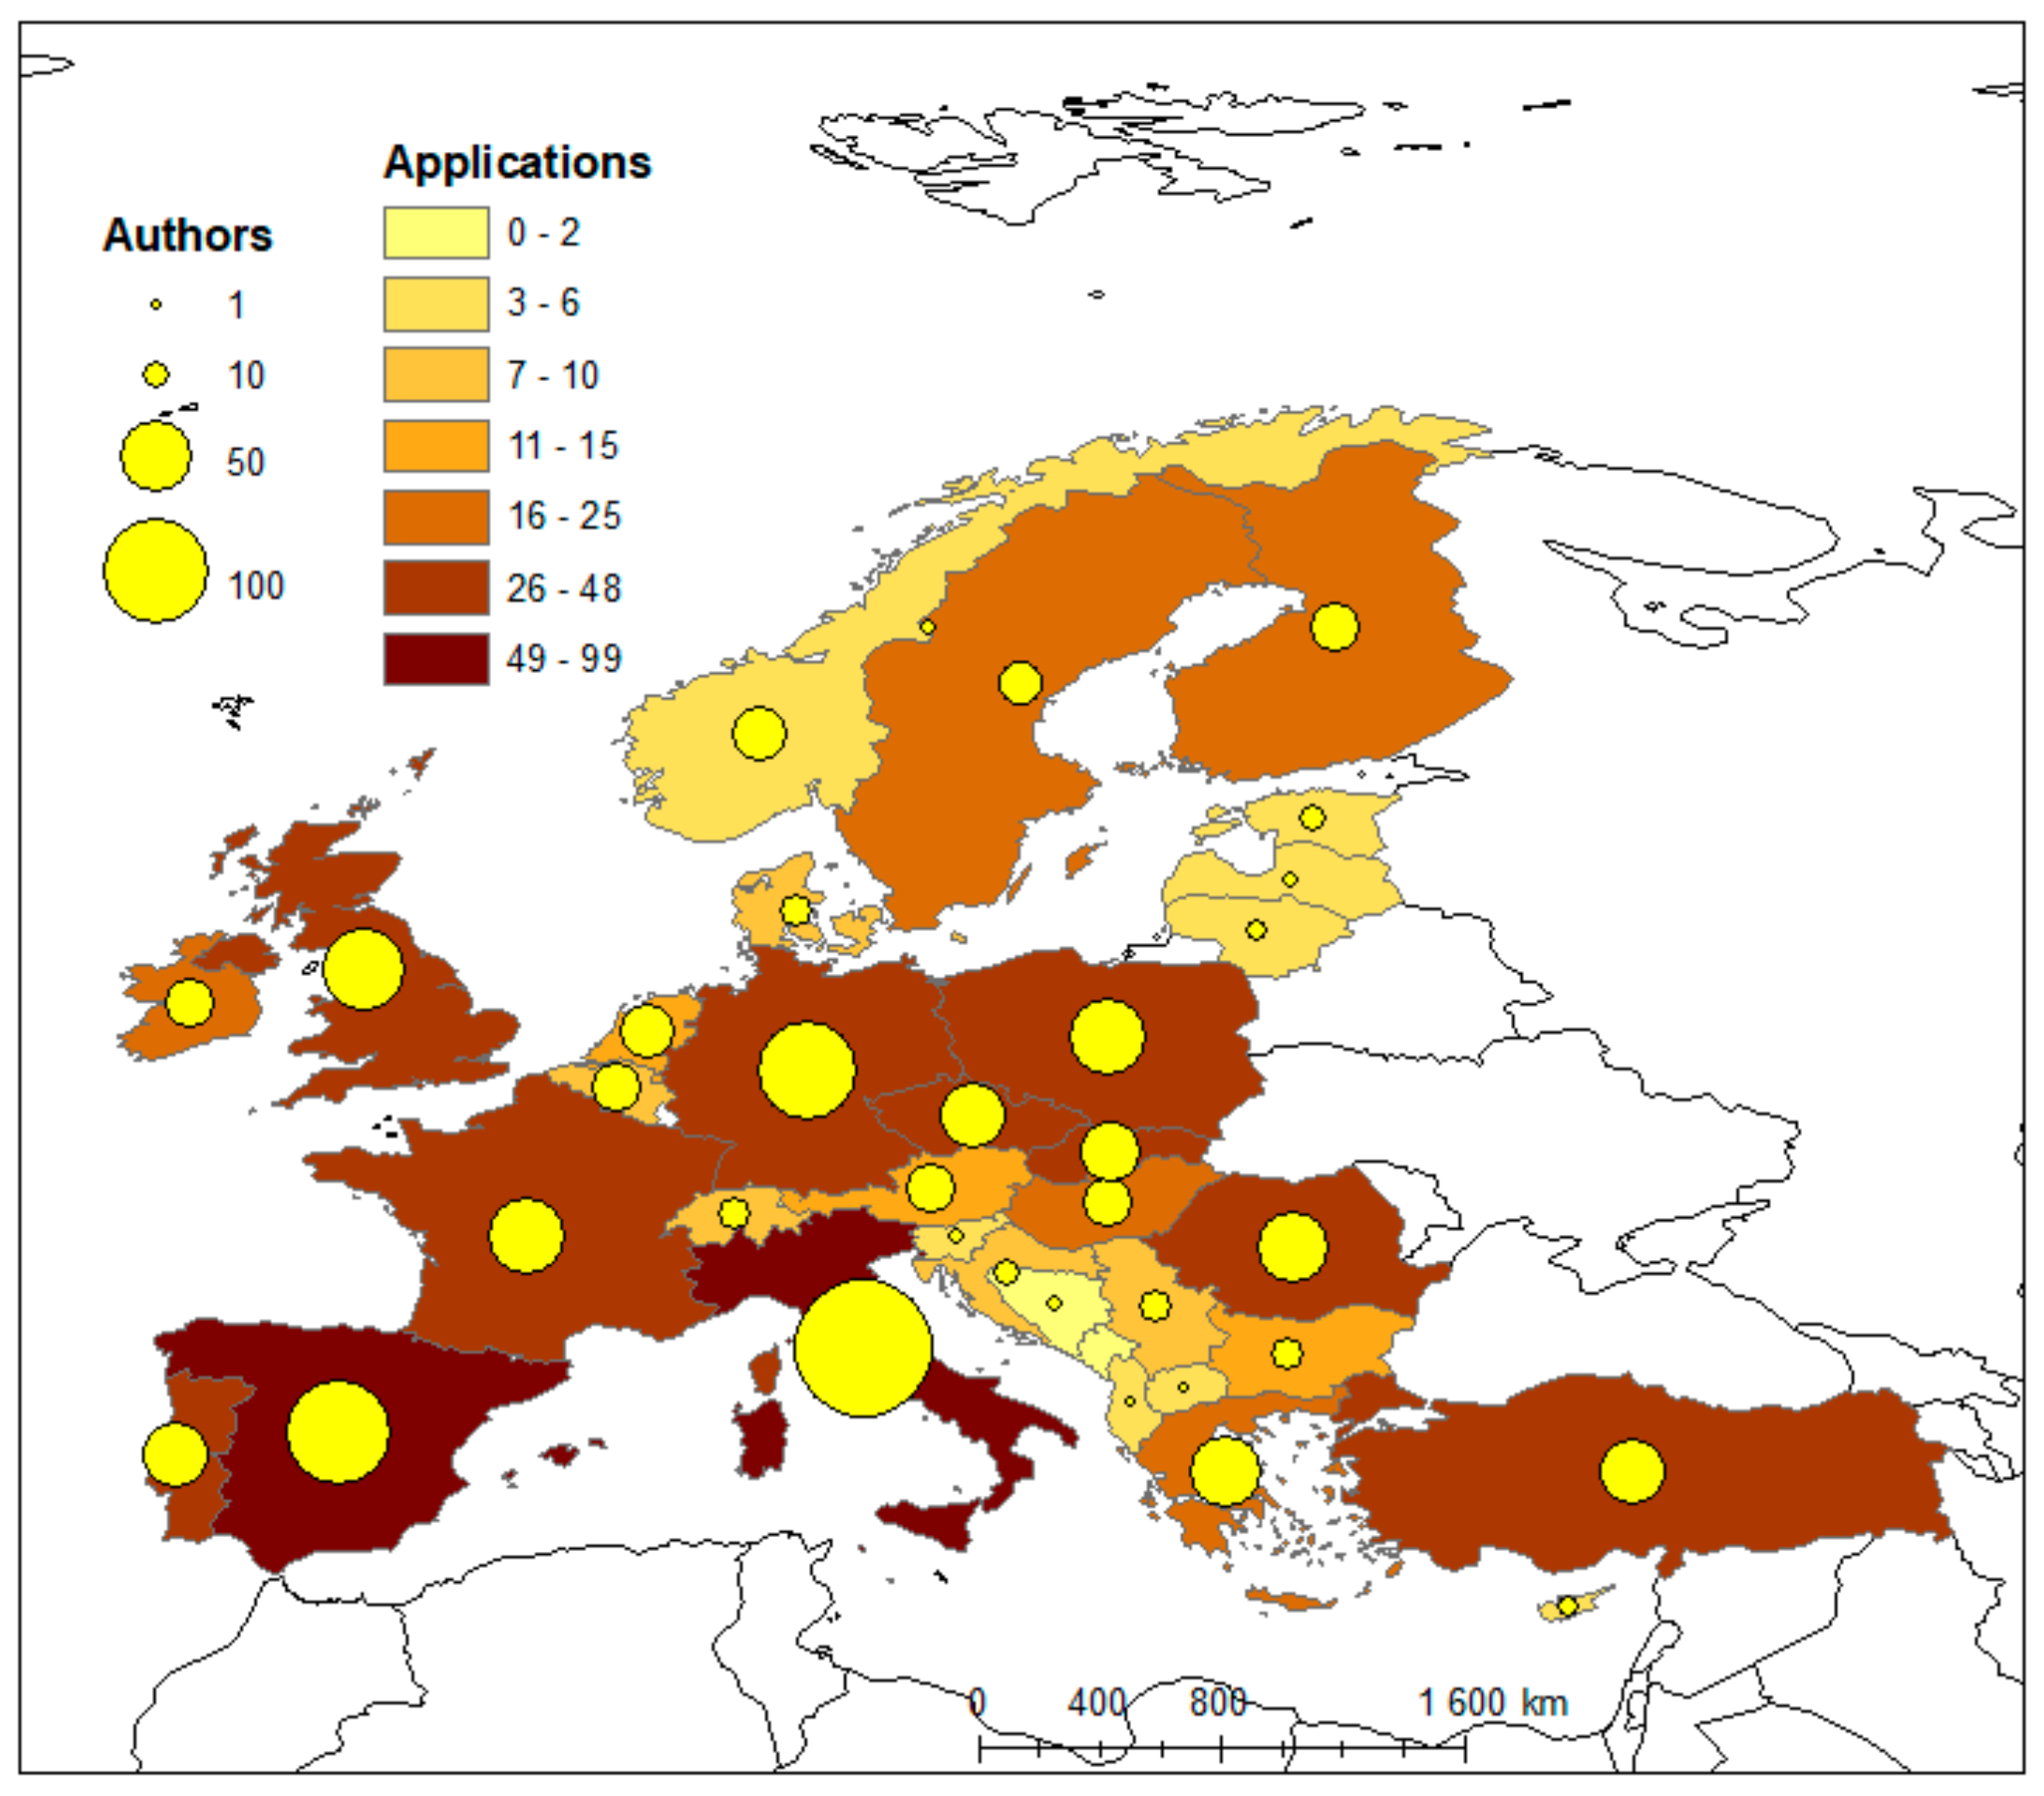
CORINE land cover applications are spread over the whole of Europe. However, their spatial distribution is clustered, and mainly concerns Mediterranean region (95 papers) and such countries as Italy, Spain, France, and Portugal (Figure 10), followed by central European countries (Poland, Germany, Czech Rep., Slovakia). As many as 15 documents are related to coastal zones, 11 to the Alpine region and nine to the Carpathian Mountains. A relatively small number of applications refers to Balkan countries and the Baltic States. The coefficient of dispersion of dispersion of CORINE LC applications number is very high, and amounts to 25.70. The geographical inequality is emphasized by Moran’s Global Index, which is equal to 0.24 and the z-score of 2.40, present that with the 95% likelihood and p-value < 0.05, the geographical distribution of CLC applications is moderately autocorrelated and clustered.
The clustered distribution of authors accompanies the clustered and weakly autocorrelated geographical pattern of CLC applications (with the = 34.20 and Moran’s Global Index equaling 0.16 and z-score of 1.75, present that with 90% likelihood and p-value < 0.1). Overall, the strong, linear relationship is observed between the number of CLC case studies related to a particular country and the authors affiliated to that country, the coefficient in simple linear regression amounts to 0.9356 ± 0.017, with the coefficient of determination equal to 0.87.
4.2. Intellectual Base, Research Frontiers, and Hot Topics
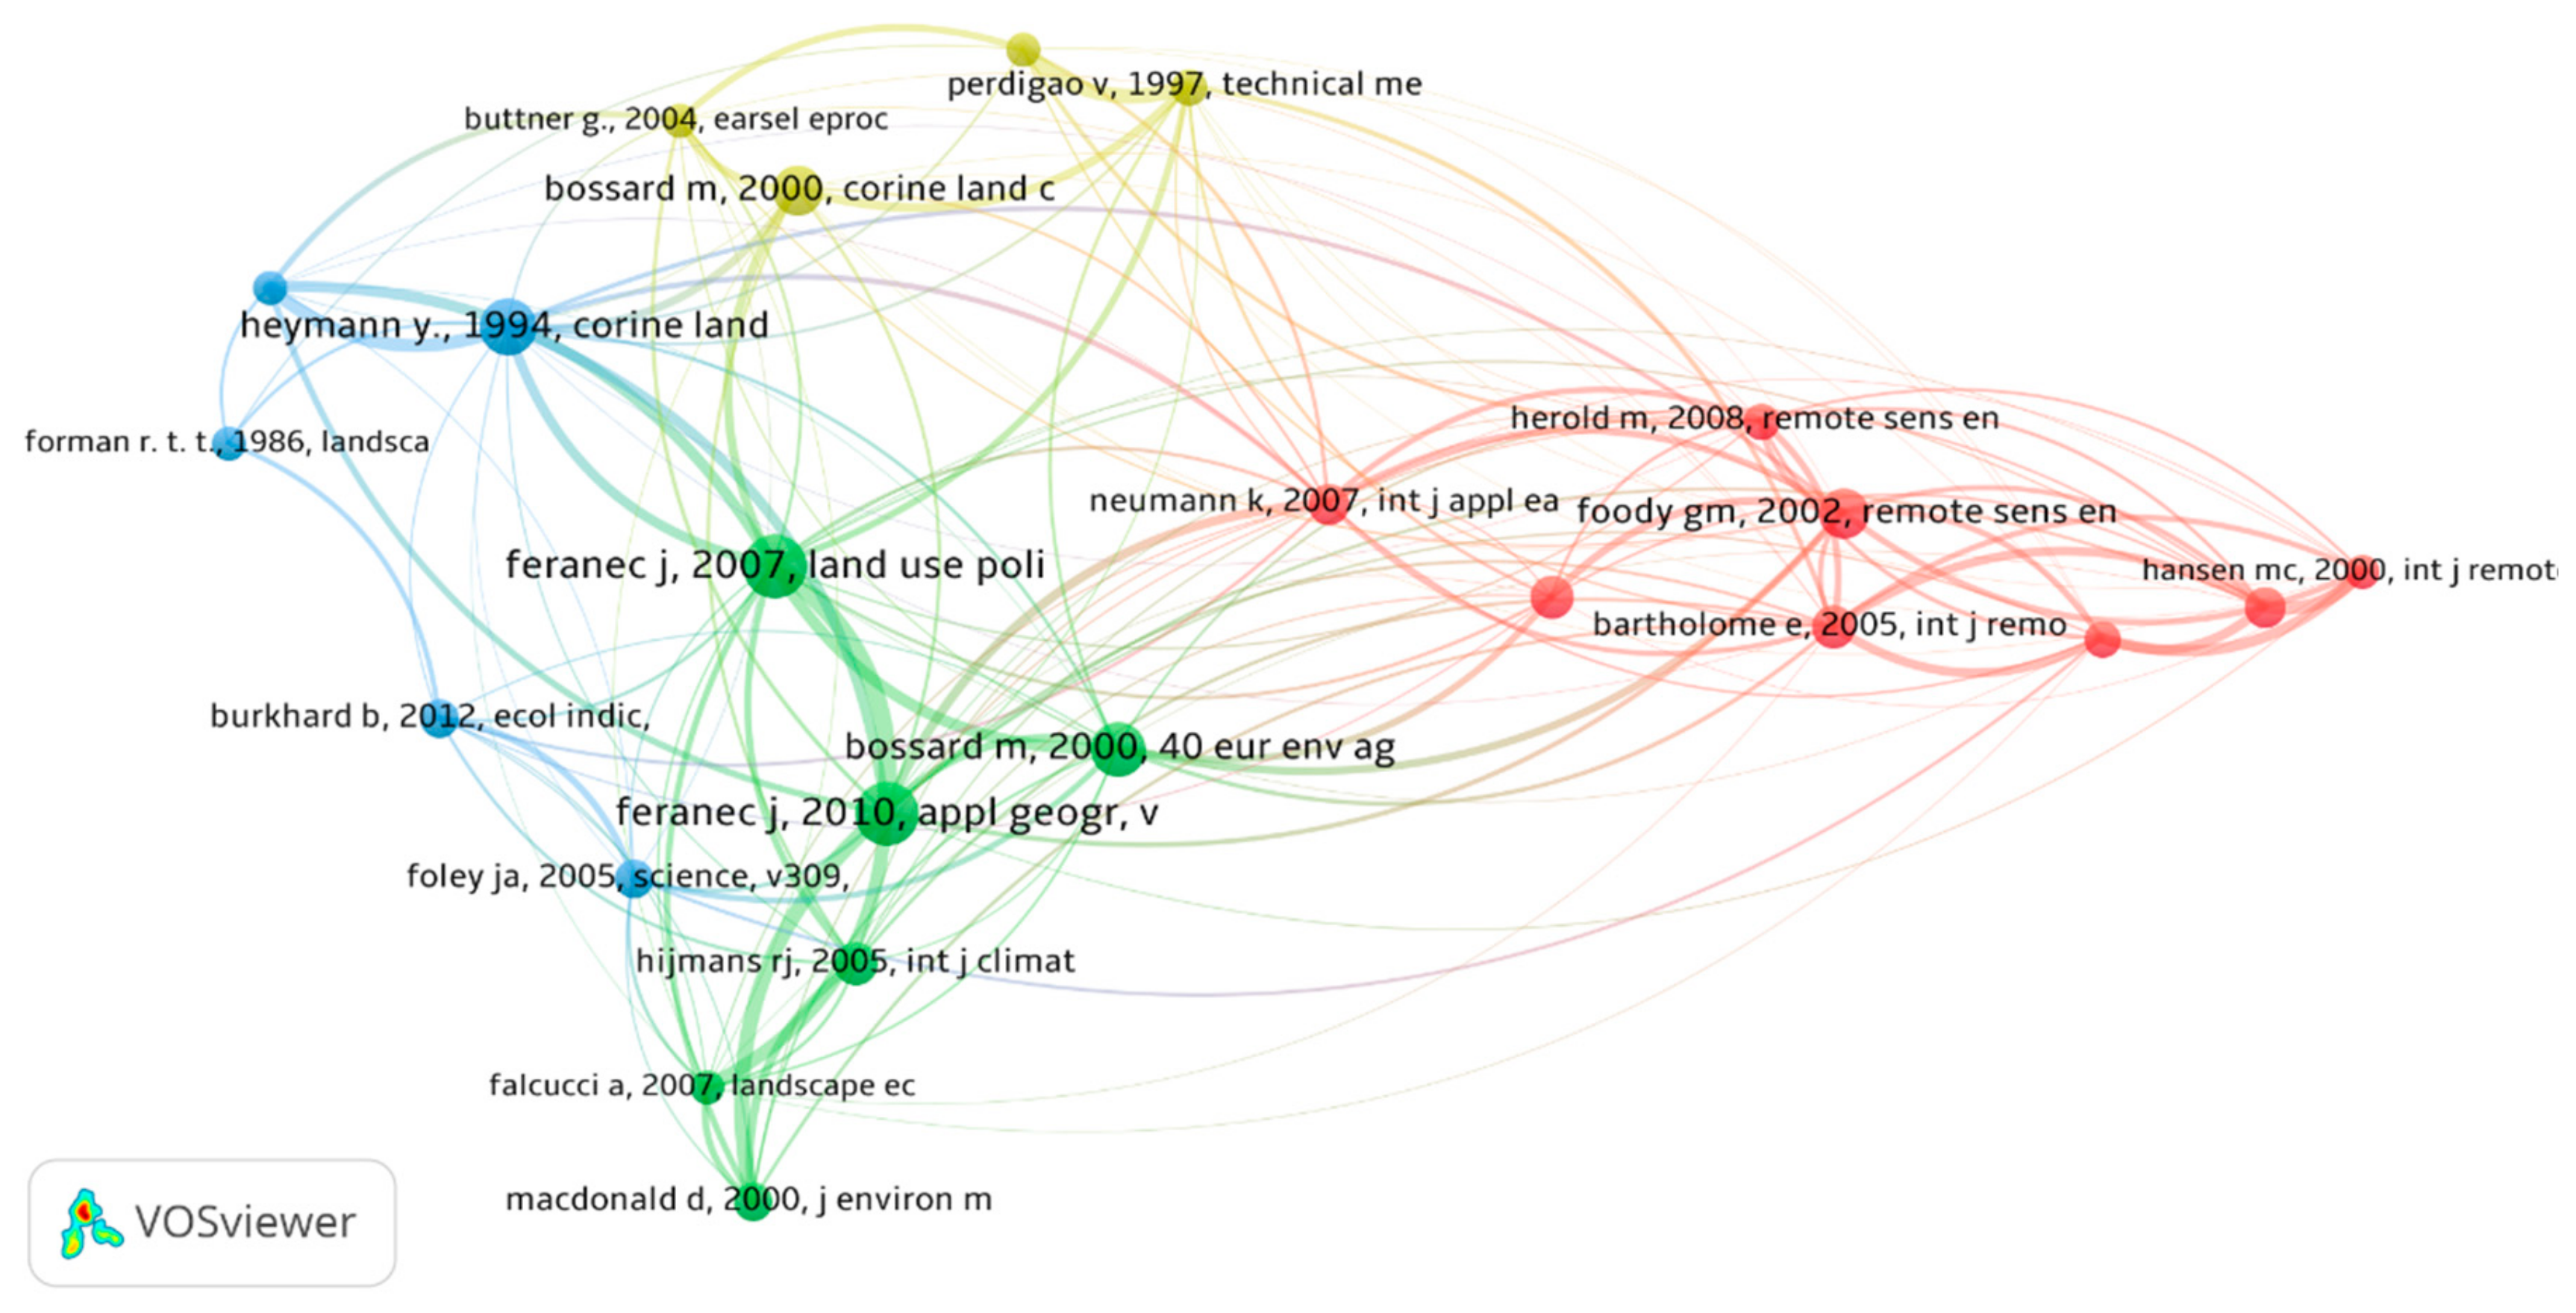
The intellectual base of a topic (herein CORINE land cover) is expressed in a network of co-cited references, selected from articles cited at least 15 times. Only 23 references met the criterion out of a total of 27,256 cited references, as shown in Figure 11. They form four clusters, with each constituting a milestone addressing different research topics related to remote-sensing-derived information on land cover. The yellow cluster comprises of only 4 documents, each of which describes methodological and technical aspects of land cover mapping in European. Of these articles, CORINE land cover technical guide: Addendum 2000 written by Bossard et al. [48] is most frequently cited by further researchers. The documents marked in red (eight research papers published in WoS indexed journals) relate to challenges in global land cover mapping based on remote sensing data [e.g., [49]], as well as accuracy assessment [50,51]. These articles describe methods of classifying accuracy assessments that are commonly used and recommended in the research literature. Moreover, these articles stress that scientists often tend to use techniques based on the confusion matrix without paying attention to the prerequisites associated with this method, such as proper co-registration of data sets and sampling design for ground data acquisition. The green cluster is comprised of five research articles dealing with changes in land use/land cover patterns determination [15,52], and their implications for biodiversity conservation [53]. References included in the blue cluster are diversified, and concern technical documentation of the CORINE land cover mapping [54], reviews papers describing global consequences of land use [55], as well as general principles of landscape and regional ecology [56] and ecological services [57]. The last-mentioned article was written by Burkhard et al. [57] and was published in the very prominent journal Ecological Indicators. It is the highest-cited paper in the field, receiving 593 citations since 2012, and reaching the yearly average cite score of 74.13 (see Table 7).
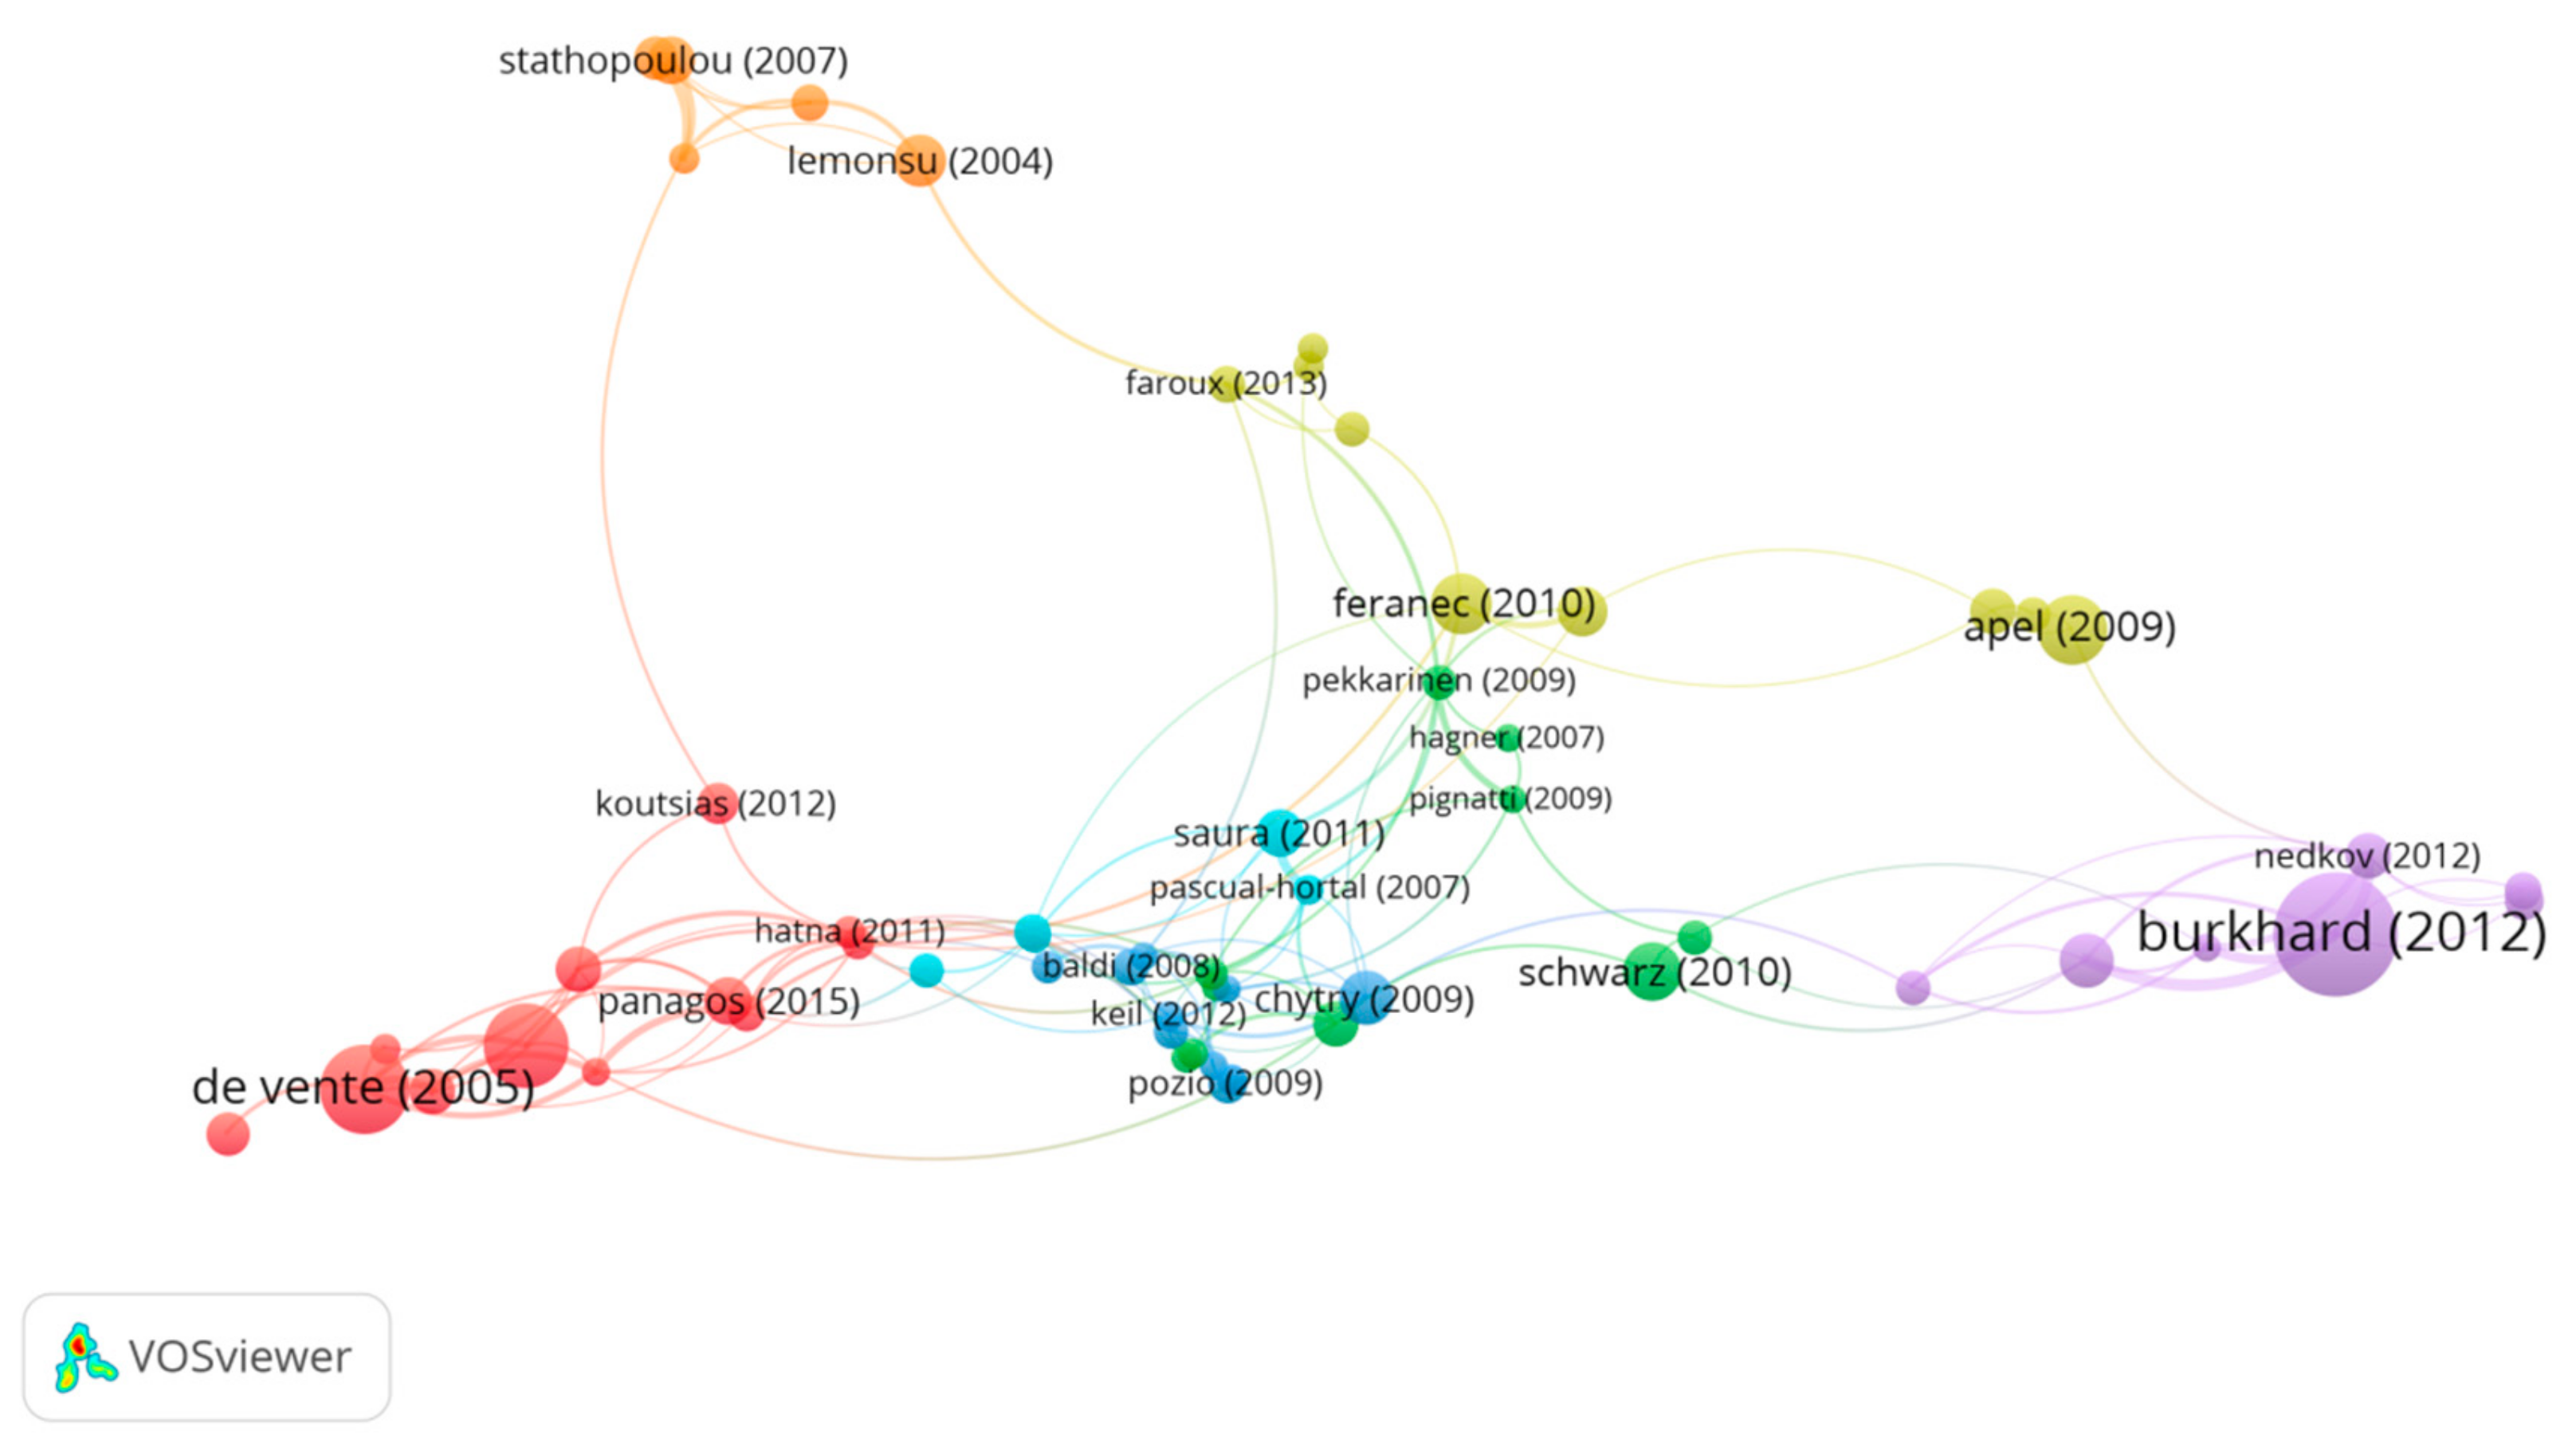
The citation analysis allows for the distinguishing of five active research fronts in CLC research applications, include: (1) landscape analysis (changes, trends, diversity, fragmentation, and connectivity), (2) soil erosion, (3) ecosystems services supply; (4) surface energy balance and its relation with climate change, (5) biodiversity (e.g., alien plant invasion) (Table 7, Figure 12). Although this is not a comprehensive list, it reviews some of the leading horizons for CORINE land cover applications in Europe, where scientific advances have the greatest potential to inform local and global authorities and decision-makers. Though these fields of study have been researched for many years, they are still subjects of interest for research and development goals.
Figure 12 shows the bibliographic coupling panorama of 62 research articles grouped in seven clusters. Each node represents the research paper, the bigger the node size, the more the paper cited. The line thickness represents the coupling strength of two documents, the thicker the line, the more citations to other documents shared. The closeness of nodes indicates the similarity in research. Research on soil erosion and soil loss (red group in Figure 12) are thematically related to those dealing with landscape connectivity (light blue cluster), forest analysis (green cluster), and land cover changes (yellow cluster). Research on ecological services (violet cluster) and urban heat, as well as the energy balance are on the sidelines, are thematically the least related to the other papers.
The potential of the research using CLC data applications is growing, and recently emerged in terrain passability for military purposes [58].
5. Discussion
Science is a driving force of our society. For many years, research work has become the source of breakthroughs in the discovering more about the world. Therefore, the evaluation of scientific research is crucial, both for intellectual and policymaking reasons. As “land is the foundation of our society and a source of economic growth” [59], it is of utmost importance to map the relationship between concepts, ideas and problems raised in land cover/land use research. There are several methods in which such mapping may be achieved, one of them is a bibliometric analysis of publication indexed in Web of Science, as it is devoted to quantitative studies of literature [28,60]. However, though bibliometric techniques portray publication patterns and trends in many Geospatial Information (GI) disciplines, the analysis in the field of land cover is still missing. The research related to CORINE plays an essential role: addressing emerging European trends in land cover structure and dynamics, especially those that relate to the Sustainable Development Goals [61].
Research application of the CORINE land cover are geographically and thematically diverse and address many scientific problems raised by global research in the field. As stated by Song et al. [62] changes in land cover/land use significantly alter the Earth’s energy balance and biogeochemical cycles, which contributes to climate change, affecting land surface properties and the provision of ecosystem services. Moreover, they concluded that of all land changes, 60% are associated with direct human activities and only 40% with indirect environmental drivers, e.g., climate change. In addition, land cover changes exhibit regional dominance in agricultural intensification, temperate reforestation or afforestation, and urbanization [7,17,19,63].
Commonly used indications of science performance at the author, organization, country, journal and research area levels are the number of papers published (TP), total number of citations (TC), average citation per year (CPP) and the h-index. The total number of publication on CLC included in WoS, is small compared to those on remote sensing [32,33,34] and GIS [35]. Nevertheless, CLC-based research constitutes a significant fraction of those studies, which is reflected in other research issues and keywords analysis. Particular attention should be paid to technical materials describing the CLC database, developed by Bossard [47] and Heymann [53], which are referenced by more than 10% of publications on CORINE land cover in WoS.
Citation and indexes calculated on its basis (e.g., h-index) are perceived after Garfield [30] as the best measures of scientific excellence. However, as stated by many researchers [27,37,64] the motivations of authors to cite literature vary greatly and unfortunately often arise from many incentive reasons aside from referring to scientifically relevant papers, e.g. citation of friends or works published in recent years, or particular sources. Moreover, research papers that have already received more credit and a higher reputation tend to gain even more citations and increase their impact in science, what is called the Matthew effect, and according to Malcom [65] “increases the visibility of contributions to science by scientists of acknowledged standing and reduce the visibility of contributions by authors who are less known”.
High-impact research institutions, which conducted research related to CLC data, are located in several countries that are in-line with its position in RS (Remote Sensing) and GIS global research [32,33,34,35], i.e., Italy, France, Germany, and Slovakia. Aside from the Italian National Research Council, Italy hosts JRC, which published the largest number of highly cited papers. Additionally, 5 out of the 10 most prominent authors of the CLC oeuvres were employed at JRC.
Finally, it is worth noting that academic authorities and founding agencies consider a bibliometric number as an objective measure of a scientist’s quality. This is different when viewed from the perspective of a researcher, as was forcibly expressed by Kun [66]: “the pressure to produce eye-catching results, which are publishable in prestigious journals undermines the integrity of science”.
Analyzed papers included only in the Web of Science Database, e.g. those that met the criteria in Methods and Materials section, cover both methodological and research-related problems pertaining to land cover/land use diversity and changes comprise only oeuvres that relate to CORINE land cover in Europe. In addition, the obtained results could differ significantly after analysis of publications indexed by the Scopus and Google Scholar citation databases, which underlines many scientists, e.g., [26,27]. This lays behind the decision to extend our further research into scientific publications output on CORINE land cover applications, including Scopus and Google Scholar databases.
6. Conclusions
Land use/land cover analyses have been a hot research topic worldwide since the beginning of the 20th century, as it reflects the pattern of human activity and plays an important role in documenting environmental degradation. Recognizing the importance of land cover monitoring, many organizations set up projects that included monitoring land use changes. One such project is CORINE land cover, established by the European Commission in 1985. The CORINE land cover data, with the five releases, constitutes a very mature and comprehensive source of information related to the environment, i.e., land cover/land use. Such data, as described in the presented article, is used to monitor land cover changes, and is applied in many different fields of investigation, such as climatology, agriculture, urban sprawl monitoring, soil investigation, water resources monitoring, etc.
The objective of our study was to present the intellectual and cognitive structure of the CORINE land cover database. The main motivation of this study arose from the need to present existing applications of the CORINE database, and the desire to inspire further research works. To achieve these goals, the citations, titles, keywords, authors, organizations, etc., as well as several indexes commonly found in bibliometric studies, were analyzed. Thanks to this presentation, the applied methodology can also be used to analyze other collections that pertain to research results.
The 873 analyzed articles show that applications of CORINE land cover dataset are varied, in terms of numbers of applications and cooperation, as well as applications. In addition, the method of analysis can be used in interdisciplinary research Europe-wide, on the national, multinational, or many-organizational scale.
Today, CORINE is mostly used by researchers from countries containing the most prominent European research centers, such as Italy, France, Germany, and Slovakia. The increase of interest in the CLC database is shown by the rise in the number of publications in recent years. It can also be observed that these data sets are used by smaller European centers, as well as by centers in other parts of the world. In addition, at this time, the main research areas are focused on topics such as landscape analysis, soil erosion, climate change, etc. However, access to a large amount of archived data from CORINE and new open-source data will enable the extension of the thematic scope in which data from the CORINE database is being used.
Due to its versatility, the CLC may further enrich much ecological, agricultural, remote sensing, forestry, or computer science research on a local, regional, or even global scales. CORINE could be a key element of future studies covering different areas of investigation primarily related to the goals of sustainable development across the world.
Author Contributions
E.B. and A.J. contributed equaly, in all parts, i.e. in conceptualization, methodology, and writing.
Funding
This research was funded by Military University of Technology, Faculty of Civil Engineering and Geodesy, Institute of Geodesy.
Acknowledgments
We would like to express our thanks to the reviewers for their feedback and valuable comments, which has allowed us to improve the quality of this article.
Conflicts of Interest
The authors declare no conflict of interest.
References
- Waterton, C.; Wynne, B. Building the European Union: Science and the cultural dimensions of environmental policy. J. Eur. Public Policy 1996, 3, 421–440. [Google Scholar] [CrossRef]
- Büttner, G.; Maucha, G.; Biro, M.S.T.; Kosztra, B.; Pataki, R.; Petrik, O. National Land Cover Database At Scale 1:50,000 In Hungary. In Proceedings of the EARSeL eProceedings 3; EARSeL: Strasbourg, France, 2004; pp. 323–330. [Google Scholar]
- Wierzbicki, D. Multi-Camera Imaging System for UAV Photogrammetry. Sensors 2018, 18, 2433. [Google Scholar] [CrossRef] [PubMed]
- Nunes de Lima, M.V. CORINE Land Cover Updating for the Year 2000: IMAGE2000 and CLC2000 Products and Methods; Nunes de Lima, M.V., Ed.; European Communitie: Ispra, Italy, 2005; ISBN 9289498625. [Google Scholar]
- Büttner, G. CORINE Land Cover and Land Cover Change Products. In Land Use and Land Cover Mapping in Europe: Practices & Trends; Manakos, I., Braun, M., Eds.; Springer: Dordrecht, The Netherlands, 2014; pp. 55–74. ISBN 978-94-007-7969-3. [Google Scholar]
- Luc, M.; Bielecka, E. Ontology for National Land Use/Land Cover Map: Poland Case Study. In Land Use and Land Cover Semantics; Ahlqvist, O., Varanka, D., Fritz, S., Janowicz, K., Eds.; CRS Press Taylor & Francis Group: Boca Raton, FL, USA, 2015; pp. 21–40. [Google Scholar]
- Feranec, J.; Soukup, T.; Hazeu, G.; Jaffrain, G. (Eds.) European Landscape Dynamics: CORINE Land Cover Data, 1st ed.; CRC Press: Boca Raton, FL, USA, 2016; ISBN 9781315372860. [Google Scholar]
- Jansen, L.J.M.; Gregorio, A. Di Parametric land cover and land-use classifications as tools for environmental change detection. Agric. Ecosyst. Environ. 2002, 91, 89–100. [Google Scholar] [CrossRef]
- Cruickshank, M.M.; Tomlinson, R.W. Application of CORINE Land Cover Methodology to the U.K.-Some Issues Raised from Northern Ireland. Glob. Ecol. Biogeogr. Lett. 1996, 5, 235–248. [Google Scholar] [CrossRef]
- Diaz-Pacheco, J.; Gutiérrez, J. Exploring the limitations of CORINE Land Cover for monitoring urban land-use dynamics in metropolitan areas. J. Land Use Sci. 2014, 9, 243–259. [Google Scholar] [CrossRef]
- Di Sabatino, A.; Coscieme, L.; Vignini, P.; Cicolani, B. Scale and ecological dependence of ecosystem services evaluation: Spatial extension and economic value of freshwater ecosystems in Italy. Ecol. Indic. 2013, 32, 259–263. [Google Scholar] [CrossRef]
- Hansen, M.C.; Defries, R.S.; Townshend, J.R.G.; Sohlberg, R. Global land cover classification at 1 km spatial resolution using a classification tree approach. Int. J. Remote Sens. 2000, 21, 1331–1364. [Google Scholar] [CrossRef]
- García-Álvarez, D.; Camacho Olmedo, M.T. Changes in the methodology used in the production of the Spanish CORINE: Uncertainty analysis of the new maps. Int. J. Appl. Earth Obs. Geoinf. 2017, 63, 55–67. [Google Scholar] [CrossRef]
- Cole, B.; Smith, G.; Balzter, H. Acceleration and fragmentation of CORINE land cover changes in the United Kingdom from 2006–2012 detected by Copernicus IMAGE2012 satellite data. Int. J. Appl. Earth Obs. Geoinf. 2018, 73, 107–122. [Google Scholar] [CrossRef]
- Feranec, J.; Hazeu, G.; Jaffrain, G.; Cebecauer, T. Cartographic Aspects of Land Cover Change Detection (Over- and Underestimation in the I&CORINE Land Cover 2000 Project). Cartogr. J. 2007, 44, 44–54. [Google Scholar]
- Petrişor, A.I. Using CORINE data to look at deforestation in Romania: Distribution & possible consequences. Urban. Archit. Constr. 2015, 6, 83–90. [Google Scholar]
- Szumacher, I.; Pabjanek, P. Temporal Changes in Ecosystem Services in European Cities in the Continental Biogeographical Region in the Period from 1990–2012. Sustainability 2017, 9, 665. [Google Scholar] [CrossRef]
- Pelorosso, R.; Della Chiesa, S.; Tappeiner, U.; Leone, A.; Rocchini, D. Stability analysis for defining management strategies in abandoned mountain landscapes of the Mediterranean basin. Landsc. Urban Plan. 2011, 103, 335–346. [Google Scholar] [CrossRef]
- Giorgio, G.; Ragosta, M.; Telesca, V. Climate Variability and Industrial-Suburban Heat Environment in a Mediterranean Area. Sustainability 2017, 9, 775. [Google Scholar] [CrossRef]
- Mancini, L.D.; Mancini, L.D.; Barbati, A.; Corona, P. Geospatial analysis of woodland fire occurrence and recurrence in Italy. Ann. Silvic. Res. 2017, 41, 41–47. [Google Scholar]
- Ballabio, C.; Panagos, P.; Monatanarella, L. Mapping topsoil physical properties at European scale using the LUCAS database. Geoderma 2016, 261, 110–123. [Google Scholar] [CrossRef]
- Pabjanek, P.; Szumacher, I. Land use and ecosystem services temporal changes in the urban sprawl zone, Warsaw, Poland. Probl. Landsc. Ecol. 2017, XLIV, 29–40. [Google Scholar]
- Gardi, C.; Panagos, P.; Van Liedekerke, M.; Bosco, C.; De Brogniez, D. Land take and food security: Assessment of land take on the agricultural production in Europe. J. Environ. Plan. Manag. 2015, 58, 898–912. [Google Scholar] [CrossRef]
- Jaffrain, G. Corine Land Cover Outside of Europe—Nomenclature Adaptation to other Bio-Geographical Regions Studies and Project from 1990 to 2010; European Environment Agency: Copenhagen, Demark, 2011. [Google Scholar]
- WoldeYohannes, A.; Cotter, M.; Kelboro, G.; Dessalegn, W. Land Use and Land Cover Changes and Their Effects on the Landscape of Abaya-Chamo Basin, Southern Ethiopia. Land 2018, 7, 2. [Google Scholar] [CrossRef]
- Bar-Ilan, J. Informetrics at the beginning of the 21st century—A review. J. Informetr. 2008, 2, 1–52. [Google Scholar] [CrossRef]
- Bar-Ilan, J. Citations to the “Introduction to informetrics” indexed by WOS, Scopus and Google Scholar. Scientometrics 2010, 82, 495–506. [Google Scholar] [CrossRef]
- Hood, W.W.; Wilson, C.S. The Literature of Bibliometrics, Scientometrics, and Informetrics. Scientometrics 2001, 52, 291. [Google Scholar] [CrossRef]
- Hess, D.J. Science Studies: An Advanced Introduction; NYU Press: New York, NY, USA, 1997; ISBN 9780814735633. [Google Scholar]
- Garfield, E. Citation Indexing: Its Theory and Application in Science, Technology, and Humanities, 1st ed.; Wiley: New York, NY, USA, 1979; ISBN 978-0471025597. [Google Scholar]
- White, H.D.; McCain, K.W. Visualizing a discipline: An author co-citation analysis of information science, 1972–1995. J. Am. Soc. Inf. Sci. 1998, 49, 327–355. [Google Scholar]
- Zhang, H.; Huang, M.; Qing, X.; Li, G.; Tian, C. Bibliometric Analysis of Global Remote Sensing Research during 2010–2015. ISPRS Int. J. Geo-Inf. 2017, 6, 332. [Google Scholar] [CrossRef]
- Zhuang, Y.; Liu, X.; Nguyen, T.; He, Q.; Hong, S. Global remote sensing research trends during 1991–2010: A bibliometric analysis. Scientometrics 2013, 96, 203–219. [Google Scholar] [CrossRef]
- Zhang, Y.; Thenkabail, P.S.; Wang, P. A Bibliometric Profile of the Remote Sensing Open Access Journal Published by MDPI between 2009 and 2018. Remote Sens. 2019, 11, 91. [Google Scholar] [CrossRef]
- Tian, Y.; Wen, C.; Hong, S. Global scientific production on GIS research by bibliometric analysis from 1997 to 2006. J. Informetr. 2008, 2, 65–74. [Google Scholar] [CrossRef]
- Bielecka, E.; Burek, E. Spatial data quality and uncertainty publication patterns and trends by bibliometric analysis. Open Geosci. 2019, 11, 219–235. [Google Scholar] [CrossRef]
- Garfield, E. From Bibliographic Coupling to Co-Citation Analysis via Algorithmic Historio-Bibliography: A Citationist’s Tribute to Belver C. Griffith; Drexel University: Philadelphia, PA, USA, 2001; p. 45. [Google Scholar]
- Van Eck, N.J.; Waltman, L. How to normalize cooccurrence data? An analysis of some well-known similarity measures. J. Am. Soc. Inf. Sci. Technol. 2009, 60, 1635–1651. [Google Scholar] [Green Version]
- Callon, M.; Courtial, J.P.; Laville, F. Co-word analysis as a tool for describing the network of interactions between basic and technological research: The case of polymer chemsitry. Scientometrics 1991, 22, 155–205. [Google Scholar] [CrossRef]
- Van Eck, N.J.; Waltman, L. Software survey: VOSviewer, a computer program for bibliometric mapping. Scientometrics 2010, 84, 523–538. [Google Scholar] [CrossRef]
- Gini, C. Concentration and dependency ratios (English translation Italian version from 1909). Riv. Polit. Econ. 1997, 87, 769–789. [Google Scholar]
- INCites. INCites Indicator Handbook; Thompson Reuters: Toronto, ON, Canada, 2014. [Google Scholar]
- Horbiński, T.; Medyńska-Gulij, B. Geovisualisation as a process of creating complementary visualisations: Static two-dimensional, surface three-dimensional, and interactive. Geod. Cartogr. 2017, 66, 45–58. [Google Scholar] [CrossRef]
- Perianes-Rodriguez, A.; Waltman, L.; Van Eck, N.J. Constructing bibliometric networks: A comparison between full and fractional counting. J. Informetr. 2016, 10, 1178–1195. [Google Scholar] [CrossRef] [Green Version]
- Vihervaara, P.; Kumpula, T.; Tanskanen, A.; Burkhard, B. Ecosystem services—A tool for sustainable management of human–environment systems. Case study Finnish Forest Lapland. Ecol. Complex. 2010, 7, 410–420. [Google Scholar] [CrossRef]
- Briggs, D.J.; Brignall, P.; Wilkes, A. Assessing soil erosion risk in the Mediterranean region: The Corine programme of the European Communities. In Proceedings of the Application of Computerized EC Soil Map and Climate Data—Proceedings of a Workshop in the Community Programme for Coordination of Agricultural Research, Wageningen, The Netherlands, 15–16 November 1988; Van Lanen, H.A.J., Breght, A.K., Eds.; Office for Official Publications of the European Communities: Luxembourg, 1989; pp. 195–210. [Google Scholar]
- European Commission Monitoring Agricultural ResourceS (MARS). Available online: https://ec.europa.eu/jrc/en/mars (accessed on 20 April 2019).
- Bossard, M.; Feranec, J.; Otahel, J. Technical Report No 40/2000 CORINE Land Cover Technical Guide—Addendum 2000; European Environment Agency: Copenhagen, Demark, 2000. [Google Scholar]
- Bartholomé, E.; Belward, A.S. GLC2000: A new approach to global land cover mapping from Earth observation data. Int. J. Remote Sens. 2005, 26, 1959–1977. [Google Scholar] [CrossRef]
- Congalton, R.G. A review of assessing the accuracy of classifications of remotely sensed data. Remote Sens. Environ. 1991, 37, 35–46. [Google Scholar] [CrossRef]
- Foody, G.M. Status of land cover classification accuracy assessment. Remote Sens. Environ. 2002, 80, 185–201. [Google Scholar] [CrossRef]
- Feranec, J.; Jaffrain, G.; Soukup, T.; Hazeu, G. Determining changes and flows in European landscapes 1990–2000 using CORINE land cover data. Appl. Geogr. 2010, 30, 19–35. [Google Scholar] [CrossRef]
- Falcucci, A.; Maiorano, L.; Boitani, L. Changes in land-use/land-cover patterns in Italy and their implications for biodiversity conservation. Landsc. Ecol. 2007, 22, 617–631. [Google Scholar] [CrossRef]
- Heymann, Y. CORINE Land Cover Technical Guide; Commission of the European Communities: Luxembourg, 1994; ISBN 92-826-2578-8. [Google Scholar]
- Foley, J.A. Global Consequences of Land Use. Science 2005, 309, 570–574. [Google Scholar] [CrossRef] [Green Version]
- Forman, R.T.T.; Godron, M. Landscape Ecology; Wiley: Hoboken, NJ, USA, 1986. [Google Scholar]
- Burkhard, B.; Kroll, F.; Nedkov, S.; Müller, F. Mapping ecosystem service supply, demand and budgets. Ecol. Indic. 2012, 21, 17–29. [Google Scholar] [CrossRef]
- Pokonieczny, K. Comparison of land passability maps created with use of different spatial data bases. Geografie 2018, 123, 317–352. [Google Scholar]
- Abdul Malak, D. EEA Report No 10/2017 Landscapes in Transition an Account of 25 Years of Land Cover Change in Europe; European Environment Agency: Copenhagen, Demark, 2017. [Google Scholar]
- Group OECD and SCImago Research (CSIC) Compendium of Bibliometric Science Indicators. Available online: http://oe.cd/scientometrics (accessed on 2 May 2019).
- Nakamura, M.; Pendlebury, D.; Schnell, J.; Szomszor, M. Navigating the Structure of Research on Sustainable Development Goals; Clarivate Analytics: Philadelphia, PA, USA, 2019. [Google Scholar]
- Song, X.P.; Hansen, M.C.; Stehman, S.V.; Potapov, P.V.; Tyukavina, A.; Vermote, E.F.; Townshend, J.R. Global land change from 1982 to 2016. Nature 2018, 560, 639–643. [Google Scholar] [CrossRef]
- Turner, B.; Meyer, W.B.; Skole, D.L. Global land use/land cover change: Towards an integrated study. AMBIO 1994, 23, 91–95. [Google Scholar]
- Smith, L.C. Citation analysis. Libr. Trends 1981, 30, 83–106. [Google Scholar]
- Gladwell, M. Outliers: The Story of Success, 1st ed.; Little, Brown and Company: Boston, MA, USA, 2008; ISBN 0-316-01792-2. [Google Scholar]
- Kun, Á. Publish and Who Should Perish: You or Science? Publications 2018, 6, 18. [Google Scholar] [CrossRef]
Figure 1.
Research publications referred to CORINE land cover: (a) number of publications related to consecutive CLC inventories; (b) annual and cumulative publication counts followed by the exponential trend line.
Figure 1.
Research publications referred to CORINE land cover: (a) number of publications related to consecutive CLC inventories; (b) annual and cumulative publication counts followed by the exponential trend line.

Figure 2.
Evolution in total and cumulative cites.

Figure 3.
Inequalities of publication sources measured by GINI index: (a): all journals; (b) the 10 top journals.
Figure 3.
Inequalities of publication sources measured by GINI index: (a): all journals; (b) the 10 top journals.

Figure 4.
Bibliographic coupling of the most productive journals, the 10 top; green—remote sensing red—others.
Figure 4.
Bibliographic coupling of the most productive journals, the 10 top; green—remote sensing red—others.

Figure 5.
The network of authors who published at least one document cooperatively: (a) authors of at least one cited paper; (b) zoom to the biggest cluster of cooperated authors.
Figure 5.
The network of authors who published at least one document cooperatively: (a) authors of at least one cited paper; (b) zoom to the biggest cluster of cooperated authors.

Figure 6.
Bibliographic coupling of authors published five and more papers at least 10 times cited.

Figure 7.
Cooperation of organizations: (a) more than five documents; (b) at least one citation.

Figure 8.
Terms used in titles and abstracts at least 10 times; yellow—land cover and habitat types; red—technological and methodological aspects, blue—geospatial analyses; green—land cover change.
Figure 8.
Terms used in titles and abstracts at least 10 times; yellow—land cover and habitat types; red—technological and methodological aspects, blue—geospatial analyses; green—land cover change.

Figure 9.
Words used at least 10 times in titles of publications.

Figure 10.
The geographical location of authors and case studies.

Figure 11.
Co-cited references; yellow—methodological and technical aspects, red—global cover mapping, green—land cover/ land use diversification on biodiversity, blue—others.
Figure 11.
Co-cited references; yellow—methodological and technical aspects, red—global cover mapping, green—land cover/ land use diversification on biodiversity, blue—others.

Figure 12.
Bibliographic coupling of papers at least 50 times cited.


Table 1.
Publications output by type of document.
| Document Type | CLC Publications | % of 873 Documents |
|---|---|---|
| Article | 621 | 71.14 |
| Proceedings paper | 227 | 26.00 |
| Book chapter | 10 | 1.15 |
| Review | 9 | 1.03 |
| Editorial | 4 | 0.46 |
| Letter | 1 | 0.11 |
| Note | 1 | 0.11 |
Table 2.
Annual research using CLC data output.
| PY 1 | TP 2 | PC 3 | PC/P 4 | TC 5 | CPP 6 | AU 7 | J 8 | PPJ 9 | CU 10 |
|---|---|---|---|---|---|---|---|---|---|
| 1989 | 1 | 16 | 16.0 | 0 | 0.0 | 3 | 1 | 1.0 | 1 |
| 1990 | 0 | 0 | 0.0 | 0 | 0.0 | 0 | 0 | 0.0 | 0 |
| 1991 | 1 | 5 | 5.0 | 0 | 0.0 | 4 | 1 | 1.0 | 1 |
| 1992 | 0 | 0 | 0.0 | 0 | 0.0 | 0 | 0 | 0.0 | 0 |
| 1993 | 1 | 2 | 2.0 | 0 | 0.0 | 2 | 1 | 1.0 | 2 |
| 1994 | 4 | 48 | 12.0 | 39 | 9.8 | 6 | 4 | 1.0 | 2 |
| 1995 | 8 | 62 | 7.8 | 118 | 14.8 | 16 | 6 | 1.3 | 5 |
| 1996 | 5 | 60 | 12.0 | 45 | 9.0 | 8 | 5 | 1.0 | 4 |
| 1997 | 4 | 30 | 7.5 | 16 | 4.0 | 11 | 3 | 1.3 | 8 |
| 1998 | 8 | 58 | 7.3 | 80 | 10.0 | 22 | 7 | 1.1 | 8 |
| 1999 | 6 | 64 | 10.7 | 51 | 8.5 | 30 | 6 | 1.0 | 4 |
| 2000 | 11 | 106 | 9.6 | 86 | 7.8 | 33 | 9 | 1.2 | 8 |
| 2001 | 11 | 143 | 13.0 | 226 | 20.5 | 36 | 9 | 1.2 | 9 |
| 2002 | 9 | 142 | 15.8 | 194 | 21.6 | 28 | 8 | 1.1 | 6 |
| 2003 | 14 | 151 | 10.8 | 159 | 11.4 | 46 | 11 | 1.3 | 13 |
| 2004 | 24 | 273 | 11.4 | 445 | 18.5 | 76 | 19 | 1.3 | 15 |
| 2005 | 25 | 298 | 11.9 | 736 | 29.4 | 73 | 20 | 1.3 | 18 |
| 2006 | 24 | 164 | 6.8 | 364 | 15.2 | 90 | 17 | 1.4 | 15 |
| 2007 | 31 | 311 | 10.0 | 748 | 24.1 | 92 | 24 | 1.3 | 17 |
| 2008 | 32 | 407 | 12.7 | 922 | 28.8 | 116 | 26 | 1.2 | 16 |
| 2009 | 50 | 546 | 10.9 | 1558 | 31.2 | 213 | 39 | 1.3 | 25 |
| 2010 | 41 | 466 | 11.4 | 1334 | 32.5 | 155 | 34 | 1.2 | 25 |
| 2011 | 51 | 632 | 12.4 | 914 | 17.9 | 189 | 40 | 1.3 | 25 |
| 2012 | 48 | 597 | 12.4 | 1424 | 29.7 | 186 | 38 | 1.3 | 26 |
| 2013 | 54 | 678 | 12.6 | 716 | 13.3 | 246 | 45 | 1.2 | 28 |
| 2014 | 70 | 839 | 12.0 | 675 | 9.6 | 269 | 53 | 1.3 | 30 |
| 2015 | 89 | 1148 | 12.9 | 959 | 10.8 | 355 | 74 | 1.2 | 33 |
| 2016 | 80 | 1015 | 12.7 | 510 | 6.4 | 286 | 69 | 1.2 | 32 |
| 2017 | 67 | 846 | 12.6 | 225 | 3.4 | 269 | 55 | 1.2 | 32 |
| 2018 | 70 | 1018 | 14.5 | 95 | 1.4 | 314 | 61 | 1.1 | 34 |
| 2019 | 34 | 488 | 14.4 | 11 | 0.3 | 145 | 30 | 1.1 | 27 |
1 PY: publication year, 2 TP: total number of publications, 3 PC: page count, 4 PC/P: page count per publication, 5 TC: total number of citations, 6 CPP: cited references per publication, 7 AU: number of authors, 8 J: number of journals (conferences), 9 CU: number of countries, 10 PPJ: average number of publications per journal.
Table 3.
The 10 most productive journals.
| Journal | TP 1 | % of All Pub. in a Journal | IF 2 | IF 5-year (R) 3 | TC 4 | CPP 5 | AU 6 | AU/P | CU 7 |
|---|---|---|---|---|---|---|---|---|---|
| Ecological Indicators | 22 | 3% | 3.983 | 4.391 (3) | 1120 | 50.9 | 85 | 3.9 | 17 |
| Applied Geography | 17 | 2% | 3.117 | 3.844 (5) | 427 | 25.1 | 53 | 3.1 | 17 |
| International Journal of Applied Earth Observation and Geoinformation | 17 | 2% | 1.782 | 2.003(8) | 273 | 16.1 | 66 | 3.9 | 9 |
| International Journal of Remote Sensing | 17 | 2% | 1.782 | 2.003 (7) | 280 | 16.5 | 65 | 3.8 | 9 |
| Fresenius Environmental Bulletin | 13 | 1% | 0.673 | 0.611 (10) | 27 | 2.1 | 43 | 3.3 | 6 |
| Land Use Policy | 12 | 1% | 3.194 | 3.662 (6) | 521 | 43.4 | 55 | 4.6 | 15 |
| Landscape and Urban Planning | 12 | 1% | 4.994 | 5.957 (2) | 528 | 44.0 | 41 | 3.4 | 10 |
| Remote Sensing of Environment | 12 | 1% | 6.457 | 7.737 (1) | 513 | 42.8 | 49 | 4.1 | 10 |
| Carpathian Journal of Earth and Environmental Sciences | 10 | 1% | 0.671 | 0.708 (9) | 86 | 8.6 | 44 | 4.4 | 7 |
| Remote Sensing | 10 | 1% | 3.406 | 3.952 (4) | 141 | 14.1 | 55 | 5.5 | 17 |
1 TP: total number of publications on CLC, 2 IF: 2018 ISI impact factor; 3 R-rank; 4 TC: total number of citations, 5 CPP: cited references per publication, 6 AU: number of authors, 7 CU: countries.
Table 4.
Conferences with the highest number of publications related to CORINE land cover.
| Conference | TP 1 | % of All Papers | TC 2 | CPP 3 | AU 4 | CU 5 |
|---|---|---|---|---|---|---|
| The European Association of Remote Sensing Laboratories (EARSeL) | 27 | 2% | 35 | 1.84 | 70 | 12 |
| The Society of Photo Optical Instrumentation Engineers SPIE | 25 | 3% | 33 | 1.32 | 105 | 11 |
| IEEE International Symposium on Geoscience and Remote Sensing IGARSS | 16 | 2% | 24 | 1.5 | 52 | 8 |
| International Multidisciplinary Scientific Geoconference SGEM | 12 | 1% | 4 | 0.3 | 36 | 3 |
| International Archives of the Photogrammetry Remote Sensing and Spatial Information Sciences | 7 | 1% | 11 | 1.6 | 22 | 4 |
| Global Developments in Environmental Earth Observation from Space | 7 | 1% | 26 | 3.7 | 23 | 6 |
1 TP: total number of publications in the field, 2 TC: total number of citations, 3 CPP: cited references per publication, 4 AU: number of authors, 5 CU: countries.
Table 5.
The 10 most productive authors ordered by the number of publications on CLC.
| Author | Institution/ Country | TP 1 | %ISI 2 R | sij3 | TP ISI 4 | h-index 5 (R) | TC 6 | % STC 7 | CPP 8 | Main Research Topics Using CLC Data |
|---|---|---|---|---|---|---|---|---|---|---|
| Feranec J. | Slovak Academy of Science, Slovakia | 14 | 64% (1) | 49 | 22 | 7 (9) | 402 | 82% | 18.27 | Land cover changes, Landscape diversity |
| Otahel J. | Slovak Academy of Science, Slovakia | 11 | 44% (2) | 26 | 25 | 5 (10) | 74 | 76% | 2.96 | Land cover changes, Landscape diversity |
| Panagos P. | EC JRC, Italy | 11 | 11% (8) | 25 | 97 | 28 (2) | 323 | 13% | 3.33 | Environmental Sciences, ecology |
| Petrisor A.I. | Ion Mincu University of Architecture Urbanism, Romania | 11 | 26% (5) | 9 | 42 | 10 (6) | 122 | 49% | 2.90 | Soil erosion, ecology |
| Buttner G. | FOMI, Hungary | 8 | 27% (4) | 16 | 30 | 8 (8) | 32 | 13% | 1.07 | Land cover changes |
| Montanarella L. | EC JRC, Italy | 6 | 5% (10) | 21 | 133 | 38 (1) | 189 | 4% | 1.42 | Soil erosion |
| Kallimanis A.S. | University of Ioannina, Greece | 6 | 8% (9) | 9 | 75 | 21 (3) | 148 | 9% | 1.97 | Air pollution, biodiversity |
| Strobl P. | EC JRC, Italy | 6 | 14% (7) | 23 | 44 | 13 (4) | 128 | 26% | 2.91 | Remote sensing, IT technology |
| Weissteiner C.J. | EC JRC, Italy | 6 | 26% (6) | 14 | 23 | 12 (5) | 104 | 22% | 4.52 | Ecosystems, water, natural hazards |
| Gallego J. | EC JRC, Italy | 6 | 32% (3) | 3 | 19 | 8 (7) | 104 | 39% | 5.47 | Population distribution, remote sensing |
1 TP: total publication related to CLC, 2 % ISI: % of all ISI indexed publication; sij 3: cooperation strength; 4 TP ISI: total number of ISI publication 5 h-index: Hirsch index; 6 TC: total number of citations of CLC related papers; 7 % STC: % sum of all times ISI publications; 8 CPP: total citations per all ISI publications; R: rank.
Table 6.
Main research topics concerning CORINE land cover data.
| Research Topics | Concepts |
|---|---|
| Agriculture areas structure and changes (246) 1 | Land use change (71), land cover change (69), pasture (27), abandonment (25), plot (25) land classification (23), land use classes (24), change detection (16), land use structure (16) |
| Urban areas analysis (126) | Urbanization (52), ecosystem services (34), urban sprawl (23), urban growth (11), urban atlas (10), urban expansion (10), suburban area (10) |
| Forest (91) | Deforestation (30), afforestation (14), forest structure (mixed forest (14), coniferous (11)), fire (12), |
| Soil (157) | Erosion (30), loss (24), soil type (15), texture (10) |
| Landscape (107) | Metrics (24), structure (24), changes (22), land use pattern (15), diversity (10), fragmentation (3) |
| Climate (220) | Climate impact (45), change (41), temperature (55), land surface temperature (16), air temperature (14), precipitation (35), digital elevation model (35), elevation (19) |
1 Occurrence number.
Table 7.
Highly cited papers referred to CORINE land cover data.
| Authors | Title of Publication | Publication Source Name; JRC Journal Category; IF(2018) | Pub. Date | TC | Av. Cit./ Year |
|---|---|---|---|---|---|
| Burkhard B.; Kroll F.; Nedkov S.; et al. | Mapping ecosystem service supply, demand, and budgets | Ecological Indicators; Environmental sciences; 4.490 | Oct. 2012 | 593 | 74.13 |
| de Vente J; Poesen J. | Predicting soil erosion and sediment yield at the basin scale: Scale issues and semi-quantitative models | Earth-Science Reviews; Geosciences. Multidisciplinary; 9.53 | Jun 2005 | 344 | 22.93 |
| Cerdan O.; Govers G.; Le Bissonnais Y.; et al. | Rates and spatial variations of soil erosion in Europe: A study based on erosion plot data | Geomorphology; Geosciences. Multidisciplinary; 3.681 | Oct. 2010 | 305 | 30.50 |
| Apel H.; Aronica G. T.; Kreibich H.; et al. | Flood risk analyses-how detailed do we need to be? | Natural Hazards; Geosciences. Multidisciplinary; 2.319 | Apr. 2009 | 221 | 20.09 |
| Feranec J.; Jaffrain G.; Soukup T.; et al. | Determining changes and flows in European landscapes 1990-2000 using CORINE land cover data | Applied Geography; Geography; 3.068 | Jan. 2010 | 179 | 17.90 |
| Schwarz N. | Urban form revisited-selecting indicators for characterizing European cities | Landscape and urban planning; Geography physical. Regional and urban planning. Urban studies; 5.144 | May 2010 | 171 | 17.10 |
| Kroll F.; Mueller F.; Haase D.; et al. | Rural-urban gradient analysis of ecosystem services supply and demand dynamics | Land Use Policy; Environmental studies; 3.573 | Jan. 2012 | 156 | 19.50 |
| Chytry M.; Pysek P.; Wild, J.; et al. | European map of alien plant invasions based on the quantitative assessment across habitats | Diversity and Distributions; Biodiversity conservation; 4.09 | Jan. 2009 | 148 | 13.45 |
| Lemonsu A; Grimmond CSB; Masson V. | Modeling the surface energy balance of the core of an old Mediterranean city: Marseille | Journal of Applied Meteorology; Meteorology and atmospheric sciences, 1.702 | Feb. 2004 | 134 | 8.38 |
| Janssen S.; Dumont G.; Fierens F.; et al. | Spatial interpolation of air pollution measurements using CORINE land cover data | Atmospheric Environment, Meteorology and atmospheric sciences, 4.012 | Jan. 2008 | 128 | 10.67 |
| Feranec J.; Hazeu G.; Christensen S.; et al. | CORINE land cover change detection in Europe (case studies of the Netherlands and Slovakia) | Land Use Policy; Environmental studies; 3.573 | Jan. 2007 | 126 | 9.68 |
| Panagos P.; Borrelli P.; Meusburger K.; et al. | Estimating the soil erosion cover-management factor at the European scale | Land Use Policy; Environmental studies; 3.573 | Nov. 2015 | 125 | 25.0 |
© 2019 by the authors. Licensee MDPI, Basel, Switzerland. This article is an open access article distributed under the terms and conditions of the Creative Commons Attribution (CC BY) license (http://creativecommons.org/licenses/by/4.0/).
Share and Cite
MDPI and ACS Style
Bielecka, E.; Jenerowicz, A. Intellectual Structure of CORINE Land Cover Research Applications in Web of Science: A Europe-Wide Review. Remote Sens. 2019, 11, 2017. https://0-doi-org.brum.beds.ac.uk/10.3390/rs11172017
AMA Style
Bielecka E, Jenerowicz A. Intellectual Structure of CORINE Land Cover Research Applications in Web of Science: A Europe-Wide Review. Remote Sensing. 2019; 11(17):2017. https://0-doi-org.brum.beds.ac.uk/10.3390/rs11172017
Chicago/Turabian StyleBielecka, Elzbieta, and Agnieszka Jenerowicz. 2019. "Intellectual Structure of CORINE Land Cover Research Applications in Web of Science: A Europe-Wide Review" Remote Sensing 11, no. 17: 2017. https://0-doi-org.brum.beds.ac.uk/10.3390/rs11172017
Note that from the first issue of 2016, this journal uses article numbers instead of page numbers. See further details here.