Radiometric Top-of-Atmosphere Reflectance Consistency Assessment for Landsat 8/OLI, Sentinel-2/MSI, PROBA-V, and DEIMOS-1 over Libya-4 and RadCalNet Calibration Sites


Abstract
:
1. Introduction
2. Satellite Missions
2.1. PROBA-V
2.2. DEIMOS-1
2.3. Sentinel-2
2.4. Landsat-8
3. Methods and Data
3.1. OSCAR Libya-4
3.2. RadCalNet
4. Results
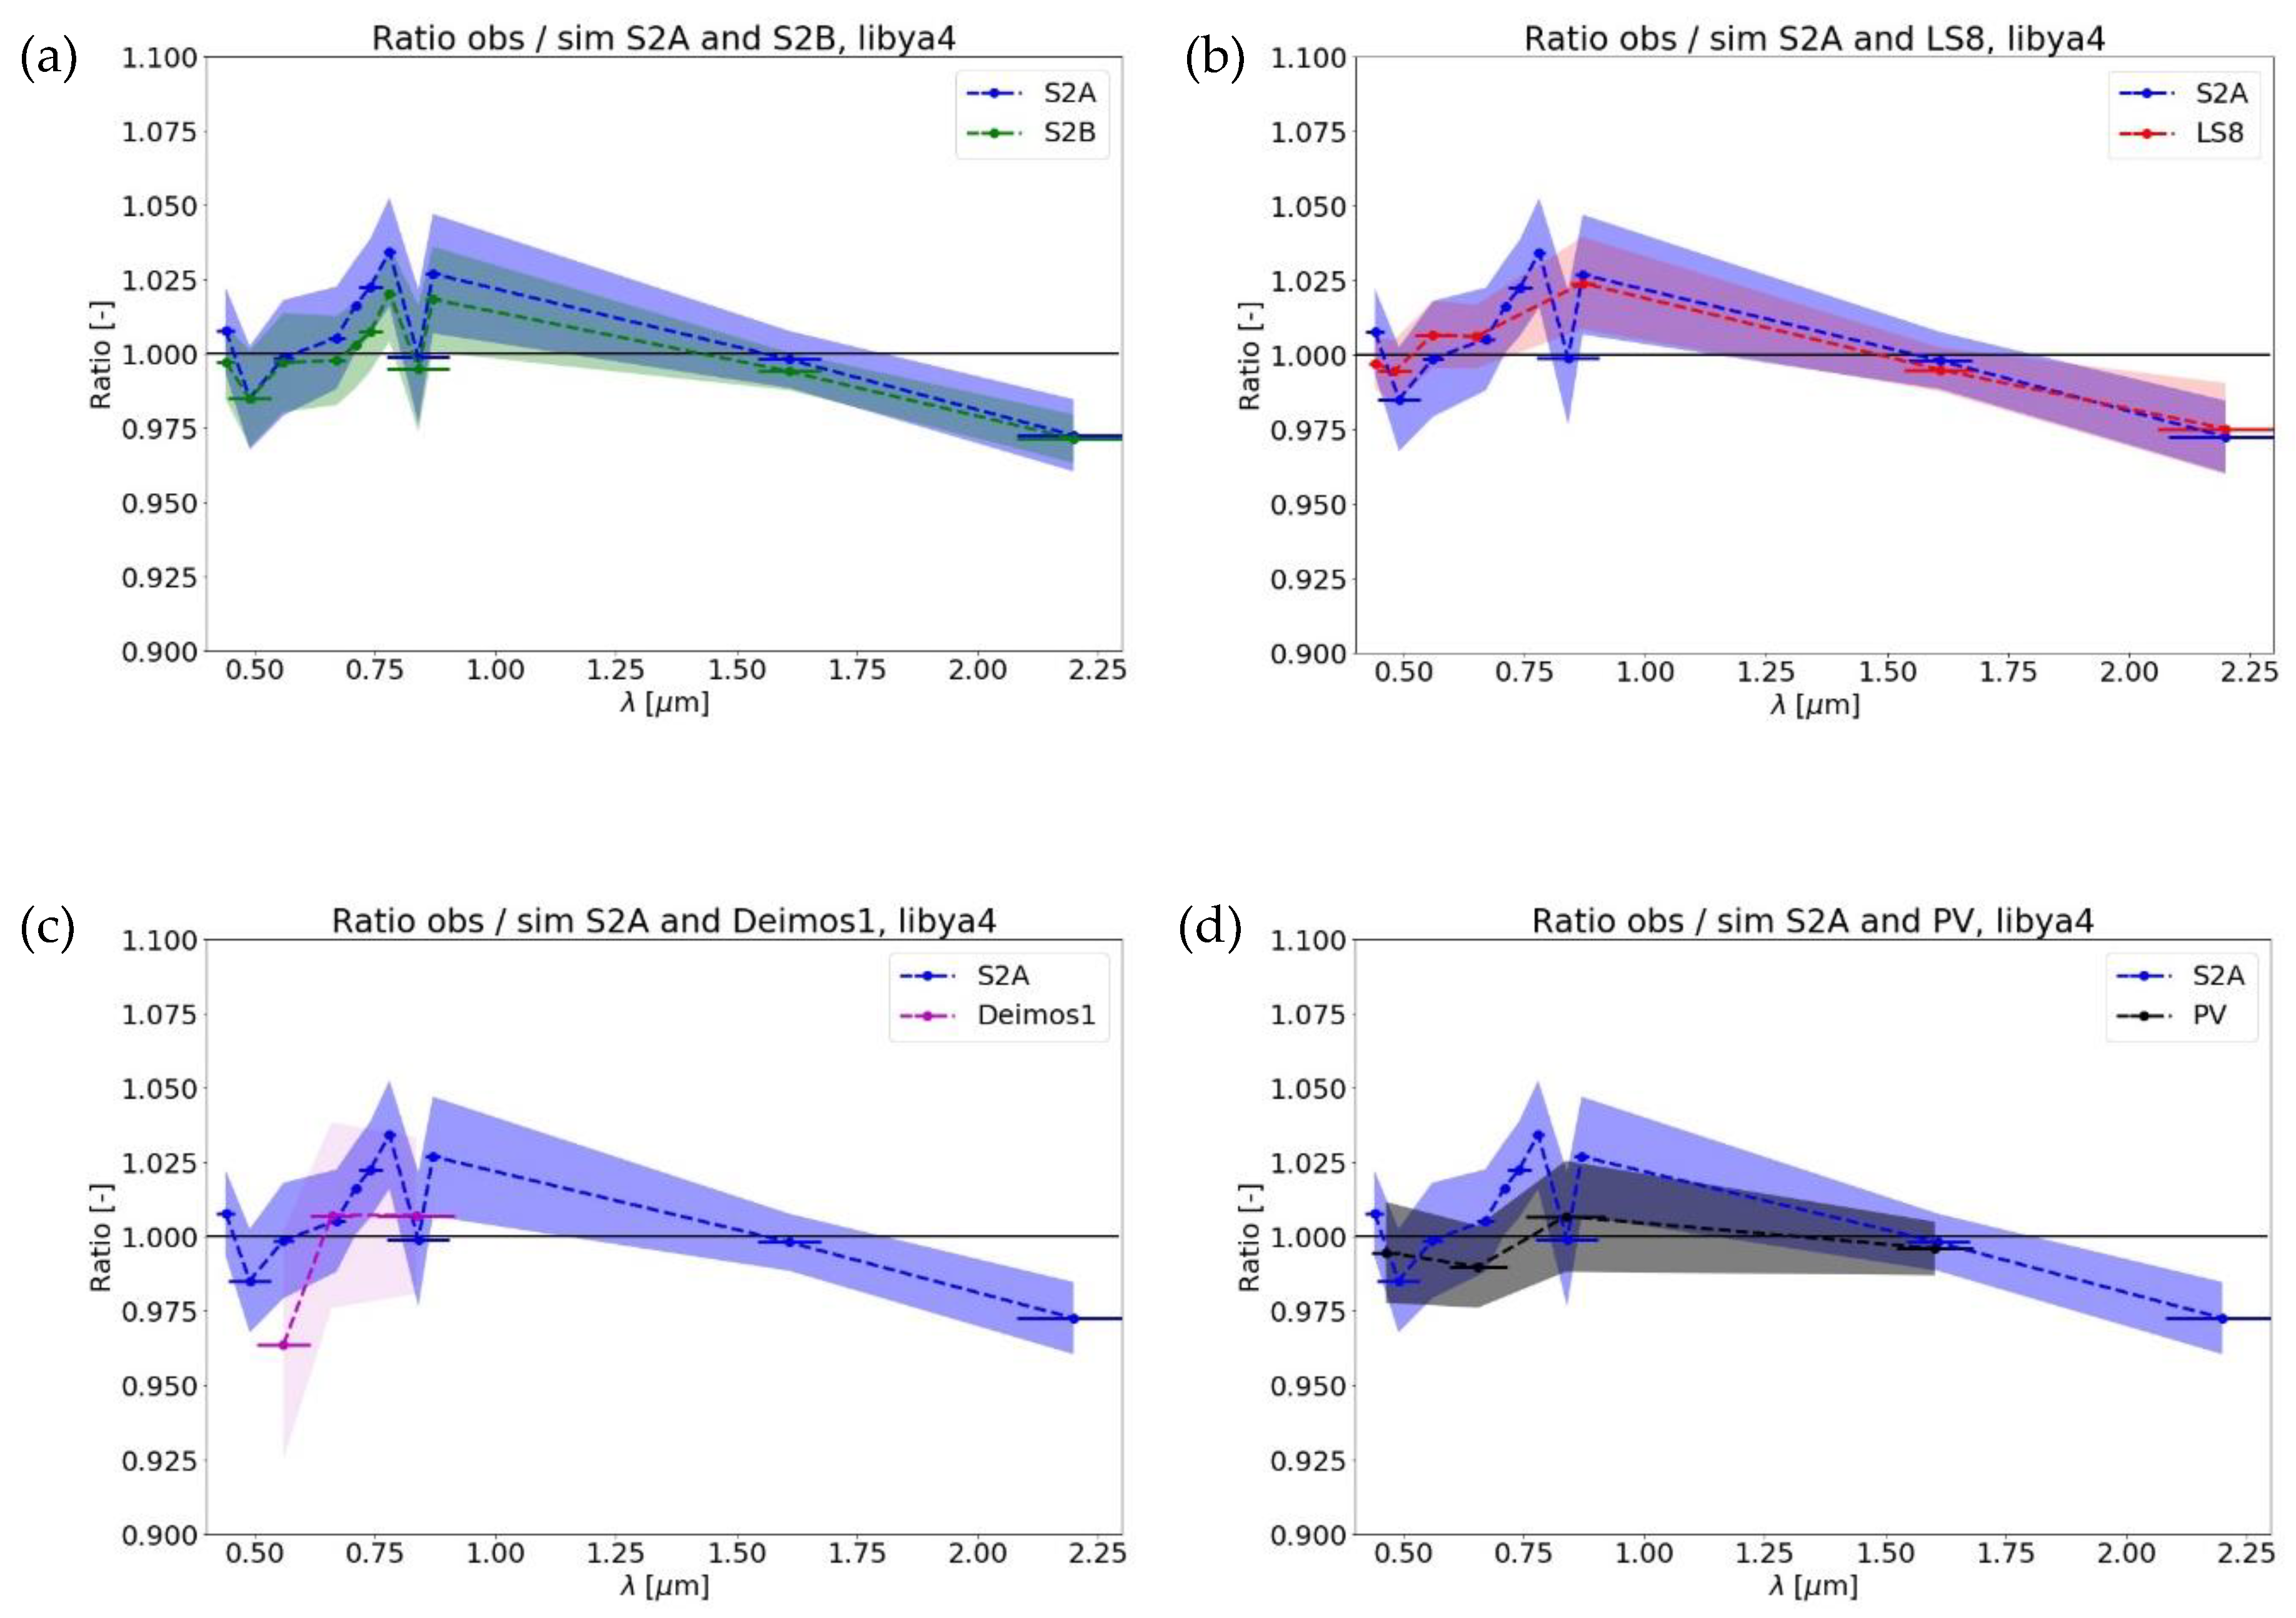
4.1. Libya-4
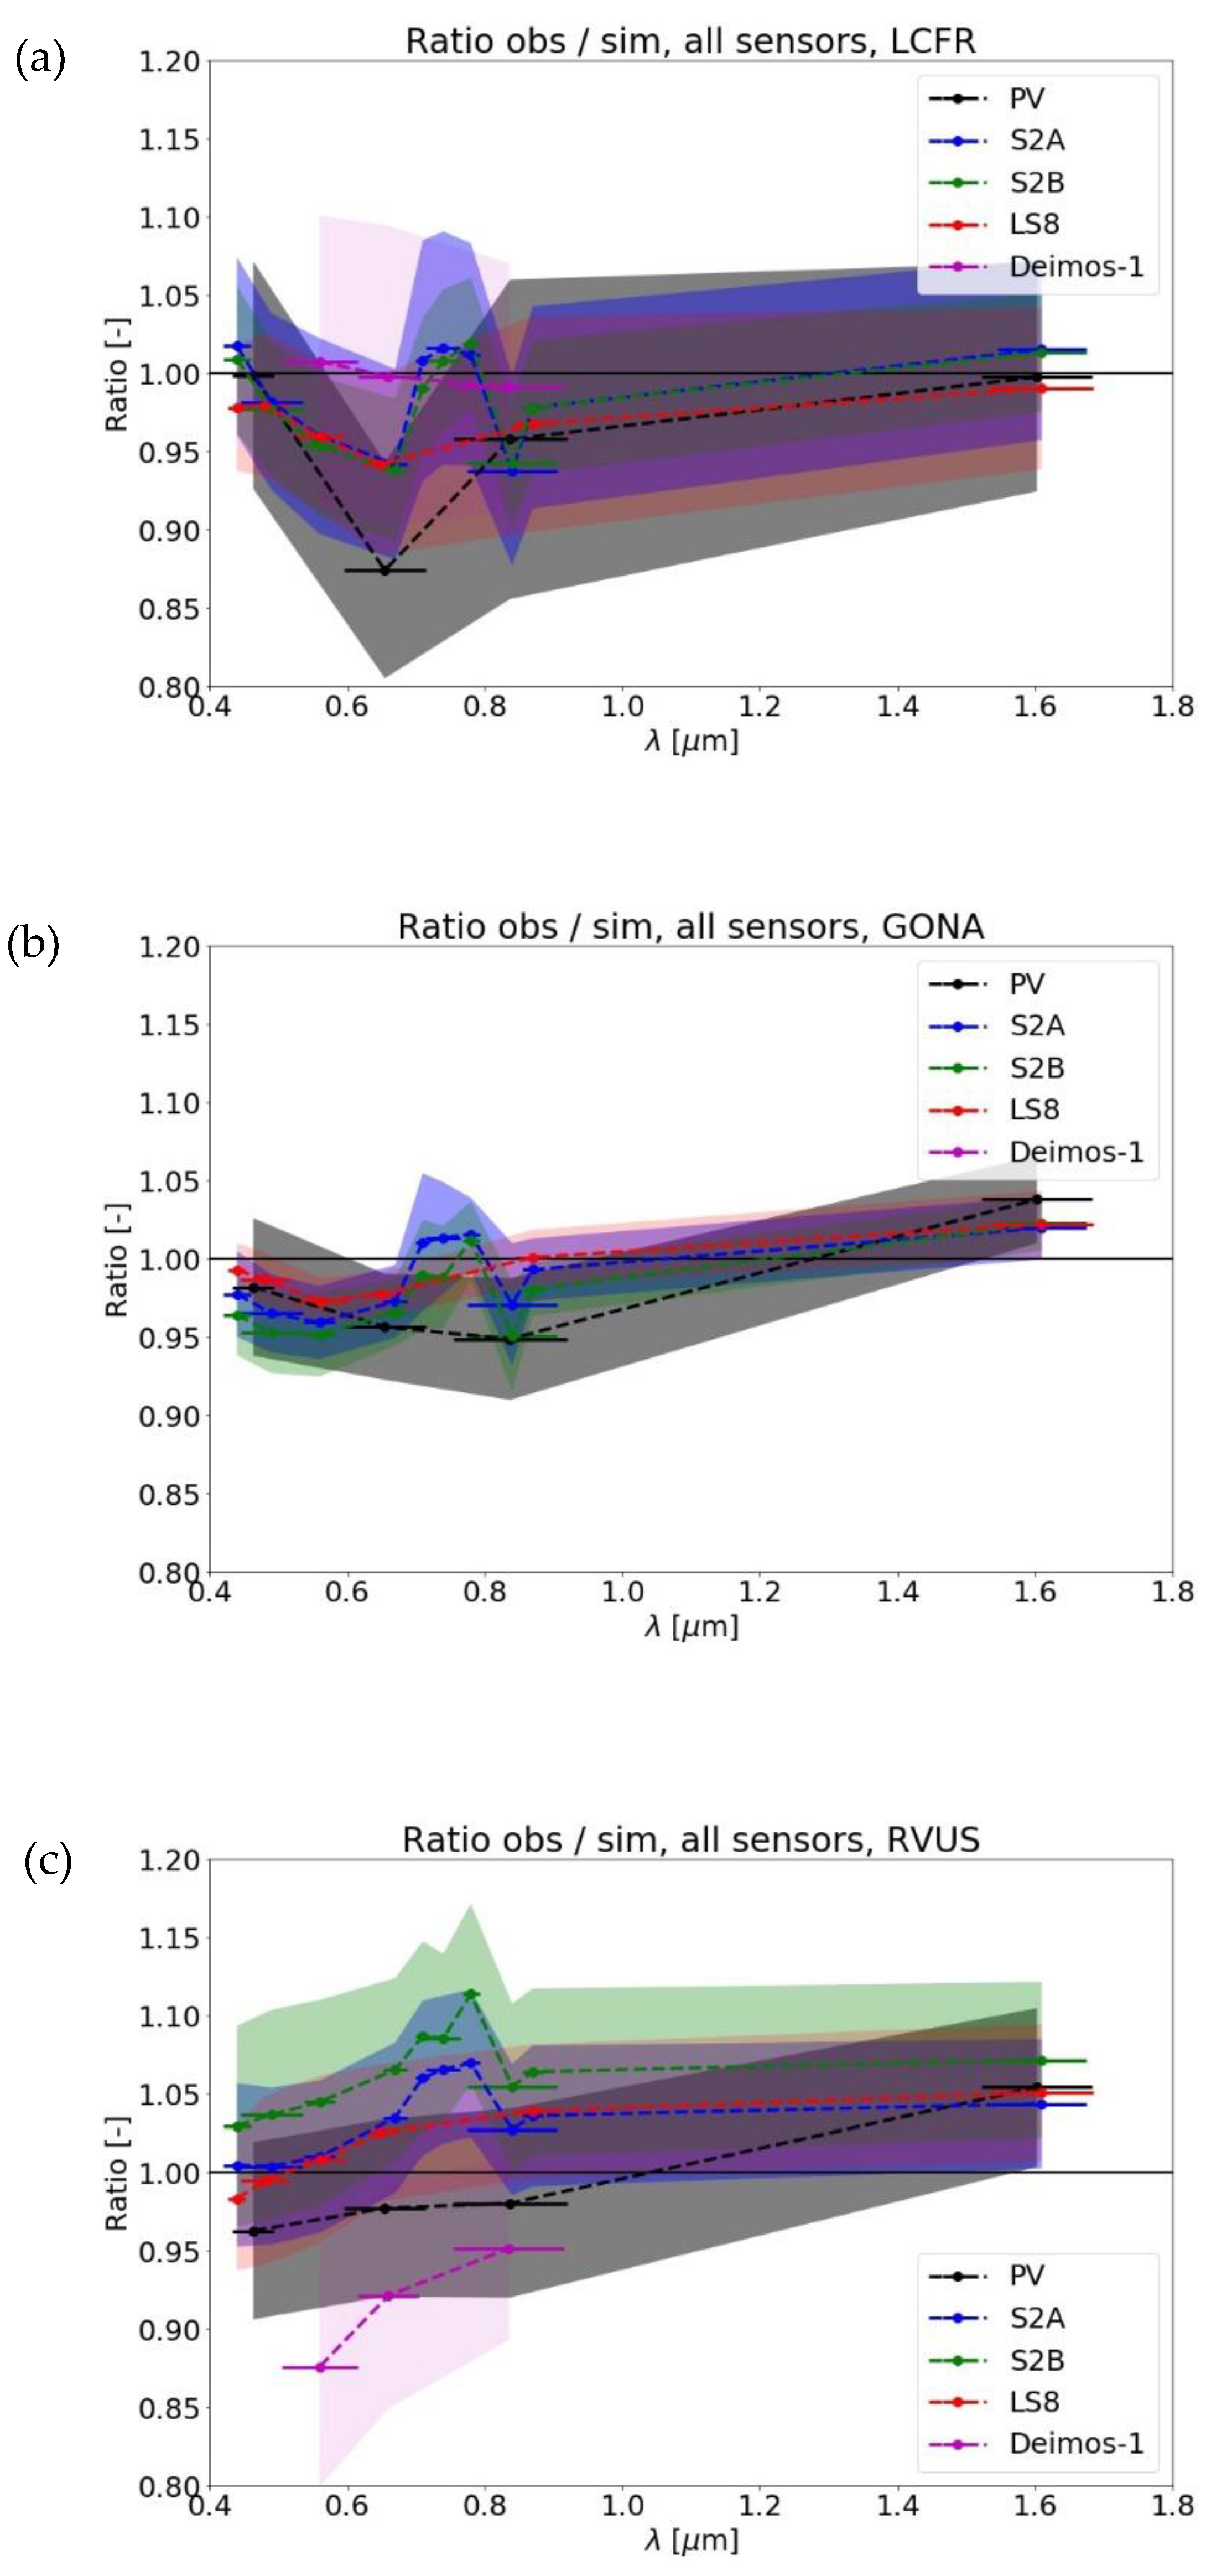
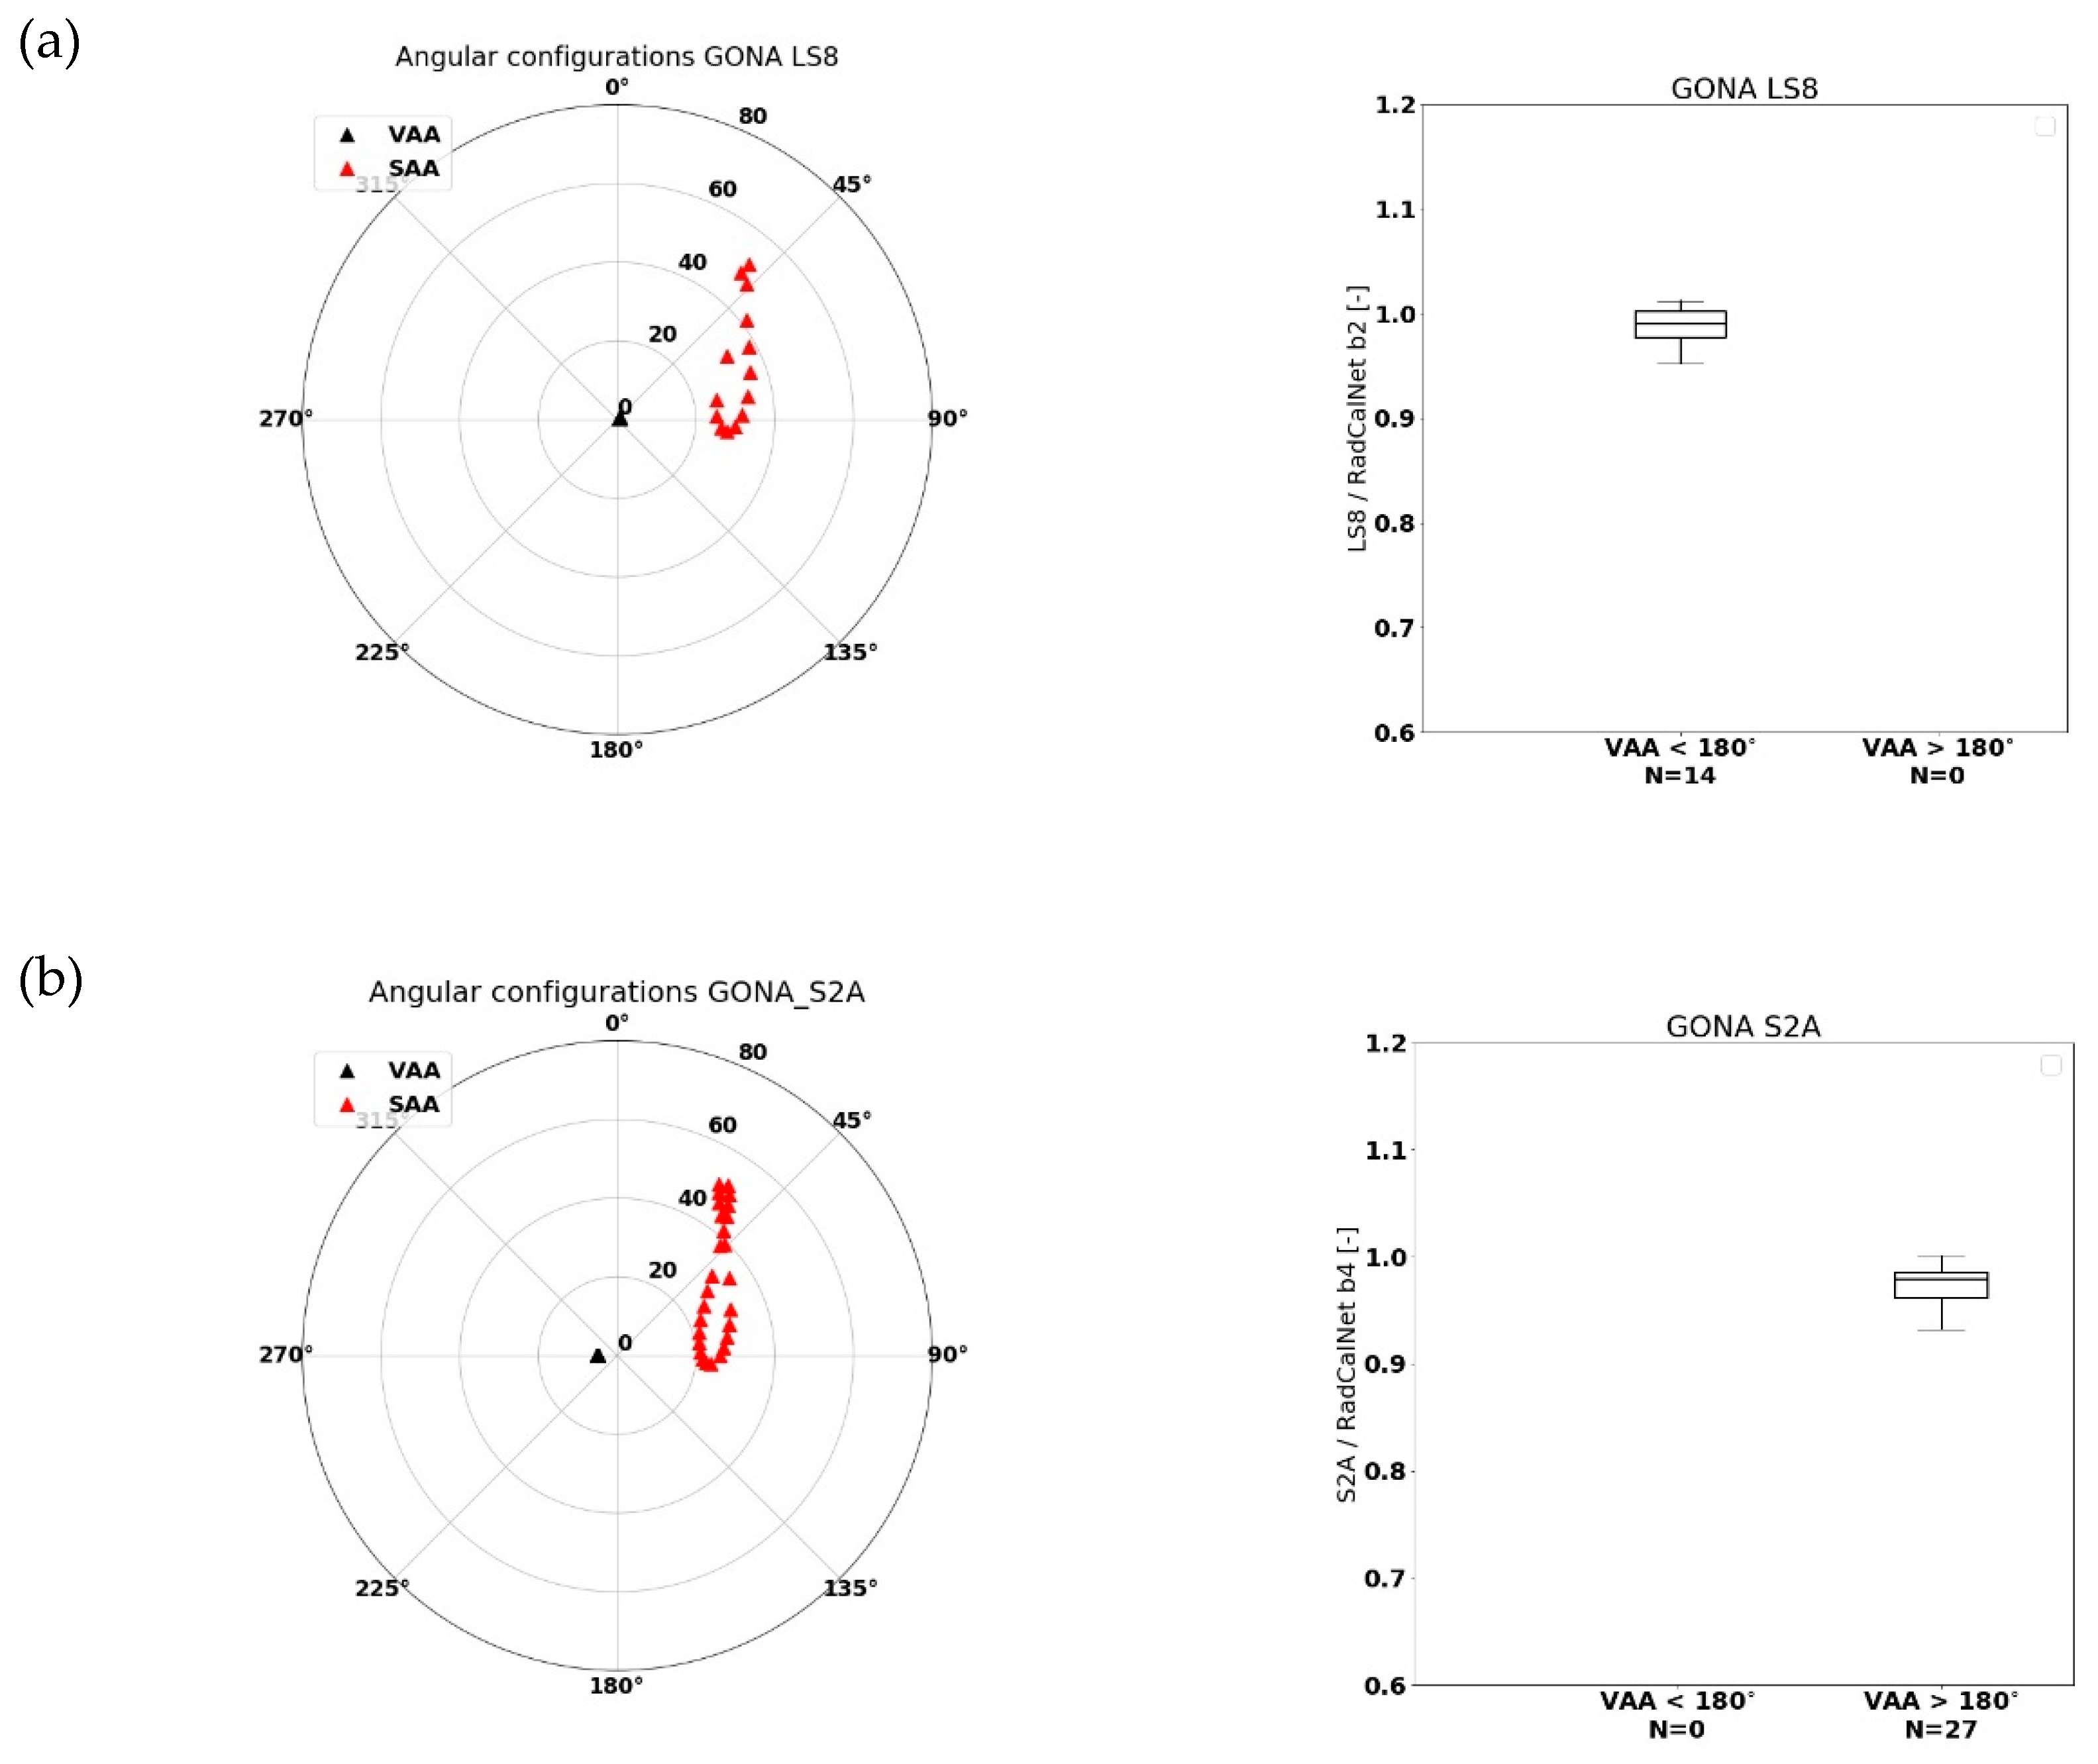
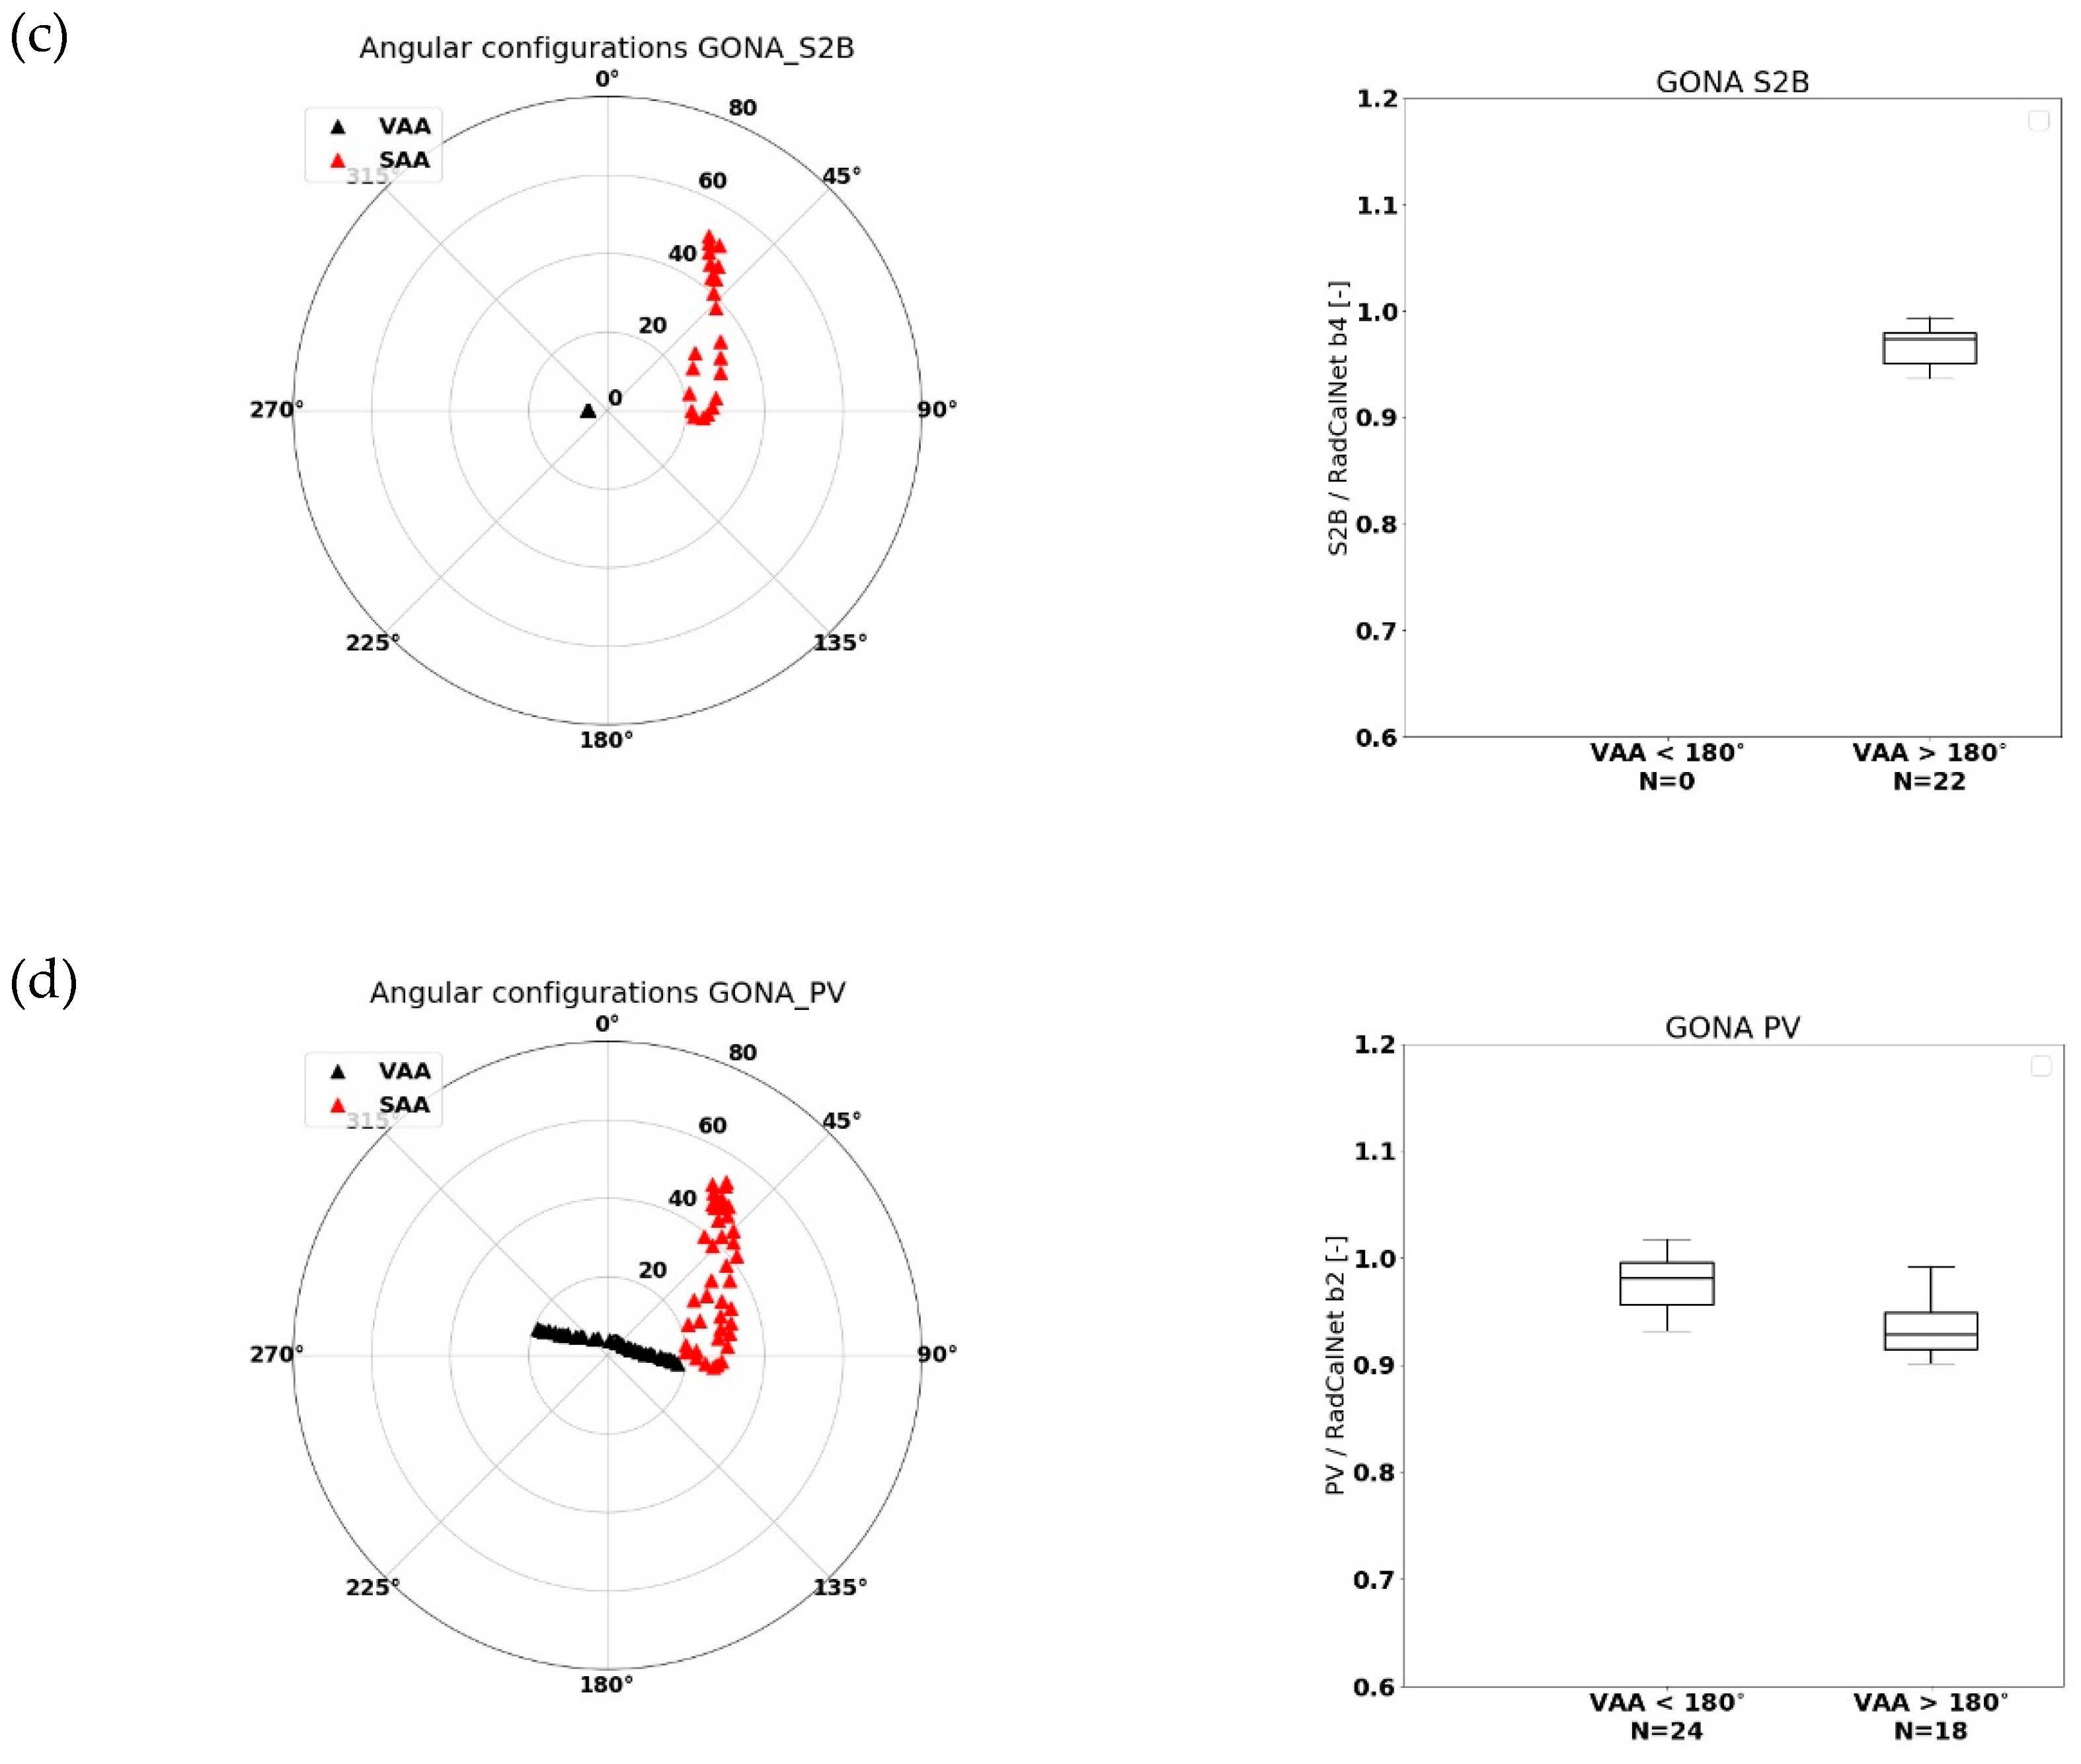
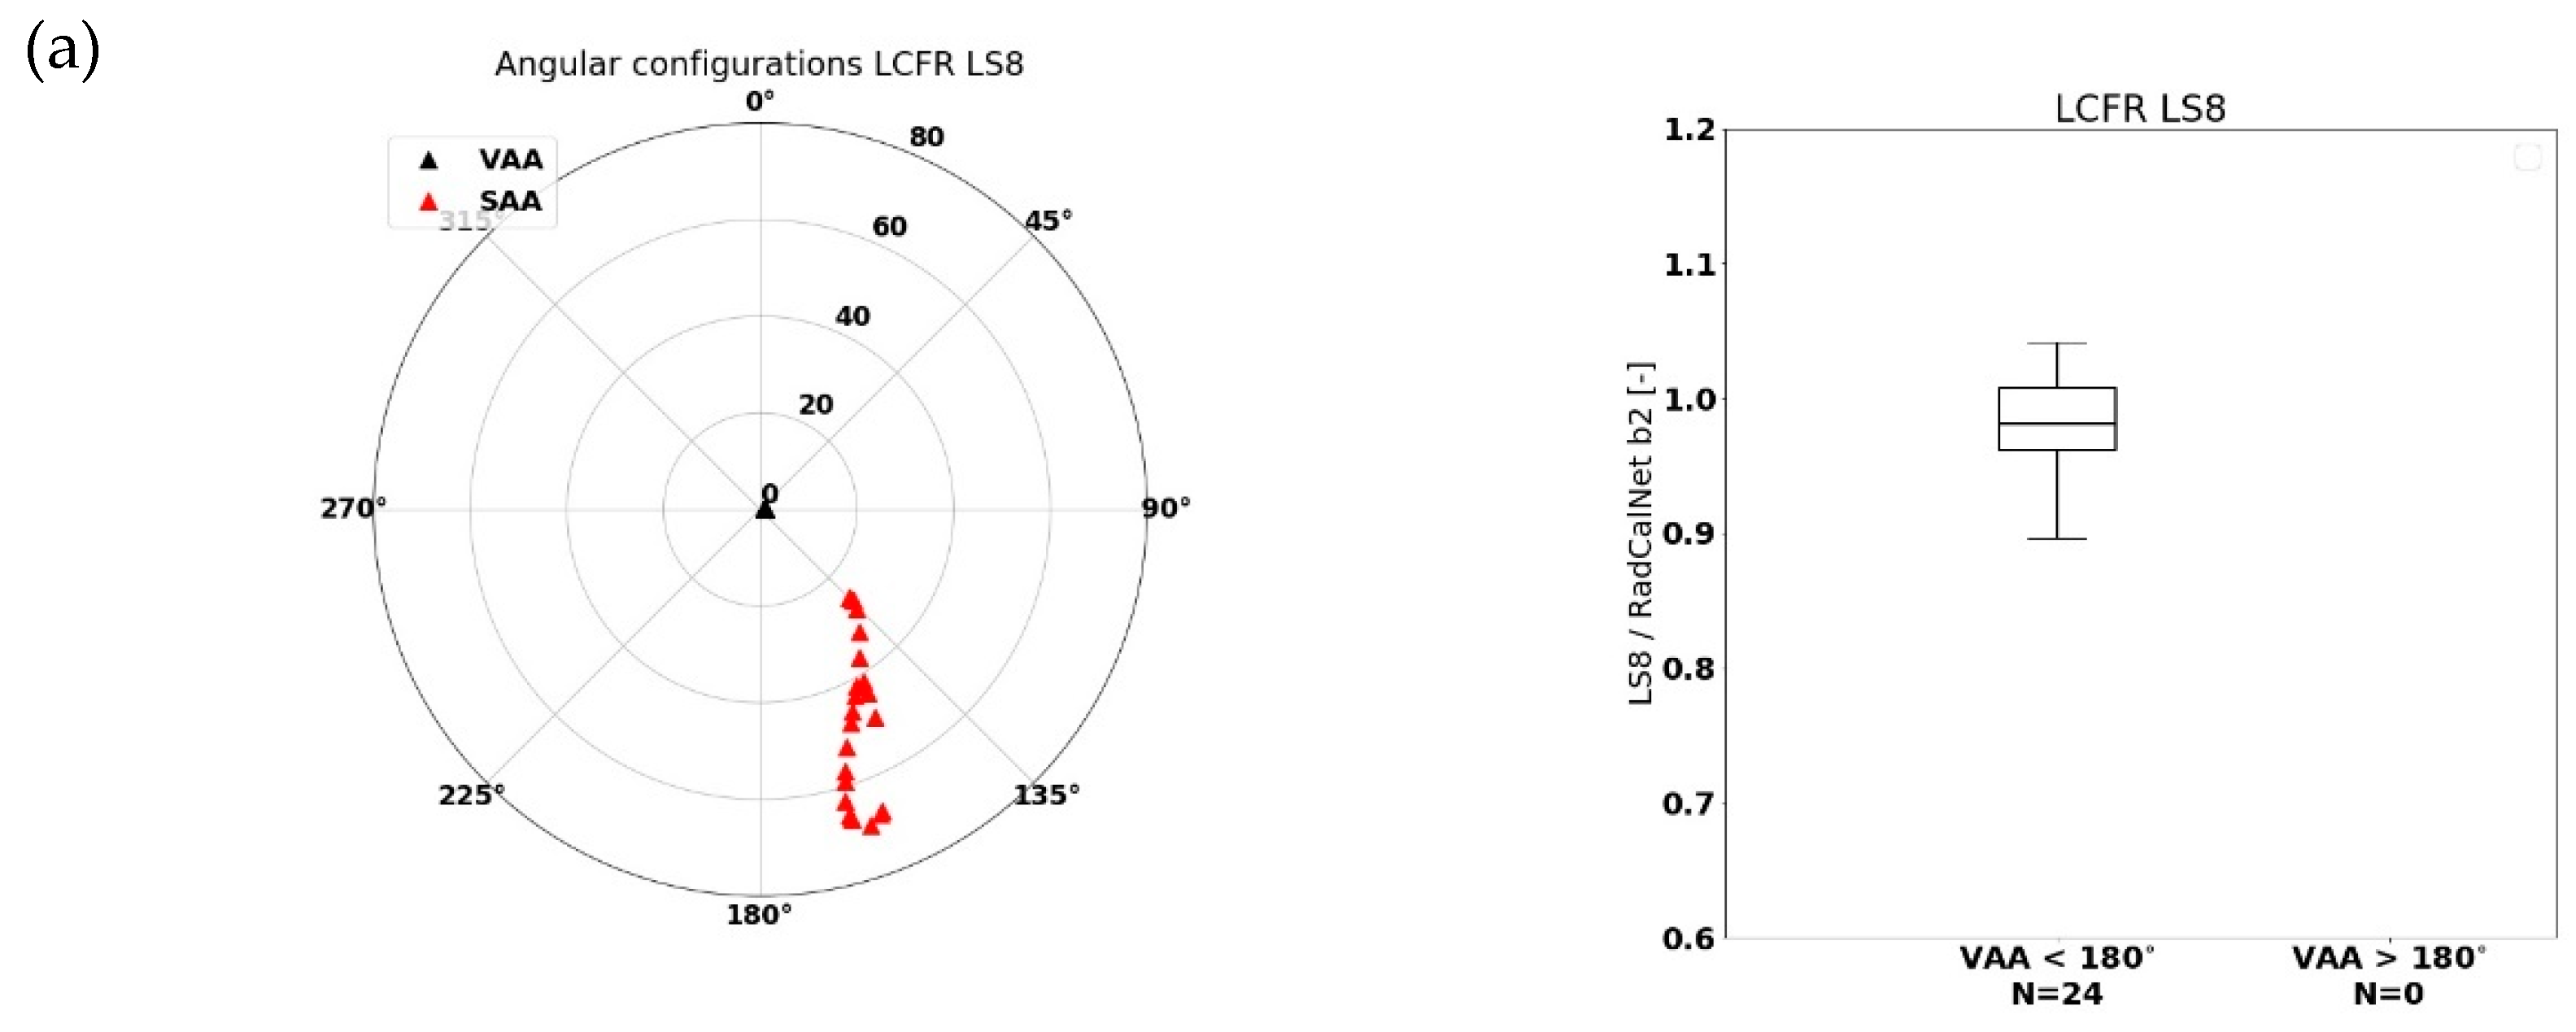
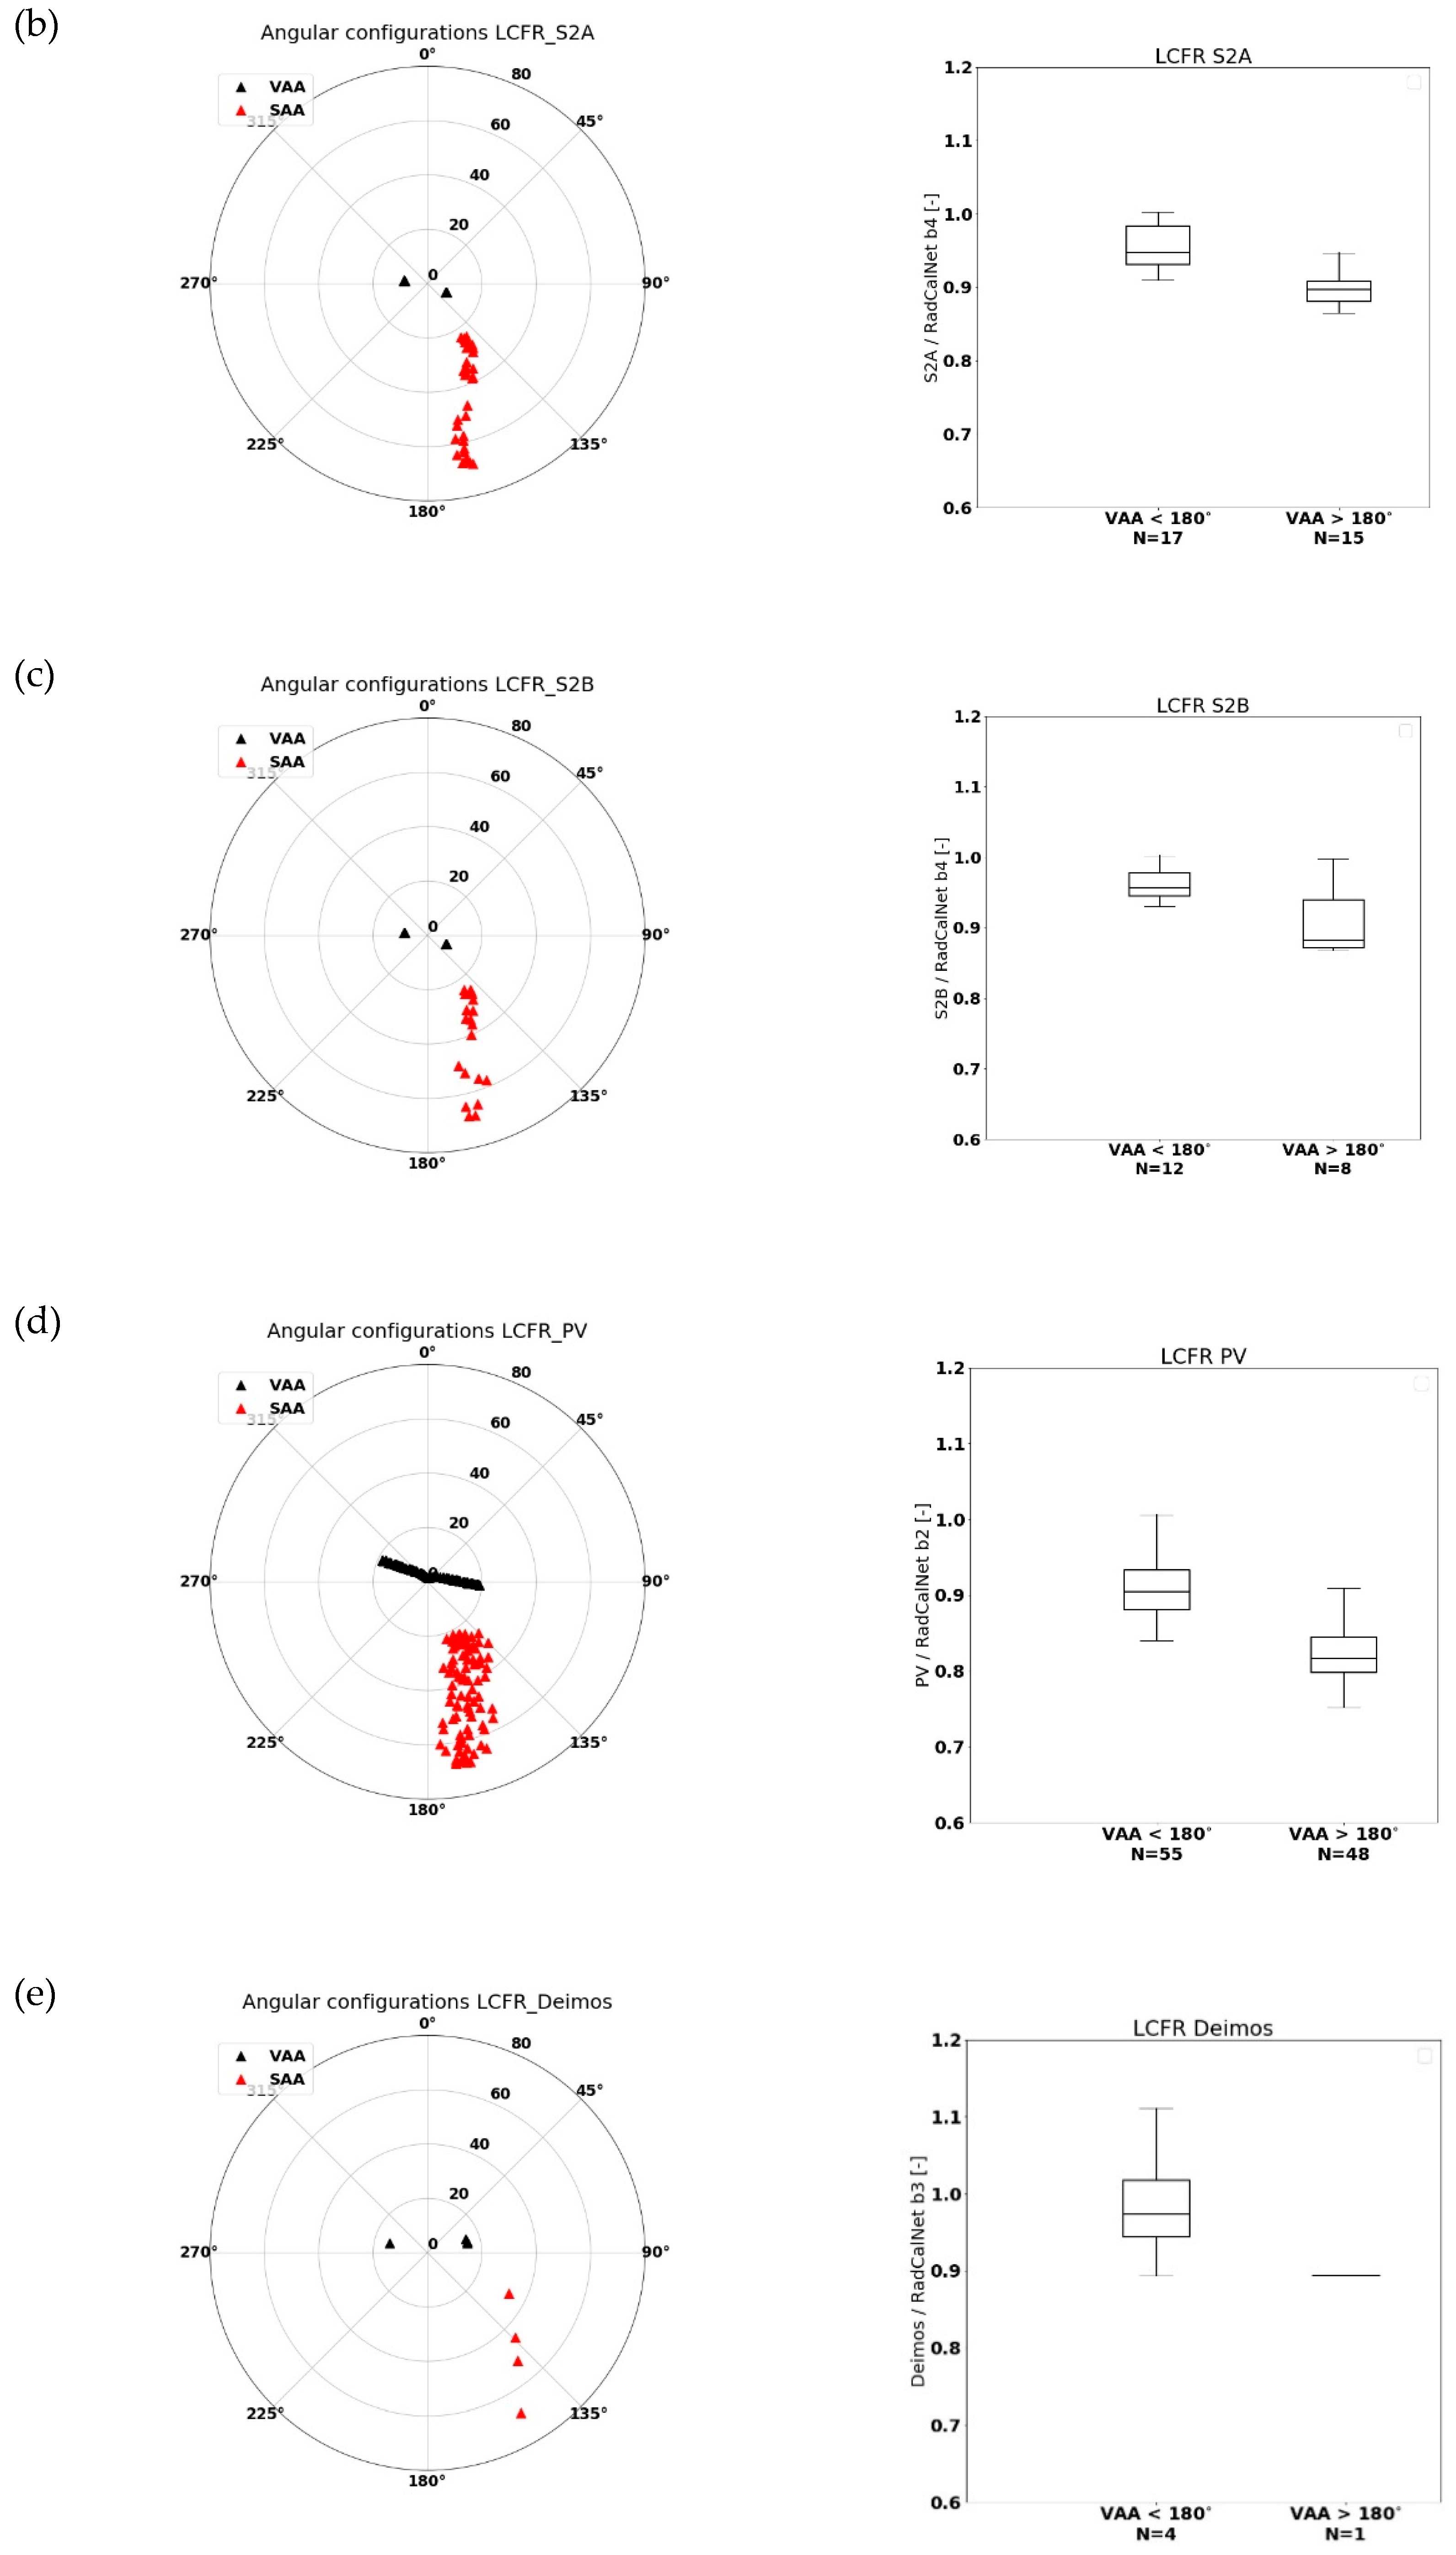
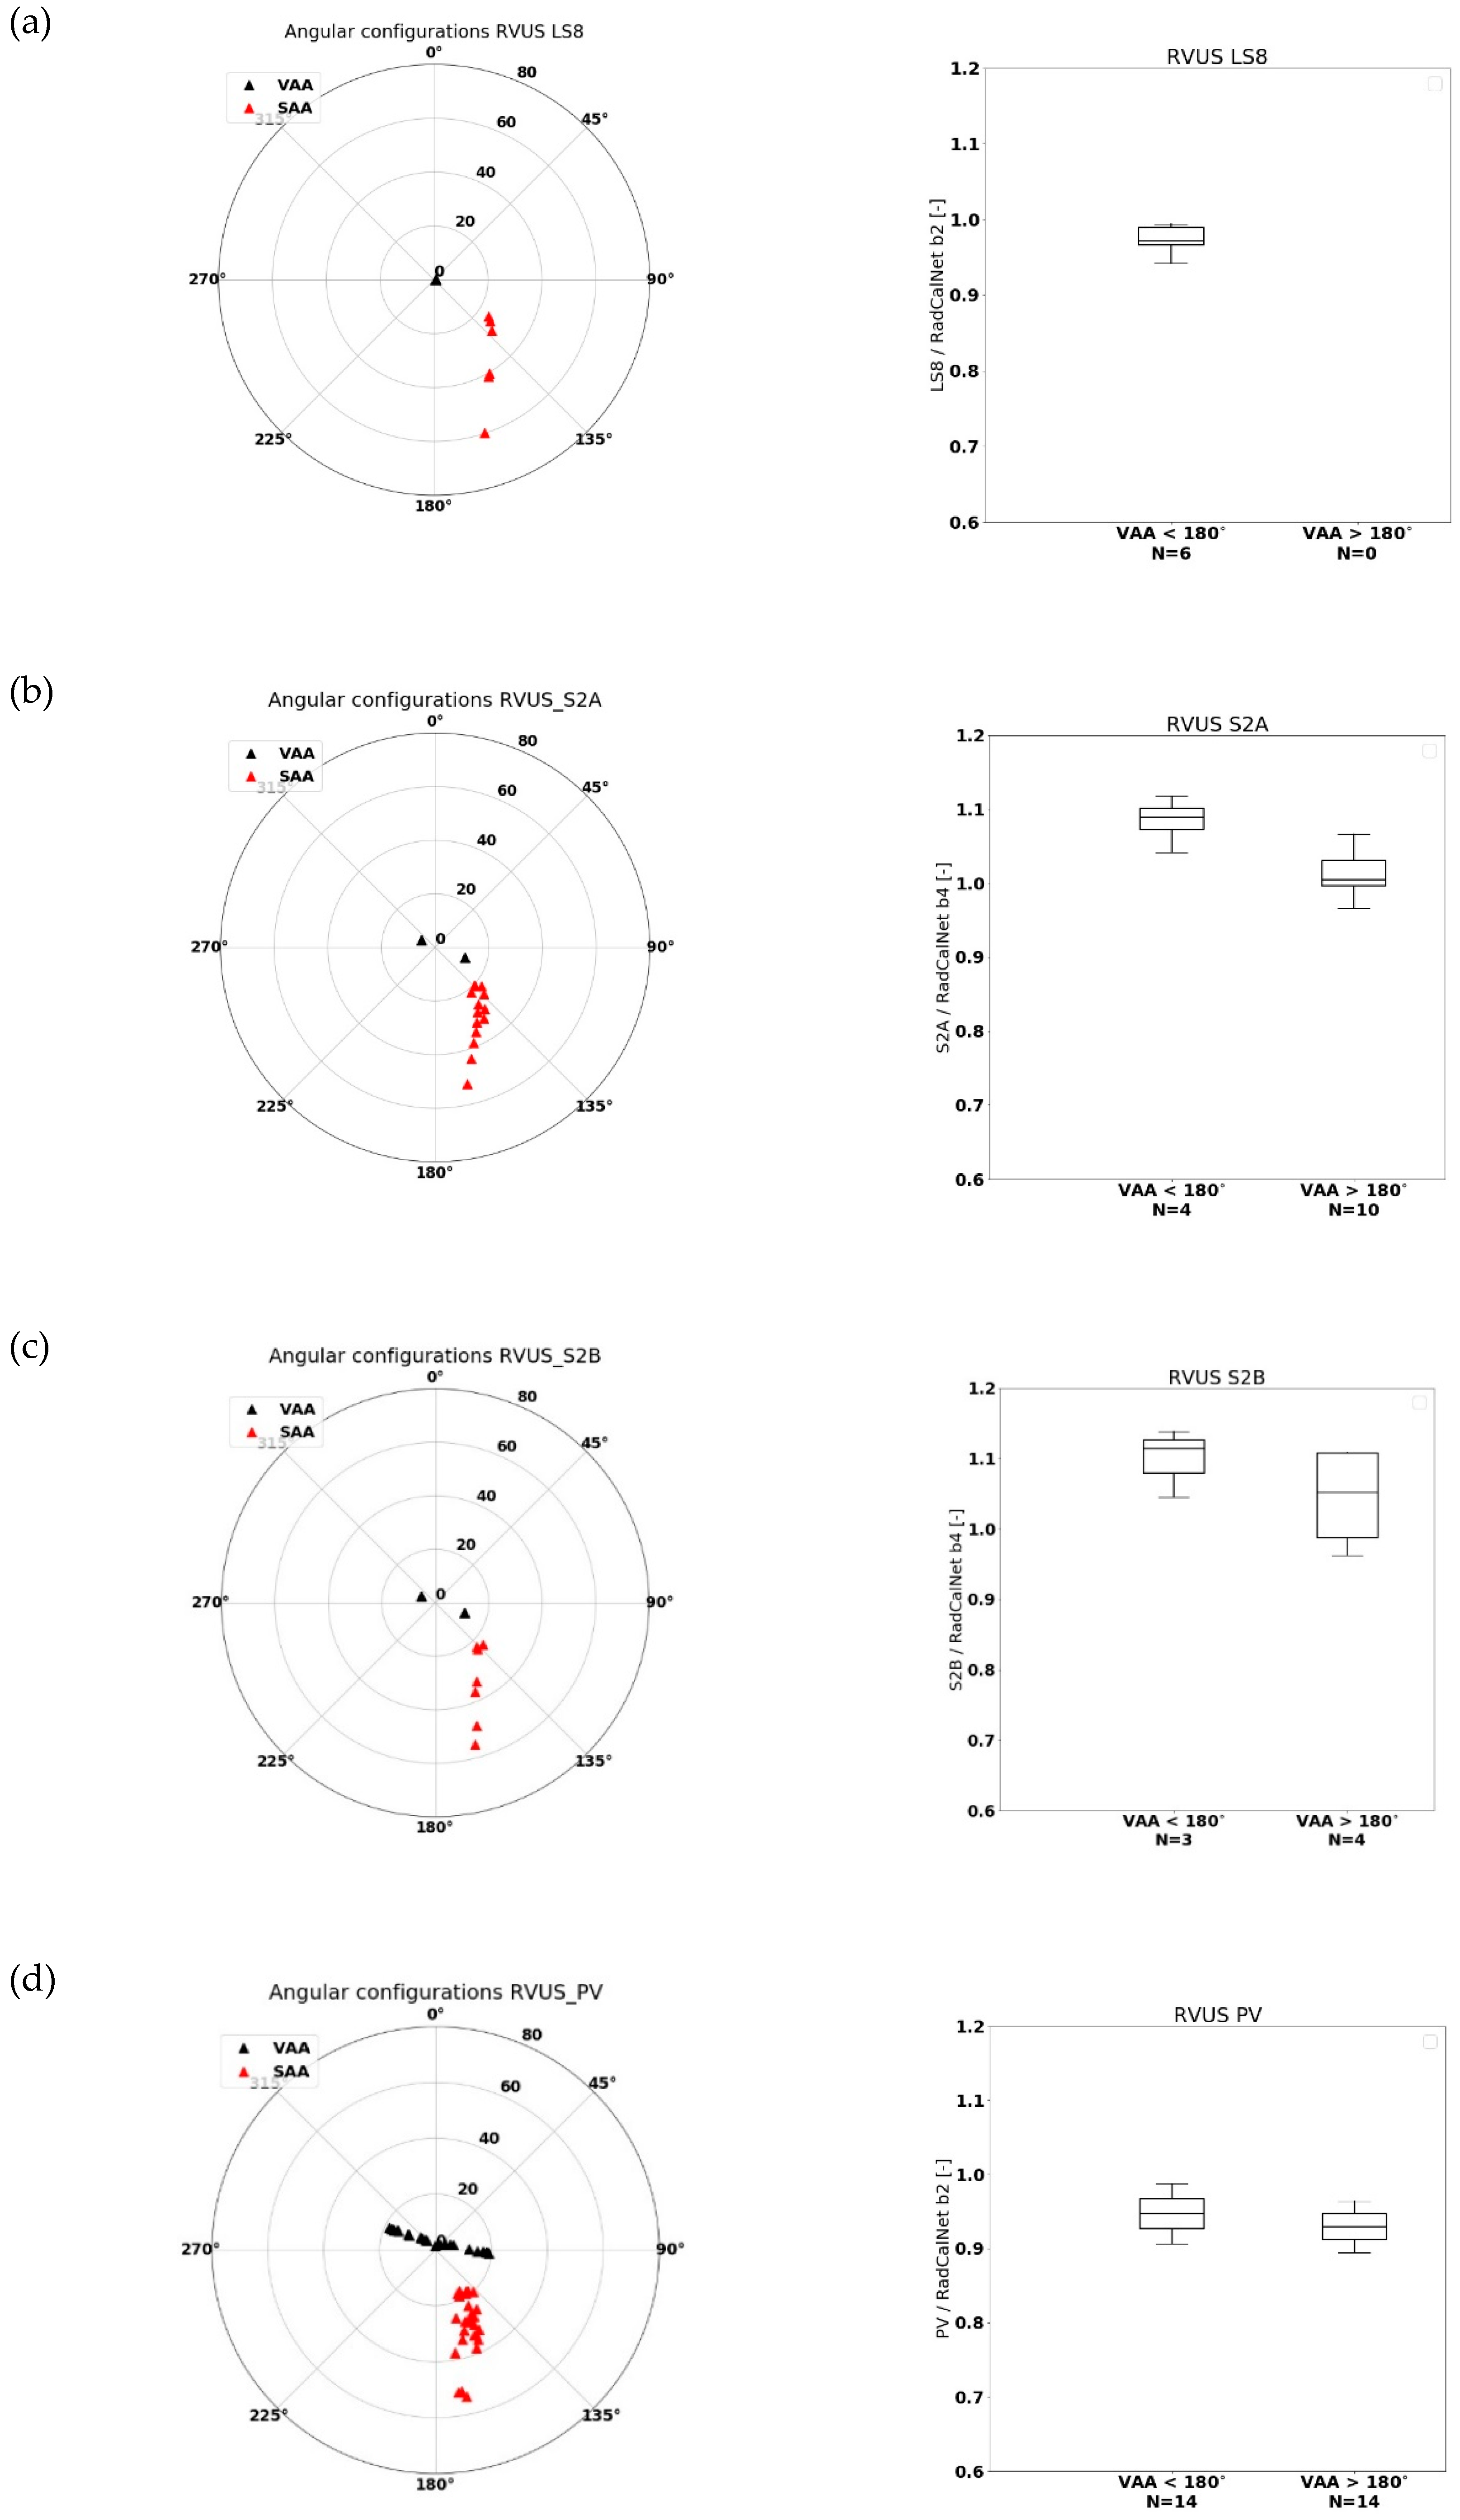
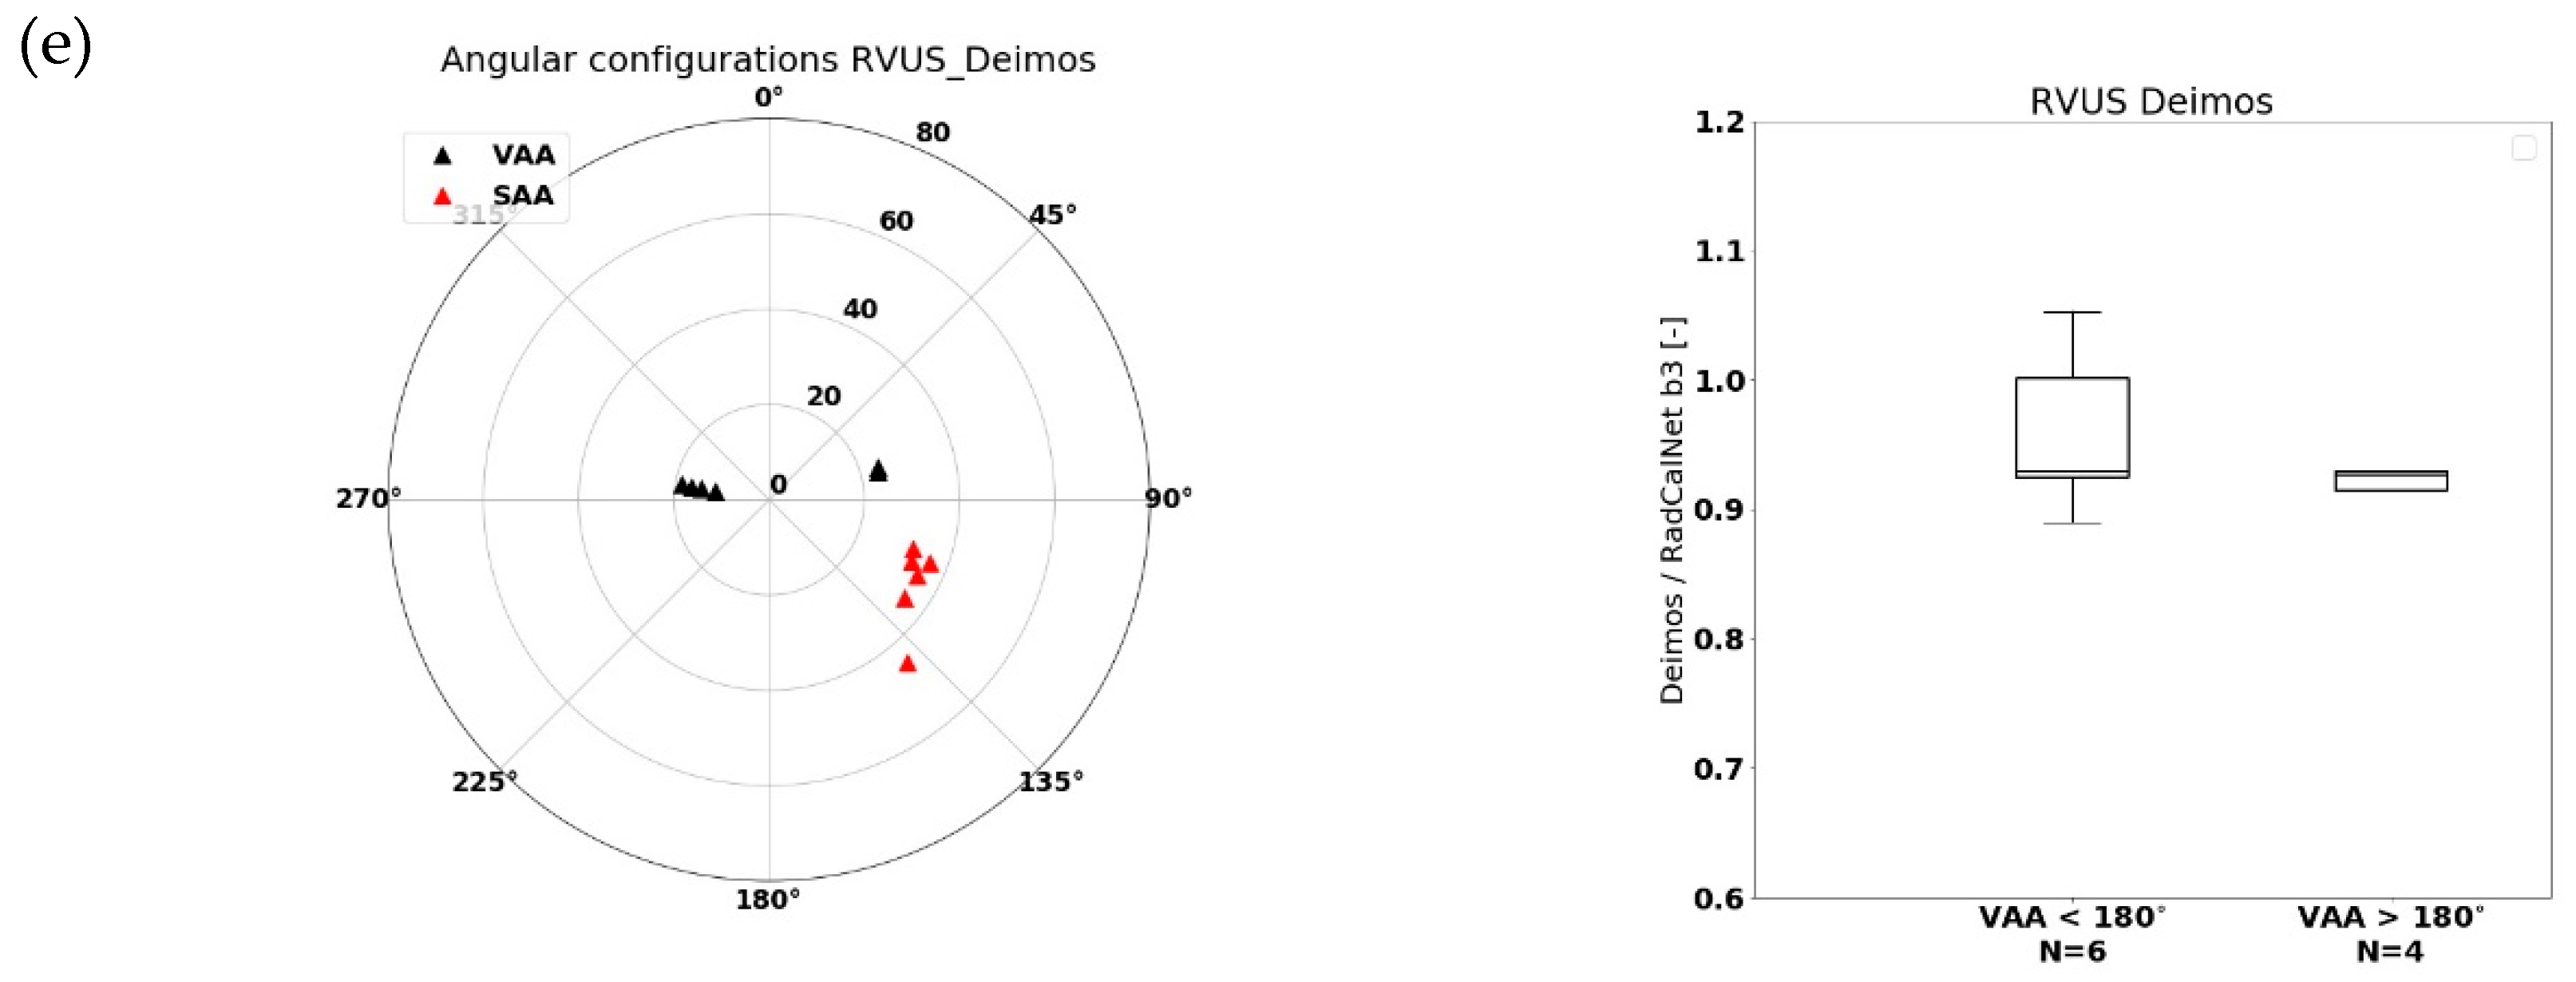
4.2. RadCalNet
5. Discussion
6. Conclusions
Author Contributions
Funding
Acknowledgments
Conflicts of Interest
References
- Harmonization of Multi-Mission High Resolution Time Series: Application to BELAIR. Available online: https://belharmony.vito.be (accessed on 16 July 2019).
- Cao, C.; Weinreb, M.; Xu, H. Predicting simultaneous nadir overpasses among polar-orbiting meteorological satellites for the intersatellite calibration of radiometers. J. Atmos. Ocean. Technol. 2004, 21, 537–542. [Google Scholar] [CrossRef]
- Gao, H.; Gu, X.; Yu, T.; Liu, L.; Sun, Y.; Xie, Y.; Liu, Q. Validation of the calibration coefficient of the GaoFen–1 PMS sensor using the Landsat–8 OLI. Remote Sens. 2016, 8, 132. [Google Scholar] [CrossRef]
- Czapla-Myers, J.; McCorkel, J.; Anderson, N.; Thome, K.; Biggar, S.; Helder, D.; Aaron, D.; Leigh, L.; Mishra, N. The ground-based absolute radiometric calibration of Landsat 8 OLI. Remote Sens. 2015, 7, 600–626. [Google Scholar] [CrossRef]
- Govaerts, Y.; Sterckx, S.; Adriaensen, S. Use of simulated reflectances over bright desert target as an absolute calibration reference. Remote Sens. Lett. 2013, 4, 523–531. [Google Scholar] [CrossRef]
- Mishra, N.; Helder, D.; Angal, A.; Choi, J.; Xiong, X. Absolute Calibration of Optical Satellite Sensors Using Libya 4 Pseudo Invariant Calibration Site. Remote Sens. 2014, 6, 1327–1346. [Google Scholar] [CrossRef] [Green Version]
- Test Sites Catalog. Available online: https://calval.cr.usgs.gov/apps/test_sites_catalog (accessed on 16 July 2019).
- Dierckx, W.; Sterckx, S.; Benhadj, I.; Livens, S.; Duhoux, G.; Van Achteren, T.; Francois, M.; Mellab, K.; Saint, G. PROBA-V mission for global vegetation monitoring: Standard products and image quality. Int. J. Remote Sens. 2014, 35, 2589–2614. [Google Scholar] [CrossRef]
- Sterckx, S.; Benhadj, I.; Duhoux, G.; Livens, S.; Dierckx, W.; Goor, E.; Adriaensen, S.; Heyns, W.; Van Hoof, K.; Strackx, G.; et al. The PROBA-V mission: Image processing and calibration. Int. J. Remote Sens. 2014, 35, 2565–2588. [Google Scholar] [CrossRef]
- Toté, C.; Swinnen, E.; Sterckx, S.; Adriaensen, S.; Benhadj, I.; Iordache, M.; Bertels, L.; Kirches, G.; Stelzer, K.; Dierckx, W.; et al. Evaluation of PROBA-V Collection 1: Refined Radiometry, Geometry, and Cloud Screening. Remote Sens. 2018, 10, 1375. [Google Scholar] [CrossRef]
- Lozano, F.J.; Romo, A.; Moclan, C.; Gil, J.; Pirondini, F. The DEIMOS-1 mission: Absolute and relative calibration activities and radiometric optimization. In Proceedings of the 2012 IEEE International Geoscience and Remote Sensing Symposium, Munich, Germany, 22–27 July 2012; pp. 4754–4757. [Google Scholar] [CrossRef]
- Markham, B.; Barsi, J.; Kvaran, G.; Ong, L.; Kaita, E.; Biggar, S.; Czapla-Myers, J.; Mishra, N.; Helder, D. Landsat-8 Operational Land Imager Radiometric Calibration and Stability. Remote Sens. 2014, 6, 12275–12308. [Google Scholar] [CrossRef] [Green Version]
- Rahman, H.; Pinty, B.; Verstraete, M.M. Coupled Surface-Atmosphere Reflectance (CSAR) model 2. Semiempirical surface model usable with NOAA advanced very high resolution radiometer data. J. Geophys. Res. 1993, 98, 20791–20801. [Google Scholar] [CrossRef]
- Govaerts, Y.M.; Clerici, M. Evaluation of radiative transfer simulations over bright desert calibration sites. IEEE Trans. Geosci. Remote 2004, 42, 176–187. [Google Scholar] [CrossRef]
- Holben, B.N.; Eck, T.F.; Slutsker, I.; Tanre, D.; Buis, J.P.; Setzer, A.; Vermote, E.; Reagan, J.A.; Kaufman, Y.J.; Nakajima, T.; et al. AERONET—A federated instrument network and data archive for aerosol characterization. Remote Sens. Environ. 1998, 66, 1–16. [Google Scholar] [CrossRef]
- Govaerts, Y.M. Sand Dune Ridge Alignment Effects on Surface BRF over the Libya-4 CEOS Calibration Site. Sensors 2015, 15, 3453–3470. [Google Scholar] [CrossRef] [Green Version]
- Bacour, C.; Briottet, X.; Bréon, F.-M.; Viallefont-Robinet, F.; Bouvet, M. Revisiting Pseudo Invariant Calibration Sites (PICS) Over Sand Deserts for Vicarious Calibration of Optical Imagers at 20 km and 100 km Scales. Remote Sens. 2019, 11, 1166. [Google Scholar] [CrossRef]
- Bialek, A.; Greenwell, C.; Lamare, M.; Meygret, A.; Marcq, S.; Lachérade, S.; Woolliams, E.; Berthelot, B.; Bouvet, M.; King, M.; et al. New radiometric calibration site located at Gobabeb, Namib desert. In Proceedings of the 2016 IEEE International Geoscience and Remote Sensing Symposium (IGARSS), Beijing, China, 10–15 July 2016; pp. 6094–6097. [Google Scholar] [CrossRef]
- Czapla-Myers, J.; McCorkel, J.; Anderson, N.; Biggar, S. Earth-observing satellite intercomparison using the Radiometric Calibration Test Site at Railroad Valley. J. Appl. Remote. Sens. 2017, 12. [Google Scholar] [CrossRef] [Green Version]
- RadCalNet Radiometric Calibration Network Portal. Available online: https://www.radcalnet.org/#!/ (accessed on 16 July 2019).
- Marcq, S.; Meygret, A.; Bouvet, M.; Fox, N.; Greenwell, C.; Scott, B.; Berthelot, B.; Besson, B.; Guilleminot, N.; Damiri, B. New RadCalNet site at Gobabeb Namibia: Installation of the instrumentation and first satellite calibration results. In Proceedings of the IGARSS 2018—2018 IEEE International Geoscience and Remote Sensing Symposium, Valencia, Spain, 22–27 July 2018; pp. 6444–6447. [Google Scholar]
- Czapla-Myers, J.; Ong, L.; Thome, K.; McCorkel, J. Validation of EO-1 Hyperion and Advanced Land Imager Using the Radiometric Calibration Test Site at Railroad Valley, Nevada. IEEE J. Sel. Top. Appl. 2016, 9, 816–826. [Google Scholar] [CrossRef]
- Revel, C.; Lonjou, V.; Marcq, S.; Desjardins, C.; Fougnie, B.; Coppolani-Delle, C.; Guilleminot, N.; Lacamp, A.; Lourme, E.; Miquel, C.; et al. Sentinel-2A and 2B absolute calibration monitoring. Eur. J. Remote Sens. 2019, 52, 122–137. [Google Scholar] [CrossRef] [Green Version]
- Jing, X.; Leigh, L.; Teixeira Pinto, C.; Helder, D. Evaluation of RadCalNet Output Data Using Landsat 7, Landsat 8, Sentinel 2A, and Sentinel 2B Sensors. Remote Sens. 2019, 11, 541. [Google Scholar] [CrossRef]
- Helder, D.; Markham, B.; Morfitt, R.; Storey, J.; Barsi, J.; Gascon, F.; Clerc, S.; LaFrance, B.; Masek, J.; Roy, D.P.; et al. Observations and Recommendations for the Calibration of Landsat 8 OLI and Sentinel 2 MSI for Improved Data Interoperability. Remote Sens. 2018, 10, 1340. [Google Scholar] [CrossRef]
- Barsi, J.; Alhammoud, B.; Czapla-Myers, J.; Gascon, F.; Haque, M.H.; Maewmanee, M.; Leigh, L.; Markham, B. Sentinel-2A MSI and Landsat-8 OLI Radiometric Cross Comparison. Eur. J. Remote Sens. 2018, 51, 822–837. [Google Scholar] [CrossRef]
- Sterckx, S.; Adriaensen, S.; Dierckx, W.; Bouvet, M. In-Orbit Radiometric Calibration and Stability Monitoring of the PROBA-V Instrument. Remote Sens. 2016, 8, 546. [Google Scholar] [CrossRef]


| Platform | No. of Obs. |
|---|---|
| Sentinel-2A | 68 |
| Sentinel-2B | 19 |
| Landsat 8 | 62 |
| PROBA-V | 214 |
| Deimos-1 | 91 |
| Sensor | LCFR | RVUS | GONA | Total |
|---|---|---|---|---|
| Sentinel-2A | 32 | 14 | 27 | 73 |
| Sentinel-2B | 20 | 8 | 22 | 50 |
| Landsat 8 | 24 | 6 | 14 | 44 |
| PROBA-V | 103 | 28 | 42 | 173 |
| Deimos-1 | 4 | 7 | 0 | 11 |
| S2 | S2 | S2A | S2B | LS8 | LS8 | LS8 | Deimos1 | Deimos1 | Deimos1 | PV | PV | PV |
|---|---|---|---|---|---|---|---|---|---|---|---|---|
| band | cwv | ratio | ratio | band | cwv | ratio | band | cwv | ratio | band | cwv | ratio |
| 1 | 443 | 1.008 | 0.997 | CA | 443 | 0.997 | Blue | 460 | 0.995 | |||
| 2 | 490 | 0.985 | 0.985 | Blue | 492 | 0.994 | ||||||
| 3 | 560 | 0.999 | 0.997 | Green | 561 | 1.007 | Green | 549 | 0.964 | |||
| 4 | 665 | 1.005 | 0.998 | Red | 654 | 1.006 | Red | 679 | 1.007 | Red | 658 | 0.990 |
| 5 | 705 | 1.016 | 1.003 | |||||||||
| 6 | 740 | 1.023 | 1.007 | |||||||||
| 7 | 783 | 1.034 | 1.020 | |||||||||
| 8 | 842 | 0.999 | 0.995 | NIR | 803 | 1.007 | NIR | 834 | 1.007 | |||
| 8A | 865 | 1.027 | 1.018 | NR | 865 | 1.024 | ||||||
| 9 | 945 | NA | NA | |||||||||
| 10 | 1375 | NA | NA | Cirrus | 1373 | NA | ||||||
| 11 | 1610 | 0.998 | 0.994 | SWIR1 | 1610 | 0.995 | SWIR | 1610 | 0.996 | |||
| 12 | 2190 | 0.973 | 0.971 | SWIR2 | 2200 | 0.975 |
| S2 | S2 | S2A | % dif S2B | LS8 | LS8 | % dif LS8 | Deimos1 | Deimos-1 | % dif D-1 | PV | PV | % dif PV |
|---|---|---|---|---|---|---|---|---|---|---|---|---|
| band | cwv | ratio | vs S2A | band | cwv | vs S2A | band | cwv | vs S2A | band | cwv | vs S2A |
| 1 | 443 | 1.008 | −1.05% | CA | 443 | −1.05% | Blue | 460 | −1.30% | |||
| 2 | 490 | 0.985 | −0.03% | Blue | 492 | 0.94% | 460 | 0.97% | ||||
| 3 | 560 | 0.999 | −0.16% | Green | 561 | 0.82% | Green | 549 | −3.5% | |||
| 4 | 665 | 1.005 | −0.76% | Red | 654 | 0.08% | Red | 679 | 0.2% | Red | 658 | −1.55% |
| 5 | 705 | 1.016 | −1.32% | |||||||||
| 6 | 740 | 1.023 | −1.49% | |||||||||
| 7 | 783 | 1.034 | −1.35% | |||||||||
| 8 | 842 | 0.999 | −0.40% | NIR | 803 | 0.8% | NIR | 834 | 0.78% | |||
| 8A | 865 | 1.027 | −0.84% | NR | 865 | −0.28% | ||||||
| 9 | 945 | NA | NA | |||||||||
| 10 | 1375 | NA | NA | Cirrus | 1373 | NA | ||||||
| 11 | 1610 | 0.998 | −0.40% | SWIR1 | 1610 | −0.30% | SWIR | 1610 | −0.21% | |||
| 12 | 2190 | 0.973 | −0.12% | SWIR2 | 2200 | 0.28% |
© 2019 by the authors. Licensee MDPI, Basel, Switzerland. This article is an open access article distributed under the terms and conditions of the Creative Commons Attribution (CC BY) license (http://creativecommons.org/licenses/by/4.0/).
Share and Cite
Sterckx, S.; Wolters, E. Radiometric Top-of-Atmosphere Reflectance Consistency Assessment for Landsat 8/OLI, Sentinel-2/MSI, PROBA-V, and DEIMOS-1 over Libya-4 and RadCalNet Calibration Sites. Remote Sens. 2019, 11, 2253. https://0-doi-org.brum.beds.ac.uk/10.3390/rs11192253
Sterckx S, Wolters E. Radiometric Top-of-Atmosphere Reflectance Consistency Assessment for Landsat 8/OLI, Sentinel-2/MSI, PROBA-V, and DEIMOS-1 over Libya-4 and RadCalNet Calibration Sites. Remote Sensing. 2019; 11(19):2253. https://0-doi-org.brum.beds.ac.uk/10.3390/rs11192253
Chicago/Turabian StyleSterckx, Sindy, and Erwin Wolters. 2019. "Radiometric Top-of-Atmosphere Reflectance Consistency Assessment for Landsat 8/OLI, Sentinel-2/MSI, PROBA-V, and DEIMOS-1 over Libya-4 and RadCalNet Calibration Sites" Remote Sensing 11, no. 19: 2253. https://0-doi-org.brum.beds.ac.uk/10.3390/rs11192253