1. Introduction
Earth observation (EO) is used for a wide range of societal and commercial applications. Increasingly users are combining data from different sensors, either to provide long-term records of environmental change that require time series greater than the lifetime of a single sensor, or to provide operational services using data from different sensors (from different satellites) to maximize coverage. Both the space agencies and commercial operators are launching a wider range of sensors with different spectral bands, and increasingly small, relatively cheap sensors are being launched with no on-board calibration (e.g., onboard CubeSats). Post-launch radiometric performance assessment of Earth observation optical sensors is essential to understand changes occurring after preflight laboratory characterizations and calibrations. EO optical sensors can benefit from the use of vicarious calibration approaches whether they rely on onboard calibration devices or not. The work here concentrates on the radiometric calibration of earth imagers operating in the visible to shortwave infrared spectral range (400 nm to 1000 nm).
Vicarious techniques concentrating on radiometric calibration in the visible to short-wave infrared spectral range have been developed to provide calibration for a single sensor, including absolute [
1], band-to-band [
2], and detector-to-detector relative for a single band [
3,
4]. Multiple sensor approaches have been developed to ensure consistency between multiple sensors of different type [
5,
6].
The work presented here traces its heritage to the long history of vicarious calibration methods linking in situ radiometric measurements to a spaceborne sensor, either directly or via a reference sensor. One of the first applications of such techniques dates to [
7], who measured the radiance above a ground target from a high-altitude aircraft to verify the degradation of the response of the Coastal Zone Color Scanner’s shorter wavelength bands [
8]. Sensors on an Earth Resources (ER-2) aircraft provided cross-calibration of the Advanced Very High Resolution Radiometer (AVHRR) via sensors onboard the ER-2 aircraft [
9]. The basic concept of such comparison involves two sensors viewing the same instrumented site at the same time from the same viewing geometry with identical spectral bands. Teillet et al. developed a variation of the approach to account for the unavoidable small differences in view and solar geometry [
10]. The method relies on spatially and spectrally characterizing the surface reflectance from aircraft data and using the reflectance with coincident atmospheric data to predict the at-sensor radiance. Such an approach was used to compare data from a wide array of sensors viewing the Railroad Valley instrumented site on a single day [
11] and has been used to cross-compare data from sensors viewing the site on different dates [
12].
The reflectance-based approach was developed in the 1980s for the calibration of Landsat 4 and 5 Thematic Mapper [
13,
14]. The reflectance-based method relies on measurements of surface reflectance and atmospheric conditions at a selected instrumented site nearly coincident in time with the overpass of an imager to be calibrated. The use of a radiative transfer code permits the calculation of the top-of-atmosphere (TOA) radiance that is used to evaluate the radiometric calibration of the sensor being evaluated. The method has been successfully used for many sensors relying on several instrumented sites with data collected by groups in multiple countries [
15,
16,
17,
18,
19,
20,
21]
One drawback of the reflectance-based approach is that poor weather, budget limitations, and personnel constraints can limit the number of successful data collections. It is also not feasible to apply the approach to a large number of sensors that do not share overpass times and dates. Automated approaches to address these issues have been developed that rely on slightly different processing approaches but essentially the same types of ground-based data to provide results similar in absolute and relative uncertainty as those of the traditional reflectance-based approach [
22].
Methods are now needed that permit comparisons of a wide range of sensors that do not concentrate on one-to-one comparisons between sensors. Automated collections over multiple sites are well-suited to allow intercomparisons of many sensors. Ensuring that the in situ data from those sites are traceable to the international system of units (SI-traceable) with known uncertainties allows the combination of results from the multiple sites in a straightforward fashion.
This paper describes the overall Radiometric Calibration Network (RadCalNet) concept, including descriptions of the initial four sites that are part of the network. The processing approach for RadCalNet is presented along with sample uncertainties, and more importantly, the approaches that are being implemented within RadCalNet to ensure that network members are following appropriate methods for determining uncertainties. The last section of the paper shows an example interconsistency study between two sensors and two independent instrumented sites to illustrate how RadCalNet users will benefit from the data available from the network.
2. RadCalNet Overview
RadCalNet, the Radiometric Calibration Network, is a network of sites that can be used to compare different satellite sensors to each other and to a common reference. RadCalNet was proposed and implemented within the Infrared Visible Optical Sensors (IVOS) Subgroup of the Committee on Earth Observation Satellites (CEOS) Working Group on Calibration and Validation (WGCV) and was made publicly available in June 2018 as a culmination of almost two decades’ effort within WGCV and IVOS, beginning with the definition of the original LandNet sites [
23].
RadCalNet is based on the reflectance-based approach described above, with continuous deployment of automated instrumentation that is calibrated traceably to SI and with known, and peer-reviewed, uncertainties. Results from previous automated sites [
24] and [
25] have shown that they can achieve uncertainties similar to collection [
26]
The RadCalNet concept has been developed to address temporal sampling issues, and to provide global consistency, by networking the measurements from several automated sites and making these data widely available to teams responsible for the in-flight monitoring of sensors as well as to users of those sensors. Data from the different automated instrumented sites are quality controlled and processed to TOA reflectances (see
Section 2.3) that are suitable for vicarious calibration or radiometric monitoring of a sensor viewing the sites. There are admittedly limitations as to how these data can be used for the in-flight assessment of spaceborne sensors as they are provided only at a 30-min interval for a nadir viewing configuration only. Although this limits the possibilities of matching up the data with spaceborne sensors with off-nadir viewing angles, it should allow for intercomparison with sensors viewing any of the sites with low viewing angles. While additional data might be gathered by site owners at each site allowing for off-nadir and higher temporal or spectral resolution TOA reflectance simulations, these are not available through RadCalNet (site owners should be contacted directly). Moreover, the RadCalNet are representative of areas on the ground that can only be matched by a sensor having sufficiently high spatial resolution. In addition, the RadCalNet TOA reflectance are derived through the reflectance-based methodology e.g.,: ([
26,
27]) in which typical uncertainty in predicting TOA atmosphere reflectance is estimated to be around 5%. While the RadCalNet TOA reflectance and their associated uncertainty should be sufficient to assess the in-flight radiometric performance of spaceborne sensors operating in the visible to shortwave infrared designed with an absolute radiometric accuracy requirement of the order of 5% (as typically required for land-monitoring space missions), they might not be able to address the needs of sensor with high absolute radiometric calibration requirements of around 2% (such as ocean color space missions). The data are made available through a web portal to registered users [
28]. This paper describes this networked approach along with the methods applied to ensure consistency of the results from the different sites and the SI-traceability of the data.
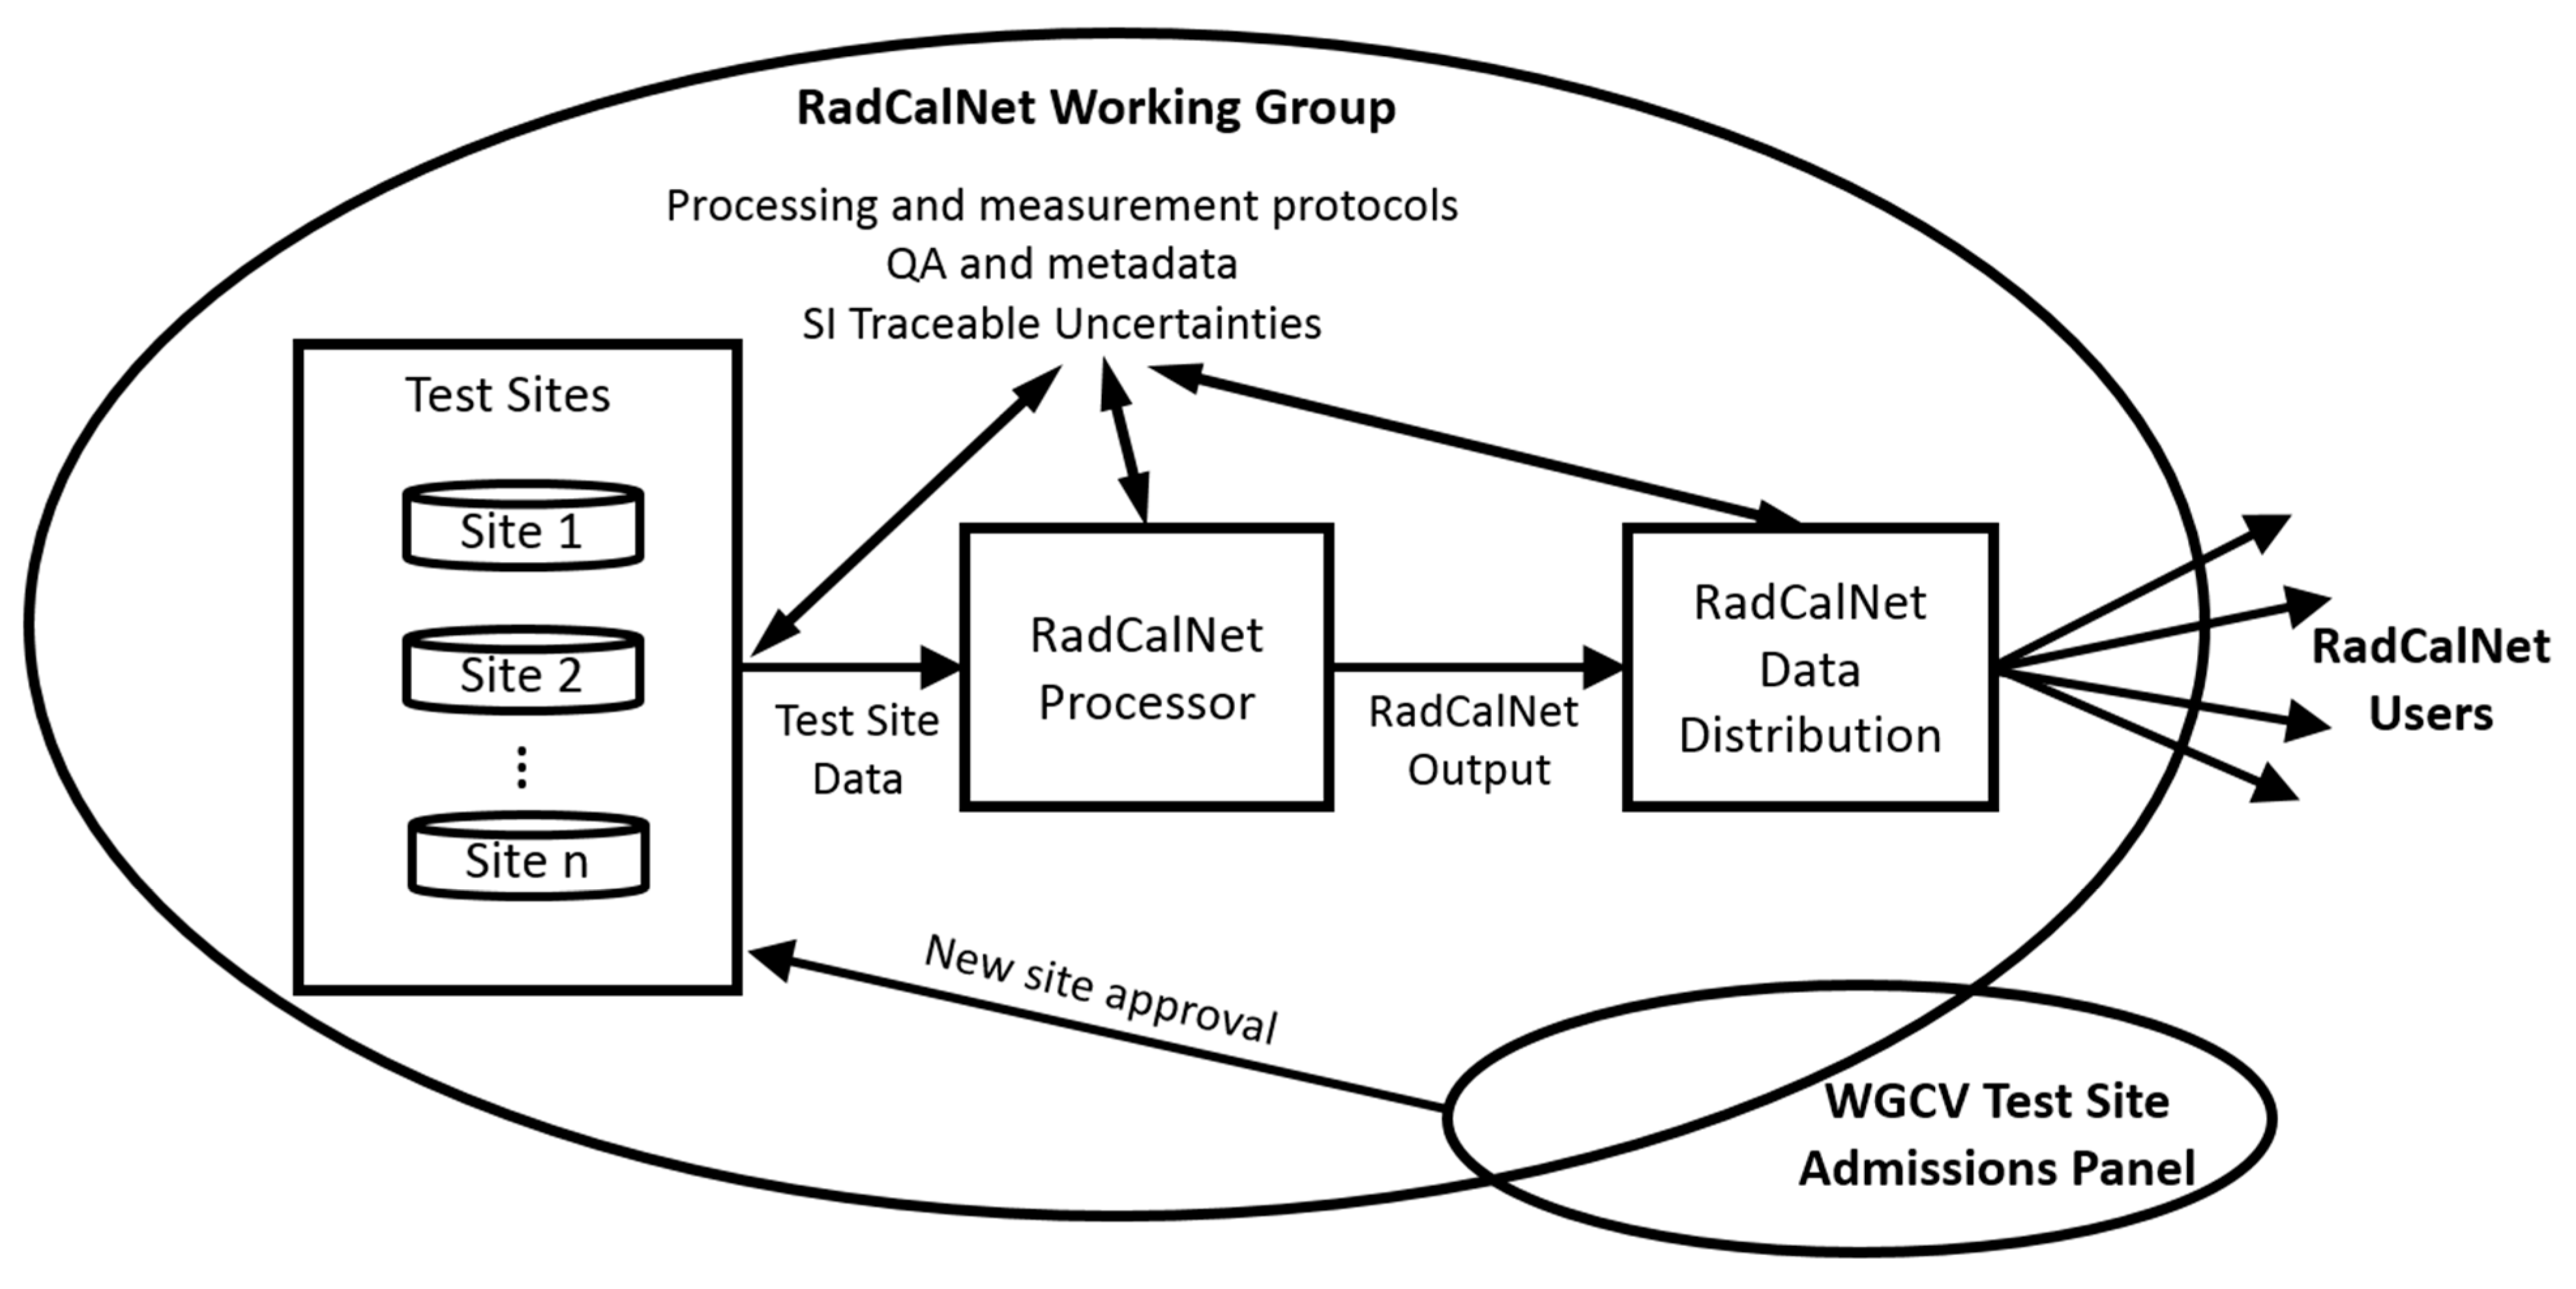
There are six parts of RadCalNet: 1) Instrumented sites and their operators; 2) RadCalNet Quality Control and Processing; 3) RadCalNet Data Distribution; 4) RadCalNet Working Group; 5) RadCalNet Admission Review Panel; and 6) RadCalNet users.
Figure 1 illustrates the relationships between the different parts. The instrumented sites and their operators are the basis of the data that is the key to RadCalNet. Participation in RadCalNet is on a voluntary basis, and as part of membership in RadCalNet, the instrumented sites agree to provide their data and uncertainties in a specific format and undergo peer review evaluation of the uncertainties associated to their data. The initial instrumented site membership includes the four sites described below.
The data from the sites are provided to the RadCalNet Processor: a central facility that ensures the data from the individual sites are processed with the same approach to provide TOA reflectances and associated uncertainties based on the inputs from the instrumented site. The results from the RadCalNet processing are provided to the RadCalNet Data Distribution that provides the interface to the user community to distribute the results. The RadCalNet Data Distribution also provides quality assurance (QA) on the products and provides metadata and documentation of the RadCalNet approach.
It is expected that new sites will seek inclusion in RadCalNet. The RadCalNet Admission Review Panel will evaluate requests from an instrumented site to become part of RadCalNet based on a review of the site’s uncertainty budget, provision of operational data, comparison results, and assurances that the site will operate for at least five years. The panel consists of IVOS and WGCV members. The panel makes recommendations to the full WGCV membership, and the WGCV determines whether to admit an instrumented site to RadCalNet.
Figure 1 shows the panel overlapping with the RadCalNet Working Group to indicate that members of the panel can also be members of the working group.
2.1. RadCalNet Working Group
The large ellipse in
Figure 1 represents the RadCalNet Working Group. The working group, which was established in 2013, includes members of IVOS and WGCV, the site operators, and RadCalNet Processor and Data Distribution developers. An initial meeting took place in January 2014 with representatives of three automated sites, a national metrology institute, and interested space agencies. The objective of the meeting was to define the architecture shown in
Figure 1 and the processing methodology described below (and shown in
Figure 2). The meeting also produced a roadmap to demonstrating a RadCalNet operational concept and recommendations to CEOS/WGCV/IVOS and CEOS/WGCV for evolution of the initial RadCalNet into an operational network.
The role of the RadCalNet Working Group is one of evaluation and support through two-way interaction with the three components of RadCalNet: instrumented sites; processor; and data distribution. The working group provides guidance and assistance in developing sites and encourages and facilitates communication between sites. The site operators provide the working group with descriptions of their site and uncertainty assessments for their specific instrumentation and processing approaches, which the working group reviews and makes recommendations on. The working group plays a similar two-way communication between the processor and data distribution. Communication of lessons learned from the processor and data distribution teams to the site operators is also facilitated by the working group.
The current RadCalNet Working Group (WG) consists of the authors of this paper. Four radiometric calibration instrumented sites (one each in China, France, Namibia, and the USA) were selected as the starting point for RadCalNet. The RadCalNet WG used its initial prototyping years to 1) define the architecture of RadCalNet, 2) demonstrate the operational concept using currently available satellite sensors; 3) provide recommendations to CEOS/WGCV for the evolving RadCalNet towards an operational project, and 4) provide guidelines for the addition of new sites.
2.2. Radcalnet Instrumented Sites
There is no requirement from RadCalNet on the site operators to provide bottom-of-atmosphere (BOA) reflectance at a specific level of uncertainty. They should however demonstrate that the BOA reflectance they provide is SI-traceable and within a verified uncertainty budget. Site operators are responsible for collecting surface and atmospheric data at their sites and providing surface reflectance and atmospheric parameters to the RadCalNet Processor. The inputs from the sites must include uncertainties as determined by the site operator. They best understand their own site and its instrumentation, thus RadCalNet relies on their expertise to provide QA of the data being provided to RadCalNet. Any data provided should be of sufficient quality to warrant processing by RadCalNet. As mentioned above, there are currently four sites in operation. Overviews of the sites are provided here along with references to provide greater details.
The longest-operating automated site of the four is the La Crau site in France. The La Crau site has been used since 1987 for the vicarious calibration of SPOT cameras [
29]. Early calibration activities were conducted during field campaigns devoted to the characterization of the atmosphere and the site reflectance. In 1997, an automatic photometric station (ROSAS) was set up on the site on top of a 10 m high post [
30] in the center of a 400 m × 400 m area (0.16 km
2) in the “La Crau Seche,” that is a 60 km
2 flat, pebbly area in southeastern France (longitude: 4.87° E, latitude: 43.50° N, altitude 20 m). The area has a dry and sunny Mediterranean climate. The soil is mainly composed of pebbles and is sparsely covered by a low vegetation. The surface optical properties do vary within the year but are continuously monitored. The photometer measures spectral solar extinction and sky radiance to characterize the optical properties of the atmosphere. It also views the upwelling radiance over the ground to derive the surface reflectance. The photometer samples the spectrum from 380 nm to 1650 nm in 12 narrow bands. The photometer automatically and sequentially performs measurements every noncloudy day. Data are transmitted by GSM (Global System for Mobile communications) to Centre Nation d’Etude Spatiales (CNES). The photometer calibration is performed in situ using the sun measurements for irradiance and cross-band calibration, and over the Rayleigh scattering for the short wavelengths radiance calibration. This calibration is validated by measurements made by the instrument manufacturer, taking advantage of the good atmospheric conditions of a high-altitude site (Izaña, Tenerife) for irradiance calibration and by using an integrating sphere for radiance calibration. The data are processed by operational software that calibrates the photometer, estimates the atmosphere properties, and computes a modelled bidirectional reflectance distribution function of the site.
The Railroad Valley Playa site in Nevada, USA has been used for reflectance-based vicarious calibration since the mid-1990s [
1]. Automated solar transmittance data collections began in 2001, and early versions of automated, downward-looking radiometers were deployed in 2002. The current Radiometric Calibration Test Site (RadCaTS), which relies on a suite of four ground-viewing radiometers (GVRs), was completed in 2011. The 1 km
2 area of RadCaTS is centered at 38.497° N and 115.690° W at an altitude of 1435 m. The site is in a remote area with limited access. The average surface reflectance is typical of clay-based playas, with lower values in the blue portion of the spectrum, increasing to values in excess of 0.3 in the near-infrared and shortwave infrared. The surface reflectance is generally stable under dry conditions but changes due to periodic rain and snowfall events. The surface is approximately Lambertian out to view angles approaching 30° [
31]. The yearly average aerosol optical depth is typically low, on the order of 0.060 at 550 nm [
32]. The GVRs are multispectral radiometers with seven bands in the visible and near-infrared (VNIR) and one shortwave infrared (SWIR) channel. Atmospheric data are collected at the default acquisition scheme for the aeronet network AERONET [
33], and the GVRs acquire data every two minutes. Data are transmitted to the University of Arizona via satellite uplink on a regular basis. The data are processed using operational software that determines a site reflectance based on the average of the GVR suite, and that average is used to determine an optimal hyperspectral reflectance.
The Baotou Site is the only site to rely on artificial surfaces [
34]. There are four gravel targets that are each 48 × 48 m
2 in size. The “white” area has reflectance of approximately 0.6, while the “gray” and “black” are 0.25 and 0.10 in reflectance. Only the gray target is considered a RadCalNet site as its spectral characteristics best match the site-surrounding spectral characteristics, thus limiting the impact of adjacency effect on TOA simulations. The site is located approximately 50 km from Baotou City at latitude 40.84° N and longitude 109.46° E, with an altitude of 1270 m. The surface of the surrounding area is mainly desert, bare land, grassland, and farmland. Baotou features a cold semi-arid climate, with average precipitation of 300 mm. The surface bidirection reflectance factor (BRF) of the site is obtained with a commercially available field spectrometer. The spectrometer was deployed in 2016, while measured the ground-reflected radiance every two minutes. The spectral range of the spectrometer is 380 nm to 1080 nm, with a sampling interval of 2 nm. Atmospheric parameters are derived from AERONET solar photometer measurements [
33]. Automated measurements are transmitted to the Academy of Opto-Electronics, Chinese Academy of Sciences via the 4G mobile network.
The fourth site is in Gobabeb, Namibia. This was set up during the RadCalNet prototype phase and has been providing data from July 2017 [
35,
36]. It is operated jointly by European Space Agency (ESA) (subcontracting to the National Physical Laboratory of Unites Kingdom (NPL)) and CNES and has the same type of instrument and operational protocol as the La Crau ROSAS system, and the data are analyzed using the same analysis software at CNES. It is the only site of the four to be selected through a global search, relying primarily on quantitative assessments of spectral characteristics, spatial uniformity, probability of clear skies, and other key site parameters. The Gobabeb site was used by the RadCalNet Working Group to develop the requirements and guideline documents for candidate sites to the network.
2.3. RadCalNet Data Product
RadCalNet provides SI-traceable, spectrally resolved TOA reflectance for a nadir view at 30 min intervals from 9 am to 3 pm local standard time for a given site. The TOA reflectance has a spectral sampling of 10 nm intervals and covers the 400 nm to 1000 nm spectral range (required for all sites), with data for longer wavelengths (up to 2500 nm; also 10 nm intervals) provided in those cases where the site provider is capable of a broader spectral range. The area over which the TOA reflectance is applicable is defined as appropriate for each site, but in all cases is at least 45 × 45 m2.
The input data provided by the site operators are nadir-viewing BOA reflectance along with atmospheric parameters such as surface pressure, columnar water vapor, columnar ozone, aerosol optical depth, and the Angstrom coefficient to define aerosol sizes. Simulation to TOA reflectance is performed through the central RadCalNet Processing for all sites using the method described below. TOA reflectance and BOA reflectance data are provided, along with their associated uncertainties, to users through the RadCalNet portal [
28]. The data are in ASCII format.
3. TOA Reflectance Computation
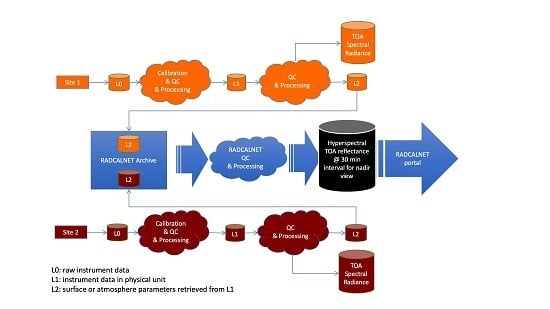
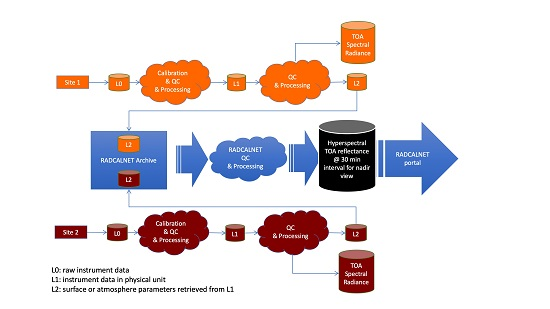
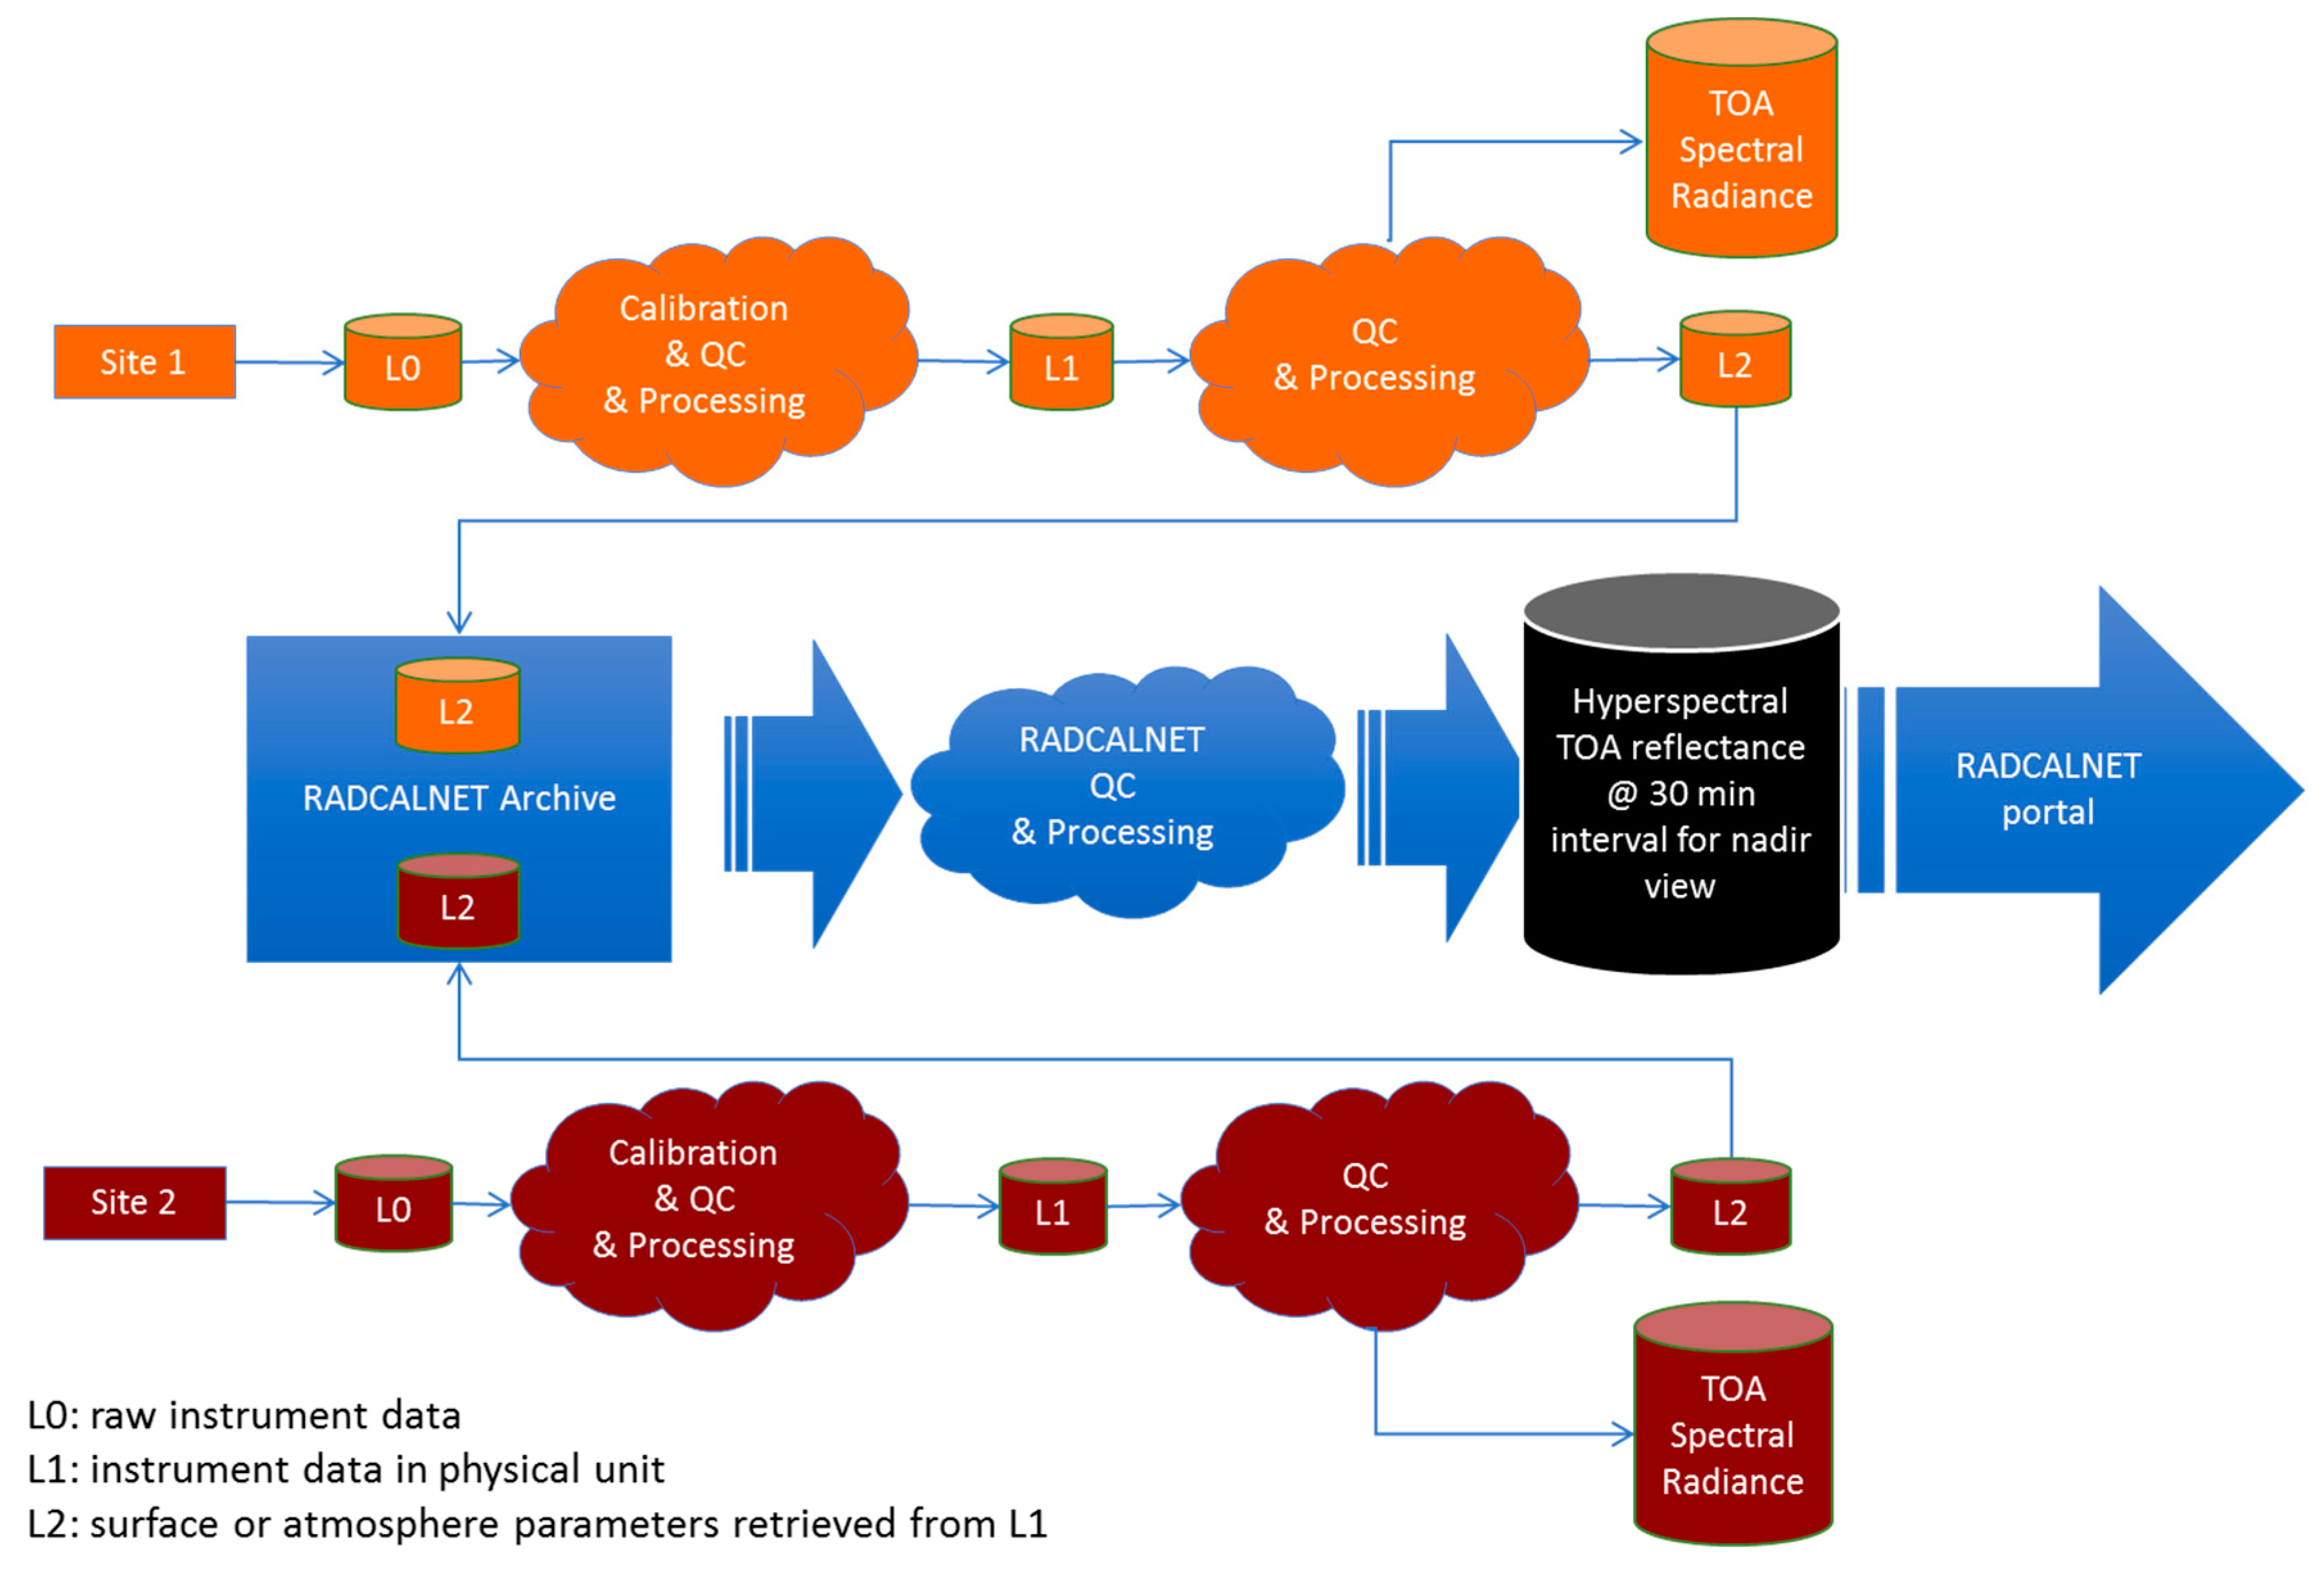
An overview of the TOA reflectance determination is provided in this section and in more detail in the subsections below. The basic approach is illustrated in
Figure 2 for two representative automated sites (Site 1 and Site 2) operating independently. They both collect their Level 0, or raw data, using instrumentation and techniques suitable for their individual site. Likewise, they independently process these data to a physical property such as bidirectional reflectance factor or site radiance, along with atmospheric parameters, the Level 1 product. All groups include some level of quality check in their processing when proceeding from Level 0 to Level 1. Sites may choose to perform their own processing to TOA reflectance from this Level 1 product, and such data may be made available separately to users and tailored to an individual satellite sensor (e.g., spectral band integration, temporal interpolation, viewing angle corrections). Such products are not part of the RadCalNet data dissemination.
Sites belonging to RadCalNet provide the RadCalNet processor with nadir-view BOA reflectance data and atmospheric parameterizations in a common format. This is the Level 2 product, as shown in
Figure 2, and comprises the surface and atmospheric parameterizations in the format specified by RadCalNet and described above. The Level 2 data can be very similar to what is produced as part of the site’s TOA radiance/reflectance predictions, but it is not identical.
Figure 2 illustrates this by showing separate data products, the L2 output provided to RadCalNet and the TOA radiance used by the site operators for their projects.
The Level 2 data from the individual sites are delivered and archived at the RadCalNet processing facility. All data are processed through the same processing code to produce the TOA reflectance at the RadCalNet spectral sampling, resolution and range at the 30 min interval. The results are processed to include uncertainties for each individual data point. The results, along with the input data used to derive them, are then provided to the user community via the RadCalNet portal.
3.1. RadCalNet Site Field Collection Data
Each of the four current RadCalNet sites makes independent measurements using methods and techniques that are slightly different to one another, but which follow the general philosophy of the reflectance-based vicarious method [
37]. The reflectance-based approach relies on surface bidirectional reflectance factor derived from measurements of upwelling radiance coupled with atmospheric parameterizations derived primarily from solar transmittance within a radiative transfer model to predict TOA radiance for sensor–sun geometry [
14].
Details of the specific instrumentation, measurement approaches, and processing specific to each instrumented site are documented in the site description documents and uncertainty statements documents that are reviewed by the RadCalNet Working Group and can be found on the RadCalNet portal [
28] and have also been introduced in
Section 2.2. All current sites deploy downward-looking radiometers to retrieve the upwelling radiance near ground level. Some sites use multispectral radiometers, others use spectrometers, and some sites use fixed, vertically viewing sensors, while others use multi-angle approaches. The upwelling radiance is converted to a nadir-viewing, BOA reflectance using the ratio of the upwelling radiance to the downwelling total irradiance from both the sun and sky. The downwelling irradiance is typically derived through radiative transfer modeling using the measured atmospheric parameters, measurements of hemispheric downwelling irradiance, or integration of multi-angle sky radiance coupled with direct solar irradiance. Conversion of multispectral data to hyperspectral coverage suitable for RadCalNet is typically obtained using spectral models of the site based on hyperspectral ground-based measurements of the site reflectance.
Atmospheric retrievals rely on measurements of directly transmitted solar irradiance to retrieve spectral aerosol optical depth, aerosol size information, and column amounts of gaseous absorbers such as ozone and water vapor. The same atmospheric measurements are also used to screen out cloud-contaminated data through continuous measurements of the atmospheric extinction. The cloud screening detailed approach is site-dependent and left to the responsibility of the site owner as it might require site-specific implementation. Ancillary information such as surface pressure measurements, site altitude, or numerical weather predictions provide molecular scattering optical depths. Sky radiance measurements are used at some sites to provide aerosol size information while at others as validation of the aerosol size distribution retrieved from solar transmittance. Still others use the sky radiance as a means to quality check their assumptions regarding aerosol composition.
3.2. Site Data Provided to RadCalNet
In general, the data produced specifically for internal use by the site operators is different than that required for RadCalNet processing. It should be emphasized that RadCalNet does not specify to the site operators how they are to convert their instrumented site measurements to the input requirements for RadCalNet. Of greater importance to RadCalNet is a defensible uncertainty budget for the data that are provided.
The TOA reflectance processing for RadCalNet requires the site operators to provide a nadir-viewing surface reflectance at 10 nm intervals from 400 nm to 1000 nm from 9 am to 3 pm local standard time at 30 min intervals. There is a goal of RadCalNet to obtain data beyond 1000 nm when possible. The reported reflectance to RadCalNet is required to be valid for an area of at least 45m × 45 m. All sites currently sample the reflectance at the requested times (and, in reality, at higher temporal frequency), and no interpolation for time is required for the typical case where all data are successfully acquired by the instrumentation. Three of the sites collect the reflectance data at multispectral wavelengths, and these data are combined with representative spectra derived from site measurements to provide the 10 nm hyperspectral data needed by RadCalNet.
RadCalNet requires the following atmospheric information: aerosol optical depth at 550 nm, Angstrom coefficient, column water vapor, and column ozone. An aerosol type corresponding to one of the standard inputs that are part of the MODTRAN radiative transfer code is also needed. The aerosol parameters are derived from the closest measurement in time at the sites, but this difference is typically less than a few minutes at each of the sites. In addition to the atmospheric and surface nadir reflectance provided for each valid time and date, the sites provide a surface pressure and temperature for each data point, column water vapor and ozone. The site operators also provide RadCalNet with their site elevation, latitude, and longitude that represents the center of the area that is valid for their provided BOA reflectance.
The site operators perform quality assessments on their data to evaluate which data are suitable for inclusion in the RadCalNet processing and archive. Any input data provided for inclusion in RadCalNet by the site operators are assumed to be valid and to have the reported input parameter uncertainties. The derivation of uncertainties associated to each site’s surface reflectance measurements is dependent on the site-specific instrumentation, processing methods, and site characteristics.
3.3. RadCalNet Processing Methodology
Once ingested into the RadCalNet archive, the input data are used with the MODTRAN V5.3 radiative transfer code (RTC). Processing all RadCalNet data using the same RTC provides consistency in the predicted TOA reflectance. The risk to using the same processing approach is that it can create a systematic error (or colloquially, a bias), but evaluation of the impact of the radiative transfer code on reflectance-based results has shown greater sensitivity to the uncertainty of the input parameters rather than the choice of specific radiative transfer code [
38], and differences between RTCs are known.
During initial set up for data processing, an input file for all the site-specific default MODTRAN parameters is generated. It is not expected that these parameters will change value, but the file is provided so that the MODTRAN input file for any data run can be recreated. The site-specific data include a site identifier, latitude, longitude, and altitude. The processing is specified for the UTC time, day, and year, allowing calculation of the solar zenith angle for each data point.
MODTRAN has numerous options, and the description given here is not designed to allow the reader the capability to reproduce exactly the tape5 file needed to produce TOA radiance, but rather is a summary of the configuration used for RadCalNet as guidance on how RadCalNet uses MODTRAN. MODTRAN is configured for RadCalNet processing to run in multiple scattering mode using the eight-stream option for the DISORT (discrete ordinates) computations. One of the advantages to MODTRAN is that the absorption by gases is included within the radiative transfer calculations. Absorption is calculated using the MODTRAN band model as opposed to correlated-k option. Auxiliary gaseous species (OH, HF, HCl, HBr, HI, ClO, OCS, H2CO, HOCl, N2, HCN, CH3Cl, H2O2, C2H2, C2H6, PH3) are not included to improve processing time with minimal impact on results in the VNIR and SWIR. Carbon dioxide mixing ratio is assumed to be 390 ppmv.
Vertical profile information is based on the midlatitude summer model for all sites. The profile is scaled according to surface temperature, pressure, and column water vapor. The impact of the specific vertical distribution of atmospheric constituents is minimal for scattering-dominated radiative transfer calculations, and the midlatitude summer option allows for the combination of surface temperatures and total columnar water vapor found at typical vicarious calibration sites.
The MODTRAN calculations are performed for a “vertical slant path to space” for multiple scattering including both thermal emission and solar scattering. The surface is assumed to be Lambertian, and no adjacency effects are included (i.e., the underlying assumption is that the spectral properties of the site surroundings are identical to those measured at the site). The near-Lambertian nature of the sites included in RadCalNet coupled with the typically low aerosol loading and moderate to high surface reflectance means that the impact of the non-Lambertian effects on the diffuse-light field are minimal [
32]. Adjacency effects are not included as most sites have a low adjacency effect and to simplify processing.
The spectral resolution used for the MODTRAN calculations is a triangular-shaped response with 20 nm full width, half maximum. Spectral sampling is 400 nm to 1000 nm at 10 nm intervals for all sites, with additional spectral bands available at those sites providing inputs beyond the required RadCalNet spectral range. The Chance/Kurucz solar irradiance spectral model is used but has no impact on the predicted TOA reflectance for RadCalNet since the same solar irradiance is used to scale the MODTRAN results to reflectance.
The given Angstrom coefficient and 550 nm aerol optical depth (AOD) are used within MODTRAN to compute the spectral variation in AOD that is combined with the aerosol model to determine scattering characteristics needed for the DISORT calculations. The aerosol model used in RadCalNet is selected by the site operator as one of six standard MODTRAN types (Rural 23 km visibility, Rural 5 km visibility, Maritime with user-defined visibility, maritime with 23 km visibility, urban with 5 km visibility, tropospheric with 50 km visibility). To date, all of the sites rely on a Rural with 23 km visibility model.
3.4. RadCalNet Output
The MODTRAN output in the ‘.7sc’ file is extracted to compute the TOA reflectance. For each wavelength, the TOA reflectance is calculated as:
where
and
are the top-of-atmosphere spectral radiance and incoming solar spectral irradiance as calculated by MODTRAN respectively and
is the MODTRAN spectral bandpass function for the central wavelength
. The solar zenith angle at the time of the measurement is
θ. An output flag is provided for any times and dates omitted by the site operators. Omitting data is typically due to cloudy weather, instrument malfunction, surface moisture effects, and so forth. Currently the spectral bandpass function
is a triangular function, centered on
with a half-base width of 20 nm (there is a discussion underway to reduce this to 10 nm at the next RadCalNet reprocessing).
4. SI-Traceability and Uncertainty Analysis
Providing well-understood and SI-traceable uncertainties are as important as the TOA reflectance itself. The key element to the success of RadCalNet is its adherence to SI-traceability with quantitative uncertainties. Ensuring SI-traceability is necessary to support the establishment of the Global Earth Observation (GEO) System of Systems (GEOSS). The Quality Assurance framework for Earth Observations [
39] was established at the request of GEO, with the key principle that “all Earth observing (EO) data and derived products should have associated with them a quality indicator based on a documented quantitative assessment of its traceability to internationally agreed upon reference standards (e.g., SI units)”.
4.1. Input Data Quality
The input data provided by the site operators includes uncertainties for each input parameter for each time. The uncertainties are based upon the expertise of the instrumented site operators with their specific instrumentation, processing methods, and instrumented site characteristics. All instrumented sites must have their uncertainty budgets peer reviewed by the RadCalNet Working Group and documented in an uncertainty summary report (and, where appropriate, a peer reviewed publication).
The uncertainty analysis for a site considers the calibration of the site instruments (both permanent and any used in site characterization, e.g., to provide high spectral resolution measurements between the spectral bands of the permanent instruments), uncertainties associated with the use of that instrumentation in the field (including aging and temperature sensitivities), and uncertainties associated with the determination of ground reflectance from the raw measurements (e.g., due to sun and sky irradiance calculations). The uncertainty analysis and summary report documents the traceability of the measurement of surface reflectance to SI.
4.2. Output Data Quality
The surface and atmosphere measurements provided as input to RadCalNet for the generation of simulated reference TOA reflectance are provided with associated uncertainties. These uncertainties are propagated to TOA via a lookup table (LUT) approach containing precomputed uncertainties corresponding a set of surface/atmospheric parameters combinations and their associated uncertainties. The sampling of the input parameter space associated to the surface/atmosphere parameters and their uncertainties and corresponding to the LUT nodes was adjusted to allow for a nearest-neighbor interpolation of the LUT in the RadCalNet processing scheme while providing the RadCalNet TOA reflectance uncertainty within a 0.5% uncertainty.
The TOA uncertainties stored in the LUT were derived via a Monte Carlo approach. Each LUT entry corresponds to the TOA reflectance uncertainty associated to a particular combination of input parameters (specific atmospheric and surface conditions for an individual data point) derived from multiple runs of MODTRAN, with simulated input parameter errors drawn from probability distributions describing the uncertainties associated with the input parameters. This approach is applicable to all sites and provides a computationally efficient solution to the propagation of input parameter uncertainties.
The uncertainty associated to the RadCalNet TOA reflectance in spectral regions strongly affected by gaseous absorption and, in particular, water vapour is significantly larger than in other spectral regions. These regions are thus systematically flagged in the RadCalNet TOA uncertainty products and should be avoided when using the RadCalNet TOA reflectance.
Uncertainties associated to the TOA reflectance due to the modelling of the atmospheric scattering and absorption by MODTRAN are not included in the RadCalNet TOA uncertainty computation. It is expected, however, that they are not the main contributor to the total TOA uncertainty.
4.3. Consistency between RadCalNet Sites
To validate the uncertainty statements for the sites (associated with both ground measurements and TOA reflectance values), it is important to check the consistency between the measurements carried out at each RadCalNet site. The RadCalNet WG is developing procedures for ground-based site-to-site comparisons involving multispectral or hyperspectral travelling reference radiometers, but these are yet to be implemented.
The radiometric consistency is currently verified at TOA reflectance level by comparing the RadCalNet TOA reflectance products to observations from the Multi Spectral Instrument (MSI) onboard the Sentinel-2 satellites. These sensors were chosen because their performance has been thoroughly characterized in-flight and they are continuously monitored.
5. Calibration and Harmonization Using RadCalNet
The basic processing approach to calibrate a selected sensor using RadCalNet consists of six basic steps:
Extract the predicted TOA reflectance for the dates and times corresponding to when the sensor under study imaged the selected RadCalNet site, including uncertainties.
Determine test sensor output for the selected RadCalNet site and associated uncertainties.
Perform a temporal correction to the RadCalNet TOA reflectances to account for time differences between the sensor’s imaging of the site and the RadCalNet 30 min interval.
Convolve the RadCalNet TOA reflectance to the test sensor’s spectral response to determine the band-integrated TOA reflectance and associated uncertainty.
Convert RadCalNet TOA reflectance and associated uncertainty to appropriate units for comparison to test sensor output found in #2.
Compare imaging sensor output to the corresponding RadCalNet-based TOA reflectance and determine uncertainty associated with comparison.
The examples shown in this section follow the approach above, as applied to data from two of the RadCalNet sites and two currently operating, on-orbit satellite sensors. The specific sites and sensors used are not given to emphasize the overall RadCalNet concept as opposed to specific methodologies, sites, or sensors. The two sensors are well-understood, multispectral imagers with similar spatial resolutions of 10 m to 30 m. Both imagers acquired at least nine representative images for each of the two sites over an 18 month time period. The imagery from both sensors was obtained via each sensor’s public data distribution website. All available images for the two sites for both sites were obtained from the data provider, and dates for which the images showed obvious presence of clouds have been excluded from the study.
The dates and acquisition times for those scenes that appear not to be affected by clouds were used to locate matching RadCalNet output data. The approach used here to determine the predicted TOA reflectance from RadCalNet output was a nearest-in-time approach. Such an approach is reasonable for the sites that will be part of RadCalNet, since TOA reflectance varies more slowly with time than does the TOA radiance. Dates for which the RadCalNet TOA reflectance varied by more than 10% within the 60 min of the image acquisition were omitted from the results shown here.
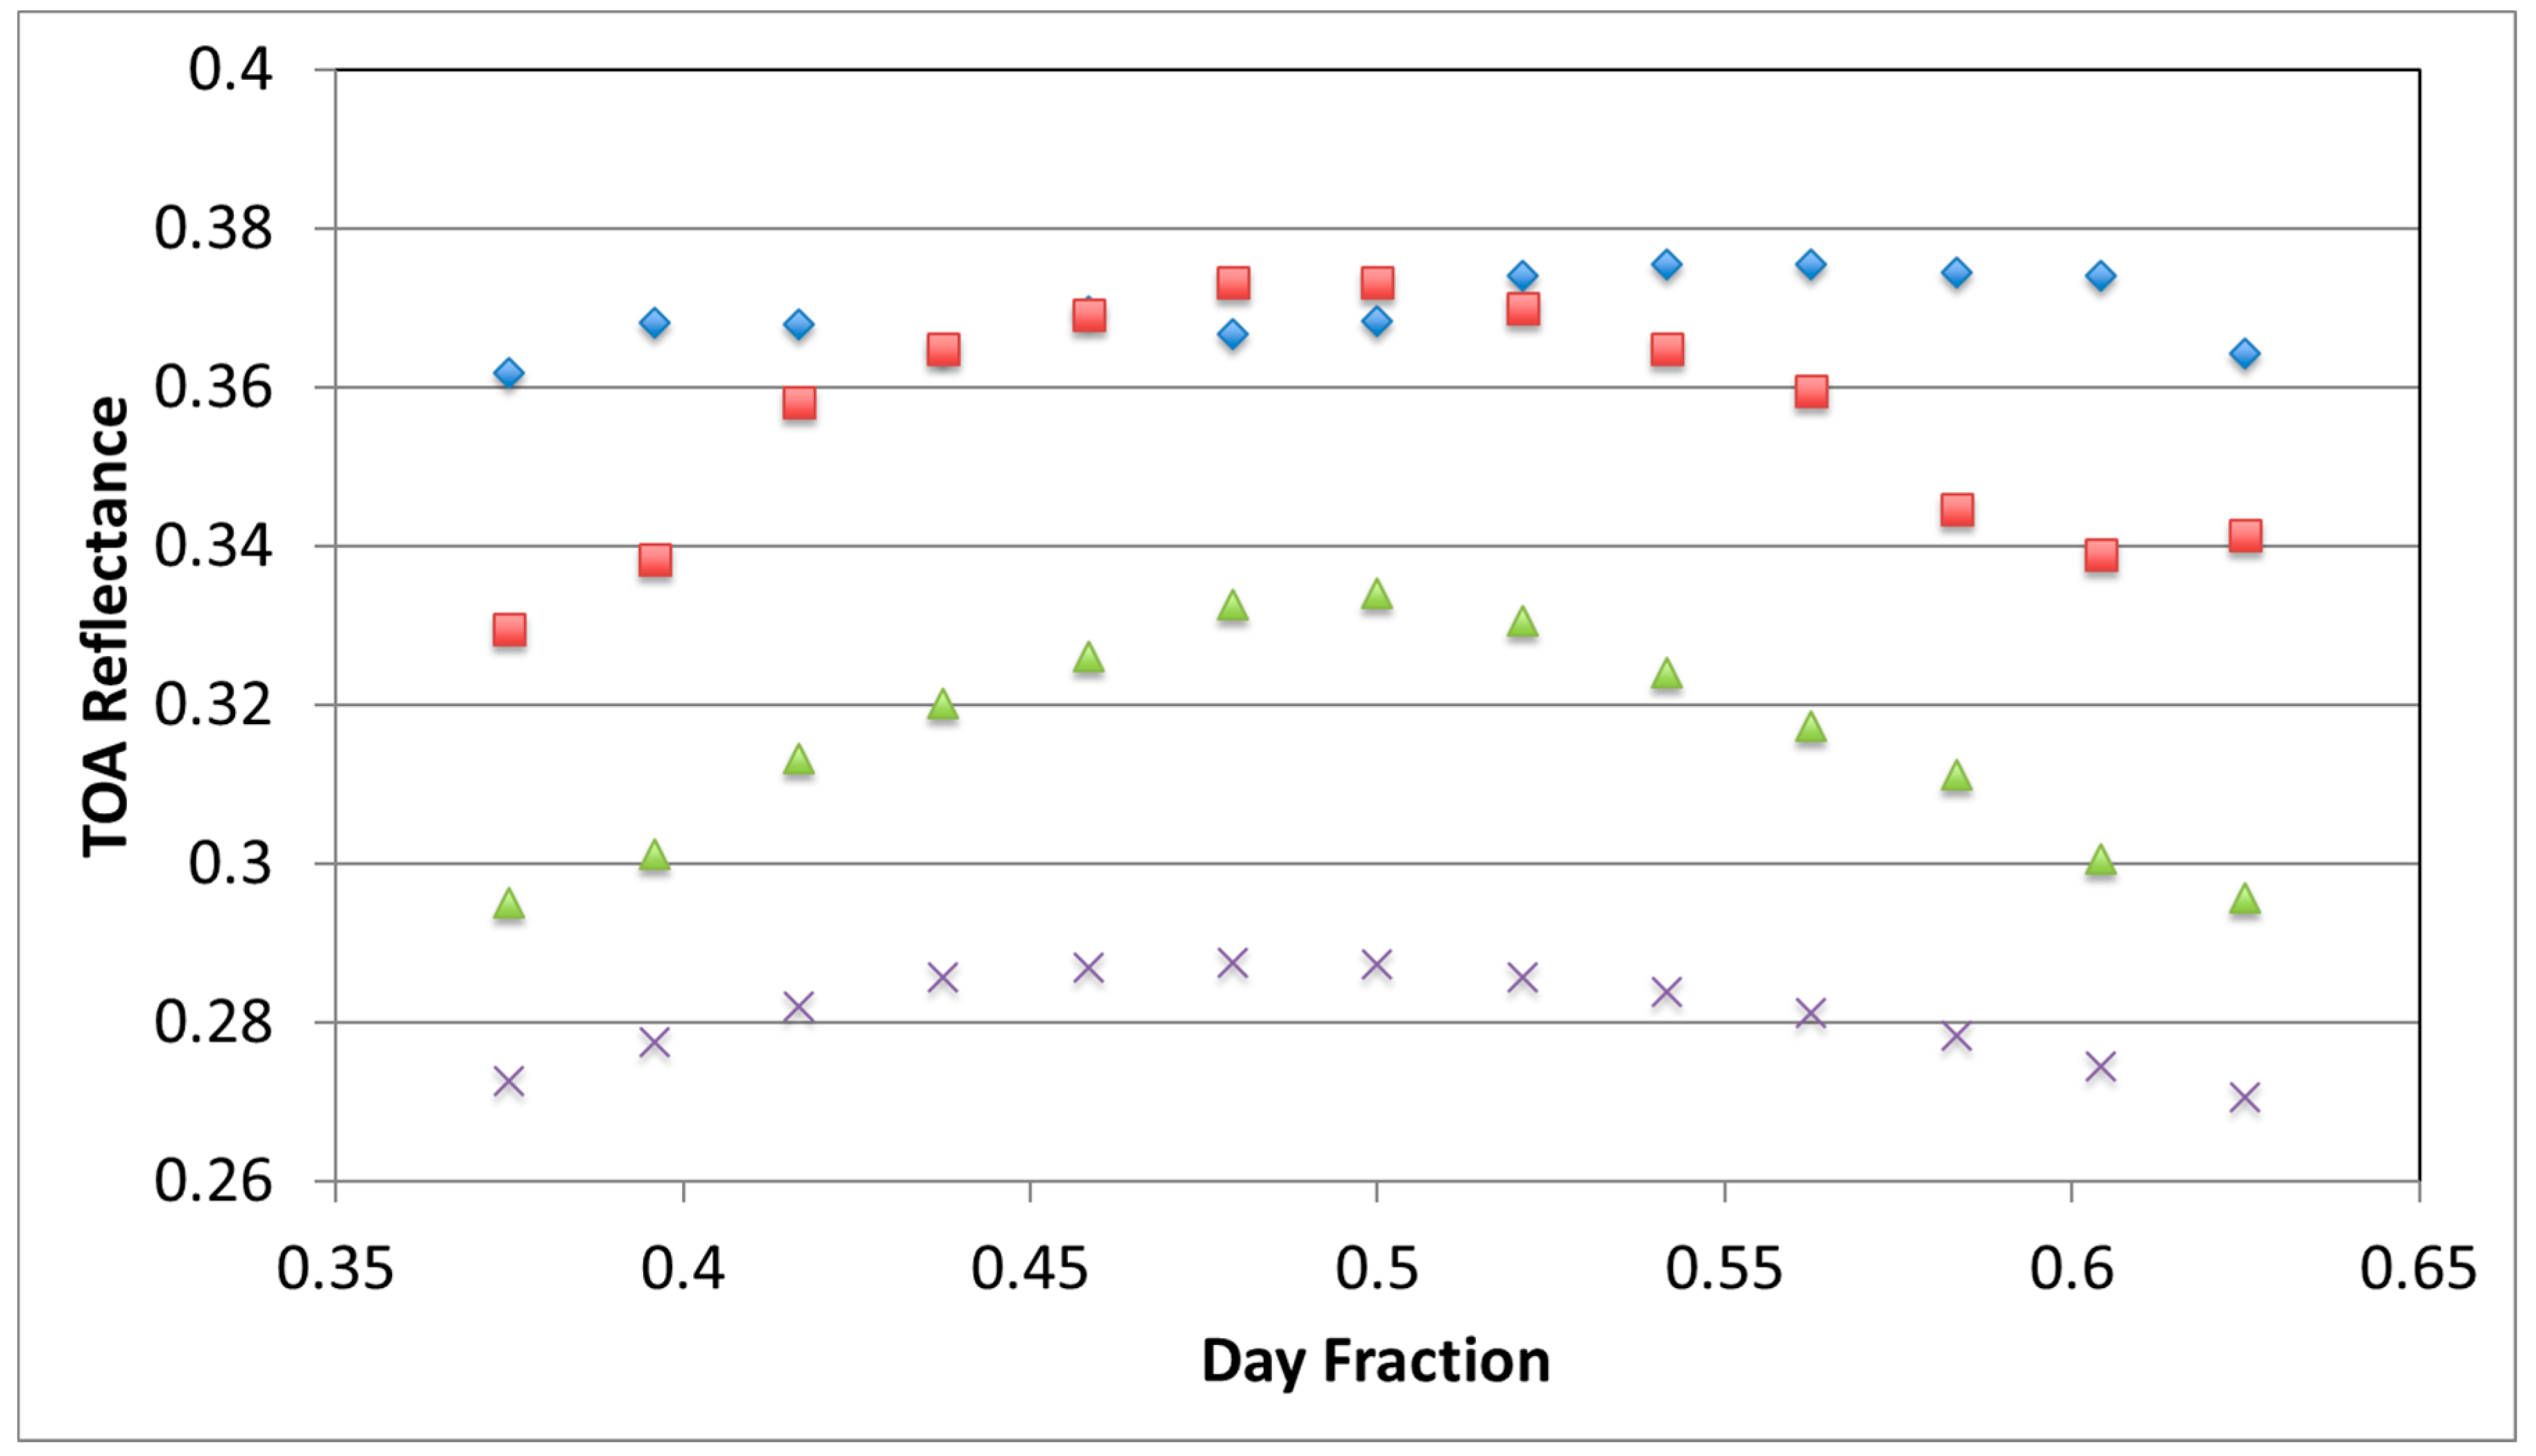
Figure 3 shows typical TOA reflectance predicted from one of the instrumented sites as a function of time from four randomly selected dates. These data represent a variety of seasons, surface moisture conditions, and various clear-sky atmospheric conditions. The wavelength shown is in the midvisible. The first thing to note is that the reflectance of this particular location can vary by >30% depending on date, demonstrating the utility of having automated measurements to assess such changes. The second noticeable feature is that the variation in reflectance can be as large as 20% over a single day, caused by surface bidirectional reflectance effects and atmospheric angular scattering effects.
The variation over a 30 min time period is typically <5% and is typically smaller for the overpass times of most sun-synchronous imagers. Simplistic approaches such as using the closest data point in time or linear interpolation are sufficient for most applications to ensure that the temporal variation in TOA reflectance is not the dominant uncertainty source. Applications using times of day for which the solar illumination angle changes significantly over time may necessitate more sophisticated approaches, depending upon the user’s uncertainty requirements.
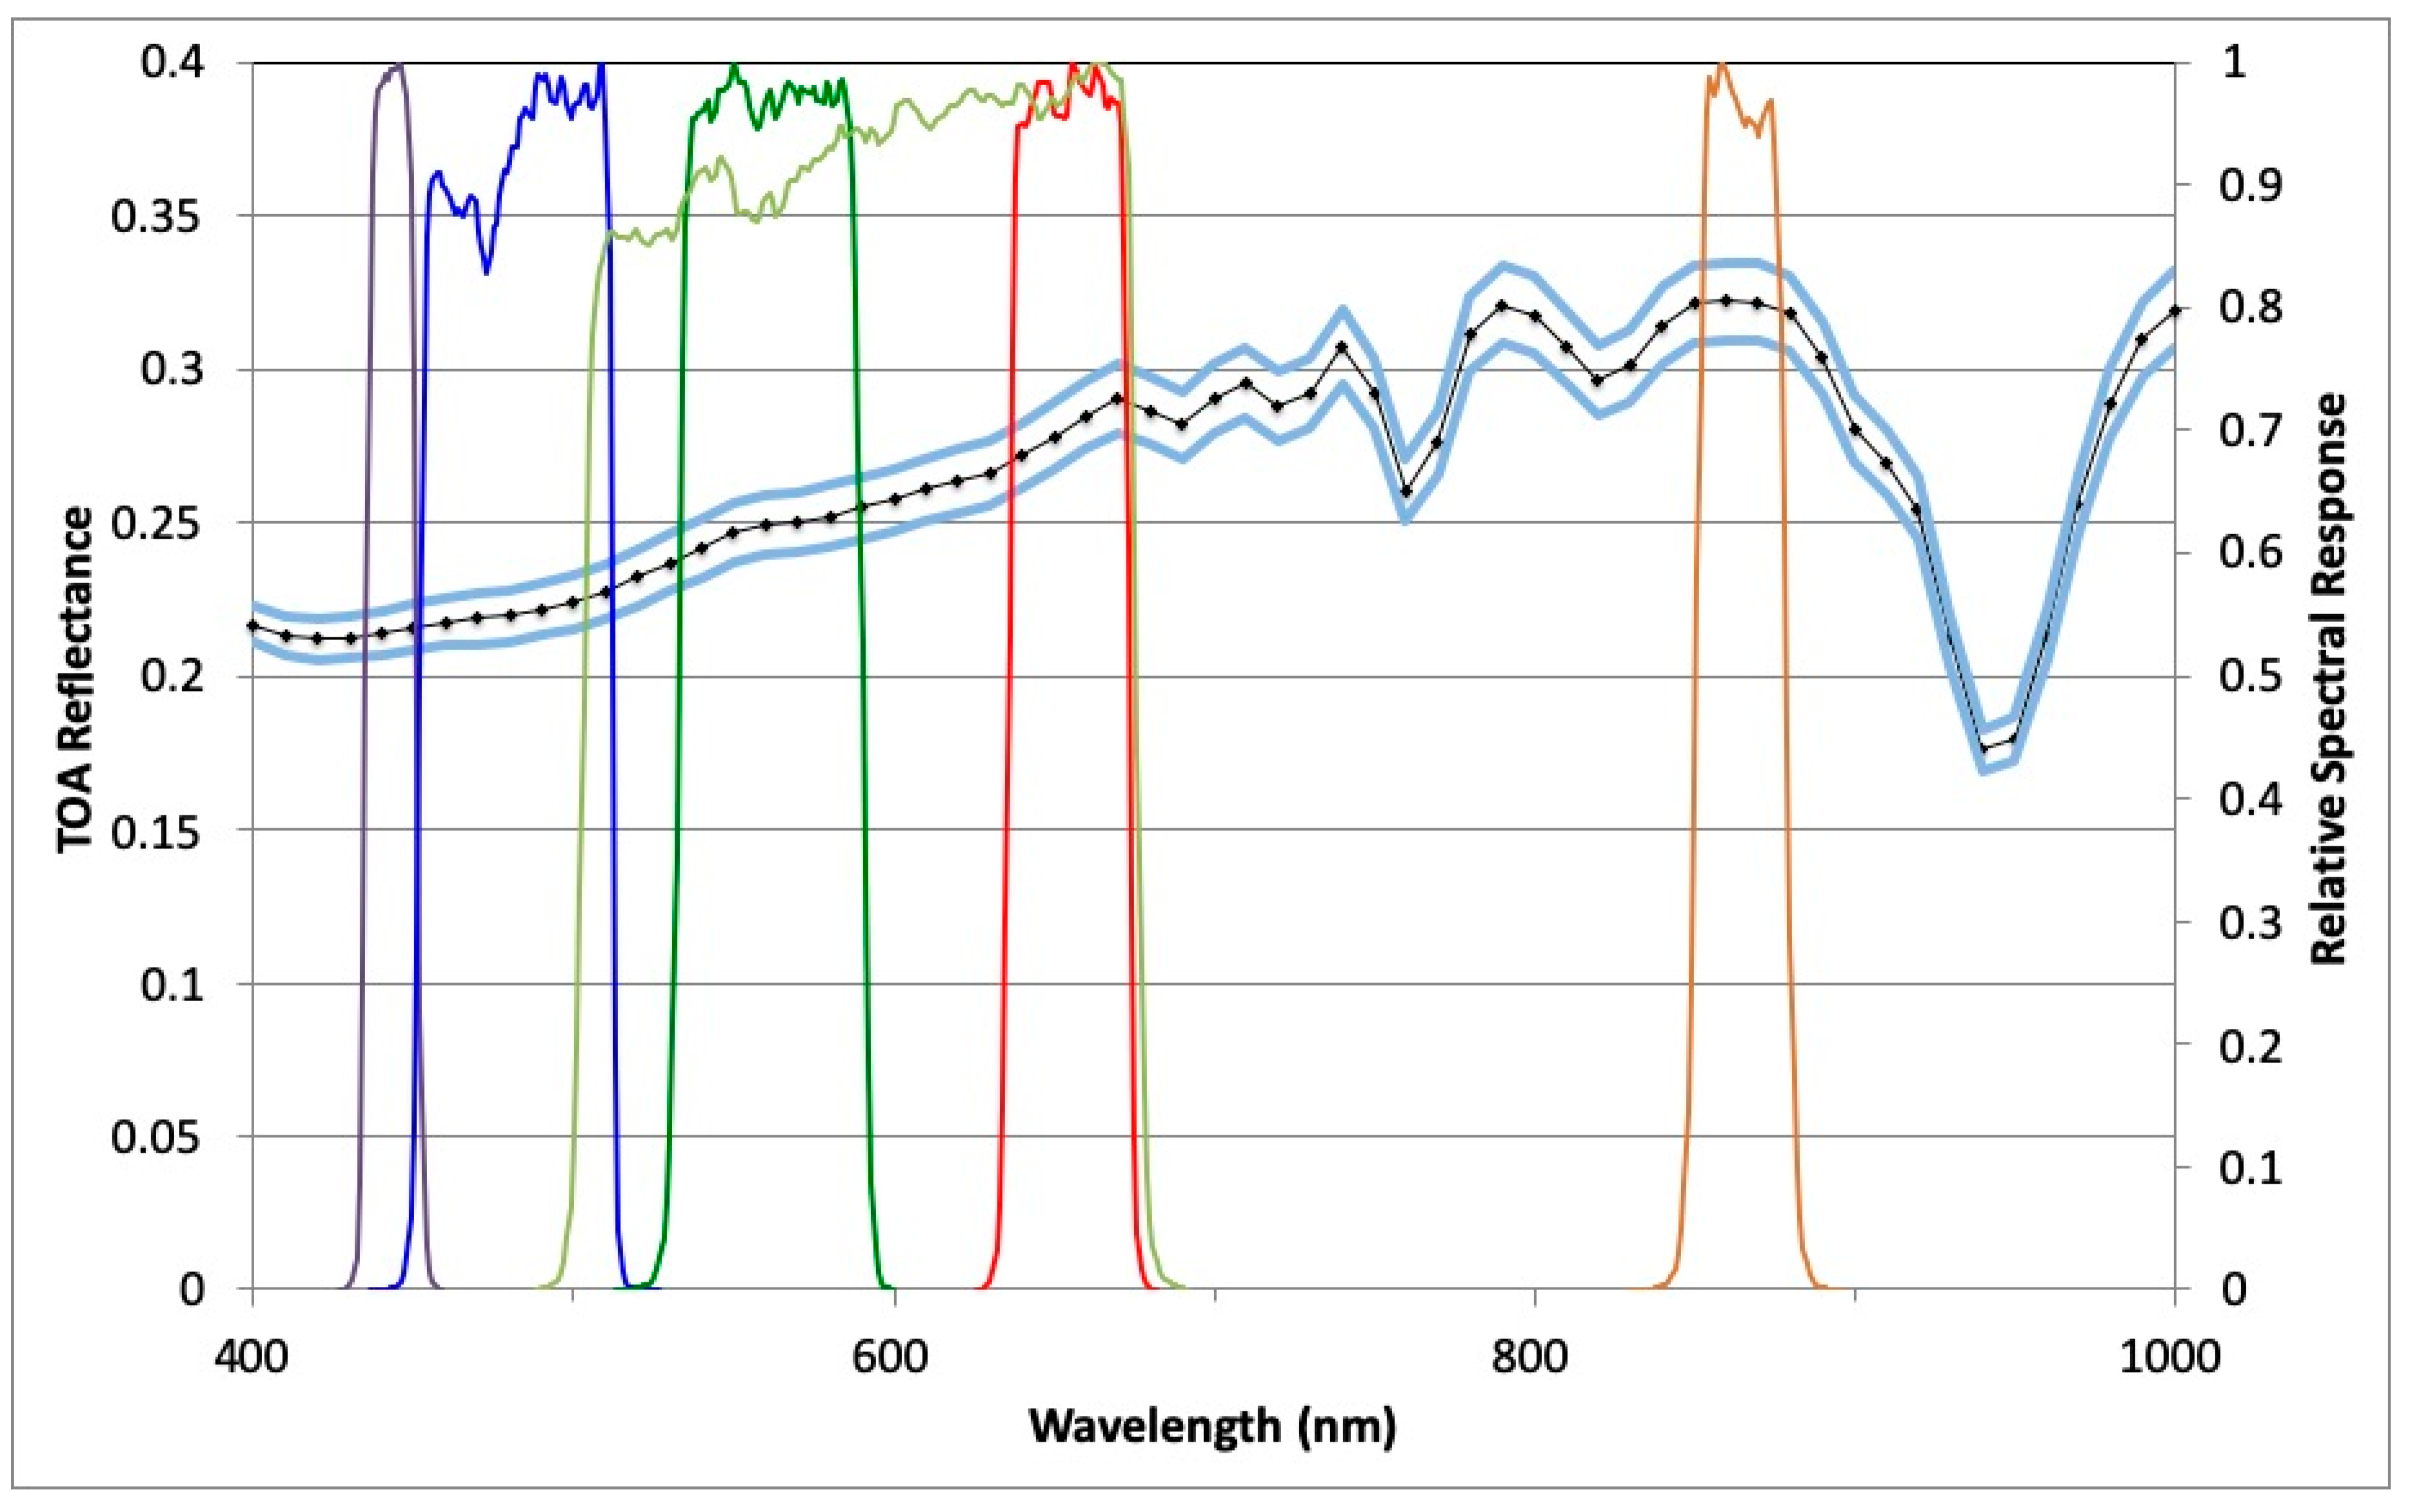
Figure 4 shows a sample TOA reflectance as a function of wavelength obtained from RadCalNet. The results are given at the native resolution of RadCalNet. Also shown in the figure are relative spectral response function (SRF) data for what is referred to here as sensor 1, as representative of a set of spectral bands used in earth imagers. The TOA reflectance for a selected sensor band can be derived through a variety of approaches, including choosing the closest RadCalNet wavelength to the sensor’s center wavelength, band-averaging across the sensor’s spectral response at the RadCalNet 10 nm interval, or interpolating the RadCalNet output to the same spectral resolution as the sensor’s spectral response data.
The relatively smooth nature of the TOA reflectance seen in
Figure 4 is a result of the smoothly varying spectral reflectance of the surface coupled with the lack of strong atmospheric absorption features. The few spectral regions affected by water vapor absorption (720 nm, 830 nm, 940 nm) and oxygen at 760 nm are visible as broad, shallow features due to the 20 nm spectral averaging used to obtain the TOA reflectance in RadCalNet. Increased uncertainties in bands affected by gaseous absorption are reported within the RadCalNet output, and users should exercise care in these spectral regions to mitigate the increasing uncertainties resulting from atmospheric absorption.
The relative spectral response data shown in
Figure 4 were obtained from the same data source as that used to obtain the imagery. The method for band-averaging of the RadCalNet TOA reflectance data used in this work is to linearly interpolate the TOA reflectance data to match the spectral sampling of the imager’s SRF to determine a band-weighted TOA reflectance. Such an approach is suitable here because the bands being studied are in regions of the spectrum not affected by absorption.
Once the band-averaged TOA reflectance is computed from RadCalNet data for the sensor of interest, the results are compared to the reported TOA reflectance from the sensor under test. The site is located for each image, and a spatial average of the area recommended by the site operator is used to determine the image sensor’s output for each spectral band. Both sensors used in the current work provide an at-sensor reflectance as their data product, thus negating the need for including a solar irradiance model. If the imagery data are provided as a spectral radiance, it would be converted to TOA reflectance using the solar irradiance model recommended by the data provider.
Three examples are presented here to demonstrate the utility of RadCalNet for sensor radiometric calibration as well as harmonization of multiple sensors.
Section 5.1 provides results for a single multispectral imaging sensor (Sensor #1) from multiple days from one of the current RadCalNet instrumented sites (Site A). The second example presented in
Section 5.2 gives results from Sensor #1 from two of the sites (Sites A and B).
Section 5.3 describes the results from a second sensor (Sensor #2) using multiple dates at both Sites A and B and compares the results to those obtained from Sensor #1. The specifics regarding the locations and properties of Sites A and B or the characteristics of Sensors #1 and #2 are not critical to this discussion, beyond the fact that both sensors have been demonstrated not to be suffering from temporal degradation, and the sites have been audited through RadCalNet to ensure their SI-traceable uncertainties.
5.1. Single Sensor, Single Site
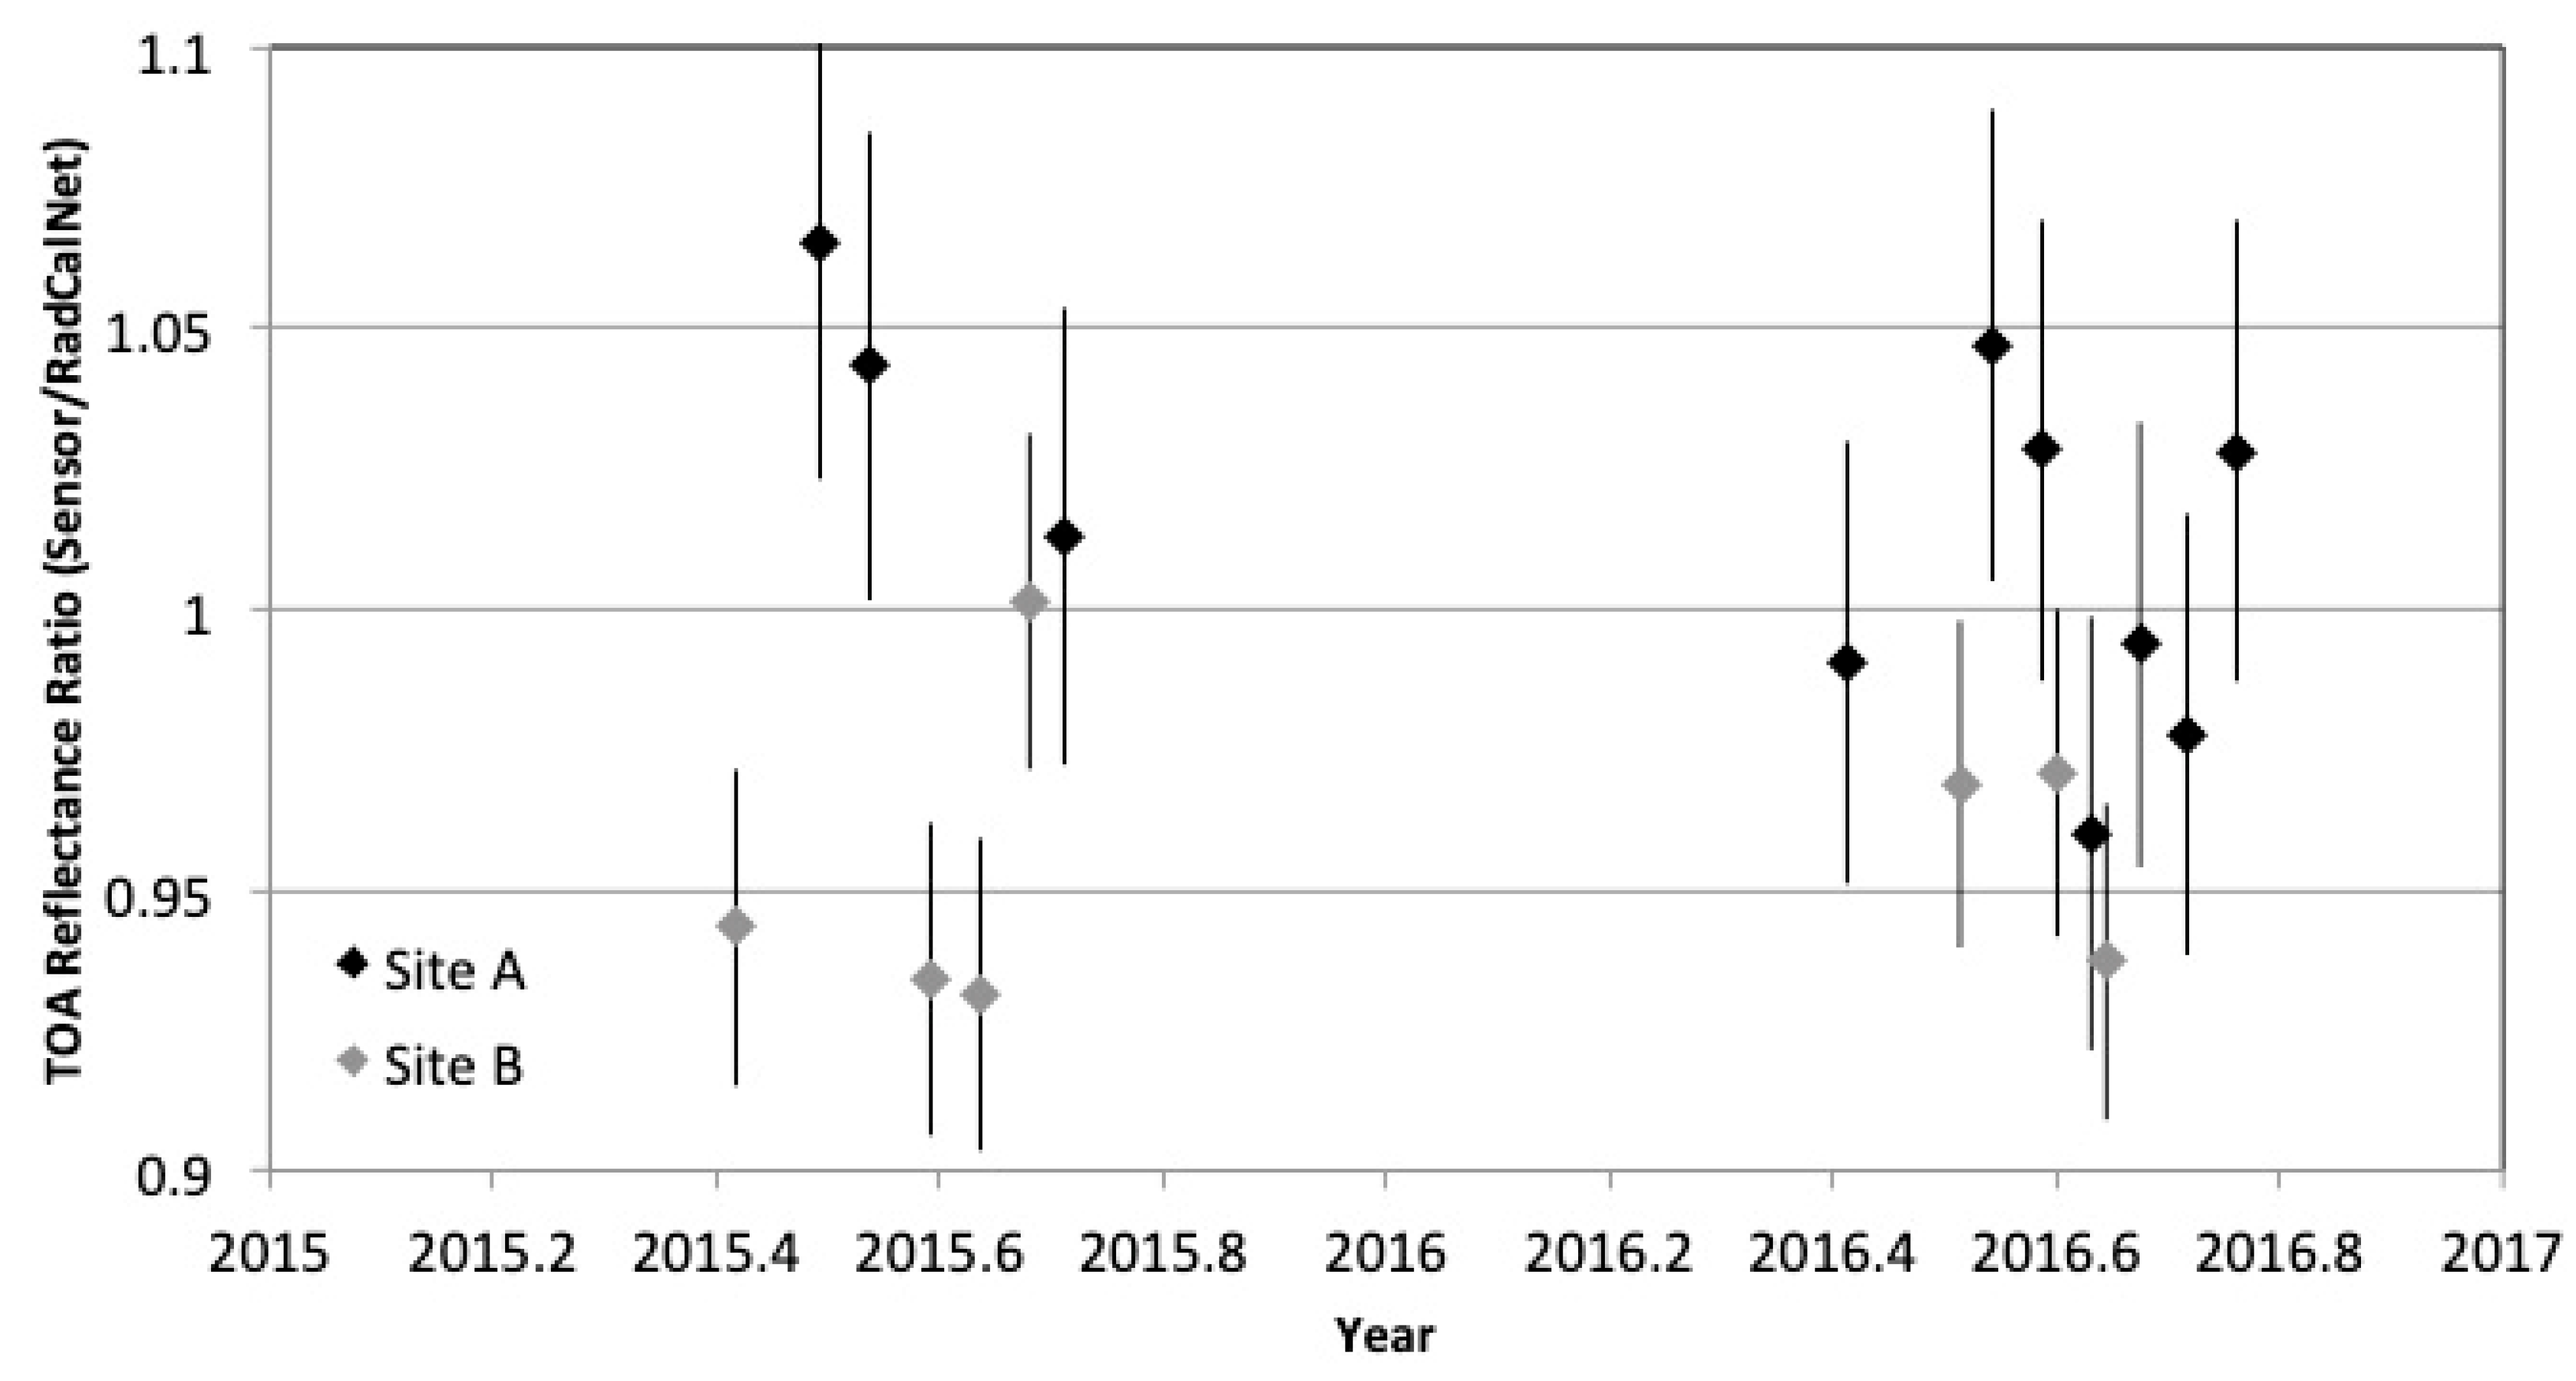
Employing the approach described above to Sensor #1 at Site A provided 10 near-nadir data images coinciding with available RadCalNet TOA reflectance predictions over approximately a 14-month period in 2015 and 2016. The maximum number of near-nadir views for this sensor that could be available over that time period is 30 possible scenes. The 20 “missing” data points are due to cloudiness over the site; instrumentation at the RadCalNet site undergoing maintenance; or unsuitable surface conditions, indicated by anomalously low reflectance (wet surface), anomalously high reflectance (snow), or rapidly changing values on a given date. The gap in results late in 2015 to early in 2016 is due primarily to cloudy conditions coupled with surface variability.
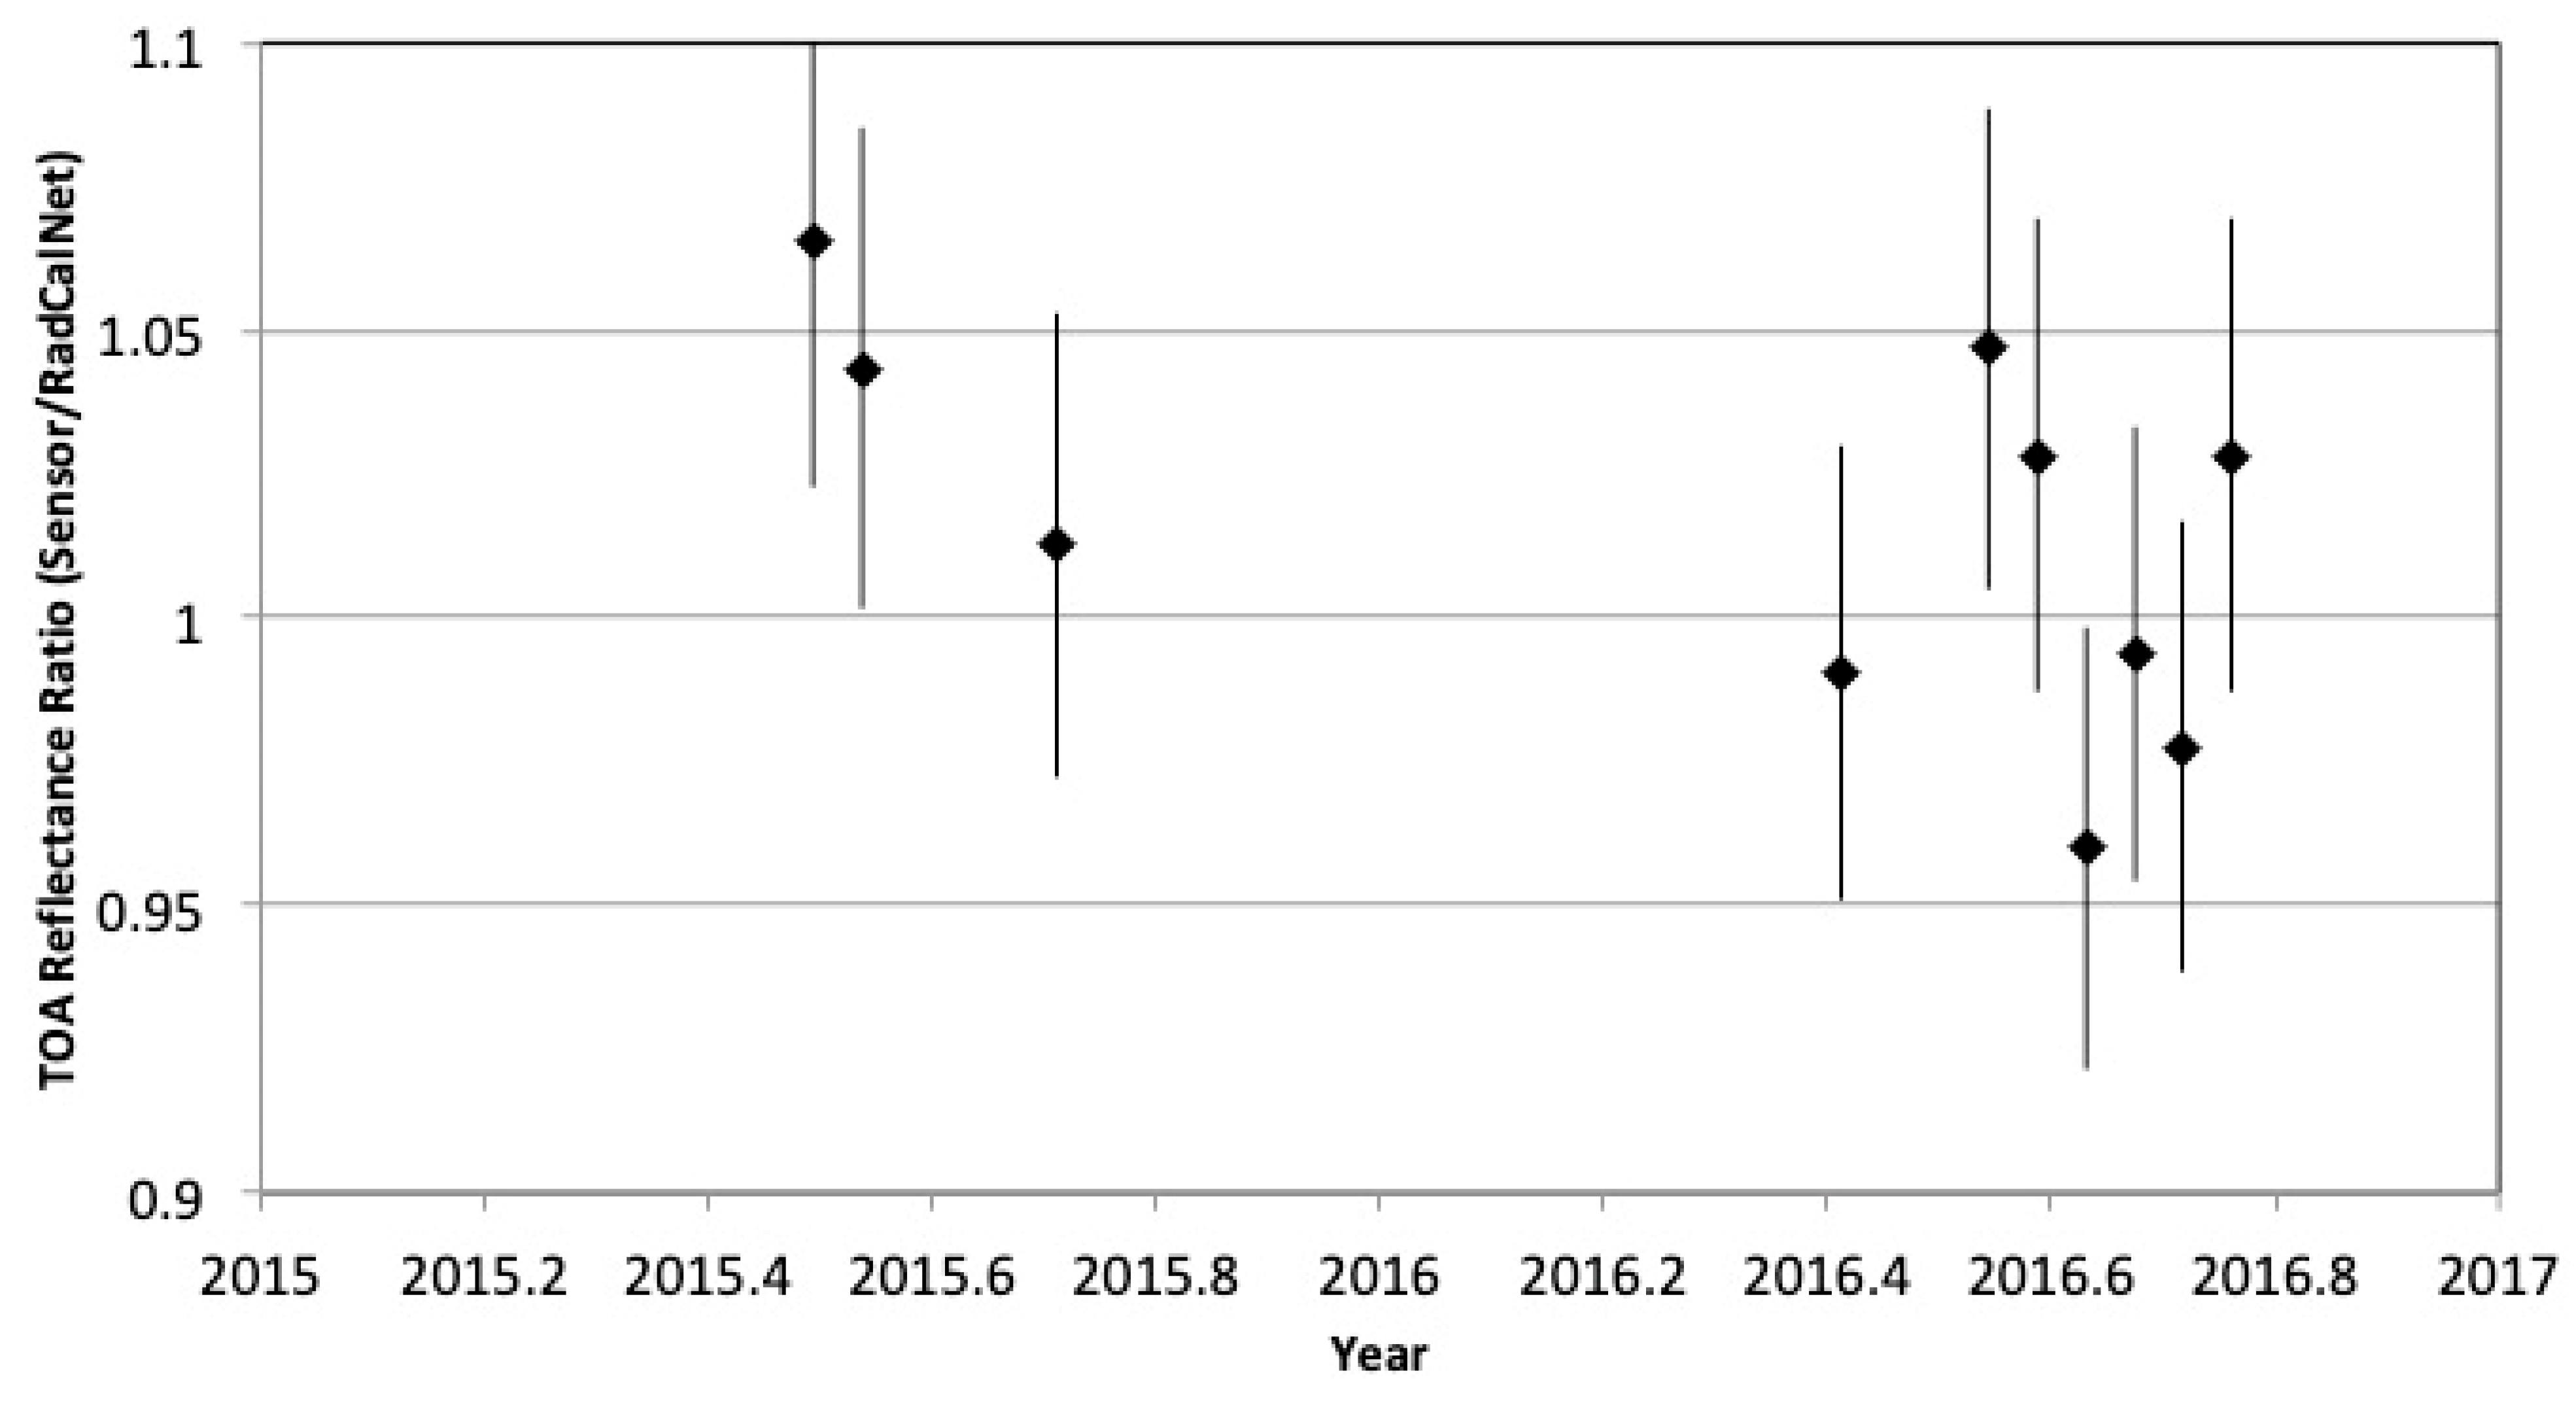
Figure 5 shows the results of these 10 dates as a function of time for a single spectral band of the imager, centered approximately at 650 nm. The data are displayed as the ratio of the predicted TOA reflectance to that reported by the imaging sensor. The error bars shown are the nominal absolute uncertainties for a single measurement being currently reported by RadCalNet. The uncertainties represented in
Figure 5 do not include the uncertainty related to Sensor #1′s image data, such as that caused by geolocation uncertainty, sensor noise, absolute uncertainty, and so forth.
One noticeable feature in
Figure 5 is the scatter of the data. Such scatter is also present in reflectance-based results relying on measurements made with personnel located at the instrumented site [
27,
29] and can result from uncertainties associated to the on-ground instrumentation radiometric calibration and stability and the site area sampling strategy, both typically estimated of the order of few percent. On top of such on-ground measurements uncertainties, this scatter is also explained by a) the uncertainty associated to the propagation of the surface reflectance measurements to the top of the atmosphere via radiative transfer simulation (due to uncertainty in atmospheric parameters measurement, such as aerosol optical properties and gaseous absorption) and b) the uncertainty associated to the spaceborne sensor calibration. The encouraging result is that the RadCalNet results agree with the imaging sensor’s absolute radiometric calibration to better than 5%, except for the initial two data points. This result is in line with the overall expected uncertainty of the reflectance-based methodology used by RadCalNet [
27,
29]. The data also indicate a trend of about 1% per year, which is statistically not significant over such period if compared with the uncertainty of about 5% obtained with the RadCalNet TOA simulations.
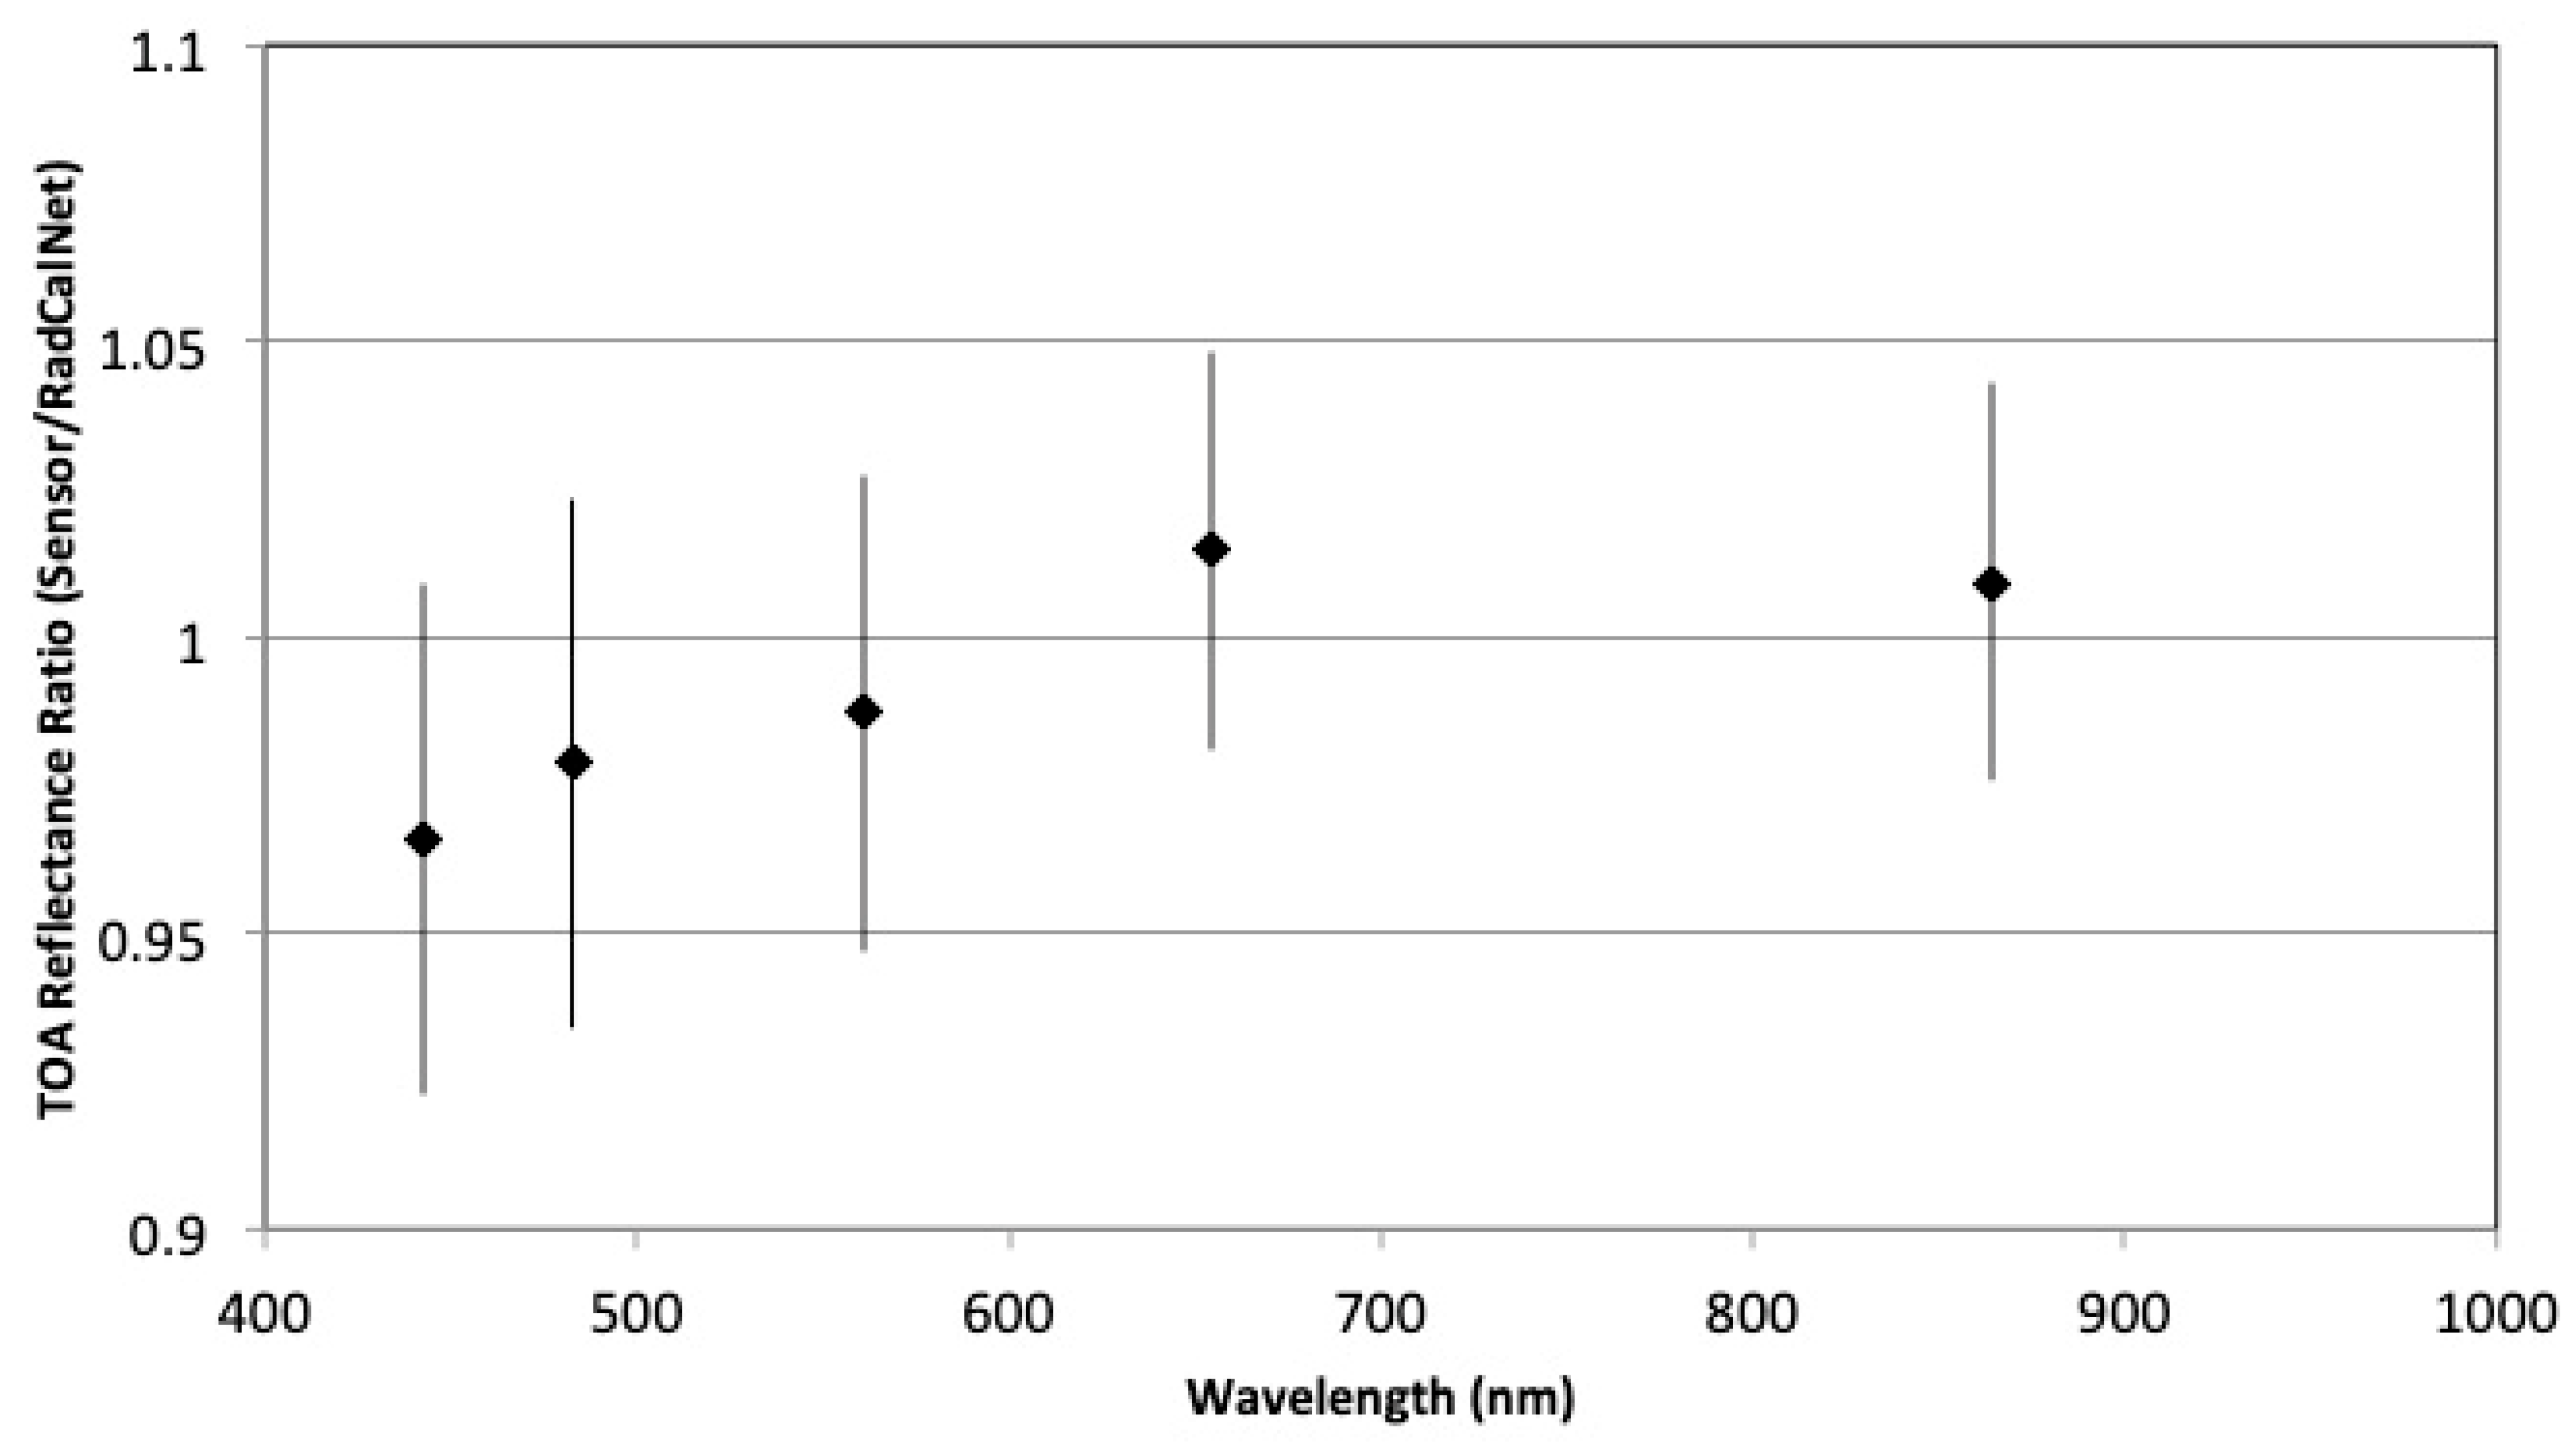
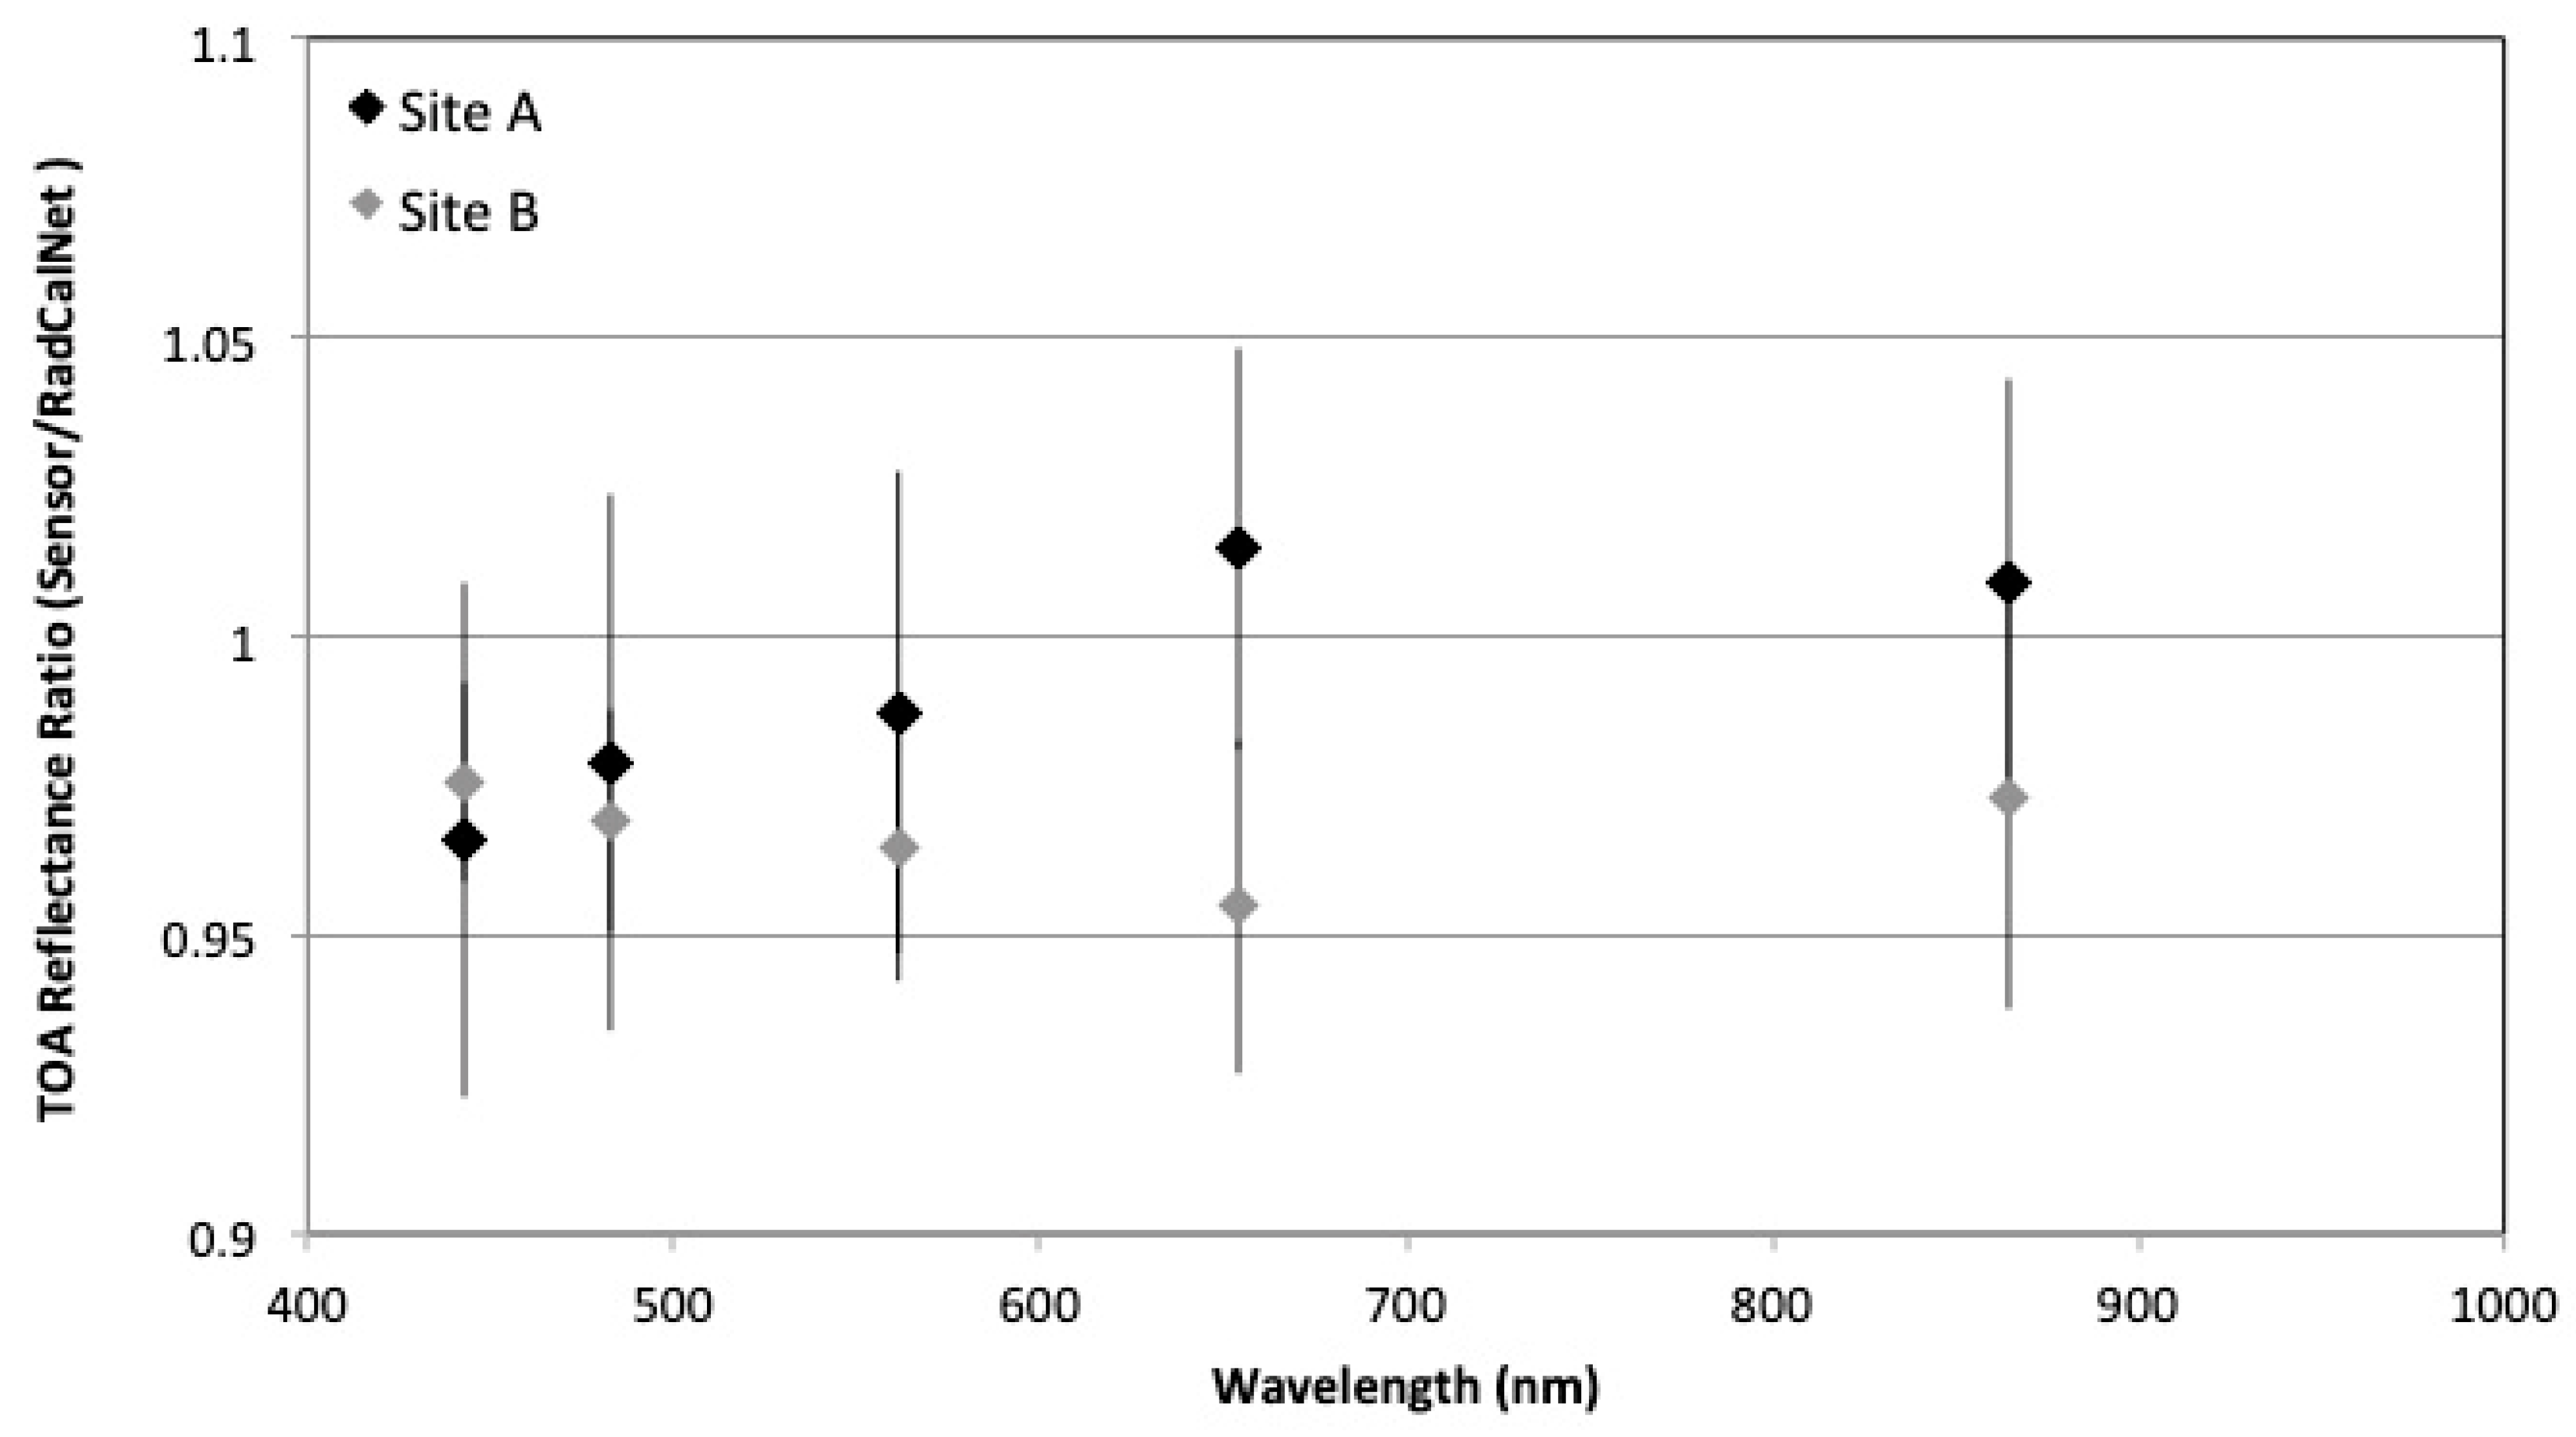
Averaging the 10 data points for each of the spectral bands leads to
Figure 6 that shows the average ratio between the RadCalNet predictions and Sensor #1′s reported TOA reflectance results for each spectral band. Such an average assumes that the sensor being calibrated is not changing in time, as is the case given prior knowledge of the radiometric stability of sensor #1. The average of the data shown in
Figure 5 are shown as the fourth band, centered near 650 nm. The error bars shown in this figure are the 1-σ standard deviations of the temporal averages. The standard deviations shown here match well with those reported in past work for reflectance-based methods with on-site personnel [
1]
The dominant result to note is that the averages all agree to within their associated standard deviation (just below 5%), which is in line with the overall expectation of the reflectance-based methodology used by RadCalNet; a spectral trend can also be seen. Such a trend could indicate a band-to-band calibration feature of the sensor or be an indication of a systematic spectral effect in the processing of the RadCalNet data. Statistical evaluation of the means of the 450 nm, 480 nm, and 550 nm bands are not different at the 5% level. Taken individually, the 650 nm and 850 nm bands are statistically different from the three shorter-wavelength bands at the 5% level. Results for all bands, however, agree with the RadCalNet predictions to within the absolute uncertainty for the site, as reported by the site operator and evaluated by the RadCalNet Working Group. Evaluation of the measurement methodology, instrumentation, and processing does not indicate that a bias is present. One approach to understand the origin of any bias is to examine the behavior of the same sensor at multiple sites that follow similar measurement and uncertainty protocols.
5.2. Single Sensor, Multiple Sites
One goal of RadCalNet is to increase the number of available calibration opportunities through networking results from multiple sites. Such a goal requires that the results from different sites can be used interchangeably to assess the radiometric calibration of a sensor. One method to assess the suitability of using multiple sites is to compare results from the sites using a well-understood sensor that is not changing significantly with time. A similar approach has been used for reflectance-based results at two sites in the western USA [
32]. The comparison of sensor #1 measurements to site A and B RadCalNet TOA simulation is first presented, and then similarly for sensor #2 again against the RadCalNet simulation from site A and B.
Figure 7 repeats the results for RadCalNet Site A and Sensor #1 given in
Figure 5, while including results from RadCalNet Site B. Ideally, one would have the same number of data points when comparing the impact of site-related uncertainties, but weather conditions and other factors limit the opportunity for such a controlled evaluation.
The first feature to note is that the gap in data from late 2015 to early 2016 is present for both Sites A and B. Such a lack of data from two widely separated sites over the same time period is rare and is one motivation for expanding RadCalNet to include sites with varying climatologies (and particularly the use of both southern hemisphere and northern hemisphere sites) to reduce the chance of such gaps occurring.
Figure 7 helps to illustrate one of the advantages of providing data from multiple sites. Consider the time period near the middle part of 2016. Three data points should be sufficient to derive a radiometric calibration with statistical confidence [
40], but the opportunity to include additional data points of similar absolute and relative uncertainties improves the understanding of the sensor’s radiometric behavior. Likewise, consider the results shown from 2015 for the three data points from Site A. The noise in those results could be interpreted to imply a trend in the sensor’s response as a function of time. Combining the results from both sites would reinforce the lack of a statistical trend from Site A.
Of course, the discussion above depends on there being no systematic differences larger than absolute uncertainties at the multiple sites. Visual inspection of the data in
Figure 7 indicates that the results from Site B appear to have a lower ratio than those from Site A. The difference is readily apparent in the data from 2015. A first evaluation of the two datasets examined whether either site indicates a trend in the sensor’s radiometric response or possibly a nonlinear response in relation to the surface reflectance levels of site A and B. As mentioned previously, the data from Site A for this spectral band near 650 nm do not indicate a temporal change in the ratio that is statistically different from zero at the 5% confidence level. The results from Site B also show no trend at the 5% confidence level, as does the combined Site A and B results.
Figure 8 helps to understand the significance of the possible systematic differences between the two sites. The figure shows the average ratio for the two sites based on the seven and 10 days shown in
Figure 7. The means for the 650 nm and 850 nm bands are statistically different at the 5% confidence level, while those of the other bands agree. However, it should be made clear that the results for all bands agree to within the absolute uncertainties determined by each site operator for their site and agreed upon by the RadCalNet Working Group (in the range of 3% to 5%, depending of the spectral region here covered and the sites).
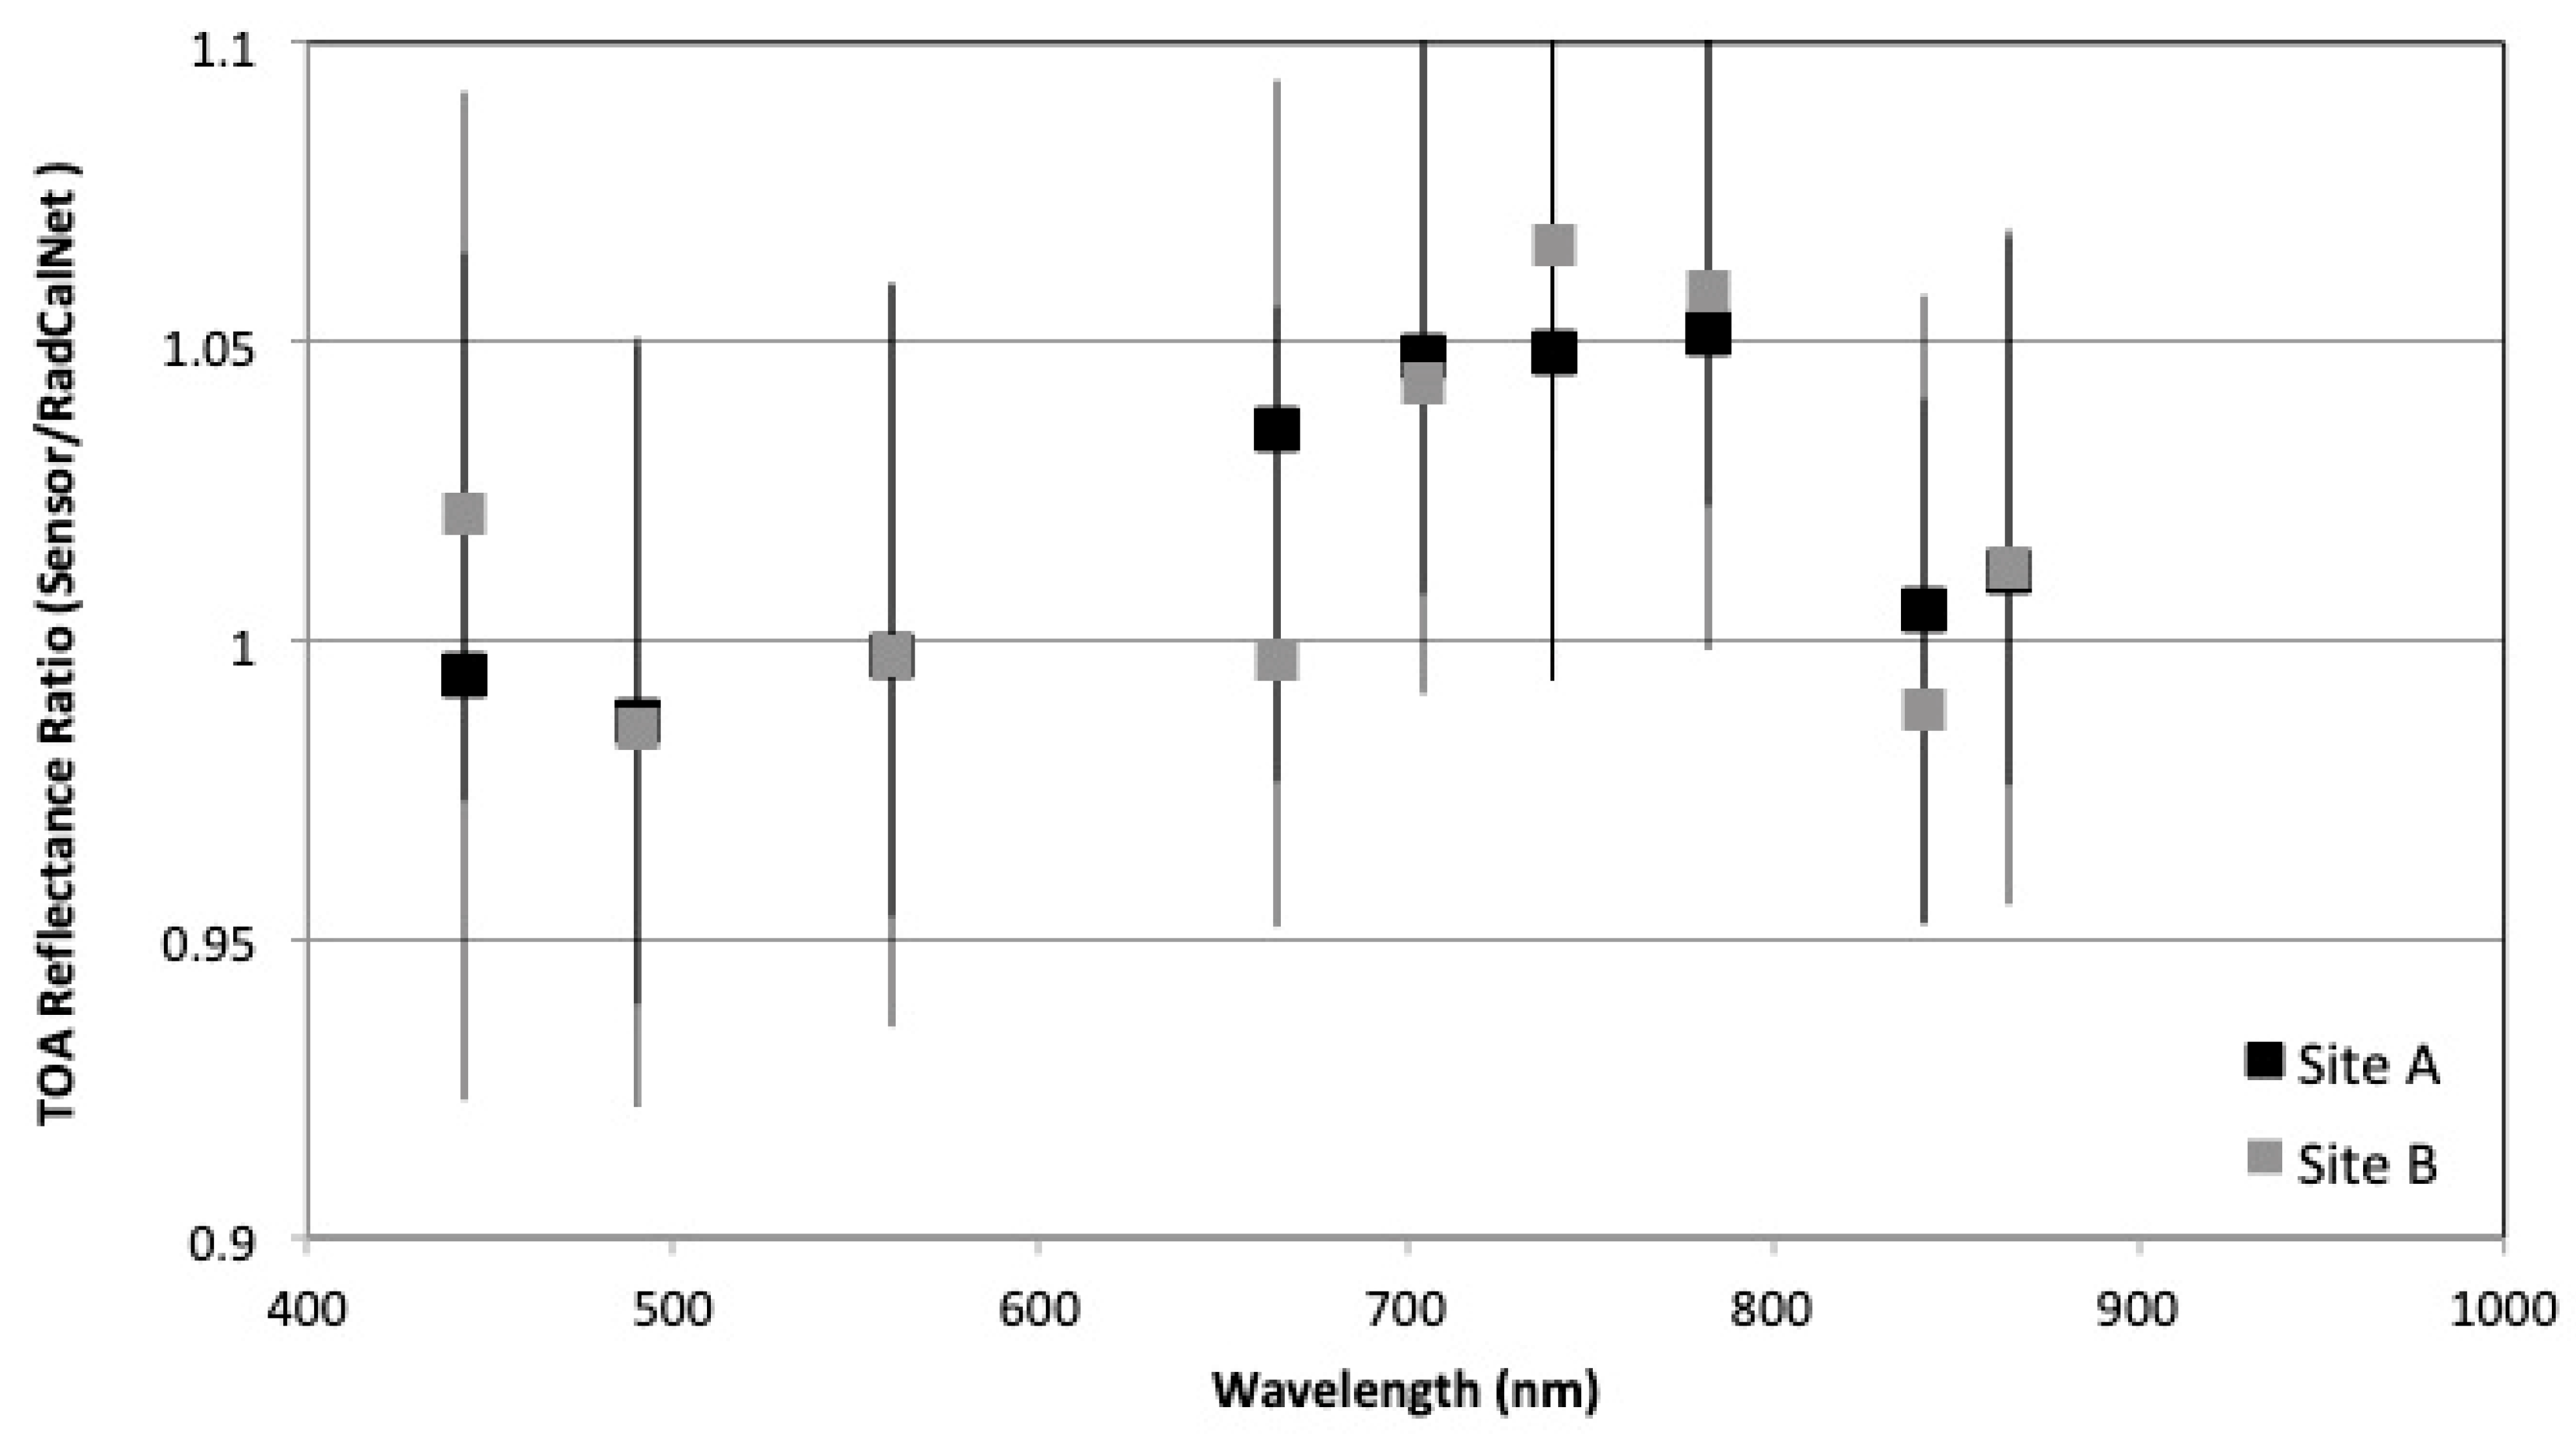
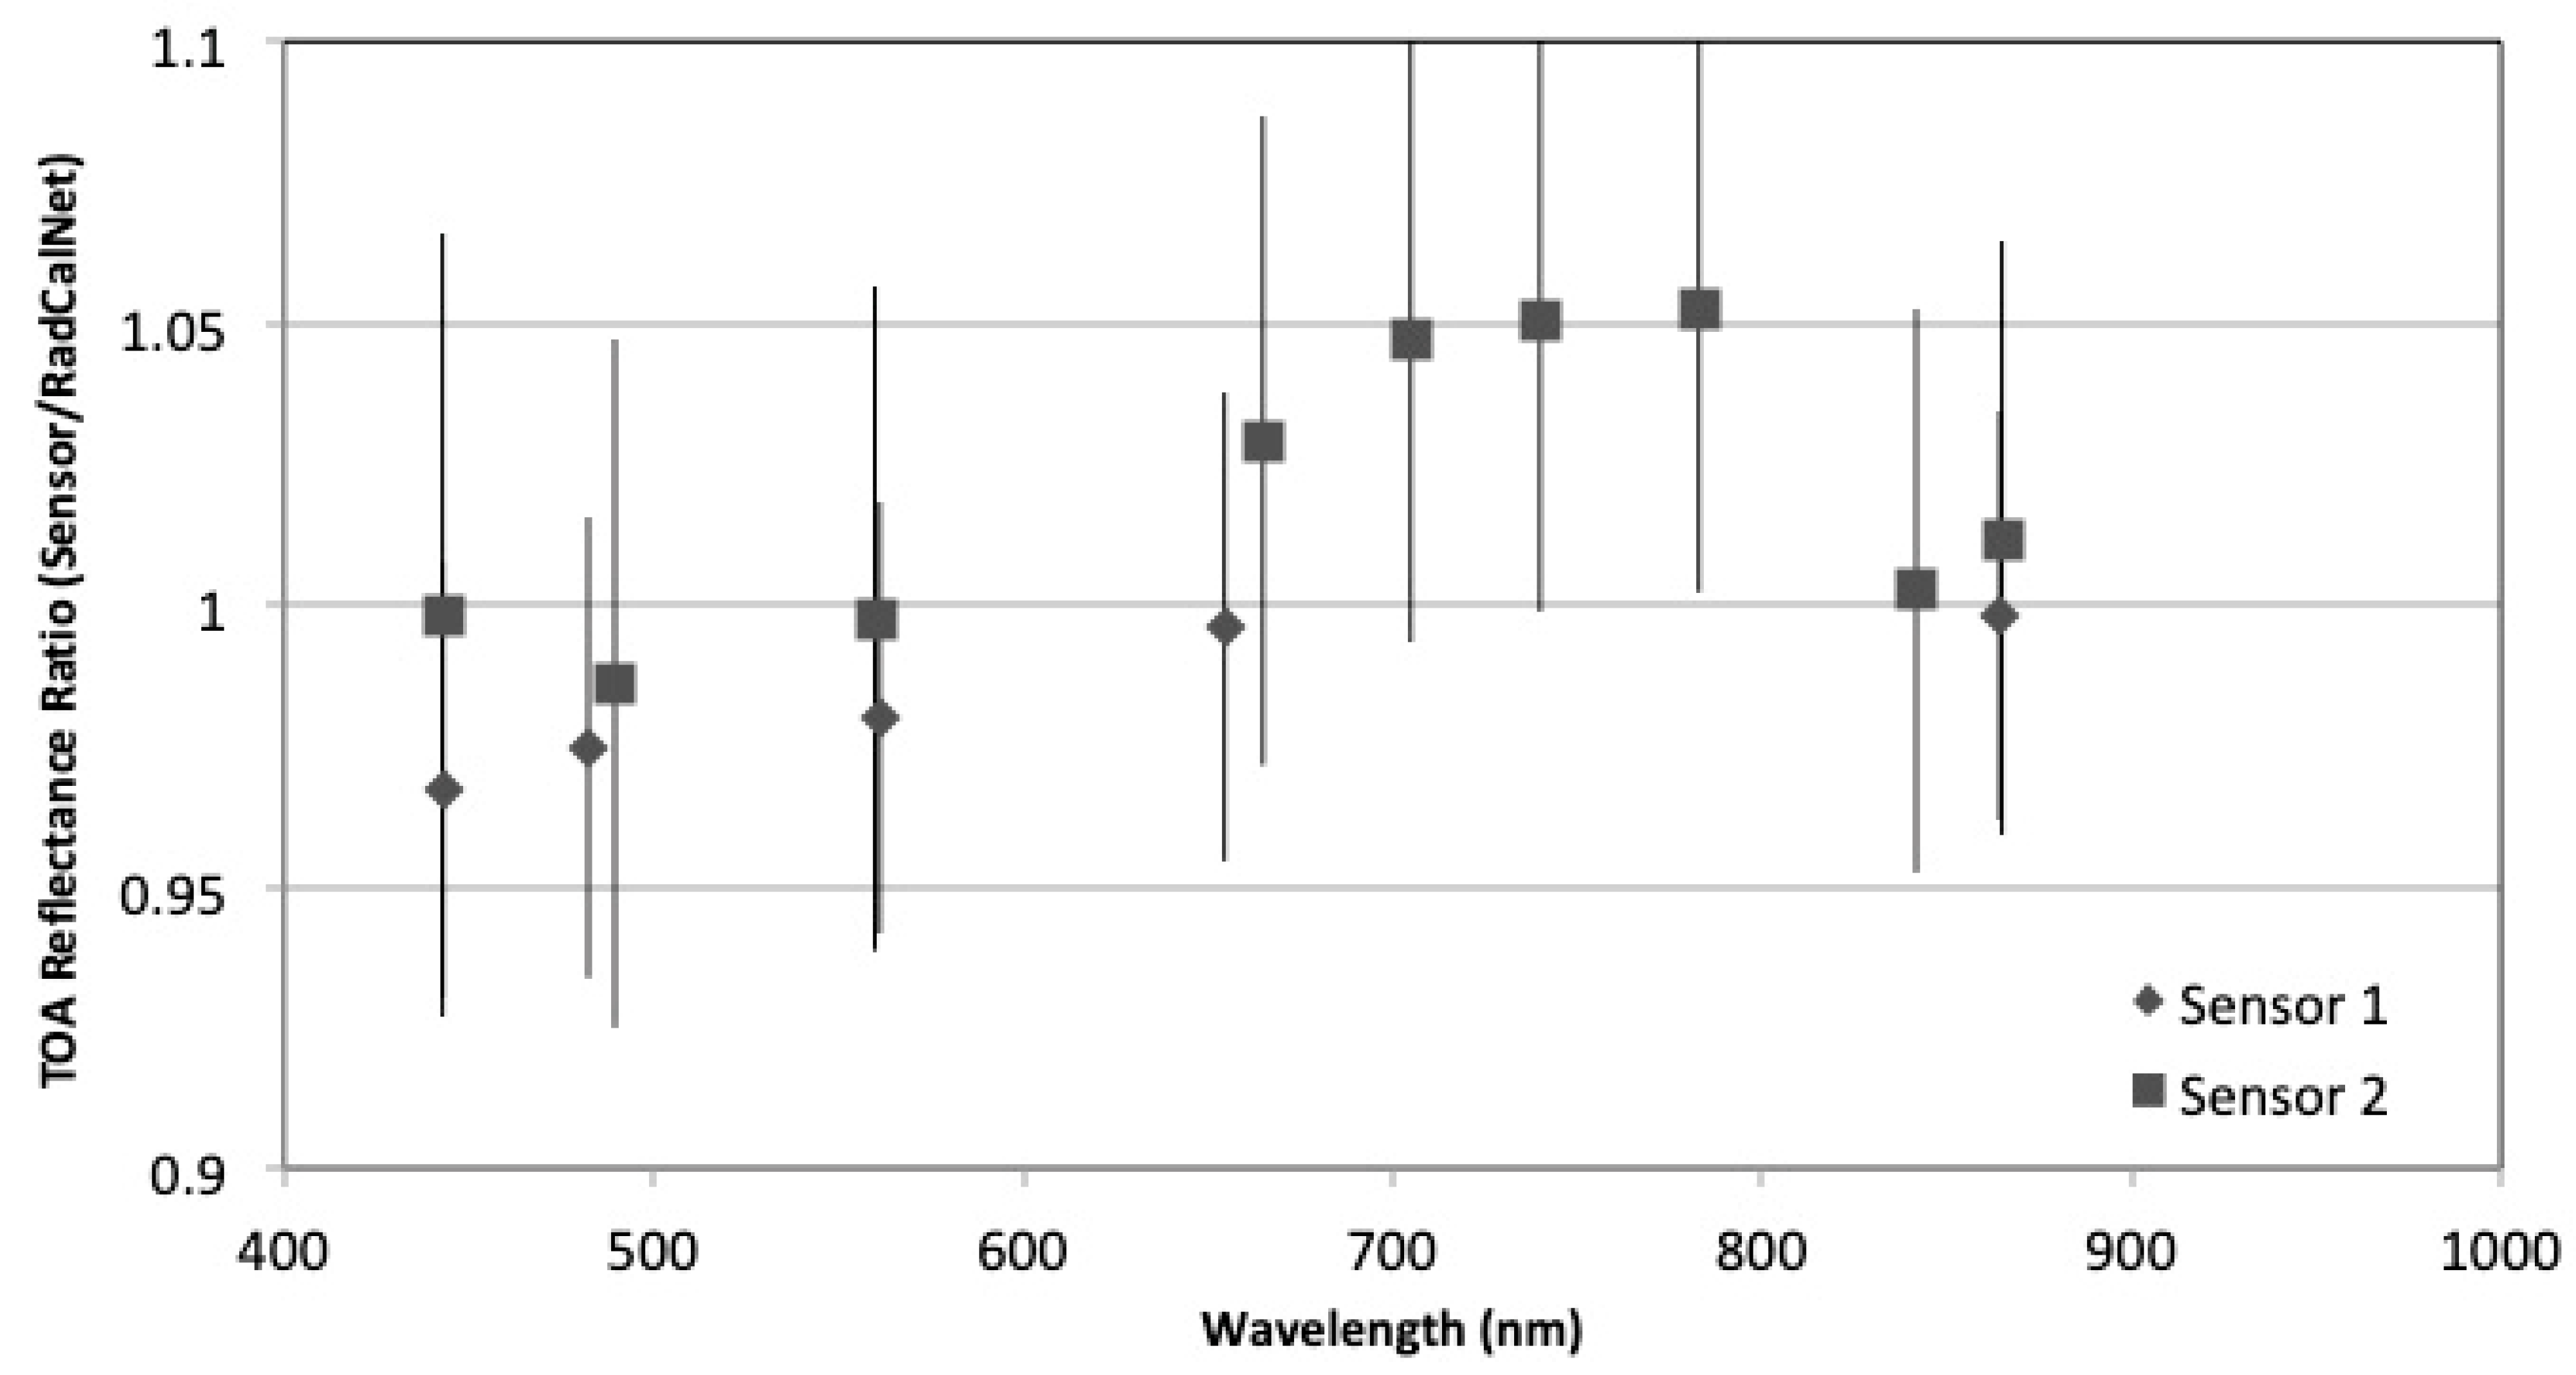
Figure 9 shows the same as
Figure 8, except for Sensor #2 at Sites A and B. The number of datasets for Sensor #2 at Site A is 16, and that for site B is five. None of the means from the two sites for a given band are found to be different statistically at the 5% confidence level. The agreement for several of the bands is close enough that the two symbols are not discernible. The disagreements are again largest at 650 nm, indicating a possible feature in this part of the spectrum between the results of the two sites. It is possible that there is a systematic effect that has been missed in the uncertainty analysis. One advantage of RadCalNet is that the availability of data from other sites and sensors will allow improvements in understanding the RadCalNet uncertainty budgets as well as possible sensor features that could cause site-dependent differences.
It is noted above that the band-to-band differences for Sensor #1 for both sites were not statistically different. That is, the radiometric calibration of all bands is within the uncertainties of the predicted TOA reflectance from two RadCalNet sites across all spectral bands. The Sensor #2 data in
Figure 9 show similar agreement to the RadCalNet TOA reflectance. The band-to-band differences also agree to within the absolute uncertainties, but the relative difference between the average ratios for spectral bands in the 650 nm to 800 nm spectral region are statistically different from those of the shortest wavelength bands for Site A. Results from Site B confirm the statistical difference for bands between 700 nm and 800 nm and those between 480 nm and 600 nm. Such a result, confirmed at two different sites, should lead to an examination of the band-to-band radiometric calibration of Sensor #2.
5.3. Multiple Sensors, Single Site
Data from a single RadCalNet site can be used to examine the calibration of multiple sensors. Such results have been obtained in the past by groups using the reflectance-based method with on-site personnel, as well as by the RadCalNet site operators relying on their automated systems.
Figure 10 is similar to
Figure 8 and
Figure 9 but shows the results from Site A for the two sensors and illustrates one of the advantages of using data from RadCalNet for sensor radiometric comparisons. The results for the two sensors are plotted as a function of the band-averaged center wavelength obtained from the sensor’s relative spectral response data. Recall that the ratios are obtained from similar band-averaging approaches and thus, the results inherently contain spectral band adjustment factors [
41], allowing direct comparisons between the sensors against a common reference.
Analysis of the results in
Figure 10 indicates no statistically significant difference between the similar bands of the sensors at the 5% confidence interval when relying on either the standard deviation of the average or the estimated absolute uncertainty. Likewise, the results are not statistically different from a ratio of unity for any of the spectral bands.
The results in
Figure 10 also confirm the discussion of the previous section related to the band-to-band agreement for Sensor #2. The power of RadCalNet is well demonstrated in the band-to-band differences seen in Sensor #2 by RadCalNet. One would expect that processing data through an algorithm relying only on the near-identical bands of Sensors #1 and #2 would give similar results for either sensor because the radiometric calibrations agree. One advantage for Sensor #2 is that the added bands from 700 nm to 800 nm allow unique algorithms to be developed, making use of this spectral information. Conclusions drawn from algorithms using these bands could be suspect because of the lack of consistent radiometric calibration across the sensor. The ability to reference all of the spectral bands of a sensor to a common SI-traceable reference of RadCalNet allows for comparisons such as this.
As has been emphasized repeatedly, another advantage of RadCalNet is the use of multiple sites.
Figure 11 shows the comparison between Sensors #1 and #2, except in this case relying on Site B. Comparing the ratios for similar center wavelengths shows that the calibrations of both sensors agree at the 5% confidence interval, both in a relative and in an absolute sense. The three spectral bands of Sensor #2 in the 700 nm to 800 nm spectral region again disagree significantly from the shorter-wavelength bands of Sensor #1 as well as the 850 nm at this site.
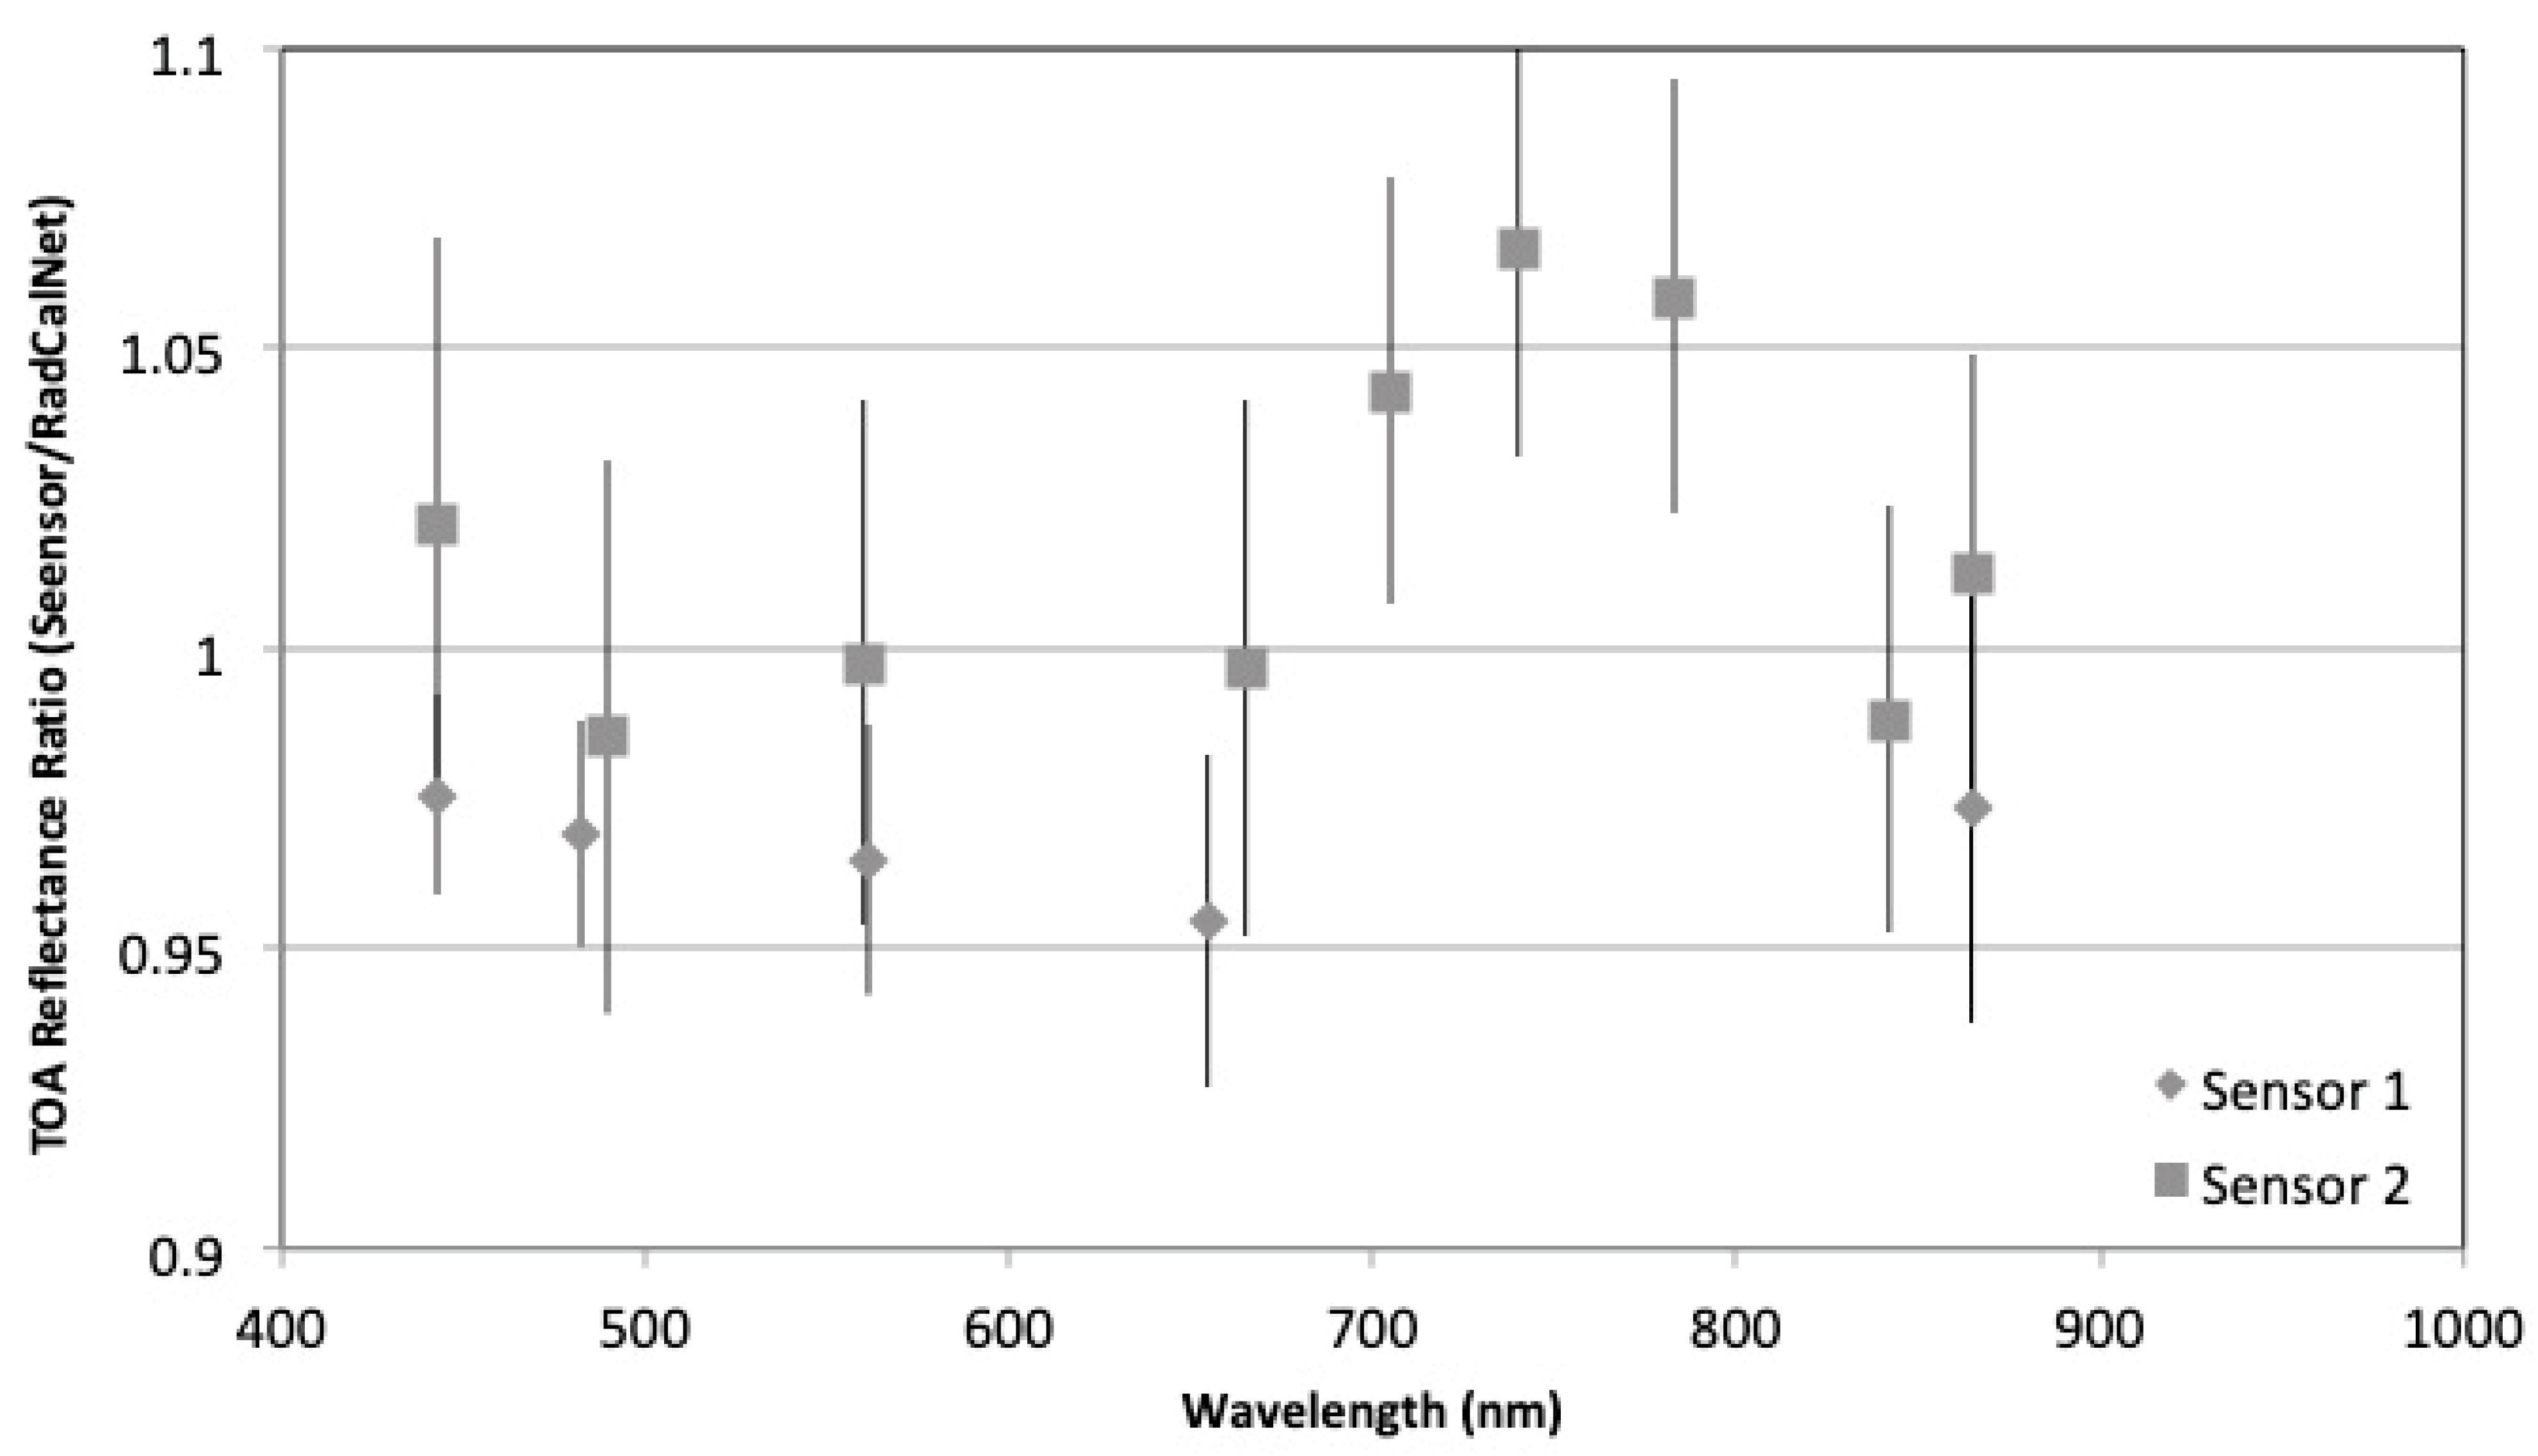
5.4. Two Sensors, Two Sites
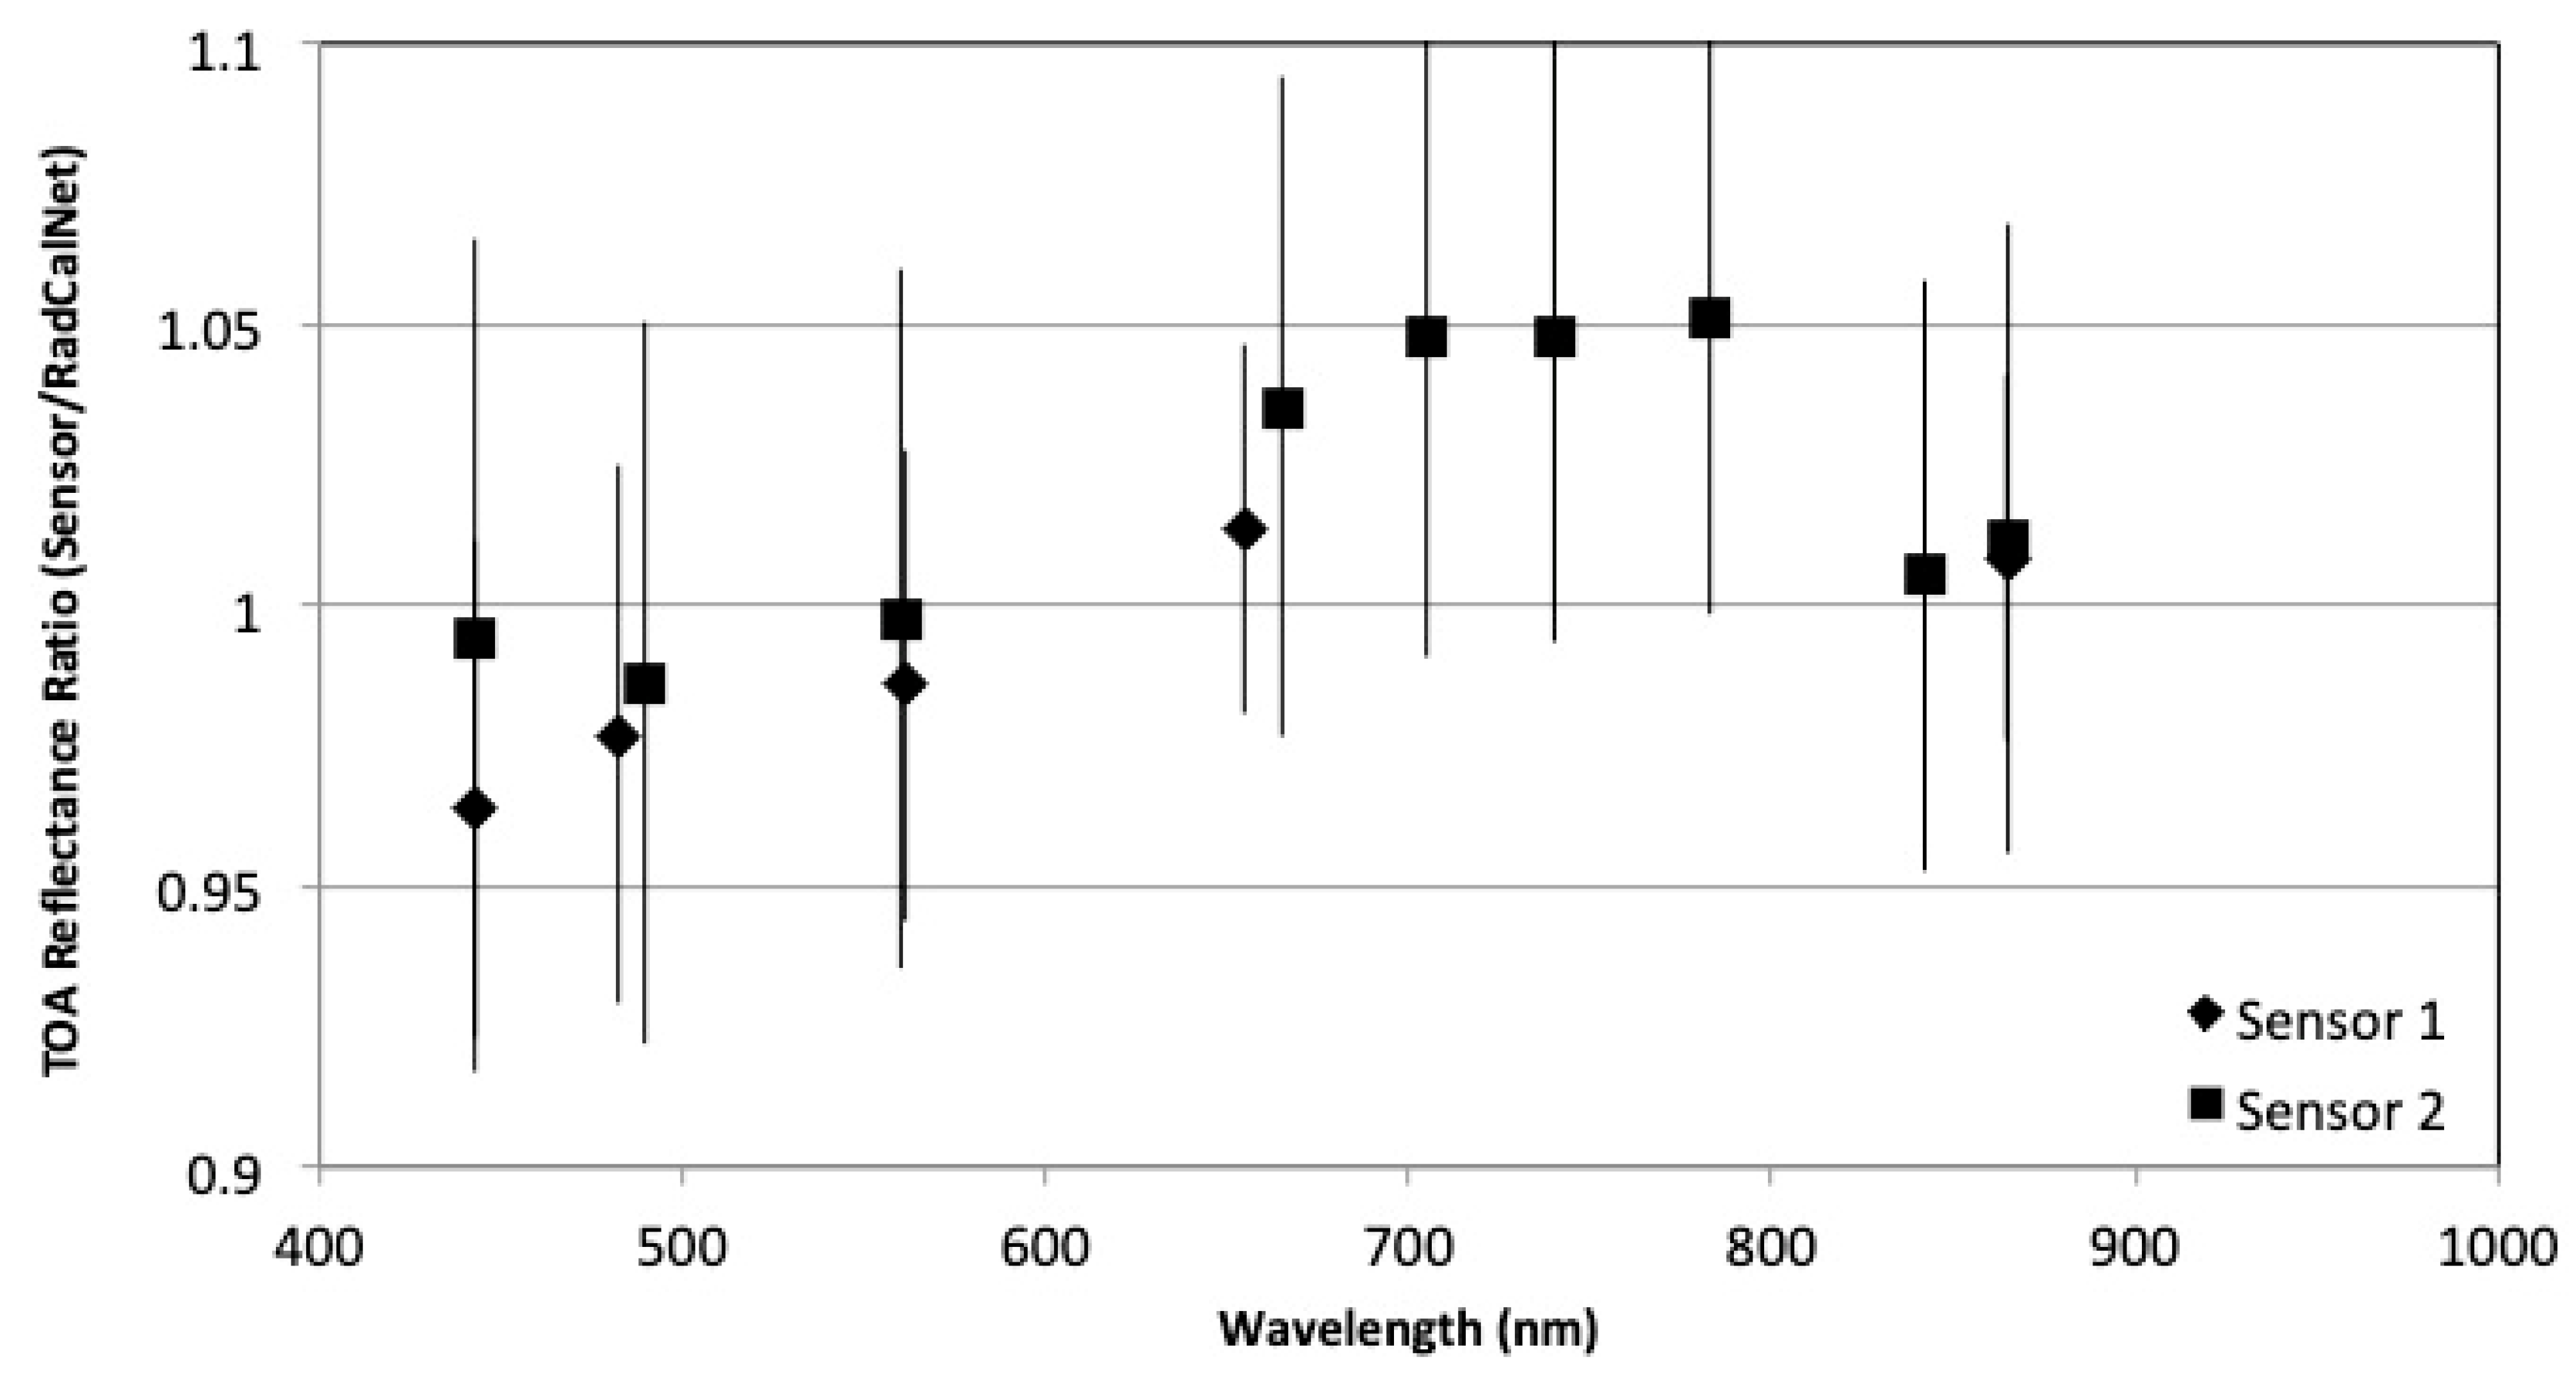
The final way to examine the data from the two sensors and the two sites is to combine all of the data from both sites for a single sensor for both sensors of interest, as shown in
Figure 12. The data points represent the average of the ratios from all dates, weighted by the absolute uncertainty for each site. Similarly, the error bars shown are a weighted variance based on the absolute uncertainties for each site. Such an approach is simplistic but serves as an example of how the data from two sites could be combined. Efforts are taking place within the RadCalNet Working Group to determine methods to represent the uncertainties and averages from combinations of data from multiple sites. For example, one could readily compute the average ratio from data for each site and then determine the average of those two results (i.e., the average of the results shown in
Figure 10 and
Figure 11).
The results shown in
Figure 12 are very similar, but noticeably different to those in
Figure 10 and
Figure 11. None of the results shown in
Figure 12 are statistically different from a relative or absolute sense, and this is not a surprise since
Figure 12 represents a combination of the data in the other two figures. The band-to-band agreement within a sensor agrees to within the absolute uncertainty for each sensor. Likewise, the sensor-to-sensor agreement for similar bands is within the absolute uncertainties. The same conclusions are drawn when using an unweighted average and standard deviation computed from the unweighted average, in essence providing a relative comparison between bands and sensors. All bands across both sensors agree from an absolute sense as well, however, the three bands from Sensor 2 between 700 nm and 800 nm differ significantly from Band 1 of Sensor 1 in a relative sense using the unweighted standard deviation of the averages.
5.5. Interconsistency
The example shown in
Figure 12 is a demonstration of how data from RadCalNet can be used for harmonization, or interconsistency, studies. The SI-traceable nature of RadCalNet with its known uncertainties allows the network to be treated as a common reference to understand the consistency between sensors. One advantage to RadCalNet is that no spectral band correction factor [
41] is needed because the results for each sensor already include the sensor SRF as part of the band weighting. Additionally, the data from the sensors under study need not be from the same dates, and, more importantly, the data from the sensors need not even be from the same sites. A similar philosophy has been recommended for use of results from the reflectance-based approach with personnel present on the site [
12] and allowed the intercomparison of a dozen satellite and airborne sensors [
42]. The examples above provide a demonstration of the utility of RadCalNet and show how SI-traceability provides the best methodology for ensuring data interconsistency across bands and sensors.
6. Conclusions
This paper has presented information about the new RadCalNet network of instrumented sites. RadCalNet is designed to provide predicted TOA reflectance suitable for the radiometric calibration or monitoring of Earth imagers in the reflected solar portion of the spectrum. The initial network of sites consists of four locations: Baotou (China), Gobabeb (Namibia), La Crau (France), and Railroad Valley Playa (USA). Data from the four sites are available via the RadCalNet portal, along with documentation providing descriptions regarding the instrumentation at each site and SI-traceable uncertainties for the RadCalNet results from the sites.
RadCalNet data has been processed by many users, at the time of writing there are more than 300 registered users of RadCalNet from over 35 countries. The data from RadCalNet are well suited to assess the radiometric stability and accuracy of individual space sensors and to assess the radiometric consistency of multiple sensors, without relying on the assumption of temporal invariance of the observed site nor requiring near-simultaneous observations of the site by the sensors being compared. The SI-traceable nature of the RadCalNet TOA reflectance and its associated uncertainties allows for the consistent radiometric monitoring, comparison, and calibration of space sensors over multiple sites.
RadCalNet data are already being used for comparisons, calibrations, and validations e.g., ([
43]). It is expected that over the next few years more sites will be admitted as RadCalNet sites, increasing the range of sites available for comparison. Research is ongoing on how to improve the accuracy and consistency of RadCalNet sites and how to make the most of the available data.
While RadCalNet was designed for the comparison of Level 1 satellite products of TOA reflectance, the data are also being used for other applications. The BOA observations (site raw data) are of interest to those generating Level 2 products (atmospherically corrected BOA reflectance).

 ,
, 


