Article

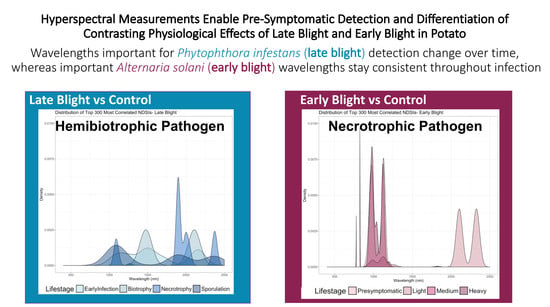
Hyperspectral Measurements Enable Pre-Symptomatic Detection and Differentiation of Contrasting Physiological Effects of Late Blight and Early Blight in Potato

1
Plant Pathology and Plant Microbe Biology Section, Cornell University, 15 Castle Creek Drive, Geneva, NY 14456, USA
2
Department of Forestry and Wildlife Ecology, University of Wisconsin-Madison, 1630 Linden Drive, Madison, WI 53706, USA
3
The Robert H. Smith Institute for Plant Sciences and Genetics in Agriculture, The Hebrew University of Jerusalem, P.O. Box 12, Rehovot 7610001, Israel
4
Departments of Entomology and Forestry and Natural Resources and Center for Plant Biology, Purdue University, 224 Whistler Hall, West Lafayette, IN 47907, USA
5
Department of Plant Pathology, University of Wisconsin-Madison, 1630 Linden Drive, Madison, WI 53706, USA
*
Author to whom correspondence should be addressed.
Submission received: 4 December 2019 / Revised: 7 January 2020 / Accepted: 13 January 2020 / Published: 15 January 2020
(This article belongs to the Special Issue Remote Sensing for Plant Pathology)

Abstract

:
In-vivo foliar spectroscopy, also known as contact hyperspectral reflectance, enables rapid and non-destructive characterization of plant physiological status. This can be used to assess pathogen impact on plant condition both prior to and after visual symptoms appear. Challenging this capacity is the fact that dead tissue yields relatively consistent changes in leaf optical properties, negatively impacting our ability to distinguish causal pathogen identity. Here, we used in-situ spectroscopy to detect and differentiate Phytophthora infestans (late blight) and Alternaria solani (early blight) on potato foliage over the course of disease development and explored non-destructive characterization of contrasting disease physiology. Phytophthora infestans, a hemibiotrophic pathogen, undergoes an obligate latent period of two–seven days before disease symptoms appear. In contrast, A. solani, a necrotrophic pathogen, causes symptoms to appear almost immediately when environmental conditions are conducive. We found that respective patterns of spectral change can be related to these differences in underlying disease physiology and their contrasting pathogen lifestyles. Hyperspectral measurements could distinguish both P. infestans-infected and A. solani-infected plants with greater than 80% accuracy two–four days before visible symptoms appeared. Individual disease development stages for each pathogen could be differentiated from respective controls with 89–95% accuracy. Notably, we could distinguish latent P. infestans infection from both latent and symptomatic A. solani infection with greater than 75% accuracy. Spectral features important for late blight detection shifted over the course of infection, whereas spectral features important for early blight detection remained consistent, reflecting their different respective pathogen biologies. Shortwave infrared wavelengths were important for differentiation between healthy and diseased, and between pathogen infections, both pre- and post-symptomatically. This proof-of-concept work supports the use of spectroscopic systems as precision agriculture tools for rapid and early disease detection and differentiation tools, and highlights the importance of careful consideration of underlying pathogen biology and disease physiology for crop disease remote sensing.

Graphical Abstract

1. Introduction

Plant disease destroys 15–30% of all food grown globally, a loss of roughly $220 billion annually [1]. In recent years, there has been an increasing trend towards using non-destructive, sensor-based methods for crop disease detection as part of a global movement towards precision agriculture practices [2]. Dead tissue yields relatively consistent changes in leaf optical properties, which presents challenges to distinguishing causal plant pathogen identity using symptomatic plant tissue rather than traditional molecular or serological methods. This limitation negatively impacts the utility of remote sensing for effective plant disease management. The capacity to non-destructively identify causal organisms as opposed to disease/no-disease would represent a great improvement on current commercially available disease sensing systems that rely primarily on visible (VIS, 400–700 nm) and near-infrared (NIR, 700–1000 nm) reflectance indices, such as normalized difference vegetation index (NDVI), to detect advanced, rather than early (non-visual), stages of plant disease.
Reflectance spectroscopy has emerged as an effective approach for fast, non-destructive estimation of a wide variety of plant chemical, biophysical, and metabolic traits in living tissue [3,4,5,6,7,8,9,10,11,12,13,14]. This methodology utilizes changes in leaf optical properties arising from the interaction of light, chemical bonds, and cellular structure to directly estimate foliar structure, plant chemical composition, water concentration, and metabolic status from reflectance measurements in the VIS, NIR, and shortwave infrared wavelengths (SWIR, 1000–2500 nm) [3]. Such work has commonly employed handheld, hyperspectral field spectrometers that measure light reflectance continuously across the VSWIR (collectively 350–2500 nm) spectral range at 3–8 nm resolution. These measurements differ from broadband, multispectral devices, and cameras by covering a larger spectral range at narrower intervals. Changes in reflectance in the VIS range is mainly influenced by pigment concentration and photosynthesis. In contrast, changes in the NIR result from leaf structure and internal light scattering processes [15], while SWIR measurements are strongly influenced by leaf chemical composition and water content [3].
Plant disease induces physiological changes that influence plant energy balance and how solar radiation interacts with foliage. In addition to modifications to tissue color, disease can affect a variety of traits that can be remotely sensed, such as leaf shape, transpiration rate, canopy morphology, canopy density, foliar chemistry, and water content [16]. Changes in continuous, narrowband (i.e., 1–10 nm wavelength spacing) SWIR wavelengths are valuable for plant disease detection due to their sensitivity to a range of biochemical and physiological properties impacted by plant disease [3,5,17]. Plant pathogens damage, impair, and/or alter foliar function [16], thus changing the chemical composition of the foliage, such as through production of systemic effectors or secondary metabolites, or by physical presence of pathogen structures, such as hyphae and spores, which can be detected using spectral data [2,17]. The use of hyperspectral VSWIR measurements allows us to non-destructively assess both the broad and specific impacts of plant pathogens on plant chemistry, physiology, and morphology [18,19,20,21,22,23].
Together, late blight and early blight are the most important diseases of potato, and account for the vast majority of disease management effort and cost in temperate growing regions [24]. Late blight is caused by the oomycete plant pathogen Phytophthora infestans (Mont.) deBary, a plant disease notorious for giving rise to the Irish Potato Famine of the 1840s in which nearly a million people died and two million emigrated [25]. Late blight causes $6.7 billion in losses annually, making it one of the most destructive potato (Solanum tuberosum L.) and tomato (Solanum lycoperscium L.) diseases worldwide [26]. Phytophthora infestans can cause disease symptoms on almost all potato and tomato plant parts at any point during the growing season, including post-harvest [16]. As a hemibiotrophic organism, P. infestans spends the initial stage of its life cycle living inter- and intracellularly feeding on living cells, then switches to a necrotrophic lifestyle. Visual symptoms do not appear until after the pathogen lifestyle switch, which typically occurs at two days post-infection; after this time, very small areas of necrotic lesions become visible [27]. The latent period is generally considered to be 7–10 days, although under optimal conditions, it can be as few as 2–4 days. Once formed, lesions can produce up to ~300,000 sporangia per lesion per day [27]. These sporangia create substantial risk for spread by wind and rain splash within and between susceptible potato and tomato fields.
Early blight of potato is caused by Alternaria solani and is a perennial disease concern across temperate potato-growing regions. Typically, foliar lesions and chlorosis first appear in the Northern Hemisphere in early July and persist until harvest. Lesions are initially small and dark brown in color. As disease progresses, lesions enlarge and coalesce with notable “bulls-eye” rings. Early blight can result in yield loss up to 30% annually and impacts both potato quality and storability [28,29]. In contrast to P. infestans, Alternaria solani is an asexual, necrotrophic fungus dispersed by wind and rain splash. Alternaria species are known for toxin production, which negatively impacts cell structure and facilitates pathogen invasion and establishment [30]. Because both pathogens occur almost annually in all temperate growing regions and both cause necrotic leaf symptoms, it is essential to be able to distinguish disease caused by A. solani from that caused by P. infestans because of differences in management response. Accurate early detection of these diseases could significantly reduce chemical input, and positively impact both the financial and environmental sustainability of potato production.
Pre-symptomatic disease detection using spectroscopic methods is a rapidly advancing frontier in plant pathology [18,19,31,32,33,34,35]. Symptomatic late and early blight detection has been previously established with a range of broad-band optical sensors [36,37,38,39,40,41,42,43], though none have explored pre-symptomatic detection and importantly, differentiation, using narrowband SWIR features. As well, foundational leaf-level work is needed to assess the potential for spaceborne imaging spectroscopy for disease differentiation. The goal of this study was to (1) use contact spectroscopy to pre-symptomatically detect and differentiate between early blight and late blight in potato foliage and (2) associate respective foliar spectral profiles to the underlying, differing, pathogen biology and disease physiology.

2. Materials & Methods

2.1. Plant & Pathogen Materials

Pathogen free ‘Katahdin’ potatoes were grown for four weeks from tissue culture cuttings in a pathogen-free growth chamber with a 12 h photoperiod under 24 °C daytime temperatures and 21 °C night temperatures. Data for this study were collected over a series of four experiments with the following treatments: non-pathogen-inoculated control (both Rye A agar plug inoculation and water control), late blight inoculation, early blight inoculation, and mixed late and early blight inoculation. Clonal lineage US-23 of P. infestans was used in all 4 experiments, with US-08 also used in two of the experiments.
Axenic, hyphal tip-derived P. infestans isolates were collected from naturally-infected commercial potato fields in 2017 from central Wisconsin. These samples were isolated, cleaned, and placed into long-term storage on sterilized hemp seeds [44]. This was done in order to avoid culturing the isolate more than twice prior to use in experimentation [45]. A long-term storage culture was placed onto Rye A agar plates and grown for three weeks at 18 °C to produce cultures for experimentation. All cultures were placed at room temperature for 24–48 h to induce sporulation prior to inoculation. A 5-mm agar plug was excised in areas with concentrated sporulation and inoculated, sporangia side down, onto the adaxial surface of the leaf. When used, an A. solani isolate was generated from an axenic, single conidiated culture generated from a commercial field infection in 2012. Pathogen was grown on clarified V8 agar media for two weeks under a photoperiod of 20 h light/4 h dark at 24 °C to encourage sporulation. Conidia were collected from two-week old cultures and the concentration of the conidia suspensions adjusted to 105 conidia/mL. Leaves were inoculated by spraying the conidia suspension on to the surface of leaves in a localized area consistently used across all treatments.
Phytophthora infestans infection was confirmed visually and with ELISA immunostrip assays for the genus Phytophthora (Agdia, Elkhart, IN, USA). Early blight was confirmed visually, and by microscopically confirming A. solani conidia by morphological corroboration. Twenty replicates were used per treatment. Disease was rated using a modified Horsfall-Barratt rating scale as 0–5, with 0 = no disease and 5 = severe disease for the respective pathogens at each time point a measurement was made [46,47].

2.2. Experimental Set-Up

A single walk-in growth chamber was used for all four experiments. Within the single chamber, four areas were divided into separate zones (henceforth referred to as humidity chambers) to maintain control plants without exposure to inoculum. After inoculation, plants were placed into high humidity chambers to ensure a conducive disease environment. The conditions of our study necessitated treatment isolation within a humidity chamber due to high potential for cross-contamination during measurement process, risk of inoculum spread, and need for equipment sterilization between treatments. Water control and agar control were not found to be significantly different (PERMANOVA, p-value > 0.05). We noted variable disease incidence between plug and spray inoculation for P. infestans, but equivalent severity progression (AUDPC, t-test, p-value > 0.05; Figure S1). Inoculation method was not found to have a significant effect between these data (PERMANOVA, p-value > 0.05). Therefore, plug inoculation was used for P. infestans treatments to ensure adequate disease development for study purposes.

2.3. Clearing and Staining

Tryphan blue staining was utilized to visualize and corroborate the pathogen lifecycle with our disease time assignment. Phytophthora infestans infection was monitored for four days. Samples were collected at each disease time stage: 24 h (early infection), 48 h (biotrophy), 72 h (necrotrophy), and 96 hrs (sporulation) post-inoculation. The same inoculation procedure was followed as outlined previously with ‘Russet Burbank’ plants to demonstrate the infection progression. A single leaf was inoculated per plant. At each disease time stage, plugs from a representative sample were removed and a 7-mm disc around the point of infection excised. Leaf discs were transferred to 10-mL beakers with lactophenol trypan blue (10 g phenol, 10 mL > 99% glycerol, 10 mL 85% lactic acid, 10 mL DI H2O, and 10 mg trypan blue). The beakers were then floated in a boiling water bath for 2 min, cooled to ambient room temperature, then boiled for another 2 min [48]. Leaf discs were rinsed and transferred to a 24 well plate and submerged in Visikol® (Visikol Inc., Whitehouse Station, NJ, USA) to clear for 48 h [49]. Discs were mounted in Visikol® and viewed under a Leica DMi1 inverted microscope.

2.4. Reflectance Measurements

Contact leaf reflectance was measured with two high-spectral-resolution SVC HR-1024i (350–2500 nm) field spectroradiometers (Spectra Vista Corporation, Schnectady, NY, USA). All measurements were taken from the leaf adaxial surface using a leaf-clip assembly attached to a plant probe with a halogen light source, using 99% spectralon as white reference (Labsphere, North Sutton, NH, USA). Treatments were randomized across spectrometer. Spectrometer did not have a significant effect on reflectance (PERMANOVA, p-value > 0.05). Reflectance was measured on two locally inoculated leaves per plant and averaged per leaf location. Measurements were taken directly above the inoculation zone, but not on top of the inoculation zone. Baseline measurements were taken immediately prior to inoculation, and then at 12–24 h intervals for the following 5–7 days, until necrosis progressed to the extent that leaves could no longer be measured. Between each treatment group spectrometers were sterilized to prevent inoculum transmission. At each time point images were taken with a Nikon digital camera.

2.5. Data Preparation

We utilized reflectance measurements from 400 to 2400 nm, removing noisy bands at the shortest and longest wavelengths. Data were interpolated to 1 nm resolution from the native 3–8 nm resolution of the instrument following standard practice to standardize measurements across instruments over time [7,10,19,50]. Bad measurements, such as those with low reflectance or abnormalities due to measurement error, were removed prior to data analysis [6,10,19,51]. Inoculated samples that did not achieve a disease rating of 4 for their respective diseases or greater by the end of the study period were not included. A total of 2039 individual leaf spectral measurements were used in this analysis.
Disease time was defined [21] for statistical analyses as follows: late blight inoculated samples were labelled “early infection” at time points within 24 h of inoculation, “biotrophy” during measurement time points spanning 48 h until the last time point made before disease symptoms appeared, “necrotrophy” during timepoints after which disease symptoms had become visible but before sporulation occurred, and “sporulation” when both necrosis and sporulation were visible. Early blight inoculated samples were labelled “pre-symptomatic” prior to the appearance of visible symptoms, “light” if they had a disease rating of 1–2, “medium” if they had a disease rating of 3, and “heavy” if they had a disease rating of 4–5. For discrimination, medium and heavy were combined to enable robust analysis. Disease time was defined for control plants as the approximate range of time the majority of diseased-treated plants entered into the next infection progression stage. This was done so that the interaction of treatment, pathogen, and time could be estimated, while accounting for the fact that not all inoculated individuals progressed uniformly in infection and disease severity. This allowed us to separate spectral changes caused by plant response to measurement and handling from those of interest caused by infection.

2.6. Data Analysis

All analyses were conducted in the open source, statistical computing language R. The package vegan [52] was used to conduct calculate Euclidean distance and conduct principal coordinates analysis (PCoA) to visualize broad spectral differences between infection caused by the two diseases in comparison to control using spectral reflectance. PCoA uses a dissimilarity matrix calculated using Euclidean distance to transform a large number of possibly correlated predictor variables into a smaller number of uncorrelated latent variables, or principal coordinates, reducing the dimensionality of the data.
Partial least squares discriminant analysis (PLS-DA) was employed to classify treatments using the R packages caret and pls [53,54]. PLS-DA is widely used non-parametric method to discriminate groups with independent variables with high dimensionality and collinearity, and commonly used for spectral analyses [7,10,19,50]. PLS-DA projects latent vectors through the response and predictor variables to reduce data dimensionality and maximize prediction accuracy by generating components maximally correlated to differences in class [55]. PLS approaches do not directly provide parameter uncertainties, so the analyses were permuted (100 times) by dividing observations (70:30) into training (calibration) and testing (cross-validation) sets to estimate jack-knifed uncertainty. The number of correct testing classifications across 100 permutations and the resulting kappa statistic were used to evaluate the classification accuracy. PLS-DA has a tendency to over-fit models, making internal cross-validation essential [55]. The ideal number of latent vectors was identified by iteratively running the PLS-DA models with increasing numbers of components and examining the predicted residual error sum of squares (PRESS). The number of latent vectors with the lowest PRESS across all permutations was chosen. The absolute value of averaged standardized coefficients across 100 simulations were extracted and ranked to determine important regions of the spectra for classification. PLS-DA models were fit for testing control vs. late blight, control vs. early blight, late blight vs. early blight, and late blight vs. mixed inoculation across all time points as well as within the various stages of disease development. For PLS-DA, early blight diseased samples with a rating of “medium” were added into the “heavy” dataset to increase sample size in the analyses.
Normalized difference spectral indices (NDSI, Equation (1)) were generated for all possible combinations of wavelengths to identify regions of the spectrum most correlated (Pearson correlation) with a difference between healthy and infected classes. NDSIs were calculated across all disease times as well as within each stage. A 0/1 status indicator variable was correlated with each normalized index (~4 million combinations) using Pearson’s correlation and plotted in a wavelength-vs-wavelength NDSI heat map to illustrate the areas with the greatest difference between infected and non-infected treatments. This can be interpreted as the wavelengths showing the most change with infection status and enables visualization of spectral shifts over the course of disease development relative to treatment. NDSIs were calculated for control vs. late blight, control vs. early blight, late blight vs. early blight, and late blight vs. mixed inoculation across all time points as well as within the various stages of disease development. The top 300 NDSIs that correlated most strongly with treatment status for each of these combinations of control vs. late blight and control vs. early blight were tabulated to identify the wavelengths most frequently associated with discrimination between treatments. Wavelength relative frequency by pathotype and developmental stage was plotted to visualize how disease progression affected reflectance.
N D S I = ( r e f l e c t a n c e ( w a v e l e n g t h i ) r e f l e c t a n c e ( w a v e l e n g t h j ) ) ( r e f l e c t a n c e ( w a v e l e n g t h i ) + r e f l e c t a n c e ( w a v e l e n g t h j ) )
Foliar nitrogen, total phenolics, sugar, starch, and leaf mass/area (LMA) were estimated from spectra using partial least squares regression (PLS-R) calibrations from Chlus et al. (submitted). PLS-R is a commonly used and well-established technique for estimating foliar chemistry from reflectance spectroscopy measurements [4,5,6,7,9,10,12]. Because these models were not specifically validated in our study, they must be considered as trait indices rather than true trait quantities, but yield important insights into the underlying physiological and biochemical drivers of spectral response nonetheless. Full PLS-R models and respective model evaluations can be found under the University of Wisconsin-Madison Environmental Spectroscopy (UW-ENSPEC) profile on EcoSML.org, an open-source repository of spectral mapping functions. LMA is an indicator of leaf dry-mass investment and relates to light interception and leaf longevity [56,57]. The normalized differential water index (NDWI) was calculated using the relative difference in reflectance at wavelengths 857 nm and 1241 nm as an estimate of leaf water concentration [58]. These non-destructively derived indices were chosen to compare across diseased leaves to better understand how disease physiology relates to spectral differences. A two-way, repeated measures ANOVA was fit using a mixed effect model with maximum likelihood estimation method for each of the non-destructively sensed metrics with the R package nlme [59]. The R package emmeans was used to calculate interaction effects for treatment across time [60]. Treatment was fit as a fixed effect and disease time and sample identifier as random effects to account for the repeated measures nature of the experiment.

3. Results

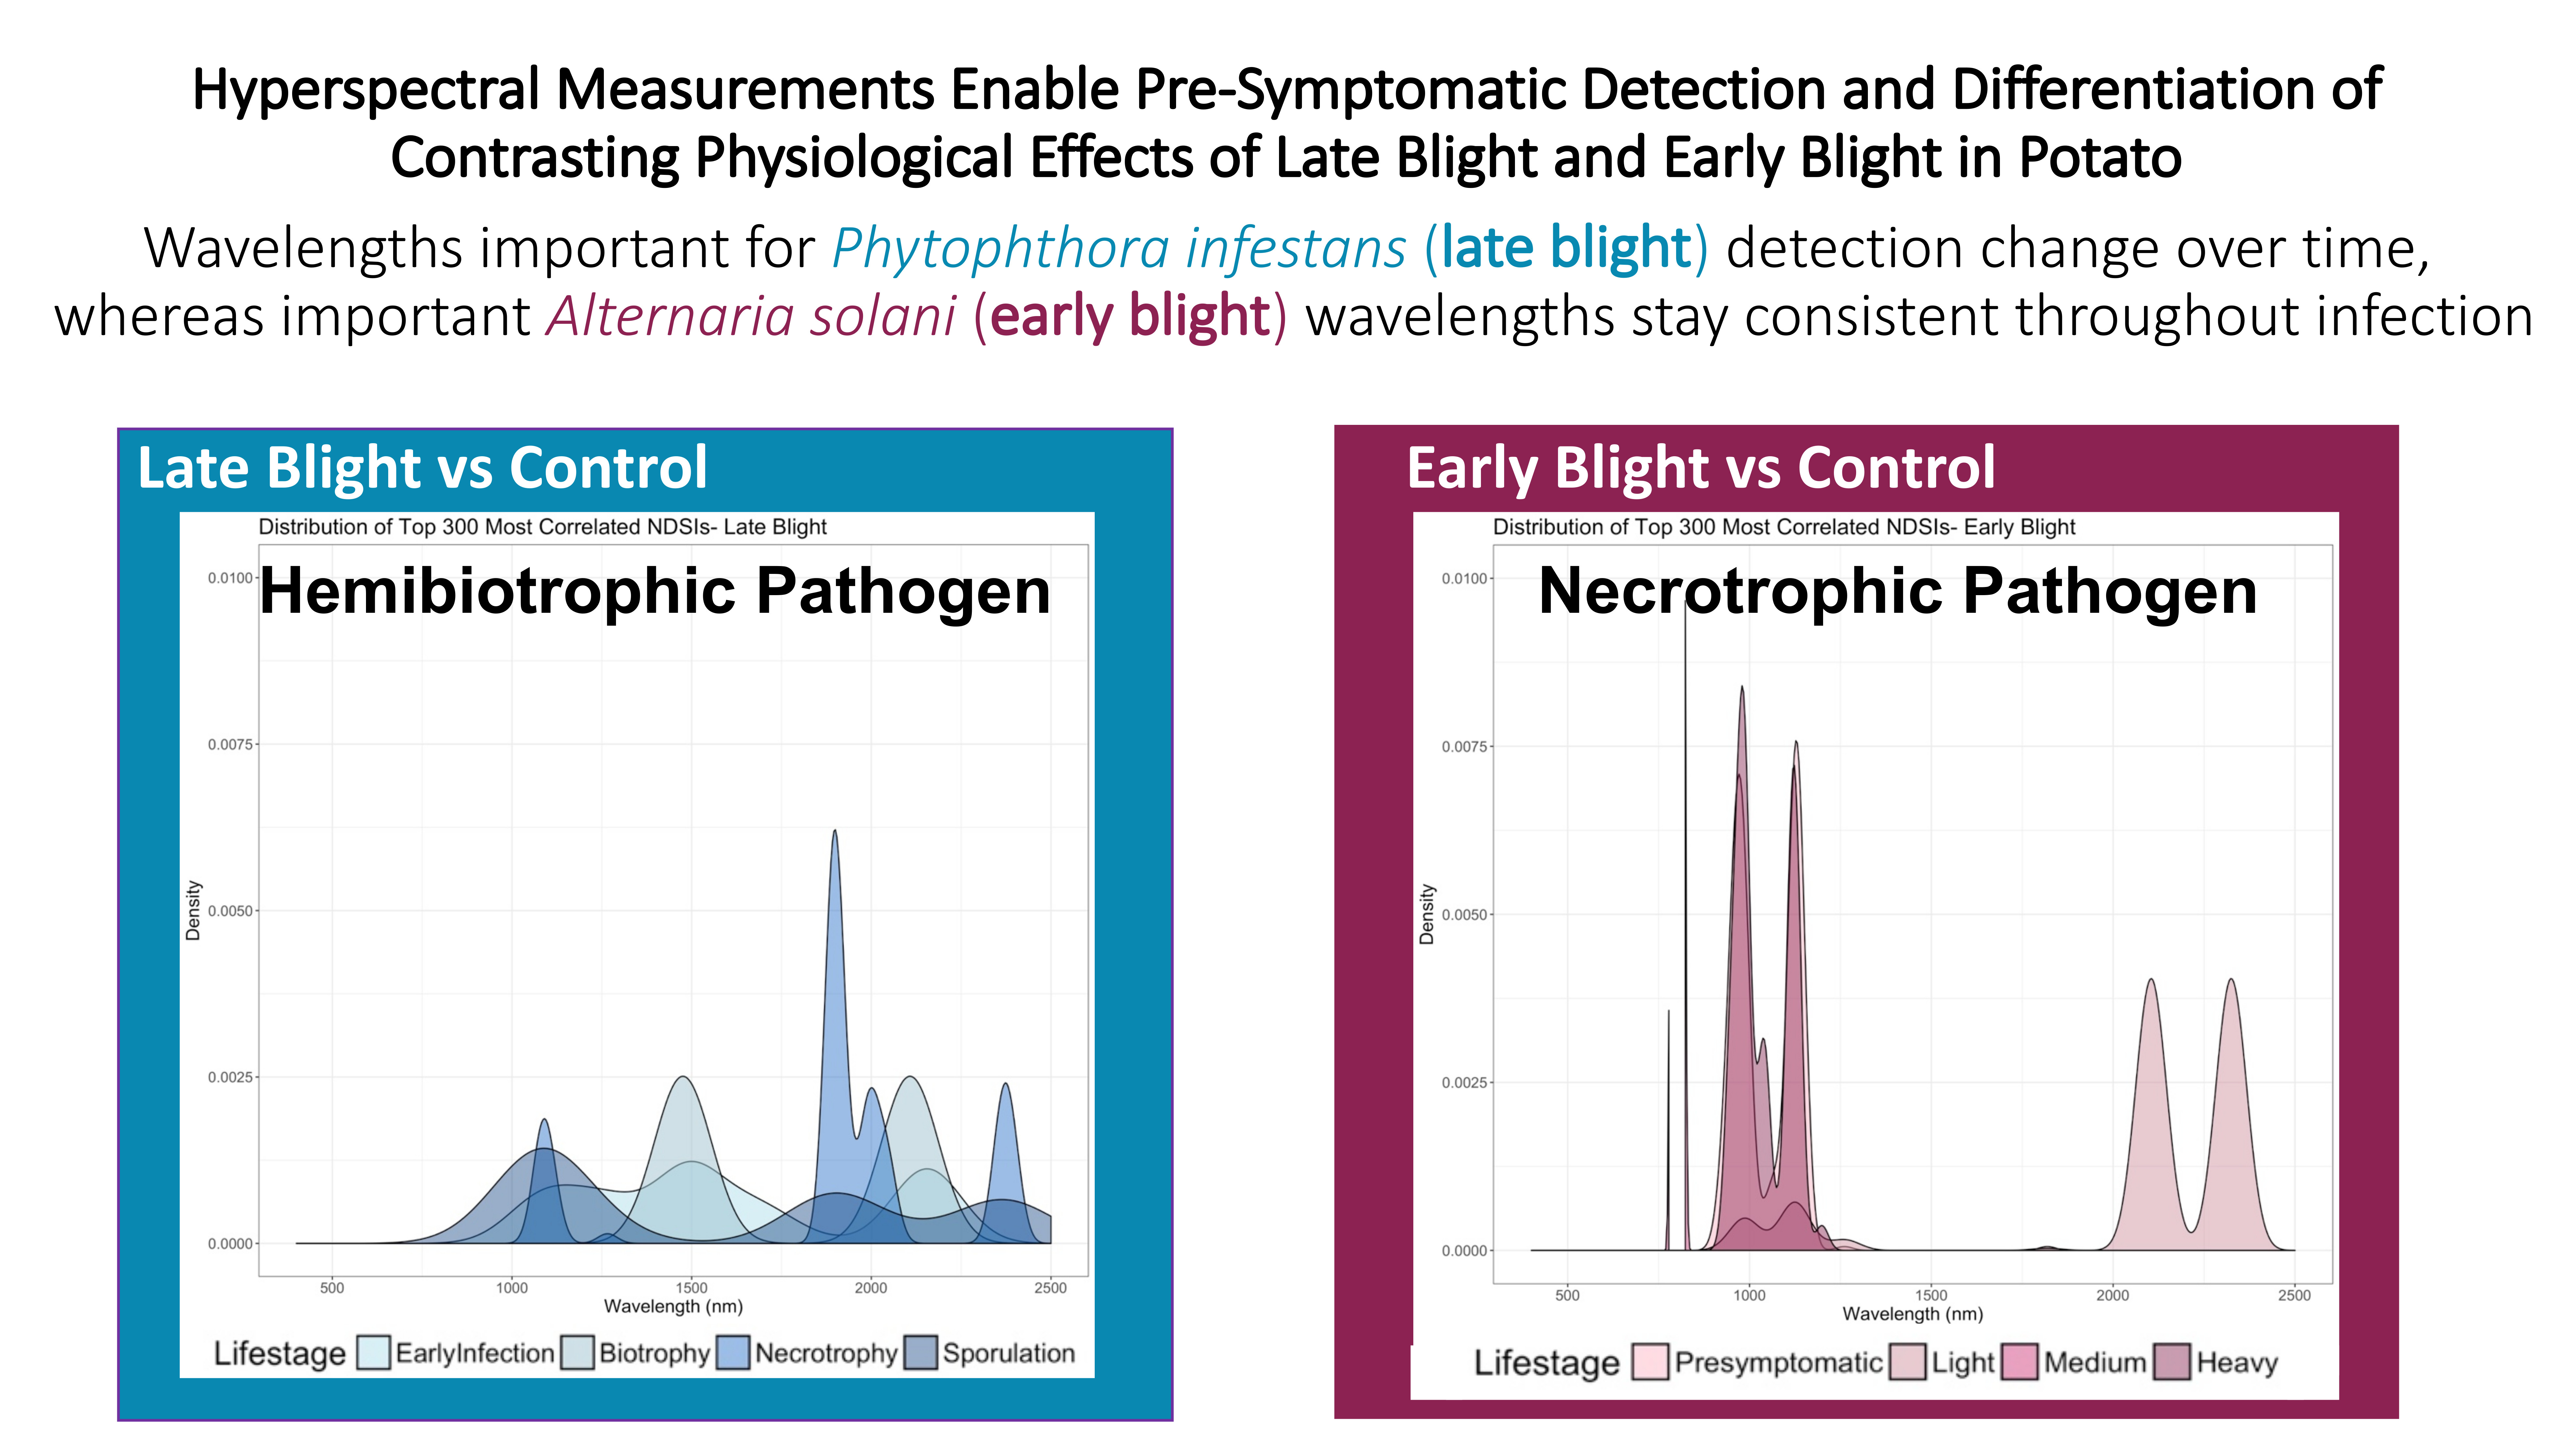
3.1. Phytophthora infestans Life Cycle Can Be Accurately Characterized with our Disease Time Rating Scale

During early infection, there were no visible signs or symptoms at the macroscopic level (Figure 1A). At 100× magnification, the inoculation hyphael mass was clearly visible on the leaf surface during early infection (Figure 1E). At this stage there was no evidence of hyphae penetrating past the cuticle, but at 200× magnification sporangial germination was observed with the germ tube extending toward stomata (Figure 1I). During biotrophy, a very small area of clear water soaking could sometimes be seen directly underneath the inoculation plug, but necrosis was never present (Figure 1B). At 200× magnification hyphae were observed extending along the leaf surface and entering the leaf through stomata (Figure 1F). Hyphae were observed growing in the intercellular space of epidermal cells, and the first evidence of haustorial formation (Figure 1J). During necrotrophy, lesion development began (Figure 1C). At this disease time point, the number of intercellular hyphae increased, haustoria were common, and aerial hyphae were observed emerging from stomata (Figure 1G,K). During sporulation, water soaking, necrotic lesion development, and sporulation were all clearly visible at the macroscopic level (Figure 1D). Extensive aerial hyphae and sporangia production were observed (Figure 1H). Aerial hyphae were easily traced back to the stomata from which they emerged (Figure 1L). Dense hyphae and sporangia made it difficult to observe intercellular activity. We concluded from this assessment that binning by disease development was appropriate due to the alignment of our rating scale with pathogen life cycle and would allow us to account for individual plant disease development.

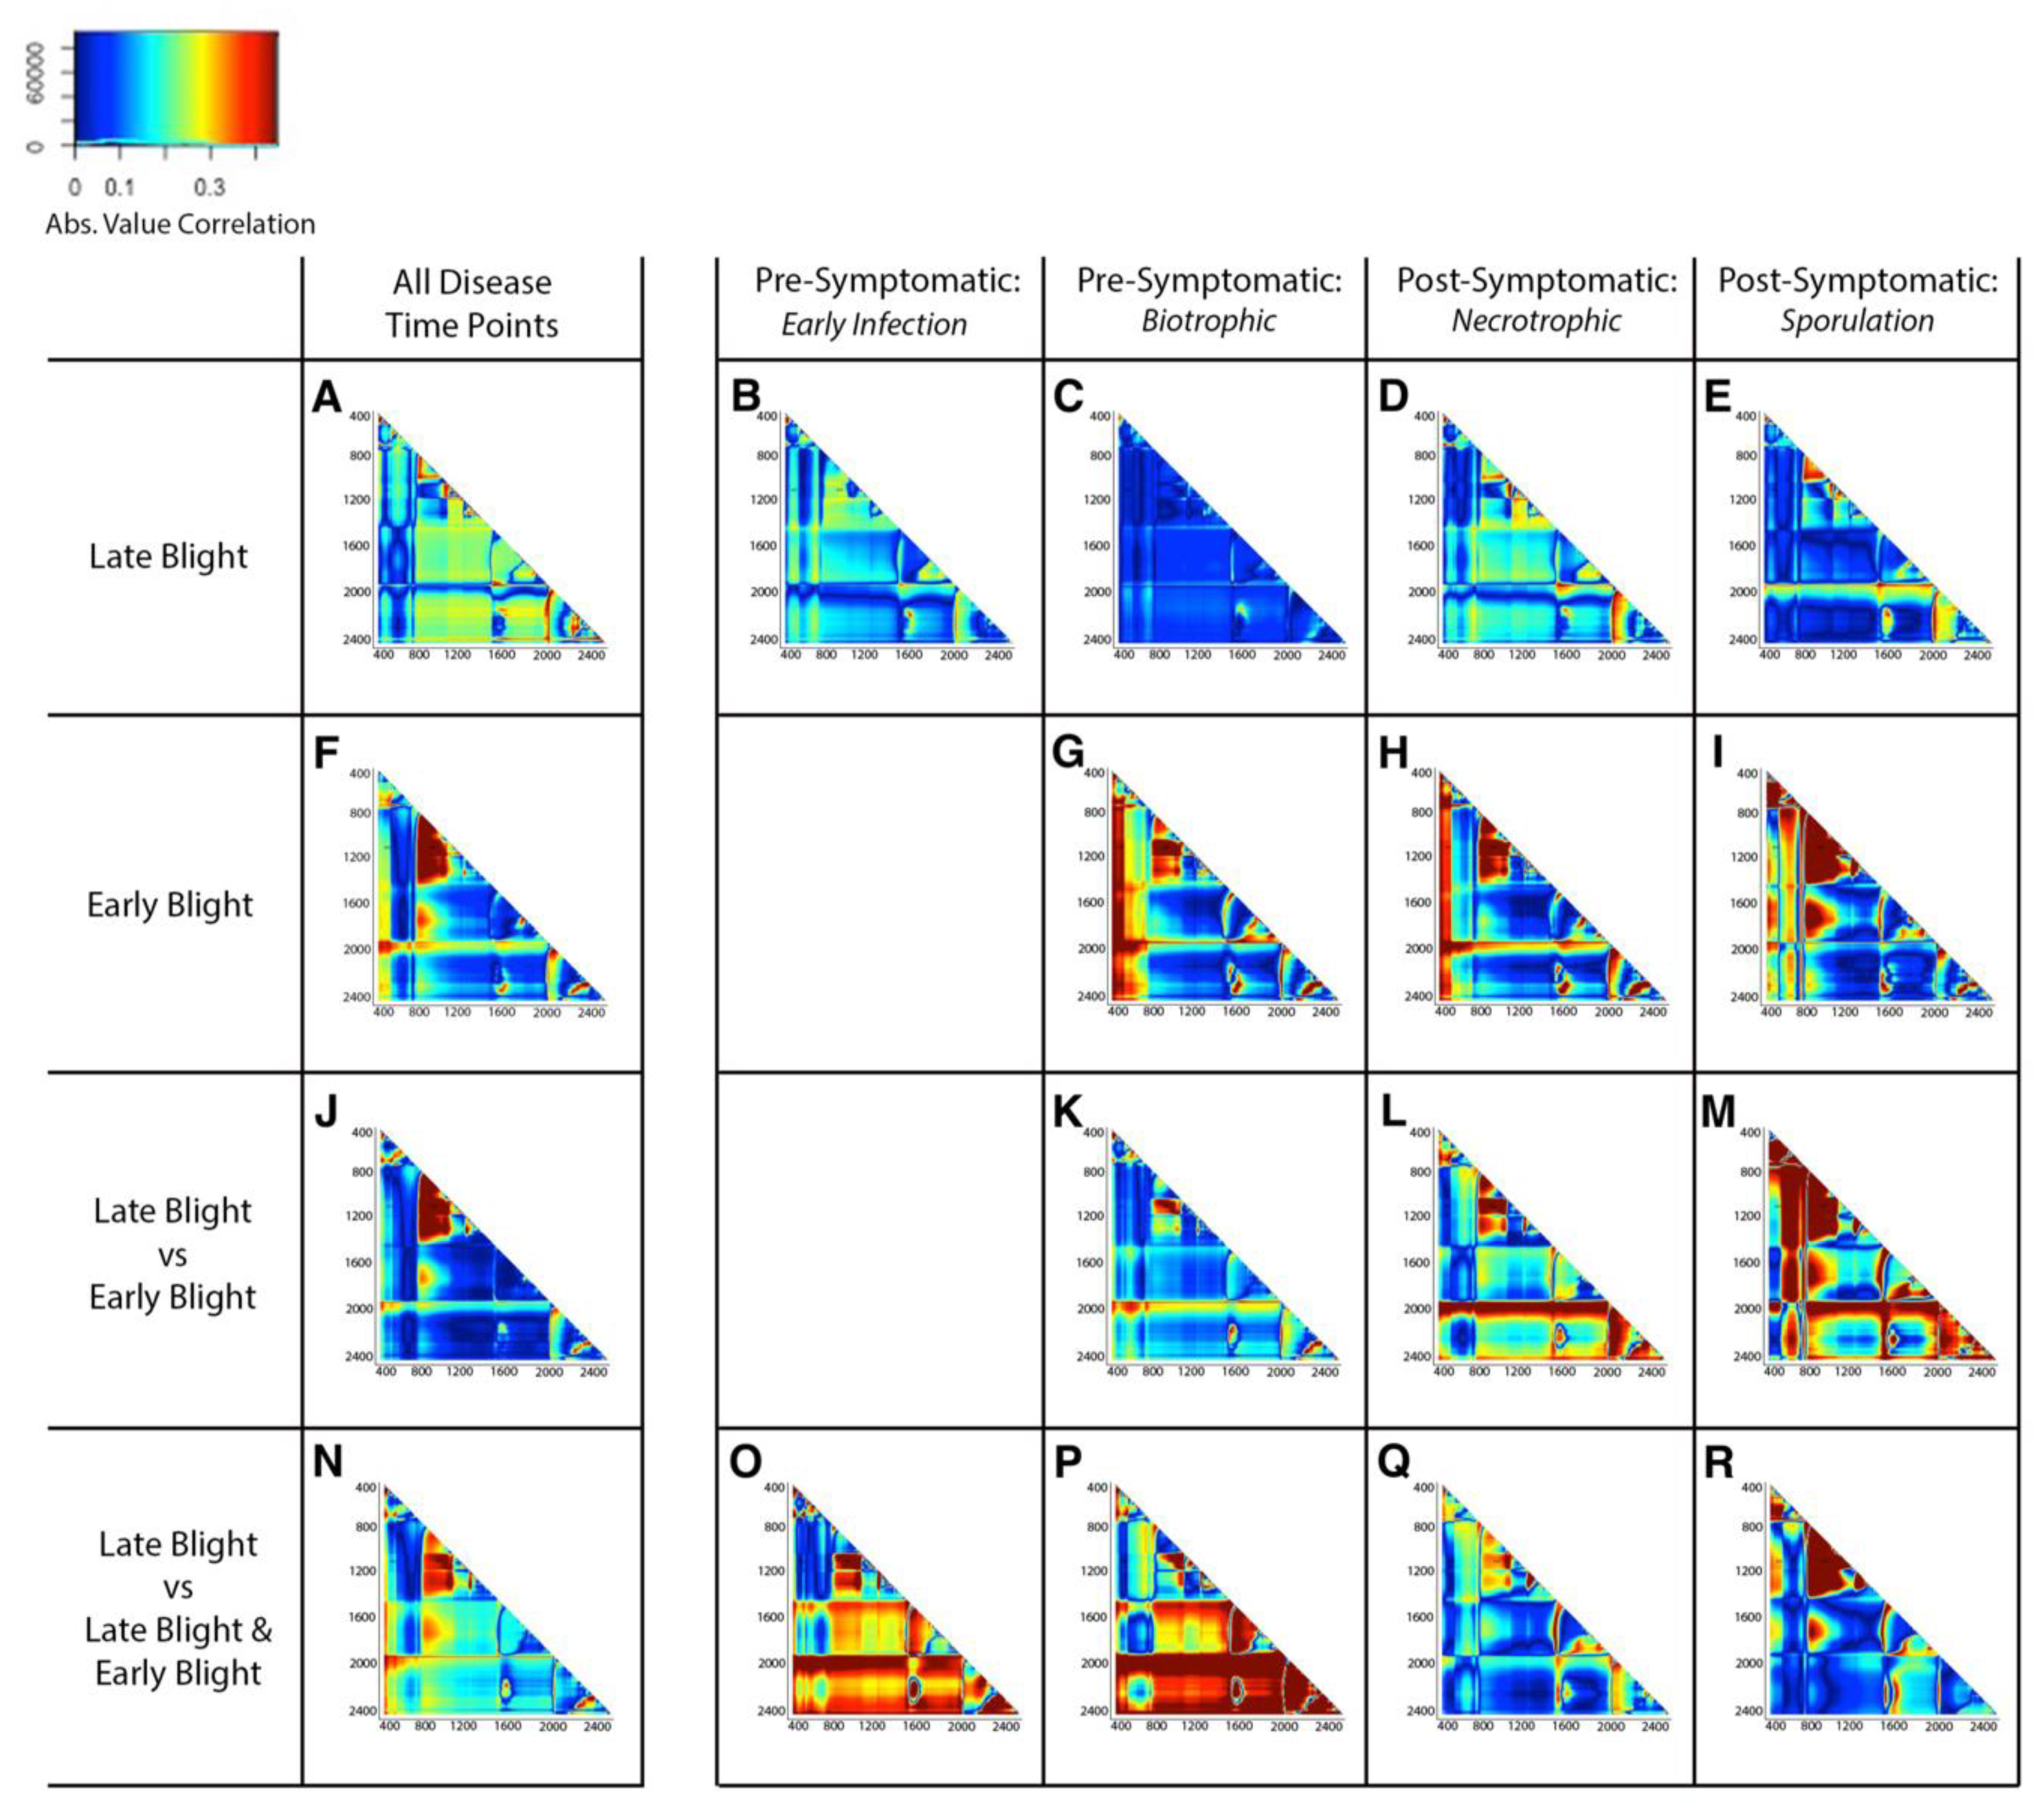
3.2. Disease Effects of Phytophthora infestans and Alternaria solani Can Be Detected and Differentiated across All Time Points Using Spectroscopy

Principle coordinate analysis (PCoA) revealed that healthy control, P. infestans, and A. solani-infected samples showed unique spectral responses, with spectral separability at all disease time stages. Differences between infected and control plant spectra increased as both diseases progressed. Phytophthora. infestans- and A. solani- infected leaves became more different from each other, and from the control plants as disease time progressed (Figure 2). Of note, late blight reflectance appears to deviate more from the control during early infection compared to biotrophy, while necrotrophy and sporulation showed greater deviation than both. We suspect this may be due to either higher variability in the data due to the wider range of time biotrophy encompasses, or perhaps due to the increase in effector expression during this disease time stage to downregulate plant defense responses. Healthy and diseased leaf spectral reflectance differed in the NIR and SWIR regions when averaged across all time points in the study (Figure S2). There were no significant differences in the visible region spectra for P. infestans infected leaves (Figure S2A).
PLS-DA accurately characterized P. infestans infection across the study period with an average cross-validation kappa of 0.77 (Table 1) and A. solani infection with an average cross-validation kappa of 0.90 (Table 2). The top 1% of standardized coefficients in the P. infestans PLS-DA model included NIR narrow bands in the red edge (~700 nm) and around 970 nm. These regions are known to be associated with declining plant health and leaf water concentration. The importance of SWIR narrow bands around 1380 nm and 1890 nm indicate a likely relationship between changing leaf water concentration and infection [3]. Both the P. infestans and A. solani PLS-DA models built for all disease time points performed well when applied to all stages of respective infection. Cross-validation kappas ranged from 0.71–0.86 for P. infestans and 0.90–0.98 for A. solani. This indicates that P. infestans and A. solani infection could be broadly and accurately detected regardless of stage of infection progression, and that infection has a consistent impact on leaf health, biochemistry, and physiology that can be non-destructively sensed (Table 1 and Table 2, Figures S3–S5). The top 100 most important wavelengths for discrimination between healthy and diseased for P. infestans, ranked by absolute value of the standardized coefficient, include regions in the 2300 nm range known to be associated with chemical changes, 1100 nm, and in visible wavelengths (Figures S2A and S3).
The PLS-DA model built for P. infestans and A. solani infection differentiation across all time points had an average cross-validation kappa of 0.83 and total accuracy of 91.8%. This indicates that respectively diseased leaves can be distinguished regardless of stage of disease progression (Table 3). The top 1% of standardized coefficients in the PLS-DA model included wavelengths at the red edge (~690 nm), ~1000 nm, and ~1890 nm. The PLS-DA model (12 components) built for P. infestans and mixed P. infestans and A. solani infections (“mixed”) differentiation across all time points had an average cross-validation kappa of 0.89 and total accuracy of 94.4%. Phytophthora infestans infection could be accurately differentiated from mixed infection regardless of disease progression (Figure S6). The top 1% of standardized coefficients in the PLS-DA model included wavelengths at the red edge (~690 nm) and ~1890 nm (Figures S2D and S6).
Changes in infrared wavelengths were associated with all three treatments and were important for differentiation between control, late blight, and early blight. Averaged across all time points, NDSIs in the narrowband regions of both the NIR and SWIR showed the strongest correlations with P. infestans infection status compared to healthy plants (Figure 3A). NDSIs utilizing the NIR and ~2000 nm reflectance discriminated A. solani infection from healthy plants (Figure 3F). These wavelengths were not important for P. infestans NDSI differentiation from healthy spectra (Figure 3A). NDSIs of NIR-vs-NIR wavelengths were most highly correlated with differences between late and early blight diseased leaves across all time points. Specific narrowband regions of the VIS and SWIR also showed high correlation with pathogen identity (Figure 3J). Similar narrowband regions of the NIR and SWIR were important for differentiation between late blight diseased and mixed diseased leaves as between late blight vs. early blight. Significant interactions of VIS wavelengths with the ~1900 nm region were more correlated with a change in treatment across all time points here than when differentiating the two diseases (Figure 3N).

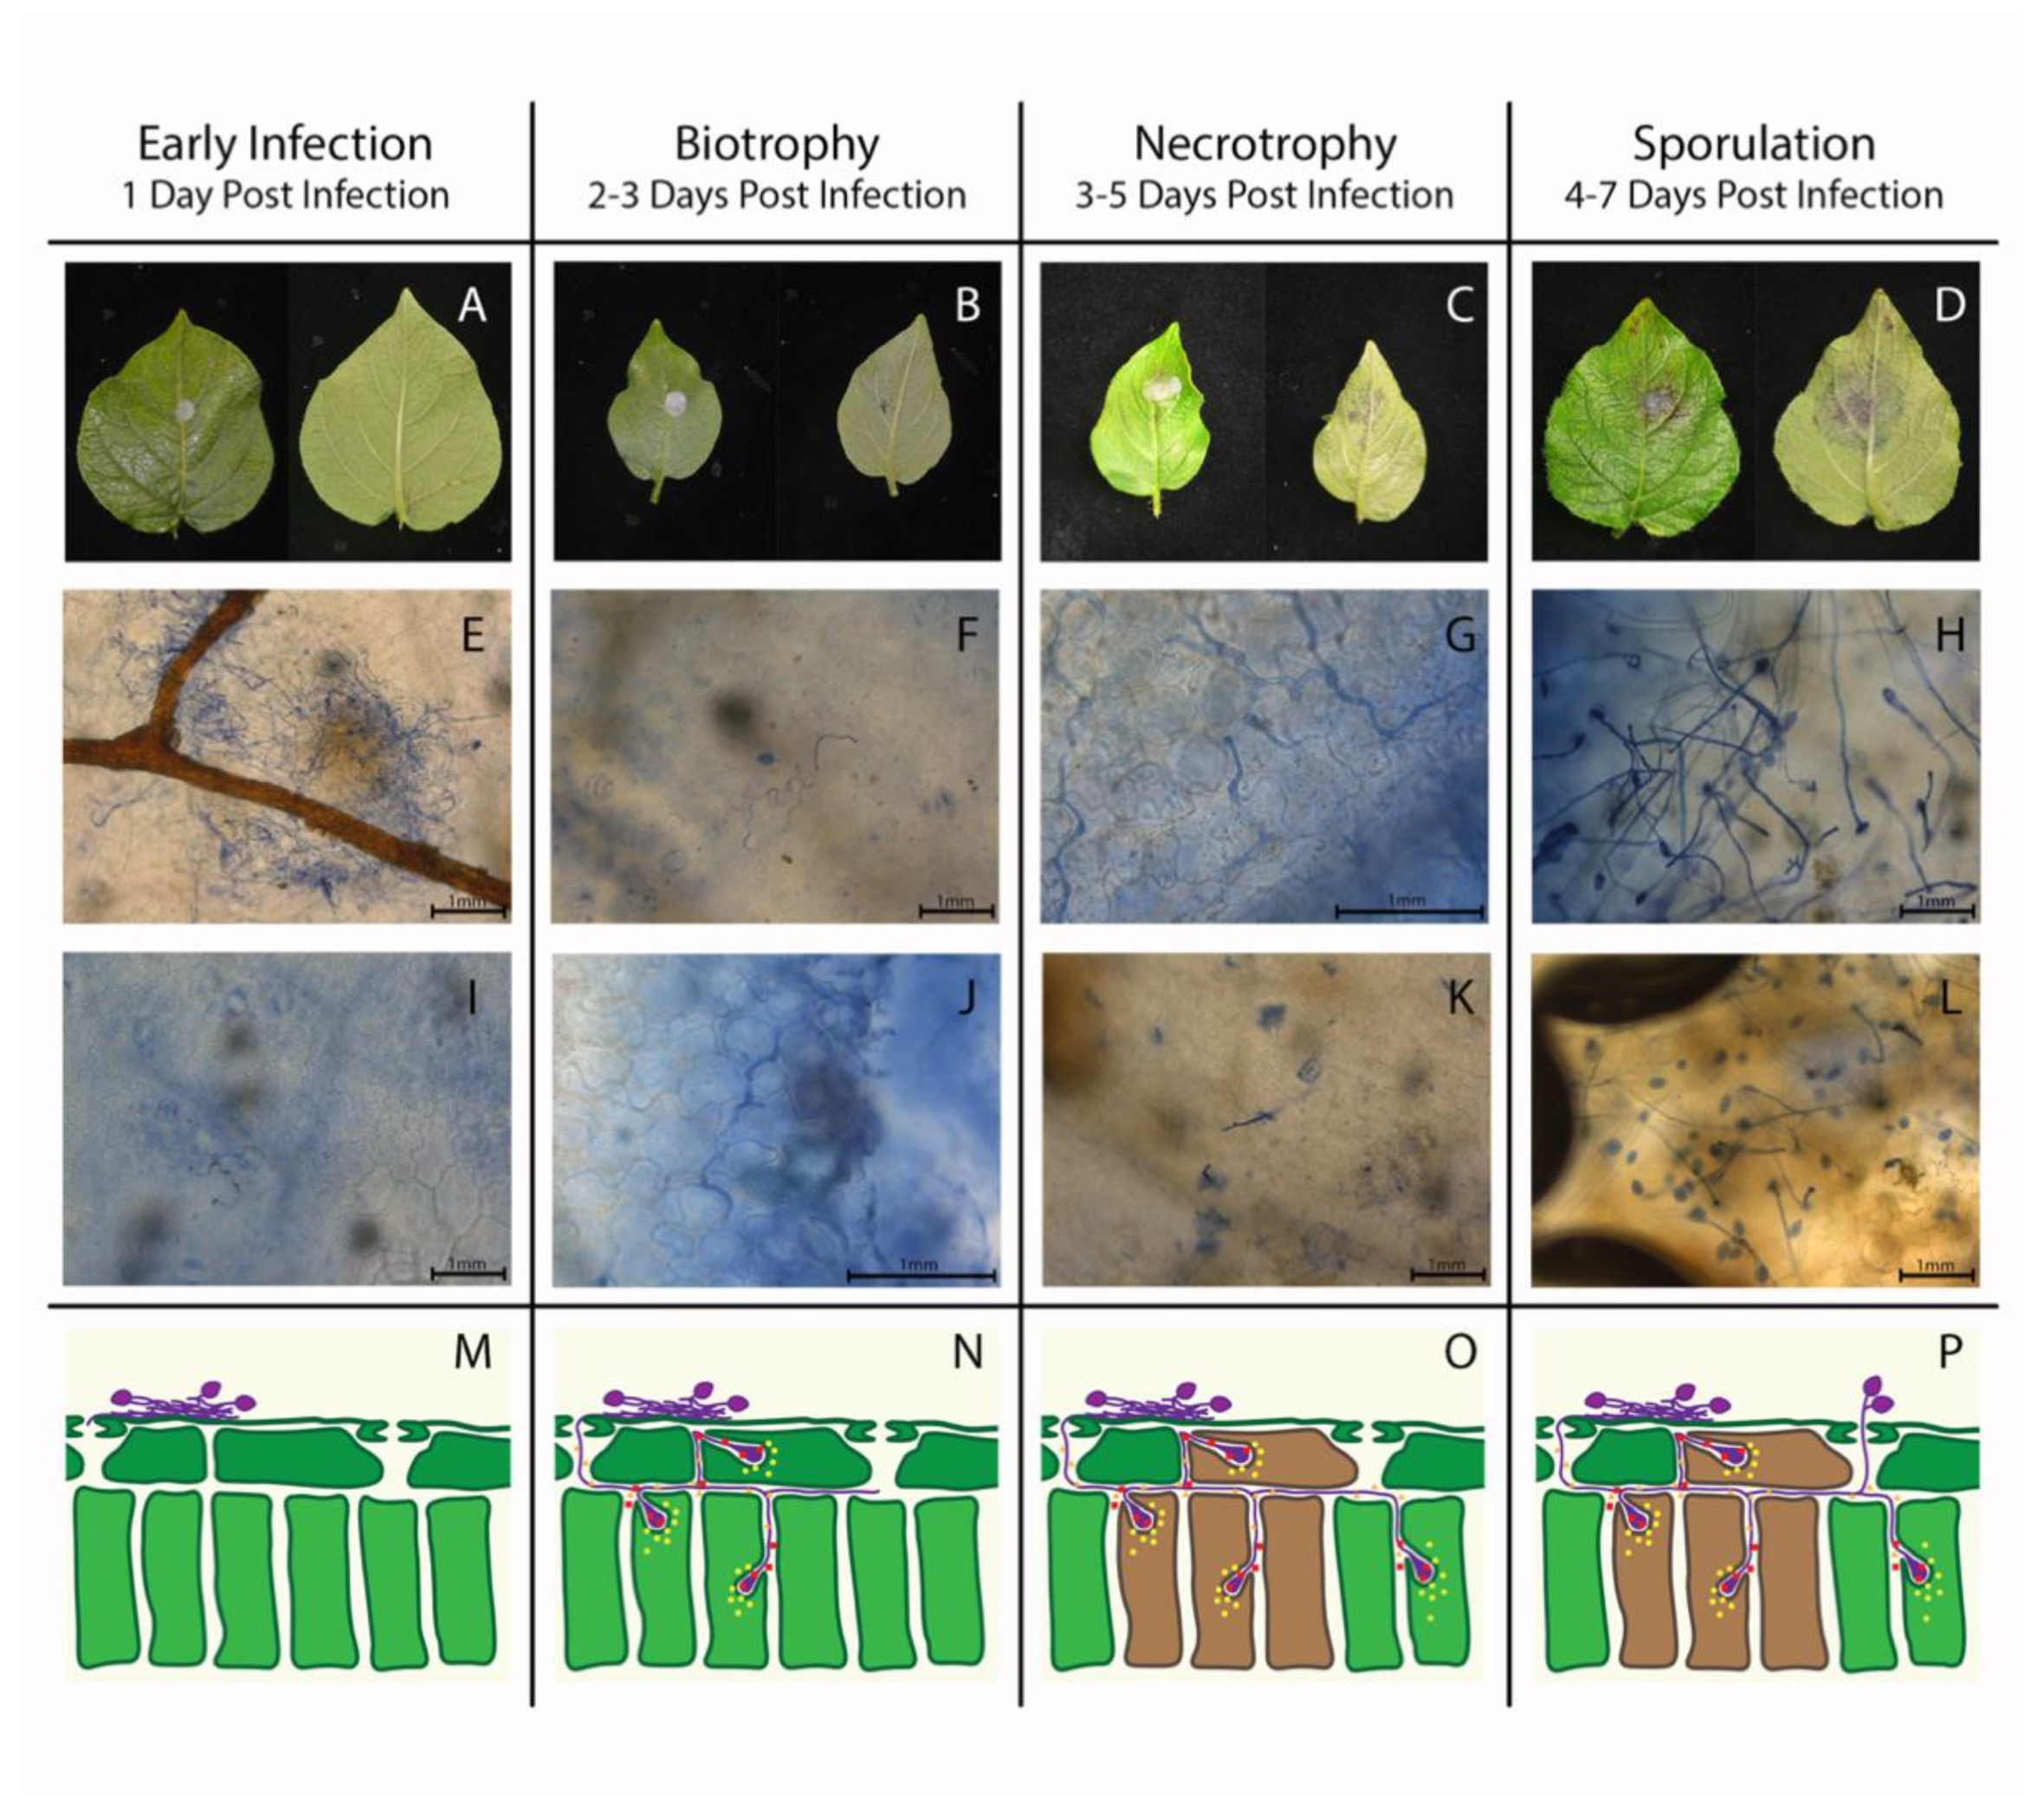
3.3. Plant Response to P. Infestans, A. solani, and Co-Inoculations Can Be Differentiated from Healthy Leaves Prior to Symptom Development with Spectroscopy

Phytophthora infestans infected leaves could be both accurately detected and differentiated from healthy leaves at all stages of infection progression with average cross-validation kappas greater than 0.6 (Table 1). Infected leaves could be detected pre-symptomatically during early infection (24 hpi) and biotrophy (36–72 hpi), with average cross-validation kappa statistics of 0.87 and 0.81, respectively. PLS-DA models for early infection indicated that wavelengths around 1000 nm, related to leaf internal structure, and ~2400 nm, related to chemical changes, were the most important for detection (Figure S2A). PLS-DA models for biotrophy indicated that wavelengths around ~1000 nm and the two SWIR leaf water absorption features (~100 nm areas around 1400 and 1900 nm) were important for detection (Figure S2B). Early infection PLS-DA model performance ranged from poor to moderately good when applied to data from other infection stages, with average cross-validation kappas ranging from 0.38–0.61 (Table 1). The PLS-DA model built for biotrophy performed poorly when applied to data from other infection stages, with average cross-validation kappa values ranging from 0.04 to 0.21 (Table 1). At 24 h post inoculation (early infection), NDSIs across wide swaths of the spectrum strongly differentiated between healthy and diseased plants. Narrowband interactions of the SWIR were the most different between stages (Figure 3B). In contrast, as infection progressed to biotrophic growth, only specific narrowband regions showed significant discrimination between healthy and diseased plants, with NDSIs from the two water features being the most highly correlated (Figure 3C).
Alternaria solani infected leaves could be accurately detected and differentiated from healthy leaves at all stages of disease progression with kappa values greater than 0.9 (Table 2). Infected leaves could be detected pre-symptomatically with an average cross-validation kappa of 0.936 (Table 2). The top 1% of standardized coefficients included NIR narrow bands around 990 nm and 1150 nm, as well as SWIR narrow bands ~1380 nm and 1890 nm. These wavelengths are associated with leaf water and starch content and were strongly associated with infection (Figures S2B and S4). NDSIs including the VIS in combination with all other spectral regions showed a high degree of change between pre-symptomatic and healthy plants. Specific narrowband interactions of the SWIR and broad impacts across the NIR also differentiated healthy and A. solani infected leaves (Figure 3G).
Phytophthora infestans and A. solani infected leaves could be differentiated pre-symptomatically from each other with satisfactory accuracy. Pre-symptomatic A. solani infection could be differentiated from pre-symptomatic (early infection and biotrophy) P. infestans infection with an average cross-validation kappa of 0.78 and total accuracy of 91.3% (Table 3). The top 1% of standardized coefficients included VIS, NIR, and SWIR narrow bands, potentially pointing to differences in chlorophyll absorption and leaf water. NDSIs utilizing the VIS and NIR correlated with late blight vs. early blight diseased leaves, as well as NDSIs across all regions of the spectra anchored by SWIR water bands. Narrow band NDSIs in the SWIR also correlated with leaf disease type (Figure 3K). This indicates an underlying difference in diseased leaf biochemistry and physiology between the two pathogens. Phytophthora infestans and mixed infected leaves could be differentiated from each other pre-symptomatically with an average cross-validation kappa of 0.78 and total accuracy of 91.3% (Table 3).

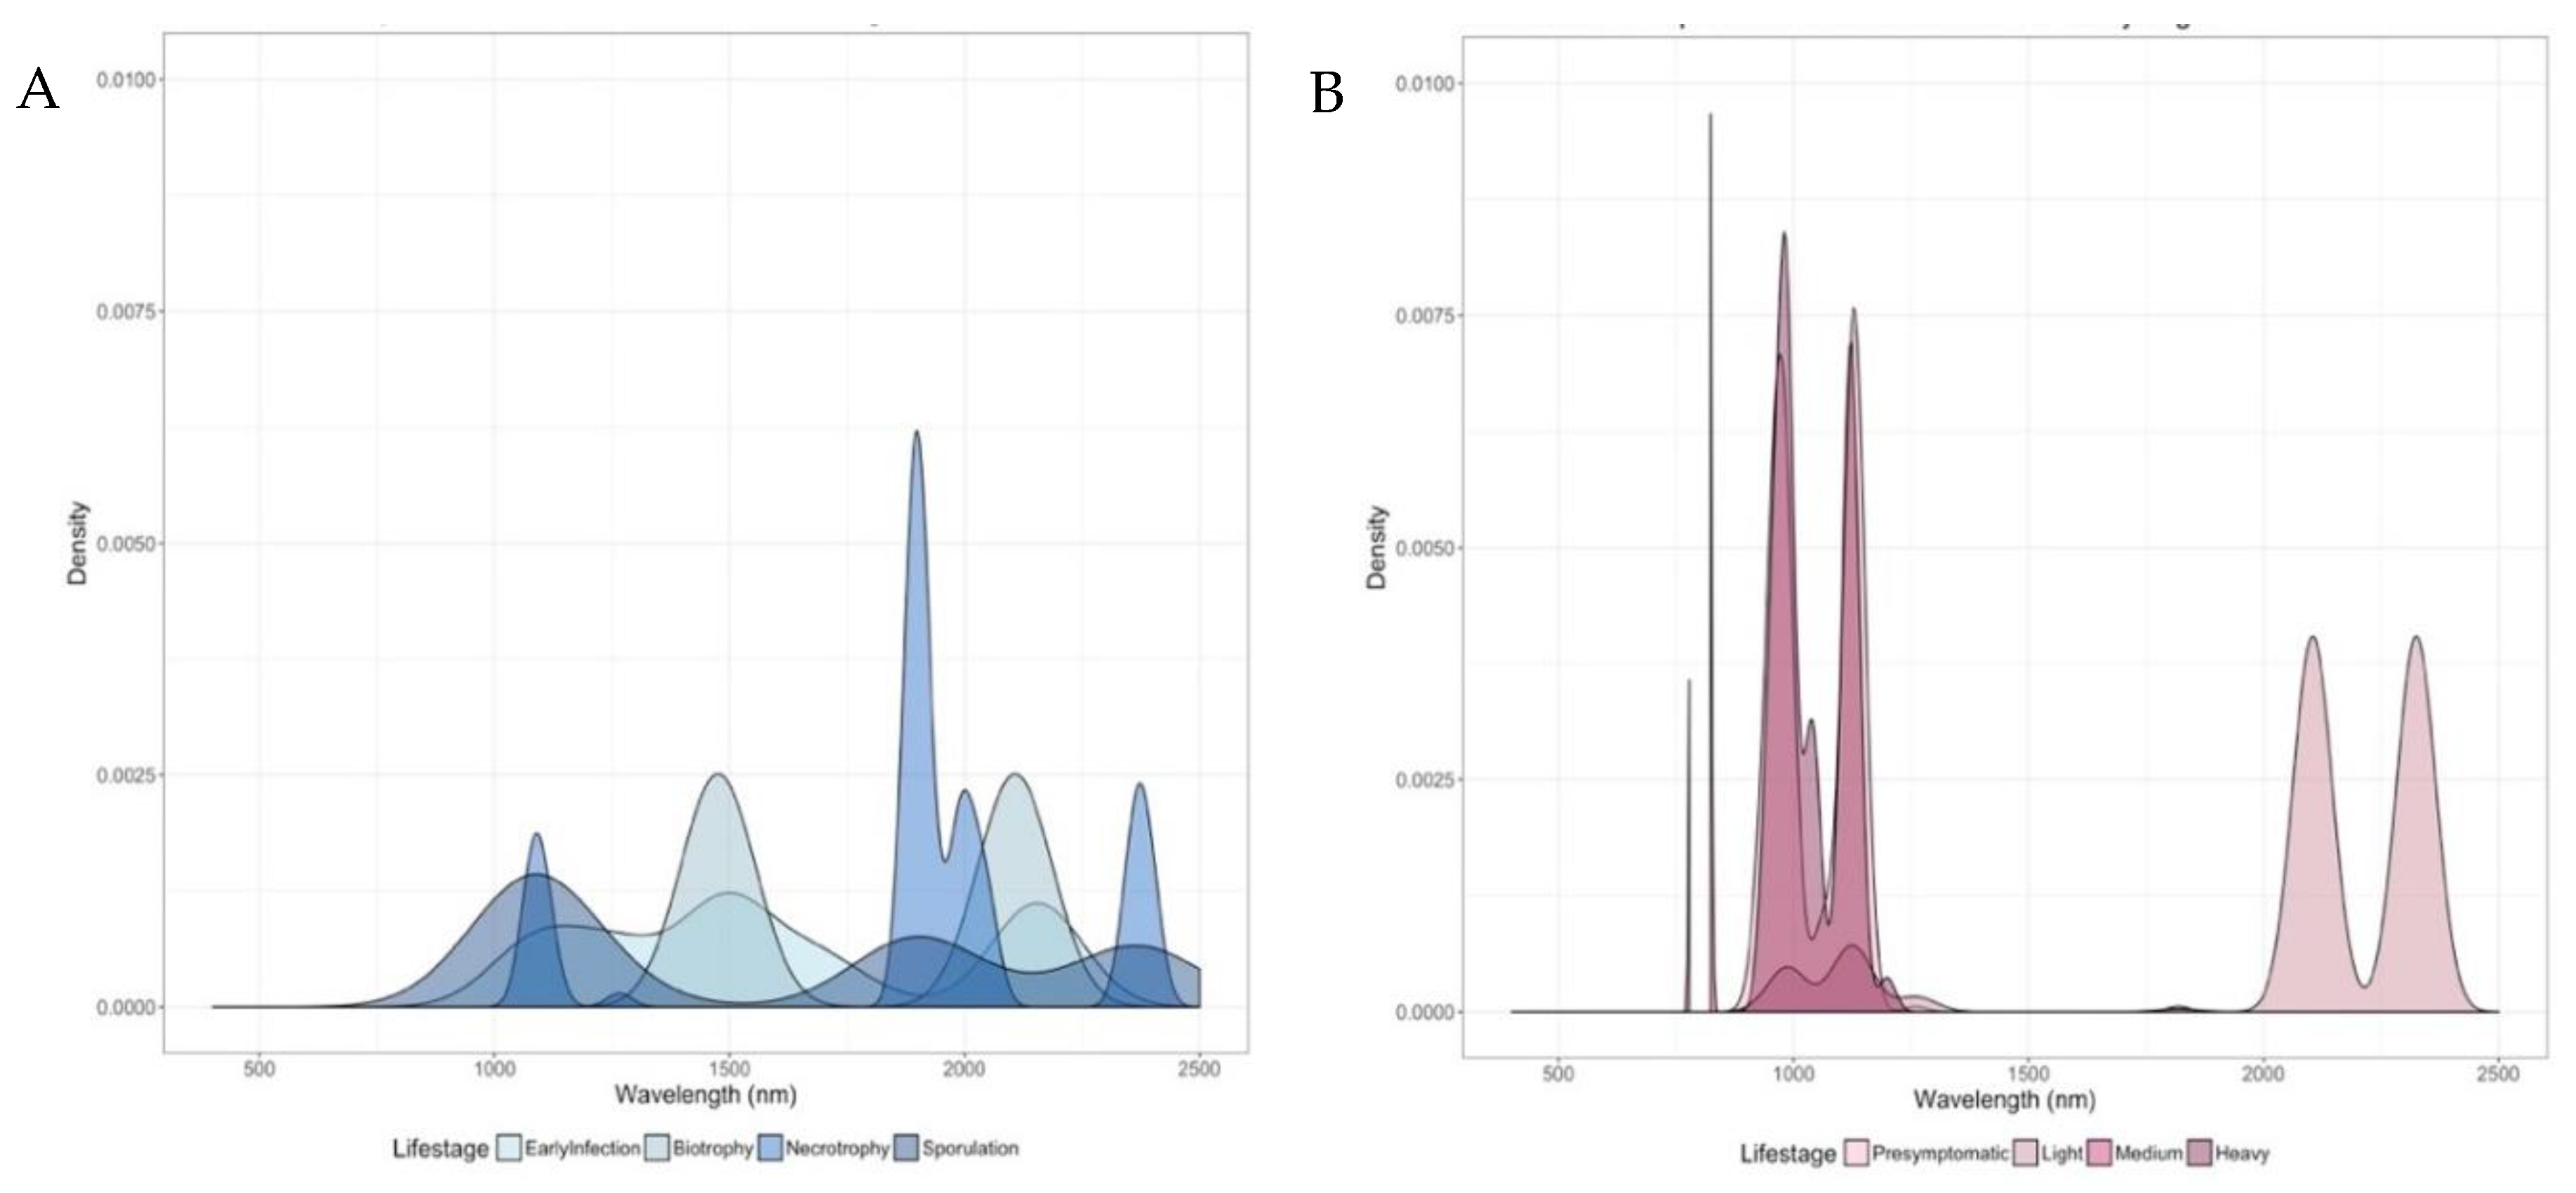
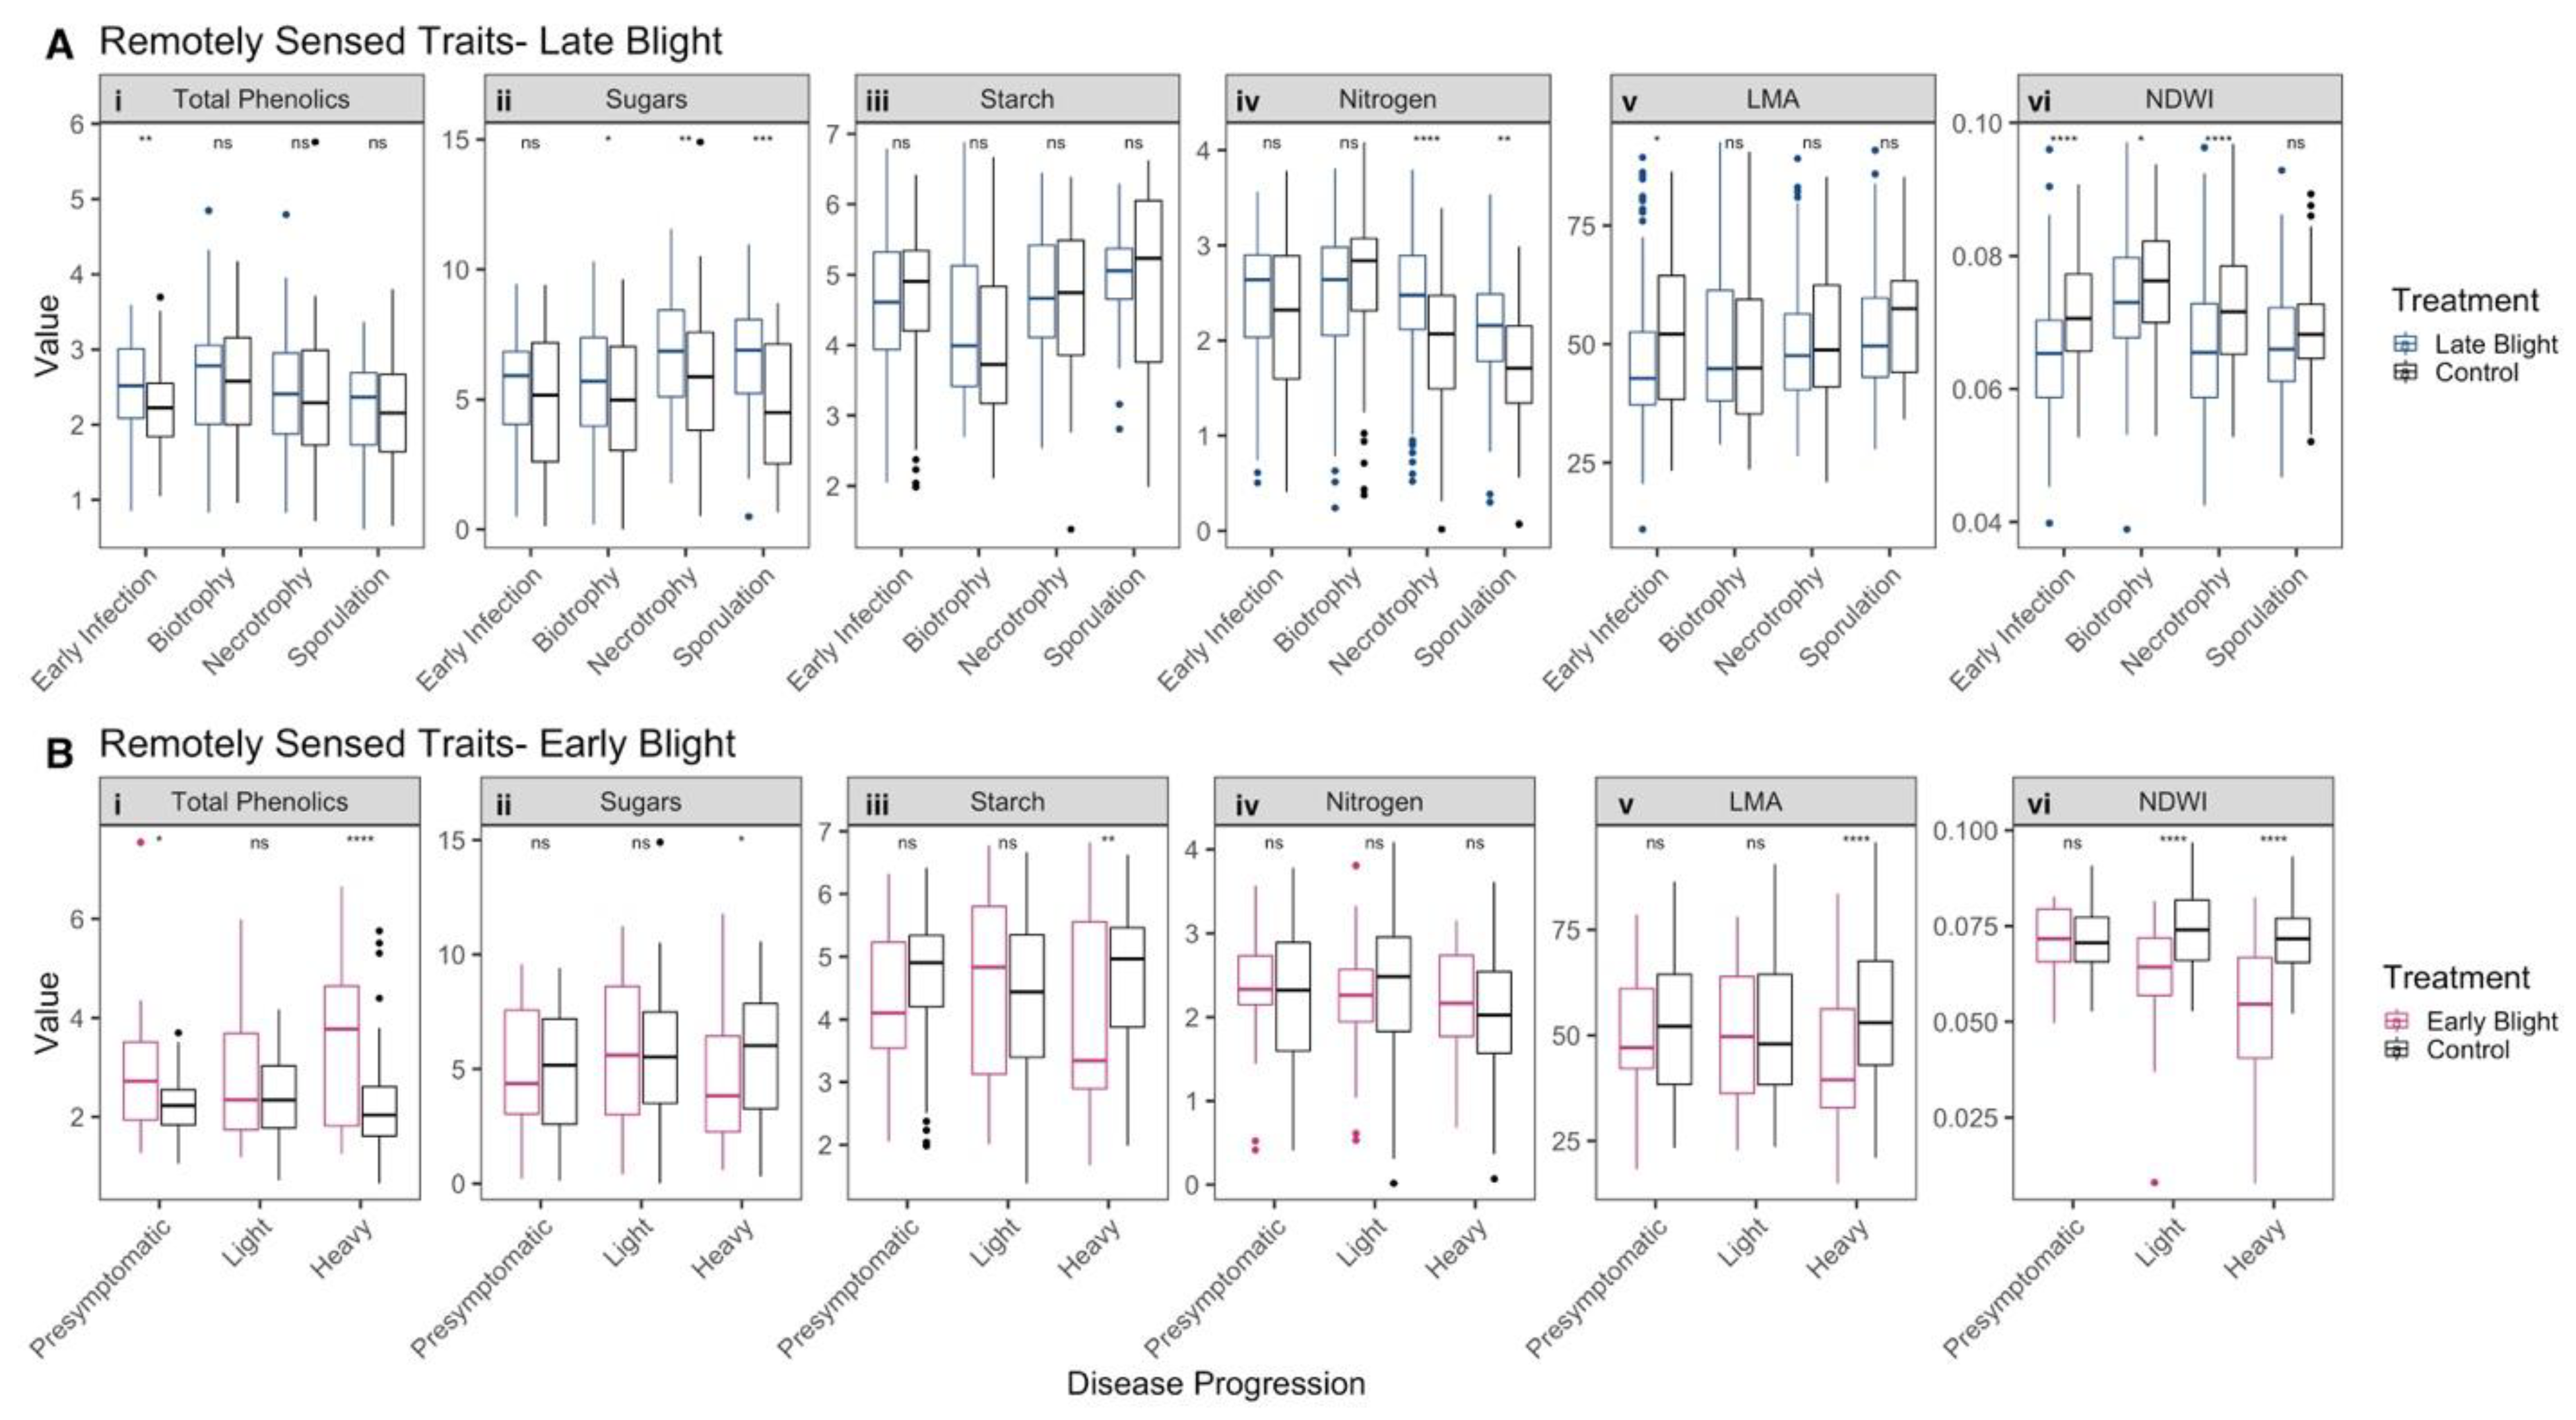
3.4. Spectral Profiles of Infected Leaves Corroborate Pathogen Biology

PLS-DA models were cross-tested against data from all other life stages and disease progression stages to relate leaf spectral profiles to underlying P. infestans and A. solani biology. Generally, P. infestans models performed best when applied to the life stage for which they had been built (Table 1). The early infection PLS-DA model, kappa = 0.87, performed fairly well when cross-validated on data from all time points (kappa = 0.61) and biotrophy (kappa = 0.56), but less well when applied individually to the symptomatic disease time stages of necrotrophy (kappa = 0.42) and sporulation (kappa = 0.38). The PLS-DA model built for biotrophic growth performed very well on biotrophic data (kappa = 0.81), but very poorly when applied to all time points, early infection, necrotrophy, and sporulation (kappa range 0.04–0.21). The necrotrophy PLS-DA model performed less well when applied to data from all time points (kappa = 0.45), early infection (0.48), and moderately well when applied to sporulation (0.60). This model performed poorly when applied to biotrophic growth data (0.29). The model built for sporulation performed best when applied to necrotrophic data (0.73) and performed well when applied to sporulation data (0.64). This model performed moderately well when applied to data from all time points (0.54) but poorly when applied to the pre-symptomatic disease time stages of early infection (0.44) and biotrophy (0.41). In contrast, the PLS-DA model built for pre-symptomatic A. solani detection performed extremely well when applied to later stages of early blight disease progression with light and heavy cross-validation kappa values of 0.96 and 0.85 respectively (Table 2).
Visual examination of NDSIs show that important spectral regions for late blight detection shift and intensify in importance as infection progresses (Figure 3B–E), whereas important regions for early blight detection generally intensify within spectral regions already important at early stages (Figure 3G–I), which is why the pre-symptomatic models perform well on later stage data. Wavelengths used to make the top 300 most correlated NDSI across respective infections come from shifting regions of the NIR and SWIR as P. infestans progresses through its life stages (Figure 4A). During early infection, wavelengths in the NIR and a centralized peak around 2200 nm related most strongly to detection. During biotrophic growth, the most strongly related wavelengths occurred in two distinct peaks, the first centered around 1500 nm and the second around 2100 nm. During necrotrophic growth, regions around 1800–2000 nm exhibited the highest correlation. As infection progressed to sporulation, broad swaths of the NIR and SWIR corresponded to discrimination between infected and uninfected plants, with a peak around 1000 nm and a broad bimodal concentration in the SWIR. In contrast, the majority of the wavelengths yielding the most highly correlated NDSIs concentrated in two narrow peaks in the NIR around 1000 nm across all A. solani infection stages. Two peaks in the SWIR region between 2000–2400 nm, indicate that chemical changes occurred within infected leaves. This also appeared to be the most highly discriminatory region during light stages of disease progression (Figure 4B).
Leaf level biochemical trait indices derived from PLS-R models from Chlus et al. (in preparation) were applied to a subset of the spectral data not including mixed inoculation treatments (n = 1365) to test whether spectral variation associated with leaf biochemistry varied between late and early blight diseased plants across disease time (Figure 5). Estimating these metrics non-destructively enabled us to follow the same cohort of leaves over time, in contrast to traditional chemical analyses requiring destructive sampling of leaf tissue. These PLS-R models should be considered trait indices rather than precise measurements because they were not validated on the leaves within this study. Late blight infection had a significant effect on total phenolics concentration, sugar concentration, nitrogen concentration, leaf mass per area (LMA), and NDWI, a measure of leaf water status (Table S1). There was a significant interaction effect of treatment and disease time on phenolics concentration, nitrogen concentration, and LMA (Table S1). In contrast, early blight treatment only had a significant effect on phenolics and NDWI, but the interaction term was significant for all quantified traits (Table S2).
The consistent impact of pathogen biology was apparent through further examination of the pairwise differences between control leaves and diseased leaves at progressive stages. Foliar trait differences between early blight infected leaves and controls changed consistently over time, becoming greater at the latest disease stages. In contrast, the effects were more variable across the pathogen life cycle for late blight aligning with its hemibiotrophic lifestyle (Figure 5). Nitrogen was only significantly different between P. infestans infected and control leaves during symptomatic stages (Figure 5A(iv)). Total phenolic concentration (Figure 5A(i)) and LMA (Figure 5A(v)) were only significantly different during the earliest disease time stage. NDWI was highly significantly different during early infection and necrotrophy, but not during biotrophy or sporulation (Figure 5A(vi)). In contrast, leaf sugar concentration followed the pattern seen in early blight traits, with differences between late blight infected leaves and control leaves growing as infection advanced (Figure 5A(ii)). Total phenolics was the only trait to show intra-disease time variation, with weakly significant differences between A. solani infected and control leaves during pre-symptomatic infection, none during light infection, and highly significant differences during heavy infection (Figure 5B(i)).
When late blight was binned according to early blight disease time and the two compared, a significant treatment effect was only seen for nitrogen and NDWI, though the interaction term was significant for all measured traits except nitrogen (Table S3). Total phenolics were only significantly different between late blight and control leaves during early infection (Figure 5A(i)). In contrast, total phenolics were highly significantly different between early blight and control leaves during the latest disease time stage (Figure 5B(i)). Starch concentration, total phenolics concentration, and LMA were significantly different between late blight diseased and early blight diseased leaves only in a comparison of the latest disease time stages (heavy vs. sporulation). Sugar concentration was significantly different between the two symptomatic disease time stages (light vs. necrotrophy, heavy vs. sporulation). NDWI was significantly different between late blight diseased and early blight diseased leaves for both pre-symptomatic early blight and early infection late blight (but not biotrophy) and at the latest disease time stages. Nitrogen was significantly different between late blight diseased and early blight diseased leaves in a comparison of light early blight leaves and necrotrophy late blight leaves.

4. Discussion

Here, we demonstrate that leaf-level hyperspectral measurements and spectrally derived trait indices can be used to pre-symptomatically differentiate between two important potato diseases across all stages of infection and disease development. This work, conducted in controlled environments, is a critical first step in pursuit of eventual field-based, pre-symptomatic disease detection. We found that spectral patterns relate to both pathogen biology and the underlying biochemical and physiological changes resulting from infection. While spectral features that enable disease detection at the leaf level can differ from those at the canopy level [50], this work lays the foundation for future use of full-spectrum in-situ and imaging spectroscopy systems as quantitative tools for pre-symptomatic disease detection and optimized management. This work additionally highlights the importance of careful consideration of underlying pathogen biology and resulting disease physiology for future crop disease remote sensing. Specifically, for some diseases, different spectral models may be needed to identify infection dependent on disease stage (e.g., late blight), whereas this may not be necessary for other pathogens (e.g., early blight).
Only recently have VSWIR hyperspectral systems demonstrated the capacity for asymptomatic and pre-symptomatic disease detection [19,31,32,33,34,35,42]. Historically, differentiation has been difficult due to the fact that symptomatic, necrotic tissue yields relatively consistent changes in leaf optical properties. Spectral reflectance sourced from a variety of scales has been used to monitor plant disease progression for over 30 years [61,62,63]. These historical works have shown that disease can effectively be detected at multiple deployment scales ranging from ground to satellite. Despite these successes, a consistent challenge remains to (1) reliably detect disease under varying environmental conditions, and (2) to differentiate disease from other potentially confounding biotic and abiotic stresses. For the discipline of remote sensing of crop disease to move beyond these challenges, care must be taken to relate unique disease physiology to spectrally derived data. This study represents an essential step in the remote sensing pipeline by providing proof of concept for use of contact spectroscopy in controlled environments, the “cleanest” and least noisy deployment level.
Understanding the underlying processes involved in early (both pre-symptomatic and early symptomatic) disease establishment is essential, as management actions taken during these stages are most likely to succeed [16]. Pre-symptomatic disease detection could trigger management responses such as targeted plant rogueing, or removal, to exclude infection before spore production and prescriptive application of semi-curative fungicides, responses that address both commercial organic and conventional production needs. This would represent a great advance for agroecosystem environmental sustainability, through more prescriptive and precise fungicide application, financial sustainability, through the reduction in unnecessary spending, and social sustainability, through a reduction in anxiety, tension, and negative social stigma due to the unpredictability and potentially devastating impact of plant disease.
To our knowledge, this work is the first to relate in-situ spectral reflectance to underlying pathogen biology through the lens of non-destructively sensed comparative disease physiology. Phytophthora infestans releases different suites of effectors as infection progresses, differentially affecting plant chemical composition at different stages of the infection cycle [64,65]. Relating these spectral signatures to pathogen biology is an important step towards developing this approach as a functional disease management tool. This work, conducted at the leaf level in controlled environments, demonstrates the viability of using in-situ spectroscopy to understand basic biochemical and physiological disease processes and highlights the importance of considering underlying drivers of spectral responses to disease for future crop disease remote sensing studies. Future work validating and scaling up the results presented here to the canopy and field level will be critical to advance the broader goal of integrated disease management with imaging spectroscopy.
Trait estimation with in-situ and imaging spectroscopy has been extensively used to study ecosystem functional diversity [4,7,10,12,13,66]. The application of this method to understand pathosystem function, the interaction of host, environment, and pathogen, is novel to both ecological remote sensing and phytopathology. In comparison to traditional methods that require destructive sampling, we can follow the same cohort of diseased leaves over time by using in-vivo spectroscopy to detect and quantify physiological and biochemical traits. The capacity to non-destructively monitor pathosystem biochemistry and physiology function with spectrally-derived plant physiology, biochemistry, and morphology metrics, first established by Arens et al. [18] and Couture et al. [19], should be explored in future works to facilitate more accurate characterization of the precise impact pathogens impart on their hosts during the earliest infection stages.
Phenolics concentration may be an important differentiator of symptomatic late and early blight infections. Phenolics concentration differed significantly between late blight and early blight diseased leaves and controls, as well as between late blight and early blight diseased leaves during specific disease time stages. Kokaly and Skidmore [5] found significant absorption features for phenolics at both 1660 nm and 2140 nm. In our work, we found that wavelengths around 2100 nm differentiated between late blight and early blight diseased leaves (Figure 2 and Figure 4). This gives evidence to the hypothesis that differences in phenolic concentrations may discriminate symptomatic late and early blight infections. Gold et al. found that phenolic concentration varied across cultivars and between healthy and diseased plants undergoing the early stages of late blight infection [22]. Future work addressing and quantifying specific phenolic and secondary metabolites associated with early infection could yield even greater detection accuracy across a wider variety of biotic and abiotic potato stressors. The PAL-1 gene encodes a lyase that controls the production of phenolics compounds and is differentially expressed during infection by different clonal lineages [37]. Various classes of secondary metabolite are differentially expressed as well, such as glycoalkaloids, steroidal terpenoids, and phenolic acids. These have been shown to be strong indicators of plant response to early P. infestans infection [67]. As well, A. solani produces a variety of toxins during infection that cause cell death and leaf chlorosis [30]. Specifically, quantifying toxins produced by A. solani during infection or metabolic compounds upregulated during infection using spectroscopy may be a way to increase the accuracy and specificity of spectral classification approaches.
Our PLS-DA models found SWIR wavelengths to be essential for accurate discrimination between healthy and diseased leaves and for discrimination between the two infections at all disease time stages. We speculate that spectral differences in the SWIR between late and early blight may be caused by a difference in underlying biochemical and physiological response to infection. Many of the wavelengths identified as important by our study are known to correspond to changes in biochemical constituents such as cellulose, water content, and phenolics [3,5,58]. Cellulose is an essential component of plant cell walls, and is compromised during both P. infestans and A. solani infections [30,68]. Alternaria solani toxins are known to cause rapid and extreme damage to plant cell walls, occurring in as little as 1–3 h after first exposure [30]. In particular, wavelengths in the 1850–1900 nm range are known to be associated with leaf cellulose, starch, and water concentration and were frequently found in the top 20 PLS-DA standardized coefficients and within the most differentiating NDSIs. As a caveat, this spectral range is near to the specific region (~1900 nm) where the two SWIR sensors within the spectrometer stitch together, which may influence their reflectance values. But, supporting our inference here is the fact that other SWIR wavelengths (~1000 nm, ~1380 nm, ~2100 nm) known to be related to similar underlying physiological and biochemical processes were highly changed and important for accurate discrimination.
Across many disease time points, SWIR leaf water absorption features (~1400 nm and ~1800 nm) were among the most highly correlated with differences between all healthy and diseased leaves as well as between early blight and late blight (Figure 2, Figure 4 and Figure 5). To scale this methodology to airborne or satellite remote sensing, an important area of future research must address whether wavelengths outside these regions (where atmospheric absorption prevents reliable measurements) are suitable for disease detection with imaging spectroscopy. This limitation may or may not affect overall detection and differentiation accuracy, but this issue will need to be explored to determine the applicability of this technology for in-field deployment.

5. Conclusions

The findings presented here represent proof of concept for rapid pre- and post-symptomatic detection and differentiation of two economically important foliar plant diseases. To move towards the goal of in-field disease differentiation, a greater number of isolates and pathovars with independent validation must be tested to confirm these initial findings. Importantly, these findings must be explored in a variety of cultivars, which has been shown to have a strong impact on early infection reflectance [22]. Despite the need for further validation, this work supports the future use of in-situ spectroscopy as an effective tool for plant disease detection and differentiation, and highlights the importance of careful consideration of underlying pathosystem biology and comparative disease physiology when seeking to detect and differentiate plant diseases.

6. Patents

The work within this article is the subject of one patent: “System of detection for disease in plants,” KM Gold, AJ Gevens, PA Townsend—US Patent App. 16/251,415, 2019.

Supplementary Materials

The following are available online at https://0-www-mdpi-com.brum.beds.ac.uk/2072-4292/12/2/286/s1, Figure S1. Disease progression, as area under the disease progress curve (AUDPC) from serial disease severity ratings (modified Horsfall Barratt Scale), resulting from sporangial suspension application (spray, spectra n = 38) and inoculum plug (plug, spectra n = 86) Phytophthora infestans inoculation methods. AUDPC was not significantly different between the two inoculation methods. Horsfall, J. G.; Barratt, R. W. (1945), “An Improved Grading System for Measuring Plant Disease”, Phytopathology, 35: 655–659. Figure S2. Spectra plots annotated with bars indicating top 1% of standard coefficients that are most important to the partial least squares-discriminant analysis (PLS-DA) models by absolute value for each time stage of potato early and late blight disease. (A) Spectra and standardized coefficients from control, early infection, biotrophy, necrotrophy, and sporulation of potato late blight. (B) Spectra and standardized coefficients from control, pre-symptomatic, light, and heavy post-symptomatic stages of potato early blight. (C) Spectra of potato late blight and early blight with standardized coefficients from models differentiating the two diseases at pre-symptomatic time points, light disease time points, and heavy disease time points. (D) Spectra from potato late blight and mixed late blight and early blight diseased leaves with standardized coefficients from models differentiating the two diseases at pre-symptomatic, light infection, and heavy infection time points. Figure S3. Potato late blight vs. non-diseased (control) partial least squares-discriminant analysis (PLS-DA), absolute value standard coefficients for (A) all disease time points, (B) early infection, (C) biotrophy, (D) necrotrophy, and (E) sporulation. Figure S4. Potato early blight partial least squares-discriminant analysis (PLS-DA) absolute value std. coefficient plots for (A) all disease time points, (B) pre-symptomatic infection, (C) light symptomatic infection, and (D) heavy symptomatic infection. Figure S5. Partial least squares-discriminant analysis (PLS-DA) absolute value std. coefficient plots for differentiation between late blight and early blight during (A) all disease time points, (B) pre-symptomatic infection (early infection and biotrophic late blight), (C) light symptomatic infection (necrotrophic late blight), and (D) heavy symptomatic infection (sporulation late blight). Figure S6.—Potato late blight vs. potato late blight and potato early blight (mixed inoculation) partial least squares-discriminant analysis (PLS-DA) absolute value std. coefficient plots (A) all disease time points, (B) early infection, (C) biotrophy, (D) necrotrophy, and (E) sporulation. Table S1. ANOVA tables for spectrally derived biochemical and physiological trait indices (partial least squares regression, late blight vs. control. Table S2. ANOVA tables for spectrally derived biochemical and physiological trait indices (partial least squares regression), early blight vs control. Table S3. ANOVA tables for spectrally derived biochemical and physiological trait indices (partial least squares regression), late blight vs. early blight, binned by early blight disease time stages.

Author Contributions

Conceptualization, K.M.G., P.A.T., J.J.C., and A.J.G.; methodology, K.M.G., P.A.T., A.C. (PLS-R models), and E.R.L. (clearing and staining); software, I.H. (PLS-DA code); validation, K.M.G.; formal analysis, K.M.G.; investigation, K.M.G.; resources, P.A.T. and A.J.G.; data curation, K.M.G.; writing—original draft preparation, K.M.G.; writing—review and editing, K.M.G., P.A.T., and A.J.G.; visualization, K.M.G. and E.R.L.; supervision, K.M.G., P.A.T., and A.J.G.; project administration, K.M.G.; funding acquisition, K.M.G., P.A.T., and A.J.G. All authors have read and agreed to the published version of the manuscript.

Funding

Support for this work was provided by the Wisconsin Department of Agriculture, Trade, and Consumer Protection Specialty Crop Block Grant Program, and the University of Wisconsin Madison College of Agricultural and Life Sciences and the potato growers of Wisconsin for an Endowed Potato Fellowship. Additional support was provided by Hatch grant WIS01874 and NASA Advanced Information Systems Technology (AIST) grant 80NSSC17K0244.

Acknowledgments

We would like to thank the grower cooperators of Wisconsin for their input and partnership. Special appreciation is extended to John Hammel, Yu Monica Chen, Stephen Jordan, Aidan Mazur, Ryan Geygan, Erin Wagner, Jamie Spychalla, Haley Knight, and Tina Wu for their assistance and support in data collection.

Conflicts of Interest

The authors declare no conflicts of interest.

References

  1. FAO—News Article: New Standards to Curb the Global Spread of Plant Pests and Diseases. Available online: http://www.fao.org/news/story/en/item/1187738/icode/ (accessed on 20 November 2019).
  2. Mahlein, A.-K.; Kuska, M.T.; Behmann, J.; Polder, G.; Walter, A. Hyperspectral Sensors and Imaging Technologies in Phytopathology: State of the Art. Annu. Rev. Phytopathol. 2018, 56, 535–558. [Google Scholar] [CrossRef] [PubMed]
  3. Curran, P.J. Remote sensing of foliar chemistry. Remote Sens. Environ. 1989, 30, 271–278. [Google Scholar] [CrossRef]
  4. Kokaly, R.F.; Asner, G.P.; Ollinger, S.V.; Martin, M.E.; Wessman, C.A. Characterizing canopy biochemistry from imaging spectroscopy and its application to ecosystem studies. Remote Sens. Environ. 2009, 113, S78–S91. [Google Scholar] [CrossRef]
  5. Kokaly, R.F.; Skidmore, A.K. Plant phenolics and absorption features in vegetation reflectance spectra near 1.66 μm. Int. J. Appl. Earth Obs. Geoinf. 2015, 43, 55–83. [Google Scholar] [CrossRef] [Green Version]
  6. Serbin, S.P. Spectroscopic Determination of Leaf Nutritional, Morpholgical, and Metabolic Traits. Ph.D. Thesis, University of Wisconsin-Madison, Madison, WI, USA, May 2012. [Google Scholar]
  7. Serbin, S.P.; Singh, A.; McNeil, B.E.; Kingdon, C.C.; Townsend, P.A. Spectroscopic determination of leaf morphological and biochemical traits for northern temperate and boreal tree species. Ecol. Appl. 2014, 24, 1651–1669. [Google Scholar] [CrossRef] [Green Version]
  8. Couture, J.J.; Serbin, S.P.; Townsend, P.A. Spectroscopic sensitivity of real-time, rapidly induced phytochemical change in response to damage. New Phytol. 2013, 198, 311–319. [Google Scholar] [CrossRef]
  9. Couture, J.J.; Singh, A.; Rubert-Nason, K.F.; Serbin, S.P.; Lindroth, R.L.; Townsend, P.A. Spectroscopic determination of ecologically relevant plant secondary metabolites. Methods Ecol. Evol. 2016, 7, 1402–1412. [Google Scholar] [CrossRef] [Green Version]
  10. Singh, A.; Serbin, S.P.; McNeil, B.E.; Kingdon, C.C.; Townsend, P.A. Imaging spectroscopy algorithms for mapping canopy foliar chemical and morphological traits and their uncertainties. Ecol. Appl. 2015, 25, 2180–2197. [Google Scholar] [CrossRef]
  11. Asner, G.P.; Martin, R.E. Spectral and chemical analysis of tropical forests: Scaling from leaf to canopy levels. Remote Sens. Environ. 2008, 112, 3958–3970. [Google Scholar] [CrossRef]
  12. Asner, G.P.; Martin, R.E.; Anderson, C.B.; Knapp, D.E. Quantifying forest canopy traits: Imaging spectroscopy versus field survey. Remote Sens. Environ. 2015, 158, 15–27. [Google Scholar] [CrossRef]
  13. Cavender-Bares, J.; Meireles, J.E.; Couture, J.J.; Kaproth, M.A.; Kingdon, C.C.; Singh, A.; Serbin, S.P.; Center, A.; Zuniga, E.; Pilz, G.; et al. Associations of Leaf Spectra with Genetic and Phylogenetic Variation in Oaks: Prospects for Remote Detection of Biodiversity. Remote Sens. 2016, 8, 221. [Google Scholar] [CrossRef] [Green Version]
  14. Yuan, M.; Couture, J.J.; Townsend, P.A.; Ruark, M.D.; Bland, W.L. Spectroscopic Determination of Leaf Nitrogen Concentration and Mass Per Area in Sweet Corn and Snap Bean. Agron. J. 2016, 108, 2519–2526. [Google Scholar] [CrossRef]
  15. Carter, G.A.; Knapp, A.K. Leaf optical properties in higher plants: Linking spectral characteristics to stress and chlorophyll concentration. Am. J. Bot. 2001, 88, 677–684. [Google Scholar] [CrossRef] [PubMed] [Green Version]
  16. Agrios, G. Plant Pathogens and Disease: General Introduction; Elsevier: Amsterdam, The Netherland, 2009. [Google Scholar]
  17. Mahlein, A.-K. Plant Disease Detection by Imaging Sensors—Parallels and Specific Demands for Precision Agriculture and Plant Phenotyping. Plant Dis. 2015, 100, 241–251. [Google Scholar] [CrossRef] [Green Version]
  18. Arens, N.; Backhaus, A.; Döll, S.; Fischer, S.; Seiffert, U.; Mock, H.-P. Non-invasive Presymptomatic Detection of Cercospora beticola Infection and Identification of Early Metabolic Responses in Sugar Beet. Front. Plant Sci. 2016, 7, 1377. [Google Scholar] [CrossRef] [Green Version]
  19. Couture, J.J.; Singh, A.; Charkowski, A.O.; Groves, R.L.; Gray, S.M.; Bethke, P.C.; Townsend, P.A. Integrating Spectroscopy with Potato Disease Management. Plant Dis. 2018, 102, 2233–2240. [Google Scholar] [CrossRef] [Green Version]
  20. Heim, R.H.J.; Wright, I.J.; Chang, H.-C.; Carnegie, A.J.; Pegg, G.S.; Lancaster, E.K.; Falster, D.S.; Oldeland, J. Detecting myrtle rust (Austropuccinia psidii) on lemon myrtle trees using spectral signatures and machine learning. Plant Pathol. 2018, 67, 1114–1121. [Google Scholar] [CrossRef]
  21. Gold, K.M.; Gevens, A.J.; Townsend, P.A. System for Detection of Disease in Plants. U.S. Patent App. 16/251,415, 1 June 2019. [Google Scholar]
  22. Gold, K.M.; Townsend, P.A.; Herrmann, I.; Gevens, A.J. Investigating potato late blight physiological differences across potato cultivars with spectroscopy and machine learning. Plant Sci. 2019, 110316. [Google Scholar] [CrossRef]
  23. Oerke, E.-C.; Leucker, M.; Steiner, U. Sensory assessment of Cercospora beticola sporulation for phenotyping the partial disease resistance of sugar beet genotypes. Plant Methods 2019, 15, 133. [Google Scholar] [CrossRef] [Green Version]
  24. Fry, W.E. The Canon of Potato Science: 10. Late Blight and Early Blight. Potato Res. 2007, 50, 243–245. [Google Scholar] [CrossRef]
  25. Fry, W.E.; Birch, P.R.J.; Judelson, H.S.; Grünwald, N.J.; Danies, G.; Everts, K.L.; Gevens, A.J.; Gugino, B.K.; Johnson, D.A.; Johnson, S.B.; et al. Five Reasons to Consider Phytophthora infestans a Reemerging Pathogen. Phytopathology 2015, 105, 966–981. [Google Scholar] [CrossRef] [PubMed] [Green Version]
  26. Haverkort, A.J.; Boonekamp, P.M.; Hutten, R.; Jacobsen, E.; Lotz, L.A.P.; Kessel, G.J.T.; Visser, R.G.F.; Van Der Vossen, E.A.G. Societal costs of late blight in potato and prospects of durable resistance through cisgenic modification. Potato Res. 2008, 51, 47–57. [Google Scholar] [CrossRef]
  27. Fry, W. Phytophthora infestans: The plant (and R gene) destroyer. Mol. Plant Pathol. 2008, 9, 385–402. [Google Scholar] [CrossRef] [PubMed]
  28. Pasche, J.S.; Piche, L.M.; Gudmestad, N.C. Effect of the F129L Mutation in Alternaria solani on Fungicides Affecting Mitochondrial Respiration. Plant Dis. 2005, 89, 269–278. [Google Scholar] [CrossRef] [PubMed] [Green Version]
  29. Leiminger, J.H.; Adolf, B.; Hausladen, H. Occurrence of the F129L mutation in Alternaria solani populations in Germany in response to QoI application, and its effect on sensitivity. Plant Pathol. 2014, 63, 640–650. [Google Scholar] [CrossRef]
  30. Nishimura, S.; Kohmoto, K. Host-Specific Toxins and Chemical Structures from Alternaria Species. Annu. Rev. Phytopathol. 1983, 21, 87–116. [Google Scholar] [CrossRef]
  31. Wu, D.; Feng, L.; Zhang, C.; He, Y. Early Detection of Botrytis cinerea on Eggplant Leaves Based on Visible and Near-Infrared Spectroscopy. Trans. ASABE 2008, 51, 1133–1139. [Google Scholar] [CrossRef]
  32. Rumpf, T.; Mahlein, A.-K.; Steiner, U.; Oerke, E.-C.; Dehne, H.-W.; Plümer, L. Early detection and classification of plant diseases with Support Vector Machines based on hyperspectral reflectance. Comput. Electron. Agric. 2010, 74, 91–99. [Google Scholar] [CrossRef]
  33. Kuska, M.; Wahabzada, M.; Leucker, M.; Dehne, H.-W.; Kersting, K.; Oerke, E.-C.; Steiner, U.; Mahlein, A.-K. Hyperspectral phenotyping on the microscopic scale: Towards automated characterization of plant-pathogen interactions. Plant Methods 2015, 11, 28. [Google Scholar] [CrossRef] [Green Version]
  34. Xie, C.; Yang, C.; He, Y. Hyperspectral imaging for classification of healthy and gray mold diseased tomato leaves with different infection severities. Comput. Electron. Agric. 2017, 135, 154–162. [Google Scholar] [CrossRef]
  35. Zarco-Tejada, P.J.; Camino, C.; Beck, P.S.A.; Calderon, R.; Hornero, A.; Hernández-Clemente, R.; Kattenborn, T.; Montes-Borrego, M.; Susca, L.; Morelli, M.; et al. Previsual symptoms of Xylella fastidiosa infection revealed in spectral plant-trait alterations. Nat. Plants 2018, 4, 432–439. [Google Scholar] [CrossRef] [PubMed]
  36. Zhang, M.; Qin, Z.; Liu, X. Remote Sensed Spectral Imagery to Detect Late Blight in Field Tomatoes. Precis. Agric. 2005, 6, 489–508. [Google Scholar] [CrossRef]
  37. Wang, X.; Zhang, M.; Zhu, J.; Geng, S. Spectral prediction of Phytophthora infestans infection on tomatoes using artificial neural network (ANN). Int. J. Remote Sens. 2008, 29, 1693–1706. [Google Scholar] [CrossRef]
  38. Baranowski, P.; Jedryczka, M.; Mazurek, W.; Babula-Skowronska, D.; Siedliska, A.; Kaczmarek, J. Hyperspectral and Thermal Imaging of Oilseed Rape (Brassica napus) Response to Fungal Species of the Genus Alternaria. PLoS ONE 2015, 10, e0122913. [Google Scholar] [CrossRef] [PubMed] [Green Version]
  39. Xie, C.; Shao, Y.; Li, X.; He, Y. Detection of early blight and late blight diseases on tomato leaves using hyperspectral imaging. Sci. Rep. 2015, 5, 16564. [Google Scholar] [CrossRef]
  40. Sugiura, R.; Tsuda, S.; Tamiya, S.; Itoh, A.; Nishiwaki, K.; Murakami, N.; Shibuya, Y.; Hirafuji, M.; Nuske, S. Field phenotyping system for the assessment of potato late blight resistance using RGB imagery from an unmanned aerial vehicle. Biosyst. Eng. 2016, 148, 1–10. [Google Scholar] [CrossRef]
  41. Duarte-Carvajalino, J.M.; Alzate, D.F.; Ramirez, A.A.; Santa-Sepulveda, J.D.; Fajardo-Rojas, A.E.; Soto-Suárez, M. Evaluating Late Blight Severity in Potato Crops Using Unmanned Aerial Vehicles and Machine Learning Algorithms. Remote Sens. 2018, 10, 1513. [Google Scholar] [CrossRef] [Green Version]
  42. Bienkowski, D.; Aitkenhead, M.J.; Lees, A.K.; Gallagher, C.; Neilson, R. Detection and differentiation between potato (Solanum tuberosum) diseases using calibration models trained with non-imaging spectrometry data. Comput. Electron. Agric. 2019, 167, 105056. [Google Scholar] [CrossRef]
  43. Franceschini, M.H.D.; Bartholomeus, H.; van Apeldoorn, D.F.; Suomalainen, J.; Kooistra, L. Feasibility of Unmanned Aerial Vehicle Optical Imagery for Early Detection and Severity Assessment of Late Blight in Potato. Remote Sens. 2019, 11, 224. [Google Scholar] [CrossRef] [Green Version]
  44. Lamour, K.H.; Hausbeck, M.K. The Spatiotemporal Genetic Structure of Phytophthora capsici in Michigan and Implications for Disease Management. Phytopathology 2002, 92, 681–684. [Google Scholar] [CrossRef] [Green Version]
  45. Fry, W.E.; Patev, S.P.; Myers, K.L.; Bao, K.; Fei, Z. Phytophthora infestans Sporangia Produced in Culture and on Tomato Leaflet Lesions Show Marked Differences in Indirect Germination Rates, Aggressiveness, and Global Transcription Profiles. Mol. Plant Microbe Interact. 2018, 32, 515–526. [Google Scholar] [CrossRef] [PubMed] [Green Version]
  46. Barratt, R.; Horsfall, J. An improved grading system for measuring plant disease. Phytopathology 1945, 35, 655. [Google Scholar]
  47. Gold, K.M.; Townsend, P.A.; Larson, E.R.; Herrmann, I.; Gevens, A.J. Contact reflectance spectroscopy for rapid, accurate, and non-destructive Phytophthora infestans clonal lineage discrimination. Phytopathology 2019. Available online: https://apsjournals.apsnet.org/doi/abs/10.1094/PHYTO-08-19-0294-R (accessed on 7 January 2020). [CrossRef] [PubMed] [Green Version]
  48. Yin, J.; Gu, B.; Huang, G.; Tian, Y.; Quan, J.; Lindqvist-Kreuze, H.; Shan, W. Conserved RXLR Effector Genes of Phytophthora infestans Expressed at the Early Stage of Potato Infection Are Suppressive to Host Defense. Front. Plant Sci. 2017, 81, 2155. [Google Scholar] [CrossRef] [PubMed] [Green Version]
  49. Villani, T.S.; Koroch, A.R.; Simon, J.E. An improved clearing and mounting solution to replace chloral hydrate in microscopic applications. Appl. Plant Sci. 2013, 1, 1300016. [Google Scholar] [CrossRef]
  50. Herrmann, I.; Vosberg, S.K.; Ravindran, P.; Singh, A.; Chang, H.-X.; Chilvers, M.I.; Conley, S.P.; Townsend, P.A. Leaf and Canopy Level Detection of Fusarium Virguliforme (Sudden Death Syndrome) in Soybean. Remote Sens. 2018, 10, 426. [Google Scholar] [CrossRef] [Green Version]
  51. Zhai, Y.; Cui, L.; Zhou, X.; Gao, Y.; Fei, T.; Gao, W. Estimation of nitrogen, phosphorus, and potassium contents in the leaves of different plants using laboratory-based visible and near-infrared reflectance spectroscopy: Comparison of partial least-square regression and support vector machine regression methods. Int. J. Remote Sens. 2013, 34, 2502–2518. [Google Scholar]
  52. Oksanen, J.; Blanchet, F.G.; Kindt, R.; Legendre, P.; Minchin, P.R.; O’hara, R.; Simpson, G.L.; Solymos, P.; Stevens, M.H.H.; Wagner, H.; et al. Package ‘vegan.’. Community Ecol. Package Version 2013, 2, 1–295. [Google Scholar]
  53. Mevik, B.-H.; Wehrens, R.; Liland, K.H. pls: Partial least squares and principal component regression. R Package Version 2011, 2, 3. [Google Scholar]
  54. Kuhn, M. caret: Classification and Regression Training. Astrophys. Source Code Libr. 2015. [Google Scholar]
  55. Worley, B.; Powers, R. Multivariate analysis in metabolomics. Curr. Metab. 2013, 1, 92–107. [Google Scholar]
  56. Wright, I.J.; Reich, P.B.; Westoby, M.; Ackerly, D.D.; Baruch, Z.; Bongers, F.; Cavender-Bares, J.; Chapin, T.; Cornelissen, J.H.C.; Diemer, M.; et al. The worldwide leaf economics spectrum. Nature 2004, 428, 821. [Google Scholar] [CrossRef] [PubMed]
  57. Reich, P.B. The world-wide ‘fast–slow’ plant economics spectrum: A traits manifesto. J. Ecol. 2014, 102, 275–301. [Google Scholar] [CrossRef]
  58. Gao, B. NDWI—A normalized difference water index for remote sensing of vegetation liquid water from space. Remote Sens. Environ. 1996, 58, 257–266. [Google Scholar] [CrossRef]
  59. Pinheiro, J.; Bates, D.; DebRoy, S.; Sarkar, D.; R Core Team. nlme: Linear and nonlinear mixed effects models. R Package Version 3.1–111. Comput. Man. 2013. [Google Scholar]
  60. Lenth, R. Emmeans: Estimated marginal means, aka least-squares means. R Package Vers. 2018, 1, 2. [Google Scholar]
  61. Jackson, R.D. Remote Sensing of Biotic and Abiotic Plant Stress. Annu. Rev. Phytopathol. 1986, 24, 265–287. [Google Scholar] [CrossRef]
  62. Nilsson, H. Remote Sensing and Image Analysis in Plant Pathology. Annu. Rev. Phytopathol. 1995, 33, 489–528. [Google Scholar] [CrossRef]
  63. Hatfield, P.L.; Pinter, P.J. Remote sensing for crop protection. Crop Prot. 1993, 12, 403–413. [Google Scholar] [CrossRef]
  64. Zuluaga, A.P.; Vega-Arreguín, J.J.C.; Fei, Z.; Ponnala, L.; Lee, S.J.; Matas, A.J.; Patev, S.; Fry, W.E.; Rose, J.K.C. Transcriptional dynamics of Phytophthora infestans during sequential stages of hemibiotrophic infection of tomato. Mol. Plant Pathol. 2016, 17, 29–41. [Google Scholar] [CrossRef]
  65. Henriquez, M.A.; Adam, L.R.; Daayf, F. Alteration of secondary metabolites’ profiles in potato leaves in response to weakly and highly aggressive isolates of Phytophthora infestans. Plant Physiol. Biochem. 2012, 57, 8–14. [Google Scholar] [CrossRef] [PubMed]
  66. Wang, Z.; Townsend, P.A.; Schweiger, A.K.; Couture, J.J.; Singh, A.; Hobbie, S.E.; Cavender-Bares, J. Mapping foliar functional traits and their uncertainties across three years in a grassland experiment. Remote Sens. Environ. 2019, 221, 405–416. [Google Scholar] [CrossRef]
  67. Galeano Garcia, P.; Neves dos Santos, F.; Zanotta, S.; Eberlin, M.N.; Carazzone, C. Metabolomics of Solanum lycopersicum Infected with Phytophthora infestans Leads to Early Detection of Late Blight in Asymptomatic Plants. Molecules 2018, 23, 3330. [Google Scholar] [CrossRef] [PubMed] [Green Version]
  68. Erwin, D.C.; Ribeiro, O.K. Phytophthora Diseases Worldwide; APS Press: St. Paul, MN, USA, 1996. [Google Scholar]
Figure 1. Representative potato leaves during late blight (A) early infection, (B) biotrophy, (C) necrotrophy, and (D) sporulation. Phytophthora infestans infection progression illustrated by (EL) microscopy with enhancement by tryphan blue staining, and by a computer-stylized cross-section of (M) early infection, (N) biotrophy, (O) necrotrophy, and (P) sporulation. Progress of tissue infection is consistent with increasing necrosis and pathogen sporulation.
Remotesensing 12 00286 g001
Figure 2. Principle Coordinates Analysis (PCoA) using Euclidean distance of late blight and early blight spectra over disease time. Note the aggregation of late blight disease spectral outcomes unique from early blight spectral outcomes. Over disease time, samples became more and more different from both control and each other.
Remotesensing 12 00286 g002
Figure 3. Heat maps of normalized differential spectral index (NDSI) correlations for binary comparisons with potato late blight (diseased vs. non-diseased, AE), potato early blight (diseased vs. non-diseased, FI), potato late blight compared to early blight (JM), and potato late blight compared to mixed late blight and early blight infections (NR) over all disease time points (A,F,J,M) and late blight disease time stages: early infection (B,O), biotrophy (C,P), necrotrophy (D,Q), and sporulation (E,R) and early blight disease time stages: pre-symptomatic (G,K), post-symptomatic light (H,L), and post-symptomatic heavy (I,M).
Remotesensing 12 00286 g003
Figure 4. Density plots of distribution of the wavelengths used in the top 300 most correlated NDSIs for all potato late blight life stage models (A) and potato early blight disease stage models (B). Height of peaks indicate a higher concentration of correlated wavelengths in that spectral region.
Remotesensing 12 00286 g004
Figure 5. Non-destructively sensed physiological and biochemical traits indices difference between diseased and healthy leaves for (A) late blight and (B) early blight binned by respective disease time stages. Y-axis scales: (A(i),B(i)) total phenolics concentration, percent dry matter, (A(ii),B(ii)) total sugars concentration, percent dry matter, (A(iii),B(iii)) total starch concentration, percent dry matter, (A(iv),B(iv)) nitrogen concentration, percent dry matter, (A(v),B(v)) leaf mass per area (LMA), gram/meters2, (A(vi),B(vi)) normalized difference water index (NDWI).
Remotesensing 12 00286 g005
Table 1. Validation (kappa) for models classifying potato late blight disease at multiple life stages across 100 permutations with a 70/30 calibration validation split. Models that were fit within a life stage do not perform well outside of that stage of development with the exception of the sporulation model.
Late Blight
Kappa (val)Model
All TimepointsEarly InfectionBiotrophyNecrotrophySporulation
DataAll Timepoints0.7660.6080.2030.4540.535
Early Infection0.8570.8720.2070.4760.441
Biotrophy0.7530.5590.8120.2860.410
Necrotrophy0.7060.4240.1800.7900.731
Sporulation0.7220.3750.0440.5960.636
Table 2. Validation (kappa) for models classifying potato early blight disease at multiple disease stages across 100 permutations with a 70/30 calibration validation split. Models that were fit within a pathogen life stage perform well outside of the specific stage of development.
Early Blight
Kappa (val)Model
All TimepointsPre-SymptomaticLightHeavy
DataAll Timepoints0.9040.7090.6260.623
Pre-Symptomatic0.9350.9360.8780.844
Light0.9840.9570.9840.977
Heavy0.9510.8490.9650.982
Table 3. Confusion matrices for PLS-DA internal cross-validation averages (from 100 permutations) differentiating potato late blight disease from early blight disease at all time points, pre-symptomatic time points, light infection, and heavy disease stages. Differentiation of the two pathogens is possible with greater than 90% accuracy at all time points studied.
All Timepoints
Kappa = 0.83
Components = 14
Early BlightLate BlightActual # of samples per classProducer’s Accuracy %
Early Blight58.9311.077084.19
Late Blight1.5682.448498.14
Total # of classified samples60.4993.51Total Accuracy: 91.8%
User’s Accuracy %97.4688.27
Pre-Symptomatic
Kappa = 0.78
Components = 12
Early BlightLate BlightActual # of samples per classProducer’s Accuracy %
Early Blight14.472.531785.12
Late Blight3.0143.994793.60
Total # of classified samples17.4846.52Total Accuracy: 91.3%
User’s Accuracy %83.6594.68
Post-Symptomatic Light
Kappa = 0.86
Components = 16
Early BlightLate BlightActual # of samples per classProducer’s Accuracy %
Early Blight43.176.835086.34
Late Blight2.0690.949397.78
Total # of classified samples45.2397.77Total Accuracy: 93.8%
User’s Accuracy %95.5193.07
Post-Symptomatic Heavy
Kappa = 0.94
Components = 5
Early BlightLate BlightActual # of samples per classProducer’s Accuracy %
Early Blight15.811.191793.00
Late Blight02121100.00
Total # of classified samples15.8122.19Total Accuracy: 96.9%
User’s Accuracy %100.0094.80

