Article

Area-Based Dense Image Matching with Subpixel Accuracy for Remote Sensing Applications: Practical Analysis and Comparative Study

1
Photogrammetry and Remote Sensing, Technische Universitaet Muenchen, Arcisstr. 21, 80333 Munich, Germany
2
College of Surveying and Geo-Informatics, Tongji University, 1239 Siping Road, Shanghai 200092, China
*
Author to whom correspondence should be addressed.
Submission received: 11 January 2020 / Revised: 18 February 2020 / Accepted: 18 February 2020 / Published: 20 February 2020
(This article belongs to the Section Remote Sensing Image Processing)

Abstract

:
Dense image matching is a crucial step in many image processing tasks. Subpixel accuracy and fractional measurement are commonly pursued, considering the image resolution and application requirement, especially in the field of remote sensing. In this study, we conducted a practical analysis and comparative study on area-based dense image matching with subpixel accuracy for remote sensing applications, with a specific focus on the subpixel capability and robustness. Twelve representative matching algorithms with two types of correlation-based similarity measures and seven types of subpixel methods were selected. The existing matching algorithms were compared and evaluated in a simulated experiment using synthetic image pairs with varying amounts of aliasing and two real applications of attitude jitter detection and disparity estimation. The experimental results indicate that there are two types of systematic errors: displacement-dependent errors, depending on the fractional values of displacement, and displacement-independent errors represented as unexpected wave artifacts in this study. In addition, the strengths and limitations of different matching algorithms on the robustness to these two types of systematic errors were investigated and discussed.

Graphical Abstract

1. Introduction

Dense image matching is the process of determining correspondences between two or more overlapping images in a high-density or even pixel-to-pixel manner. It is a crucial step in many image processing tasks, revealing information from the combination of multiple data sources. Dense image matching is actually a generalization of various terms for different tasks, such as image alignment [1], stereo matching [2], optical flow [3], and digital image correlation [4]. Image matching can be generally implemented by feature-based and area-based methods. The area-based methods possess advantages in the aspects of precision, distribution, and stability [5]. The present study concentrated on area-based dense image matching, involving high-density correspondence estimation by directly maximizing the similarity in intensity information between the transformed template image and the reference image. The transformation function w that maps the template image to the reference image can be expressed by a spatially-varying displacement vector (m0, n0) associated with each position as:
w : x , y x m 0 , y n 0 .
In the field of remote sensing, dense image matching, which can provide precise and compact displacement fields between images, has also received a lot of attention with the growing availability of overlapping remote sensing images. In this study, we focused exclusively on the dense matching of single-channel images. Therefore, prior to dense matching for different types of remote sensing images, multi-channel images, such as multispectral and hyperspectral images, need to extract single-band images by band selection or weighted averaging, and different modal images, such as SAR and LIDAR images, need to be converted to intensity images. From the acquired displacement fields, the property and status of the observed scene and target can be retrieved, such as the height information within the scene [6], the ground surface deformation caused by geologic processes and climate change [7], and the motion of targets [8]. In addition, the quality of the sensor and geometric processing can be assessed according to the displacement fields, reflecting the sensor distortions [9], the attitude variations [10], the inconsistencies after correction or stitching [11], and other information. Therefore, dense image matching is an indispensable study area and has been broadly used in a variety of applications in the remote sensing community [12,13,14,15,16].
Pixel-level accuracy is often inadequate, depending on the spatial resolution of image data and the requirement of applications. For improving the precision of measurement, subpixel matching that is able to achieve fractional displacements is pursued [17]. In this study, we focused directly on the subpixel dense matching problem. In general, subpixel-level accuracy is realized by assuming a continuous approximation for discrete images. Various specific subpixel methods have been devised to estimate the transformation with subpixel precision. The commonly used ones can be roughly classified as peak centroid [18], similarity fitting [19], similarity interpolation [20], intensity interpolation [21], continuous optimization, including local optimization [22] and global optimization [23], and phase-based methods [24].
All these subpixel methods play a significant role in diverse applications and possess their own strengths. However, various applications have different emphasis and mostly concentrated on specific types of subpixel methods. For instance, the major adopted subpixel methods for solving optical flow problems are based on continuous optimization [3], while the major ones for stereoscopic digital elevation model generation are semi-global matching with similarity fitting [25] or least-squares matching (LSM) [26]. The intensity interpolation and phase-based methods are widely used in surface dynamics, monitoring for motion tracking [13,27], and local optimization-based methods are frequently used in digital image correlation for deformation measurement [4]. Therefore, most of the existing performance evaluation and error analysis of subpixel dense matching merely involve certain types of algorithms within the context of a specific application [13,21,27,28,29,30,31,32,33,34]. In addition, there inevitably exist systematic errors induced in subpixel matching that deteriorate the application potentials [35,36,37,38]. The systematic errors vary with the algorithm implementation and experiment configuration [39,40]. It is thus a need to evaluate different existing subpixel methods of dense image matching over various application scenarios, as well as investigate the possible systematic errors and the robustness of different algorithms, especially for remote sensing applications.
In this paper, a comparative study and practical analysis of state-of-the-art algorithms for area-based dense image matching at the subpixel level was presented in order to better understand the potentials and limitations of the existing subpixel algorithms in remote sensing applications. Taking normalized cross-correlation (NCC) in the spatial domain or phase correlation (PC) in the frequency domain as a similarity measure, twelve matching algorithms were tested: Centroid-NCC [41], SimiFit-NCC [7], SimiFit-SGM (semi-global matching) [42], LSM [26], IC-GN (inverse compositional Gauss-Newton) [43], MicMac [27], Correlation flow [44], Centroid-OC (orientation correlation) [41], SimiFit-PC [45], Upsampling [20], SVD-RANSAC (singular value decomposition- random sample consensus) [46], COSI-Corr-Freq [7]. These algorithms were evaluated in a simulated experiment with varying amounts of aliasing and two real applications of attitude jitter detection [10] and disparity estimation [47]. This study was not a complete study that intended to investigate all subpixel algorithms. There are many possible area-based matching algorithms and different implementations that could be extended to subpixel measurement [48,49], while the selected matching algorithms have been often used in different applications with success and cover seven types of subpixel methods mentioned above. The objective and contribution of this study are to compare and investigate the relative performance of typical algorithms for dense image matching on remote sensing data with a particular focus on the subpixel capability and robustness to the possible systematic errors. The remainder of this paper is organized as follows. In Section 2, we describe in detail the subpixel dense image matching, including the overall workflow, the adopted similarity measures, and the subpixel methods under study. Section 3 presents the implementations of the compared subpixel matching algorithms and the settings of simulated and real data experiments. The experimental results and discussions are then provided in Section 4. Finally, the conclusions of this study are reported in Section 5.

2. Dense Image Matching

Subpixel dense image matching aims at identifying and quantifying high-density correspondences with subpixel accuracy from overlapping images. In this section, we first introduce the overall workflow of dense image matching, and then the adopted two correlation-based similarity measures, and finally the evaluated subpixel methods that can obtain fractional measurements.

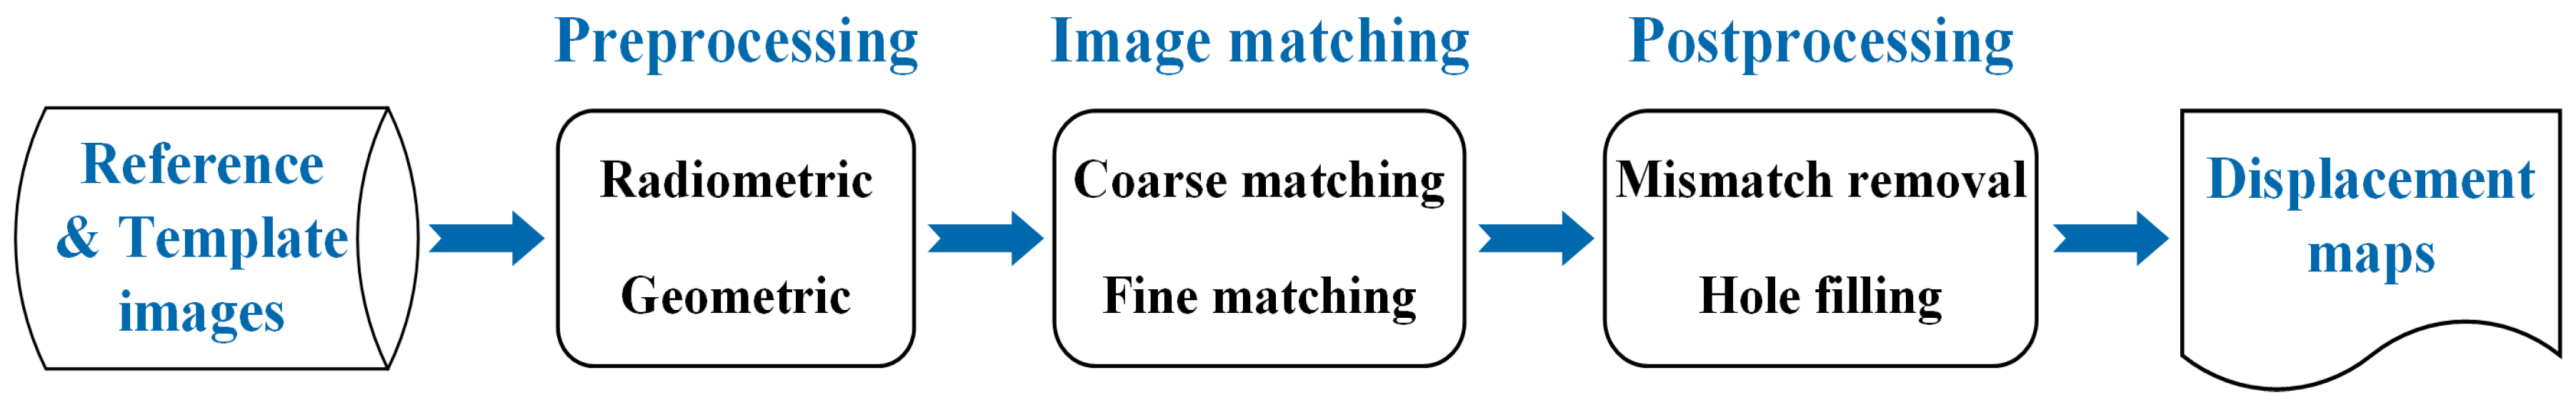
2.1. Overall Workflow

Although the implementation of dense image matching is not completely consistent in different applications, the overall processing can be summarized as a workflow shown in Figure 1. The inputs are two overlapping images for pairwise matching that transforms the template image to a reference image. The general framework contains three basic components: preprocessing, image matching, and postprocessing. The outputs are two-directional displacement maps that could represent different meanings, such as disparity information, motion information, or deformation information, in different applications.
The preprocessing stage mainly includes two aspects, namely radiometric and geometric preprocessing. For the radiometric preprocessing, the objective is to ensure the good radiometric properties for the following image matching by correcting the radiometric artifacts and improving the contrast levels of the images [31]. The geometric preprocessing is a process of image co-registration that can decrease the large differences, including rotation between stereo images and the image deformations caused by unexpected factors in order to enhance the computational efficiency and reliability of image matching. The co-registration can be conducted based on the feature correspondences, the sensor model, and the prior knowledge in various ways, considering the application scenario, such as epipolar rectification [50], orthorectification [7], and alignment using global transformation models [1]. The image matching stage is normally performed in a coarse-to-fine manner. The coarse matching provides initial estimates, and narrows search ranges for the fine matching by computing approximate correspondences using a pixel-level matching or a pyramid-based search [42]. The fine matching involves refining the estimates by means of local search or global optimization based on the subpixel methods described below. The postprocessing stage here identifies and deletes the erroneous matches and optionally fills the hole by adopting a certain filter to improve the quality of displacement maps. The filtering should require little user interaction and is generally implemented, depending on the prior knowledge, the neighboring values, and the confidence measures, such as correlation coefficient, signal-to-noise ratio, and left-right consistency [13]. All these three components would determine the final performance of outputs. In this study, in order to exclusively investigate the performance of subpixel dense matching and the induced systematic errors, no additional radiometric preprocessing was adopted, and the mismatch removal in postprocessing was conducted by selecting a filtering method that was independent of the matching method used.

2.2. Similarity Measures

The similarity measure plays a crucial role in area-based image matching. In our study, two correlation-based similarity measures were tested. The first one was NCC that was operated in the spatial domain, and another option was PC that was calculated in the frequency domain.
NCC is frequently used to estimate the similarity between matching entities in two images due to its simplicity and reliability [51]. For a patch r(x, y) in the reference image and a corresponding patch t(x + m, y + n) in the template image, where m and n stand for the offsets within the search range, the NCC between two patches is defined as [52]:
C N C C ( m , n ) = x , y ( r ( x , y ) r ¯ ) ( t ( x + m , y + n ) t ¯ ) [ x , y ( r ( x , y ) r ¯ ) 2 x , y ( t ( x + m , y + n ) t ¯ ) 2 ] 0.5 ,
where r ¯ and t ¯ are the mean intensities of the patches r(x, y) and t(x + m, y + n), respectively. The values of NCC range between −1, indicating exactly inverse, and +1, indicating the same. NCC is a compatible measure for different correlation attempts and offers robustness to the offset and linear scale in illumination changes [22]. It is worth noting that directly integrating NCC in a continuous optimization scheme is complicated due to its non-differentiability. Fortunately, NCC can be related to the zero-normalized sum of squared differences (ZNSSD) according to the relationship [22,44]:
C N C C = 1 0.5 × C Z N S S D C Z N S S D ( m , n ) = x , y ( r ( x , y ) r ¯ [ x , y ( r ( x , y ) r ¯ ) 2 ] 0.5 t ( x + m , y + n ) t ¯ [ x , y ( t ( x + m , y + n ) t ¯ ) 2 ] 0.5 ) 2
The optimization using ZNSSD is much easier.
PC is also a commonly used patch-based similarity measure that conducts normalization in the frequency domain based on the translation property of Fourier transform [53,54]. Different from NCC, the computation of PC avoids the iterative search process due to the use of Fourier transform routine. The correlation function of PC that is calculated from the inverse Fourier transform of the normalized cross-power spectrum Q is expressed by:
C P C = 1 [ Q ( u , v ) ] = 1 { r ( u , v ) * t ( u , v ) | r ( u , v ) * t ( u , v ) | } = 1 { exp ( i ( u m 0 + v n 0 ) ) } ,
where r ( u , v ) and t ( u , v ) are the corresponding Fourier transform of r(x, y) and t(x, y), 1 denotes the inverse Fourier transform, * denotes the complex conjugate, and i = 1 . Considering the phase information solely, PC is also insensitive to image content. Compared to the classical correlation, including NCC, PC has advantages in computational efficiency with the help of fast Fourier transform and robustness to frequency-dependency noise that will not alter the dominant phase difference [55]. It can be found that in the case of integer displacements, the correlation function of PC is theoretically a Dirac delta function centered at (m0, n0) [56]. The subpixel methods for using PC can be realized by locating the peak of the correlation function in the spatial domain or by estimating the phase difference in the frequency domain [24].

2.3. Subpixel Image Matching Methods

For spatially discrete images, a specific way to approximate continuous signal is required to obtain subpixel precision. In this study, seven different types of subpixel methods were tested and evaluated: peak centroid, similarity fitting, similarity interpolation, intensity interpolation, local continuous optimization, global continuous optimization, and phase-based methods.
Peak centroid is an intuitive but effective method to obtain the subpixel peak location in the correlation surface. Considering the correlation values of the neighboring pixels around the integer peak location is inversely related to the distance between the true peak and each pixel, the subpixel displacement (m0, n0) can be simply estimated as centroid in a local neighborhood N by weighted averaging the correlation values [29]:
m 0 = x , y N x C ( x , y ) x , y N C ( x , y ) ,   n 0 = x , y N y C ( x , y ) x , y N C ( x , y ) .
A threshold can be predefined to suppress the low correlation values with less reliability.
A straightforward alternative method to achieve fractional measurement is similarity fitting that finds the peak location by fitting the 1-D similarity curve or 2-D similarity surface. The difficulty is the selection of an optimal model that can correctly describe the real curve or surface. A variety of models have been investigated in empirical and theoretical studies [24]. In this study, one of the most commonly used fitting models, namely the quadratic function, was tested due to its simplicity. For 1-D parabola fitting, the subpixel peak location is found using the integer-valued main peak (x0, y0) and its two nearest neighbors separately in each direction as:
m 0 = x 0 + C ( x 0 1 , y 0 ) C ( x 0 + 1 , y 0 ) 2 ( C ( x 0 1 , y 0 ) 2 C ( x 0 , y 0 ) + C ( x 0 + 1 , y 0 ) ) n 0 = y 0 + C ( x 0 , y 0 1 ) C ( x 0 , y 0 + 1 ) 2 ( C ( x 0 , y 0 1 ) 2 C ( x 0 , y 0 ) + C ( x 0 , y 0 + 1 ) )
where C can be either similarity values in local search or matching costs in the global energy function.
For the correlation function of PC, the analytical derivation indicates that PC yields a 2-D Dirichlet kernel after the inverse Fourier transform [56]:
C ( x , y ) α W H sin ( π ( x m 0 ) ) sin ( π ( x m 0 ) / W ) sin ( π ( y n 0 ) ) sin ( π ( y n 0 ) / H ) ,
where α 1 denotes the peak value, W and H are the width and height of a patch. The subpixel locations can be solved by nonlinear optimization with a set of points around the main peak [57]. A 1-D peak fitting model can be given after approximating Equation (7) to a sinc function as [45]:
c ( x ) = β sin ( π ( x m 0 ) ) π ( x m 0 ) .
In addition to peak estimation via averaging or fitting of similarity values, another intuitive method is direct resampling of similarity values around the peak with a higher sampling rate. With regard to the Fourier-based image correlation, the inverse Fourier transform of the cross-power spectrum can be upsampled in the frequency domain by means of zero-padding [29] and matrix-multiply discrete Fourier transform [20]. The advantage of the latter one is that it is more suitable for local upsampling within a small neighborhood and without the need to zero-pad the entire cross-power spectrum, which makes it more computational and memory efficient. For instance, the locally upsampled correlation function in a neighborhood of s × s pixels around the initial peak can be calculated by multiplying three matrices:
C L U [ X , Y ] = exp ( i 2 π Y V T H k ) Q [ U , V ] exp ( i 2 π U X T W k ) = Mat 1 s k × H Mat 2 H × W Mat 3 W × s k
where Q [ U , V ] is the original cross-power spectrum matrix calculated from Equation (4), k is the upsampling factor, [ X , Y ] and [ U , V ] are the spatial distributions of patch pixels in the upsampled grid and the frequency distributions of cross-power spectrum matrix in the original grid, respectively. The peak can be relocated at the new resolution.
Similar to the above similarity interpolation, we can also interpolate the intensity values instead of similarity values to reconstruct a higher resolution signal since the correlation of two upsampled images equals to upsampling the correlation of two original images [58]. This method includes two forms. The first one is resampling images or matching patches to the desired resolution [21]. Another one is applying fractional steps to sliding patch or matching cost computation by image interpolation [27]. Then, a certain pixel-level matching algorithm is utilized, and the subpixel displacements can be measured according to the new resolution. The parameter managing the upsampling factor or fractional step determines the computational burden and the subpixel precision of the algorithm, and the choice of intensity interpolation method largely affects the performance of the matching algorithm [36,59]. This type of subpixel method is somewhat computationally expensive for large-scale applications and high precision requirements.
More sophisticated methods regard subpixel matching as an optimization problem and solve it using continuous optimization algorithms in which the variables are allowed to take on any real values permitted by the constraints. Local methods normally perform independent estimations in small patches and express relative deformations using parametric models, while global methods perform optimization globally and make prior assumptions by imposing an explicit regularization term [23]. The two most widely used local methods are iterative spatial gradient-based methods that avoid the derivatives of similarity criteria, such as LSM [26], and gradient descent approximation-based methods that involve the optimization of similarity criterion, such as Lucas-Kanade algorithm and its variants [60]. The identical objective of these two methods is to solve the parametric vector. The commonly adopted mapping function between the corresponding patches is the first-order affine warp model that allows translation, rotation, shear transformation. In LSM, considering the linear radiometric difference, the relationship between two patches in the reference image and template image can be expressed by:
r ( x , y ) = k 1 t ( a 0 + a 1 x + a 2 y , b 0 + b 1 x + b 2 y ) + k 2 + n ( x , y ) ,
where ( a 0 , a 1 , a 2 , b 0 , b 1 , b 2 ) are the unknown parameters of the affine warp model, ( k 1 , k 2 ) control the contrast and brightness differences, and n ( x , y ) denotes the random noise. After linearization with a first-order Taylor series, the residual function is given by:
V = C X L ,
where X = [ d a 0 , d a 1 , d a 2 , d b 0 , d b 1 , d b 2 , d k 1 , d k 2 ] T is the incremental parameter vector. C is a Jacobian or coefficient matrix that records the partial derivatives to each unknown parameter. L = k 01 t ( a 00 + a 01 x + a 02 y , b 00 + b 01 x + b 02 y ) + k 02 r ( x , y ) is the observation term. The parameter vector can be solved using least-squares adjustment iteratively by updating the parameters until reaching a certain termination criterion [61].
Alternatively, for the parameter vector p = [ a 0 , a 1 , a 2 , b 0 , b 1 , b 2 ] T that also considers the first-order mapping function, we can solve it by directly optimizing the similarity measure, such as the ZNSSD in Equation (3). The solution using the iterative Newton–Raphson algorithm can be written as [22]:
p = p 0 C ( p 0 ) C ( p 0 ) ,
where p 0 is the initial values of the parameter vector, C ( p 0 ) is the gradients of similarity function, and C ( p 0 ) is the second-order derivatives of similarity function, commonly called the Hessian matrix. In addition to this forward additive scheme, a more computational efficient inverse compositional scheme that avoids the redundant computation of the Hessian matrix in each iteration can be adopted [60,62].
Global methods pose the dense matching problem as the minimization of a global energy function that is normally formulated as the weighted sum of two terms [23]:
E g l o b a l ( w ) = Ω E d a t a ( x , y , w ) + λ E r e g ( x , y , w ) d x d y ,
where Ω denotes the entire image domain, w is the transformation function, E d a t a is the data term that defines the total matching error involving similarity measures, E r e g is the regularization term that provides the smoothness constraints in the homogeneous region while preserves the discontinuities at the boundaries, and λ is a parameter controlling the balance between two terms. The commonly used regularization models include spatial gradient constraint and non-local regularization [3]. This variational framework can be solved using the continuous optimization algorithms, such as Euler–Lagrange equations-based solutions and proximal splitting [23].
With regard to the similarity measure of PC, subpixel displacements can be recovered in the frequency domain by explicitly finding the best approximation to the phase difference without the inverse Fourier transform process. According to the translation property of Fourier transform and the Euler’s formula, the phase difference between two patches that is the phase angle of the normalized cross-power spectrum Q in Equation (4) can be expressed by:
φ ( u , v ) = Q ( u , v ) = ( u m 0 + v n 0 ) .
This implies that the phase difference represents a 2-D plane in the Cartesian coordinates of m-n with the slopes determined by displacements. Furthermore, the normalized cross-power spectrum matrix is theoretically a rank-one matrix as it is separable. Therefore, the subpixel displacements can be estimated by line fitting of the phase difference after low-rank approximation [63].
Another natural way to retrieve subpixel displacement from the normalized cross-power spectrum is to directly compare the computed one Q ( u , v ) with the theoretical one exp ( i ( u m 0 + v n 0 ) ) . For instance, in order to minimize the Frobenius norm of the weighted difference matrix, the objective function is formulated as [7]:
ϕ ( m 0 , n 0 ) = u = π π v = π π W ( u , v ) | Q ( u , v ) exp ( i ( u m 0 + v n 0 ) ) | 2 ,
where W ( u , v ) is a frequency weighting matrix and can be defined according to the magnitudes of cross-power spectrum [7]. The subpixel displacements (m0, n0) are solved by minimizing ϕ using a gradient descent algorithm.

3. Experimental Details

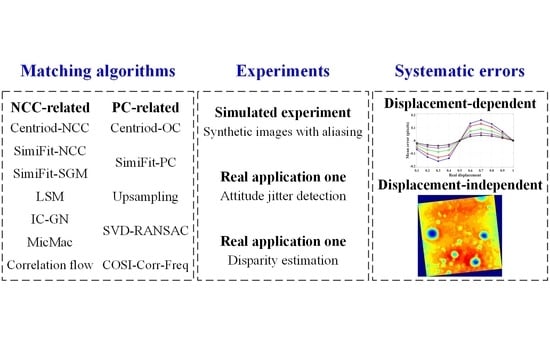
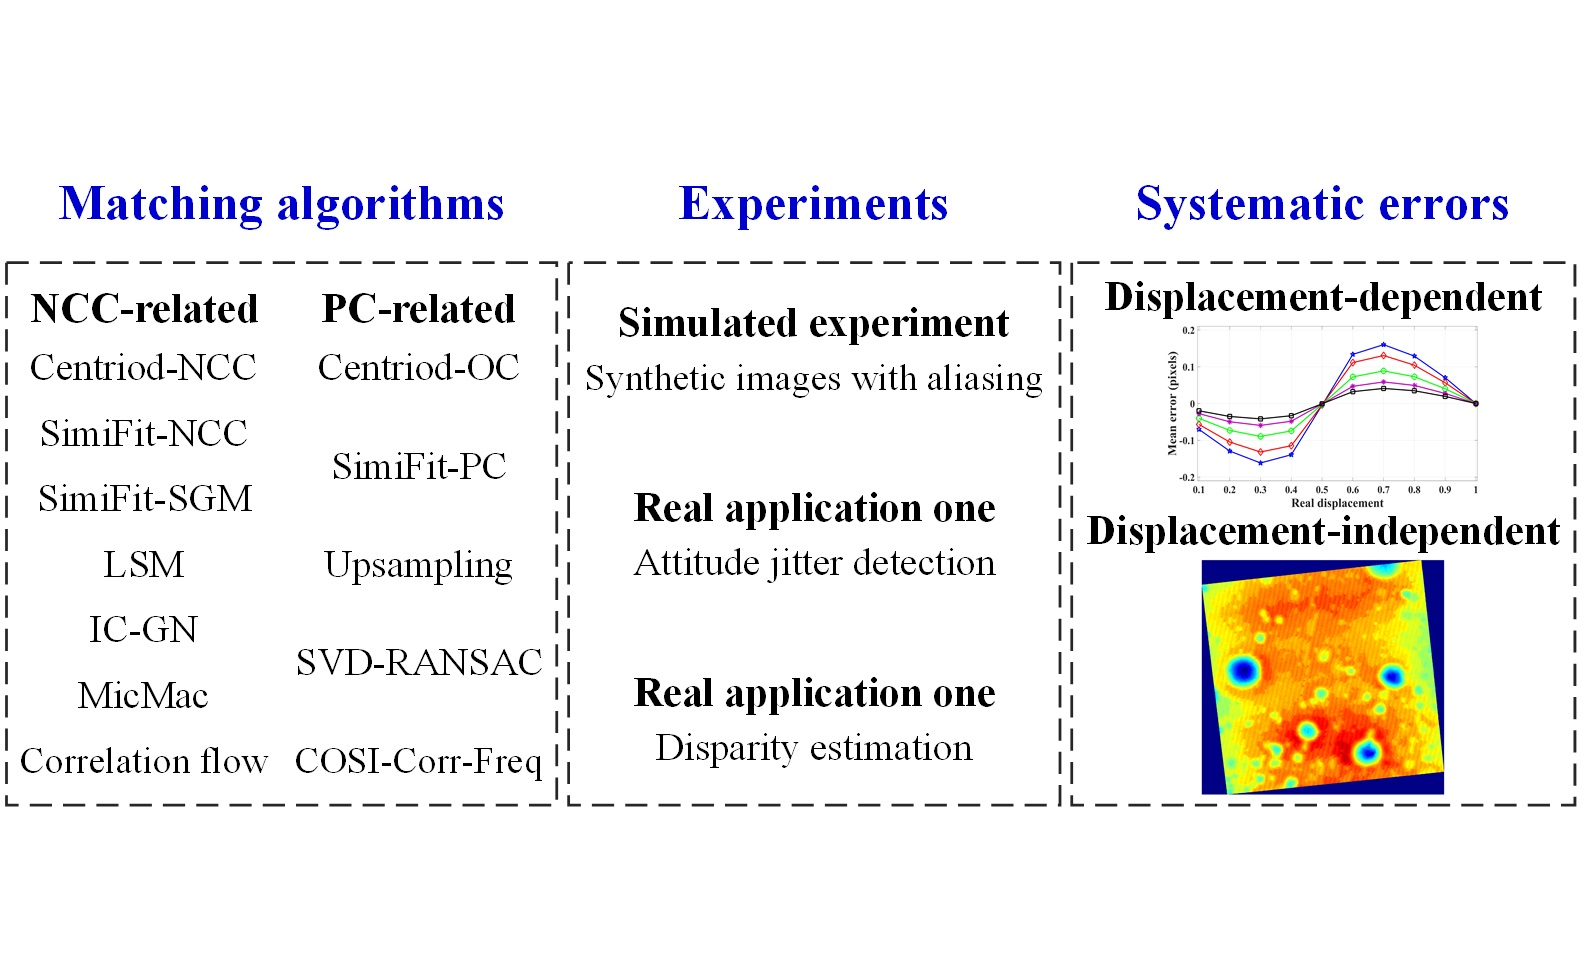
3.1. Algorithmic Implementations

In this paper, there were a total of twelve dense matching algorithms with subpixel accuracy for conducting the practical analysis and comparative study, as shown in Table 1. Among them, seven ones adopts the NCC-related similarity measure, and five ones adopts the PC-related similarity measure. The implementation details of these algorithms are described as follows.
(1)
Centroid-NCC. This algorithm calculated the correlation function within the search range using NCC and estimated the subpixel displacements using Equation (5) in a 5 × 5 neighborhood around the initial peak for each matching position. The correlation values below the mean value were not considered. The implementation in the ImGRAFT toolbox [41] was used in this study.
(2)
SimiFit-NCC. This algorithm estimated the subpixel displacements for each matching position by fitting the NCC correlation values to a quadratic curve in x and y direction independently. The implementation in COSI-Corr [7] called “statistic correlator” was used.
(3)
SimiFit-SGM. This algorithm also utilized quadratic function fitting, while the fitting object was the matching costs of a global discrete optimization algorithm instead. The implementation in the Ames Stereo Pipeline (ASP) [42] was used. The dense matching was implemented using a two-stage coarse-to-fine process. The costs were calculated using a variant of semi-global matching [25], which was extended to a 2-D disparity search and to update the costs using the information from more directions that could reduce the streaking artifacts [64].
(4)
LSM. This algorithm iteratively updated the 8-parameters vector by solving Equation (11) via least-squares adjustment until the new NCC value would not increase. The initial displacements were provided by the conventional NCC matching.
(5)
IC-GN. This algorithm directly optimized the ZNSSD similarity measure between two patches and solved the parameters of first-order mapping function by the iterative Gauss–Newton algorithm. The ZNSSD similarity measure was related to NCC according to Equation (3). An inverse compositional scheme with higher computational efficiency and robustness was employed, which iteratively solved for an incremental warp rather than an additive update to the parameter vector, and inverted the roles of the reference image and template image [60]. The implementation in Ncorr [43] was used. A reliability-guided strategy was adopted to guide the correlation and provide initial guesses for the following positions [65].
(6)
MicMac. The 2-D dense image matching algorithm implemented in MicMac calculated displacements for every position defined by the discretization step and intensity interpolation [27]. With the subpixel step, this algorithm optimized an energy function, including data term and regularization term, using multi-directional dynamic programming [66]. The data term was constructed using non-linear matching costs based on NCC.
(7)
Correlation flow. This is an optical flow algorithm that solves a global energy function in the form of Equation (13) [44]. In order to overcome the difficulty in integrating NCC in this variational framework, a correlation transform was separately performed on each image according to the relationship in Equation (3), and the data term was computed as the sum of squared differences between the correlation transforms. The variational framework employed a non-local regularization term and was optimized based on the projected-proximal-point algorithm in a coarse-to-fine warping strategy [44].
(8)
Centroid-OC. This algorithm is similar to Centroid-NCC but employed OC [67] that is a PC-related similarity measure. OC can be regarded as a different type of normalization compared to PC, which performs cross-correlation in the frequency domain on the complex orientation images calculated from the orientation of intensity gradient.
(9)
SimiFit-PC. According to the 1-D peak fitting model in Equation (8), this algorithm found the subpixel peak locations of PC correlation function from multiple tri-tuples consisting of the initial peak and its corresponding surrounding points, without the need of iteration [45]. A low-pass Gaussian function was additionally used on the normalized cross-power spectrum for spectral weighting.
(10)
Upsampling. This algorithm directly resampled the PC similarity values to a higher resolution based on the matrix-multiplication implementation of discrete Fourier transform [20], as shown in Equation (9). A 1.5 × 1.5 pixels local neighborhood around the initial peak was upsampled with a factor of 200.
(11)
SVD-RANSAC. This algorithm estimated the subpixel displacements from the phase angle of domain singular vectors of normalized cross-power spectrum matrix by robust line fitting using a unified random sample consensus algorithm [46]. The frequency masking and a fringe filter with a size of 5 × 5 pixels were additionally applied to improve the robustness.
(12)
COSI-Corr-Freq. The implementation of “frequency correlator” in COSI-Corr [7] estimated the subpixel displacements by minimizing Equation (15) using the two-point step size algorithm with the initial values from peak centroid. The frequency weighting matrix was adaptively determined based on the magnitude of normalized log-spectrum, and the correlation was iterated five times with the normalized cross-power spectrum matrix and the frequency weighting matrix adjusted in each iteration.
The other parameter settings of these algorithms followed the recommended defaults in the original papers. The patch size for calculating similarity measure between the corresponding patches in subpixel matching was fixed in all experiments. For spatial image correlation algorithms, a patch size of 25 × 25 pixels was chosen. For matching algorithms with PC-related similarity measure, the use of an additional window function prior to Fourier transform to attenuate the edge effects makes the actual effective patch narrower, a slightly larger patch size of 32 × 32 pixels was thus chosen. For matching algorithms with regularization (SimiFit-SGM, MicMac, Correlation flow), a smaller patch size (e.g., 7 × 7 pixels) was more suitable.

3.2. Experimental Settings

In this study, the matching performance and robustness to systematic errors of the above twelve subpixel algorithms were quantitatively compared in a simulated experiment with known ground truth and qualitatively investigated using two real remote sensing applications.

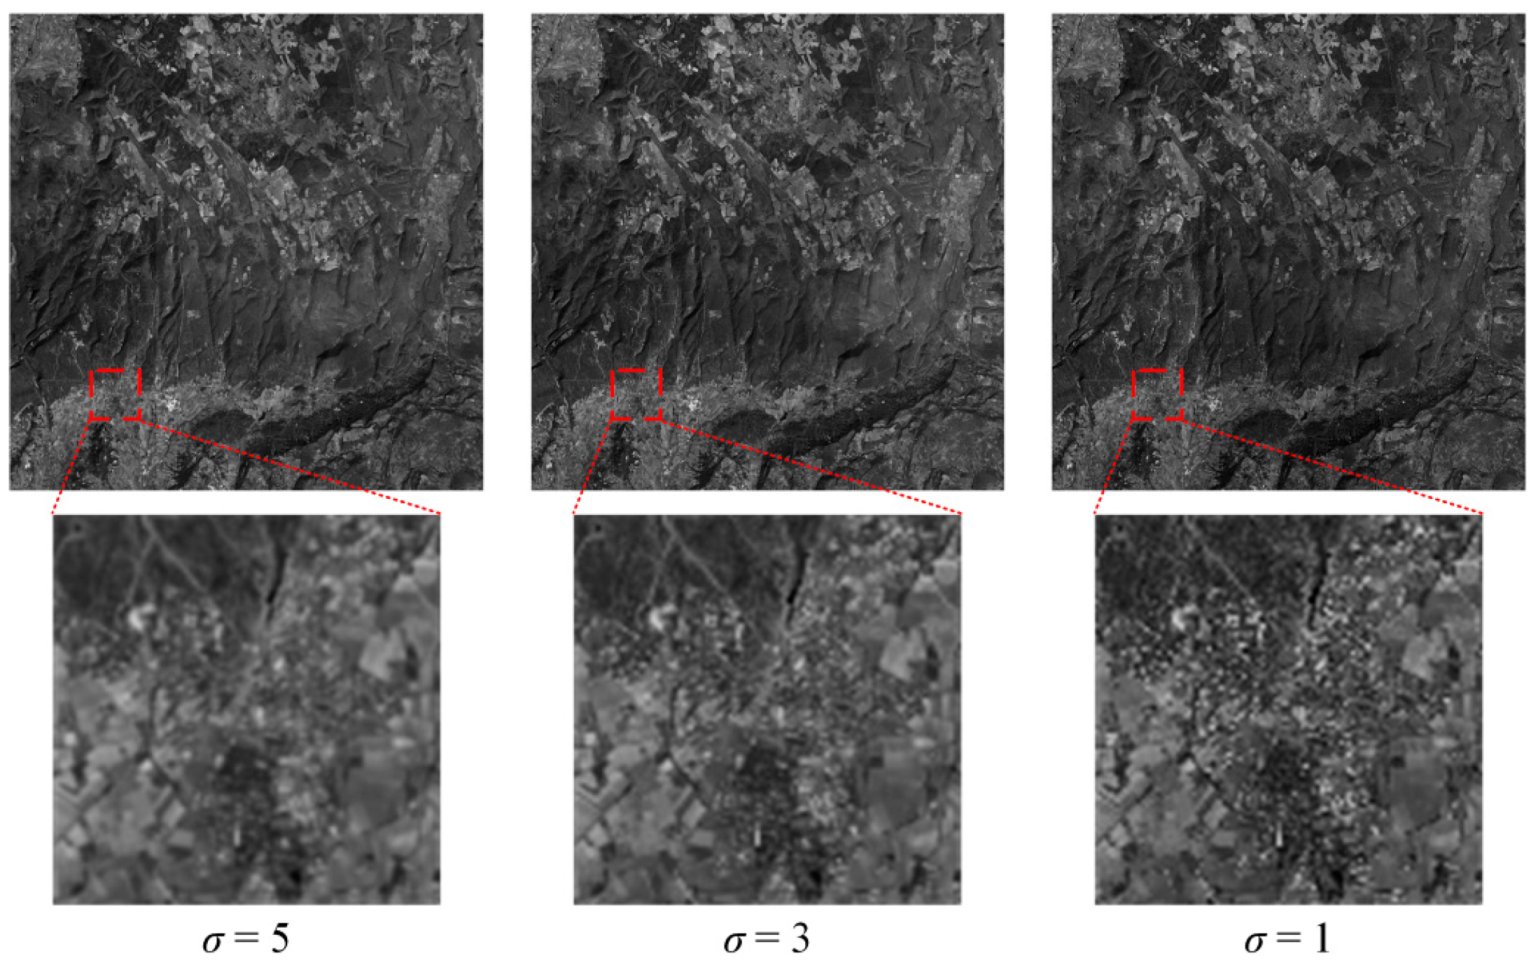
3.2.1. Simulated Experiment

To evaluate the subpixel accuracy of different matching algorithms, the synthetic image pairs in the simulated experiment were produced with the ground truth from a single real high-resolution satellite image. The subpixel displacements were generated by low-pass filtering and downsampling [46]. We applied an integer displacement S to the high-resolution image and downsampled the original and translated images by a factor of M. The relative displacement between the downsampled image pair became a fractional value of S/M. In this study, the horizontal integer displacements Sx were ranged from 1 to 10 pixels with an increment of 1 pixel, the vertical displacement Sy was fixed at 10 pixels, and the downsampling factor was set as 10. To conform to the real radiometric conditions, we also introduced systematic radiometric differences to the reference image that were modeled as a linear model with gain and offset [13]. The gain and offset parameters were randomly generated for each subset in a 3 × 3 grid. In addition, aliasing that occurs if images are not spatially band-limited and is common with satellite systems was considered. To control the amount of aliasing, a low-pass Gaussian filter with a standard deviation of σ was applied prior to downsampling [68]. The standard deviation σ varied from 1 to 5 in a step of 1. Totally 50 synthetic image pairs with sizes of 1000 × 1000 pixels were, therefore, generated.
The adopted high-resolution satellite image was a ZiYuan-3 panchromatic image with a resolution of 2.1 m and a quantization level of 10 bits. Figure 2 shows the sample reference images generated with different standard deviations of the Gaussian filter. It could be seen from the enlarged subsets that the amount of aliasing was decreased, and the image became smoother with the increasing value of σ. In the simulated experiment, the postprocessing stage only removed the mismatches whose biases exceeded the predefined threshold. The matching errors of different algorithms were then calculated between the derived displacements and actual displacements, and the performance of dense matching was assessed in terms of mean value and standard deviation of the error vector for each image pair.

3.2.2. Real Application One: Attitude Jitter Detection

Attitude jitter refers to periodic instability of satellite attitude. This subtle attitude variation can be transmitted to imaging sensors and result in image distortions. Attitude jitter can thus be effectively detected and estimated from short-time asynchronous image data [69]. In this process, the accuracy of dense image matching to retrieve the image distortions caused by attitude jitter is crucial. Here, we pixel-to-pixel matched different multispectral bands with a resolution of 5.8 m from the ZiYuan-3 satellite. The Ziyuan-3 multispectral sensor provided four spectral bands (blue, green, red, and near-infrared). For simplicity, the first two bands (blue and green) were used in this study. The derived displacements resulted from attitude jitter, which have been demonstrated to appear as an approximate sinusoidal model with an amplitude of fractional pixels [70]. Therefore, dense matching in attitude jitter detection of the ZiYuan-3 satellite is a reasonable choice for the practical study of different subpixel matching algorithm and possible systematic errors. Figure 3 gives the first band of the multispectral image used in this study. The coarse co-registration in the preprocessing stage was realized based on the designed distance between two bands on the focal plane. Since attitude jitter varied with time, and the ZiYuan-3 multispectral image was acquired by a push-broom sensor, the image distortion caused by attitude jitter in the same image line should be constant. Therefore, outliers in the results of dense matching were filtered based on the statistics within the image line. The false displacements that differed from the mean value beyond three times the standard deviation in each line were removed. Finally, the 1-D median filter was separately applied in every line for x- and y-displacement maps.

3.2.3. Real Application Two: Disparity Estimation

Another application scenario to evaluate the performance of different dense matching algorithms in this study is disparity estimation, which is an essential step for 3-D reconstruction and digital elevation model generation [47]. Here, we applied two subsets of engineering data record images from the narrow-angle camera (NAC) of NASA’s lunar reconnaissance orbiter camera (LROC) [71] to extract topographic information. The stereo image pair was acquired from two adjacent orbits with a temporal interval of about 2 h and captured the same area around the landing site of Apollo 17, the left image of which is shown in Figure 4a. The convergence angle for this image set was 12.2°, and the ground sampling distance was approximately 1.4 m. As shown in Figure 4b, we preprocessed the image pair using affine epipolar transformation in ASP [42] to roughly align two images. After matching the rectified images using different algorithms, the outliers in disparity maps were filtered, depending on the neighboring disparities [13]. The poor correspondences whose disparities deviated more than a certain threshold from the 5 × 5 mean filtered results were removed, and the disparity maps were finally refined using a 3 × 3 median filter.

4. Experimental Results and Discussion

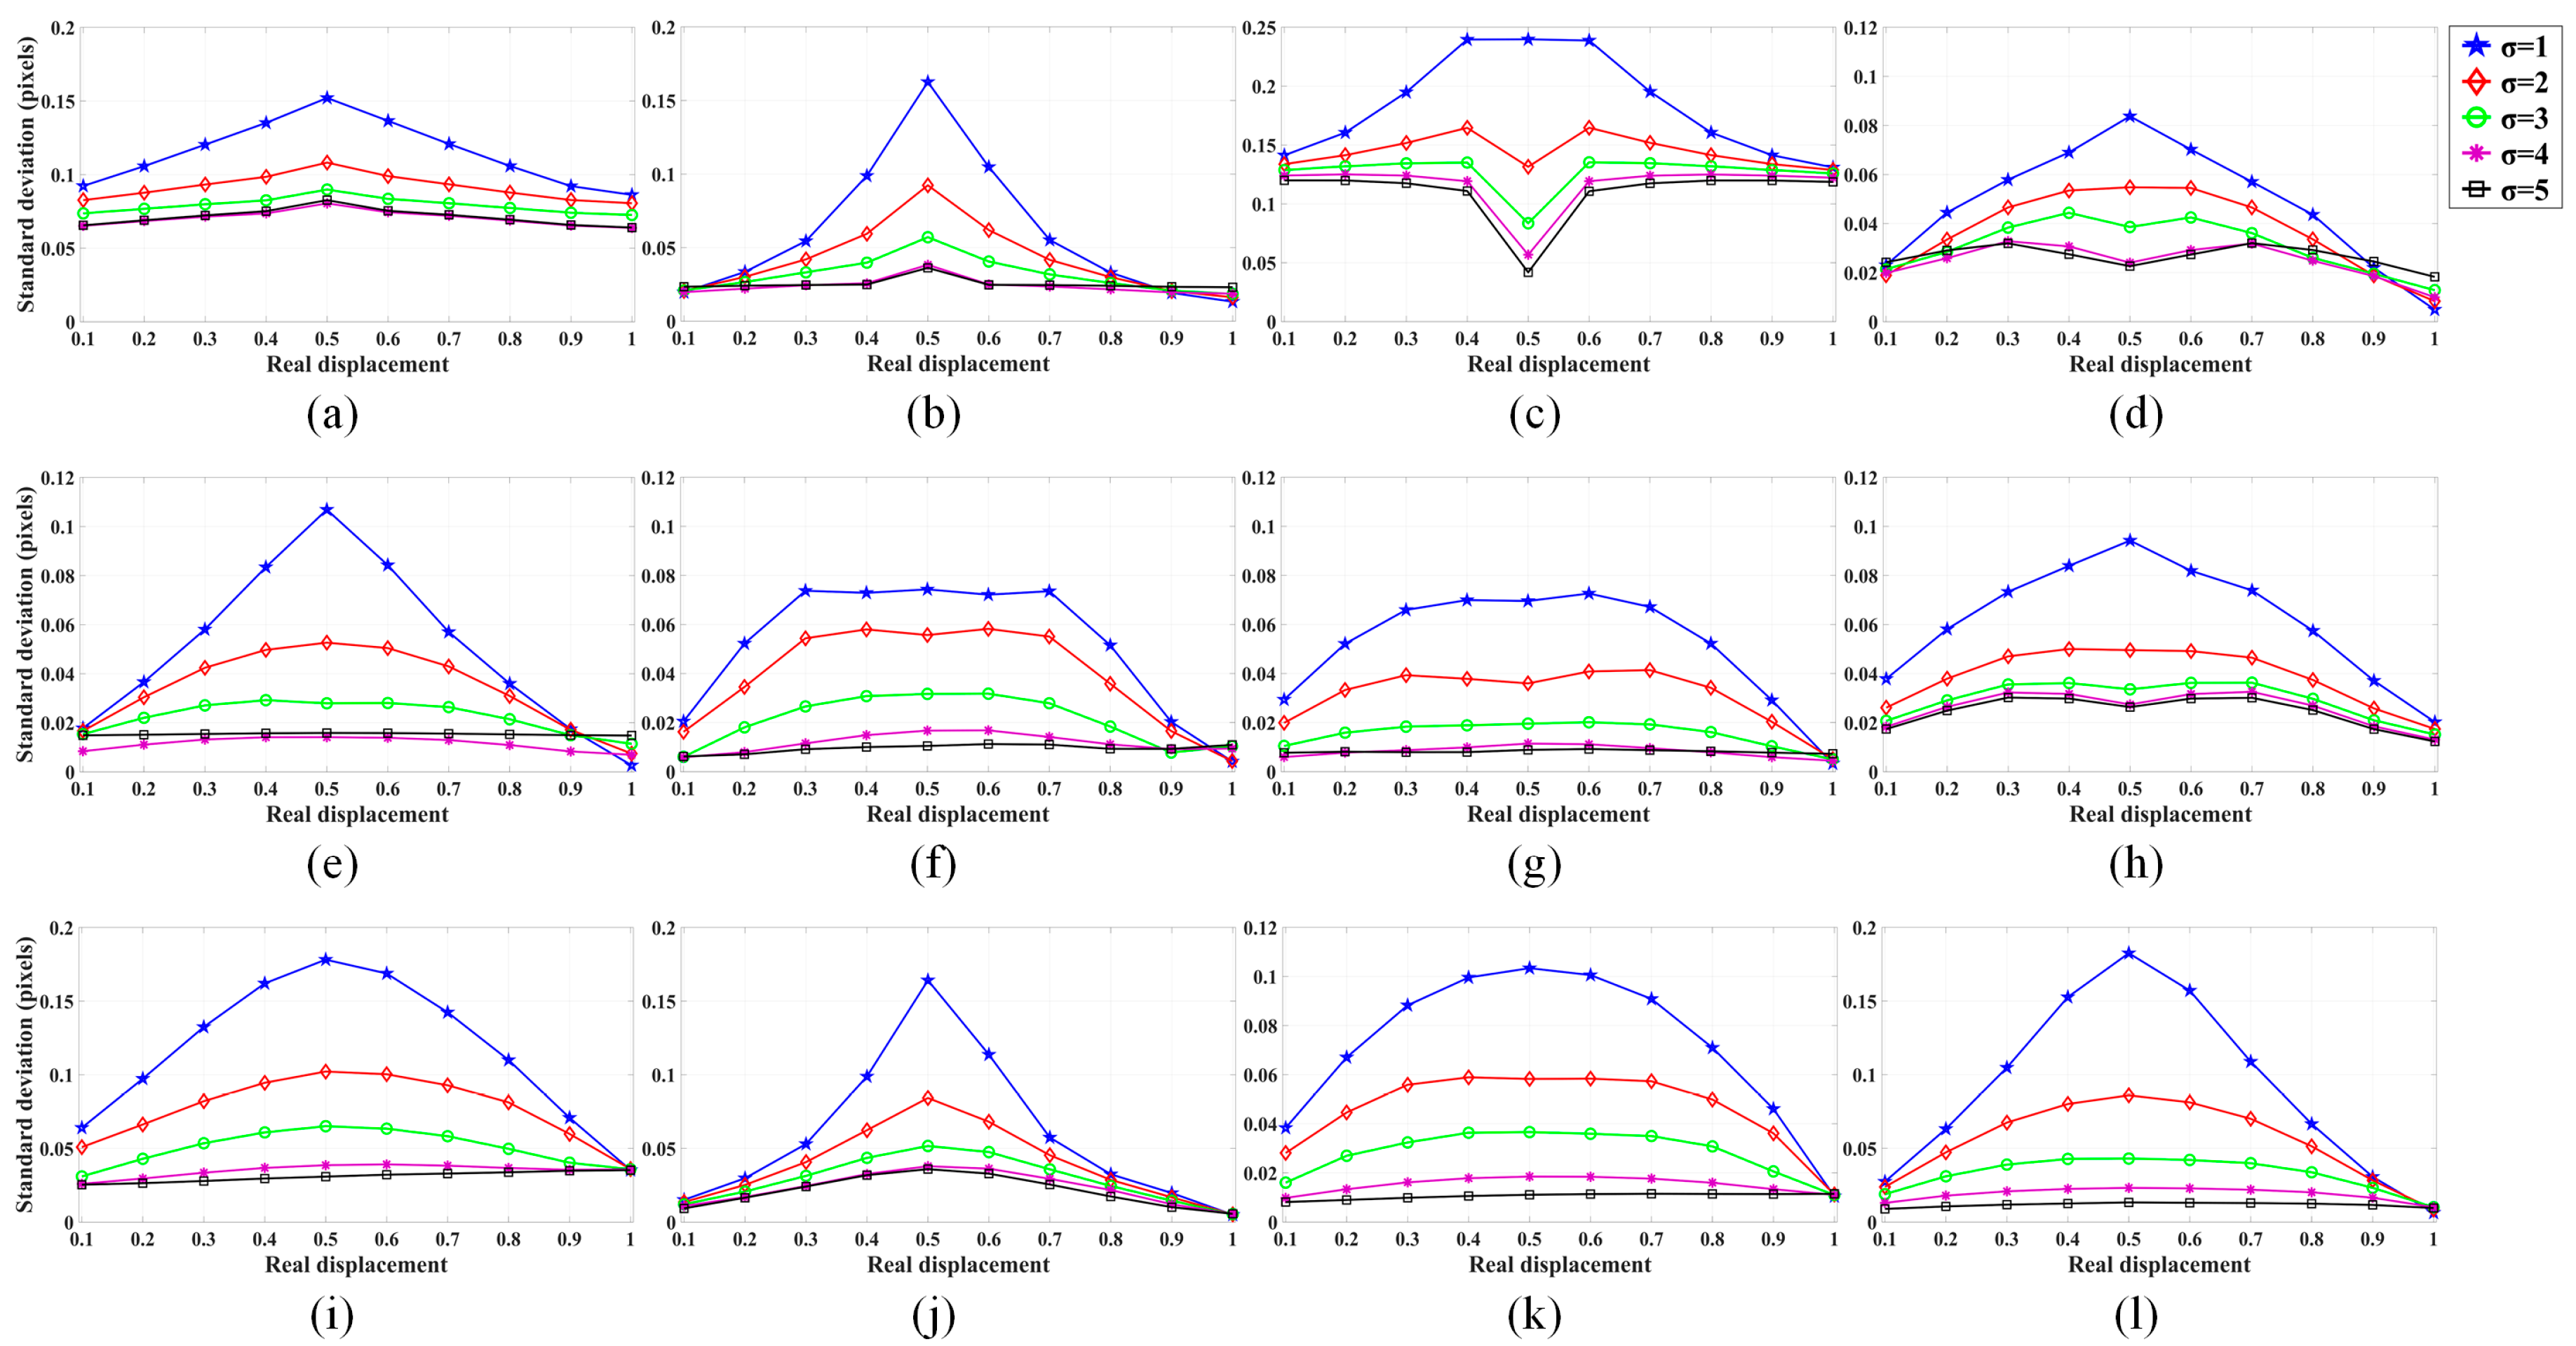
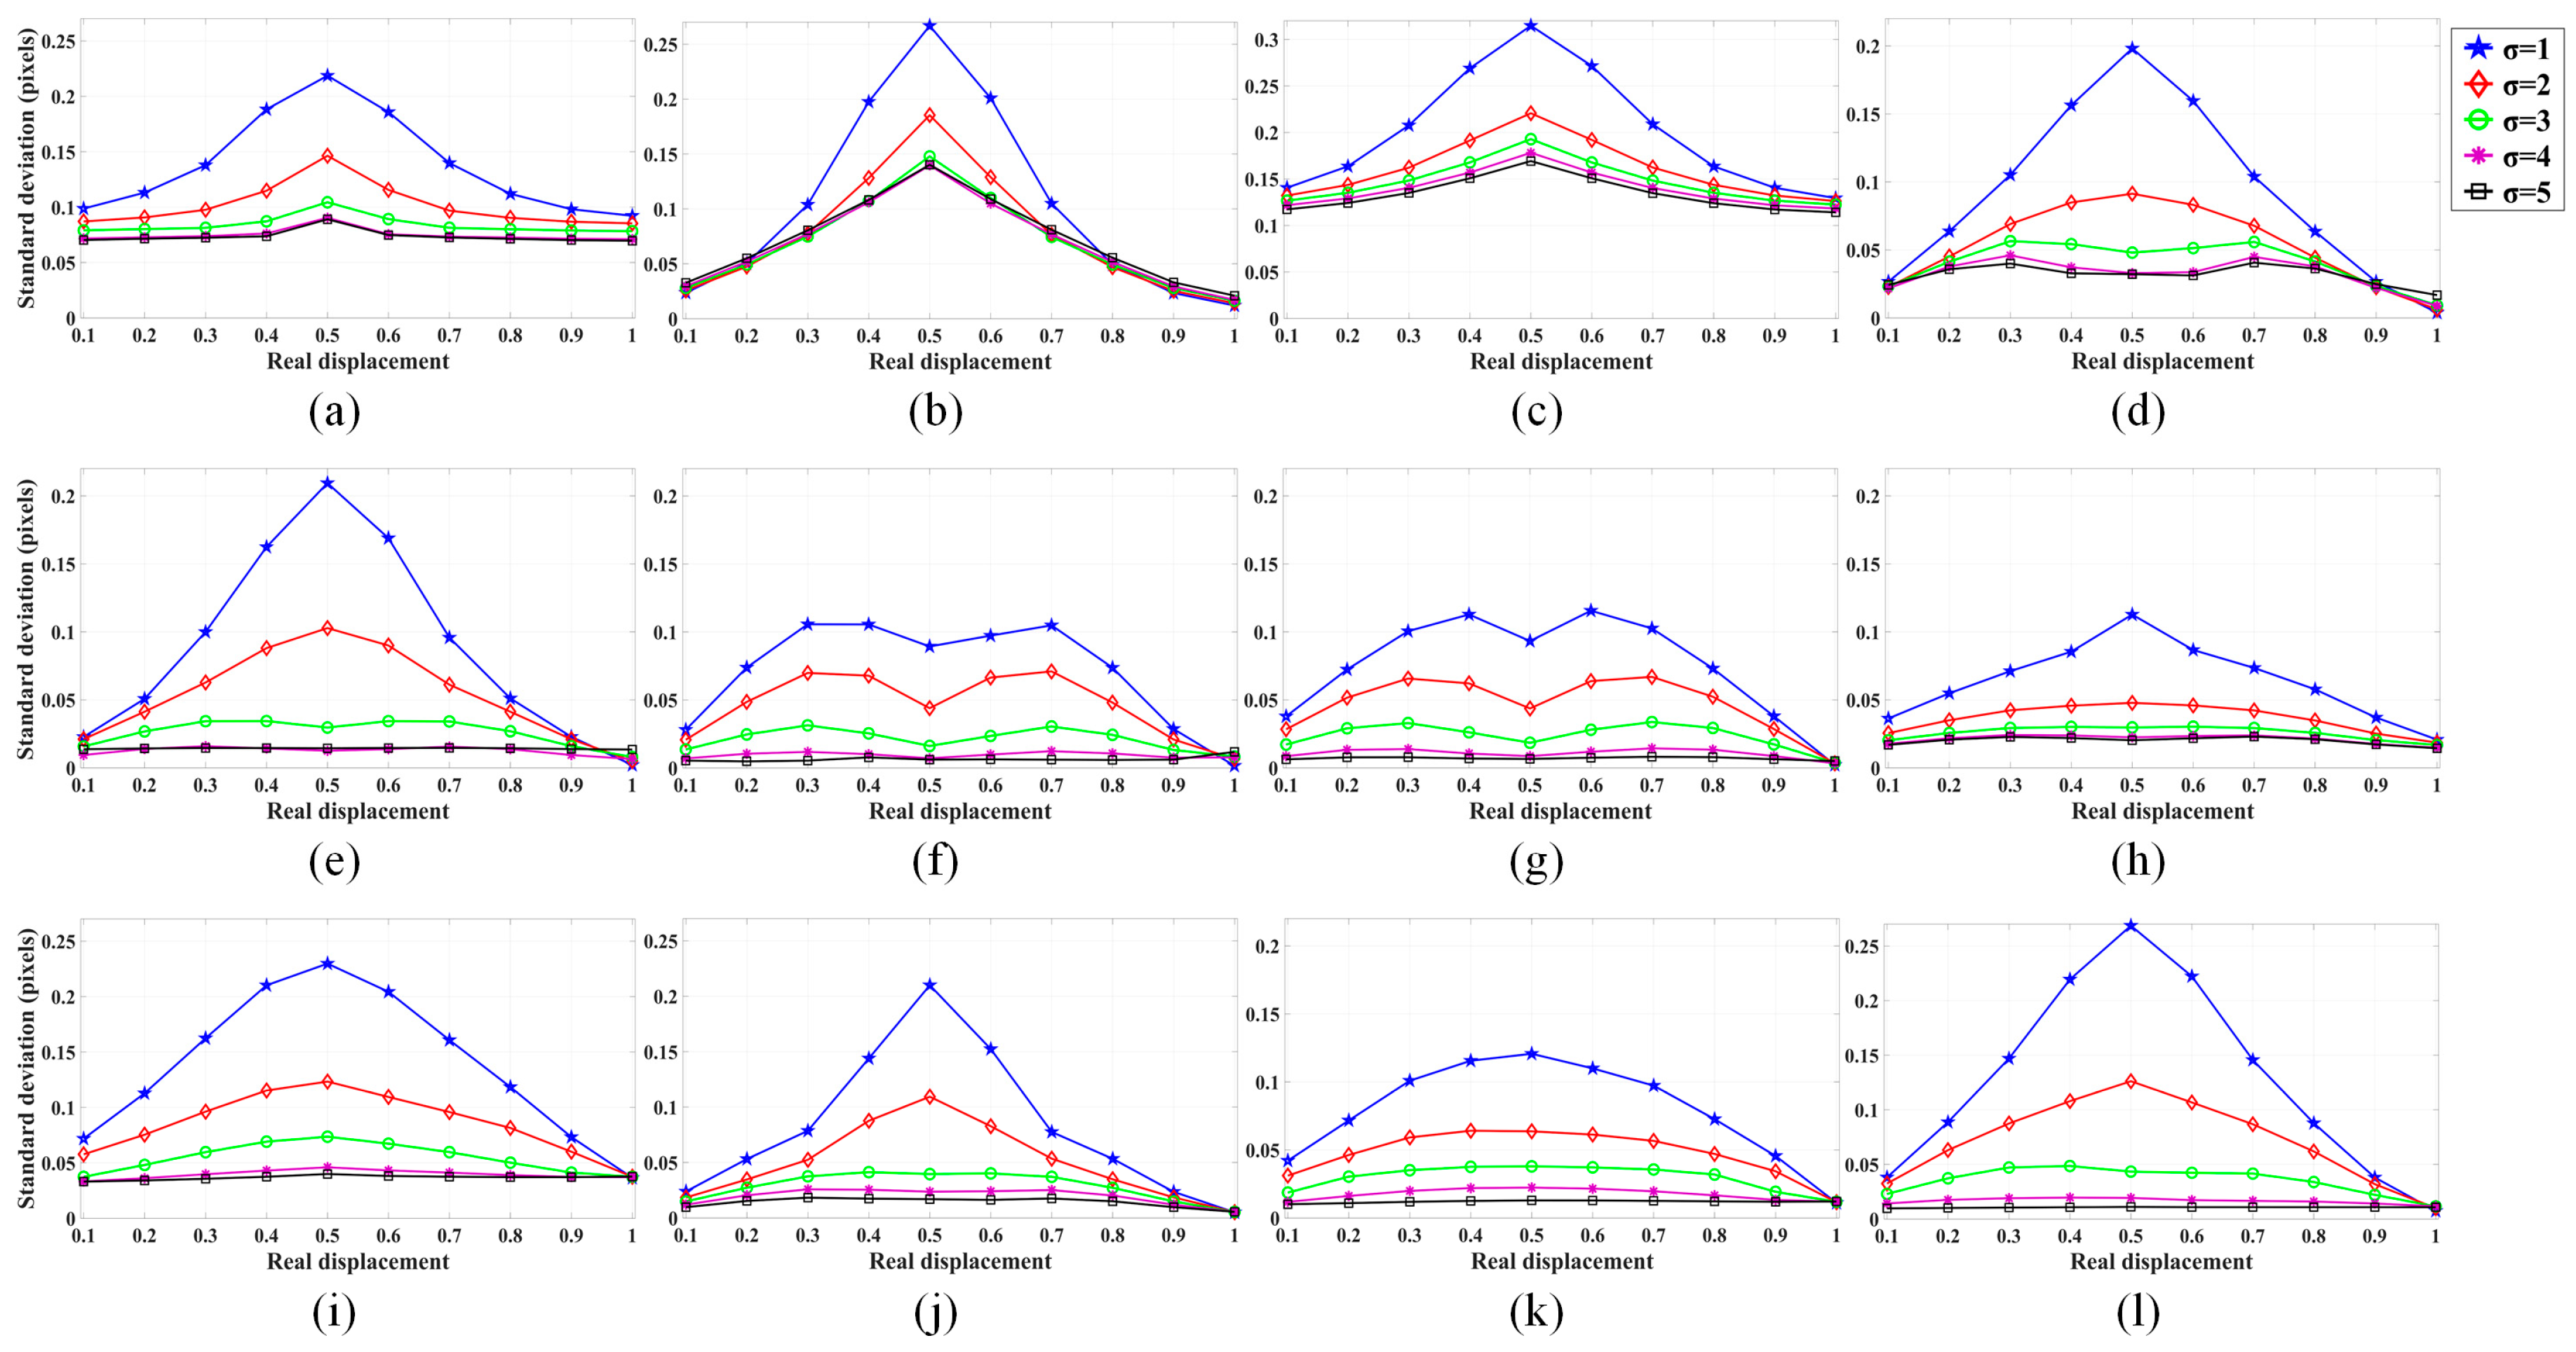
4.1. Results of Simulated Experiment

The mean value and standard deviation of the absolute error vector as a function of σ calculated from different matching algorithms are shown in Figure 5. For each algorithm and each value of σ, there were 10 million matching measurements in total. For better visualization, we illustrated the subpixel algorithms based on NCC-related and PC-related similarity measures separately.
As could be seen, all the algorithms can generate the results with mean absolute error and standard deviation less than 0.2 pixels, which demonstrated the subpixel capability of these matching algorithms in the presence of aliasing. It was evident that the matching errors for most algorithms presented an overall descending trend with the rising of σ, so as the standard deviations. The common trends indicate that the performance of subpixel matching becomes worse with the increased amount of aliasing. For the algorithms using NCC-related similarity measure, Correlation flow yielded better results in the case of large amounts of aliasing, and IC-GN and MicMac achieved the minimum errors when σ > 3. For the algorithms using PC-related similarity measure, the centroid method provided better results in the case of large amounts of aliasing, and SVD-RANSAC and COSI-Corr-Freq obtained the minimum errors when σ > 3. In contrast, SimiFit-SGM and Upsampling performed relatively worse in this simulated experiment. Similar conclusions can also be drawn from the standard deviation.
In order to investigate the detailed relationship between the matching performance and the real displacement, an error distribution analysis was further conducted for each matching algorithm and each value of σ. Since the relative displacements were designed to vary in the x-direction, we calculated the mean value and standard deviation of x-direction matching errors in each synthetic image pair with a certain horizontal subpixel displacement, as shown in Figure 6 and Figure 7, respectively.
It could be seen that the mean error and standard deviation curves of these twelve matching algorithms presented systematic trends with regard to subpixel displacements. The mean error curves revealed an S-shape trend with varying displacements. This implied the systematic errors, so-called pixel locking effect, depending on the matching algorithms and image characteristics [46,72]. The pixel locking effect refers to the phenomenon by which the estimated displacements tend to be biased toward discrete pixel values. Therefore, the matching errors show a periodic distribution within a pixel interval, in that the errors at approximate 0.5 pixels and integral pixel locations are relatively small, and the errors where displacements are larger than 0.5 pixels are positive values, while the errors where displacements were smaller than 0.5 pixels were negative values. With a decreasing value of σ, the incomplete sampling and aliasing become more serious, which is found to deteriorate the pixel locking effect. In addition, the degree of pixel locking effect for various matching algorithms was different. In the case of a smaller amount of aliasing (σ > 3), the degree of pixel locking effect for most matching algorithms was reduced considerably, while the algorithms still with relatively serious pixel locking effect included SimiFit-NCC, SimiFit-SGM, and Upsampling. Correlation flow presented the anti-pixel locking effect by which the estimated displacements inclined away integer values, and the sign of matching errors was reverse. The standard deviation curves appeared as a bell shape with varying displacements. In the distribution of standard deviation, the maximum value was obtained at approximately 0.5 pixels for most cases, especially in the case of a large amount of aliasing. The standard deviations at other positions increased with the distance to the nearest integer value and were symmetric with respect to 0.5 pixels. It is possible that the displacements around 0.5 pixels are biased toward two integer sides more randomly. The standard deviations of diverse matching algorithms also varied differently and grew with a larger amount of aliasing.
The real displacements in the y-direction were fixed to 1 pixel for every synthetic image pair in this experiment. It was, however, surprising that the varying displacements in the x-direction affected the matching results in another direction as well, particularly for standard deviations. Figure 8 shows the relationships between y-direction standard deviations and x-direction subpixel displacements for each matching algorithm. It is worth noting that the patterns of y-direction standard deviations were similar to ones in the x-direction, and the values of y-direction standard deviations were slightly larger than ones in the x-direction. The y-direction standard deviations also achieved maximum value around 0.5 pixels and were proportional to the distance between x-direction displacements and the nearest integer value. A larger amount of aliasing degraded the matching stability in the y-direction as well.

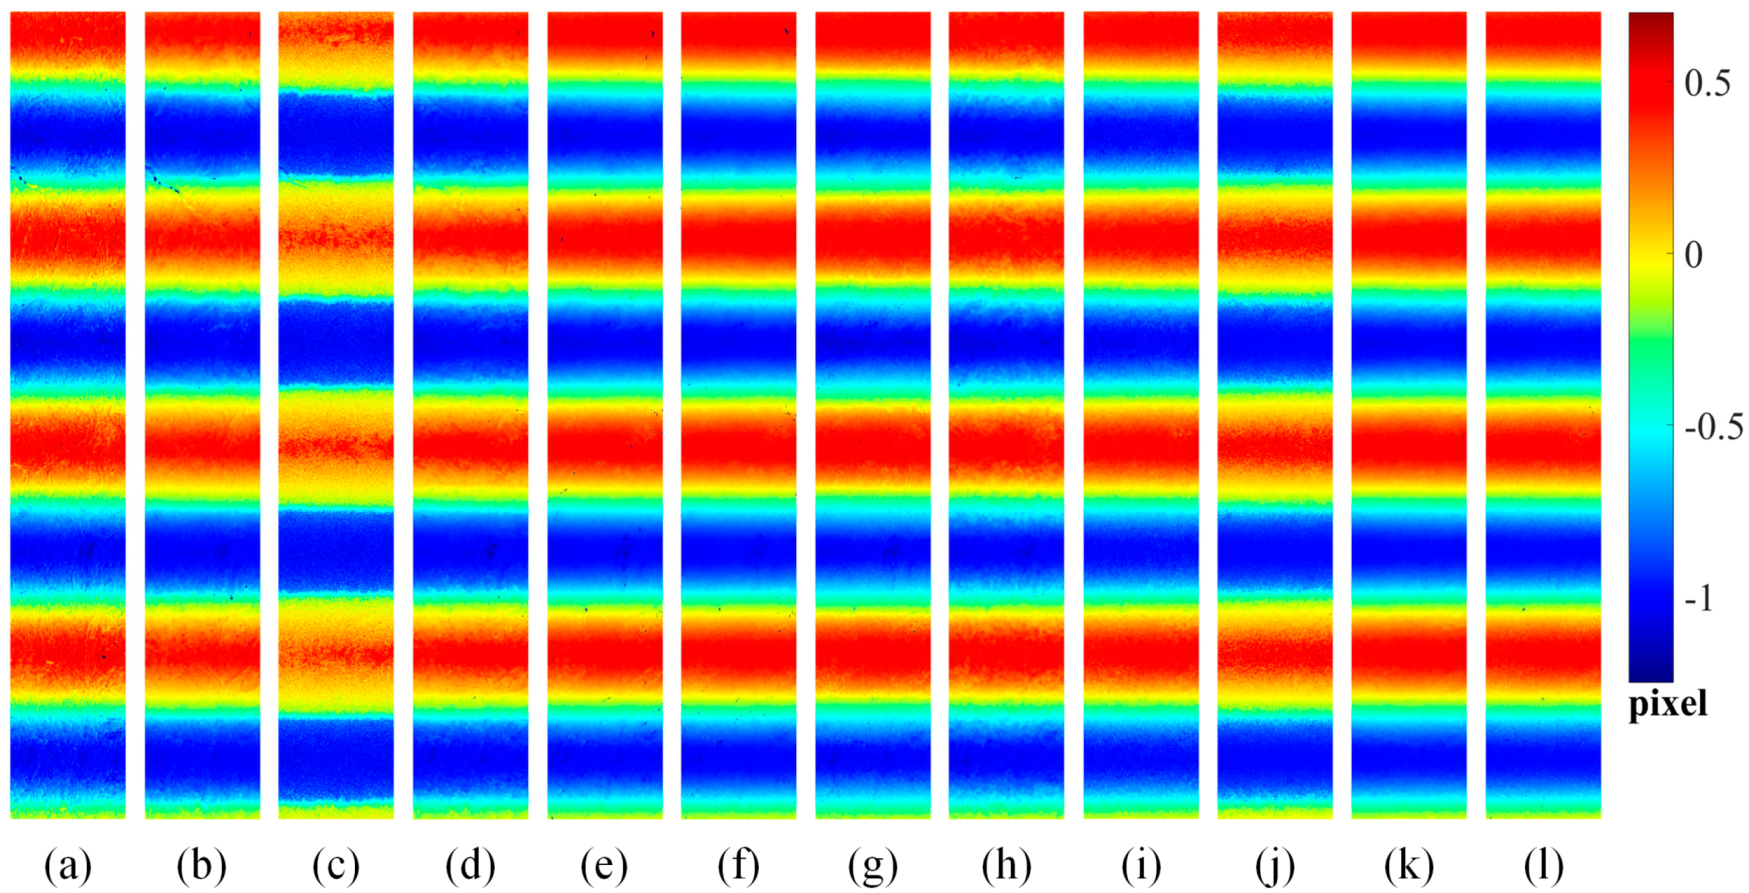
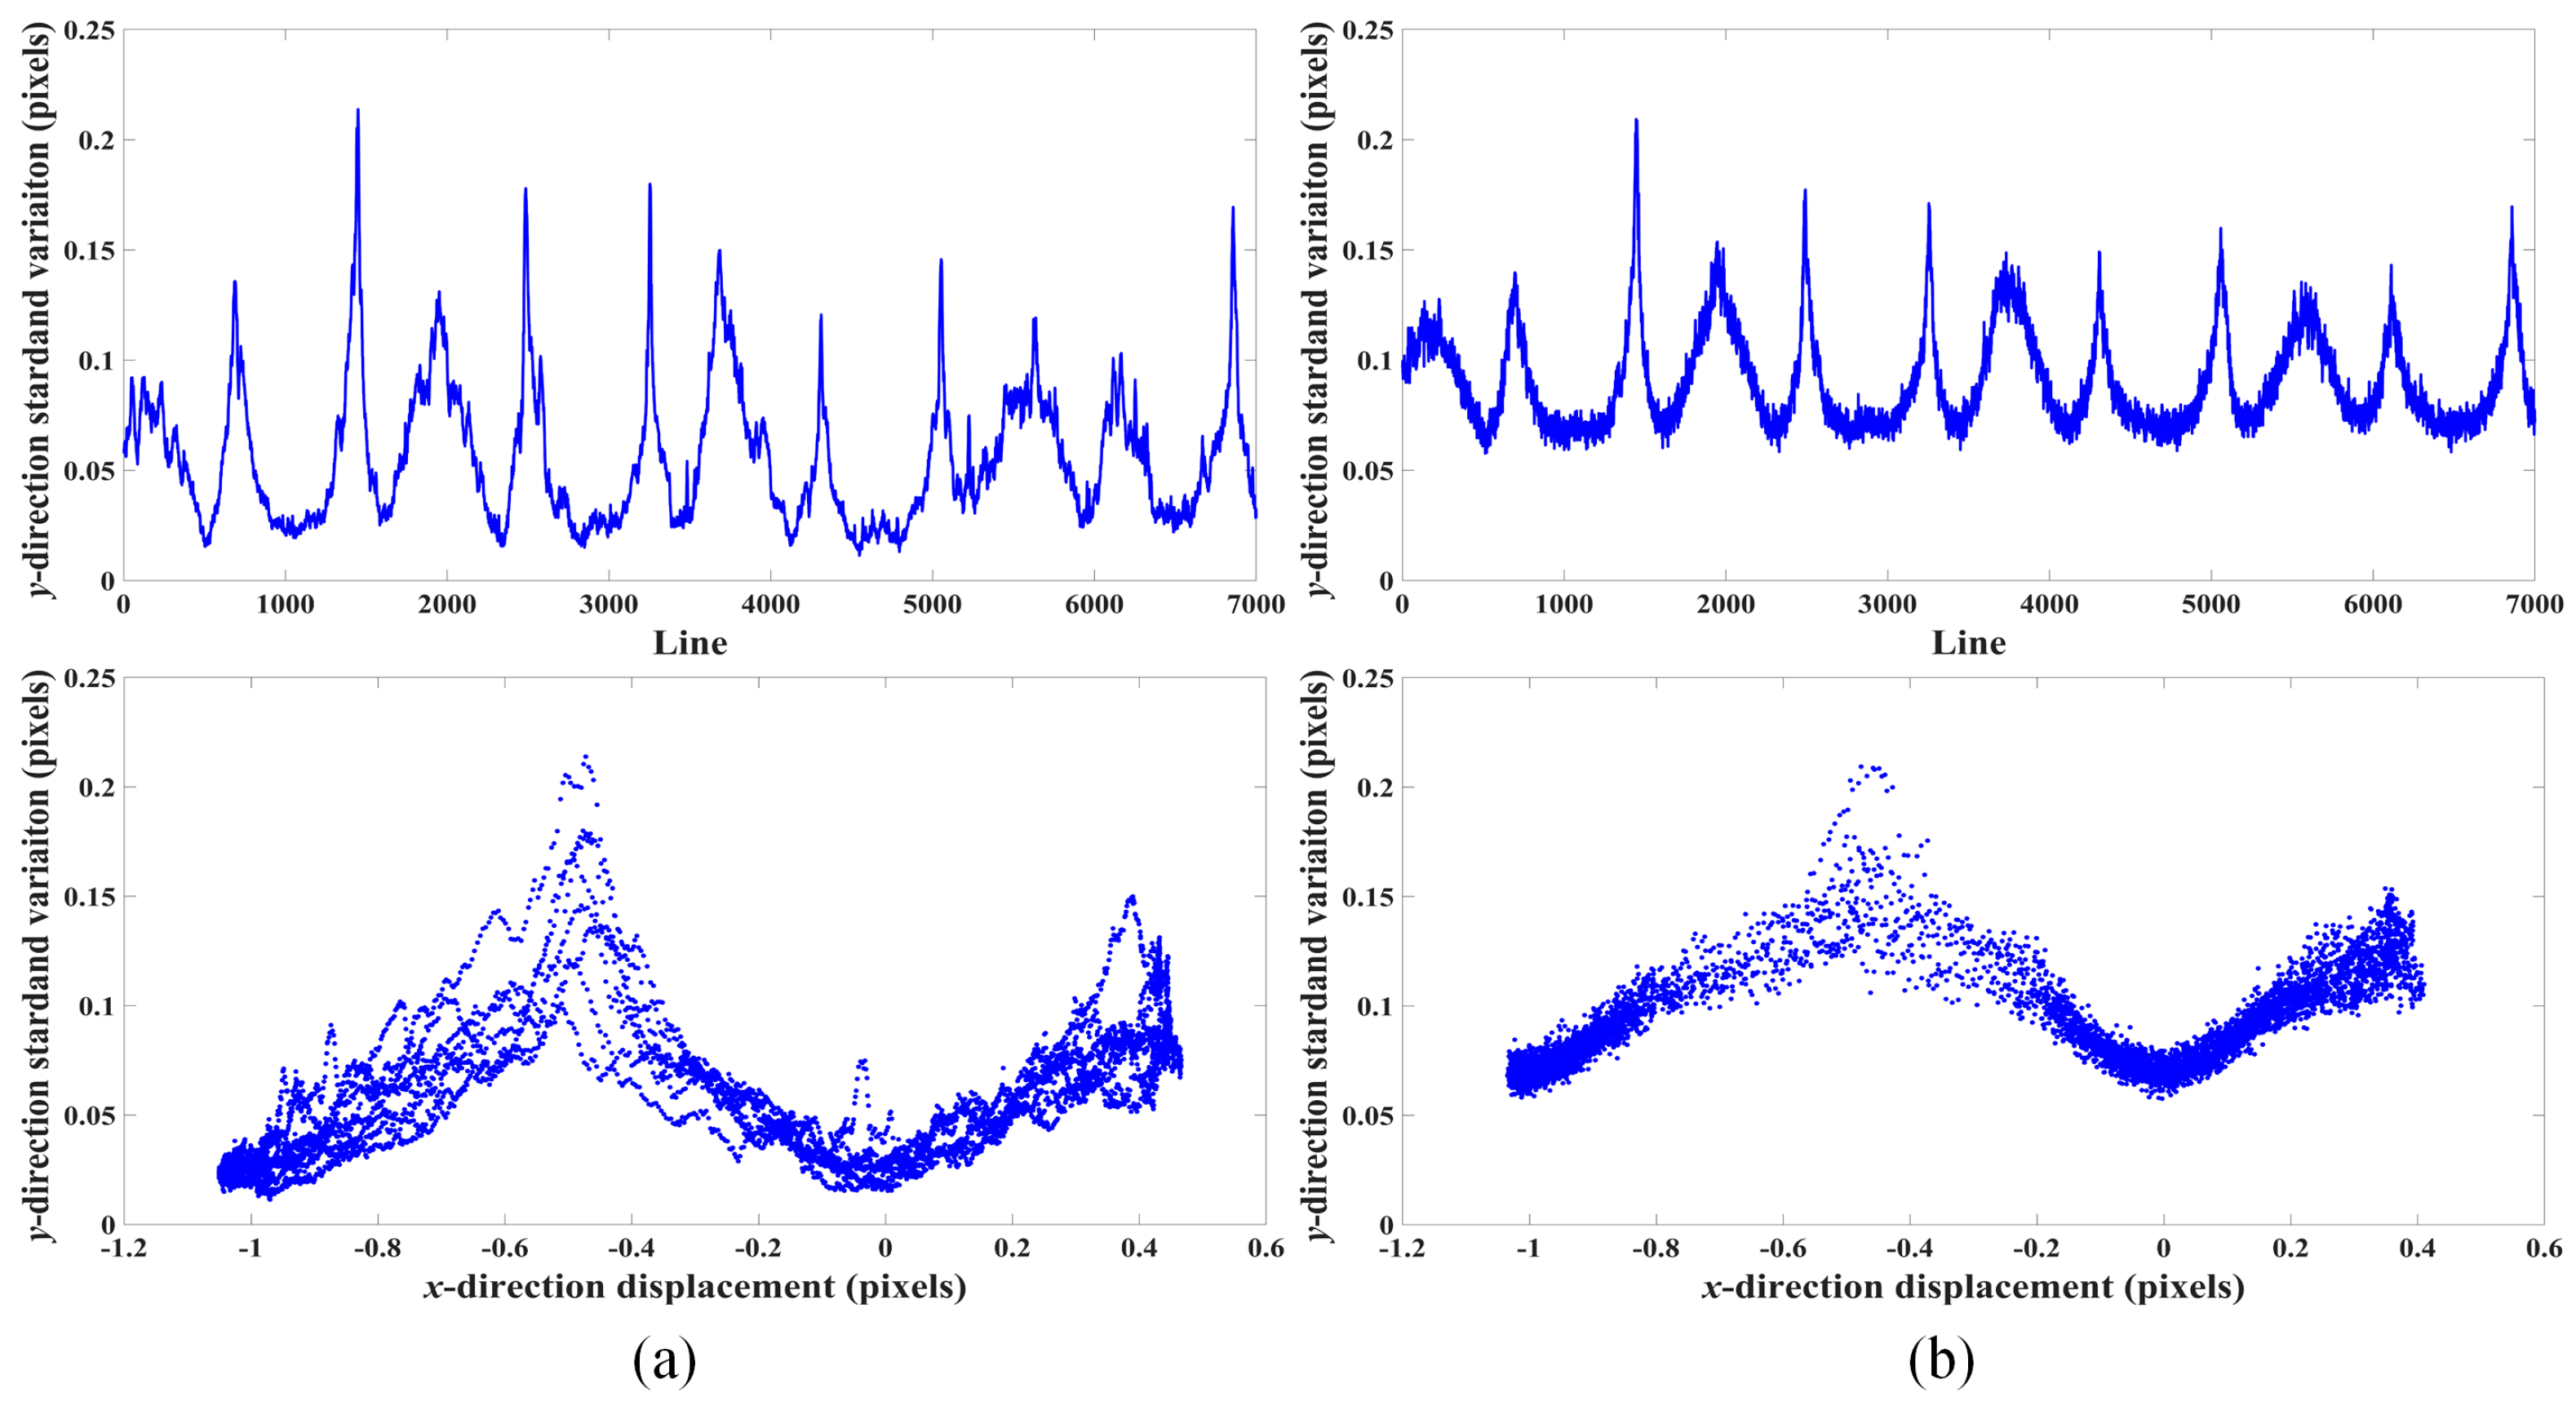
4.2. Results of Real Application One

After pixel-to-pixel matching the two multispectral band images, two filtered displacement maps were outputted from every matching algorithm, as shown in Figure 9 and Figure 10. The x-direction and y-direction displacements referred to the image distortions caused by attitude jitter of roll angle and pitch angle, respectively. The stripe pattern with a color variation of displacement maps demonstrated the existence of attitude jitter, which was dominant in roll angle. As shown in Figure 9, all the compared dense matching algorithms were able to capture this significant variation of image distortion in the x-direction, and few differences could be found by visual inspection of displacement maps. The displacement maps were rather regular, in which the interval of these stripes reflected the frequency, and the degree of color variation reflected the amplitude.
From the results in Figure 10, it was observed that the stripe patterns of y-direction displacement maps were less apparent since the amplitude of attitude jitter of pitch angle is relatively small, and the jitter distortion is contaminated by topographic information due to the short baseline [69]. The displacement maps obtained by Centroid-NCC and SimiFit-SGM were noisy, and the results from the SimiFit-NCC, SimiFit-SGM, LSM, and Upsampling seemed to appear some artifacts. In contrast, the displacement maps of other matching algorithms were visually similar to each other.
In order to more clearly compare the performance of different matching algorithms, the two-directional displacement maps were averaged by line as jitter distortions should be constant in each line. Figure 11 displays the averaged displacement curves in the x-direction. The results of most matching algorithms were found to agree well with each other and resemble a sinusoidal function with a regular frequency and values ranging from −1 to 0.5 pixels. Note that the results of SimiFit-NCC, SimiFit-SGM, LSM, and Upsampling suffered from the pixel-locking effect. Therefore, the displacement curves of these four algorithms accorded with others at the displacements of multiples of half and integral pixels and were convex at the displacements in the range of −0.5 to 0 pixels, while were concave at the displacements in the ranges of 0 to 0.5 and −1 to −0.5 pixels. In contrast, the result of Correlation flow presented a slight anti-pixel locking effect. In the y-direction, as shown in Figure 12, the periodic displacements were smaller with values, mainly ranging from 0 to 0.2 pixels. The pixel locking and anti-pixel locking effect can also be observed, by which the results of some algorithms were overall higher or lower. In addition, the results of SimiFit-NCC, SimiFit-SGM, LSM, and Upsampling appeared obvious artifacts. The positions of the artifacts were basically consistent, at where the x-direction displacements were around multiples of 0.5 pixels. One possible explanation for these artifacts is that the matching results in the y-direction were affected by the fractional values of x-direction displacements. Figure 13 gives the y-direction standard deviation curves, and the relationship between x-direction averaged displacements and y-direction standard deviations obtained by SimiFit-NCC and SimiFit-SGM. It could be seen that y-direction standard deviations were related to the fractional values of x-direction displacements, and the matching results in the y-direction were most unstable when the x-direction displacements were close to half pixels. The cases of systematic errors in this application agreed well with the phenomena in the simulated experiment.

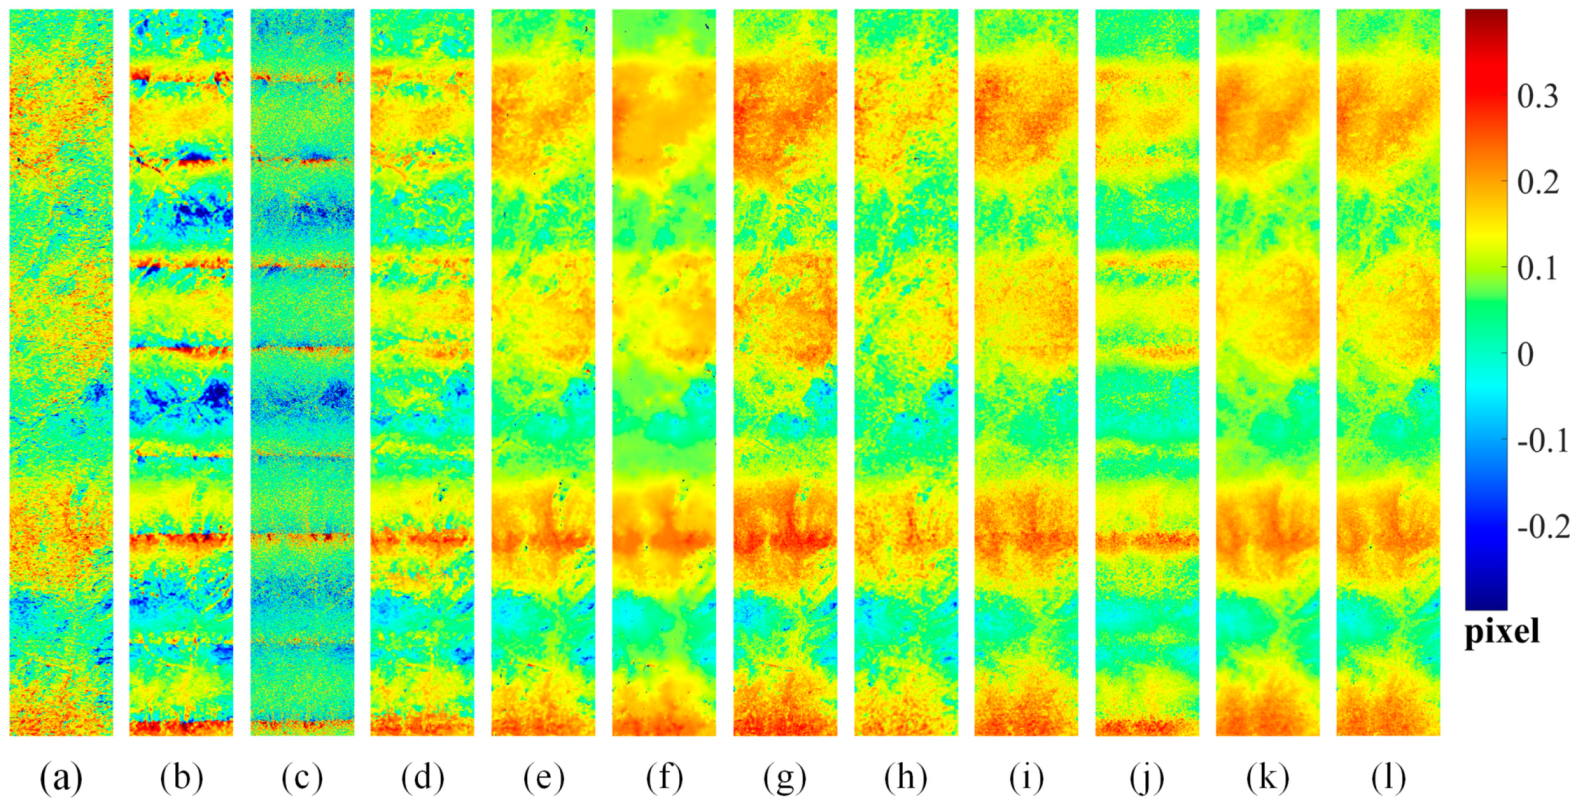
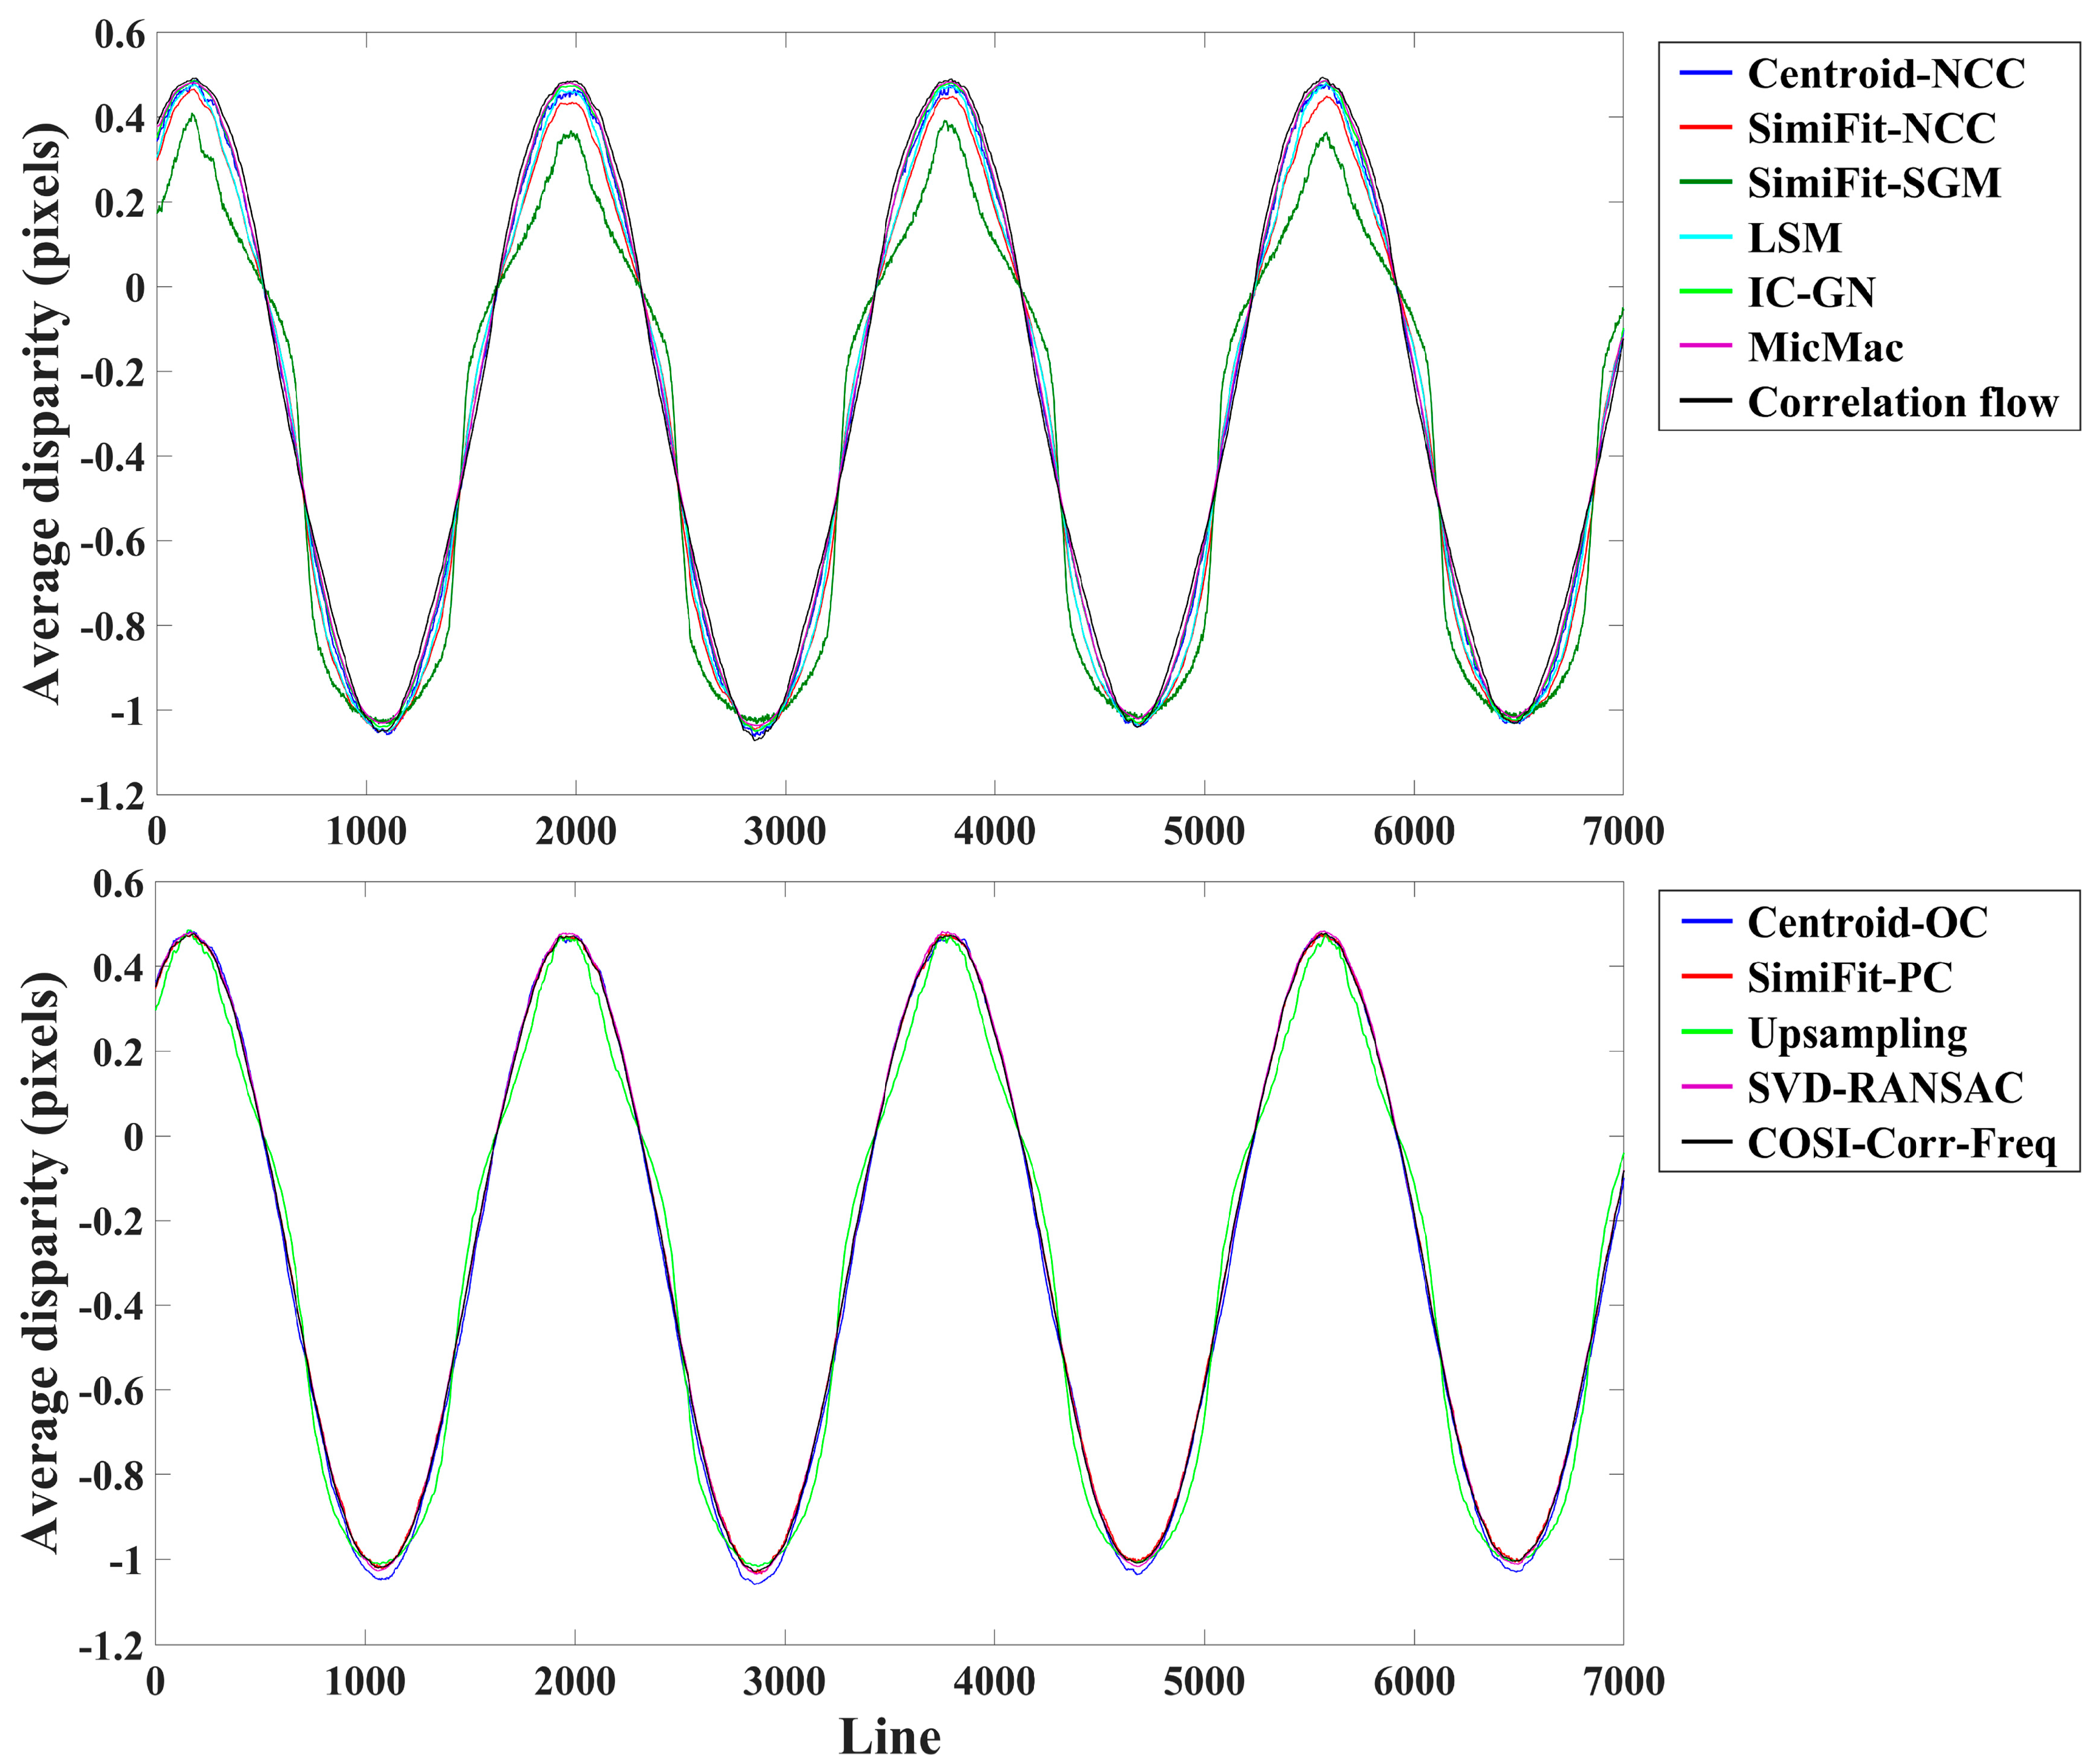
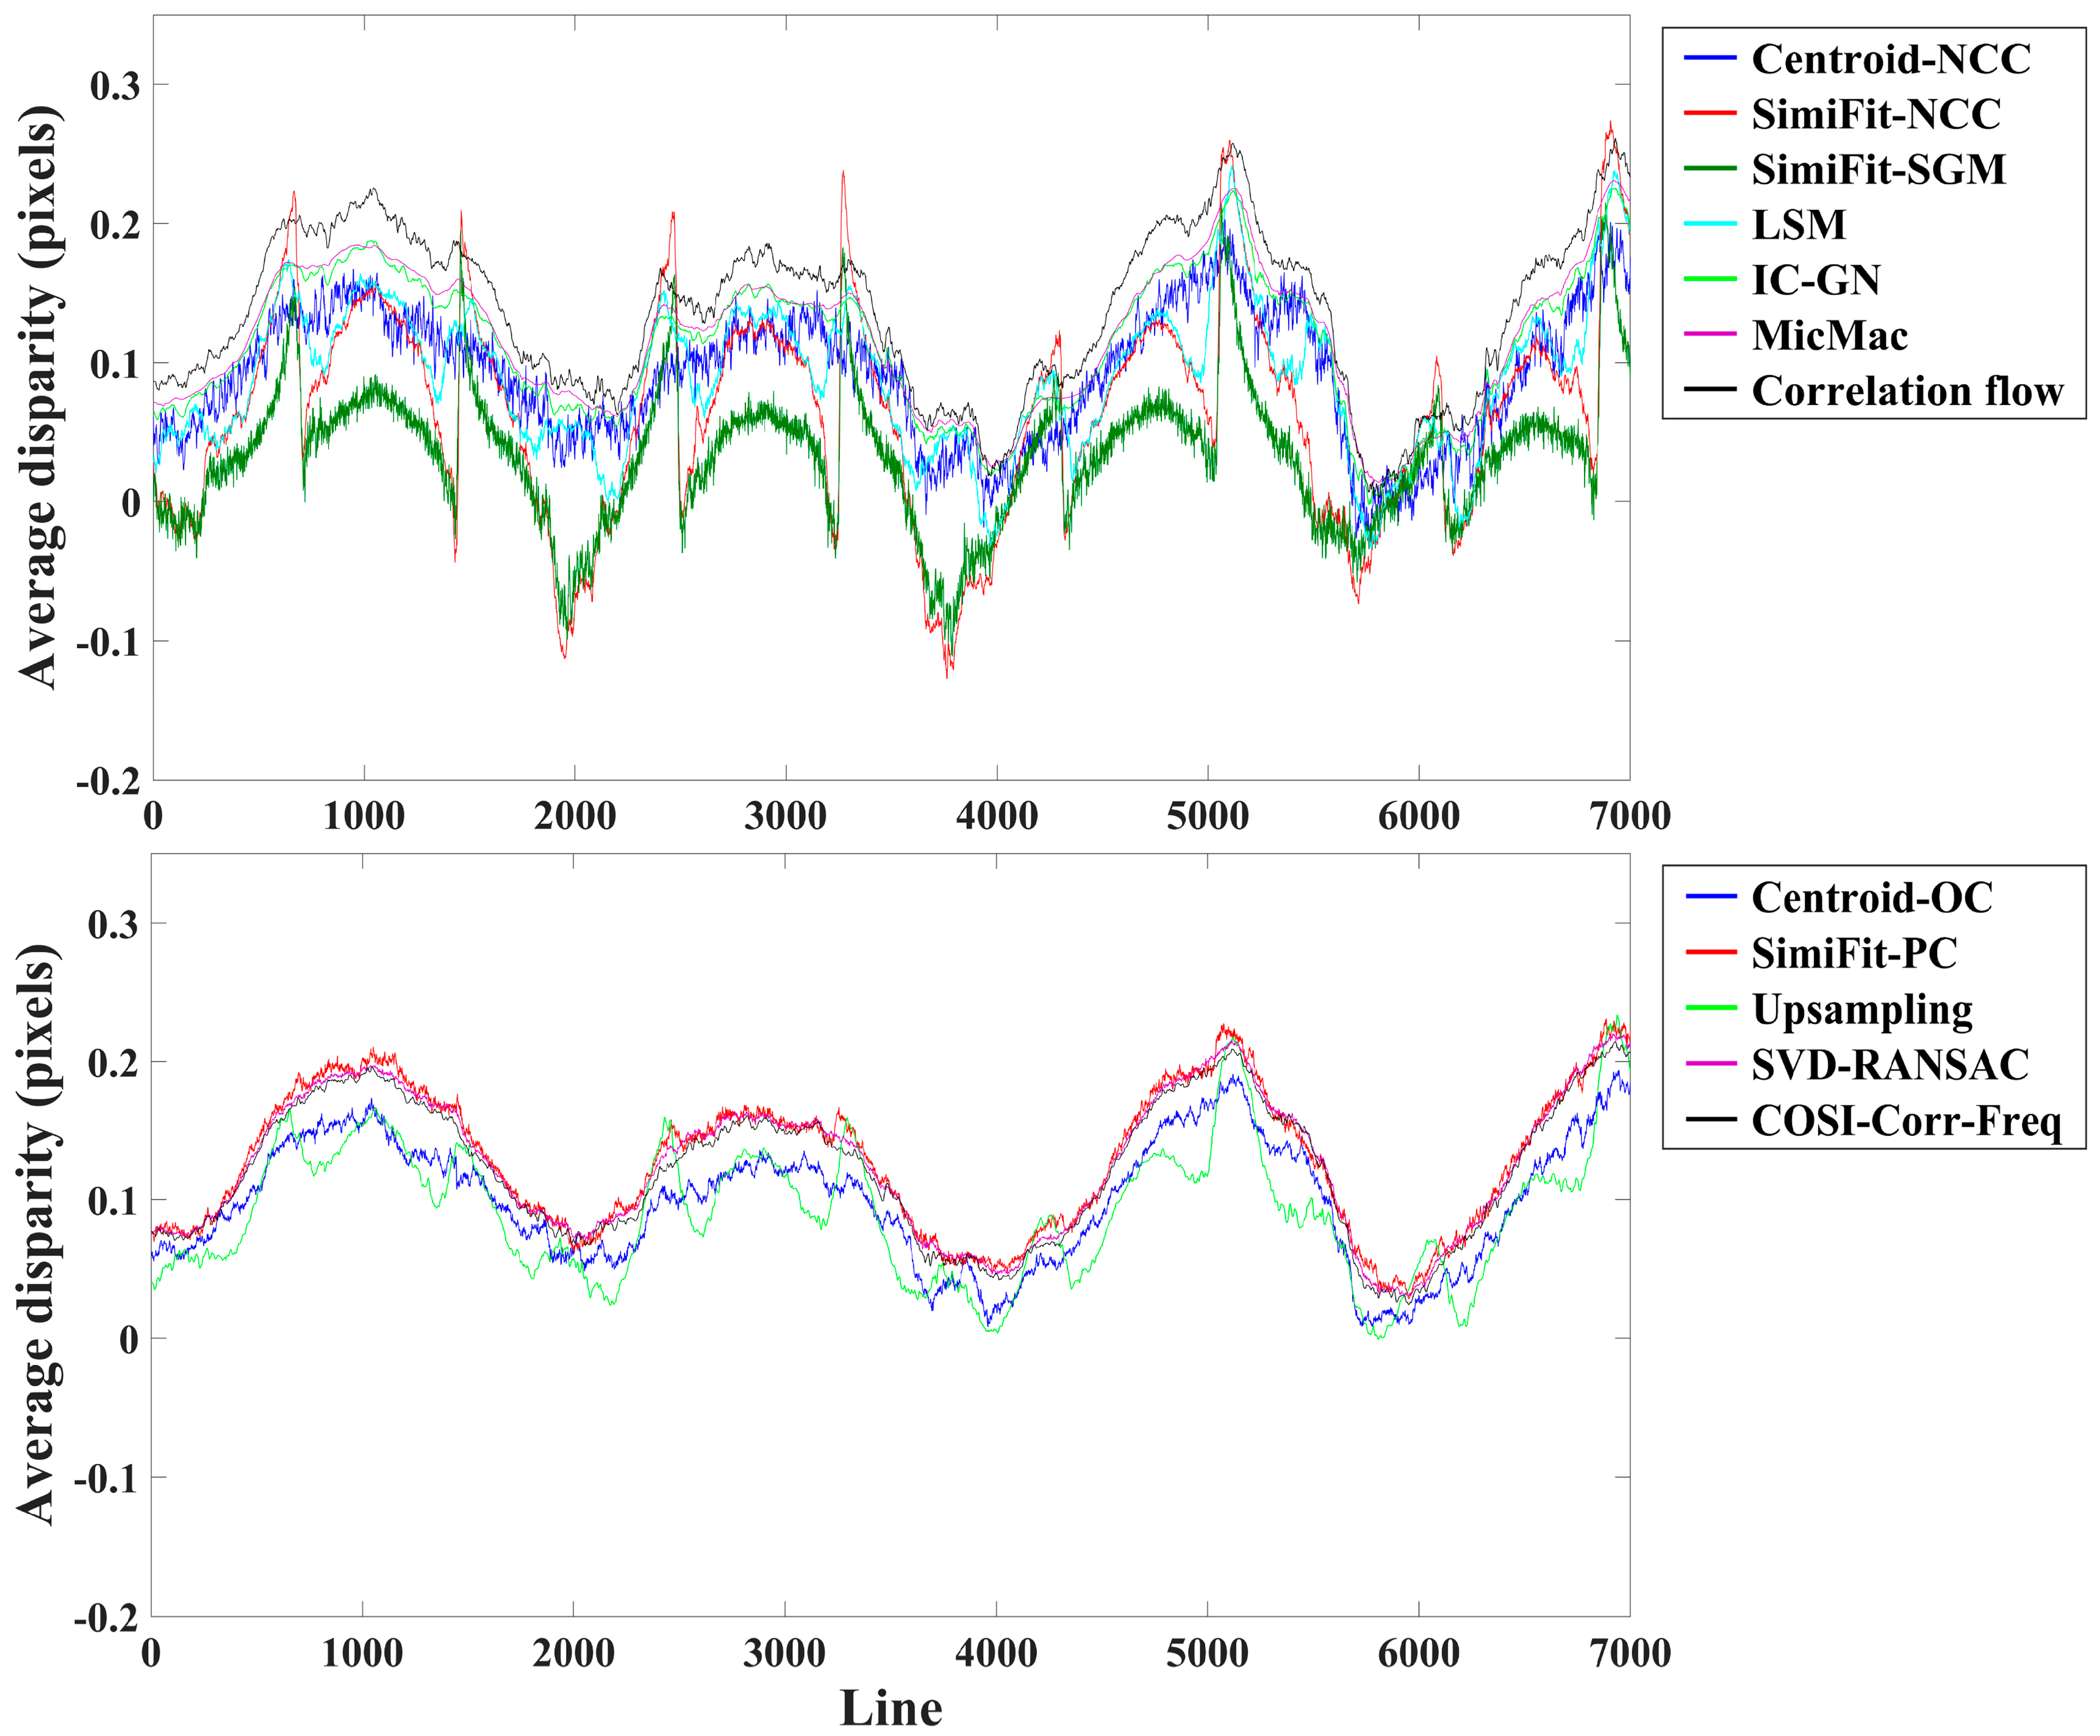
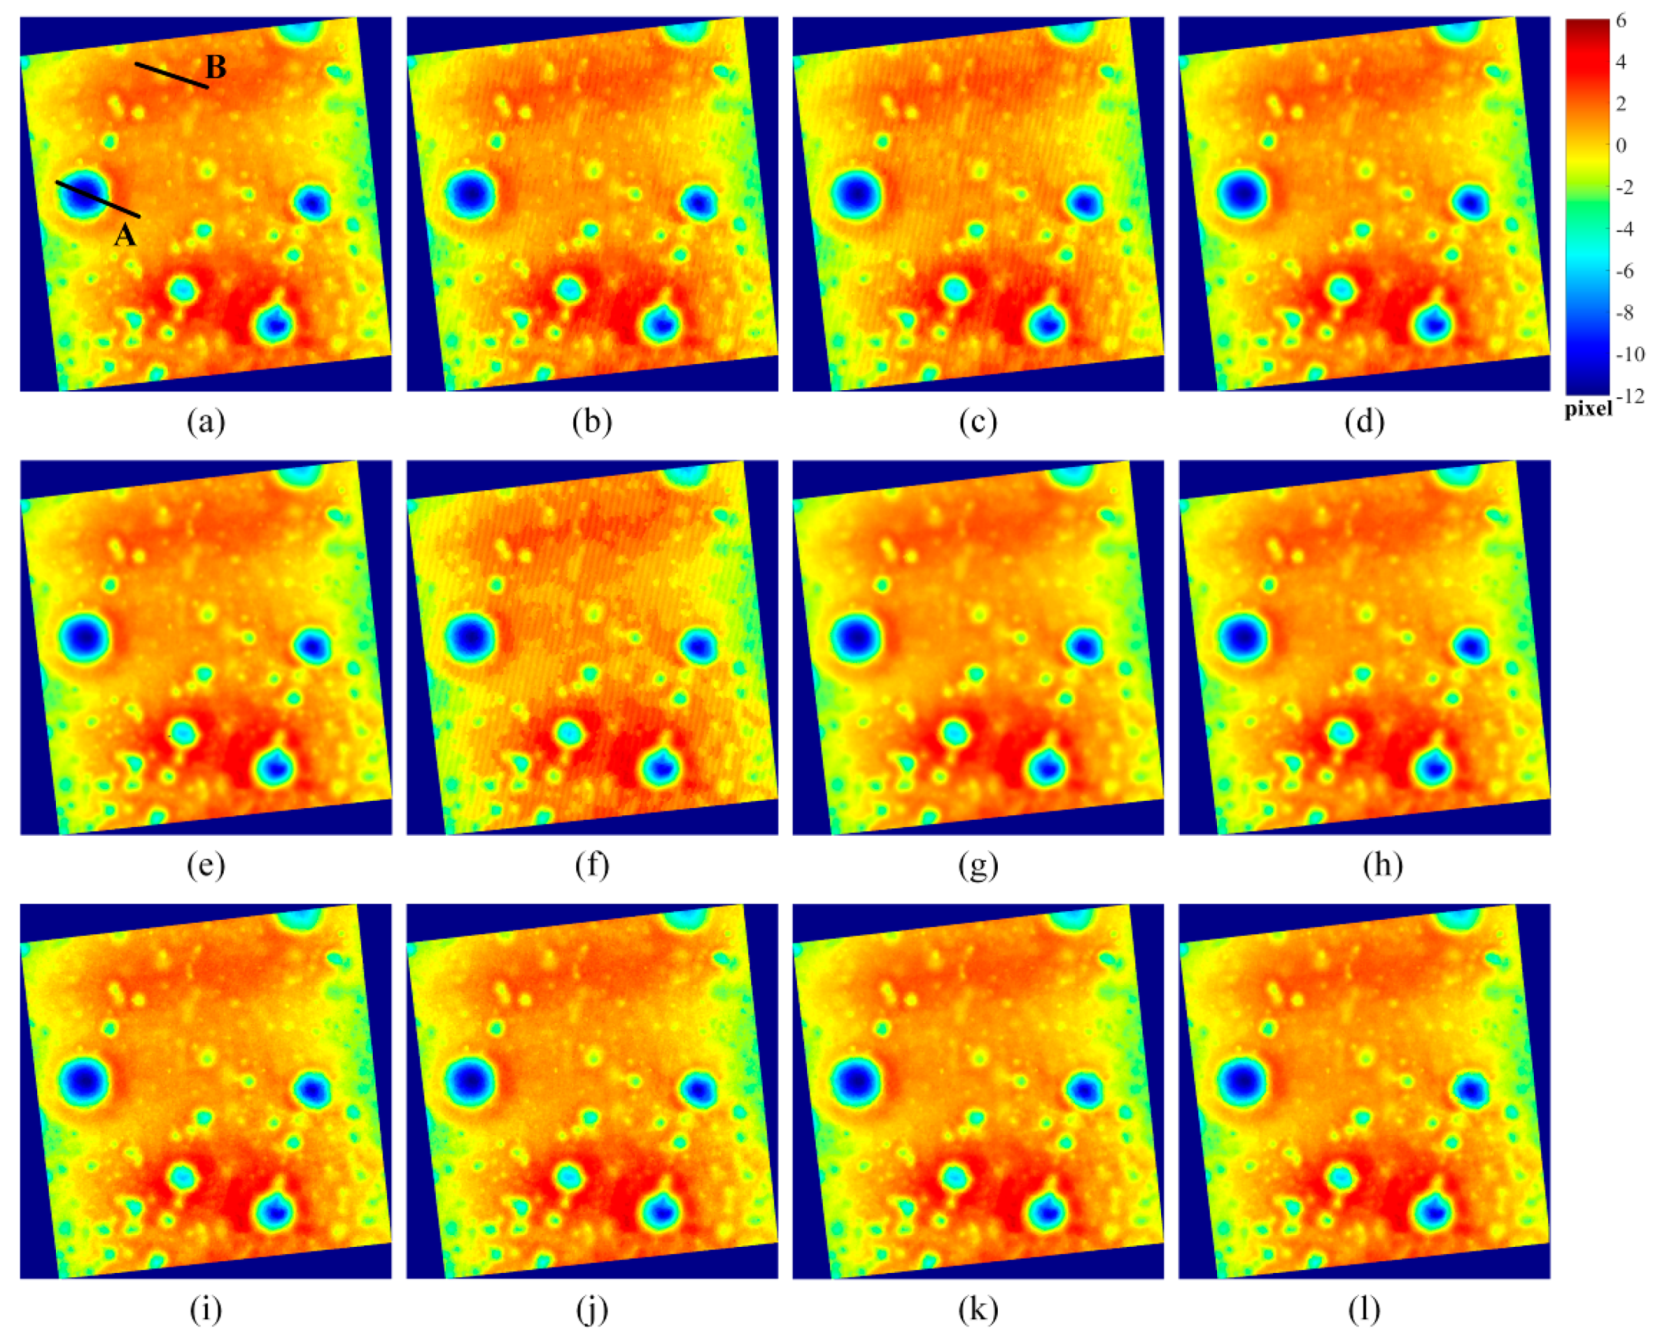
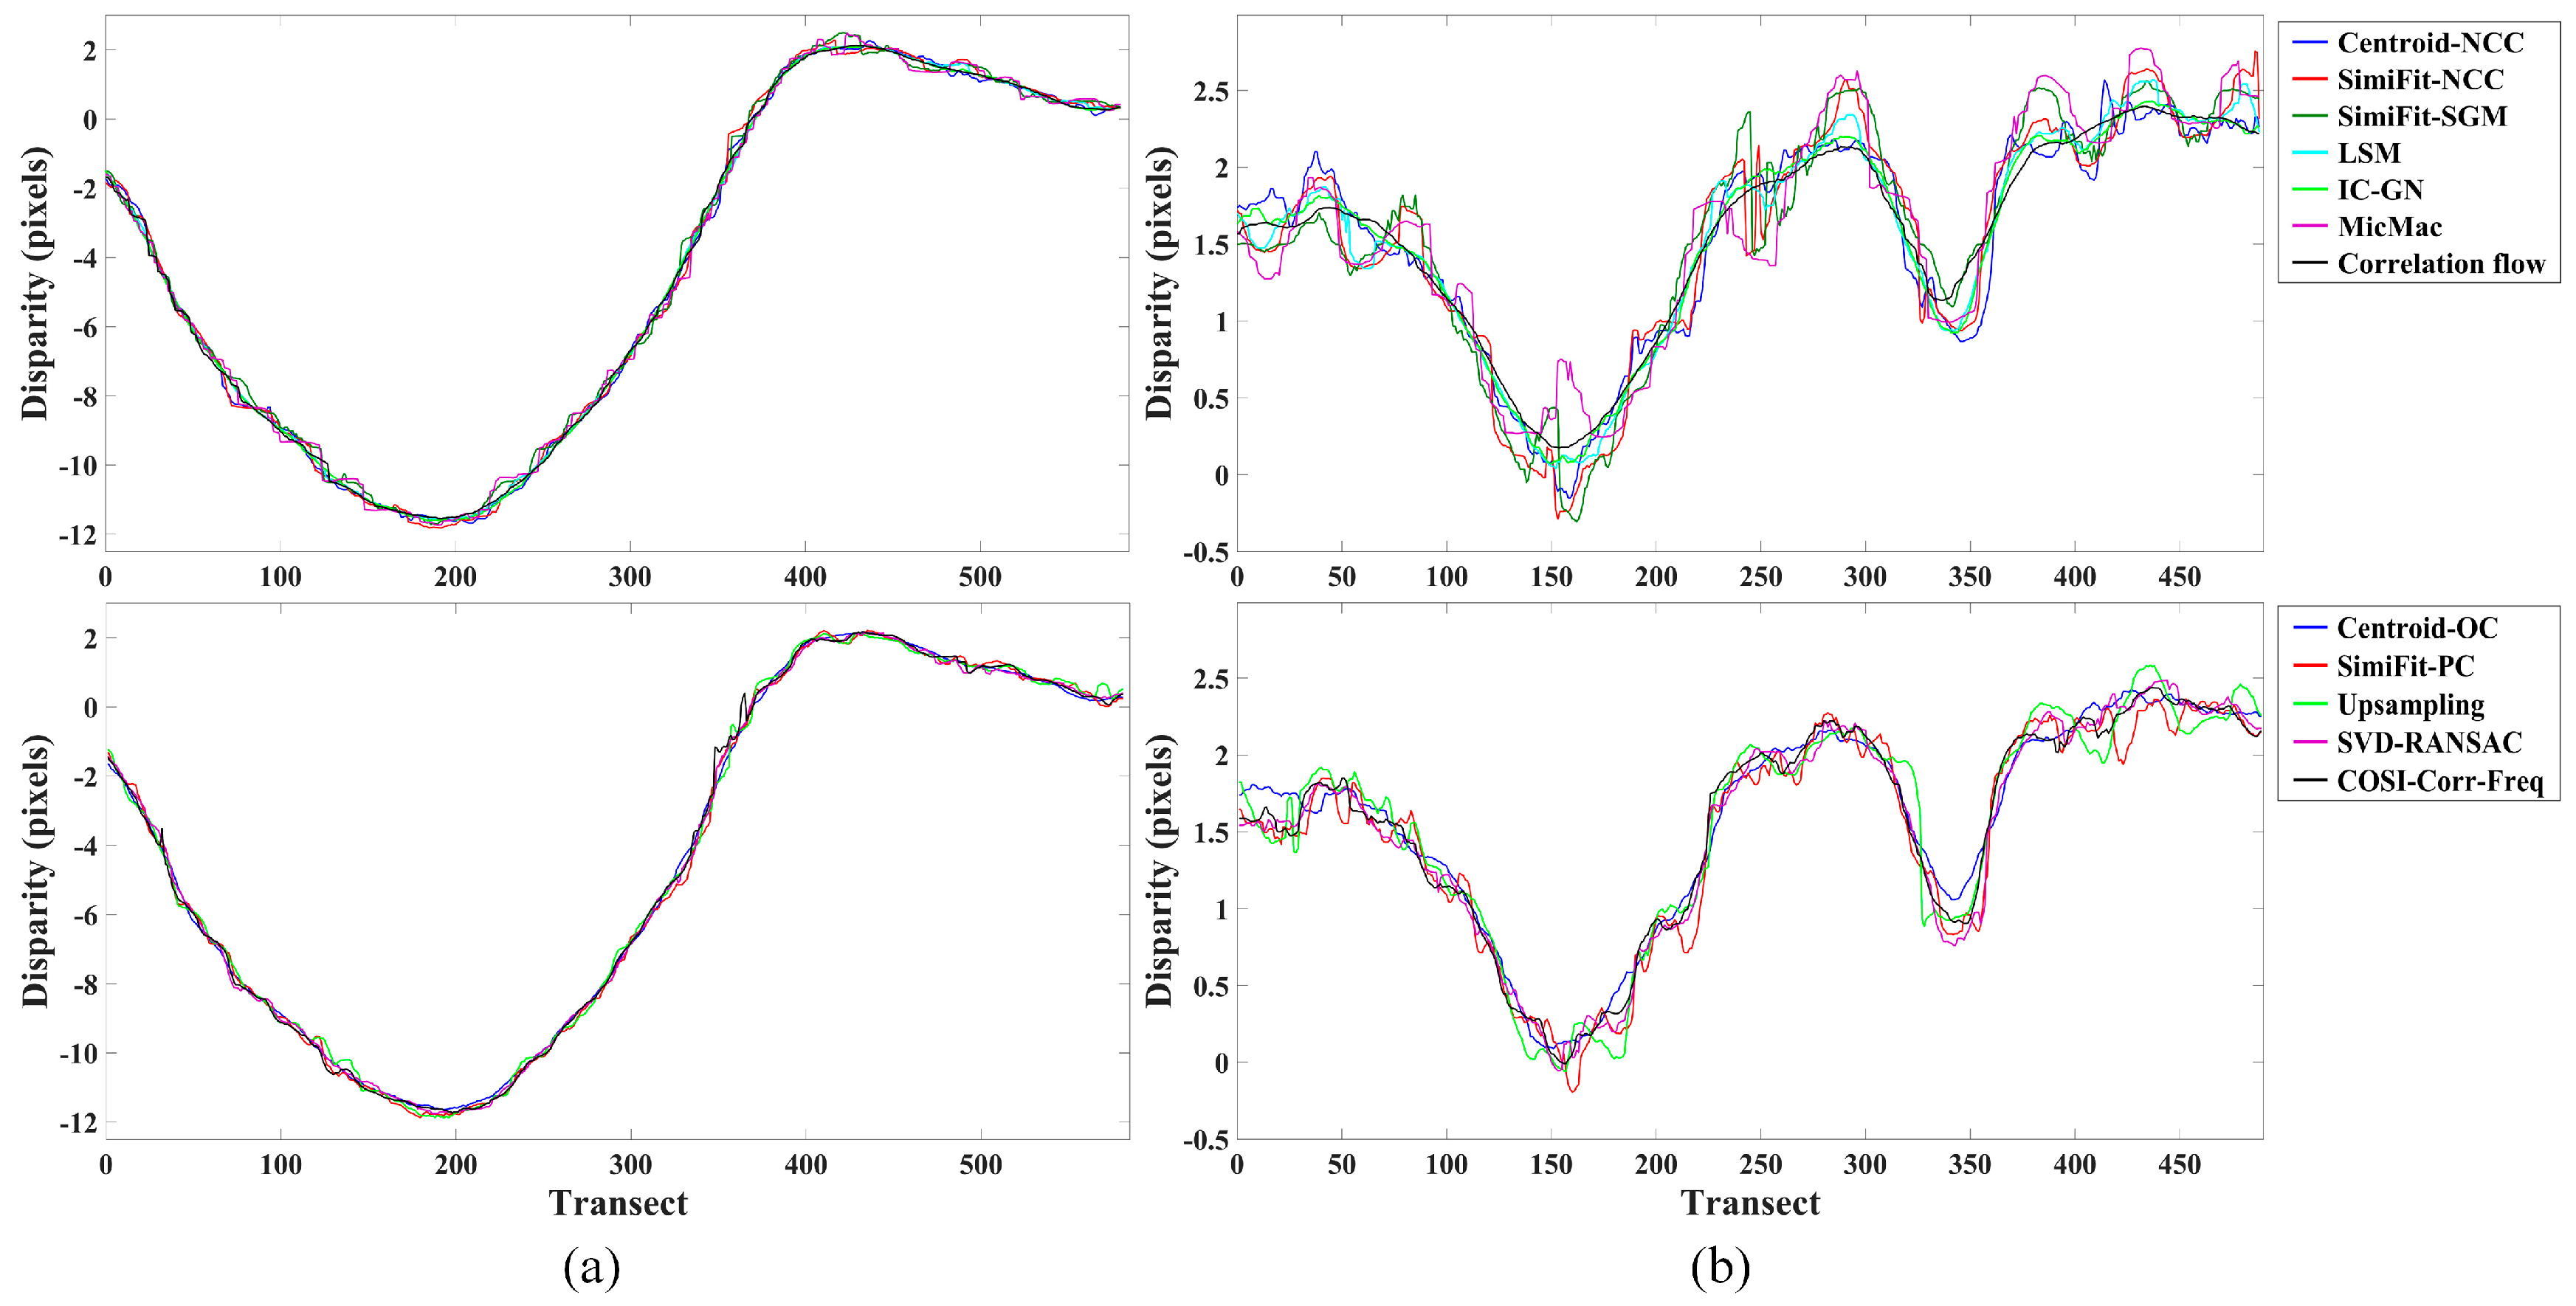
4.3. Results of Real Application Two

The disparity maps can be obtained by matching the rectified image pair. Figure 14 displays the disparity maps outputted from twelve different matching algorithms, in which the color variation corresponded to the terrain relief. The overall depth trend from different matching algorithms was basically consistent, and several lunar craters could be identified in all the disparity maps. However, a simple visual inspection of the disparity maps showed that there existed systematic errors in some matching results. The disparity maps obtained by SimiFit-NCC, SimiFit-SGM, and MicMac appeared obvious wave artifacts, and the result from LSM can also see a relatively slight artifact, while the others were free of this artifact. It is noteworthy that the systematic error in this application was different from the above two experiments, which was not related to the fractional value of displacements. In contrast, the wave artifacts were induced regularly along a certain direction.
Besides, we further examined the disparity values of different matching algorithms along two profiles (i.e., profiles A and B, illustrated in Figure 14a), as shown in Figure 15. As could be seen, all the matching algorithms were able to capture the shape of large lunar crater and the underlying trend of terrain relief. However, in addition to the noisy results caused by random errors, some matching results were unexpectedly fluctuating around the underlying trend due to the systematic errors. The profile B in Figure 15b with a narrower disparity range illustrated this case more clearly. It was found that the most severe result influenced by these systematic errors was from MicMac.

4.4. Summary and Discussion

Based on the experimental results using both simulated and real data, the systematic errors induced in subpixel dense image matching can be generally divided into two types: displacement-dependent and displacement-independent errors. The displacement-dependent systematic errors have been revealed in the simulated experiment and real application one, which are represented as pixel locking effect and standard deviation artifact. The phenomenon that bias and standard deviation vary with the fractional values of displacements has been reported in the field of particle image velocimetry and digital image correlation [73,74]. It was found in this study that this phenomenon also exists in remote sensing applications. Besides, the fractional values of displacements in one direction are shown to influence the matching results in another direction as well. This issue is ascribed to the mismatch between the continuous assumption in subpixel matching and the real situation. Therefore, improvement of sensor resolution, frequency smoothing, more sophisticated interpolation method, and fitting model can attenuate these systematic errors, while the increasing amount of aliasing will aggravate the degree of pixel locking effect and standard deviation artifact. However, the specific mechanism of the displacement-dependent systematic errors still needs further investigation. The displacement-independent systematic errors are also complicated and will not obviously present in all scenarios. Some matching results of real application two appear wave artifacts that are not related to the values of displacements. These unexpected artifacts are possibly caused by the frequency-dependent radiometric noise of the used images. It is noted that similar wave artifacts can also be observed in previous dense matching applications [7].
Various dense matching algorithms with two types of correlation-based similarity measures and seven types of subpixel methods were investigated and evaluated in this study. The similarity measure, NCC, and PC are, respectively, operated in the spatial domain and frequency domain. They use different manners of normalizations and are all insensitive to radiometric changes. PC performs better in the case of poor visual contrast and large intensity differences, while NCC performs better with small patch size [13]. The experimental results indicate that matching algorithms using PC are free of the displacement-independent systematic errors since PC is robust to the possible frequency-dependent noise that is limited to a small range of frequencies [55]. In contrast, PC would experience more severe displacement-dependent systematic errors than cross-correlation since it is sensitive to noise spread over the frequencies, and the correlation peak is sharper. However, as calculated in the frequency domain and having a theoretical model, it is convenient for PC-related algorithms to deal with aliasing and noise by adopting simple additional operations [24]. For instance, the performance of SimiFit-PC is mainly attributed to the spectral weighting with Gaussian function. SVD-RANSAC integrates frequency filtering and robust estimation, and COSI-Corr-Freq also embeds frequency masking and robustness iteration. Therefore, these three algorithms offer satisfactory robustness to systematic errors. In the NCC-related algorithms, similarity fitting with simple models, either using NCC values or using SGM costs, performs poorly. MicMac is limited by displacement-independent systematic errors, while the algorithms based on local and global continuous optimization possess the implicit smoothing effect to some degree and are able to reduce the influence of systematic errors. Surprisingly, peak centroid is a simple but effective subpixel method with low susceptibility to systematic errors, although the results of Centroid-NCC are somewhat noisy in real applications. Considering the warping assumption, MicMac and Correlation flow impose explicit smoothness constraint in the subpixel calculation, compared to the others that adopt a zero-order or first-order warp model between local patches. Therefore, they can generate smoother results with smaller standard deviations and handle the motion discontinuities better but could fail to recognize the unreliable surface changes [30]. In light of the results of comparative analysis in this study, the following suggestions on the selection of matching algorithms can be presented. (1) For time-crucial applications, peak centroid method is a reasonable option due to its simple implementation and pleasurable robustness. (2) PC-related algorithms exhibit favorable insensitivity to the displacement-independent systematic errors and are, thus, preferred for scenarios in the presence of frequency-dependent noise. (3) In the case of input images with aliasing, subpixel matching algorithms that achieve promising accuracy and robustness performance, such as IC-GN, MicMac, SVD-RANSAC, and COSI-Corr-Freq, are appropriate options to suppress the possible displacement-dependent systematic errors. (4) For the matching of scenes with considerable motion discontinuities, the algorithms based on global optimization with smaller patch sizes, such as MicMac and Correlation flow, are highly recommended.
In this study, we concentrated on the subpixel methods for area-based dense image matching and avoided additional operations that affected the exclusive comparison. In addition to the subpixel methods, the final quality of dense matching is also determined by the preprocessing stage that can change the characteristics of input images and the postprocessing stage that can directly filter out the false matches. It has been reported that a pre-filtering is able to effectively alleviate the displacement-dependent systematic errors [38,75], and additional tests in this study found that a low-pass filtering or radiometric calibration could attenuate the displacement-independent artifacts as well. However, the image details and gradients are usually reduced by the smoothing filters, which could lead to an increase in random errors in subpixel matching. It is not a trivial task to design a prefilter to balance the systematic errors and random errors. Therefore, the investigation of the intrinsic robustness of different subpixel matching algorithms is still indispensable in practical applications. In addition, the patch size is an essential parameter in dense image matching, which was empirically fixed in this study. The selection of suitable patch sizes for all cases is difficult. The larger patch sizes with enough information can improve the matching performance, especially the stability of matching, but increase the possibility of deformations that deviate the warping assumption. The patch size will not affect the presence of systematic errors [28]. Several adaptive strategies for adjusting patch size have been developed based on local structural statistics [14,76] or hierarchical variation [34,77]. The performance of various matching algorithms with varying patch sizes or adaptive strategies will be investigated in future work.

5. Conclusions

This paper presents a practical analysis and comparative study on the subpixel capability and robustness to systematic errors of area-based dense image matching for remote sensing applications. Experiments were conducted using both simulated and real data to compare and evaluate twelve existing matching algorithms. The simulated experiment and jitter detection application revealed the displacement-dependent systematic errors that were related to the intrinsic continuous assumption of matching algorithms and were exacerbated by the increasing amount of aliasing, and the disparity estimation application exhibited the displacement-independent artifacts that were related to the high-frequency image noise. According to the experimental results, peak centroid is a simple but effective subpixel method, while similarity fitting using quadratic function easily induces systematic errors. MicMac is susceptible to the displacement-independent artifacts, and the algorithms based on local and global continuous optimization can ensure the robustness to the systematic errors to different extents. PC-related algorithms are free of the displacement-independent artifacts and could be easily equipped with additional frequency operations to attenuate the displacement-dependent systematic errors. The future work will focus on the theoretical analysis and more implementation settings for various matching algorithms and matching frameworks.

Author Contributions

All authors contributed to this manuscript: Conceptualization, Z.Y. and Y.X.; methodology and software, Z.Y., Y.X. and J.Z.; experiment and analysis, Z.Y. and H.C.; data curation, Y.X. and X.T.; writing—original draft preparation, Z.Y.; writing—review and editing, Y.X.; supervision and funding acquisition, X.T. and U.S. All authors have read and agreed to the published version of the manuscript.

Funding

This work was supported by the German Research Foundation (DFG) and the Technical University of Munich within the funding program Open Access Publishing; the National Key Research and Development Program of China, grant number 2016YFC1400904, 2018YFB0505400, and 2017YFB0502900.

Acknowledgments

The authors would like to thank the Chinese Land Satellite Remote Sensing Application Center for providing the ZiYuan-3 data and the NASA Planetary Data System for providing the LROC data. We are also grateful to Sébastien Leprince, Alexandra Messerli, Justin Blaber, Marius Drulea, Manuel Guizar-Sicairos, Marc Pierrot Deseilligny, and NASA Ames Research Center for providing their codes and software.

Conflicts of Interest

The authors declare no conflict of interest.

References

  1. Zitova, B.; Flusser, J. Image registration methods: A survey. Image Vis. Comput. 2003, 21, 977–1000. [Google Scholar] [CrossRef] [Green Version]
  2. Scharstein, D.; Szeliski, R. A taxonomy and evaluation of dense two-frame stereo correspondence algorithms. Int. J. Comput. Vis. 2002, 47, 7–42. [Google Scholar] [CrossRef]
  3. Baker, S.; Scharstein, D.; Lewis, J.P.; Roth, S.; Black, M.J.; Szeliski, R. A database and evaluation methodology for optical flow. Int. J. Comput. Vis. 2011, 92, 1–31. [Google Scholar] [CrossRef] [Green Version]
  4. Sutton, M.A.; Orteu, J.-J.; Schreier, H. Image Correlation for Shape, Motion and Deformation Measurements: Basic Concepts, Theory and Applications; Springer: New York, NJ, USA, 2009. [Google Scholar]
  5. Xiong, Z.; Zhang, Y. A novel interest-point-matching algorithm for high-resolution satellite images. IEEE Trans. Geosci. Remote Sens. 2009, 47, 4189–4200. [Google Scholar] [CrossRef]
  6. Haala, N.; Rothermel, M. Dense multi-stereo matching for high quality digital elevation models. Photogramm. Fernerkund. Geoinf. 2012, 2012, 331–343. [Google Scholar] [CrossRef]
  7. Leprince, S.; Barbot, S.; Ayoub, F.; Avouac, J.-P. Automatic and precise orthorectification, coregistration, and subpixel correlation of satellite images, application to ground deformation measurements. IEEE Trans. Geosci. Remote Sens. 2007, 45, 1529–1558. [Google Scholar] [CrossRef] [Green Version]
  8. Kääb, A.; Leprince, S. Motion detection using near-simultaneous satellite acquisitions. Remote Sens. Environ. 2014, 154, 164–179. [Google Scholar] [CrossRef] [Green Version]
  9. Leprince, S.; Musé, P.; Avouac, J.-P. In-Flight CCD distortion calibration for pushbroom satellites based on subpixel correlation. IEEE Trans. Geosci. Remote Sens. 2008, 46, 2675–2683. [Google Scholar] [CrossRef]
  10. Tong, X.; Ye, Z.; Xu, Y.; Tang, X.; Liu, S.; Li, L.; Xie, H.; Wang, F.; Li, T.; Hong, Z. Framework of jitter detection and compensation for high resolution satellites. Remote Sens. 2014, 6, 3944–3964. [Google Scholar] [CrossRef] [Green Version]
  11. Jhan, J.-P.; Rau, J.-Y.; Huang, C.-Y. Band-to-band registration and ortho-rectification of multilens/multispectral imagery: A case study of MiniMCA-12 acquired by a fixed-wing UAS. ISPRS J. Photogramm. Remote Sens. 2016, 114, 66–77. [Google Scholar] [CrossRef]
  12. Gruen, A. Development and status of image matching in photogrammetry. Photogramm. Rec. 2012, 27, 36–57. [Google Scholar] [CrossRef]
  13. Heid, T.; Kääb, A. Evaluation of existing image matching methods for deriving glacier surface displacements globally from optical satellite imagery. Remote Sens. Environ. 2012, 118, 339–355. [Google Scholar] [CrossRef]
  14. Gao, S.; Tong, X.; Chen, P.; Ye, Z.; Hu, O.; Wang, B.; Zhao, C.; Liu, S.; Xie, H.; Jin, Y.; et al. Full-Field deformation measurement by videogrammetry using self-adaptive window matching. Photogramm. Rec. 2019, 34, 36–62. [Google Scholar] [CrossRef] [Green Version]
  15. Tong, X.; Ye, Z.; Li, L.; Liu, S.; Jin, Y.; Chen, P.; Xie, H.; Zhang, S. Detection and estimation of along-track attitude jitter from Ziyuan-3 three-line-array images based on back-projection residuals. IEEE Trans. Geosci. Remote Sens. 2017, 55, 4272–4284. [Google Scholar] [CrossRef]
  16. Zhang, Z.; Vosselman, G.; Gerke, M.; Persello, C.; Tuia, D.; Yang, M.Y. Detecting building changes between airborne laser scanning and photogrammetric data. Remote Sens. 2019, 11, 2417. [Google Scholar] [CrossRef] [Green Version]
  17. Ye, Z.; Tong, X.; Xu, Y.; Gao, S.; Liu, S.; Xie, H.; Lu, W.; Liu, X. An improved subpixel phase correlation method with application in videogrammetric monitoring of shaking table tests. Photogramm. Eng. Remote Sens. 2018, 84, 579–592. [Google Scholar] [CrossRef]
  18. Michel, R.; Rignot, E. Flow of Glaciar Moreno, Argentina, from repeat-pass shuttle imaging radar images: Comparison of the phase correlation method with radar interferometry. J. Glaciol. 1999, 45, 93–100. [Google Scholar] [CrossRef]
  19. Tian, Q.; Huhns, M.N. Algorithms for subpixel registration. Comput. Vis. Graph. Image Process. 1986, 35, 220–233. [Google Scholar] [CrossRef]
  20. Guizar-Sicairos, M.; Thurman, S.T.; Fienup, J.R. Efficient subpixel image registration algorithms. Opt. Lett. 2008, 33, 156–158. [Google Scholar] [CrossRef] [Green Version]
  21. Debella-Gilo, M.; Kääb, A. Sub-Pixel precision image matching for measuring surface displacements on mass movements using normalized cross-correlation. Remote Sens. Environ. 2011, 115, 130–142. [Google Scholar] [CrossRef] [Green Version]
  22. Pan, B.; Qian, K.; Xie, H.; Asundi, A. Two-Dimensional digital image correlation for in-plane displacement and strain measurement: A review. Meas. Sci. Technol. 2009, 20. [Google Scholar] [CrossRef]
  23. Fortun, D.; Bouthemy, P.; Kervrann, C. Optical flow modeling and computation: A survey. Comput. Vis. Image Underst. 2015, 134, 1–21. [Google Scholar] [CrossRef] [Green Version]
  24. Tong, X.; Ye, Z.; Xu, Y.; Gao, S.; Xie, H.; Du, Q.; Liu, S.; Xu, X.; Liu, S.; Luan, K.; et al. Image registration with Fourier-based image correlation: A comprehensive review of developments and applications. IEEE J. Sel. Top. Appl. Earth Observ. Remote Sens. 2019, 12, 4062–4081. [Google Scholar] [CrossRef]
  25. Hirschmüller, H. Stereo processing by semiglobal matching and mutual information. IEEE Trans. Pattern Anal. Mach. Intell. 2008, 30, 328–341. [Google Scholar] [CrossRef] [PubMed]
  26. Ackermann, F. Digital image correlation: Performance and potential application in photogrammetry. Photogramm. Rec. 1984, 11, 429–439. [Google Scholar] [CrossRef]
  27. Rosu, A.-M.; Pierrot-Deseilligny, M.; Delorme, A.; Binet, R.; Klinger, Y. Measurement of ground displacement from optical satellite image correlation using the free open-source software MicMac. ISPRS J. Photogramm. Remote Sens. 2015, 100, 48–59. [Google Scholar] [CrossRef]
  28. Pan, B.; Wang, B. Digital image correlation with enhanced accuracy and efficiency: A comparison of two subpixel registration algorithms. Exp. Mech. 2016, 56, 1395–1409. [Google Scholar] [CrossRef]
  29. Alba, A.; Vigueras-Gomez, J.F.; Arce-Santana, E.R.; Aguilar-Ponce, R.M. Phase correlation with sub-pixel accuracy: A comparative study in 1D and 2D. Comput. Vis. Image Underst. 2015, 137, 76–87. [Google Scholar] [CrossRef]
  30. Le Bivic, R.; Allemand, P.; Quiquerez, A.; Delacourt, C. Potential and limitation of SPOT-5 ortho-image correlation to investigate the cinematics of landslides: The example of “Mare à Poule d’Eau” (Réunion, France). Remote Sens. 2017, 9, 106. [Google Scholar] [CrossRef] [Green Version]
  31. Bickel, V.T.; Manconi, A.; Amann, F. Quantitative assessment of digital image correlation methods to detect and monitor surface displacements of large slope instabilities. Remote Sens. 2018, 10, 865. [Google Scholar] [CrossRef] [Green Version]
  32. Sabater, N.; Blanchet, G.; Moisan, L.; Almansa, A.; Morel, J.-M. Review of low-baseline stereo algorithms and benchmarks. In Proceedings of the SPIE Image and Signal Processing for Remote Sensing XVI, Toulouse, France, 20–23 September 2010; p. 783005. [Google Scholar]
  33. Remondino, F.; Spera, M.G.; Nocerino, E.; Menna, F.; Nex, F. State of the art in high density image matching. Photogramm. Rec. 2014, 29, 144–166. [Google Scholar] [CrossRef] [Green Version]
  34. Ye, Z.; Xu, Y.; Hoegner, L.; Tong, X.; Stilla, U. Precise disparity estimation for narrow baseline stereo based on multiscale superpixels and phase correlation. Int. Arch. Photogramm. Remote Sens. Spat. Inf. Sci. 2019, XLII-2/W13, 147–153. [Google Scholar] [CrossRef] [Green Version]
  35. Westerweel, J. Fundamentals of digital particle image velocimetry. Meas. Sci. Technol. 1997, 8, 1379–1392. [Google Scholar] [CrossRef] [Green Version]
  36. Schreier, H.W.; Braasch, J.R.; Sutton, M.A. Systematic errors in digital image correlation caused by intensity interpolation. Opt. Eng. 2000, 39, 2915–2921. [Google Scholar] [CrossRef]
  37. Van Puymbroeck, N.; Michel, R.; Binet, R.; Avouac, J.-P.; Taboury, J. Measuring earthquakes from optical satellite images. Appl. Opt. 2000, 39, 3486–3494. [Google Scholar] [CrossRef]
  38. Inglada, J.; Muron, V.; Pichard, D.; Feuvrier, T. Analysis of artifacts in subpixel remote sensing image registration. IEEE Trans. Geosci. Remote Sens. 2007, 45, 254–264. [Google Scholar] [CrossRef]
  39. Amiot, F.; Bornert, M.; Doumalin, P.; Dupré, J.-C.; Fazzini, M.; Orteu, J.-J.; Poilâne, C.; Robert, L.; Rotinat, R.; Toussaint, E.; et al. Assessment of digital image correlation measurement accuracy in the ultimate error regime: Main results of a collaborative benchmark. Strain 2013, 49, 483–496. [Google Scholar] [CrossRef] [Green Version]
  40. Uss, M.L.; Vozel, B.; Dushepa, V.A.; Komjak, V.A.; Chehdi, K. A precise lower bound on image subpixel registration accuracy. IEEE Trans. Geosci. Remote Sens. 2014, 52, 3333–3345. [Google Scholar] [CrossRef]
  41. Messerli, A.; Grinsted, A. Image georectification and feature tracking toolbox: ImGRAFT. Geosci. Instrum. Methods Data Syst. 2015, 4, 23–34. [Google Scholar] [CrossRef] [Green Version]
  42. Beyer, R.A.; Alexandrov, O.; McMichael, S. The Ames Stereo Pipeline: NASA’s open source software for deriving and processing terrain data. Earth Space Sci. 2018, 5, 537–548. [Google Scholar] [CrossRef]
  43. Blaber, J.; Adair, B.; Antoniou, A. Ncorr: Open-Source 2D digital image correlation Matlab software. Exp. Mech. 2015, 55, 1105–1122. [Google Scholar] [CrossRef]
  44. Drulea, M.; Nedevschi, S. Motion estimation using the correlation transform. IEEE Trans. Image Process. 2013, 22, 3260–3270. [Google Scholar] [CrossRef] [PubMed]
  45. Nagashima, S.; Aoki, T.; Higuchi, T.; Kobayashi, K. A subpixel image matching technique using phase-only correlation. In Proceedings of the International Symposium on Intelligent Signal Processing and Communication Systems, Tottori, Japan, 12–15 December 2006; pp. 701–704. [Google Scholar]
  46. Tong, X.; Ye, Z.; Xu, Y.; Liu, S.; Li, L.; Xie, H.; Li, T. A novel subpixel phase correlation method using singular value decomposition and unified random sample consensus. IEEE Trans. Geosci. Remote Sens. 2015, 53, 4143–4156. [Google Scholar] [CrossRef]
  47. Henriksen, M.R.; Manheim, M.R.; Burns, K.N.; Seymour, P.; Speyerer, E.J.; Deran, A.; Boyd, A.K.; Howington-Kraus, E.; Rosiek, M.R.; Archinal, B.A.; et al. Extracting accurate and precise topography from LROC narrow angle camera stereo observations. Icarus 2017, 283, 122–137. [Google Scholar] [CrossRef]
  48. Liu, C.; Yuen, J.; Torralba, A. SIFT flow: Dense correspondence across scenes and its applications. IEEE Trans. Pattern Anal. Mach. Intell. 2011, 33, 978–994. [Google Scholar] [CrossRef] [PubMed] [Green Version]
  49. Yuan, W.; Yuan, X.; Xu, S.; Gong, J.; Shibasaki, R. Dense image-matching via optical flow field estimation and fast-guided filter refinement. Remote Sens. 2019, 11, 2410. [Google Scholar] [CrossRef] [Green Version]
  50. Hartley, R.; Zisserman, A. Multiple View Geometry in Computer Vision; Cambridge University Press: Cambridge, UK, 2003. [Google Scholar]
  51. Lewis, J.P. Fast template matching. In Proceedings of the Vision Interface, Quebec City, QC, Canada, 15–19 May 1995; pp. 120–123. [Google Scholar]
  52. Tong, X.; Zheng, S.; Gao, S.; Liu, S.; Chen, P.; Guo, C.; Liu, S.; Xie, H.; Jin, Y.; Ye, Z.; et al. Acceleration of object tracking in high-speed videogrammetry using a parallel OpenMP and SIMD strategy. Photogramm. Rec. 2019, 34, 174–197. [Google Scholar] [CrossRef]
  53. Kuglin, C. The phase correlation image alignment method. In Proceedings of the International Conference on Cybernetics and Society, San Francisco, CA, USA, 23–25 September 1975; pp. 163–165. [Google Scholar]
  54. Ye, Z.; Tong, X.; Zheng, S.; Guo, C.; Gao, S.; Liu, S.; Xu, X.; Jin, Y.; Xie, H.; Liu, S.; et al. Illumination-Robust subpixel Fourier-based image correlation methods based on phase congruency. IEEE Trans. Geosci. Remote Sens. 2019, 57, 1995–2008. [Google Scholar] [CrossRef]
  55. Brown, L.G. A survey of image registration techniques. ACM Comput. Surv. 1992, 24, 325–376. [Google Scholar] [CrossRef]
  56. Foroosh, H.; Zerubia, J.B.; Berthod, M. Extension of phase correlation to subpixel registration. IEEE Trans. Image Process. 2002, 11, 188–200. [Google Scholar] [CrossRef] [Green Version]
  57. Takita, K.; Aoki, T.; Sasaki, Y.; Higuchi, T.; Kobayashi, K. High-Accuracy subpixel image registration based on phase-only correlation. IEICE Trans. Fundam. Electron. Commun. Comput. Sci. 2003, 86, 1925–1934. [Google Scholar]
  58. Young, S.S.; Driggers, R.G. Superresolution image reconstruction from a sequence of aliased imagery. Appl. Opt. 2006, 45, 5073–5085. [Google Scholar] [CrossRef] [PubMed]
  59. Nobach, H.; Damaschke, N.; Tropea, C. High-Precision sub-pixel interpolation in particle image velocimetry image processing. Exp. Fluids 2005, 39, 299–304. [Google Scholar] [CrossRef]
  60. Baker, S.; Matthews, I. Lucas-Kanade 20 years on: A unifying framework. Int. J. Comput. Vis. 2004, 56, 221–255. [Google Scholar] [CrossRef]
  61. Gruen, A. Adaptive least squares correlation: A powerful image matching technique. S. Afr. J. Photogramm. Remote Sens. Cartogr. 1985, 14, 175–187. [Google Scholar]
  62. Pan, B.; Li, K.; Tong, W. Fast, robust and accurate digital image correlation calculation without redundant computations. Exp. Mech. 2013, 53, 1277–1289. [Google Scholar] [CrossRef]
  63. Hoge, W.S. A subspace identification extension to the phase correlation method [MRI application]. IEEE Trans. Med. Imaging 2003, 22, 277–280. [Google Scholar] [CrossRef]
  64. Facciolo, G.; De Franchis, C.; Meinhardt, E. MGM: A significantly more global matching for stereovision. In Proceedings of the British Machine Vision Conference, Swansea, UK, 7–10 September 2015. [Google Scholar]
  65. Pan, B. Reliability-Guided digital image correlation for image deformation measurement. Appl. Opt. 2009, 48, 1535–1542. [Google Scholar] [CrossRef]
  66. Rupnik, E.; Daakir, M.; Pierrot Deseilligny, M. MicMac—A free, open-source solution for photogrammetry. Open Geospat. Data Softw. Stand. 2017, 2, 14. [Google Scholar] [CrossRef]
  67. Fitch, A.; Kadyrov, A.; Christmas, W.J.; Kittler, J. Orientation correlation. In Proceedings of the British Machine Vision Conference, Cardiff, UK, 2–5 September 2002; pp. 133–142. [Google Scholar]
  68. Stone, H.S.; Orchard, M.T.; Chang, E.-C.; Martucci, S.A. A fast direct Fourier-based algorithm for subpixel registration of images. IEEE Trans. Geosci. Remote Sens. 2001, 39, 2235–2243. [Google Scholar] [CrossRef] [Green Version]
  69. Ye, Z.; Xu, Y.; Tong, X.; Zheng, S.; Zhang, H.; Xie, H.; Stilla, U. Estimation and analysis of along-track attitude jitter of ZiYuan-3 satellite based on relative residuals of tri-band multispectral imagery. ISPRS J. Photogramm. Remote Sens. 2019, 158, 188–200. [Google Scholar] [CrossRef]
  70. Tong, X.; Xu, Y.; Ye, Z.; Liu, S.; Tang, X.; Li, L.; Xie, H.; Xie, J. Attitude oscillation detection of the ZY-3 satellite by using multispectral parallax images. IEEE Trans. Geosci. Remote Sens. 2015, 53, 3522–3534. [Google Scholar] [CrossRef]
  71. Robinson, M.S.; Brylow, S.M.; Tschimmel, M.; Humm, D.; Lawrence, S.J.; Thomas, P.C.; Denevi, B.W.; Bowman-Cisneros, E.; Zerr, J.; Ravine, M.A.; et al. Lunar reconnaissance orbiter camera (LROC) instrument overview. Space Sci. Rev. 2010, 150, 81–124. [Google Scholar] [CrossRef]
  72. Shimizu, M.; Okutomi, M. Sub-Pixel estimation error cancellation on area-based matching. Int. J. Comput. Vis. 2005, 63, 207–224. [Google Scholar] [CrossRef]
  73. Scarano, F.; Riethmuller, M.L. Advances in iterative multigrid PIV image processing. Exp. Fluids 2000, 29, S051–S060. [Google Scholar] [CrossRef]
  74. Bornert, M.; Doumalin, P.; Dupré, J.-C.; Poilane, C.; Robert, L.; Toussaint, E.; Wattrisse, B. Shortcut in DIC error assessment induced by image interpolation used for subpixel shifting. Opt. Lasers Eng. 2017, 91, 124–133. [Google Scholar] [CrossRef] [Green Version]
  75. Zhou, Y.; Sun, C.; Song, Y.; Chen, J. Image pre-filtering for measurement error reduction in digital image correlation. Opt. Lasers Eng. 2015, 65, 46–56. [Google Scholar] [CrossRef]
  76. Debella-Gilo, M.; Kääb, A. Locally adaptive template sizes for matching repeat images of Earth surface mass movements. ISPRS J. Photogramm. Remote Sens. 2012, 69, 10–28. [Google Scholar] [CrossRef]
  77. Rothermel, M.; Wenzel, K.; Fritsch, D.; Haala, N. SURE: Photogrammetric surface reconstruction from imagery. In Proceedings of the LC3D Workshop, Berlin, Germany, 4–5 December 2012. [Google Scholar]
Figure 1. The overall workflow of dense image matching.
Remotesensing 12 00696 g001
Figure 2. Sample images generated with different standard deviation σ and the enlarged subsets.
Remotesensing 12 00696 g002
Figure 3. The first band of the ZiYuan-3 multispectral image used in this study.
Remotesensing 12 00696 g003
Figure 4. Lunar reconnaissance orbiter camera (LROC) narrow-angle camera (NAC) image and the corresponding rectified image. (a) LROC NAC image; (b) Rectified image after affine epipolar transformation.
Remotesensing 12 00696 g004
Figure 5. (a) Mean value and (b) standard deviation of the absolute error vector as a function of σ calculated from different matching algorithms.
Remotesensing 12 00696 g005
Figure 6. x-direction mean errors under various displacements at each value of σ. (a) Centroid-NCC; (b) SimiFit-NCC; (c) SimiFit-SGM; (d) LSM; (e) IC-GN; (f) MicMac; (g) Correlation flow; (h) Centroid-OC; (i) SimiFit-PC; (j) Upsampling; (k) SVD-RANSAC; and (l) COSI-Corr-Freq. Note that the y-axis ranges of plots (b,c,j) are larger for better visualization.
Remotesensing 12 00696 g006
Figure 7. x-direction standard deviations under various displacements at each value of σ. (a) Centroid-NCC; (b) SimiFit-NCC; (c) SimiFit-SGM; (d) LSM; (e) IC-GN; (f) MicMac; (g) Correlation flow; (h) Centroid-OC; (i) SimiFit-PC; (j) Upsampling; (k) SVD-RANSAC; and (l) COSI-Corr-Freq. Note that the y-axis ranges of plots (ac,i,j,l) are larger for better visualization.
Remotesensing 12 00696 g007
Figure 8. y-direction standard deviations under various x-direction displacements at each value of σ. (a) Centroid-NCC; (b) SimiFit-NCC; (c) SimiFit-SGM; (d) LSM; (e) IC-GN; (f) MicMac; (g) Correlation flow; (h) Centroid-OC; (i) SimiFit-PC; (j) Upsampling; (k) SVD-RANSAC; and (l) COSI-Corr-Freq. Note that the y-axis ranges of plots (ac,i,j,l) are larger for better visualization.
Remotesensing 12 00696 g008
Figure 9. x-direction displacement maps outputted from different matching algorithms. (a) Centroid-NCC; (b) SimiFit-NCC; (c) SimiFit-SGM; (d) LSM; (e) IC-GN; (f) MicMac; (g) Correlation flow; (h) Centroid-OC; (i) SimiFit-PC; (j) Upsampling; (k) SVD-RANSAC; and (l) COSI-Corr-Freq.
Remotesensing 12 00696 g009
Figure 10. y-direction displacement maps outputted from different matching algorithms. (a) Centroid-NCC; (b) SimiFit-NCC; (c) SimiFit-SGM; (d) LSM; (e) IC-GN; (f) MicMac; (g) Correlation flow; (h) Centroid-OC; (i) SimiFit-PC; (j) Upsampling; (k) SVD-RANSAC; and (l) COSI-Corr-Freq.
Remotesensing 12 00696 g010
Figure 11. Averaged displacement curves at each line in the x-direction.
Remotesensing 12 00696 g011
Figure 12. Averaged displacement curves at each line in the y-direction.
Remotesensing 12 00696 g012
Figure 13. y-direction standard deviation curves (upper) and the relationship between x-direction displacements and y-direction standard deviations (lower). (a) SimiFit-NCC; (b) SimiFit-SGM.
Remotesensing 12 00696 g013
Figure 14. Disparity maps outputted from different matching algorithms. (a) Centroid-NCC; (b) SimiFit-NCC; (c) SimiFit-SGM; (d) LSM; (e) IC-GN; (f) MicMac; (g) Correlation flow; (h) Centroid-OC; (i) SimiFit-PC; (j) Upsampling; (k) SVD-RANSAC; and (l) COSI-Corr-Freq.
Remotesensing 12 00696 g014
Figure 15. Disparity curves along with two profiles. (a) Profile A; (b) Profile B.
Remotesensing 12 00696 g015
Table 1. Subpixel dense image matching algorithms investigated in this study.
AlgorithmSimilarity MeasureSubpixel MethodPatch Size (Pixels)
Centroid-NCCNCCPeak centroid25 × 25
SimiFit-NCCNCCSimilarity fitting25 × 25
SimiFit-SGMNCCSimilarity fitting7 × 7
LSMNCCLocal optimization25 × 25
IC-GNZNSSDLocal optimization25 × 25
MicMacNCCIntensity interpolation7 × 7
Correlation flowZNSSDGlobal optimization7 × 7
Centroid-OCOCPeak centroid32 × 32
SimiFit-PCPCSimilarity fitting32 × 32
UpsamplingPCSimilarity interpolation32 × 32
SVD-RANSACPCPhase-based32 × 32
COSI-Corr-FreqPCPhase-based32 × 32

