Article

Multitemporal 2016-2018 Sentinel-2 Data Enhancement for Landscape Archaeology: The Case Study of the Foggia Province, Southern Italy

1
Italian National Research Council (CNR), Institute of Methodologies for Environmental Analysis (IMAA), C.da Santa Loja, Tito Scalo, 85050 Potenza, Italy
2
DICEM (Dipartimento delle Culture Europee e del Mediterraneo), University of Basilicata, Via Nazario Sauro 85, 85100 Potenza (PZ), Italy
3
National Authority for Remote Sensing and Space Sciences, Cairo 1564, Egypt
4
Italian National Research Council (CNR), Institute of Heritage Science (ISPC), C.da Santa Loja, Tito Scalo, 85050 Potenza, Italy
*
Author to whom correspondence should be addressed.
Submission received: 10 April 2020 / Revised: 18 April 2020 / Accepted: 20 April 2020 / Published: 21 April 2020

Abstract

:
This paper is focused on the use of satellite Sentinel-2 data for assessing their capability in the identification of archaeological buried remains. We selected the “Tavoliere delle Puglie” (Foggia, Italy) as a test area because it is characterized by a long human frequentation and is very rich in archaeological remains. The investigations were performed using multi-temporal Sentinel-2 data and spectral indices, commonly used in satellite-based archaeology, and herein analyzed in known archaeological areas to capture the spectral signatures of soil and crop marks and characterize their temporal behavior using Time Series Analysis and Spectral Un-mixing. Tasseled Cap Transformation and Principal Component Analysis have been also adopted to enhance archaeological features. Results from investigations were compared with independent data sources and enabled us to (i) characterize the spectral signatures of soil and crop marks, (ii) assess the performance of the diverse spectral channels and indices, and (iii) identify the best period of the year to capture the archaeological proxy indicators. Additional very important results of our investigations were (i) the discovery of unknown archaeological areas and (ii) the setup of a database of archaeological features devised ad hoc to characterize and categorize the diverse typologies of archaeological remains detected using Sentinel-2 Data.

Graphical Abstract

1. Introduction

Earth observation (EO) technologies are increasingly recognized as extremely effective for the documentation, preservation, and management of cultural heritage (CH), and today considered a priority at European and international level with important cultural, social, and economic repercussions. This is clearly highlighted by the increasing number of papers, dedicated conferences, and special issues published in international scientific journals (see for example [1,2,3] and references therein quoted); so that, in 2017, the European Commission (EC) organized a specific workshop “to assess the potential of Copernicus in support of cultural heritage preservation and management, and to provide inputs for further research and/or operational implementation”. So that subsequently, a “Copernicus Cultural Heritage Task Force” was established to support the development and use of Earth observation techniques in the field of cultural heritage for knowledge improvements, documentation and enhancement, risk monitoring, and disaster management. The current challenge is not only to preserve cultural heritage for future generations for its uniqueness, historical value, and cultural importance but also to make cultural heritage properties accessible and usable in a sustainable way (SDG agenda 2030). In this context, remote sensing (RS) data can be very useful and supportive, so that Earth observation techniques for cultural heritage is now moving from a highly specialized niche sector to a consolidated reality ready to enter into a new period, characterized by the exploitation of new resources that space has to offer, as in the case of Copernicus satellite data [4].
Archaeological research can particularly benefit from remote sensing tools that already proved to be extremely useful, at diverse scale of analysis from single site up to a landscape level including Landscape Archaeology. The development of big data analysis and the availability of open data and source software has further pushed the use of Earth observation techniques as useful tools for cultural heritage, with particular reference to archaeology, in the discovery, protection, and preservation activities [1,2,3]. In this context, Copernicus satellite data (available free of charge), as those provided by Sentinel-2, can open new strategic challenges addressed to the exploitation, as much as possible, of the available open data [4,5,6].
Recently, a few studies assessed the potentiality of Sentinel-2 data in cultural heritage domain, including archaeological heritage monitoring, landscape archaeology, and the detection of archaeological proxy indicators, as in:
  • Agapiou et al., 2014, who evaluated their potential for the detection of archaeological crop marks in Paphos (Cyprus) [7];
  • Zanni and De Rosa (2019) who identified and reconstructed the ancient viability between the Roman cities of Aquileia (Aquileia, Italy) and Singidunum (Belgrade, Serbia), by means vegetation indices derived from Sentinel-2 data [8];
  • Khalaf and Insol (2019) who explored open source satellite imagery, including Sentinel-2 for the monitoring and protection of Islamic archaeological landscapes in Ethiopia [9];
  • Agapiou et al., 2019 evaluated the potential of the synergic use of multitemporal Sentinel-1 and Sentinel-2 dataset to image and semi-automatically extract archaeological features of Neolithic landscape in Thessalian plain [10];
  • Kalayci et al., 2019 performed a quantitative assessment of spectral responses of hollow ways in Upper Mesopotamia using a remote sensing date set including Sentinel-2 imagery [11];
  • Abate et al., 2019 evaluated the potential of Sentinel-2 data for preventive archaeology on two test areas in Southern Italy comparing diverse approaches to data enhancement, and semiautomatic and automatic feature extractions [12].
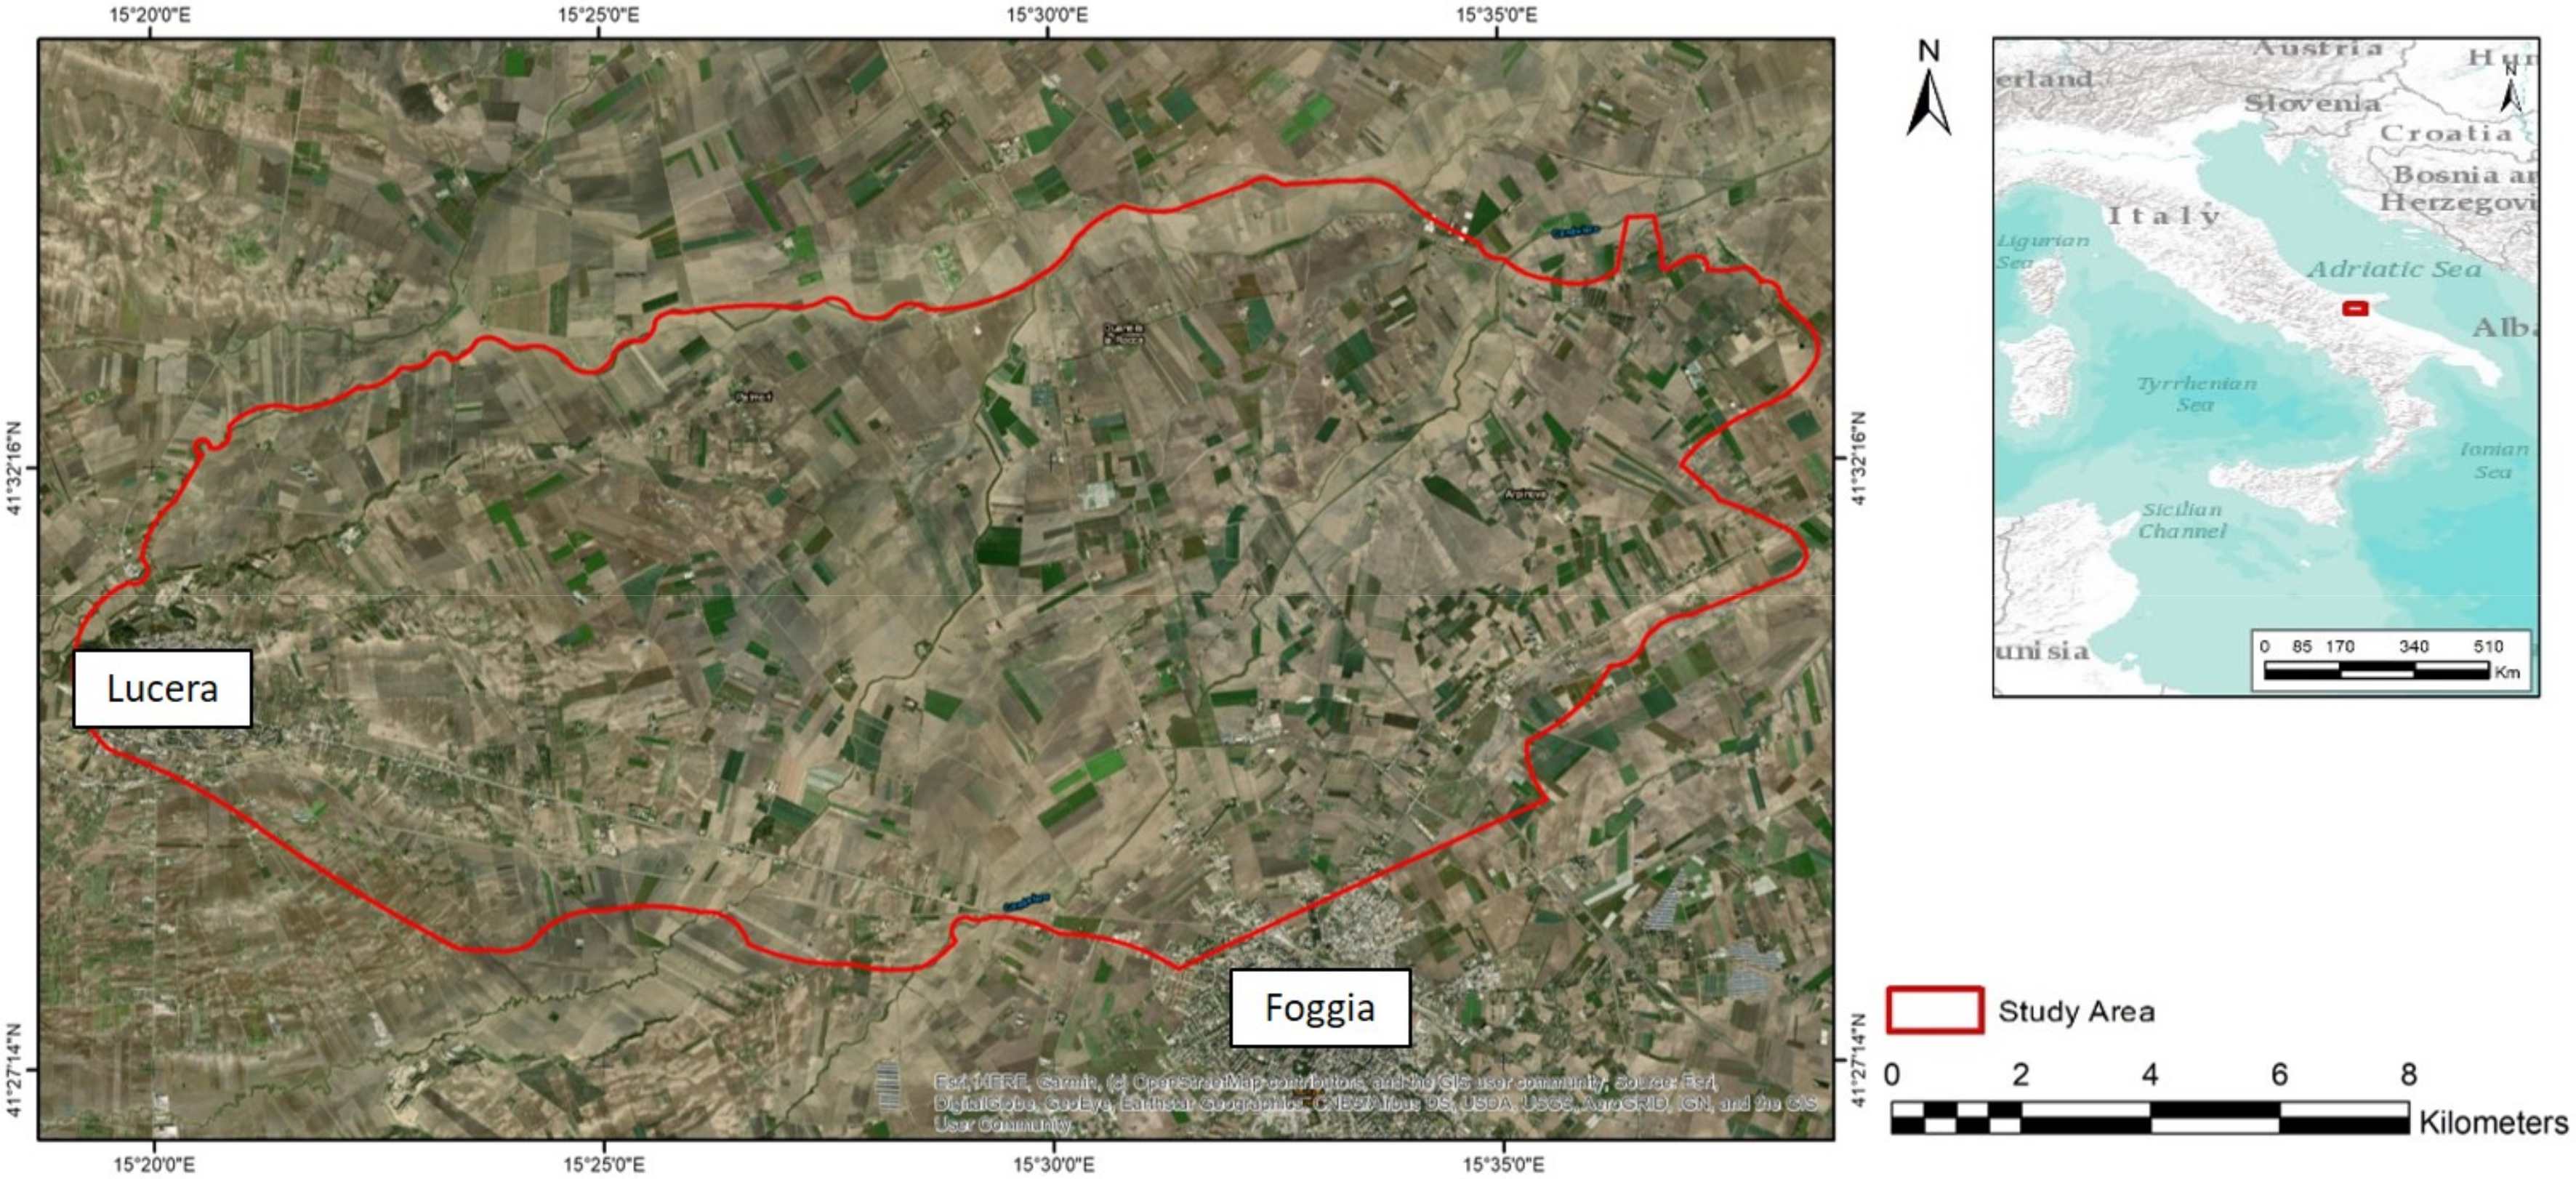
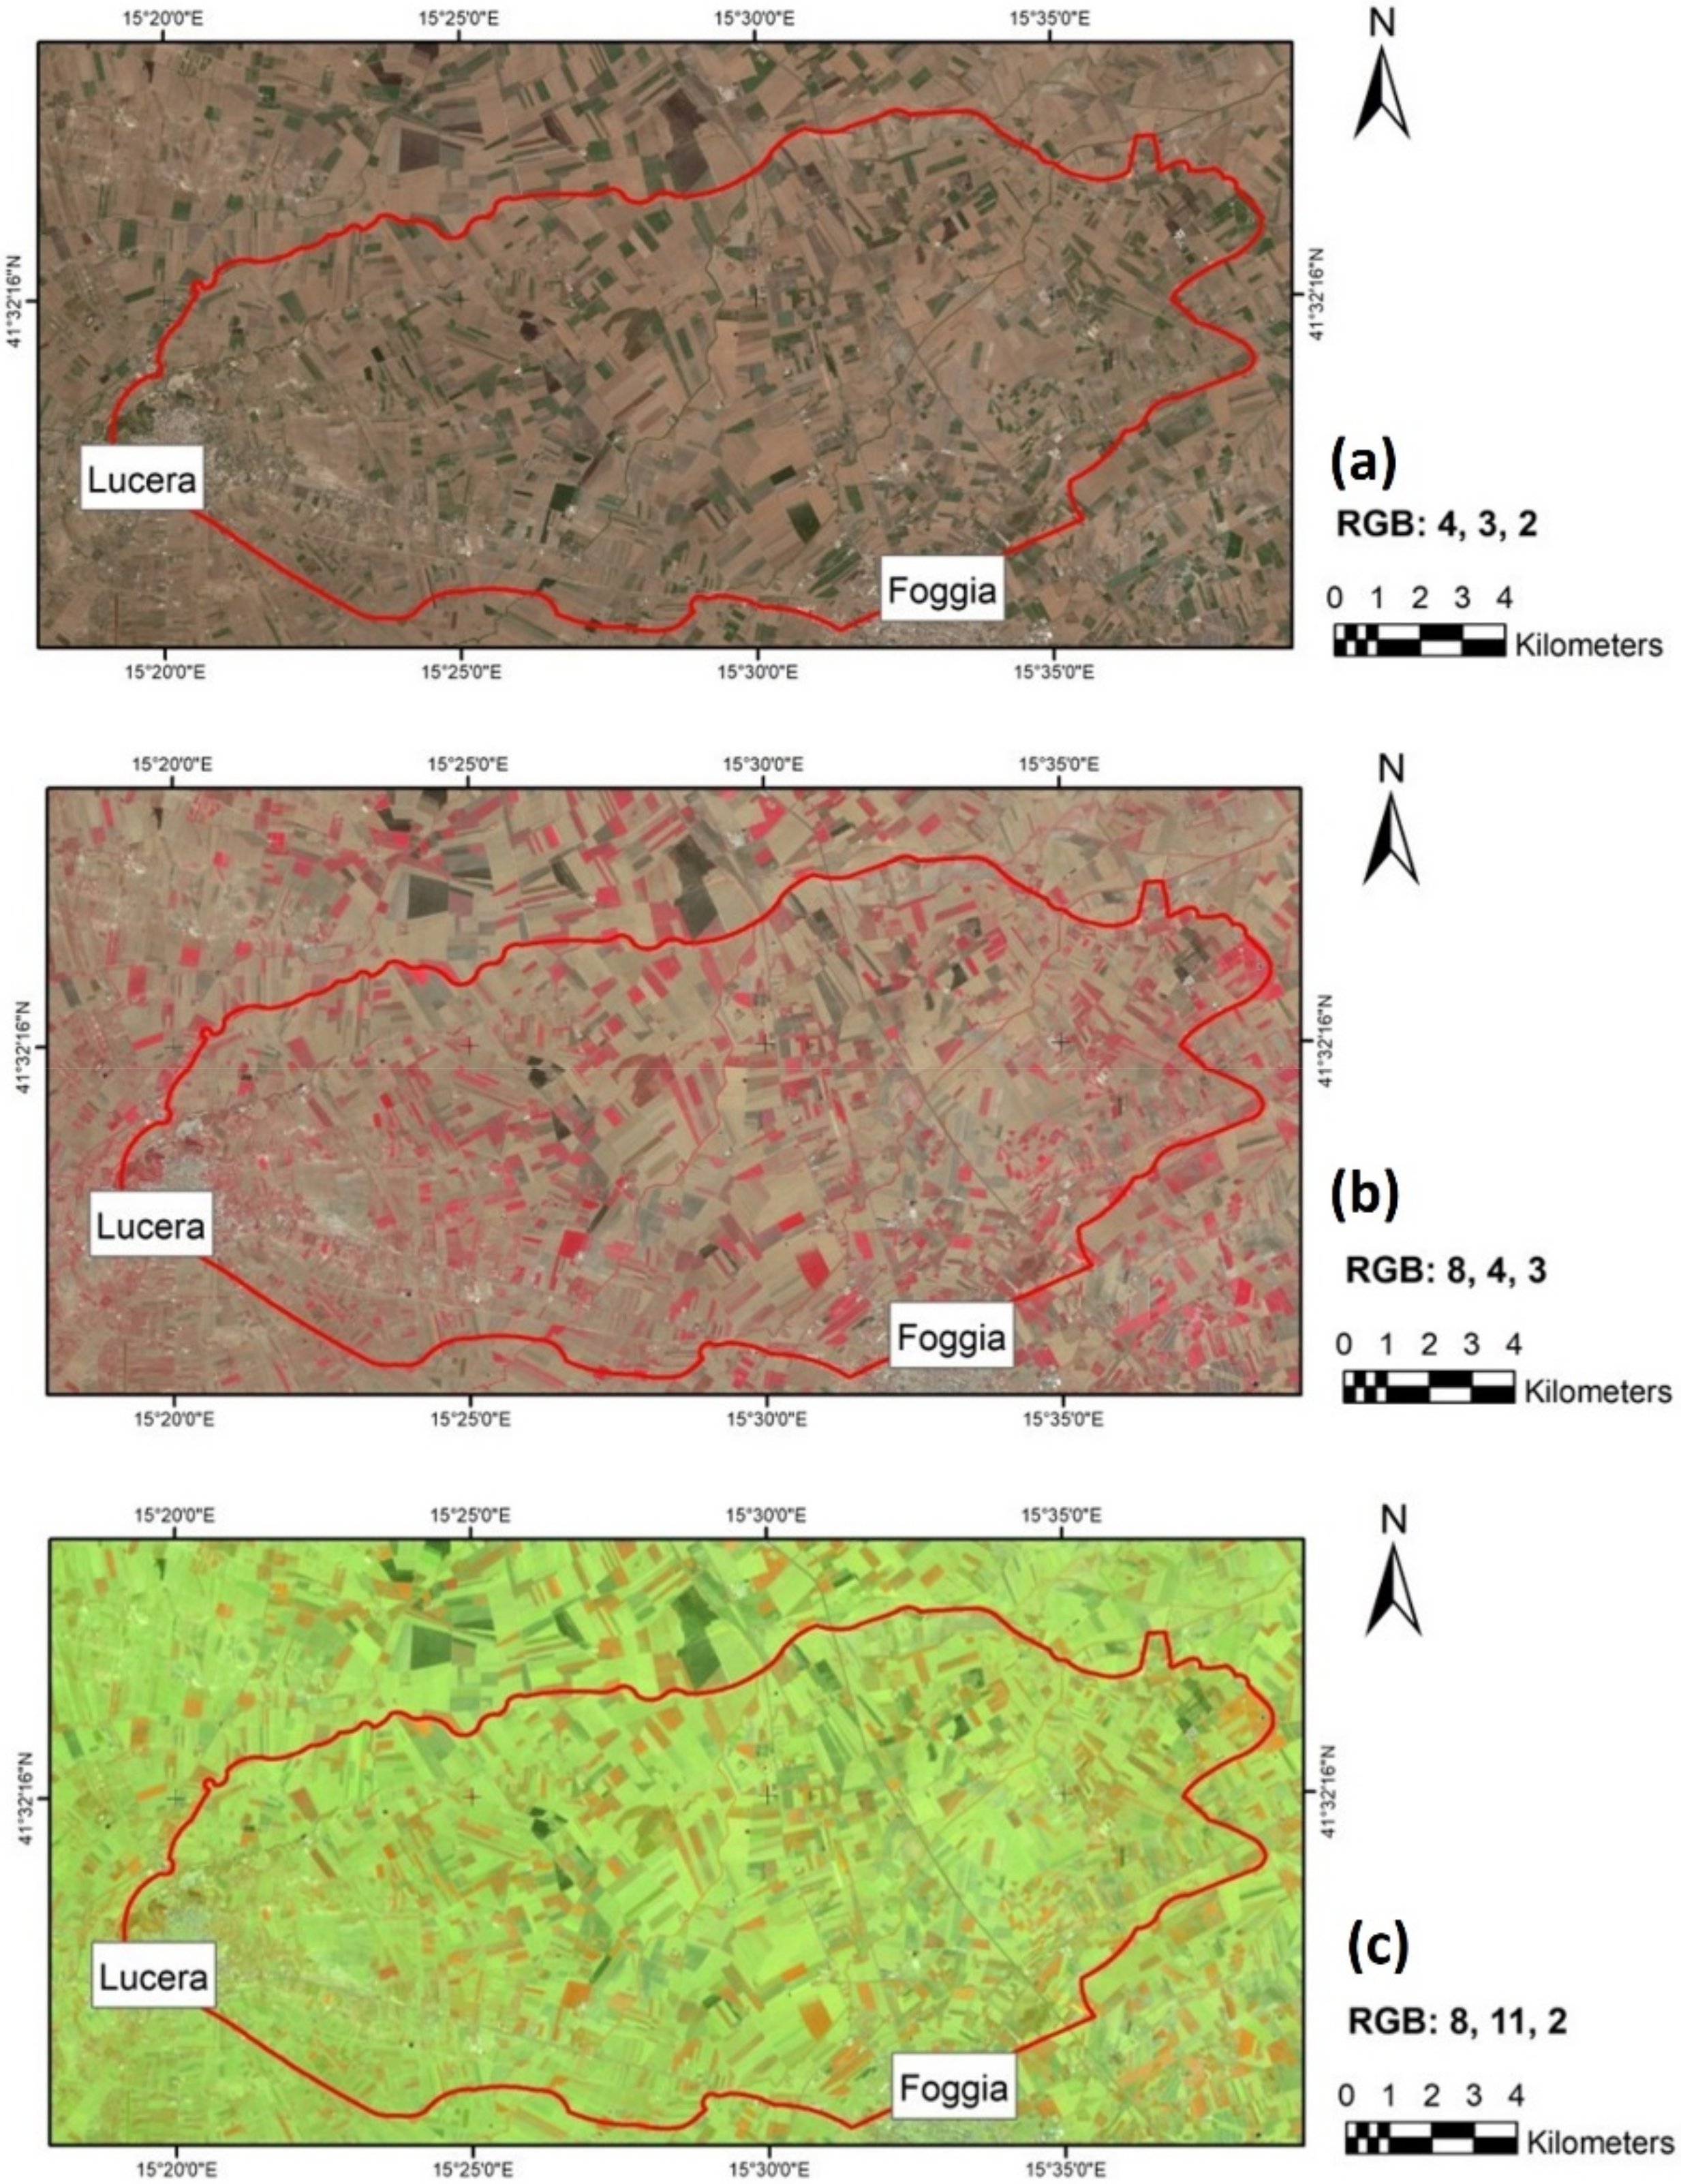
Today, the main scientific challenges to face are linked to the following questions, related to the general use of satellite Earth observation in archaeology and, more specifically, to issues related to the use of Sentinel-2 for archaeological investigations: (i) Is it possible to capture the spectral signatures of archaeological proxy indicators as soil and crop marks considering that the identification of archaeological features is a very complex issue because they are (a) very subtle anomalies linked to presence of buried remains and, moreover, (b) not permanent signal but only visible in specific observational conditions? (ii) Is the spatial resolution of Sentinel-2 a critical limitation being that, except for a few examples [1,2,3], the majority of archaeological investigations have been performed using very high-resolution satellite data?
To provide a contribution in this context, this paper focuses on the use of satellite Sentinel-2 data for assessing their capability at diverse scales of analyses from single site up to a landscape level, i.e., Landscape Archaeology. For the purposes of our investigations, the “Tavoliere delle Puglie”, a plain in northern Apulia (Southern Italy), was selected as a test area due to its long human frequentation and, consequently, its high archaeological potential and variety of cultural heritage features, along with a huge amount of ancillary data and information also available in a GIS environment. In the past the area herein investigated has been widely studied also using very high resolution satellite data as QuickBird, World View [13], geophysical prospection [14,15], along with manned [16,17,18,19,20] and unmanned aerial archaeology prospection [21]. Archaeological recorders along with previous knowledge and information already available in GIS environment are herein adopted as ground truth [22,23,24,25,26,27] to assess the potentiality of Sentinel-2 data in known archaeological sites related to different periods and civilizations, from Neolithic era to Greek-Roman and Middle Ages [28,29,30,31,32,33]. A multitemporal (2016–2019) Sentinel-2 data set is herein analyzed to characterize the spectral signatures of soil and crop marks and capture their temporal behavior, being that they are not permanent but only visible in specific observational conditions.
The paper is organized as follows, we described in Section 1 (1.1) the study area and (1.2) the Sentinel-2 data; in Section 2 the methodological approach adopted to (2.1) extract the spectral signatures from region of interest (ROIs), known archaeological areas and identify the best spectral indices along with the enhancement techniques to (2.2) further highlight the archaeological features; in Section 3 the results obtained for the whole study area the “Tavoliere delle Puglie” covering approximately 224 km2 (in the Foggia province), and, finally, in Section 4 and Section 5 discussion and conclusion, respectively.

1.1. Study Area

The investigations were carried out (Figure 1) in “Tavoliere delle Puglie”, corresponding to the current Foggia province, in Northern Apulia (Southern Italy), well known for its archaeological sites from prehistoric to industrial period. It is a plain area largely cultivated (olive trees and vines) since prehistorical times, being one of the areas where agriculture developed in Europe [22].
The Tavoliere was selected as a test area for a huge amount of ancillary data and archaeological records available in GIS environment and, therefore, represents an excellent starting point for the analysis and validation of outputs from satellite Sentinel-2 data. The WebGIS of the Italian Ministry of the Environment, along with the CartApulia WebGIS, and the WebGIS data of the Ministry and the Region of Puglia, provided: (i) high-resolution aerial images; (ii) high-resolution satellite images; (iii) LiDAR 1x1m; (iv) historical cartography; (v) modern and ancient toponymy; (vi) geo-localized points with references to well-known archaeological sites from archives, surveys and excavation, etc. [20,23,25,27,34,35,36,37]. Moreover, the flat morphology of the area along with its agricultural vocation and, therefore, the availability of large spaces free by buildings, made it an ideal place to test satellite Sentinel-2 capability for landscape archaeology.
The area is widely recognized as one the most important regions in the world for the presence of Neolithic settlements, dated between the 6th and 4th millennium BC. In Italy the spread of farming is traditionally associated with Tavoliere where, since their discovery between the late 1940s and 1950s through aerial photographs, a great number of studies have been conducted [16]. These settlements are medium to large sized ditched villages, characterized by circular shape, composed of huts surrounded by circular ditches (small compounds). They are often found along the rivers which were a source of food (being rich of fish and other edible aquatic resources) and of course, a major source of fresh water (for drinking and irrigation), and also an effective communication system [23,25,34].
The Tavoliere is also very rich in archaeological remains not only related to the Neolithic period but also to other important periods from Bronze Age onwards. As an example, near the town of Arpi Nova, north-west of Foggia, there is the archaeological site of Arpi, datable to the 2nd millennium BC (Bronze Age) [38].
In this period, this area was inhabited by the Daunians, hence the eponymous region of Daunia, which extended from the Ofanto river in the southeast to the Gargano peninsula in the northwest. Daunia underwent the influences of Greek civilization and Magna Graecia from the end of the 5th century BC. During the Roman period, the most important town was Lucera which still preserves an amphitheatre of the Augustan period [39]. Later on, a rich cultural variety followed during the medieval period with the contribution of Byzantines, Longobards, and Saracens (8-11th century AD). [40]. The Tavoliere conserved its importance with the Normans (12th century) and reached its peak with the Emperor Frederick II of Swabia (1194-1250), who built new castles and fortified existing settlements, among which was Lucera [24].
The long and complex history of the Tavoliere is reflected in the very rich archaeological evidences found across the area, studied by means of numerous archaeological excavations and investigations also based on the use of aerial archaeology. In fact, shortly after World War II, John Bradford, of the British Royal Air Force (RAF), observing some anomalies in the vegetation (the so-called crop-marks) [16,17,18] from aerial photos of the Foggia territory, discovered one of the largest Neolithic settlements in Europe known as “Passo di Corvo”. In the case of Neolithic settlements, they are circular or sub-circular features of different sizes, from a few meters to one kilometer diameter [41] and linked to traces of buried structures or anthropogenic transformations of landscape.
In more recent times, the area of Foggia has been investigated also using advanced remote sensing techniques as very high-resolution satellite data, drones, and geophysical prospection [13,14,15]. Over the years, past archaeological studies along with the interest of the Italian and worldwide scientific community for the Tavoliere area produced numerous papers and bibliographic references, very useful to define and date the archaeological features. In the last twenty years, in the whole region thanks to the activity of Soprintendenza and universities, over 1000 sites of archaeological interest were surveyed, and in some cases also excavated, and further investigated using Earth observation techniques [42,43]. So that in addition to the prehistoric remains (characterized by the circular features herein typical of the Neolithic settlements), studies based on aerial archaeology identified other geometric features, potentially linked to archaeological remains of different historical periods. For example, quadrangular shapes or parallel linear traces were refereed, on the basis of metric analysis, to the Roman period as confirmed by excavations which unearthed Roman rural farms, villas, and centuriations [44,45]. Moreover, complex subcircular shaped features, extended near ancient farmland and ruins dated to the medieval period were identified as abandoned villages or fortified settlements (“motte and bailey”) in coherence with other studies conducted in other areas [24].

1.2. Sentinel-2 Data

Sentinel-2 satellite constellations have been developed in the framework of the European Commission Copernicus Programme for security and risk monitoring [4,5,6] and are managed by the European Space Agency (ESA).
In particular, the strengths points of Sentinel-2 are multiple: (i) the twin satellites (A and B) have a regular time acquisition of the Earth’s surface and the same area is (on average) taken every five days; (ii) the data collected are free and made available to the user on the Copernicus Open Access Hub platform (https://scihub.copernicus.eu/dhus/#/home); (iii) the sensor resolution is very high and reaches a maximum of 10 meter; (iv) the sensor is multispectral and acquires in 12 separate bands (Table 1) [46,47].
Blue (B2), Green (B3), Red (B4), and Near Infrared (B8) bands have a resolution of 10 m, while the others have a spatial resolution of 20 m (Vegetation Red Edge and Short Wave Infra-Red) and 60m (Coastal Aerosol, Water Vapour, and Cirrus).
Multispectral images are very useful for archaeologists to identify ancient buried structures or anthropogenic transformation of landscape. The most useful bands for the identification of archaeological markers are: visible (0.4–0.7 µm), Near Infrared (0.7–1.4 µm), and Short-Wave Infrared (1.4–3 µm).
The usefulness of medium and high-resolution satellite data is well established and the procedures for the identification of buried structures are well described in Earth observation studies applied to cultural heritage and aerial archaeology [7,41,48]. In particular, the presence of buried structures or anthropogenic transformation with high impact on the landscape (ditches, trenches, etc.) causes spatial and spectral anomalies and, in turn, differences in reflectance between the pixels related to archaeological features and their background, called crop-/soil-/weed-marks. In the presence of crop, these anomalies are evident from above as differences in the growth or health of the vegetation, or, for bare soil as differences in soil moisture and surface temperature dynamics (thermal gradient) [49]. Previous studies suggested that NIR (Near Infrared) channels and red generally increase the visibility of crop- and soil-marks, respectively [50]. Moreover, to enhance archaeological features and make their identification easier, the use of “spectral indices”, i.e., mathematical combination of different bands is quite commonly adopted [11,51,52,53].
Therefore, in the current study, along with the single spectral channels, spectral indices were also adopted, as listed following and detailed in Section 2.1 (i) NDVI (Normalized Difference Vegetation Index), (ii) SR (Simple Ratio), (iii) Albedo, (iv) GNDVI (Green Normalized Difference Vegetation Index), (v) SAVI (Soil Adjusted Vegetation Index), etc. [52,54,55,56,57,58,59,60,61,62,63,64].

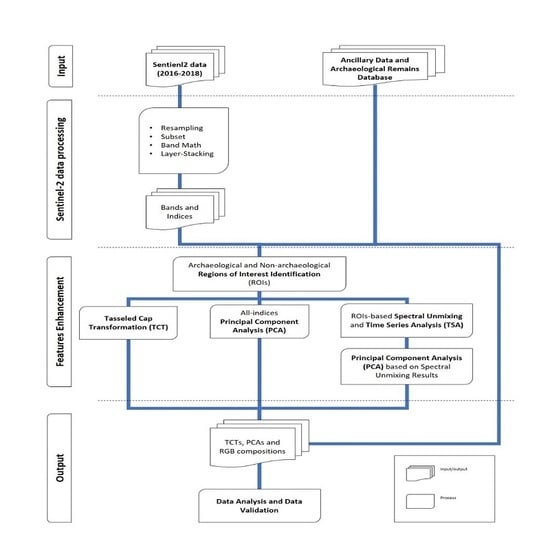
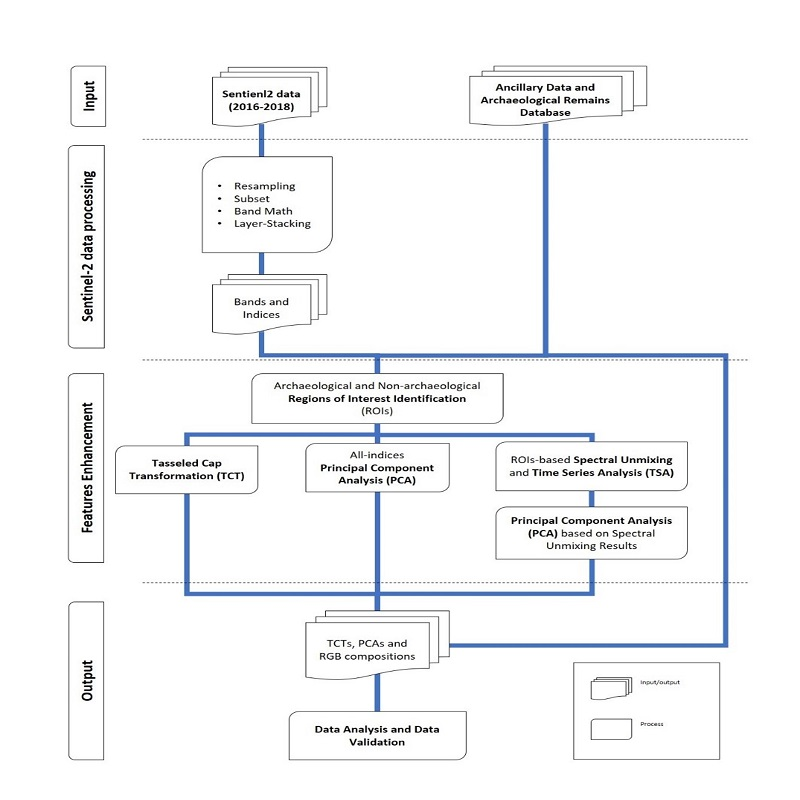
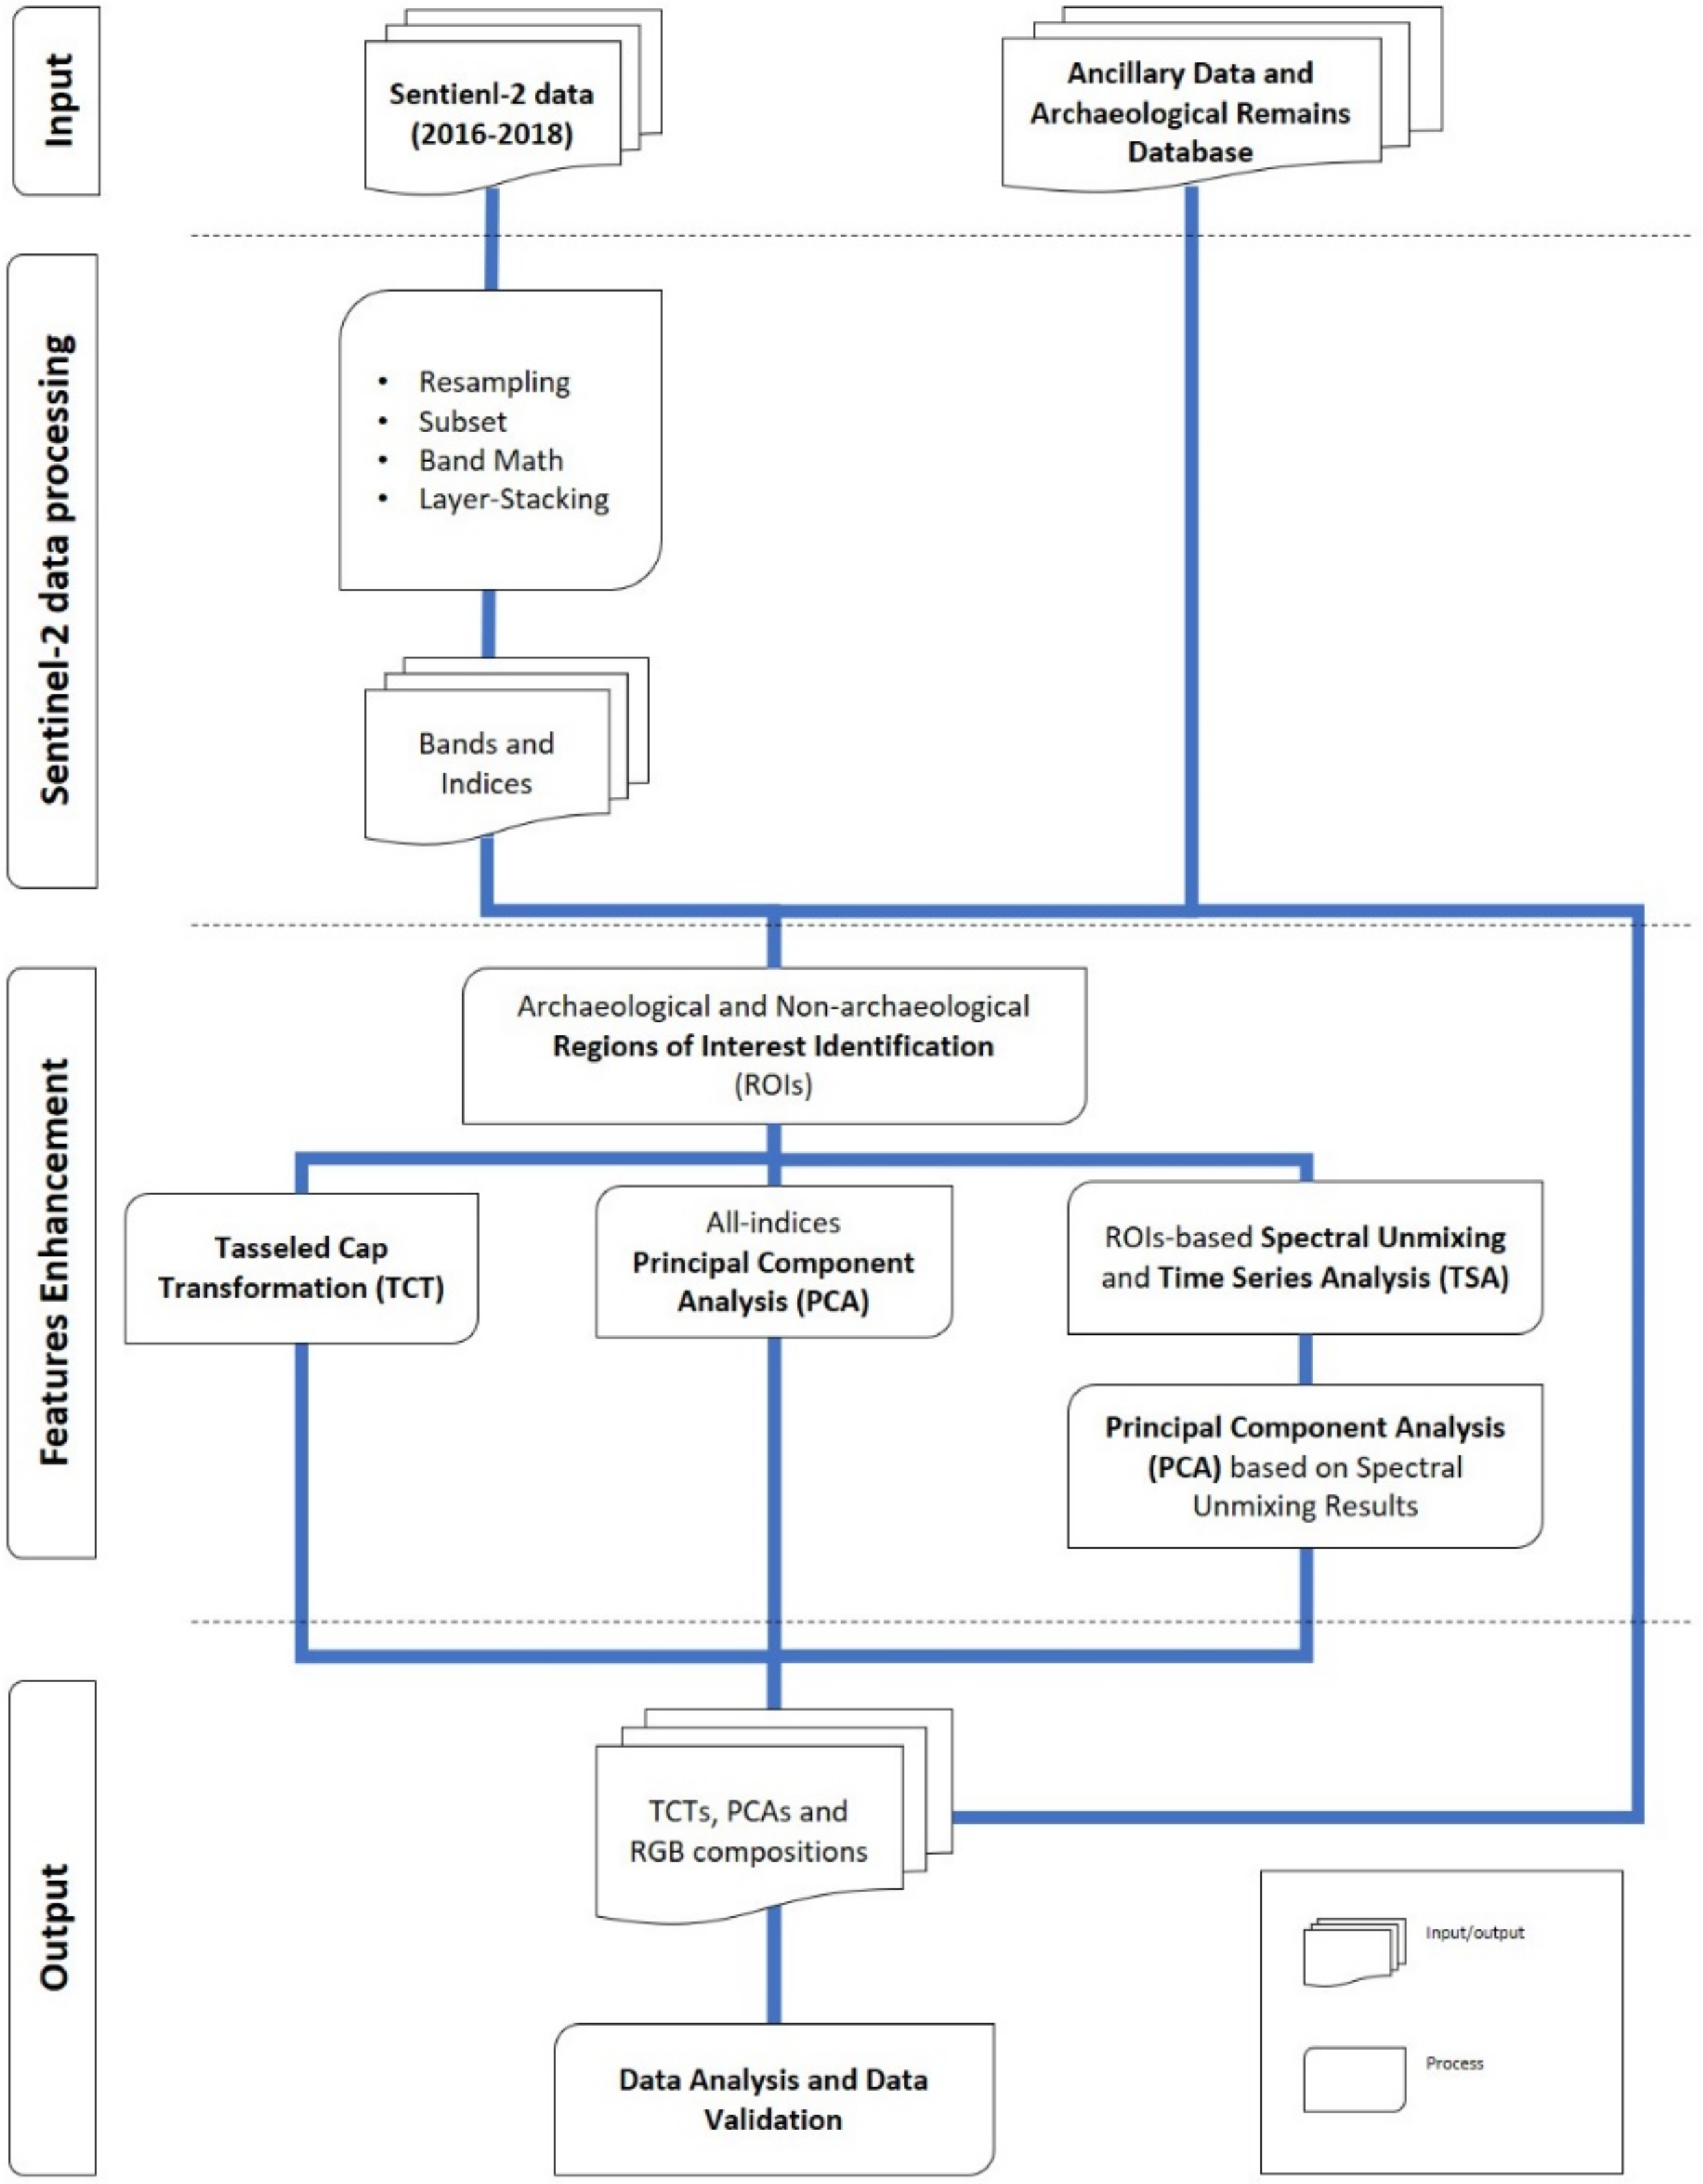
2. Materials and Methods

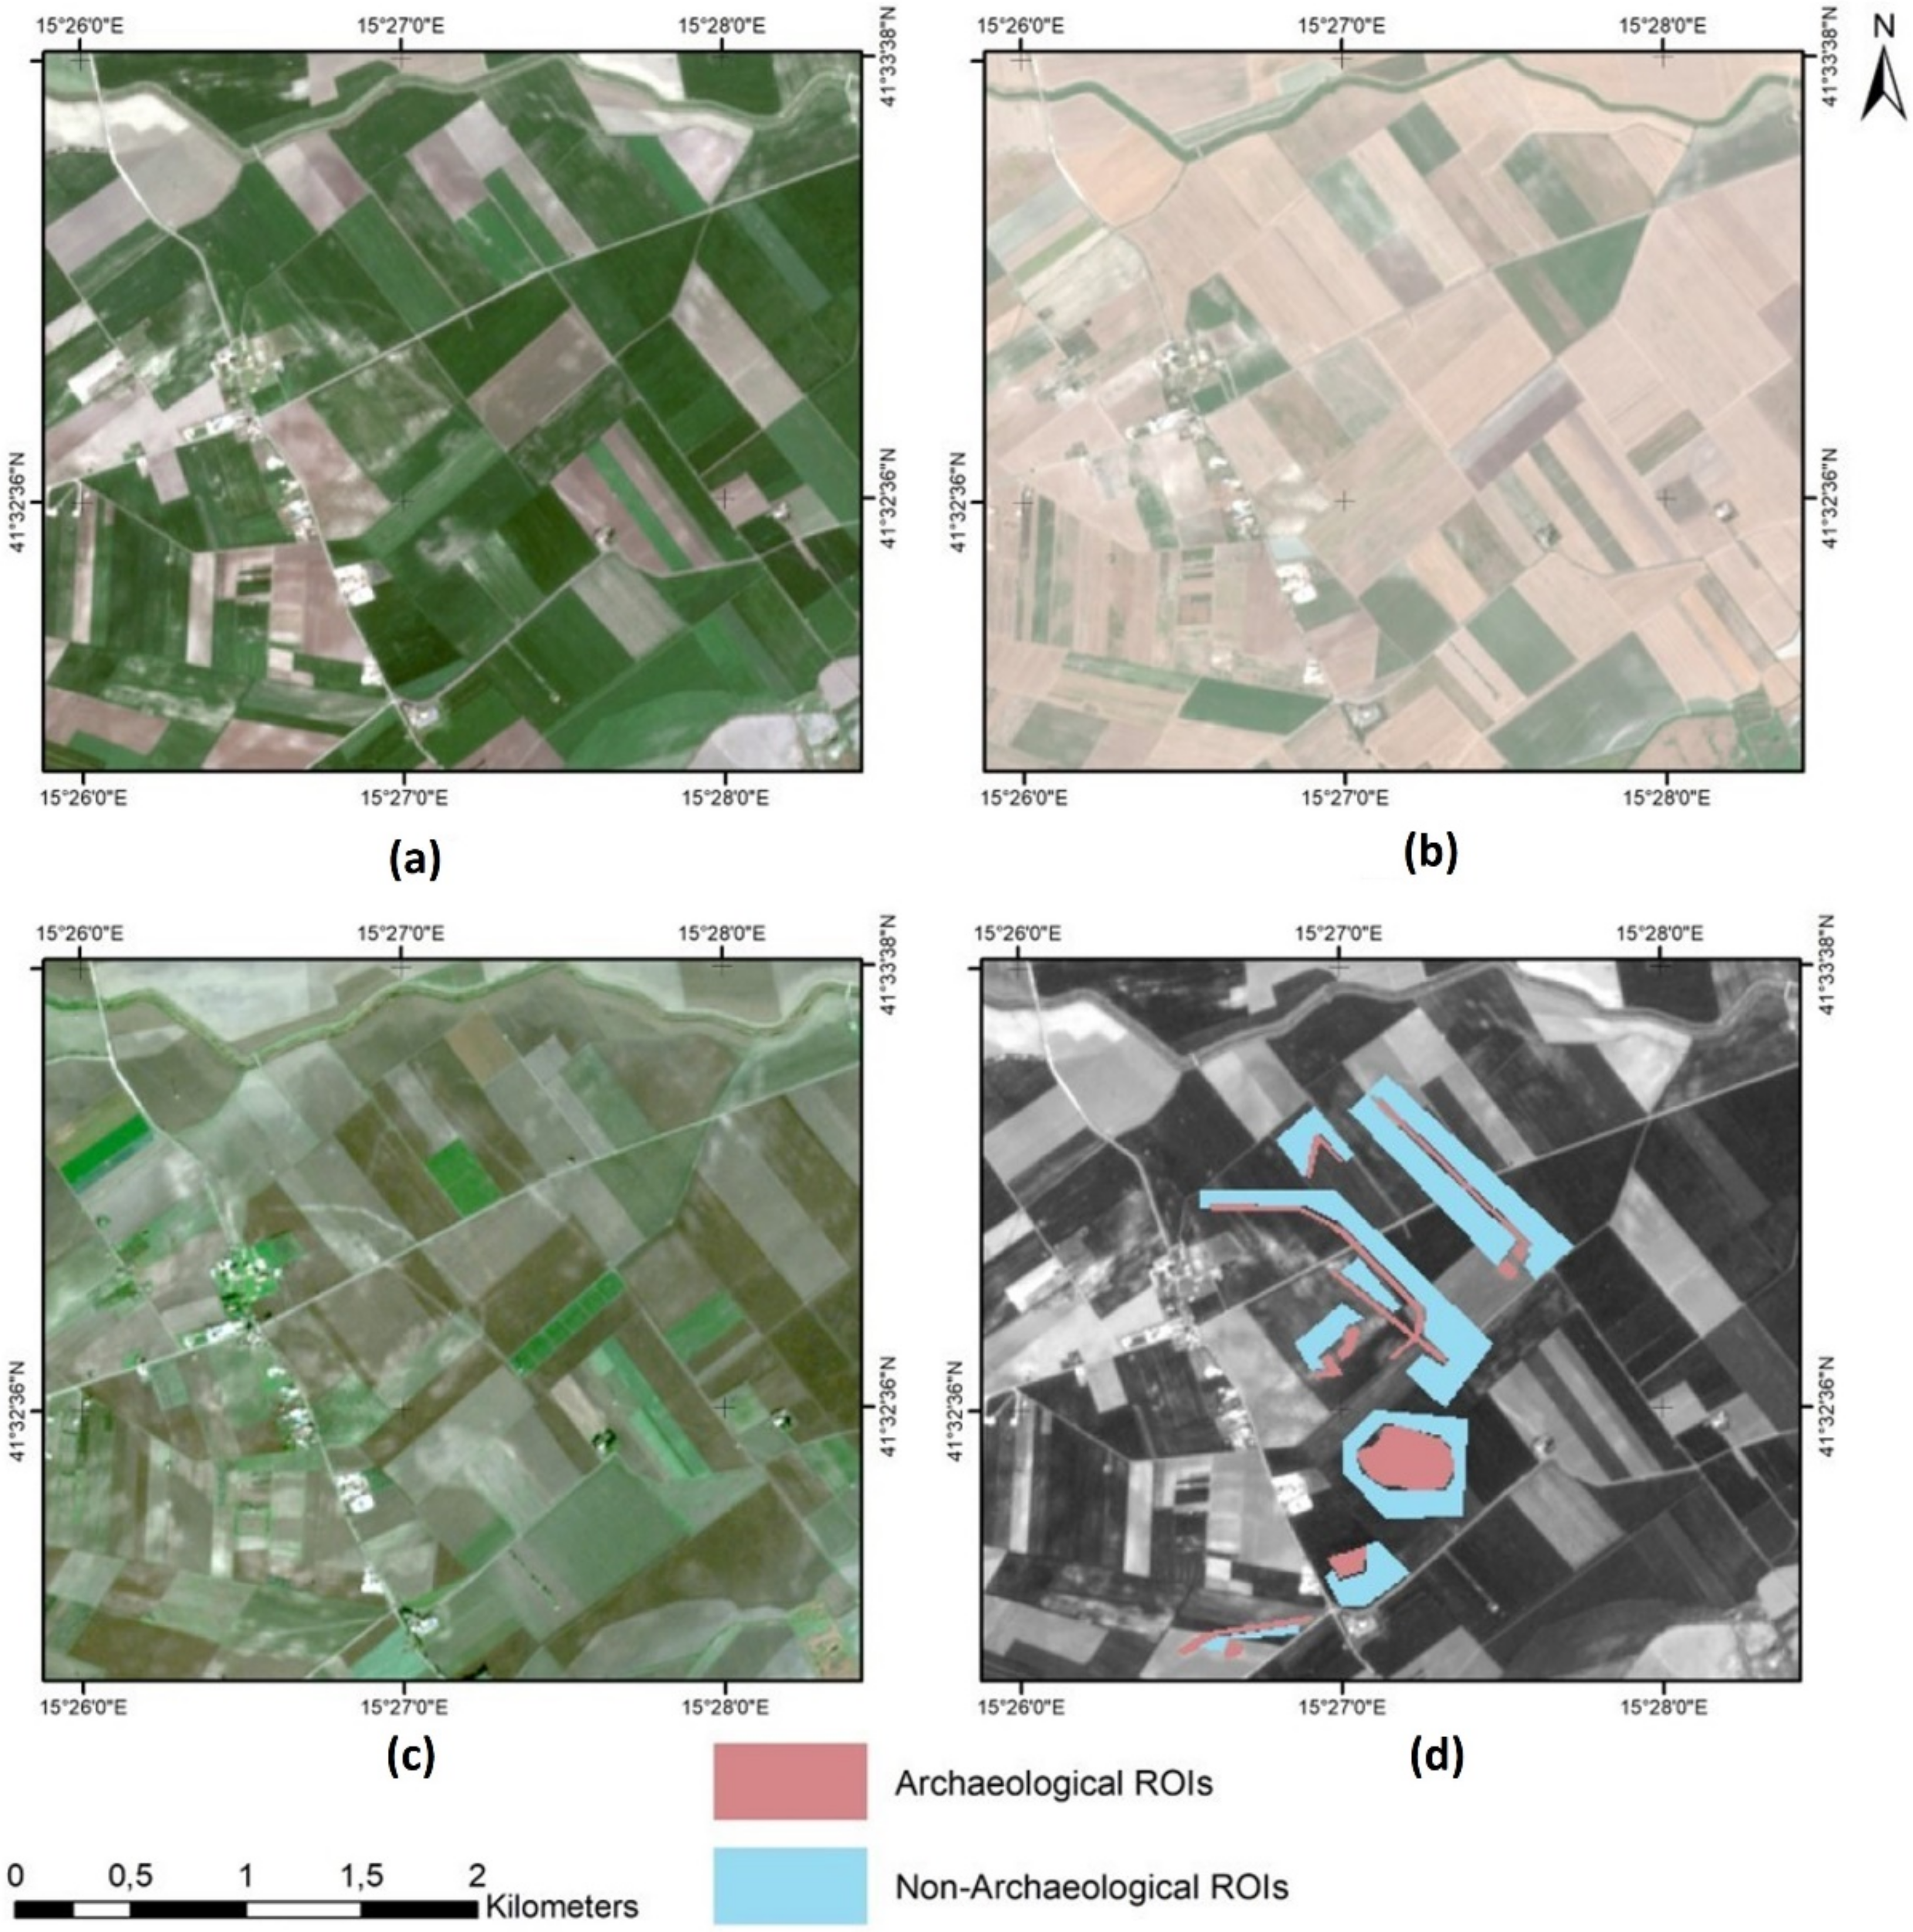
2.1. Sentine-2 Data Processing to Characterize the Spectral Signatures of Soil and Crop Marks in Mediterranen Areas Using Region of Interest (ROIs)

The investigation was performed using multi-temporal (2016–2018) Sentinel-2 multispectral dataset, already used in the field of remote sensing-based archaeology [11,12]. They have been herein analyzed using Time Series Analysis and Spectral Un-mixing tools (available in SNAP: https://step.esa.int/main/doc/tutorials/snap-tutorials/) to cope with the main challenges to face: (i) the fact that the archaeological features linked to buried remains are generally not permanent but only visible in specific observational conditions, and (ii) the need to identify sub-pixel anomalies linked to features of potential archaeological interest. These were further enhanced using (iii) Tasseled Cap Transformation and (iv) Principal Component Analysis which were selected because these were already used in Earth observation for archaeology [50]. All Sentinel-2 images were selected with a cloud coverage less than 5% and, above all, the clouds did not affect the area of interest (covering approximately 224 km2) where most of the currently known archaeological sites were located. Unfortunately, very few data in spring season (during which generally the crop-marks are well visible), could be fruitfully used due to the high cloud coverage. The data were pre-processed using SNAP v.6 (software freely provided by ESA), which allows an XML script to automate the processes though a series of operations as re-sampling, subset, band math to combine different bands, etc. Subsequently, additional analyses were performed also using tools available in ENVI 5.3 and ArcMap 10.4. In particular, on the basis of know archaeological features, the data processing chain was made up of analyses addressed to the identification of: (i) the best indices for the recognition of archaeological features; (ii) the optimal season in which the phenomenon of soil, crop-marks are visible; (iii) the most effective approach to reduce the amount of data size preserving the information. All of these operations were followed by the identification of features and validation based on independent ancillary data (see flowchart in Figure 2).
The XML script was applied as batch-process to all Sentinel-2 files automatically. The resampling function is a native function implemented in SNAP and allows pixel resolution re-scaling to benefit from all Sentinel-2 bands. Bands 2, 3, 4, and 8 (blue, green, red and NIR) were re-sampled at a 10 m spatial resolution [64,65,66].
The subset function was then used to reduce both data size and processing time focusing on the area of interest (224 km2). SNAP software allows the combination of the different bands and, for this study, bands 4-3-2, 8-4-3, and 8-11-2 (Table 1) were used to obtain the following three compositions: (i) RGB, (ii) a False Infrared Color (FCIR), and (iii) Healthy Vegetation (HV) image, as showed in Figure 3. The RGB is similar to the human eye view and shows the visible spectrum, False Infrared Color, and Healthy Vegetation are useful to improve the identification of areas with different reflectance response to enhance the visibility of vegetation anomalies and their neighboring areas (Figure 3) [67].
Subsequently, several indices (mathematical operations between bands) were calculated (using the function “Band Maths”), as suggested by the most recent papers on the subject [15,68], for all the images under investigation. The spectral indices herein considered are mainly of two types: (i) analysis of vegetation health status, and (ii) monitoring of soil and moisture level (Table 2).
These spectral combinations are useful for the enhancement of crop-marks, soil-marks, and anomalies generated by the presence of buried structures of potential archaeological interest [60,61,62,76,77,78]. The NDVI (Normalised Difference Vegetation Index) is one of the most widely used indices also in archaeological applications. NDVI values range from −1 to +1 where negative values or close to 0 correspond to water or soil, whereas higher values correspond to vegetation, with increasing values from sparsely to dense vegetation as well as from stressed to healthy vegetation also depending on vegetation type, plant phenology, and season.
NDVI is sensitive to the absorption of radiation in the Red band, caused by chlorophyll, and the reflection of light in the Near Infrared [49,50,64,76]. Recently, several other indices have been also used for the identification of archaeological features, allowing the discrimination of pixels according to their spectral signature [76,77]. For example: (i) Albedo is an indicator of some surface features, such as brightness [50]; (ii) SR is useful for bare soil analysis; (iii) Green NDVI is a variant of the NDVI index but more sensitive to chlorophyll concentration [55,56]; (iv) SAVI and EVI indices, calculated using the blue, red, and near infrared bands, are useful to reduce background influence [49,50]; (v) GEMI index reduces the influence of the atmosphere [79,80]; (vi) SWIR (NDWI, NVMI) band-based indices are useful to assess the moisture content of soil and vegetation [81,82]; (vii) NAI and RN indices, as well as crop- and soil-indices, use wavelengths from 0.6 to 0.9 to enhance archaeological proxy indicators [82,83].
In order to capture and characterize the trend of the archaeological features within the different bands/indices over the time, the single channels and spectral index maps were further processed using “Time Series Analysis” (TSA). Moreover, in order to identify the best period of the features visibility, TSA was coupled with the Spectral Unmixing analysis, carried out (using the ENVI 5.3 software). Of course, the best period/season in which the phenomenon of soil and crop marks are evident can be different from one index to another and from one features to another even in the same image due effect of local factors [21,51]. Spectral Un-mixing is used to show single pixels values in the images as: (i) minimum value; (ii) maximum value; (iii) average; (iv) standard deviation.
The discrimination between regions of archaeological interest and regions of non-archaeological interest for TSA and Spectral Un-mixing analysis were carried out starting from the data of the WebGis CartApulia. CartApulia was produced by a multidisciplinary group involving: the four Apulian Universities, the Regional Directorate for Cultural Heritage and Activities of MiBACT (Ministero per i Beni e le Attività Culturali e per il Turismo), with the competent Soprintendenza, with the coordination and scientific validation of Prof. Giuliano Volpe. The data in CartApulia are reported as shapes that in some cases follow the contours of the archaeological remains, while in others are approximate. In addition, WebGis reports references to archaeological sites and if they have been verified or not by the public institutions. For this study we used only verified sites for the creation of regions of interest (ROIs) useful for spectral analysis, checking the presence of the selected sites also in other sources (bibliography, aerial photographs, Google, etc.). Archaeological sites to be used as a sample for the definition of ROIs were chosen on the basis of their visibility within the available sources, including Sentinel-2 images (Figure 4). 4000 pixels (2000 for each class) were selected as “positive” and “negative” within Sentinel-2 images. We have considered as “positive” the area occupied by archaeological remains and as “negative” the area immediately outside the “positive” one. This can be seen in Figure 3, as the separation between the archaeological features and its surrounding. The area occupied by the selected pixels corresponds to 0.4 km2. The ROIs were chosen in the area between Lucera and Foggia, which corresponds to Masseria Palmori and Masseria Melillo, and in the area of Arpi. These areas were already known for the presence of Neolithic settlements, Roman and Medieval remains, which are visible in aerial images and satellite data (Figure 4) [16,17,18,19,45,84,85,86,87].
Figure 5 shows the spectral signature and the reflectance value of the pixels as a function of time, which was useful also to obtain the values that characterize the features of archaeological interest and the difference between the features and their neighboring pixels [21,51,64,76,88]. The analysis of the spectral signatures put in evidence a significant difference in reflectance value between archaeological features and their surroundings, from the band 6, 7, 8, 8A, and 11, covering the interval between Red edge and NIR bands, and SWIR band central wave length at 1.610 nm.
The same process was subsequently applied to the different indices produced from the band maths operation (Table 2) (Figure 6).
The multitemporal analysis has been also carried out on the single calculated indices, with the aim to identify the best period of the year (i) to observe the archaeological markers, and, (ii) within the different indices, the highest discriminability of the archaeological features from the background constituted by cultivated fields or bare soils (Figure 6). The multi temporal analysis put in evidence the best results in diverse periods of Summer (first half of July) and autumn (November and December).
Finally, due to the huge amount of data under investigation (single channels and spectral indices), additional improvements in data analysis were addressed at the (i) reduction of multispectral indices/data (one of the main issues in the case of big data analysis) to leave out the less informative multispectral data/indices (ii) further enhancement of the subtle features of interest. To this aim, in this study, Tasseled Cap Transformation (TCTs) and Principal Component Analysis (PCAs) were used, as detailed in Section 2.2 and Section 2.3.

2.2. Data Processing to Enhance Features of Archaeological Interest: Tasseled Cap Trasformation (TCT)

Tasseled Cap Transformation (TCT) is one of the most used methods for the extraction of features of archaeological interest is [41,50,89,90,91,92].
TCT is a conversion of the original images into a new data set obtained by “linear combinations” of the original bands (1) [41]:
TC = WTCDN + B
where (i) WTC depends on the sensor (the coefficients used to create the bands are statistically derived from images and empirical observations, and are sensor-specific) and the number of bands, (ii) DN Digital Number, and (iii) B Bias [41].
The first band of the TCT is related to “brightness”. The second is related to “greenness” and is used as an index of healthy vegetation. The third is ‘wetness’ or ‘yellowness’ and is relevant to soil or canopy moisture.
The original formula was empirically defined by Kauth and Thomas for the Landsat MSS sensor, for the spectral analysis of wheat growth in fields based on Landsat TM [93,94,95]. Currently, TCT is a technique used in land cover mapping and classification today empirically defined for numerous sensor as Landsat TM, ETM, ASTER, MODIS, and IKONOS sensors [96,97,98,99,100,101]. Two different procedures were used for Sentinel-2 images, using the formulas described in the Index Data Base (IDB) portal (2)–(4), database for remote sensing indices (https://www.indexdatabase.de), and Nedkov 2017 (5)–(7), respectively [102]:
TCTb1 = 0.3037 BLU + 0.2793 GREEN + 0.4743 RED + 0.5585 NIR + 0.5082 SWIR (Cirrus) + 0.1863 SWIR (12)
TCTg1 = −0.2848 BLU − 0.2435 GREEN − 0.5436 RED + 0.7243 NIR + 0.0840 SWIR (11) − 0.1800 SWIR (12)
TCTw1 = 0.1509 BLU + 0.1973 GREEN + 0.3279 RED + 0.3406 NIR − 0.7112 SWIR (11) − 0.4572 SWIR (12)
TCTb2 = 0.0822 BLU + 0.1360 GREEN + 0.2611 RED + 0.3895 NIR + 0.0009 SWIR (Cirrus)+ 0.1366 SWIR (12)
TCTg2 = −0.1128 BLU − 0.1680 GREEN − 0.3480 RED + 0.3165 NIR − 0.4578 SWIR (11) − 0.4064 SWIR (12)
TCTw2 = 0.1363 BLU + 0.2802 GREEN + 0.3072 RED − 0.0807 NIR − 0.4064 SWIR (11) − 0.5602 SWIR (12)
TCT components were computed using both the six bands described in the formulas and only the components of Blue, Green, Red, and NIR.
The TCT components were then analysed individually and combined in RGB (R: brightness, G: greenness, B: wetness) (Figure 7).

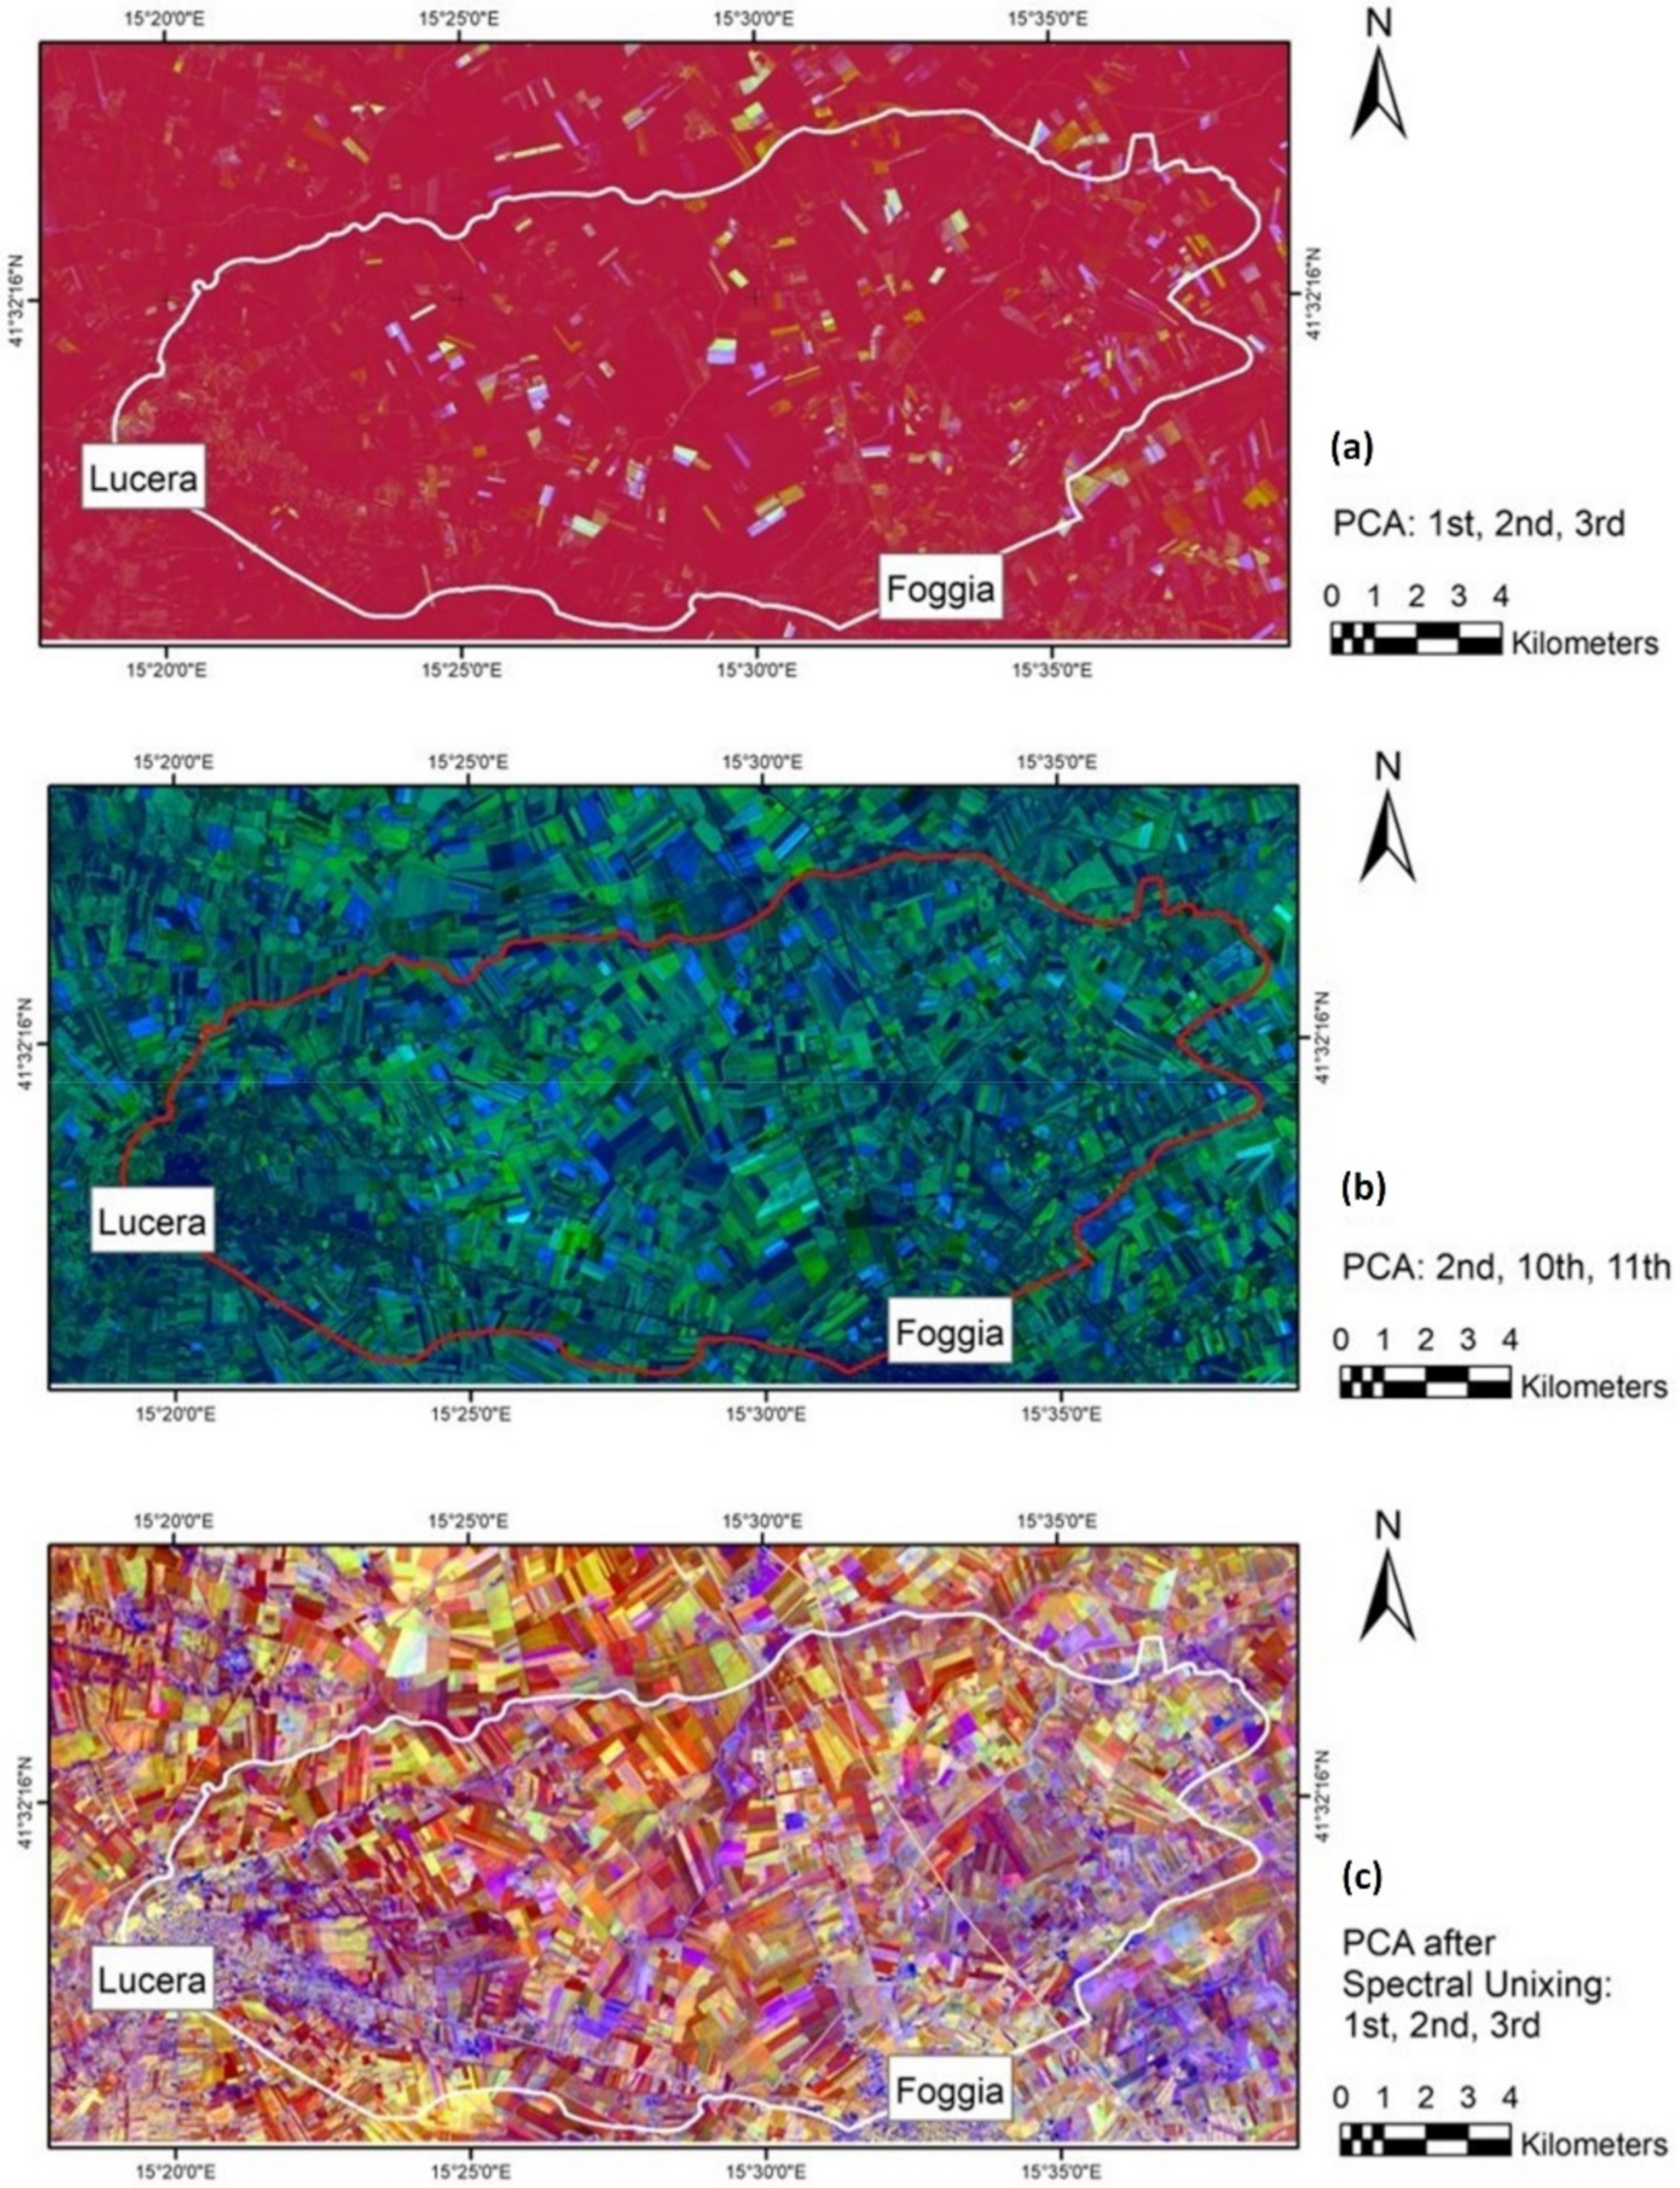
2.3. Data Processing to Enhance Features of Archaeological Interest: Principal Component Analysis (PCA)

PCA is a transformation already used in the past to better enhance features of archaeological interest or assess the change over time for cultural heritage monitoring [92,103,104,105,106]. Moreover, PCA is particularly useful to reduce redundant information and, in turn, the amount of data [41]. Therefore, PCA was herein adopted to reduce the data and facilitate the identification of individual features. To this aim, we analyzed both (i) the data produced during the first phase of image processing and (ii) their transformation as PCA components.
From the computational point of view, PCA, also known as Karhunen-Loéve transformation or Hotelling transformation, is an orthogonal decomposition widely used in multivariate statistics. PCA can be considered as a rotation of the cartesian axes of a new orthogonal system of variables, where the variables are represented without correlation [41]. The PCA operation consists of the following main steps: (i) averaging the pixels of the input images to calculate an average image, and subtracting the calculated average image from each input image; (ii) calculating the covariance (or variance) matrix on all input bands; (iii) decomposing the covariance matrix’s own eigenvalue to obtain new images [41] called components.
As a whole, PCA is a linear transformation that transforms a number of related variables into a (smaller) number of unrelated variables, called main components, which still contains much of the information present in the input dataset.
PCA was applied to both of the two different data sets: (i) the single spectral images and indices; (ii) a selection of indices based on Spectral Unmixing usefulness (Figure 5 and Figure 6).
Datasets of 364 images (spectral bands and indices) and 40 images were used, respectively, for the first and second processes.
The analysis of the PCAs components was based on RGB composition considering the three RGB images, (i) RGB with R: 1st component, G: 2nd component, and B: 3rd component, resulting from the first process (Figure 8a); (ii) RGB with R: 2nd component, G: 10th component, and B: 11th component, resulting from the first process, following an autopsy analysis of the most performing components for this study (Figure 8b); (iii) RGB with R: 1st component, G: 2nd component, and B: 3rd component, resulting from the second process (Figure 8c).
The set of outputs produced by the described methodologies has been analyzed in a GIS platform together with ancillary data from other sources.

3. Results

As detailed above, in Section 2 the first results, obtained from the analyses of the region of interests, were the characterization of the spectral signature of soil and crop marks (see Figure 5 and Figure 6).
In this section we present the results, obtained for the whole study area related to the “Tavoliere delle Puglie” covering approximately 224 km2 (in the Foggia Province), and successfully compared with independent data sources, so that this enabled the: (i) identification of the best indices to highlight the archaeological features and the best period of the year to capture soil and crop marks; (ii) discovery of unknown archaeological areas.
The high number of detected features characterized by possible archaeological interest were compared with ancillary data available from independent data sources as described in 1.1. Different tools were used for the validation (i) match with bibliography related to the investigated area [20,21,22,23,24,25,26,27,34,35,36,37,107,108]; (ii) comparison with Google Earth multi-temporal high-resolution images [109,110,111]; (iii) comparison with data of the National GeoPortal of the Italian Ministry of the Environment (http://www.pcn.minambiente.it/viewer/), and (iv) the data on the WebGis CartApulia (http://www.cartapulia.it/).
In particular, the data derived from WebGis CartApulia have been of great utility for the research as it is a GIS produced by the Region of Puglia, containing an “Archaeological Map of the Cultural Heritage of the Region of Puglia” based on the archives of the Soprintendenza, the Italian authority responsible for protecting and safeguarding of cultural heritage.
The GIS contains all the sites currently known from archaeological excavations, aerial photo analysis, and field reconnaissance activities, and proposes hypotheses of dating and characterization of contexts.
The ancillary data were of fundamental importance to understand the usefulness of the images produced by processing Sentinel-2 data.
The first outputs from analysis based on known archaeological features were the identification of (i) the indices that better enhance the archaeological proxy indicators, (ii) the period when the archaeological proxy indicators exhibited the best visibility, and in turn the discriminability. RGB and FCIR images show (see Figure 3) a complex pattern of overlapped traces related to settlements, roads, canals, and other buried structures belonging to different historical periods and, therefore, are quite difficult to characterize correctly.
In addition, the differences that indicate the presence of possible structures or effects of anthropogenic transformation of landscape were well delineated using the spectral separability (see Figure 5 and Figure 6) applied to the ROIs within the individual bands and the spectral indices. The most performing indices are those involving the Green, Red, and NIR bands, such as (i) crop-band, (ii) soil-band, (iii) RN, (iv) NDVI (Table 2), as expected according to the past investigations [7,8,11,12,13,14,70,71,72,73,74,75,76]. This is certainly due to the high resolution that the Sentinel-2 satellites have in these bands (10 m).
The analysis of spectral signatures, obtained on the basis of the Sentinel-2 bands, shows an irregular trend over time in the spectral separability between the archaeological and non-archaeological ROIs. In accordance with Figure 5 and Figure 6, the analysis of ROIs in the same months of the year, one year later (e.g., July 2016–July 2017), shows totally different data, probably related to weather conditions, soil moisture and land use. Features are clearly visible in single bands, as well as in RGB and FCIR compositions (Figure 9). However, some types of features are more visible in some images (compositions or single bands) than others.
The comparison of the diverse spectral indices, showed that the archaeological features were well highlighted in the TCT first (brightness), and second (greenness) component, along with the RGB from the first three TCT components (as follow: R: 1st TCT, G: 2nd TCT, B: 3rd TCT).
It is important to highlight that the features were more visible from the individual products, in particular from the TCT brightness and greenness as obtained from Formulas (2) and (3), an example (a zoom of a subset of the study area) is shown in Figure 10.
The image produced from the components of the PCA is definitely the one that provides the most information about the possible presence of buried remains and allows an easy identification and interpretation thanks to the sharp contrast between the features and the background. Inside the image, many archaeological features were clearly visible (i) traces of settlements and defensive moats, characterized by the circular or sub-circular shape typical of Neolithic settlements (Figure 11) in the region; (ii) traces of roads, communication routes and defensive complex of diverse ages (Figure 12); (iii) traces of paleo-channels, and other evidence of archaeological interest for the reconstruction of the ancient landscape. Of course, as expected, not all the images produced by PCA are useful for features analysis. The RGB image produced from the first three components (Figure 8a) is probably the worst for archaeological research because it shows a flattening of “ephemeral” elements such as archaeological features, in favor of persistent elements in all images such as buildings, modern roads and field boundaries. The RGBs (Figure 8b,c) are more suitable for archaeological studies as the two images can be defined as complementary: in each of them some elements are highlighted (Figure 11 and Figure 12).
The analysis of the images allowed the identification of several features of possible archaeological interest. In many cases the hypotheses have been confirmed using the tools and the data sources described above (e.g., Masseria Palmori, Masseria Schifata, Masseria Villano, or Località Masseria Petrullo), whereas other hypotheses are not confirmed with the documentation currently available because they show unknown sites not yet identified or surveyed and therefore, not yet included into the CartApulia Database. The discovery of new sites appears to be one of the strengths of the elaborated PCAs. The validation of the data, however, plays a fundamental role in the analysis of the images and in the evaluation of their real potential. In fact, starting from the recognition of known sites, it is possible to understand the different types of features, and to attribute a specific connotation to most of them, creating a training database for the identification and characterization even of sites not yet discovered (Figure 13).

4. Discussions

In this paper, the capability of satellite Sentinel-2 data in the identification of archaeological proxy indicators (soil and crop marks) has been assessed in the Mediterranean area of “Tavoliere delle Puglie”, selected because it is characterized by a long human frequentation and, therefore, is very rich in archaeological remains, from the Neolithic Era to Bronze, Greek-Roman, and Middle Ages.
Results from the investigations performed using a multi-temporal 2016–2019 dataset of Sentinel-2 imagery enabled us to extract the spectral signatures of soil and crop marks thus highlighting the capability of Sentinel-2 for the detection of archaeological features. Moreover, outputs from our analyses enabled us to identify the spectral indices that performed better in the detection of soil and crop mark and the best period of the year to capture them.
The spectral separability of the archaeological evidence was analyzed considering both single channel and spectral indices. The single channels (i.e., spectral bands) perform better than the spectral indices for the identification of the archaeological features. The contrast of archaeological features and their surrounding is significant, as is well-defined in the spectral signatures obtained and shown in Figure 5, Figure 6 and Figure 9.
Related to the spectral indices, the highest discrimination capability was observed from TCT (brightness and greenness component) and PCA outputs, and the best period of the year to capture soil and crop mark, was April and the autumn September and even December in the case of good quality image (i.e., no cloud cover). Of course, it is important to consider that the period of the best visibility is influenced by several factors that in the case of Foggia (that is an agricultural area) are mainly: (i) meteorological conditions; (ii) crop rotation; (iii) type of features. As a general approach, the characterization of the best period of the visibility of the archaeological features can be identified from investigations conducted in known sites using a multitemporal data set to assess the inter and intra year visibility. In particular, in the current case, the multitemporal 2016–2018 Sentinel-2 data was analyzed because the years considered were characterized by meteorological conditions significantly different from one year to another. As an example, the 2017 was a drought year with low rain compared to average rainfall, whereas the 2018 was characterized by abundant rain precipitation, which also occurred even during the summer period, which therein is generally a quite dry period. Data acquired by the Italian Civil Protection weather stations report for the period June-September: (i) 2016: 203 mm; (ii) 2017: 72.4 mm; (iii) 2018: 126 mm, (iv) 2019: 86 mm [112].
However, the visibility of the archaeological features inside the multi-temporal images is variable and related to phenomena that, as already mentioned, concern weather and land use, as well as the type of soils and buried archaeological remains.

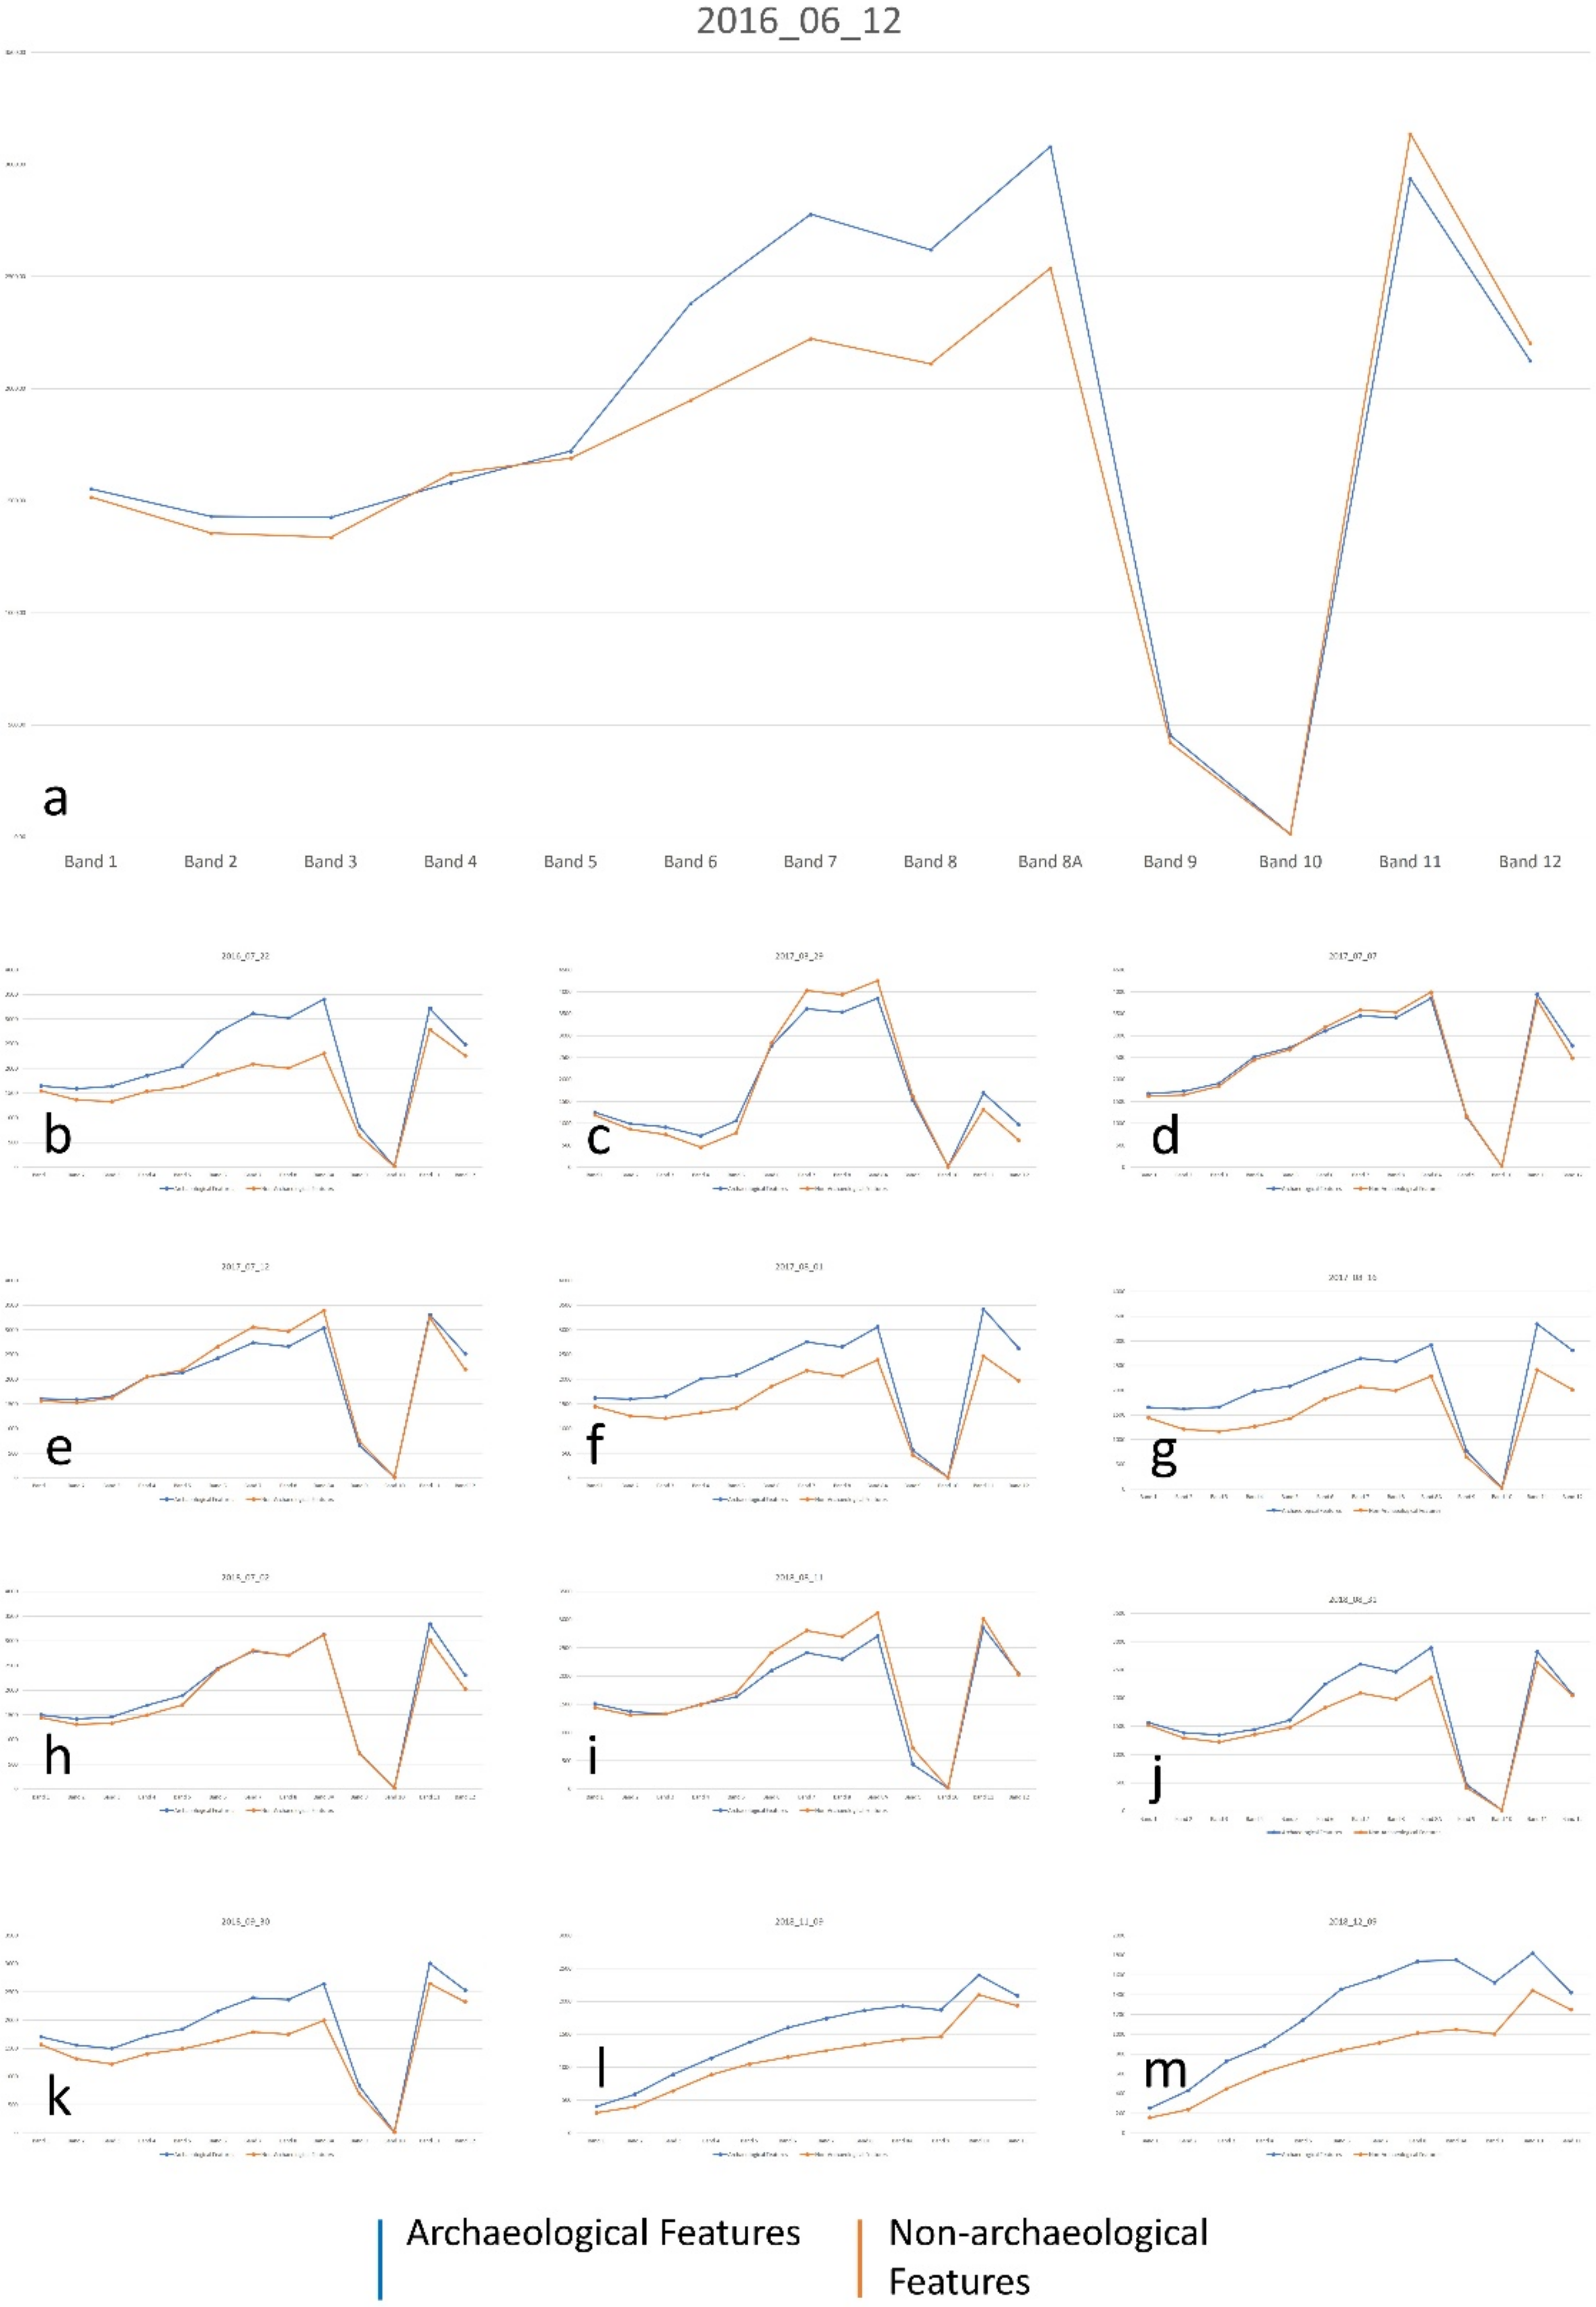
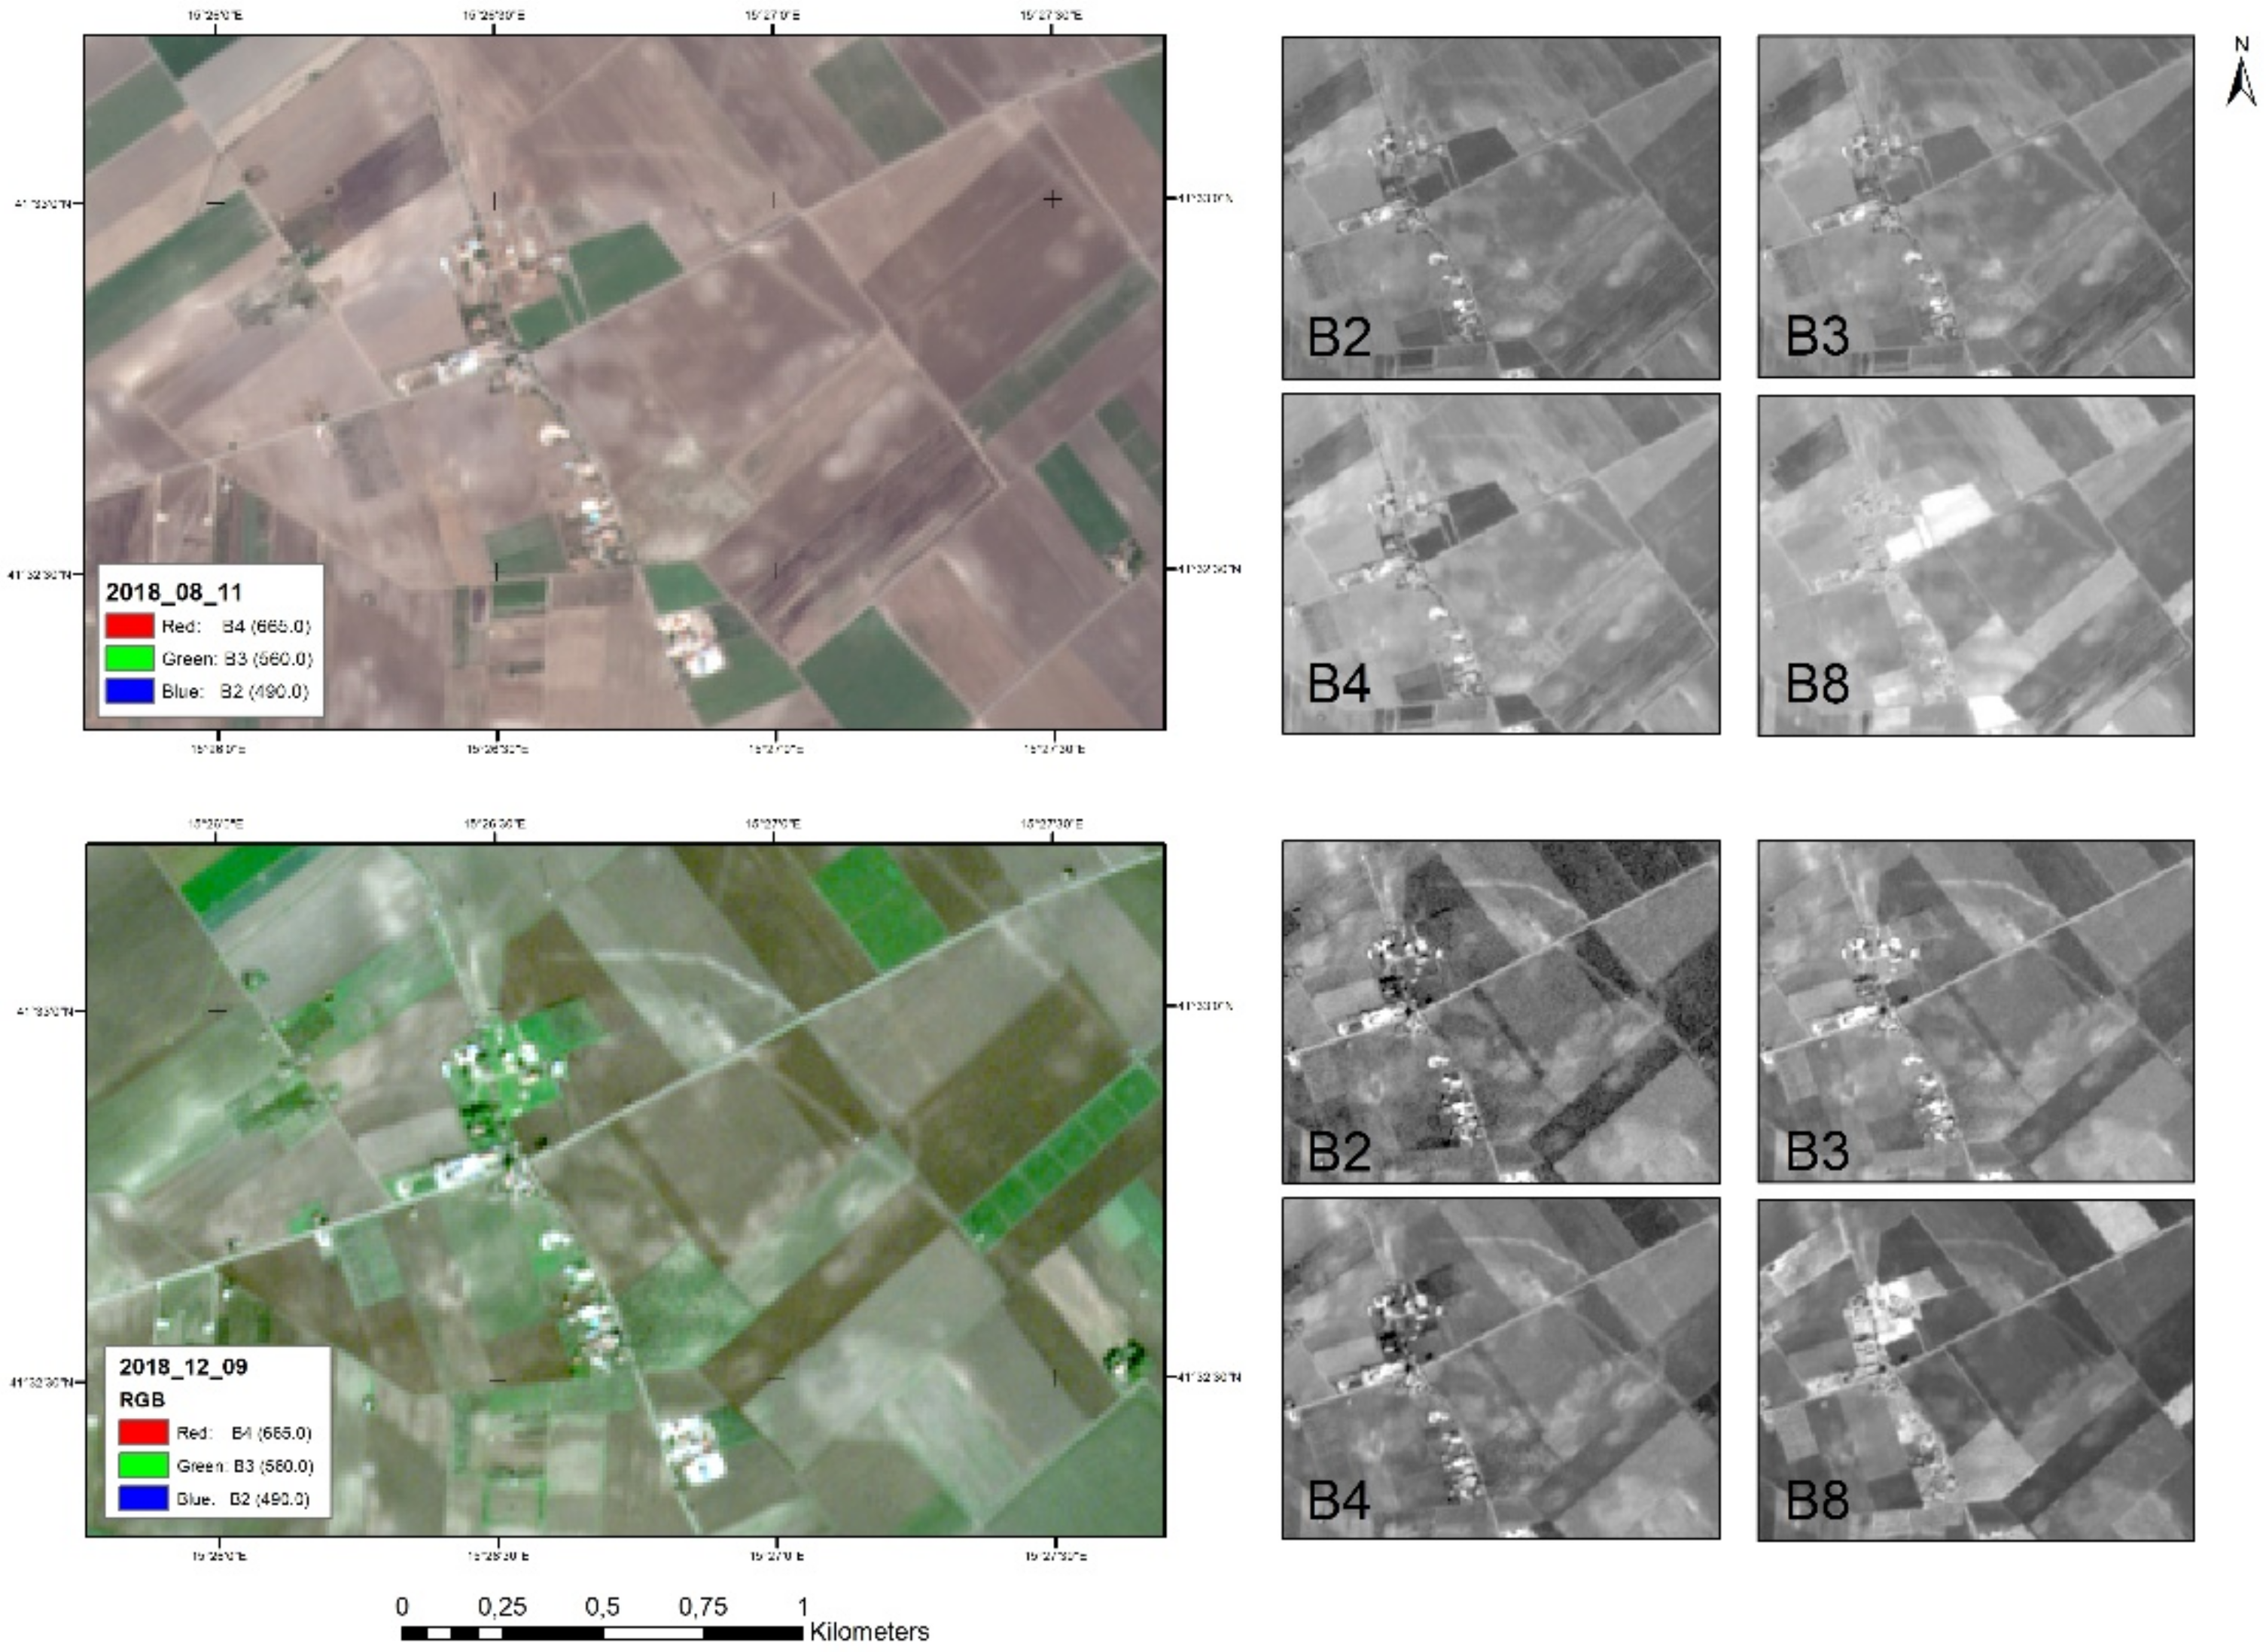
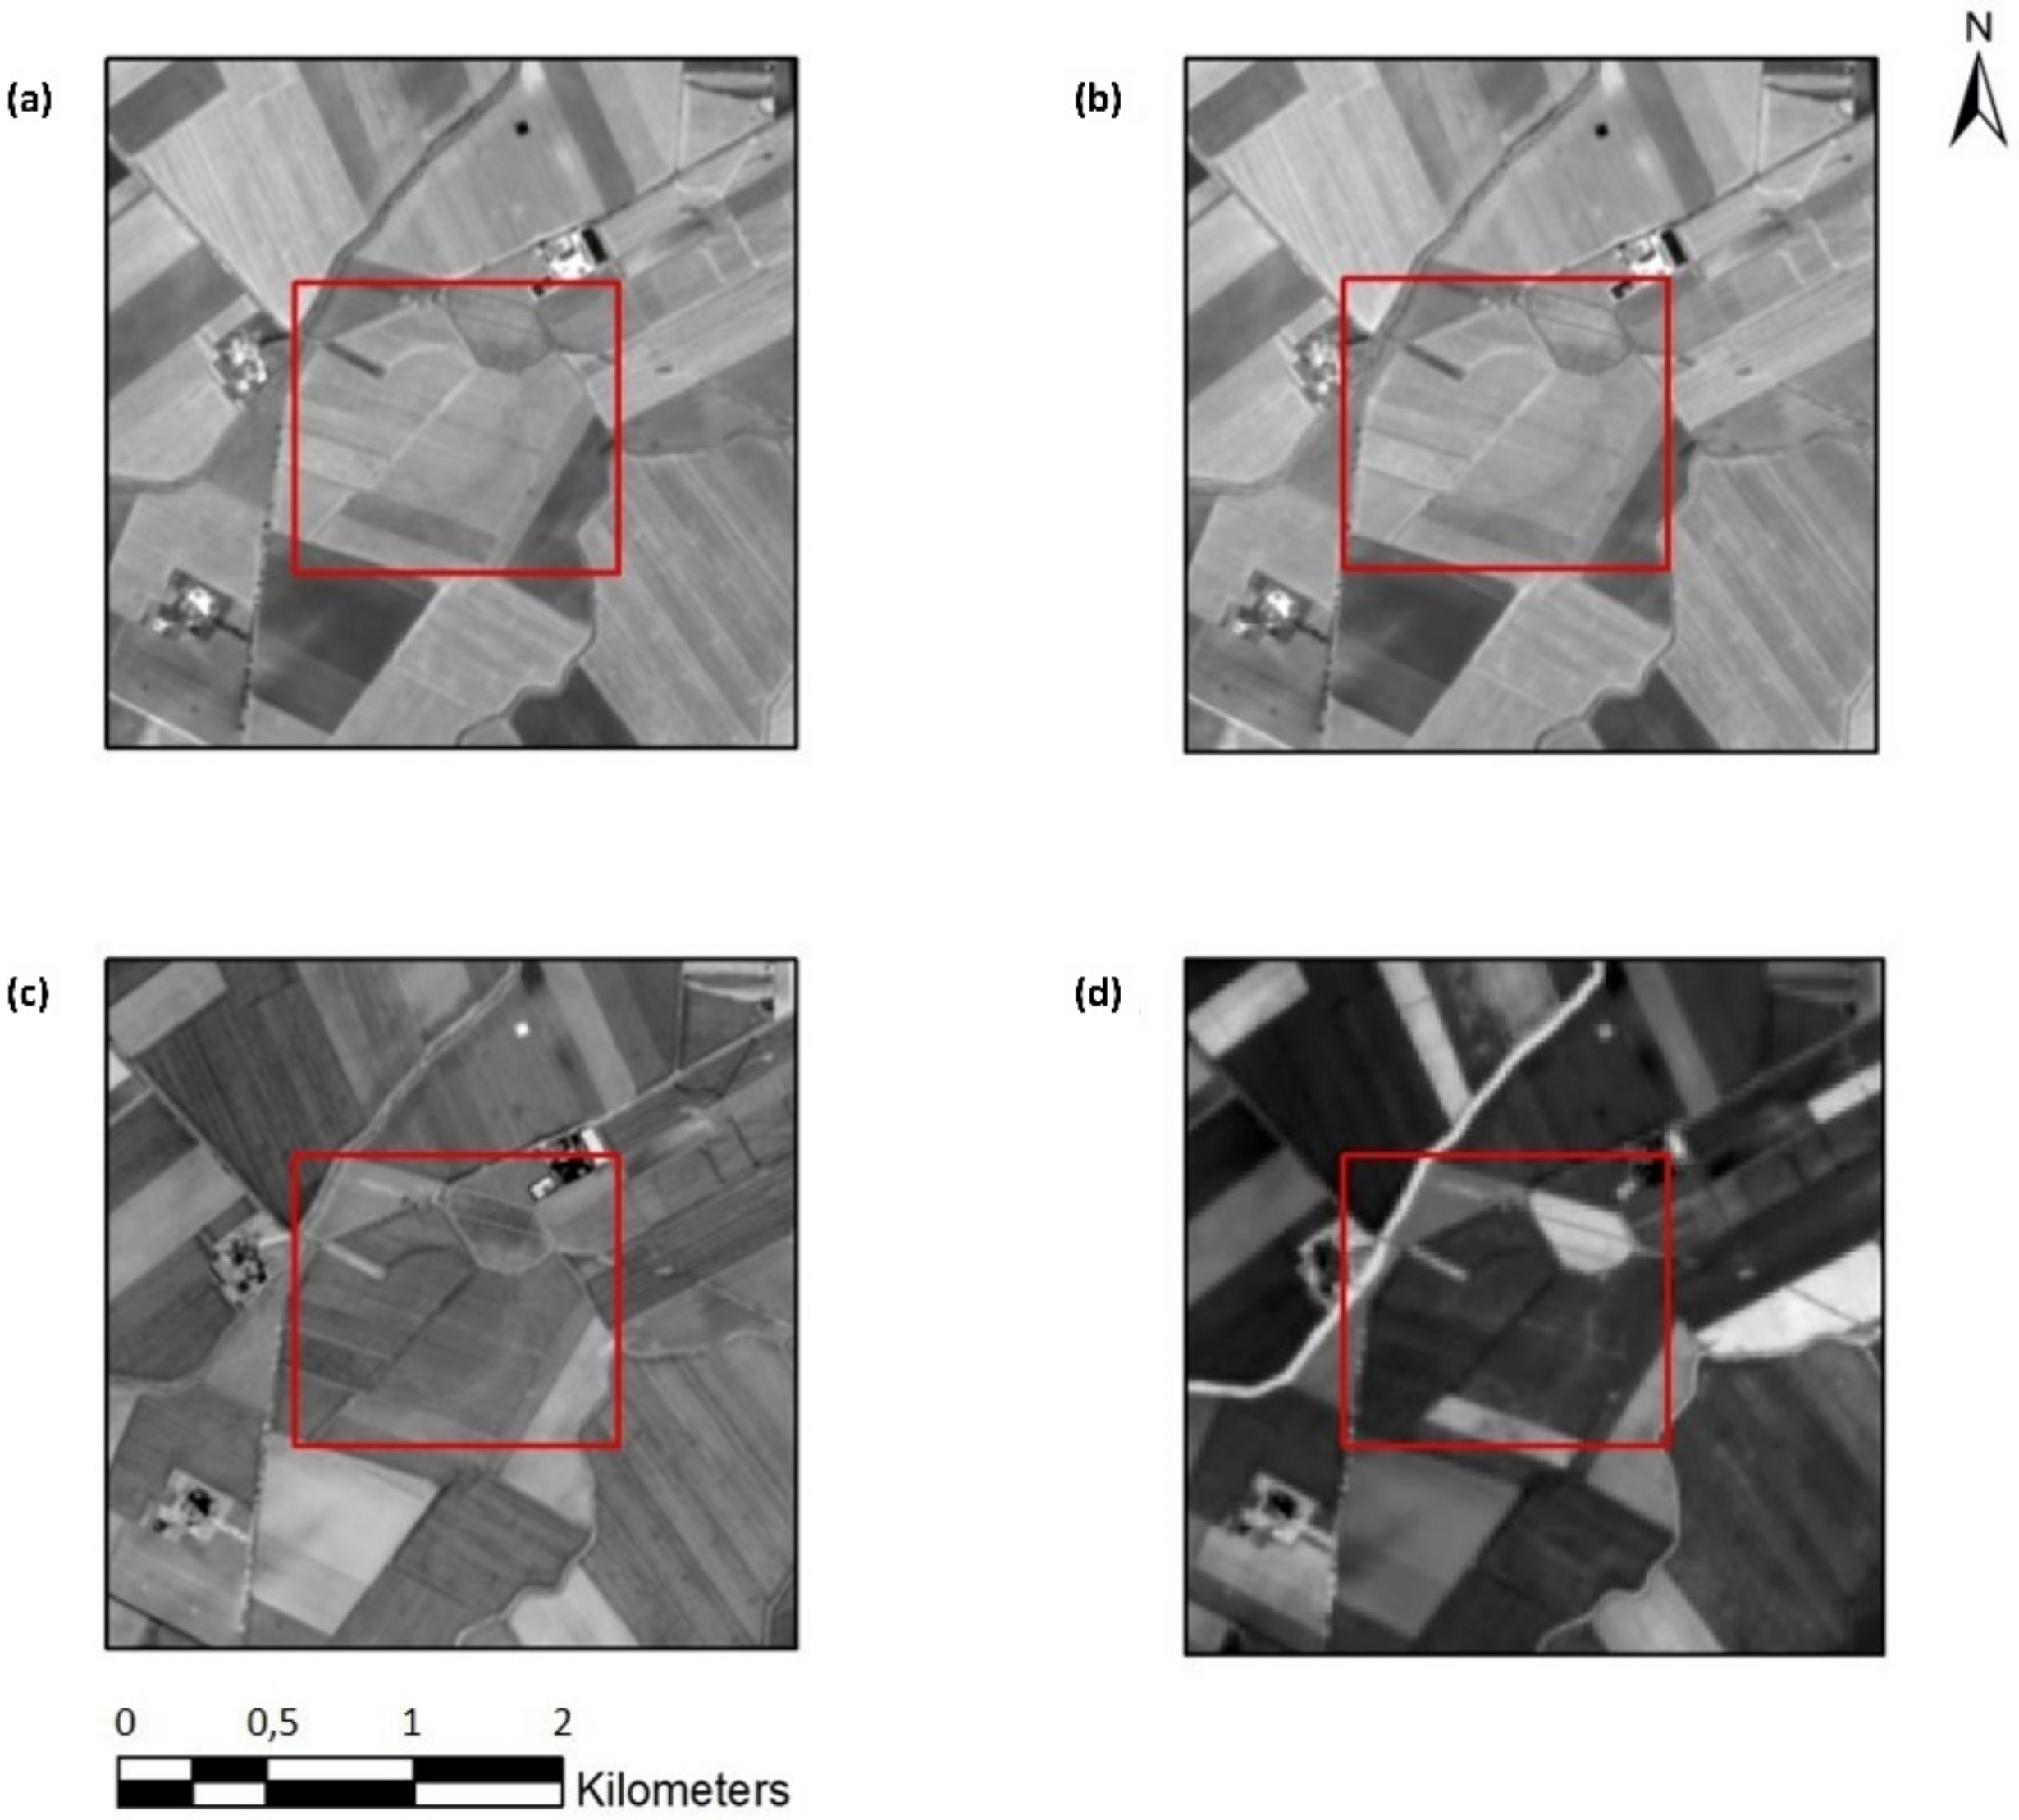
4.1. Notes on the Multitemporal Analysis of Single Channels

The analysis of the individual channels and their combinations RGB and FCIR showed that Sentinel-2 data were very effective in the identification of large anthropogenic archaeological remains such as: trenches, ditches, holes, channels, etc., which tend to retain moisture as clearly visible in the spectral bands and images [41]. Clear evidence of this was observed in the images of July and August 2017 (see spectral signatures in Figure 5d–f), due to the rainfall occurred at the end of July in Apulia (http://www.arpa.puglia.it/web/guest/serviziometeo).
Another important conclusion of this study is that the features of archaeological interest are more visible on bare soil than in cultivated fields (in the case of the Tavoliere delle Puglie), or when the vegetation has an irregular growth/heath due to the weather conditions. However, some remains are visible due to anomalies in vegetation, as changes due to a higher or lower health status. This phenomenon is mainly visible during the winter months in dry and rainless conditions (November 2018, Figure 5m, Figure 6 and Figure 9).
As a whole, we can suggest that, as expected on the basis of the relationship between vegetation health and type of archaeological remains [7,14,50,51,52,53], the visual analysis of each individual channel and of each Sentinel-2 image (of the multi-temporal data set) can provide a huge amount of useful information but of course is time consuming. Therefore, the use of spectral signature and the expected spectral separability is strongly recommended to reduce the data sets and further enhance archaeological features using TCT or PCA.
The TCTs were suitable for the identification of features of archaeological interest and very useful both individually (Figure 10) and in RGB combination. However, the use of TCTs was also time consuming and did require the analysis of a large amount of data in the final phase of features detection. Therefore, in the case of big data processing, the PCA method was the one with the best quality/time value. However, as expected, not all PCAs were useful for the study. In the first case (Figure 8a) the RGB image produced was lacking features that may indicate buried remains, in favor of elements in which the redundant information were concentrated (buildings, fields, roads etc.). The second case (Figure 8b) was more complex and derives from the use of the 2nd component in the Red channel and the 10th and 11th components as Green and Blue channels. The components produced by the PCA using all the data as input (see Section 2.3) had a useful content in terms of archaeological information from the 2nd component to the 15th, while the following ones showed excessive noise. This data was obtained after several output tests and may be different in other studies, being as known the interpretation of the PCAs dataset dependent. Nevertheless, as a general rule, we can argue that the best outputs from PCAs method were obtained only using as inputs the indices that had the highest separability (Figure 5 and Figure 6), as described in Section 2.3.

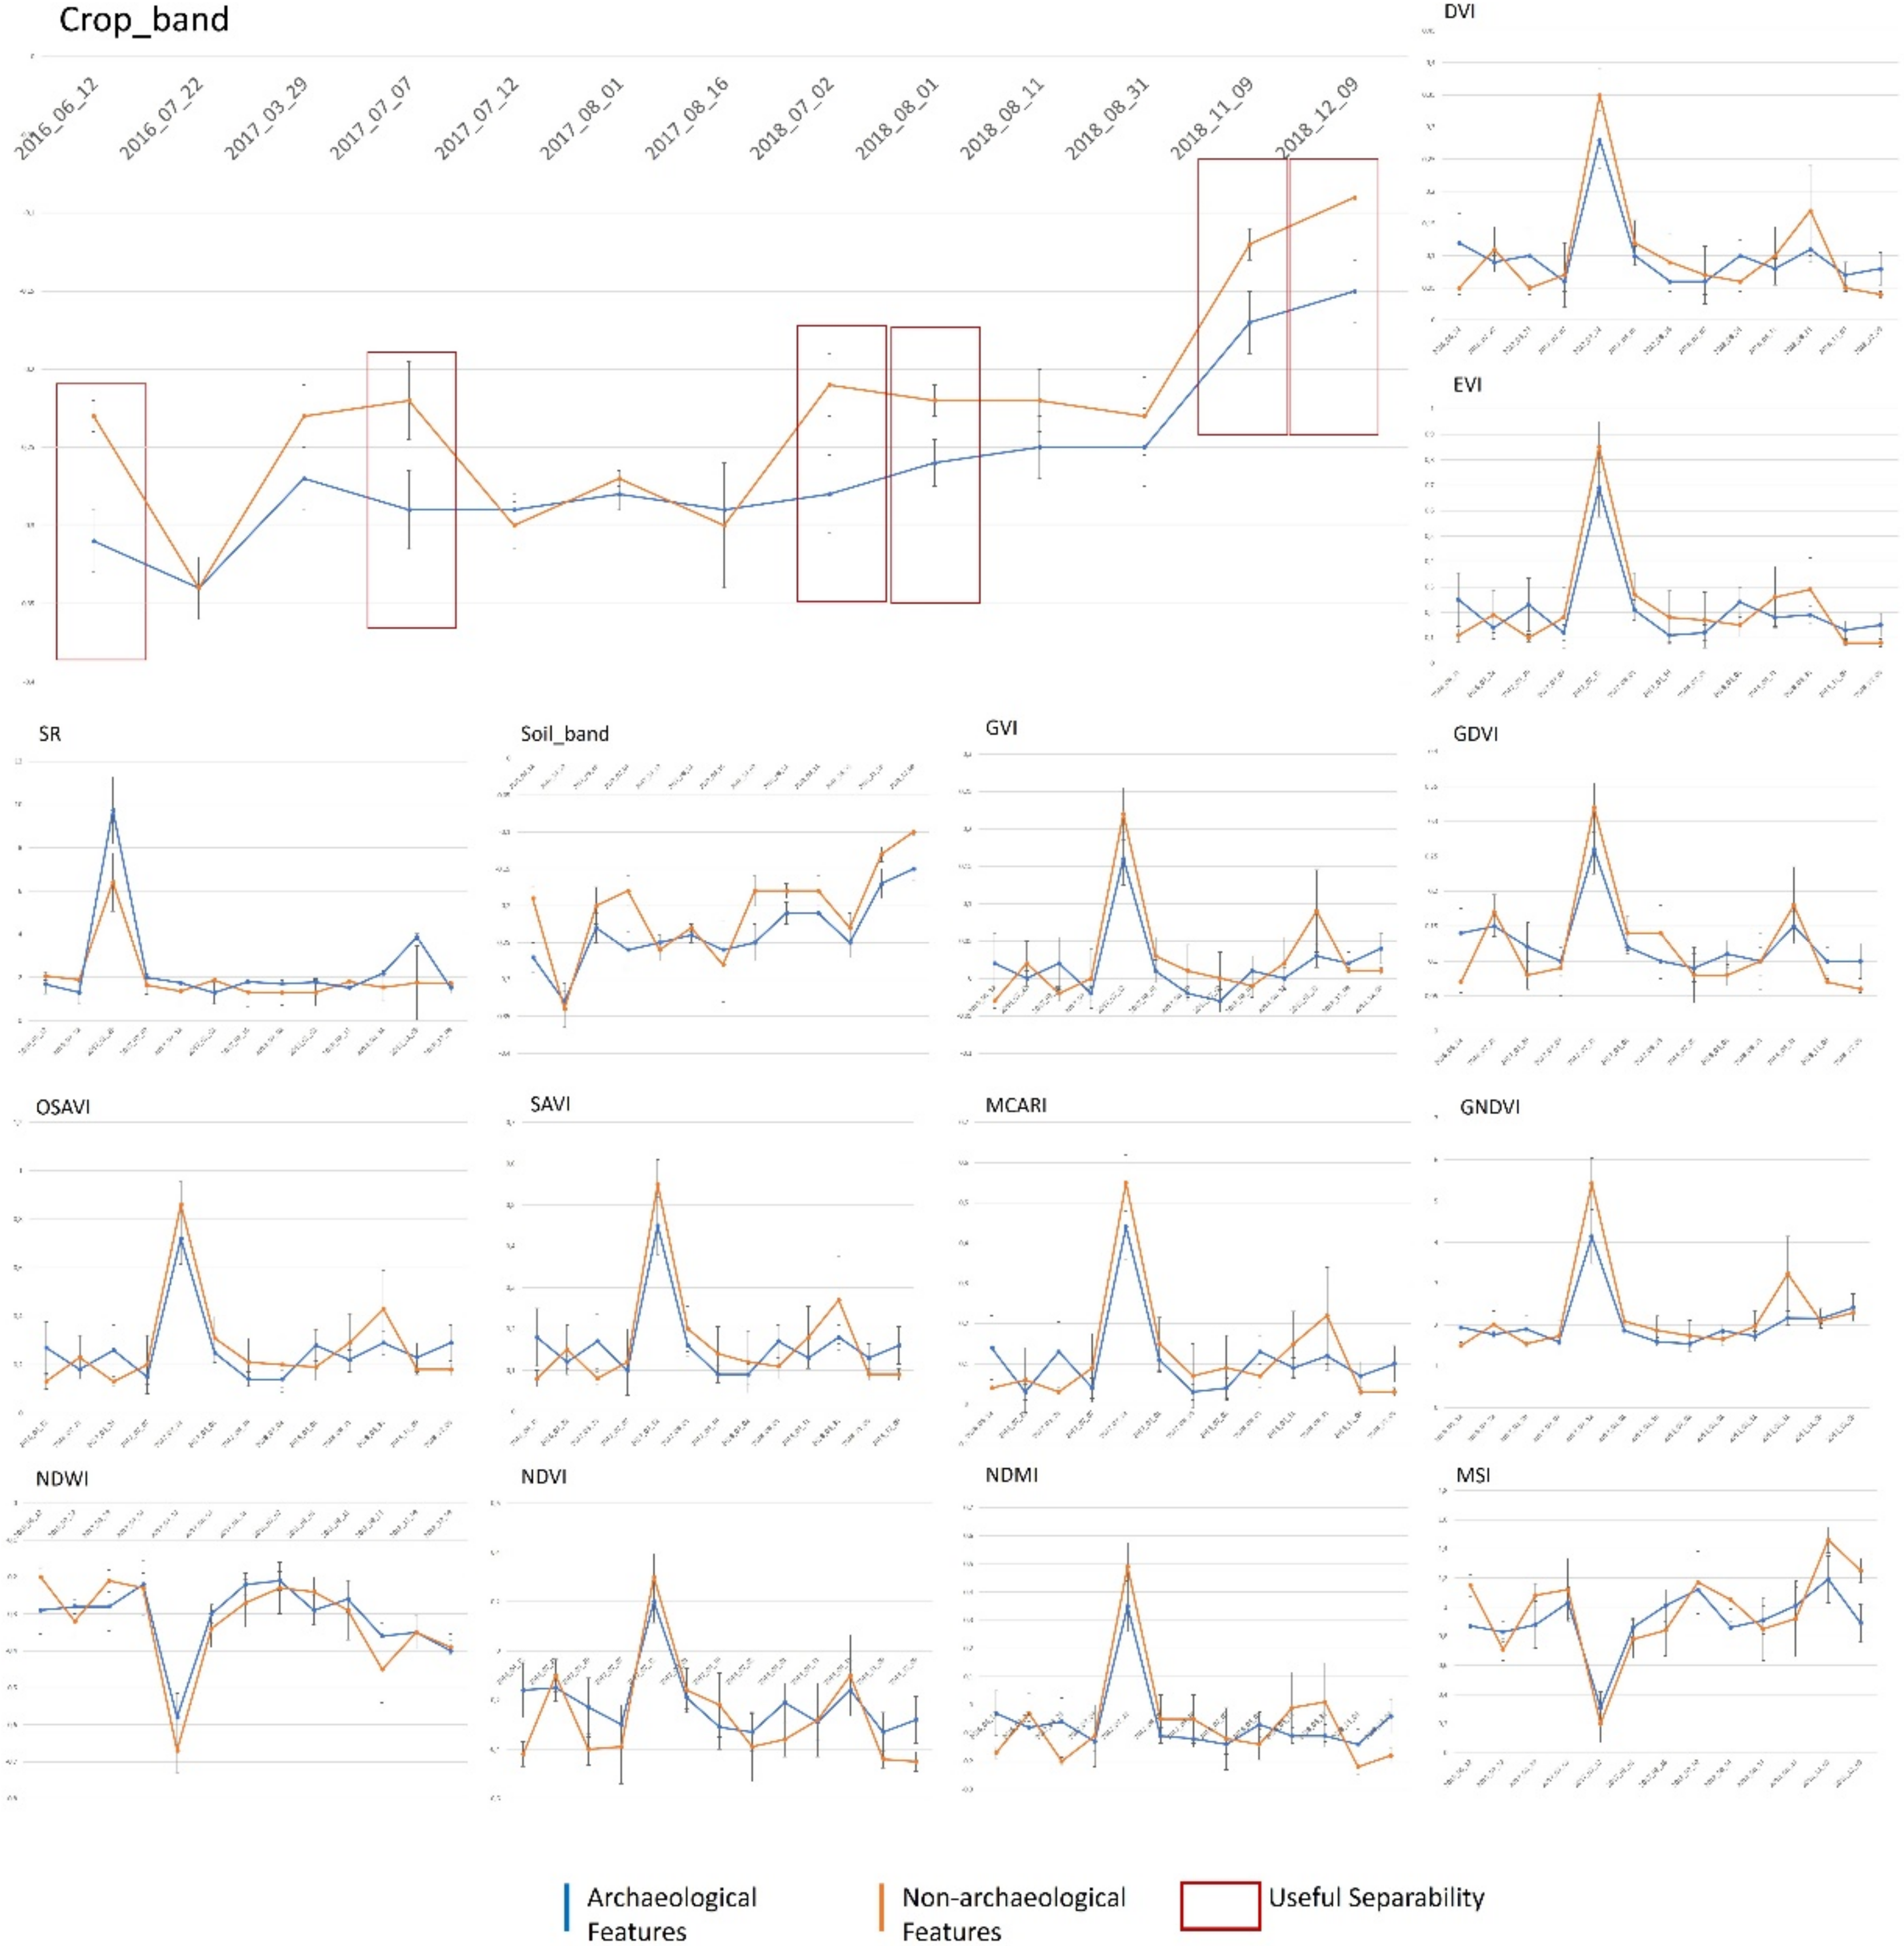
4.2. Notes on the Multitemporal Analysis of Spectral Indices

Indices were used to reduce the number of input data: they represent an enhancement of the differences in terms of spectral response of some elements in relation to the reflectance of Green, Red and NIR, which are the most suitable channels for the study of crop- and soil-marks. This method was evaluated as the most suitable for the purposes of the study: (i) the analysis was focused on the reduced to a single image; (ii) the image was of good quality; (iii) the archaeological ROIs are in sharp contrast to the surroundings, and both large shapes and smaller elements are visible (e.g., small circular compounds, rectangular-shaped farms, traces of ploughing etc.).
Of course, it is important to consider that we have in any case small features (<10 m) and there can be still additional problems to cope as the need: (i) to distinguish archaeological features from noise; (ii) to understand the nature of the features observed in order to identify and characterize new ones.
In both cases (TCTs and PCAs), the problem has been partly solved by using the knowledge acquired from archaeological investigations carried out in the past (drawings, aerial photos, GIS, etc.) which have proved to be a fundamental and essential tool for archaeological research.
However, one of the issues is precisely the correct interpretation of the large mass of data. This represents a challenge in the field of cultural heritage and the use of remote sensing for the identification, preservation and study of archaeological artefacts, where the data available from RS tools are relatively new and are based on sensors and physical parameters different from those used in the past (e.g., multispectral, hyperspectral, radar, LiDAR, GPR, etc.). Therefore, it is of fundamental importance for the research itself to couple the interpretation of the outputs of the data analysis with the archaeological documentation.

5. Conclusions

Today, in the era of big and open data, the large amount of data and information, available even for free to the scientific community, offers big opportunities and big challenges, also in the field of Earth observation techniques for cultural heritage. Big data and big challenges are particularly relevant for multi- and inter-disciplinary studies generally quite complex to be approached as in the case of archaeology [113,114,115].
Sentinel-2 data are certainly among the big data (available from 2014) that can offer big opportunities in many research fields and operational applications including cultural heritage. The use of high resolution multispectral data from the Sentinel-2 satellites of the Copernicus Program has shown all the strengths of this platform and the outputs from the current investigation clearly highlighted that these data can be fruitfully used in the future, for studies of the ancient landscape and the reconstruction of an extremely complex multi-layered context.
As a whole, one of main outputs of this research, based on open data and software (SNAP), was the methodological approach herein proposed that can be promptly replicate in other areas of the world. Moreover, the results obtained from the study of the Foggia province, along with the process carried out to obtain them, can be a good basis for some general considerations regarding the importance of Sentinel-2.
  • For the province of Foggia, the use of Sentinel-2 satellite data coupled with the ancillary data from other sources has proved extremely effective for the quick identification, on a landscape scale, of dozens of archaeological sites, some already known, others unknown and herein discovered.
  • The use of data enhancement and data reduction techniques applied to remote sensing data has proved to be extremely useful in the archaeological study. General considerations are related to the choice of multitemporal based analysis in a Mediterranean environment to cope with the different inter/intra annual visibility of soil and crops markers due to the vegetation phenology, meteorological conditions, etc.
Of course, as discussed, the main issue is to optimize the data to have a good compromise between processing and analysis in terms of effort, time, and results. To address this point, the PCA technique combined with previous use of ROIs discrimination and Spectral Un-mixing over time has proved to be very useful. The approach and the data processing chain herein proposed is an example of a perfect synthesis of the synergy needed between archaeology and remote sensing based on a virtuous circle of multidisciplinary skills that work together to address critical issues. In particular, the use of free data such as Sentinel-2 and those free available in the framework of the Copernicus initiatives, combined with archaeological knowledge of the area and ancillary data collected from other sources can produce remarkable results.
On the other hand, the use of remote sensing tools and Earth observation techniques based on Sentinel-2 images has proved to be useful in the identification of archaeological remains on a landscape scale, in the reconstruction of road systems and communication routes, and in the analysis of watercourses and their evolution over time. In particular, the identification of already known archaeological sites allows understanding of the shapes of features linked to a specific context within the images (e.g., concentric circles are linked to settlements of the Neolithic period). This is important because it allows the identification of new areas of archaeological interest (Figure 10 and Figure 12) and their attribution to a specific historical period. The archaeological analysis on landscape scale (structures, communication routes, and watercourses) allows to reconstruct the network of settlements and to carry out new historical/archaeological considerations. At the same time, the identified areas can be investigated on a “site scale”, with the normal practices of archaeology (excavation, survey) or close-range remote sensing (geophysics survey, drones, etc.) for a deep knowledge of the contexts, essential in the field of archaeological research. The use of Sentinel-2 images could also be included in the practices for the creation of the archaeological risk assessment map to be handed over to the Soprintendenza, for the protection of cultural heritage in the case of urban sprawl and land use change processes [116,117,118,119,120,121].

Author Contributions

Three main contributions participated in the current research article; archaeological view, remote sensing data analysis, and writing the manuscript. N.M., N.A., and A.E. provided the archaeological view. The maps and remote sensing imagery have been analyzed by R.L., A.E., N.M. and N.A. The manuscript has been written by A.E., N.A., N.M., and R.L. The last version of the article has been revised by N.M. and R.L. All authors have read and agreed to the published version of the manuscript.

Funding

The authors would like to declare that the research received no external funding and the research activities have been done by the author’s research centers.

Acknowledgments

The authors would like to thank the National Authority for Remote sensing and Space science (NARSS) at Cairo, Egypt and the Italian National Research Council (CNR) at Tito Scalo, Potenza (IBAM and IMAA) for supporting the research activities. Special thanks to NAIS (NEXTANT Applications & Innovative Solutions) for co-funding with the CNR-IMAA the PhD of N A at the University of Basilicata, and to the Protezione Civile of the Apulia region for providing the meteorological data.

Conflicts of Interest

The authors would like to hereby certify that no conflict of interest in the data collection, processing, and post-processing, the writing and revision of the manuscript, and in the decision to publish the manuscript results.

References

  1. Rayne, L.; Brandbury, J.; Mattingly, D.; Philip, G.; Bewley, R.; Wilson, A. From Above and on the Ground: Geospatial Methods for Recording Endagered Archaeology in the Middle East and North Africa. Geosciences 2017, 7, 100. [Google Scholar] [CrossRef] [Green Version]
  2. Wilkinson, T.J.; Philip, G.; Bradbury, J.; Dunford, R.; Donoghue, D.; Galiatsatos, N.; Lawrence, D.; Ricci, A.; Smith, S. Contextualizing Early Urbanization: Settlement Cores, Early States and Agro-Pastoral Strategies in The Fertile Crescent during the Fourth and Third Millennia BC. J. World Prehist. 2014, 27, 43–109. [Google Scholar] [CrossRef] [Green Version]
  3. Tapete, D. Remote Sensing and Geosciences for Archaeology. Geosciences 2018, 8, 41. [Google Scholar] [CrossRef] [Green Version]
  4. Sentinel Online—Esa. Available online: https://sentinel.esa.int/web/sentinel/home (accessed on 11 March 2020).
  5. Copernicus Open Access Hub. Available online: https://scihub.copernicus.eu/dhus/#/home (accessed on 11 March 2020).
  6. SNAP Tutorials—STEP. Available online: https://step.esa.int/main/doc/tutorials/snap-tutorials/ (accessed on 11 March 2020).
  7. Agapiou, A.; Alexakis, D.D.; Sarris, A.; Hadjimitsis, D.G. Evaluating the Potentials of Sentinel-2 for Archaeological Perspective. Remote Sens. 2014, 4, 2176–2194. [Google Scholar] [CrossRef] [Green Version]
  8. Zanni, S.; De Rosa, A. Remote Sensing Analyses on Sentinel-2 Images: Looking for Roman Roads in Srem Region (Serbia). Geosciences 2019, 9, 25. [Google Scholar] [CrossRef] [Green Version]
  9. Khalaf, N.; Insoll, T. Monitoring Islamic Archaeological Landscapes in Ethiopia Using Open Source Satellite Imagery. J. Field Archaeol. 2019, 44, 401–419. [Google Scholar] [CrossRef]
  10. Agapiou, A.; Alexakis, D.; Hadjimitsis, D.G. Potential of Virtual Earth Observation Constellations in Archaeological Research. Sensors 2019, 19, 4066. [Google Scholar] [CrossRef] [PubMed] [Green Version]
  11. Kalayci, T.; Lasaponara, R.; Wainwright, J.; Masini, N. Multispectral Contrast of Archaeological Features: A Quantitative Evaluation. Remote Sens. 2019, 11, 913. [Google Scholar] [CrossRef] [Green Version]
  12. Abate, N.; Lasaponara, R. Preventive Archaeology Based on Remote Sensing Data and Tools: The Cases of Sant’Arsenio (SA) and Foggia (FG), Italy. Sustainability 2019, 11, 4145. [Google Scholar] [CrossRef] [Green Version]
  13. Agapiou, A.; Lysandrou, V.; Lasaponara, R.; Masini, N.; Hadjimitsis, D. Study of the Variations of Archaeological Marks at Neolithic Site of Lucera, Italy Using High-Resolution Multispectral Datasets. Remote Sens. 2016, 8, 723. [Google Scholar] [CrossRef] [Green Version]
  14. Ciminale, M.; Gallo, D.; Lasaponara, R.; Masini, N. A Multiscale approach for reconstructing archaeological landscapes: Applicationsin northern Apulia (Italy). Archaeol. Prospect. 2009, 16, 143–153. [Google Scholar] [CrossRef]
  15. Gallo, D.; Ciminale, M.; Becker, H.; Masini, N. Remote sensing techniques for reconstructing a vast Neolithic settlement in Southern Italy. J. Archaeol. Sci. 2009, 36, 43–50. [Google Scholar] [CrossRef]
  16. Bradford, J. The Apulia expedition: An interim report. Antiquity 1950, 24, 84–95. [Google Scholar] [CrossRef]
  17. Bradford, J. The ancient city of Arpi in Apulia. Antiquity 1957, 31, 167–169. [Google Scholar]
  18. Bradford, J.S.P. Buried Landscapes in Southern Italy. Antiquity 1949, 90, 58–72. [Google Scholar] [CrossRef]
  19. Guaitoli, M. Lo Sguardo di Icaro: Le Collezioni dell’Aerofototeca Nazionale per la Conoscenza del Territorio; Campisano Editore: Roma, Italy, 2003. [Google Scholar]
  20. Riley, D.N. New Aerial Reconnaissance in Apulia; Cambridge University Press: Cambridge, UK, 1992; Volume 60, pp. 291–307. [Google Scholar]
  21. Masini, N.; Marzo, C.; Manzari, P.; Belmonte, A.; Sabia, C.; Lasaponara, R. On the characterization of temporal and spatial patterns of archaeological crop-marks. J. Cult. Herit. 2018, 32, 124–132. [Google Scholar] [CrossRef]
  22. Fiorentino, G.; Caldara, M.; De Santis, V.; D’Oronzo, C.; Muntoni, I.M.; Simone, O.; Primavera, M.; Radina, F. Climate changes and human–environment interactions in the Apulia region of southeastern Italy during the Neolithic period. Holocene 2013, 23, 1297–1316. [Google Scholar] [CrossRef]
  23. Genchi, F.; Muntoni, I.M.; Scopece, N. Indagini Archeologiche Nel Villaggio Neolitico di Masseria Pantano (Foggia). In Primi Risultati, Proceedings of the Atti del XXXII Convegno Nazionale Sulla Preistoria-Protostoria—Storia Della Daunia, San Severo, Italy, 12–13 Novembre 2011; Gravina, A., Ed.; Archeoclub d’Italia: San Severo, Italy, 2012; pp. 3–14. [Google Scholar]
  24. Martin, J.M.; Noye, G.H. Habitats et Systèmes Fortifiés en Capitanate. Première Confrontation des Données Textuelles et Archélogiques. In Structures de l’habitat et Occupation du Sol Dans Les Pays Méditerranéens. Les Méthodes et L’apport de L’archéologie Extensive; Noyè, G.H., Ed.; Collection de l’École Française: Roma, Italy, 1988; pp. 501–526. [Google Scholar]
  25. Tafuri, M.A.; Robb, J.; Belcastro, M.G.; Mariotti, V.; Iacumin, P.; Di Matteo, A.; O Connell, T. Herding Practices in the Ditched Villages of the Neolithic Tavoliere (Apulia, South-east Italy): A Vicious Circle? The Isotopic Evidence. In Proceedings-British Academy; Oxford University Press: Oxford, UK, 2014; Volume 198, pp. 143–158. [Google Scholar]
  26. Volpe, G.; Romano, A.V.; Goffredo, R. Archeologia dei Paesaggi Della Valle del Celone. In Atti del XXIII Convegno sulla Preistoria, Proceedings of the Protostoria e Storia Della Daunia, San Severo 23–24 November 2002; Gravina, A., Ed.; Archeoclub d’Italia: San Severo, Italy, 2003; pp. 349–391. [Google Scholar]
  27. Whitehouse, R. The Neolithic Pottery Sequence in Southern Italy. In Proceedings of the Prehistoric Society; Cambridge University Press: Cambridge, UK, 1970; Volume 35, pp. 267–310. [Google Scholar]
  28. Tapete, D.; Cigna, F. Appraisal of Opportunities and Perspectives for the Systematic Condition Assessment of Heritage Sites with Copernicus Sentinel-2 High-Resolution Multispectral Imagery. Remote Sens. 2018, 10, 561. [Google Scholar] [CrossRef] [Green Version]
  29. Wiseman, J.R.; El-Baz, F. Remote Sensing in Archaeology; Springer: Berlin/Heidelberg, Germany, 2007. [Google Scholar]
  30. Parcak, S.H. Satellite Remote Sensing for Archaeology; Routledge: London, UK, 2009. [Google Scholar]
  31. Bewley, R.H. Aerial survey for archaeology. Photogramm. Rec. 2003, 18, 273–292. [Google Scholar] [CrossRef] [Green Version]
  32. Altaweel, M. The use of ASTER satellite imagery in archaeological contexts. Archaeol. Prosp. 2005, 12, 151–166. [Google Scholar] [CrossRef]
  33. Lasaponara, R.; Masini, N. Detection of archaeological crop marks by using satellite QuickBird. J. Archaeol. Sci. 2007, 34, 214–221. [Google Scholar] [CrossRef]
  34. Whitehouse, R.D. The early Neolithic of southern Italy. Antiquity 1968, 42, 188–193. [Google Scholar] [CrossRef]
  35. Longhena, M. The Early Mediterranean Village. Agency, Material Culture, and Social Change in Neolithic Italy. Eur. J. Archaeol. 2007, 13, 123–124. [Google Scholar]
  36. Pluciennik, M. Radiocarbon determinations and the mesolithic-neolithic transition in southern Italy. J. Mediterr. Archaeol. 1998, 10, 115–150. [Google Scholar] [CrossRef]
  37. Acquafredda, P.; Muntoni, I.M. Obsidian from Pulo di Molfetta (Bari, Southern Italy): Provenance from Lipari and first recognition of a Neolithic sample from Monte Arci (Sardinia). J. Archaeol. Sci. 2008, 35, 947–955. [Google Scholar] [CrossRef]
  38. Colucci, A. Arpi: La Città Perduta; Bastogi Editrice Italiana: Foggia, Italy, 2009. [Google Scholar]
  39. Monaco, M.S. Lucera Nella Storia e Nell’Arte; Regione Puglia: Foggia, Italy, 2009. [Google Scholar]
  40. Otranto, G. Bizantini, Longobardi e Arabi in Puglia Nell’Altomedioevo. In Proceedings of the Atti del XX Congresso Internazionale di Studio Sull’Alto Medioevo, Savelletri di Fasano, Italy, 3–6 Novembre 2011. [Google Scholar]
  41. Masini, N.; Lasaponara, R. Sensing the Past from Space: Approaches to Site Detection. In Sensing the Past from Artifact to Historical Site; Masini, N., Soldovieri, F., Eds.; Springer: Berlin/Heidelberg, Germany, 2017; pp. 23–60. [Google Scholar]
  42. Campana, S.; Francovich, R. Landscape Archaeology in Tuscany: Cultural Resource Management, Remotely Sensed Techniques, GIS Based Data Integration and Interpretation. In The Reconstruction of Archaeological Landscapes Through Digital Technologies, Proceedings of the 1st Italy-United States Workshop, Boston, MA, USA, 1–3 November 2001; Forte, M., Williams, P.R., Eds.; Oxford University Press: Oxford, UK, 2003; pp. 15–28. [Google Scholar]
  43. Goffredo, R. Aerial Archaeology in Daunia (Northern Puglia, Italy). New research and developments. In From Space to Place: 2nd International Conference on Remote Sensing in Archaeology, Proceedings of the 2nd International Workshop, CNR, Rome, Italy, 4–7 December 2006; Campana, S., Forte, M., Eds.; Oxford University Press: Oxford, UK, 2006; pp. 541–546. [Google Scholar]
  44. Volpe, G.; Romano, A.V.; Goffredo, R. Il “Progetto Valle del Celone”: Ricognizione, Aerofotografia, G.I.S. In Progetto Durrës, Atti del II e del III Incontro Scientifico, Antichità Altoadriatiche, LVIII; Buora, M., Santoro, S., Eds.; Arbor Sapientiae S.r.l.: Roma, Italy, 2004; pp. 198–220. [Google Scholar]
  45. Romano, V.; Volpe, G. Paesaggi e Insediamenti Rurali nel Comprensorio del Celone fra Tardoantico e Altomedioevo. In Proceedings of the Atti del I Seminario sul Tardoantico e l’Altomedioevo in Italia meridionale, Foggia, Italy, 12–14 February 2004; pp. 241–264. [Google Scholar]
  46. Spatial Resolution Sentinel-2—MSI—User Guides—Sentinel Online. Available online: https://sentinel.esa.int/web/sentinel/user-guides/sentinel-2-msi/resolutions/spatial (accessed on 11 March 2020).
  47. Radiometric Resolution Sentinel-2—MSI—User Guides—Sentinel Online. Available online: https://sentinel.esa.int/web/sentinel/user-guides/sentinel-2-msi/resolutions/radiometric (accessed on 11 March 2020).
  48. Traviglia, A.; Torsello, A. Landscape Pattern Detection in Archaeological Remote Sensing. Geosciences 2017, 7, 128. [Google Scholar] [CrossRef] [Green Version]
  49. Gron, O.; Palmer, S.; Stylegar, F.A.; Aase, S.; Esbensen, K.; Kucheryavski, S.; Sigurd, A. Interpretation of archaeological small-scale features in spectral images. J. Archaeol. Sci. 2011, 38, 2024–2030. [Google Scholar] [CrossRef]
  50. Lasaponara, R.; Masini, N. Satellite Remote Sensing—A New Tool for Archaeology; Springer: Dordrecht, The Netherlands, 2012. [Google Scholar]
  51. Agapiou, A.; Hadjimitsis, D.G.; Sarris, A.; Georgopoulos, A.; Alexakis, D.D. Optimum temporal and spectral window for monitoring crop marks over archaeological remains in the Mediterranean region. J. Archaeol. Sci. 2013, 40, 1479–1492. [Google Scholar] [CrossRef]
  52. Bennett, R.; Welham, K.; Hill, R.A.; Ford, A. The application of vegetation indices for the prospection of archaeological features in grass dominated environments. Archaeol. Prosp. 2012, 19, 209–218. [Google Scholar] [CrossRef]
  53. Lasaponara, R.; Masini, N. Identification of archaeological buried remains based on Normalized Difference Vegetation Index (NDVI) from Quickbird satellite satellite data. IEEE Geosci. Remote Sens. 2006, 3, 325–328. [Google Scholar] [CrossRef]
  54. Saunders, R.W. The determination of broad band surface albedo from AVHRR visibile and rear-infrared radiances. Int. J. Remote Sens. 1990, 11, 49–67. [Google Scholar] [CrossRef]
  55. Gitelson, A.A.; Merzlyak, M.N. Remote Sensing of Chlorophyll Concentration in Higher Plant Leaves. Adv. Space Res. 1997, 59, 440–451. [Google Scholar] [CrossRef]
  56. Huete, A.R.; Liu, H.Q.; Batchily, K.; van Leeuwen, W. A comparison of vegetation indices over a global set of TM images for EOS-MODIS. Remote Sens. Environ. 1997, 59, 440–451. [Google Scholar] [CrossRef]
  57. Tucker, C.J. Red and photographic infrared linear combinations for monitoring vegetation. Remote Sens. Environ. 1979, 8, 127–150. [Google Scholar] [CrossRef] [Green Version]
  58. Chuvieco, E.; Martin, M.P.; Palacios, A. Assessment of different spectral indices in the red-near-infrared spectral domain for burned land discrimination. Int. J. Remote Sens. 2010, 23, 5103–5110. [Google Scholar] [CrossRef]
  59. Agapiou, A.; Hadjimitsis, D.G.; Themistocleous, K.; Papadavid, G. Detection of Archaeological Crop Marks in Cyprus Using Vegation Indices from Landsat TM/ETM Plus Satellite Images and Field Spectroscopy Measurements. In Proceedings of the SPIE—The International Society for Optical Engineering, Toulouse, France, 1 December 2010; Volume 7831. [Google Scholar]
  60. White, D.C.; Williams, M.; Barr, S.L. Detecting sub-surface soil disturbance using hyperspectral first derivative band rations of associated vegetation stress. Int. Arch. Photogramm. Remote Sens. Spat. Inf. Sci. 2008, 37, 243–248. [Google Scholar]
  61. Rouse, J.W.; Haas, R.H.; Schell, J.A.; Deering, D.W.; Harlan, J.C. Monitoring the Vernal Advancements and Retrogradation (Greenwave Effect) of Nature Vegetation; NASA: Washington, DC, USA, 1974. [Google Scholar]
  62. Huete, A. Overview of the Radiometric and Biophysical Performance of the MODIS Vegetation Indices. Remote Sens. Environ. 2002, 83, 195–213. [Google Scholar] [CrossRef]
  63. Kaimaris, D.; Patias, P.; Tsakiri, M. Best period for high spatial resolution satellite images for the detection of marks of buried structures. Egypt. J. Remote Sens. Space Sci. 2012, 15, 9–18. [Google Scholar]
  64. Park, H.; Choi, J.; Park, N.; Choi, S. Sharpening the VNIR and SWIR bands of Sentinel-2A imagery through modified selected and synthesized band schemes. Remote Sens. 2017, 9, 1080. [Google Scholar] [CrossRef] [Green Version]
  65. Zheng, H.; Du, P.; Chen, J.; Xia, J.; Li, E.; Xu, Z.; Li, X.; Yokoya, N. Performance Evaluation of Downscaling Sentinel-2 Imagery for Land Use and Land Cover Classification by Spectral-Spatial Features. Remote Sens. 2017, 9, 1274. [Google Scholar] [CrossRef] [Green Version]
  66. Roy, D.; Li, J.; Zhang, H.; Yan, L. Best practices for the reprojection and resampling of Sentinel-2 Multi Spectral Instrument Level 1C data. Remote Sens. Lett. 2016, 7, 1023–1032. [Google Scholar] [CrossRef]
  67. Richards, J.A. Remote Sensing Digital Image Analysis: An Introduction; Springer: Berlin/Heidelberg, Germany, 1999. [Google Scholar]
  68. Agapiou, A.; Lysandrou, V.; Hadjimitsis, D.G. Optical Remote Sensing Potentials for Looting Detection. Geosciences 2017, 7, 98. [Google Scholar] [CrossRef] [Green Version]
  69. Cerra, D.; Agapiou, A.; Cavalli, R.M.; Sarris, A. An Objective Assessment of Hyperspectral Indicators for the Detection of Buried Archaeological Relics. Remote Sens. 2018, 10, 500. [Google Scholar] [CrossRef]
  70. Calleja, J.F.; Pagés, O.R.; Diaz-Alvarez, N.; Peòn, J.; Gutiérrez, N.; Martìn-Hernàndez, E.; Relea, C.A.; Melendi, D.R.; Alvarez, P.F. Detection of buried archaeological remains with the combined use of satellite multispectral data and UAV data. Int. J. Appl. Earth Obs. Geoinf. 2018, 73, 555–573. [Google Scholar] [CrossRef]
  71. Rowlands, A.; Sarris, A. Detection of exposed and subsurface archaeological remains using multi-sensor remote sensing. J. Archaeol. Sci. 2007, 34, 795–803. [Google Scholar] [CrossRef]
  72. Alexakis, D.; Sarris, A.; Astaras, T.; Albanakis, Κ. Detection of neolithic settlements in Thessaly (Greece) through multispectral and hyperspectral satellite imagery. Sensors 2009, 9, 1167–1187. [Google Scholar] [CrossRef] [Green Version]
  73. Alexakis, A.; Sarris, A.; Astaras, T.; Albanakis, K. Integrated GIS, remote sensing and geomorphologic approaches for the reconstruction of the landscape habitation of Thessaly during the Neolithic period. J. Archaeol. Sci. 2011, 38, 89–100. [Google Scholar] [CrossRef]
  74. De Guio, A. Cropping for a Better Future: Vegetation Indices in Archaeology. In Detecting and Understanding Historic Landscapes; Chavarria Arnau, A., Reynolds, A., Eds.; SAP: Mantova, Italy, 2015; pp. 109–152. [Google Scholar]
  75. Silver, M.; Törmä, M.; Silver, K.; Okkonen, J.; Nuñez, M. Remote sensing, landscape and archaeology tracing ancient tracks and roads between Palmyra and the Euphrates in Syria. ISPRS Ann. Photogramm. Remote Sens. Spat. Inf. Sci. 2015, 2, 279–285. [Google Scholar] [CrossRef] [Green Version]
  76. Beck, A.R. Archaeological Site Detection: The Importance of Contrast. In Proceedings of the 2007 Annual Conference of the Remote Sensing and Photogrammetry Society, Newcastle Upon Tyne, UK, 11–14 September 2007; pp. 307–312. [Google Scholar]
  77. Moriarty, C.; Cowley, D.C.; Wade, T.; Nichol, C.J. Deploying multispectral remote sensing for multi-temporal analysis of archaeological crop stress at Ravenshall, Fife. Scotland. Archaeol. Prosp. 2019, 26, 33–46. [Google Scholar] [CrossRef] [Green Version]
  78. Harrower, M.J. Methods, Concepts and Challenges in Archaeological Site Detection and Modeling; Springer: New York, NY, USA, 2013; pp. 213–218. [Google Scholar]
  79. Huete, A.R. A soil-adjusted vegetation index (SAVI). Remote Sens. Environ. 1988, 25, 295–309. [Google Scholar] [CrossRef]
  80. Pinty, B.; Verstraete, M.M. GEMI: A non-linear index to monitor global vegetation from satellites. Vegetatio 1992, 101, 15–20. [Google Scholar] [CrossRef]
  81. Ceccato, P.; Flasse, S.; Trantola, S.; Jacquemound, S.; Gregoire, J.M. Detecting vegetation leaf water content using reflectance in the optical domain. Remote Sens. Environ. 2001, 77, 22–33. [Google Scholar] [CrossRef]
  82. Ceccato, P.; Gobron, N.; Flasse, S.; Pinty, B.; Tarantola, S. Designing a spectral index to estimate vegetation water content from remote sensing data: Part 1: Theoretical approach. Remote Sens. Environ. 2002, 82, 188–197. [Google Scholar] [CrossRef]
  83. Ceccato, P.; Flasse, S.; Gregoire, J.M. Designing a spectral index to estimate vegetation water content from remote sensing data: Part 2: Validation and applications. Remote Sens. Environ. 2002, 82, 198–2007. [Google Scholar] [CrossRef]
  84. Isetti, E.; Rellini, I.; Rossi, G.; Traverso, A. Passo di Corvo (Foggia). Indagini micromorfologiche sul riempimento dei fossati: Prospettive interpretative preliminari. In Proceedings of the Atti del XXXVIII Convegno Nazionale Sulla Preistoria-Protostoria-Storia della Daunia, San Severo, Italy, 18–19 November 2017; Gravina, A., Ed.; Archeoclub San Severo: San Severo, Italy, 2018; pp. 99–110. [Google Scholar]
  85. Schmiedt, G. Le Fortificazioni Altomedievali in Italia Viste Dall’aereo. In Proceedings of the Atti della XV settimana di studi del CISAM, Spoleto, Italy, 16–18 April 1968; pp. 860–927. [Google Scholar]
  86. Schmiedt, G. Atlante Aerofotografico Delle Sedi Umane in Italia: Parte III, La Centuriazione; IGM: Firenze, Italy, 1974. [Google Scholar]
  87. Schmiedt, G. Atlante Aerofotografico Delle Sedi Umane in Italia: Parte III, La Centuriazione Romana; IGM: Firenze, Italy, 1989. [Google Scholar]
  88. Sarris, A.; Jones, R. Geophysical and related techniques applied to archaeological survey in the Mediterranean: A review. J. Mediterr. Archaeol. 2000, 13, 3–75. [Google Scholar] [CrossRef]
  89. Beck, A.; Philip, A.; Abdulkarim, M.; Donoghue, D. Evaluation of Corona and Ikonos high resolution satellite imagery for archaeological prospection in western Syria. Antiquity 2007, 81, 161–175. [Google Scholar] [CrossRef] [Green Version]
  90. Yarbrough, L.D.; Navulur, K.; Ravi, R. Presentation of the Kauth-Thomas transform for WorldView-2 reflectance data. Remote Sens. Lett. 2014, 5, 131–138. [Google Scholar] [CrossRef]
  91. Kauth, R.J.; Thomas, G.S. The Tasseled Cap—A Graphic Description of the Spectral-Temporal Development of Agricultural Crops as Seen by LANDSAT. In Proceedings of the Symposium on Machine Processing of Remotely Sensed Data, West Lafayette, IN, USA, 29 June–1 July 1976. [Google Scholar]
  92. Chuvieco, E. Fundamentals of Satellite Remote Sensing: An Environmental Approach, 2nd ed.; CRC Press: Boca Raton, FL, USA, 2016. [Google Scholar]
  93. Crist, E.P.; Kauth, R.J. The tasseled Cap De-Mystified. Photogramm. Eng. Remote Sens. 1986, 52, 81–86. [Google Scholar]
  94. Crist, E.P.; Cicone, R.C. Application of the tasseled Cap Concept to Simulated Thematic Mapper Data. Photogramm. Eng. Remote Sens. 1984, 50, 343–352. [Google Scholar]
  95. Crist, E.P.; Cicone, R.C. A Physically-Based Transformation of Thematic Mapper Data–The TM Tasseled Cap. IEEE Trans. Geosci. Remote Sens. 1984, 22, 256–263. [Google Scholar] [CrossRef]
  96. Horne, J.H. A Tasseled Cap Transformation for IKONOS Images. In Proceedings of the ASPRS 2003 Annual Conference, Anchorage, AK, USA, 5–9 May 2003. [Google Scholar]
  97. Lobser, S.E.; Cohen, W.B. MODIS tasseled cap: Land cover characteristics expressed through transformed MODIS data. Int. J. Remote Sens. 2007, 28, 5079–5101. [Google Scholar] [CrossRef]
  98. Wang, Y.; Sun, D. The ASTER Tasseled Cap Interactive Transformation Using Gramm-Schmidt Method. In Proceedings of the SPIE, Wuhan, China, 3 November 2005. [Google Scholar]
  99. Huang, C.; Wylie, B.; Yang, L.; Homer, C.; Zylstra, G. Derivation of a tasselled cap transformation based on Landsat 7 at-satellite reflectance. Int. J. Remote Sens. 2002, 23, 1741–1748. [Google Scholar] [CrossRef]
  100. Heiskanen, J. Estimating aboveground tree biomass and leaf area index in a mountain birch forest using ASTER satellite data. Int. J. Remote Sens. 2006, 27, 1135–1158. [Google Scholar] [CrossRef]
  101. Kelong, T.; Yuqing, W.; Lin, Y.; Riping, Z.; Wei, C.; Yaobao, M. A new archaeological remote sensing technology. Proc. Int. Arch. Photogramm. Remote Sens. Spat. Inf. Sci. 2008, 37, 221–224. [Google Scholar]
  102. Nedkov, R. Orthogonal Transformation of Segmented Images from the Satellite Sentinel-2. Comptes Rendus de l’Académie Bulgare des Sciences 2017, 70, 687–692. [Google Scholar]
  103. Bahrenberg, G.; Giese, E.; Nipper, J. Statistische Methoden in der Geographie 2—Multivariate Statistik; Borntraeger Gebrueder: Stuttgart, Germany, 1992; pp. 198–277. [Google Scholar]
  104. Lasaponara, R.; Masini, N.; Rizzo, E.; Coluzzi, R.; Orefici, G. New discoveries in the Piramide Naranjda in Cahuachi (Peru) using satellite, Ground Probing Radar and magnetic investigation. J. Archaeol. Sci. 2011, 38, 2031–2039. [Google Scholar] [CrossRef]
  105. Evans, D.; Traviglia, A. Uncovering Angkor: Integrated Remote Sensing Applications in the Archaeology of Early Cambodia. In Satellite Remote Sensing: A New Tool for Achaeology, Remote Sensing and Digital Image Processing; Lasaponara, R., Masini, N., Eds.; Springer: Cham, Switzerland, 2012; Volume 16, pp. 197–230. [Google Scholar]
  106. Estornell, J.; Martì-Gavilà, J.M.; Sebastià, T.; Mengual, J. Principal component analysis applied to remote sensing. MSEL 2013, 6, 83–89. [Google Scholar] [CrossRef] [Green Version]
  107. Martin, J.M. Foggia nel Medioevo; Congedo Editore: Galatina, Italy, 1998. [Google Scholar]
  108. Martin, J.M. I Castelli Federiciani Nelle Città del Mezzogiorno d’Italia. In Castelli e Fortezze Nelle Città Italiane e Nei Centri Minori Italiani (Secoli XIII–XV); Panero, F., Pinto, G., Eds.; CISIMI: Cherasco, Italy, 2009; pp. 251–269. [Google Scholar]
  109. Lou, L.; Wang, X.; Guo, H.; Lasaponara, R.; Shi, P.; Bachagha, N.; Li, L.; Yao, Y.; Masini, N.; Chen, F.; et al. Google Earth as a Powerful Tool for Archaeological and Cultural Heritage Applications: A Review. Remote Sens. 2018, 10, 1558. [Google Scholar]
  110. Campana, S.; Francovich, R. Linking Remote Sensing and Infra Site Analysis to the Reconstruction of Rural Settlement and Landscape Patterns. In Proceedings of the Reconstruction of Archaeological Landscapes through Digital Technologies, Berkeley, CA, USA, 3–5 November 2003. [Google Scholar]
  111. Lesiv, M.; See, L.; Laso-Bayas, J.; Sturn, T.; Schepaschenko, D.; Karner, M.; Moorthy, I.; McCallum, I.; Fritz, S. A global snapshot of the spatial and temporal distribution of very high resolution satellite imagery in Google Earth and Bing Maps as of 11th of January, 2017. Pangea 2018, 10, 1594. [Google Scholar]
  112. Analisi Idrologici—Parte I. Available online: https://protezionecivile.puglia.it/centro-funzionale-decentrato/rete-di-monitoraggio/annali-e-dati-idrologici-elaborati/annali-idrologici-parte-i-download/ (accessed on 20 March 2020).
  113. Huggett, J. Is Big Digital Data Different? Towards a New Archaeological Paradigm. J. Field Archaeol. 2020, 45, 8–17. [Google Scholar] [CrossRef] [Green Version]
  114. Gattiglia, G. Think big about Data: Archaeology and the Big Data Challenge. Archäologische Inf. 2015, 38, 113–124. [Google Scholar]
  115. Kitchin, R. Big Data, new Epistemologies and Paradigm Shifts. Big Data Soc. 2014, 1, 1–12. [Google Scholar] [CrossRef] [Green Version]
  116. Elfadaly, A.; Lasaponara, R. Cultural Heritage Management Using Remote Sensing Data and GIS Techniques around the Archaeological Area of Ancient Jeddah in Jeddah City, Saudi Arabia. Sustainability 2020, 12, 240. [Google Scholar] [CrossRef] [Green Version]
  117. Elfadaly, A.; Lasaponara, R. On the use of satellite imagery and GIS tools to detect and characterize the urbanization around heritage sites: The case studies of the Catacombs of Mustafa Kamel in Alexandria, Egypt and the Aragonese Castle in Baia, Italy. Sustainability 2019, 11, 2110. [Google Scholar] [CrossRef] [Green Version]
  118. Elfadaly, A.; Attia, W.; Lasaponara, R. Monitoring the environmental risks around Medinet Habu and Ramesseum Temple at West Luxor, Egypt, using remote sensing and GIS techniques. J. Archaeol. Method Theory 2018, 25, 587–610. [Google Scholar] [CrossRef]
  119. Elfadaly, A.; Attia, W.; Qelichi, M.M.; Murgante, B.; Lasaponara, R. Management of cultural heritage sites using remote sensing indices and spatial analysis techniques. Surv. Geophys. 2018, 39, 1347–1377. [Google Scholar] [CrossRef]
  120. Elfadaly, A.; Wafa, O.; Abouarab, M.A.; Guida, A.; Spanu, P.G.; Lasaponara, R. Geo-environmental estimation of land use changes and its effects on Egyptian Temples at Luxor City. ISPRS Int. J. Geo Inf. 2017, 6, 378. [Google Scholar] [CrossRef] [Green Version]
  121. Lasaponara, R.; Murgante, B.; Elfadaly, A.; Qelichi, M.M.; Shahraki, S.Z.; Wafa, O.; Attia, W. Spatial open data for monitoring risks and preserving archaeological areas and landscape: Case studies at Kom el Shoqafa, Egypt and Shush, Iran. Sustainability 2017, 9, 572. [Google Scholar] [CrossRef] [Green Version]
Figure 1. Study Area location.
Remotesensing 12 01309 g001
Figure 2. Flowchart of the study.
Remotesensing 12 01309 g002
Figure 3. Outputs produced using Sentinel-2 bands: (a) RGB; (b) False Colour Infrared; (c) Healthy Vegetation (HV).
Remotesensing 12 01309 g003
Figure 4. (a) Sentinel-2 RGB (2017-03-29); (b) Sentinel-2 RGB (2018-07-02); (c) Sentinel-2 RGB (2018-12-09); (d) e.g., region of interest (ROIs).
Remotesensing 12 01309 g004
Figure 5. Spectral Signature (average) of individual Sentinel-2 bands based on identified ROIs: (a) 2016-06-12; (b) 2016-07-22; (c) 2017-03-29; (d) 2017-07-07; (e) 2017-07-12; (f) 2017-08-01; (g) 2017-08-16; (h) 2018-07-02; (i) 2018-08-11; (j) 2018-08-31; (k) 2018-09-30; (l) 2018-09-11; (m) 2018-12-09.
Remotesensing 12 01309 g005
Figure 6. Time Series Analysis and Spectral Un-mixing results on indices.
Remotesensing 12 01309 g006
Figure 7. RGB produced using Tasseled Cap Transformation (TCTs) equations: (a) R: TCT brightness (2), G: TCT greenness (3), B: TCT wetness (4); (b) R: TCT brightness (5), G: TCT greenness (6), B: TCT wetness (7).
Remotesensing 12 01309 g007
Figure 8. RGB produced using Principal Component Analysis (PCAs) components: (a) PCA obtained from the first process with R: 1st component, G: 2nd component, B: 3rd component; (b) PCA obtained from the first process with R: 2nd component, G: 10th component, B: 11th component; (c) PCA obtained from the second method with R: 1st component, G: 2nd component, B: 3rd component.
Remotesensing 12 01309 g008
Figure 9. E.g. RGB composition and bands (Località Palmori).
Remotesensing 12 01309 g009
Figure 10. TCT detail of a Neolithic Settlement near Lucera: (a) TCT Brightness (2), (b) TCT Brightness (5), (c) TCT Greenness (3), (d) TCT Greenness (6).
Remotesensing 12 01309 g010
Figure 11. Identification of the features of archaeological interest, in the Palmori area, within the PCA: (a) PCA obtained with all the bands and indices produced, R: 2nd component, G: 10th component, B: 11th component; (b) PCA obtained with the images in which Spectral Unmixing has shown greater separability, R: 1st component, G: 2nd component, B: 3rd component. In the images there are archaeological sites already known from the bibliography/survey and archaeological sites not included in the national archaeological maps.
Remotesensing 12 01309 g011
Figure 12. Archaeological Site of Masseria Petrullo (Medieval Castrum): (a) Aerial photo [43], Figure 6; (b) PCA obtained with all the bands and indices produced, R: 2nd component, G: 10th component, B: 11th component; (c) PCA obtained with the images in which Spectral Unmixing has shown greater separability, R: 1st component, G: 2nd component, B: 3rd component.
Remotesensing 12 01309 g012
Figure 13. Some examples of features of archaeological interest identified in the study area: (a) circular or sub-circular shapes of Neolithic settlements; (b) geometrical shapes organized in regular complexes of the Classical period (Arpi); (c) Rectangular farmhouses of the medieval period (Torretta di Sezze); (d) paleochannels, roads, and traces of centuriation of different ages.
Remotesensing 12 01309 g013
Table 1. Sentinel-2 bands [46,47].
BandsCentral Wavelength (nm)Spatial Resolution (m)
Band 10.44360
Band 20.49010
Band 30.56010
Band 40.66510
Band 50.70520
Band 60.74020
Band 70.78320
Band 80.84210
Band 8A0.86520
Band 90.94560
Band 101.37560
Band 111.61020
Band 122.19020
Table 2. Sentinel-2 indices.
IndexEquationReference
Difference Vegetation Index (DVI) B 8 B 4 [57]
Enhanced Vegetation Index (EVI) 2.5 × B 8 B 4 B 8 + 6 × B 4 7.5 × B 2 + 1 [58]
Green Difference Vegetation Index (GDVI) B 8 B 3 [59]
Green Normalized Difference Vegetation Index (GNDVI) B 8 B 3 B 8 + B 3 [59]
Green Ratio Vegetation Index (GRVI) B 8 B 3 [60,61]
Normalized Difference VegetationIndex (NDVI) B 8 B 4 B 8 + B 4 [61]
Modified Chlorophyll Absorption in Reflectance Index B 5 B 4 0.2 × B 5 B 3 × B 5 B 4 [61]
Normalized Difference Water Index (NDWI) B 8 B 11 B 8 + B 11 [61]
Soil Band 0.09 × B 2 + 0.27 × B 3 0.71 × B 4 0.65 × B 8 [69,70]
Crop Band 0.38 × B 3 0.71 × B 2 + 0.2 × B 4 0.56 × B 8 [69,70]
Normalized Difference Moisture Index (NDMI) B 8 B 11 B 8 + B 11 [69,70]
Soil Adjusted Vegetation Index (SAVI) 1.5 × B 8 B 4 B 8 + B 4 + 0.5 [71,72,73,74,75,76]
Moisture Stress Index (MSI) B 11 B 8 [71,72,73,74,75,76]
Simple Ratio Nir/Red B 8 B 4 [71,72,73,74,75,76]

