The Impact of Canopy Reflectance on the 3D Structure of Individual Trees in a Mediterranean Forest


1
Computer Graphics and Geomatics Group of Jaén, University of Jaén, 23071 Jaén, Spain
2
Department of Cartographic, Geodetic and Photogrammetric Engineering, University of Jaén, 23071 Jaén, Spain
*
Author to whom correspondence should be addressed.
Remote Sens. 2020, 12(9), 1430; https://0-doi-org.brum.beds.ac.uk/10.3390/rs12091430
Submission received: 31 March 2020
/
Revised: 28 April 2020
/
Accepted: 29 April 2020
/
Published: 1 May 2020
(This article belongs to the Special Issue 3D Forest Structure Observation)
Abstract
:The characterization of 3D vegetation structures is an important topic, which has been addressed by recent research in remote sensing. The forest inventory requires the proper extraction of accurate structural and functional features of individual trees. This paper presents a novel methodology to study the impact of the canopy reflectance on the 3D tree structure. A heterogeneous natural environment in a Mediterranean forest, in which various tree species (pine, oak and eucalyptus) coexist, was covered using a high-resolution digital camera and a multispectral sensor. These devices were mounted on an Unmanned Aerial Vehicle (UAV) in order to observe the tree architecture and the spectral reflectance at the same time. The Structure from Motion (SfM) method was applied to model the 3D structures using RGB images from the high-resolution camera. The geometric accuracy of the resulting point cloud was validated by georeferencing the study area through multiple ground control points (GCPs). Then, the point cloud was enriched with the reflected light in four narrow-bands (green, near-infrared, red and red-edge). Furthermore, the Normalized Difference Vegetation Index (NDVI) was calculated in order to measure the tree vigor. A comprehensive analysis based on structural and spectral features of individual trees was proposed. A spatial segmentation was developed to detect single-trees in a forest and for each one to identify the crown and trunk. Consequently, structural parameters were extracted, such as the tree height, the diameter at breast height (DBH) and the crown volume. The validation of these measurements was performed by field data, which were taken using a Total Station (TS). In addition, these characteristics were correlated with the mean reflectance in the tree canopy. Regarding the observed tree species, a statistical analysis was carried out to study the impact of reflectance on the 3D tree structure. By applying our method, a more detailed knowledge of forest dynamics can be gained and the impact of available solar irradiance on single-trees can be analyzed.
1. Introduction
Forests play a key role in the conservation of biological diversity and suppression of climate change effects. The observation of its comprehensive three-dimensional (3D) structure has been the focus of recent advances in remote sensing [1]. Moreover, the observation of reflectance on the 3D tree structure is useful to detect the relationship between the shape of trees and their spectral behaviours. Collection of spectral and structural parameters of trees in the field has often been a time-consuming process with limited spatial resolution [2].
In recent years, a great variety of technologies and methods have been used to measure and observe 3D vegetation structures, such as RaDAR [3], Light Detection and Ranging (LiDAR) [4] or photogrammetric techniques such as structure-from-motion (SfM) [5]. Regarding the improvement in image quality, photogrammetry has been widely used for the 3D reconstruction of single-tree architecture. Unlike LiDAR technology, SfM-based methods are a more cost-effective solution and the accuracy of the results is quite acceptable [6]. Grant et al. [7] made a comparison of LiDAR and satellite photogrammetry for forest inventory and the results clearly showed that point cloud data obtained from stereo satellite imagery were useful for the acquisition of forest inventory attributes. Furthermore, Unmanned Aerial Vehicles (UAVs) provide a great opportunity to capture multi-source remote sensing data of the forest structure [8,9]. The imaging sensors can capture heterogeneous data in order to observe particular ecosystem functions. Regarding some UAV-based applications in forestry, Tomaštík et al. [10] studied the accuracy of photogrammetric UAV-based point clouds under conditions of a partially open forest canopy and Tian et al. [11] proposed a novel tree-height extraction approach for individual trees by combining terrestrial laser scanners (TLS) and UAV.
While a 3D forest structure can easily be assessed in a holistic way using terrestrial LiDAR [12,13], single-tree information is often needed. Therefore, a comprehensive inventory of 3D forest requires a proper segmentation of individual trees and an accurate delineation of the canopy structure. One of the most popular clustering methods for the segmentation of the point cloud is the k-means algorithm [14,15]. This method needs some seed points, whose location strongly influence the correct recognition of each tree. In this scenario, some approaches based on the canopy height maximum (CHM) were proposed to detect treetops and determine the initial seed points [16]. However, the most important drawback of this method is that an inappropriate choice of k, the number of clusters, might yield poor clustering results. In this study, a spatial segmentation of the tree crown is proposed for the individual segmentation in the study area. According to the study of tree structure, Chen et al. [17] proposed a novel methodology for the trunk and crown segmentation using LiDAR data. In this study, we propose a novel approach for the tree segmentation and the crown and trunk recognition on photogrammetric point clouds. Regarding the extraction of structural attributes, the tree height, the crown volume and the diameter breast height (DBH) are meaningful traits in order to observe tree growth and tree species characterization. Generally, previous works used various novel platforms to create and characterize the 3D structure of a forest but the study and modeling of forest dynamics are still challenging.
Recent research has proposed solutions based on fusing hyperspectral, multispectral or thermal images for the environmental understanding [18,19,20]. Nevertheless, most of these observations are fundamentally two-dimensional (2D) and the tree structure is measured by using orthomosaics of the study area. In reality, forests are complex 3D systems, so the extraction of a comprehensive knowledge of trees has to be carried out in the 3D space. Moreover, the use of multispectral images can be used to observe the light absorption of the tree canopy from meaningful spectral bands [21] as well as to measure the canopy structure [22]. The spectral reflectance and 3D tree structure can be used together to study the light propagation in a forest and to classify the tree species. In this regard, several studies were proposed for the recognition of spectral reflectance patterns in forests and the competition for light in forest gaps [23,24].
The aim of this study was to measure the incident sunlight on the tree canopy and to analyze the impact on the structural tree parameters such as the tree height, trunk diameter and the crown volume. The main contributions of the proposed methodology are: (1) the reflectance-based characterization of the 3D forest structure, (2) the fully automatic segmentation of individual trees, (3) the analysis of dependency between structural and spectral parameters by considering different tree species. This article is structured as follows: Section 2 describes the study area and sensors used for data collection. Section 3 shows the proposed methods for data acquisition, 3D reconstruction, multispectral map computing, point cloud characterization, segmentation of individual trees, reflectance-based analysis and validation. In Section 4, the results are presented and main issues are discussed in Section 5. Finally, Section 6 presents the main conclusions and further research.
2. Materials
2.1. Study Area
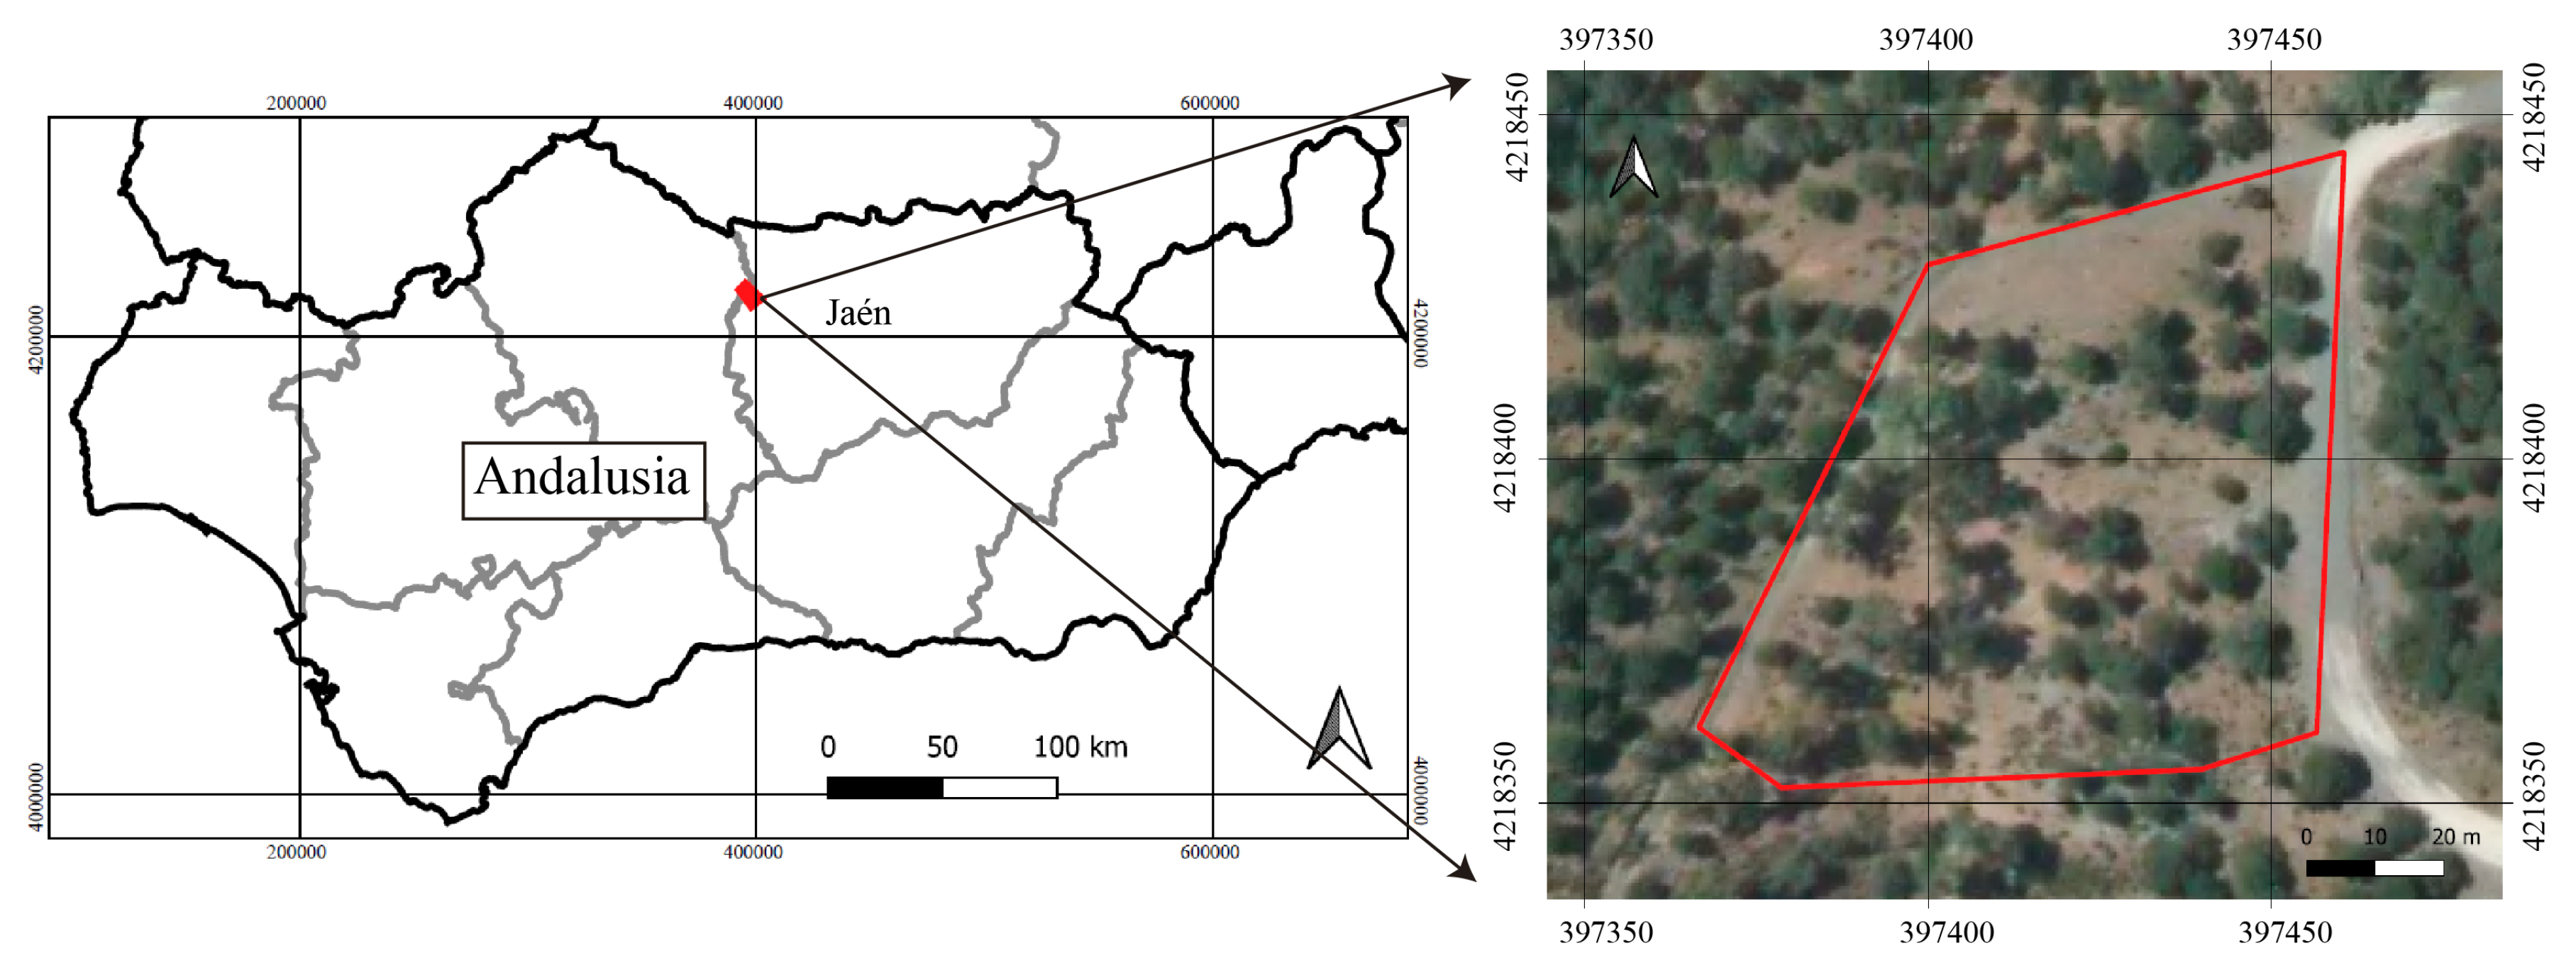
The study was conducted in a Mediterranean forest, situated in Sierra Morena Nature Reserve (38°06’N, 4°10’W) in Jaén, a southern province of Spain located about 500 m above sea level. This region has a semi-continental climate with a mean annual temperature of 25.1 C, a mean relative humidity of 70% and a mean annual precipitation of 1341 mm [25]. The study area is characterized by different tree species such as the oak, pine and eucalyptus as well as other Mediterranean shrubs. Moreover, the ground in this area has a concave shape with a slight slope. For the purpose of our research, we covered an area of 0.6 ha. Figure 1 shows the study area in which this research was conducted.
2.2. UAV-Based and Field Data
The use of UAV in remote sensing provides the collection of heterogeneous data through optimal trajectories and a high detail level of the plant shape. In contrast to satellite images, the UAV-based acquisition process has a high versatility and provides multiple observations of target crops from different viewpoints. The morphological structure of trees is complex, with many self-hidden branches, which makes the observation of 3D structure more difficult.
In this research, a professional drone (model: DJI Matrice 210) was used to collect aerial imagery. On board the drone a high-resolution digital camera (model: X5s) and a multispectral sensor (model: Parrot Sequoia) were mounted. These devices were very different from each other. On the one side, a full-frame RGB camera took photos with 20.8 megapixels (MP), thereby observing the study area with a great spatial resolution. On the other side, the multispectral sensor captured the reflectance in four spectral bands: the near-infrared (NIR) from 770 nm to 810 nm, the red from 640 nm to 680 nm, the green from 530 nm to 570 nm and the red-edge (REG) from 730 nm tp 740 nm. This device has a wide-angle lens with a focal length of 4 mm to cover more ground area in a single capture. However, a high visual deformation was presented in the image. In this way, the development of the canopy reflectance was monitored from every wavelength range in order to characterize the spectral behaviour for each single tree. In addition, the Red and NIR bands were combined to calculate the Normalized Difference Vegetation Index (NDVI). It is a well-known spectral index applied in remote sensing to assess the green biomass, leaf cover and chlorophyll per unit ground area [26,27].
An important aspect of the data collection process was to ensure an accurate geolocation and geometric quality. Therefore, it was necessary to design the distribution of Ground Control Points (GCPs). These are marked points on the ground that have a known geographic location of the whole area into a national grid and height datum. This network of points was used to georeference the images, and thus the point clouds were unified into the same reference system.
GCPs were measured on the center point of circular targets of 25 mm. These were covered with an aluminium foil to ensure a high contrast in RGB images and a full reflectance in multispectral images. The coordinates of GCPs network were obtained from a couple of Global Navigation Satellite System (GNSS) receivers (model: Topcon GR5) using Real-Time-Kinematic (RTK) technique. One receiver was set in a fixed point and a second one was used to measure every point in the field. The fixed point was located in a high place of the study area in order to avoid any possible interference. The reference frame was ETRS89 and the projection was Universal Transverse Mercator (UTM) zone 30, and the altitude was referred to the mean sea level data at Alicante (Spain).
Regarding the field data to measure the tree height and trunk diameter, these were taken using a Total Station (TS) (Model: Leica TCR 805 reflectorless). The TS is a surveying instrument which measures angles and distances using an electronic distance measurement (EDM). The angles and distances were measured by the TS, and the coordinates (X, Y, and Z; or easting, northing, and elevation) of surveyed points are relative to the TS. To get an absolute location it is necessary to know the absolute coordinates of the TS position (base station) and another reference point. A direct line of sight between the TS and the reference point is also required. For the first time, the TS have to be orientated, so we pointed to the reference point and then, to the target point. Moreover, the resulting coordinates were automatically transformed to our reference system. In this way, the coordinates of the 3D tree structure were measured.
3. Methods
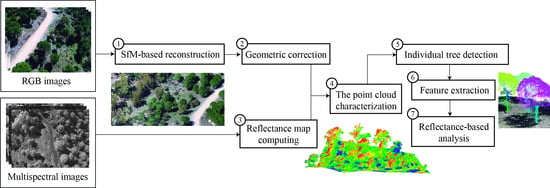
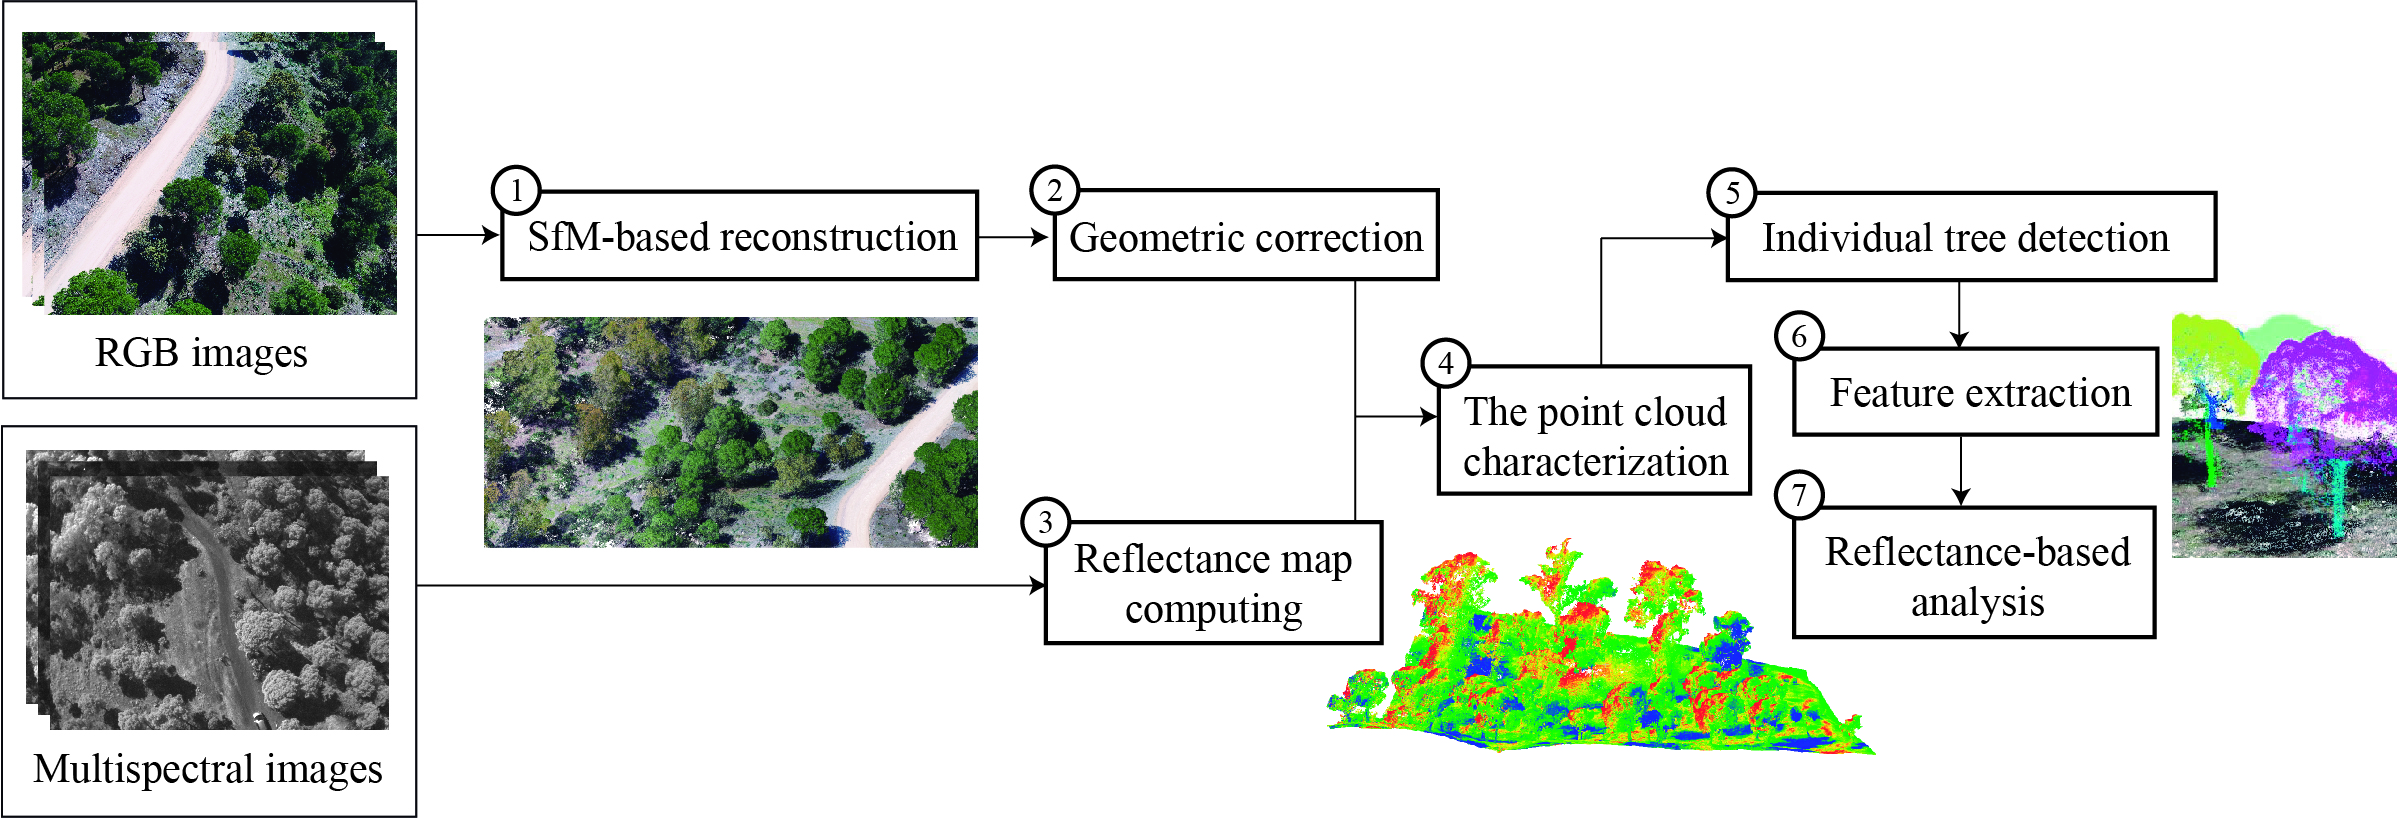
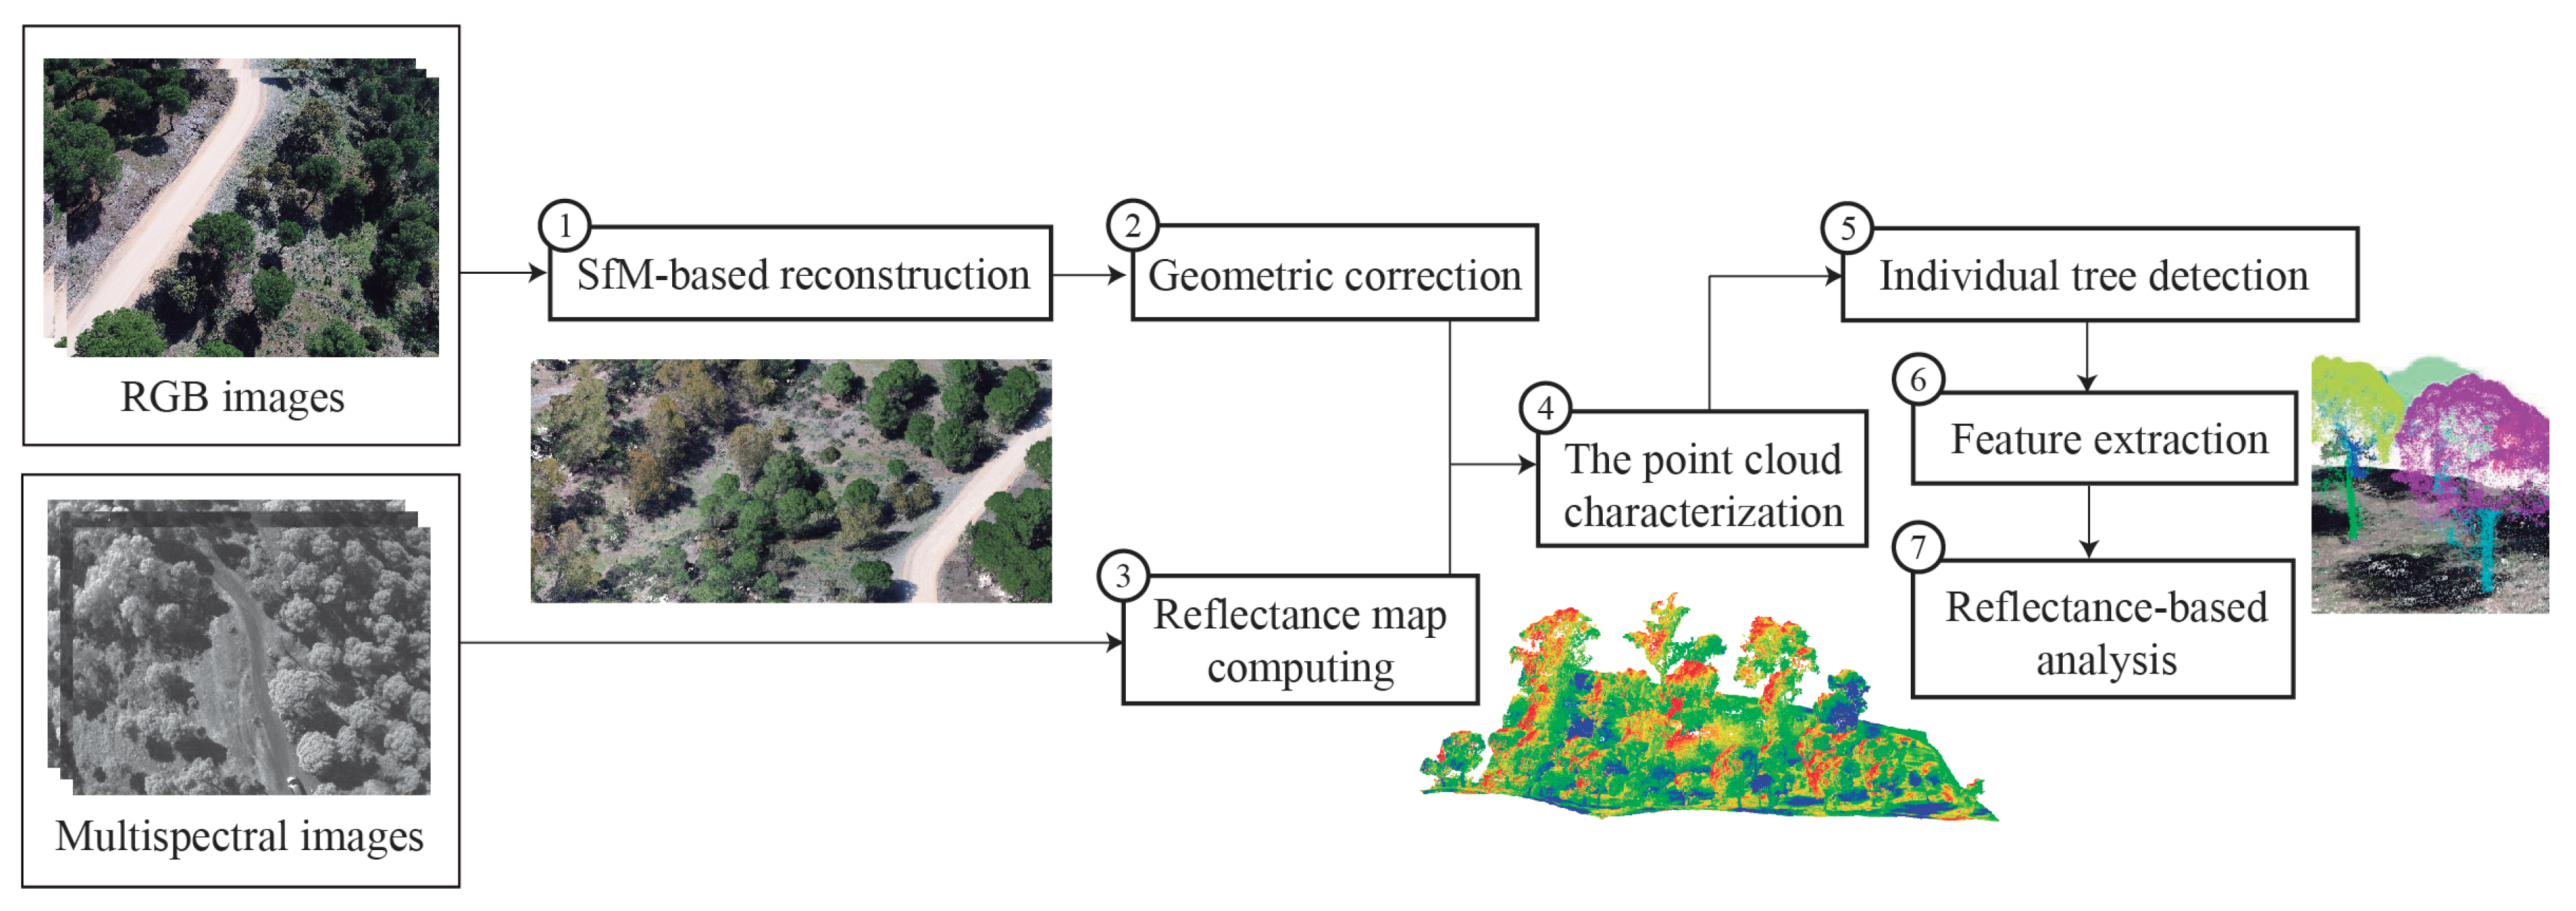
In this research, some steps were developed from the acquisition of aerial images to the reflectance-based analysis of the 3D structures on individual trees. Figure 2 shows a diagram which summarizes the main sections of the proposed methodology. Initially, the RGB images were used to generate a dense point cloud which was geometrically corrected by the use of GCPs. Then, this 3D model was enriched using reflectance data, which described the plant response to incident sunlight. According to spatial and spectral features of the point cloud, a method for individual tree detection was proposed. Moreover, once every tree was segmented, the crown and trunk were identified and some structure-based features were extracted. Finally, our analysis was based on the study of the impact of the mean canopy reflectance on the 3D structure of trees. The proposed methodology for the extraction, processing and analyzing the studied tree parameters was implemented in C++ using Point Cloud Library (PCL) [28] and OpenCV [29].
3.1. UAV-Based Acquisition
The use of UAVs for the observation of the 3D forest structure is a great opportunity to capture more detailed images with a higher spatial resolution than satellite images. Regarding the lighting conditions, the camera settings need to be determined by fixed values in order to avoid over- or under-exposed images. The photogrammetric results are highly influenced by the quality of input images. Therefore, sensors, settings and acquisition plans have to be considered to ensure optimal image data. Regarding the parameters of digital camera, the ISO was 100, the aperture was set to f/6.3 and exposition time was 1/500 s. This camera setting ensures the capture of sharp images without motion blur, which has negative impacts on the quality of photogrammetric reproduction. According to the multispectral sensor, these parameters were set by default (ISO: 100, f-number: 2.2 and exposure time: 1/5417).
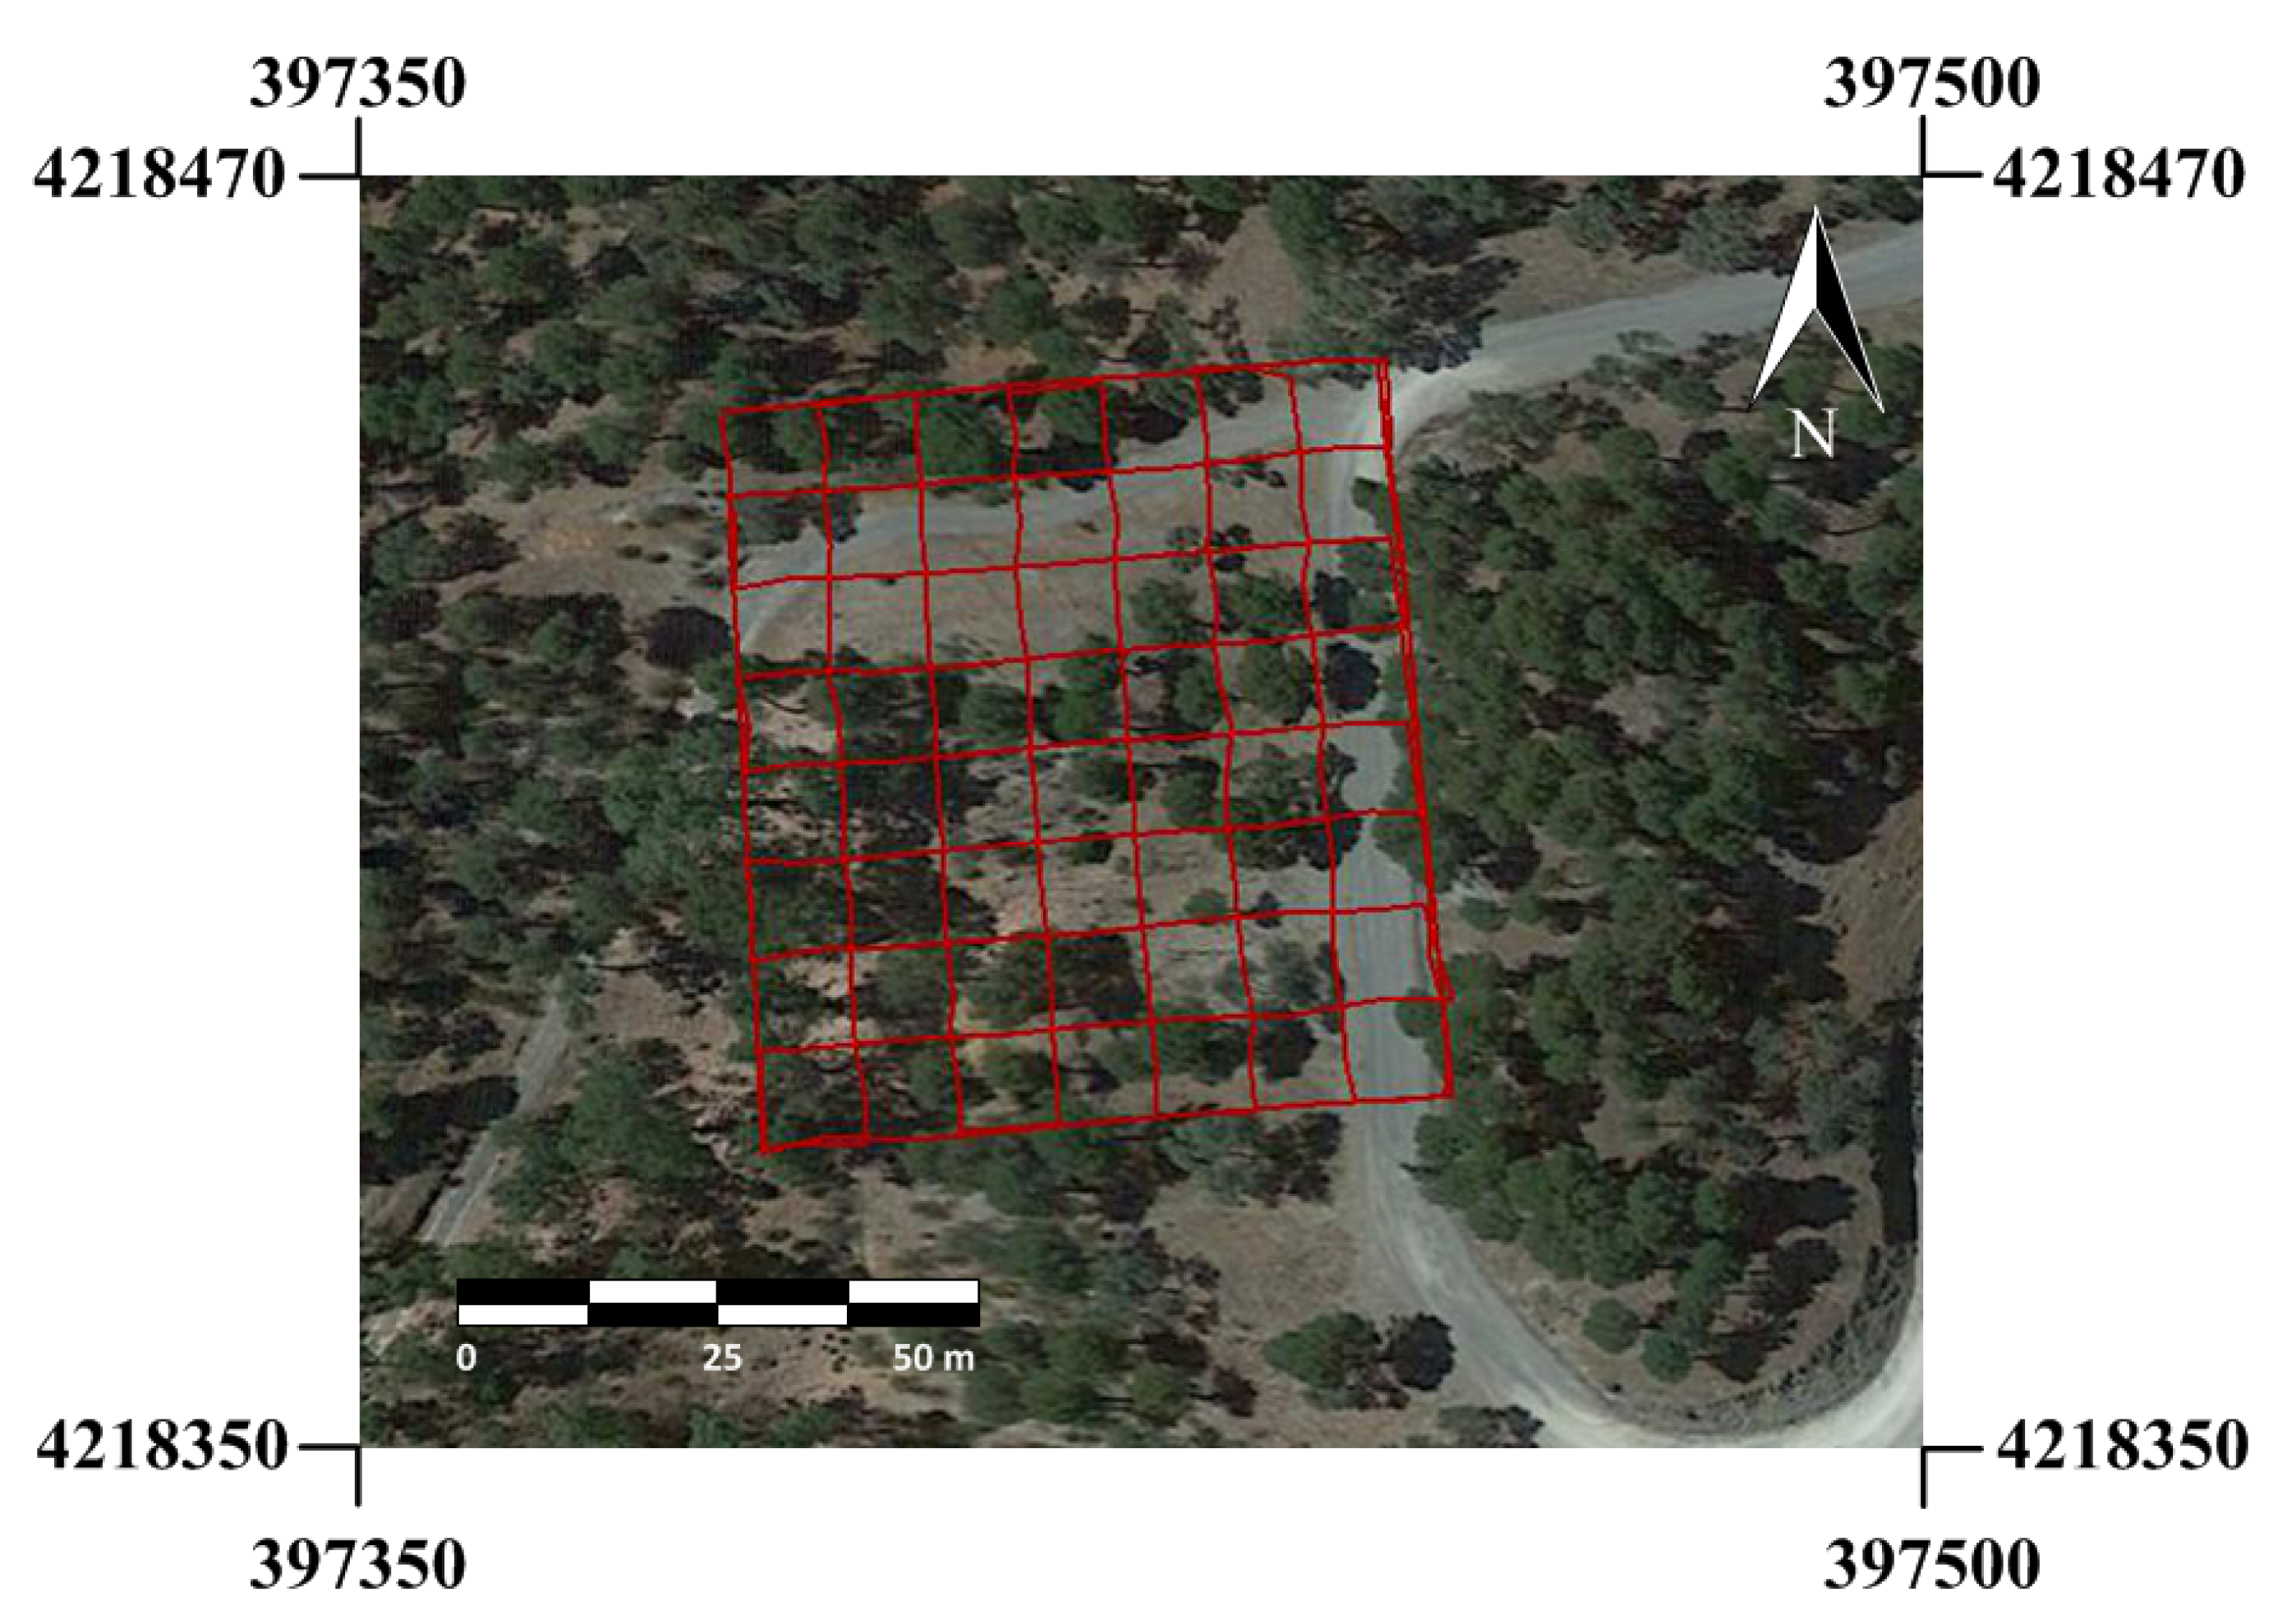
In this research, one flight was performed in order to acquire a comprehensive observation of the tree geometry and reflectance. It was conducted close to the solar noon time in order to minimize the plant shadows and specular lighting. The time flight was 25 min. As mentioned before, a digital high-resolution camera and a multispectral sensor were mounted together on board the UAV during the flight. The spatial resolution of each sensor is different, so the flight plan must ensure that the ground sampling distance (GSD) of both image sets is under 3 cm. Thus, the tree structure can be observed through a high spectral resolution. According to the specification of the multispectral sensor, which has the lowest image resolution, the flight height was set to 30 m. Regarding the flight path, a double grid was carried out to capture the tree structure from multiple viewpoints with a side and front overlap of 85% (Figure 3). Moreover, the capturing angle is another factor to take into account in any photogrammetric acquisition. In this case, the high-resolution RGB camera was mounted with an inclination of 60°. Therefore, the lateral and low branches of trees could be detected in the image and these were reconstructed on the 3D model. The multispectral sensor was oriented perpendicular to the ground (90°) to ensure accurate measurements of canopy reflectance.
3.2. Point Cloud Reconstruction
The observation of 3D forest structure by high-resolution cameras has been recently improved by the optimization of image-based methods. In this regard, the adoption of Structure from Motion (SfM) [30] is changing the acquisition of remote sensing data in forestry [31]. In contrast to other approaches based on LiDAR data [1], the application of SfM enables collecting the fit-for-purpose data to assess the single-tree architecture from multiple viewpoints. The potential of using UAVs and consumer-grade cameras for the 3D reconstruction is a great opportunity to observe the comprehensive development of a forest. In fact, there is increasing interest in UAV forest surveys which can arguably be attributed to photogrammetric processing [32].
SfM photogrammetry employs an automated process to identify and match key points between overlapping images. Therefore, the complex geometry of plants poses an important challenge to detect similarities in the image. To apply SfM photogrammetry in forestry, some relevant aspects to obtain an accurate survey are as follows: (1) any feature to be reconstructed should be visible in at least three images, (2) the study area should be sufficiently illuminated, (3) the image scale should be 1/2 or 1/4 to recognize more key points. We used Pix4D software to generate the dense point cloud and make the geometric corrections in the resulting 3D model.
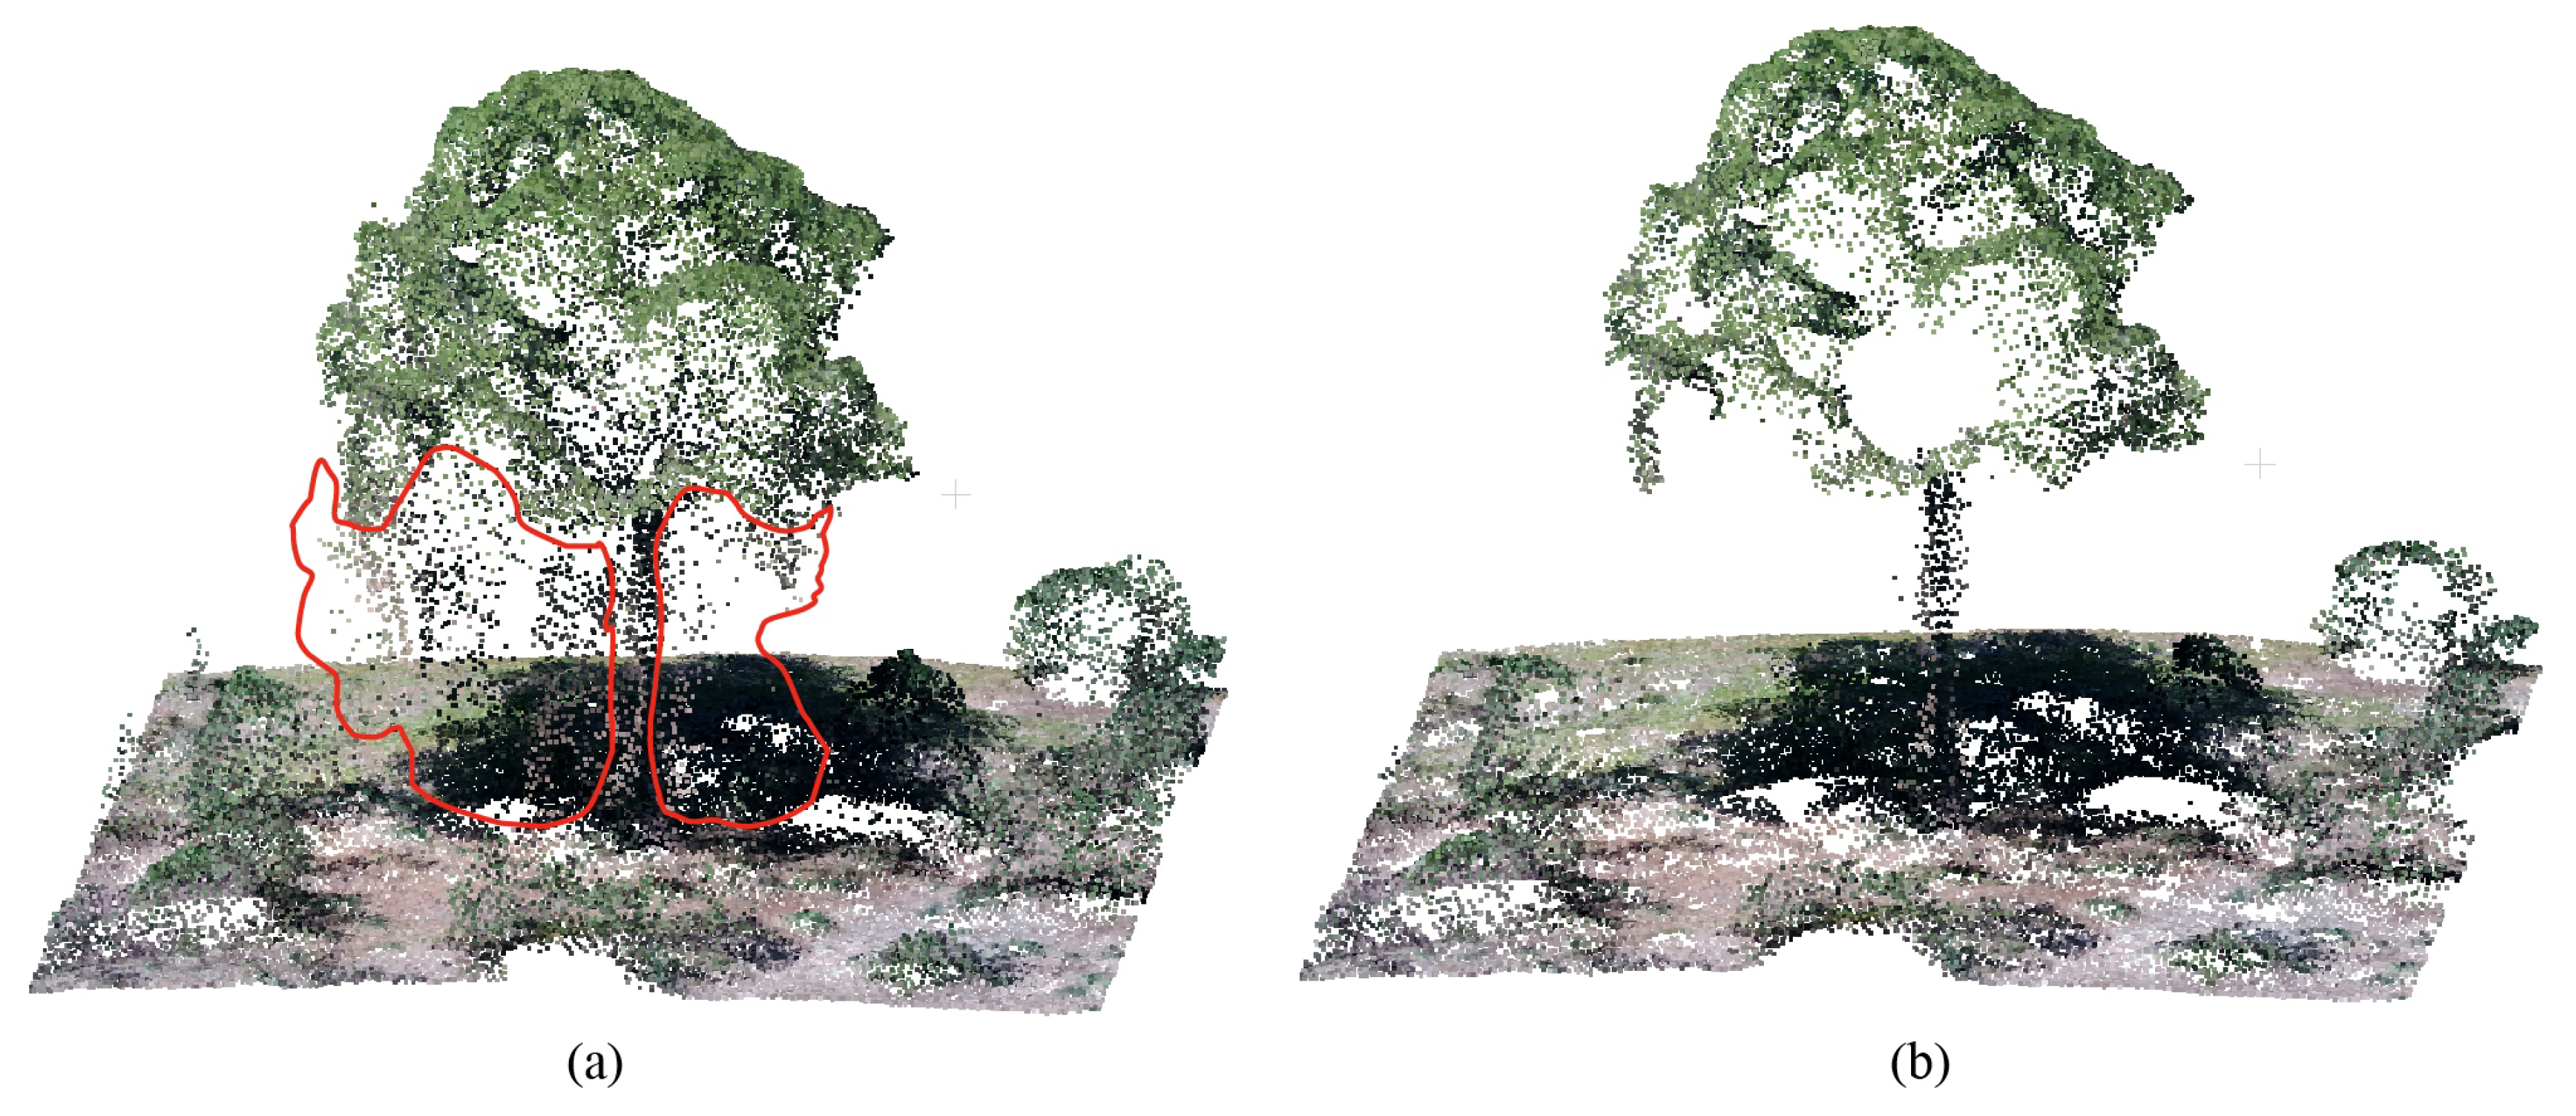
Regarding the results of the SfM, the point cloud have to be corrected in order to ensure a correct position and scale. For this purpose, twenty-three GCPs were measured but only seven points were used for the georeferencing; the rest were used to validate the results. All these points were located on visible areas from the viewpoint of the aerial images captured. Therefore, we could achieve a centimeter accuracy in the study area, and the parameters of the tree structure were correctly measured. Finally, the dense point cloud was submitted to a noise filtering process in order to remove points around the tree shape, which were generated by the SfM method. In this case, we applied the Statistical Outlier Removal (SOR) algorithm, in which 100 neighbours were considered to calculate the distance between them and to remove the points that were farther than the average distance and the standard deviation. The left image in Figure 4 shows an example of an observed tree on the point cloud, which presents a high noise around the tree trunk. By applying the noise filter, these points are automatically removed as shown on the right in Figure 4.
3.3. Reflectance Map Computing
Multispectral imaging provides image information in spectral as well as spatial domains. The surface bidirectional reflectance distribution function (BRDF) measures the distribution of the reflected light by leaves, which is directly related to the tree growth. In this study, a multispectral sensor was used to measure the canopy reflectance of the observed forest area from multiple viewpoints. As mentioned before, this sensor is composed by four lenses to capture the reflected irradiance and a sunshine sensor to measure the incident irradiance. The resulting multispectral images provided an accurate measurement of reflectance in some specific narrow-bands of the electromagnetic spectrum. First, in the near-infrared (NIR), the vegetation can easily be recognized due to the fact that this band is less sensitive to chlorophyll. Secondly, the Green and Red bands are very useful to study the reflected light by the tree canopy in the visible range. Finally, the REG band captures the reflectance between the Red and NIR and plays a key role detecting a key contrast from the visible to infrared light.
The capture of spectral reflectance can be influenced by several parameters such as changes of ambient light, the shutter speed, etc. Therefore, the multispectral images have to be radiometrically corrected by a calibration target. In our study, the spectral reflectance was calculated by measuring the incoming sunlight irradiance and reflected irradiance by the surface of the object captured. Equation (1) was used to estimate the reflectance value (R) for each pixel of every multispectral image.
where is the calibration coefficient of every band i, is the radiant flux reflected by the object captured, is the radiant flux incidence by the sun and is the angle between the direction vector of sun rays and direction vector of the sunshine sensor.
The incoming sunlight irradiance () was measured by the sunshine sensor, which was mounted on top of the acquisition system. This device was continuously capturing the lighting conditions during the acquisition process. Moreover, the angle between the sunshine sensor and the sunlight direction have to be taken into account to compensate the light reflection. A mean value of the incident light was estimated for each multispectral image. The mathematical formulation of this magnitude is defined in Equation (2).
where is a sensor count value, g is the relative gain factor and is the exposure time in seconds.
The next step was the calculation of the reflected irradiance () by using metadata (Exif) stored in the image. Every pixel p in the image I provided a reflected irradiance value, which was calculated by applying Equation (3).
where g is the f-number = 2.2, p is defined by pixel intensity, is the exposure time, is the ISO parameter = 100 and A, B and C are the calibration coefficients measured per camera in production.
Finally, the plant reflectance must be radiometrically calibrated. Therefore, a calibration panel was used to calculate the calibration coefficient (K) regarding a known reflectance for every multispectral band. Three images were captured over this panel at different exposure levels. This process was carried out at the beginning and at the end of the acquisition process. Then, Equation (4) was applied to calculate a calibration coefficient K for each observed band.
where is the known reflectance for each band i, is the radiant flux incidence from the sunlight and is the radiant flux reflected by the calibration panel.
Moreover, the reflectance values in the Red and NIR bands were combined to estimate the NDVI. This spectral index is widely used in remote sensing for the assessment of a plant health. Although this study is out of the scope of this work, the use of the NDVI is very interesting to identify the vegetation on the ground and study the tree vigor. As a result, reflectance and NDVI maps were obtained for each multispectral image and these were mapped on the point cloud to characterize it with meaningful spectral traits.
3.4. The Point Cloud Characterization
In this section, we propose a variation of the method developed by Jurado et al. [33], which focuses on multispectral image mapping on 3D point clouds. Thus, the geometry can be enriched by spectral features in order to describe physiological properties of vegetation. The core of this method is the inverse 3D projection in order to calculate the pixels of multispectral images, in which 3D points of the cloud are directly visible. In this research, a variation of this method was applied, so the point cloud of our study area was characterized by the spectral reflectance from every observed narrow-band. Therefore, the reflected light by every single tree was measured and the key geometric changes on the 3D structure were detected.
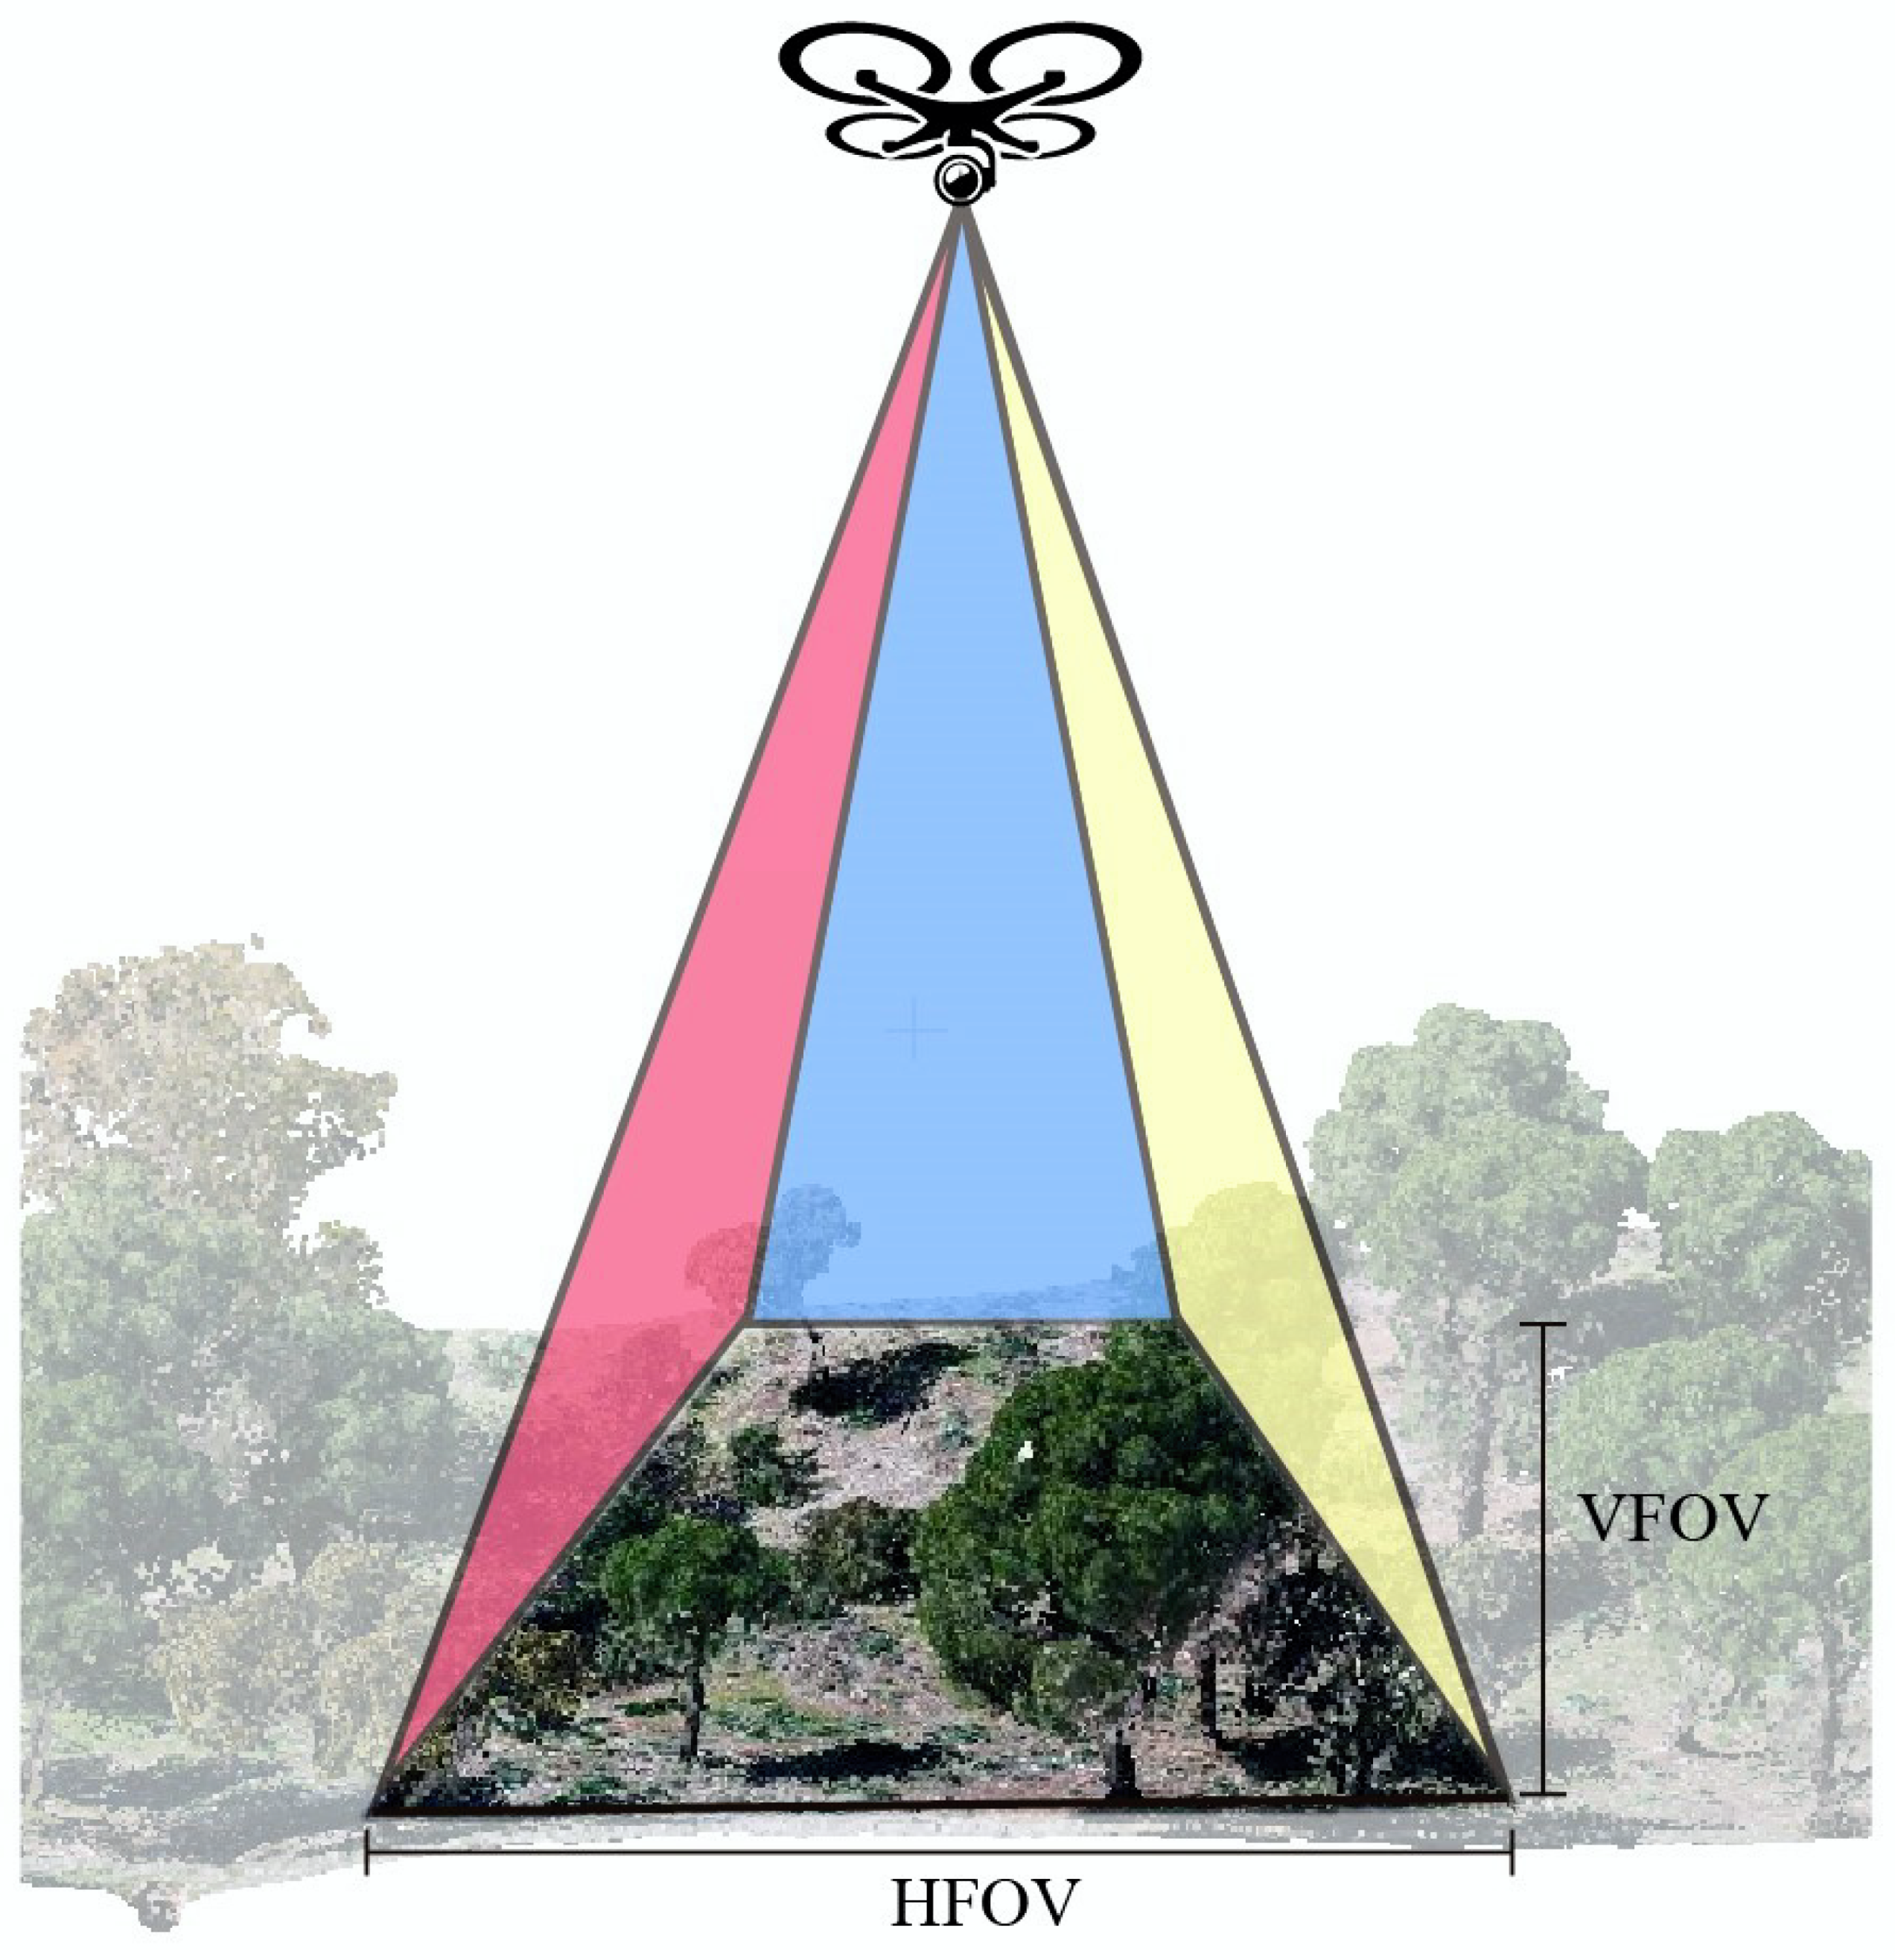
Regarding the proposed optimization in this work, first, the point cloud was spatially indexed using an octree [34] in order to ensure a more efficient neighbour search in the visibility test. Secondly, the view frustum for each multispectral camera was calculated by considering four cutting-planes. The vertical field of view (VFOV) and the horizontal field of view (HFOV) were determined by the parameters of the multispectral sensor (VFOV: 48.5° and HFOV: 61.9°). Consequently, only the points inside the volume of view frustum were considered to be projected in the image (Figure 5). Finally, a new approach was proposed to improve the efficiency of visibility test. In contrast to the occlusion detection on the point cloud by the creation of minimal triangulated surfaces, a distance-based matrix was used for each multispectral capture. Our method only enables one-to-one relationships so only one 3D point can be projected on one pixel. The size of this matrix was determined by the multispectral image resolution. For each pixel a distance from the projected 3D point and the camera position was saved. This matrix was updated in order to obtain for each cell the 3D point to be projected, which had the minimum distance to the position camera. As a result, the resolution of the point cloud was higher than multispectral images, so multiple 3D points were not characterized by any reflectance values. To overcome this problem, a k-nearest neighbour search (KNN) [35] was developed in order to assign the mean reflectance of the neighbours to unprojected points.
This process was an important step in the proposed methodology in order to characterize the geometry with meaningful data about the light competition in the study area. For each 3D point, we could determine the light which was reflected or absorbed in four multispectral bands. Undoubtedly, the mean canopy reflectance is a key factor which determines the development of a tree structure. Therefore, the next step was to focus on the individual detection of single trees in the study area.
3.5. Individual Tree Detection
The segmentation of individual trees is a critical process for the assessment of the single-tree architecture. A variety of methods were proposed to identify individual tree crowns based on raster images [36,37]. However, our point-based approach directly uses spatial constraints on the point cloud rather than the raster images. The proposed method for the individual tree detection was divided in two steps: (1) the segmentation of individual tree crowns and (2) the tree trunk recognition.
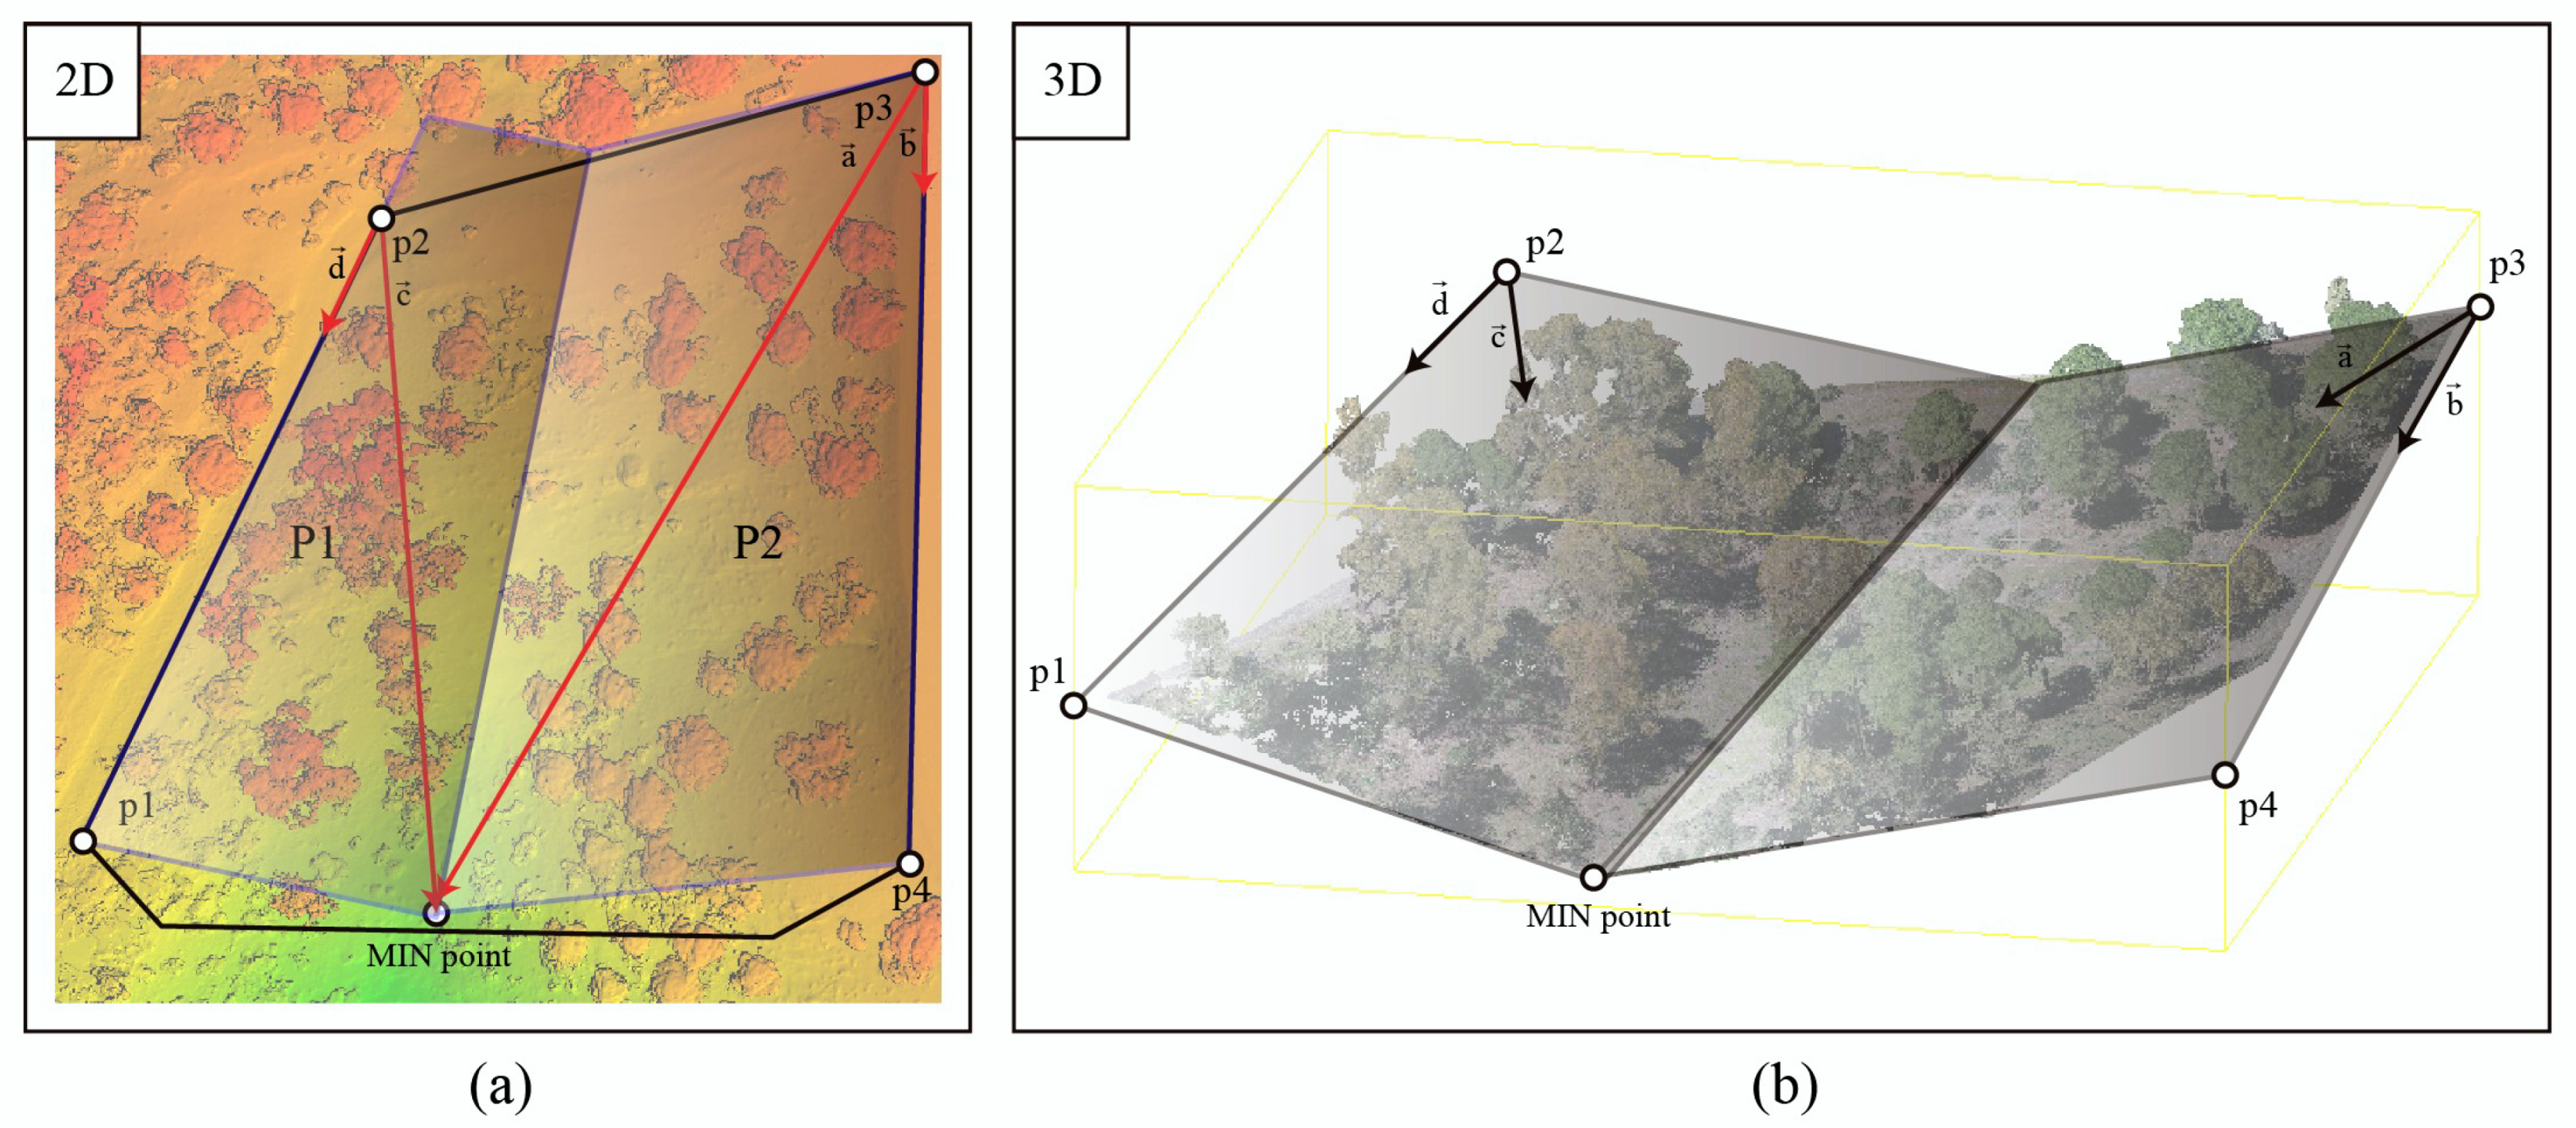
The first step was the segmentation of the tree crown on the point cloud. The study scenario was characterized by a ground, which had a concave shape and a significant slope to be considered, many shrubs around the trees and different tree species, which had heterogeneous crown shapes. The ground points could be discarded by using the spectral reflectance since these reflected a lower infrared light than vegetation points. However, the mean reflectance of low vegetation and tree crowns is similar, so trees cannot be clearly identified using only the multispectral features. In this regard, our method was based on the calculation of 3D cutting-planes oriented with the slope of the terrain in order to extract those points, which are in the tree crown. Figure 6 describes the experimental concept for the proposed method in the study area. First, the 3D point with the minimum height (MIN point) was set. Then, a bounding box was calculated on the point cloud in order to determine the boundary ground points (p1, p2, p3 and p4) for each corner. Thus, four slope vectors were calculated by linking the two points with the maximum height (p2 and p4) to the minimum point and to the other boundary points (p1 and p3). As a result, two planes were created by considering the vectors and for the plane P1 as well as the vectors and for the plane P2. In the left image in Figure 6, the Digital Surface Model (DSM) is shown where the MIN point is detected in the green area, which depicts the lower height values. The planes P1 and P2 are also shown, which were determined by the vectors mentioned before. Moreover, in the image on the right, the same concept is described by depicting the cutting-planes on the point cloud from a 3D perspective. By applying this method, all 3D points under the cutting-planes were automatically discarded. Consequently, only the highest 3D points, which usually form the tree crown and the highest branches, were preserved for the identification of every individual tree.
The tree segmentation was carried out following an approach based on spatial clustering. The algorithm proposed by Kanungo et al. [38] was applied in order to extract the tree crowns, which were spatially separated from each other. In the study area, by applying the noise removal on the point cloud, the minimum distance between every tree crown was at least 50 cm. The generation of every cluster was determined as follows: (1) the Euclidean distance between the 3D points must be lower than 50 cm (this value is proportional to the GSD of the dense point cloud) and (2) the angle between normal vectors cannot be wider than 180°. The goal of these constraints is to ensure the correct definition of the growing region for each cluster. Thus, the tree crown was segmented by using only the spatial features of the 3D model.
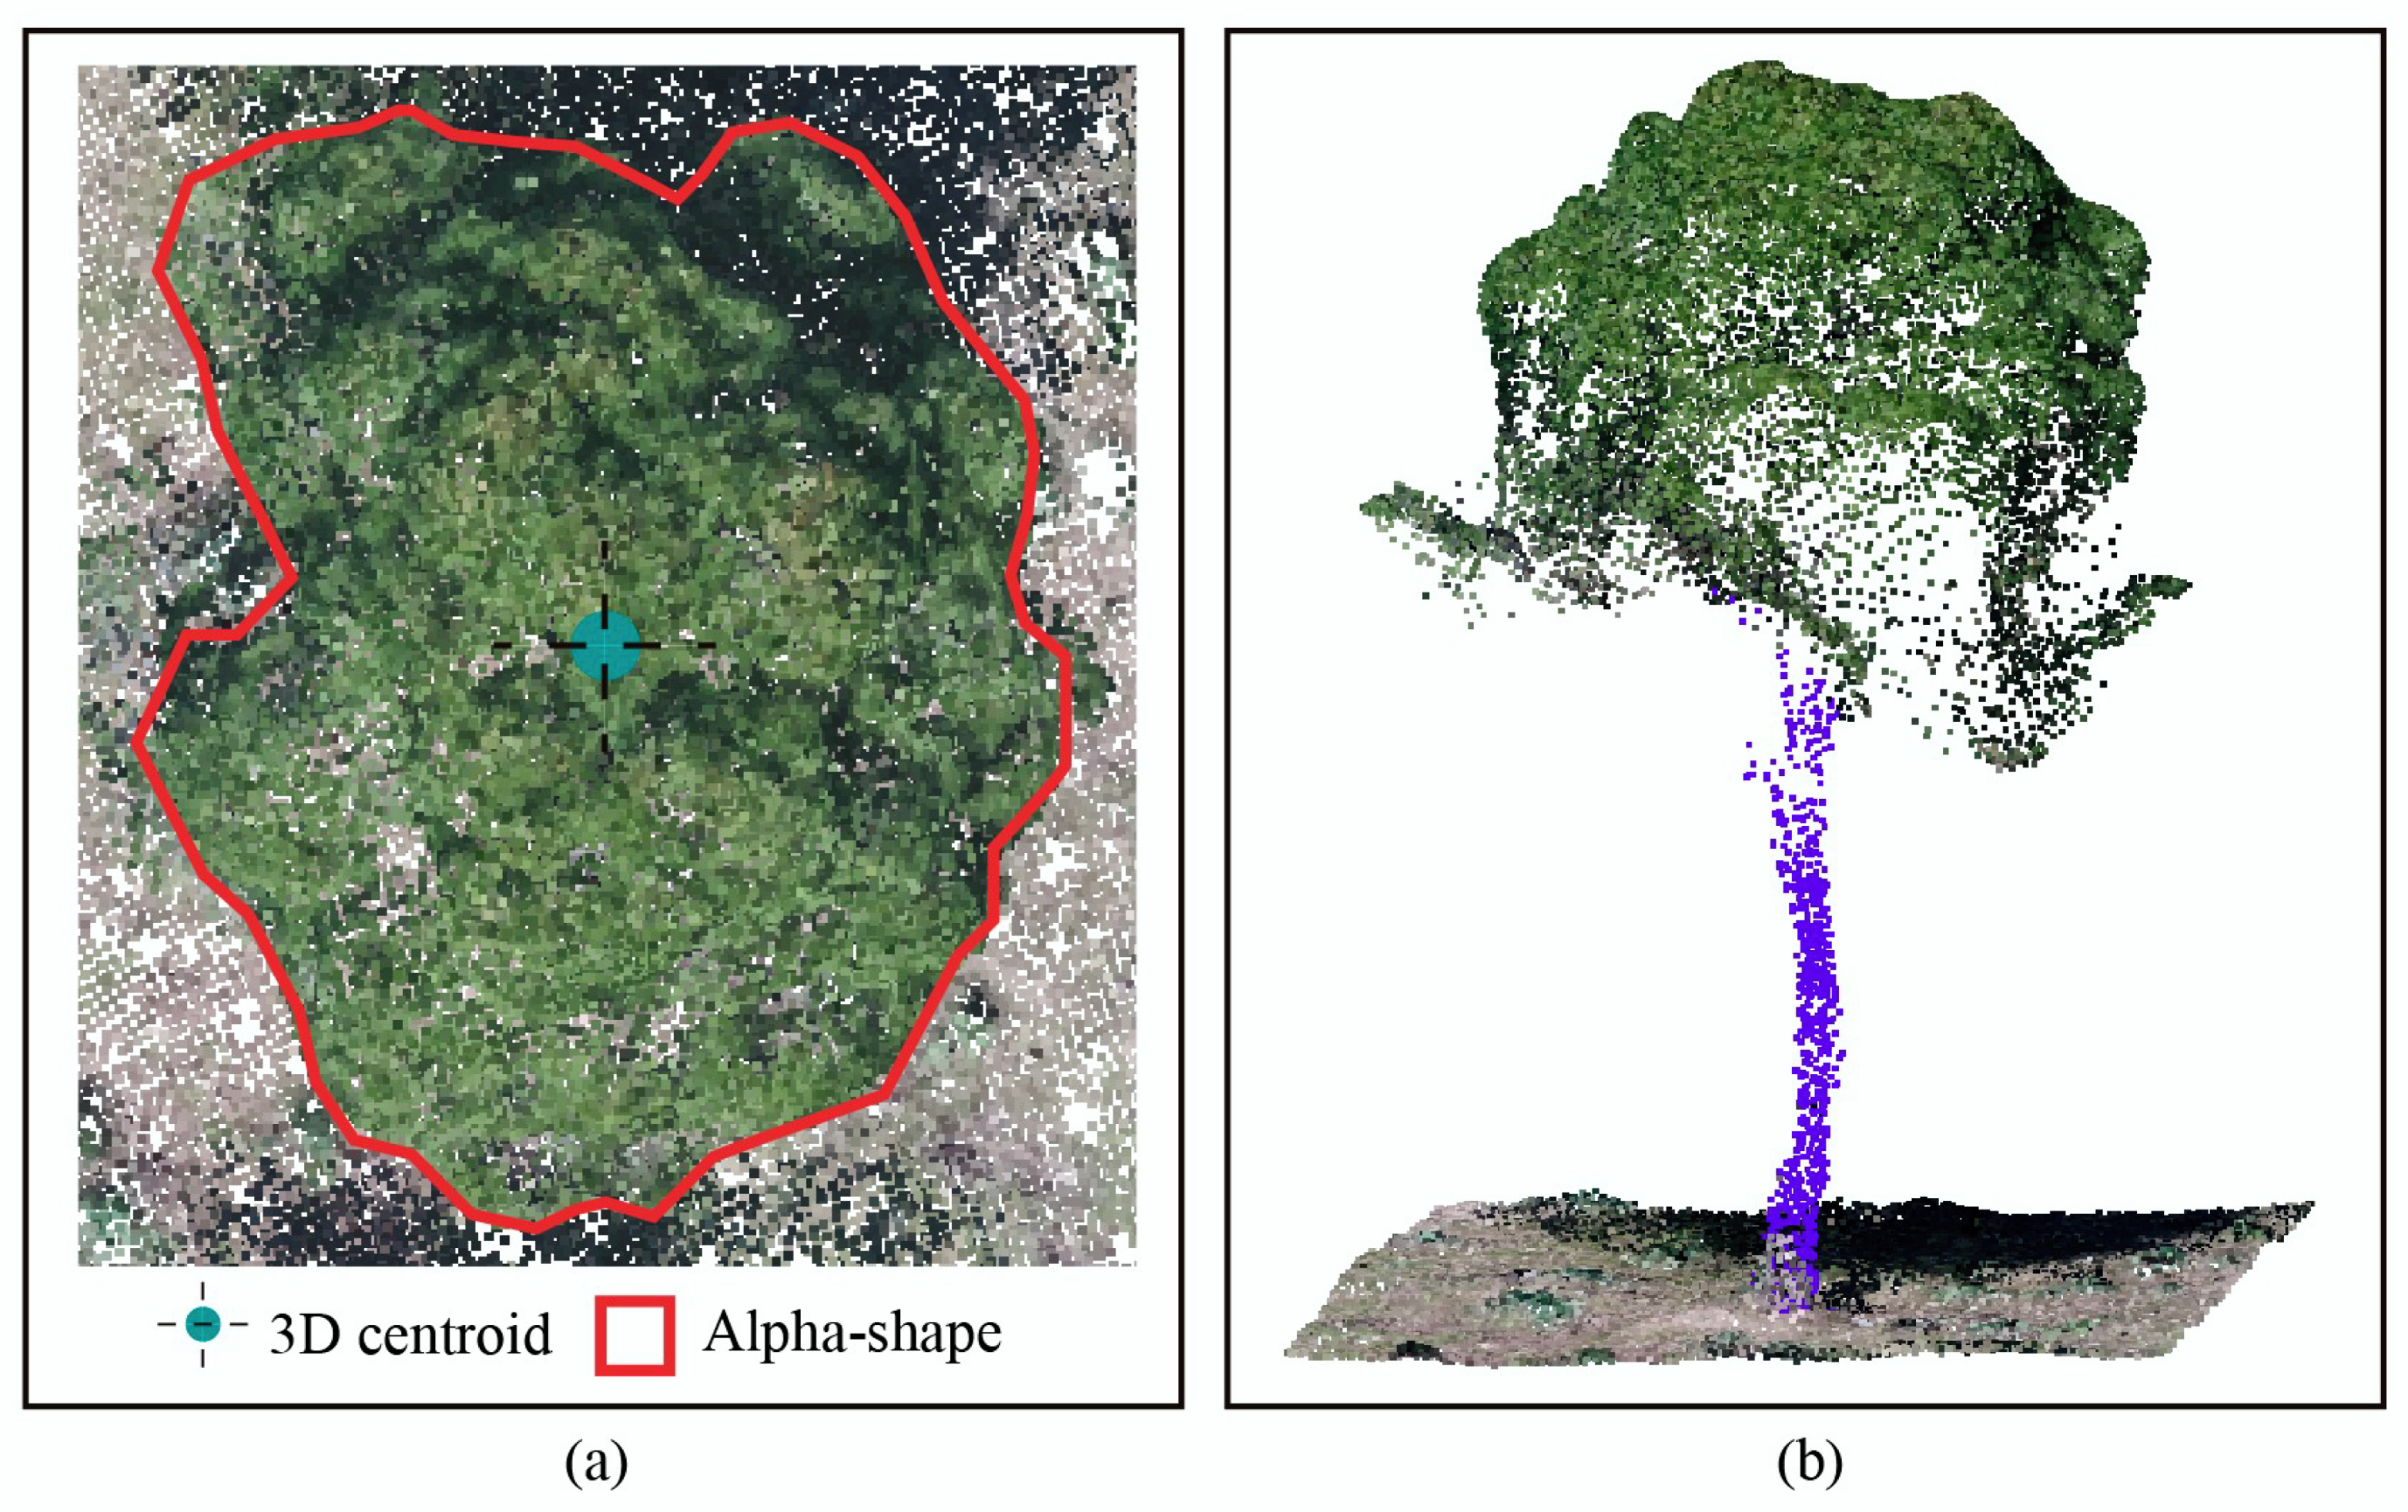
Once the tree crown had been segmented, the final step was the detection of 3D points of the tree trunk in order to acquire a more detailed knowledge of the 3D tree structure. In this regard, the location of the tree crown centre for each tree can determine directly the position of the corresponding trunk for the X and Y axes. For this purpose, instead of calculating the average of coordinates for the points in the tree crown, we propose a novel method based on the creation of 3D alpha-shapes [39]. These geometric structures create a non-convex bounding volume, which envelops a set of 3D points. The vertices of the shape are determined by an alpha radius, which is set as 20 cm in order to produce the tightest fitting alpha shape, which encloses all points of the tree crown. Then, the centroid for each one is calculated and it is used as the seed point in order to search the 3D points points of the tree trunk. To this end, a clustering method was developed in order to detect 3D points, which share the following features: (1) a tolerance of 30 centimetres for the X and Y axes of centroid, (2) the location of points has to be above the 3D cutting planes (P1 and P2) and (3) points have not been considered to be part of the tree crown. Figure 7 shows the example of the application of this method on a single tree in the study area. Thus, the trunk and main branches can be correctly identified in the tree.
Finally, an optimization method to improve the results of previous segmentation was developed. The KNN method was applied in order to correct those points which had been labeled wrong class (tree crown or trunk), if most of their neighbours did not share the same class. The search radius was set to 50 cm by considering the GSD of the point cloud and the impact on performance. Hence, the 3D tree structure for each tree could be divided into the trunk and crown.
3.6. Structural Feature Extraction
The accurate measurement of canopy architecture and tree crown parameters is critical for the assessment of photosynthesis and the energy transfer. In this study, reflection mapping on the 3D tree structure was used to find out meaningful relationships between the structural features of different tree species and the spectral reflectance, which were observed in the tree canopy.
According to the tree parameters, which were considered in our study, the tree height, the trunk diameter (DBH) and the crown volume were measured for each tree. First, the tree height is a relevant feature which plays a key role in competition for light in the forest canopy. This value was measured by calculating the distance for the Z axis between the lowest point of the trunk and the highest point of the tree crown. Secondly, the trunk diameter was determined by the maximum distance between two points of the trunk at the same height. To this end, a bounding cylinder enveloping the points of the tree trunk, was created and the resulting diameter was considered the trunk diameter. Although the trunk of some trees was partially occluded by the tree crown, the shape of cylinder could be generated by using the visible points, so the lack of tree trunk points could be overcome without a significant negative impact on the calculation of the DBH. Finally, the crown volume is another relevant tree parameter which influences on the light absorption and tree development. In this study, the space of the tree crown was decomposed by a 3D octree [40] with a spatial resolution of 25 cm. This data structure is based on a tree topology in which every internal node has exactly eight children. Hence, the tree crown was spatially divided by an octree in which a inclusion test was developed in order to check for each leaf node if it includes one 3D point at least. As a result, the crown volume was calculated by the sum of each voxel volume, which was occupied by some parts of the tree crown. These tree parameters were compared with field measurements to verify the accuracy of our methodology.
3.7. Reflectance-Based Analysis
In this study, a novel methodology has been proposed to analyze the impact of the canopy reflectance on the 3D structure of individual trees. Once the tree parameters were extracted, a statistical analysis was developed to detect key relationships between the mean reflectance and structural parameters of the tree. Our research is focused on the observation of the 3D tree structure and reflected light by the tree canopy of three different tree species (pine, oak and eucalyptus). In the analysis process, the correlation between the studied tree parameters is approached. Regarding the impact of the mean canopy reflectance on the 3D tree structure, it is classified into three categories: (1) high, (2) medium and (3) low. Therefore, the impact of the canopy reflectance by considering tree species is analyzed. Table 1 shows a summary of all studied variables, which were considered for the analysis process.
3.8. Validation Process
This section describes the process of determining the geometric quality of the 3D reconstruction. The aim is to validate the 3D model in order to carry out all measurements on the tree structure. On the one hand, a validation of the model scale was carried out using the ground points for georeferencing. On the other hand, field data were acquired in order to measure the quality of the measurements taken on the point cloud such as the tree height and tree trunk.
3.8.1. GNSS Measurements
The use of measurements with the GNSS receiver to give exact coordinates of the points used for the correct geolocation of the images captured with the UAV has already been explained. Furthermore, these points allow us to analyze the geometric quality of the model in terms of preserving scale. The cross validation method was used to evaluate the quality of the scale of the model during the creation of a 3D construction from multispectral images. A set of random points was selected to perform the validation, the rest were used for georeferencing. Then, the quality of the 3D model scale was validated using the root-mean-square error (RMSE), which was calculated for the X and Y axes (Equation (5)) and the Z axis (Equation (6)).
where: X, Y and Z are the coordinates of the 3D point measured by the GNSS and X, Y or Z are the coordinates of point i of the point cloud.
3.8.2. Total Station Measurements
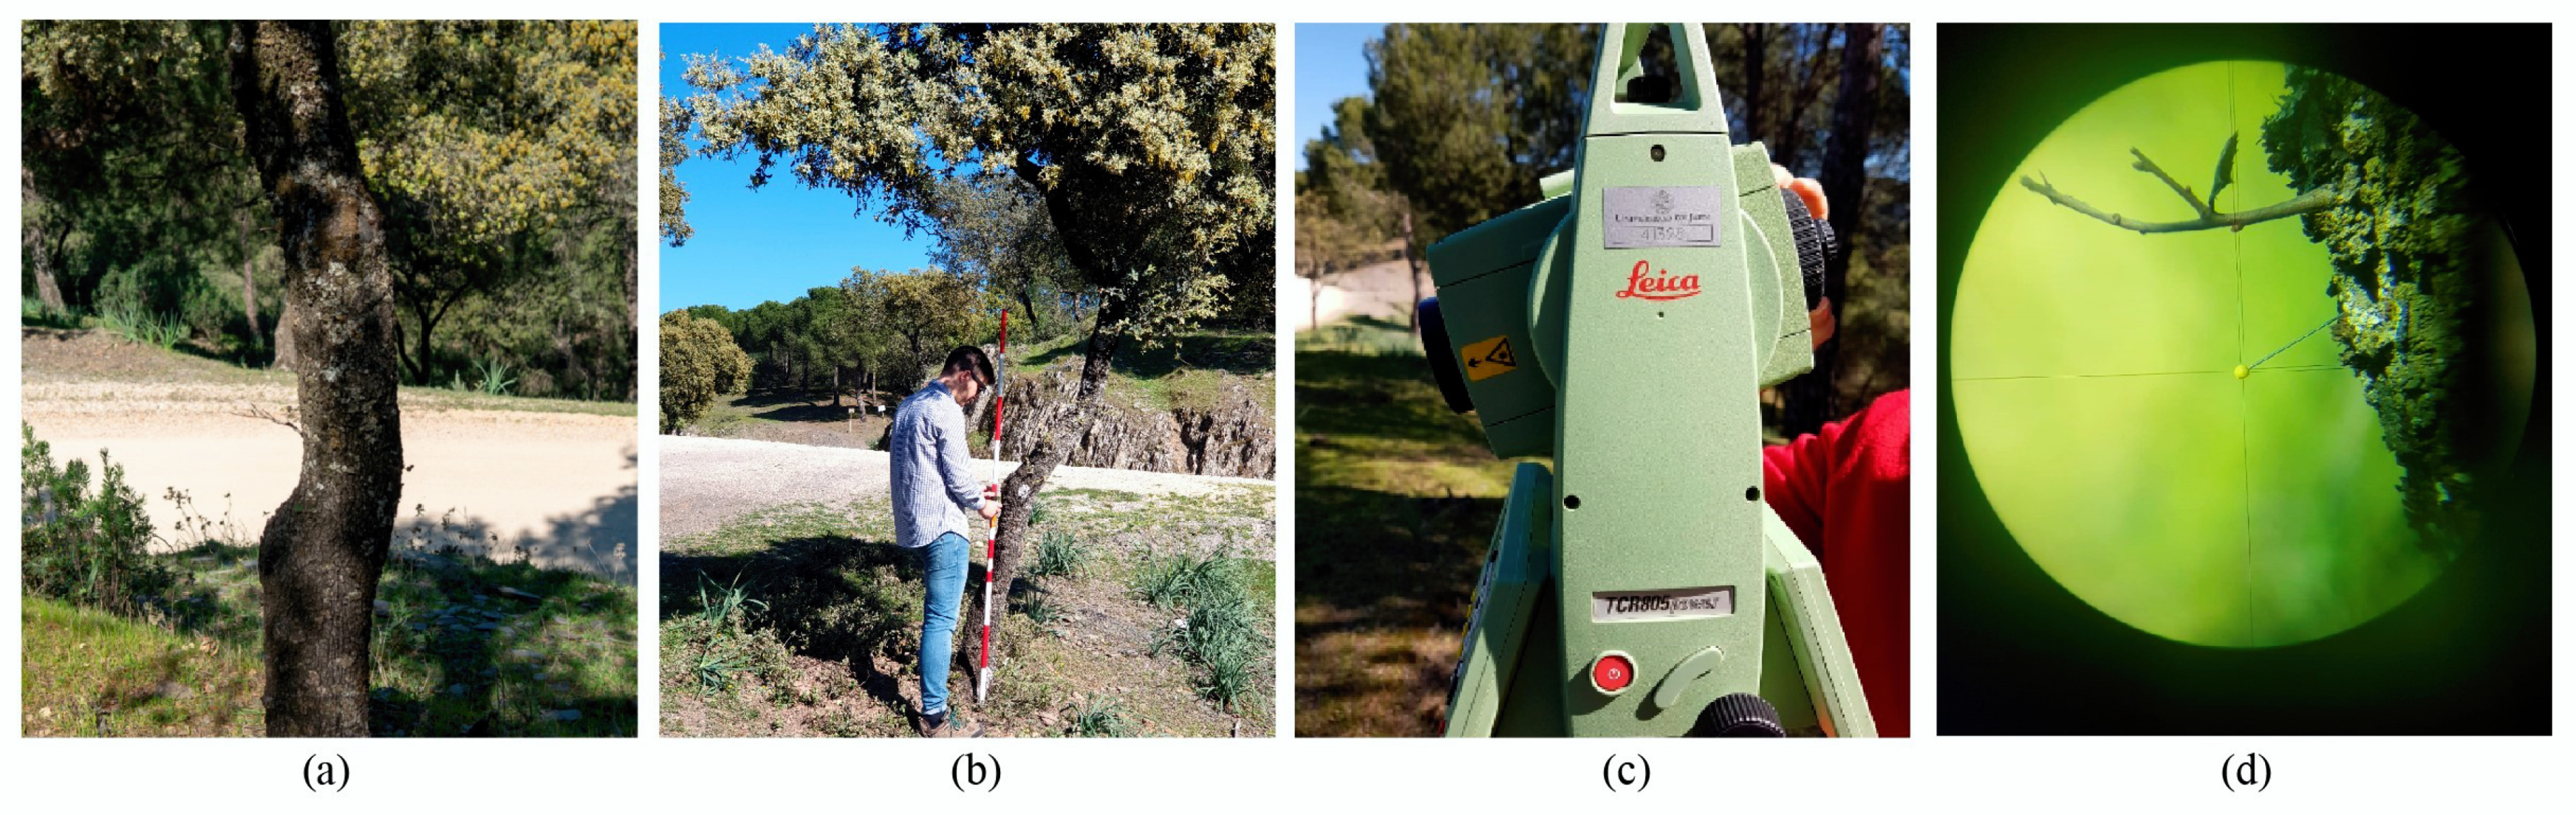
As stated above, the georeferencing of UAV images was carried out from a GNSS receiver in RTK mode. In this work, the tree structure was characterized by field data, which were collected on the tree trunk and the highest branches of the tree crown, to determine the tree height and trunk diameter. These measurements were taken using a TS, Figure 8c. According to its manufacturer’s manual specifications it has an accuracy of 3 mm ± 2 ppm using a reflectorless for the estimation of the distance and 1.5 mgon for angular measurements [41]. To achieve this accuracy in field data acquisition, some visible marks were fixed on the tree structure in order ensure a high accuracy in the geometric validation. Therefore, some pins with a rounded end (5 mm of diameter) were placed on each side of the tree trunk, Figure 8a,d. The lowest point of the tree trunk was measured using a pole, which was set on the base of tree, Figure 8b.
4. Results
The forest structure was modeled using multiple UAV-based images, which were captured by a high-resolution camera and a multispectral sensor. In this study, the SfM method was applied to generate a dense point cloud in the study area. For this process, only RGB images were used because these had a greater spatial resolution than multispectral images. Regarding the quality of the 3D reconstruction, the GSD was 1.09 cm, the number of points per cubic meter was 2039.27 and the size of the point cloud was 3.395.368. As a result, the crown, trunk and main branches of the tree structure could be correctly modeled. In addition, the noisy points around the trees were filtered, thereby, 259.194 points of the 3D model were automatically removed.
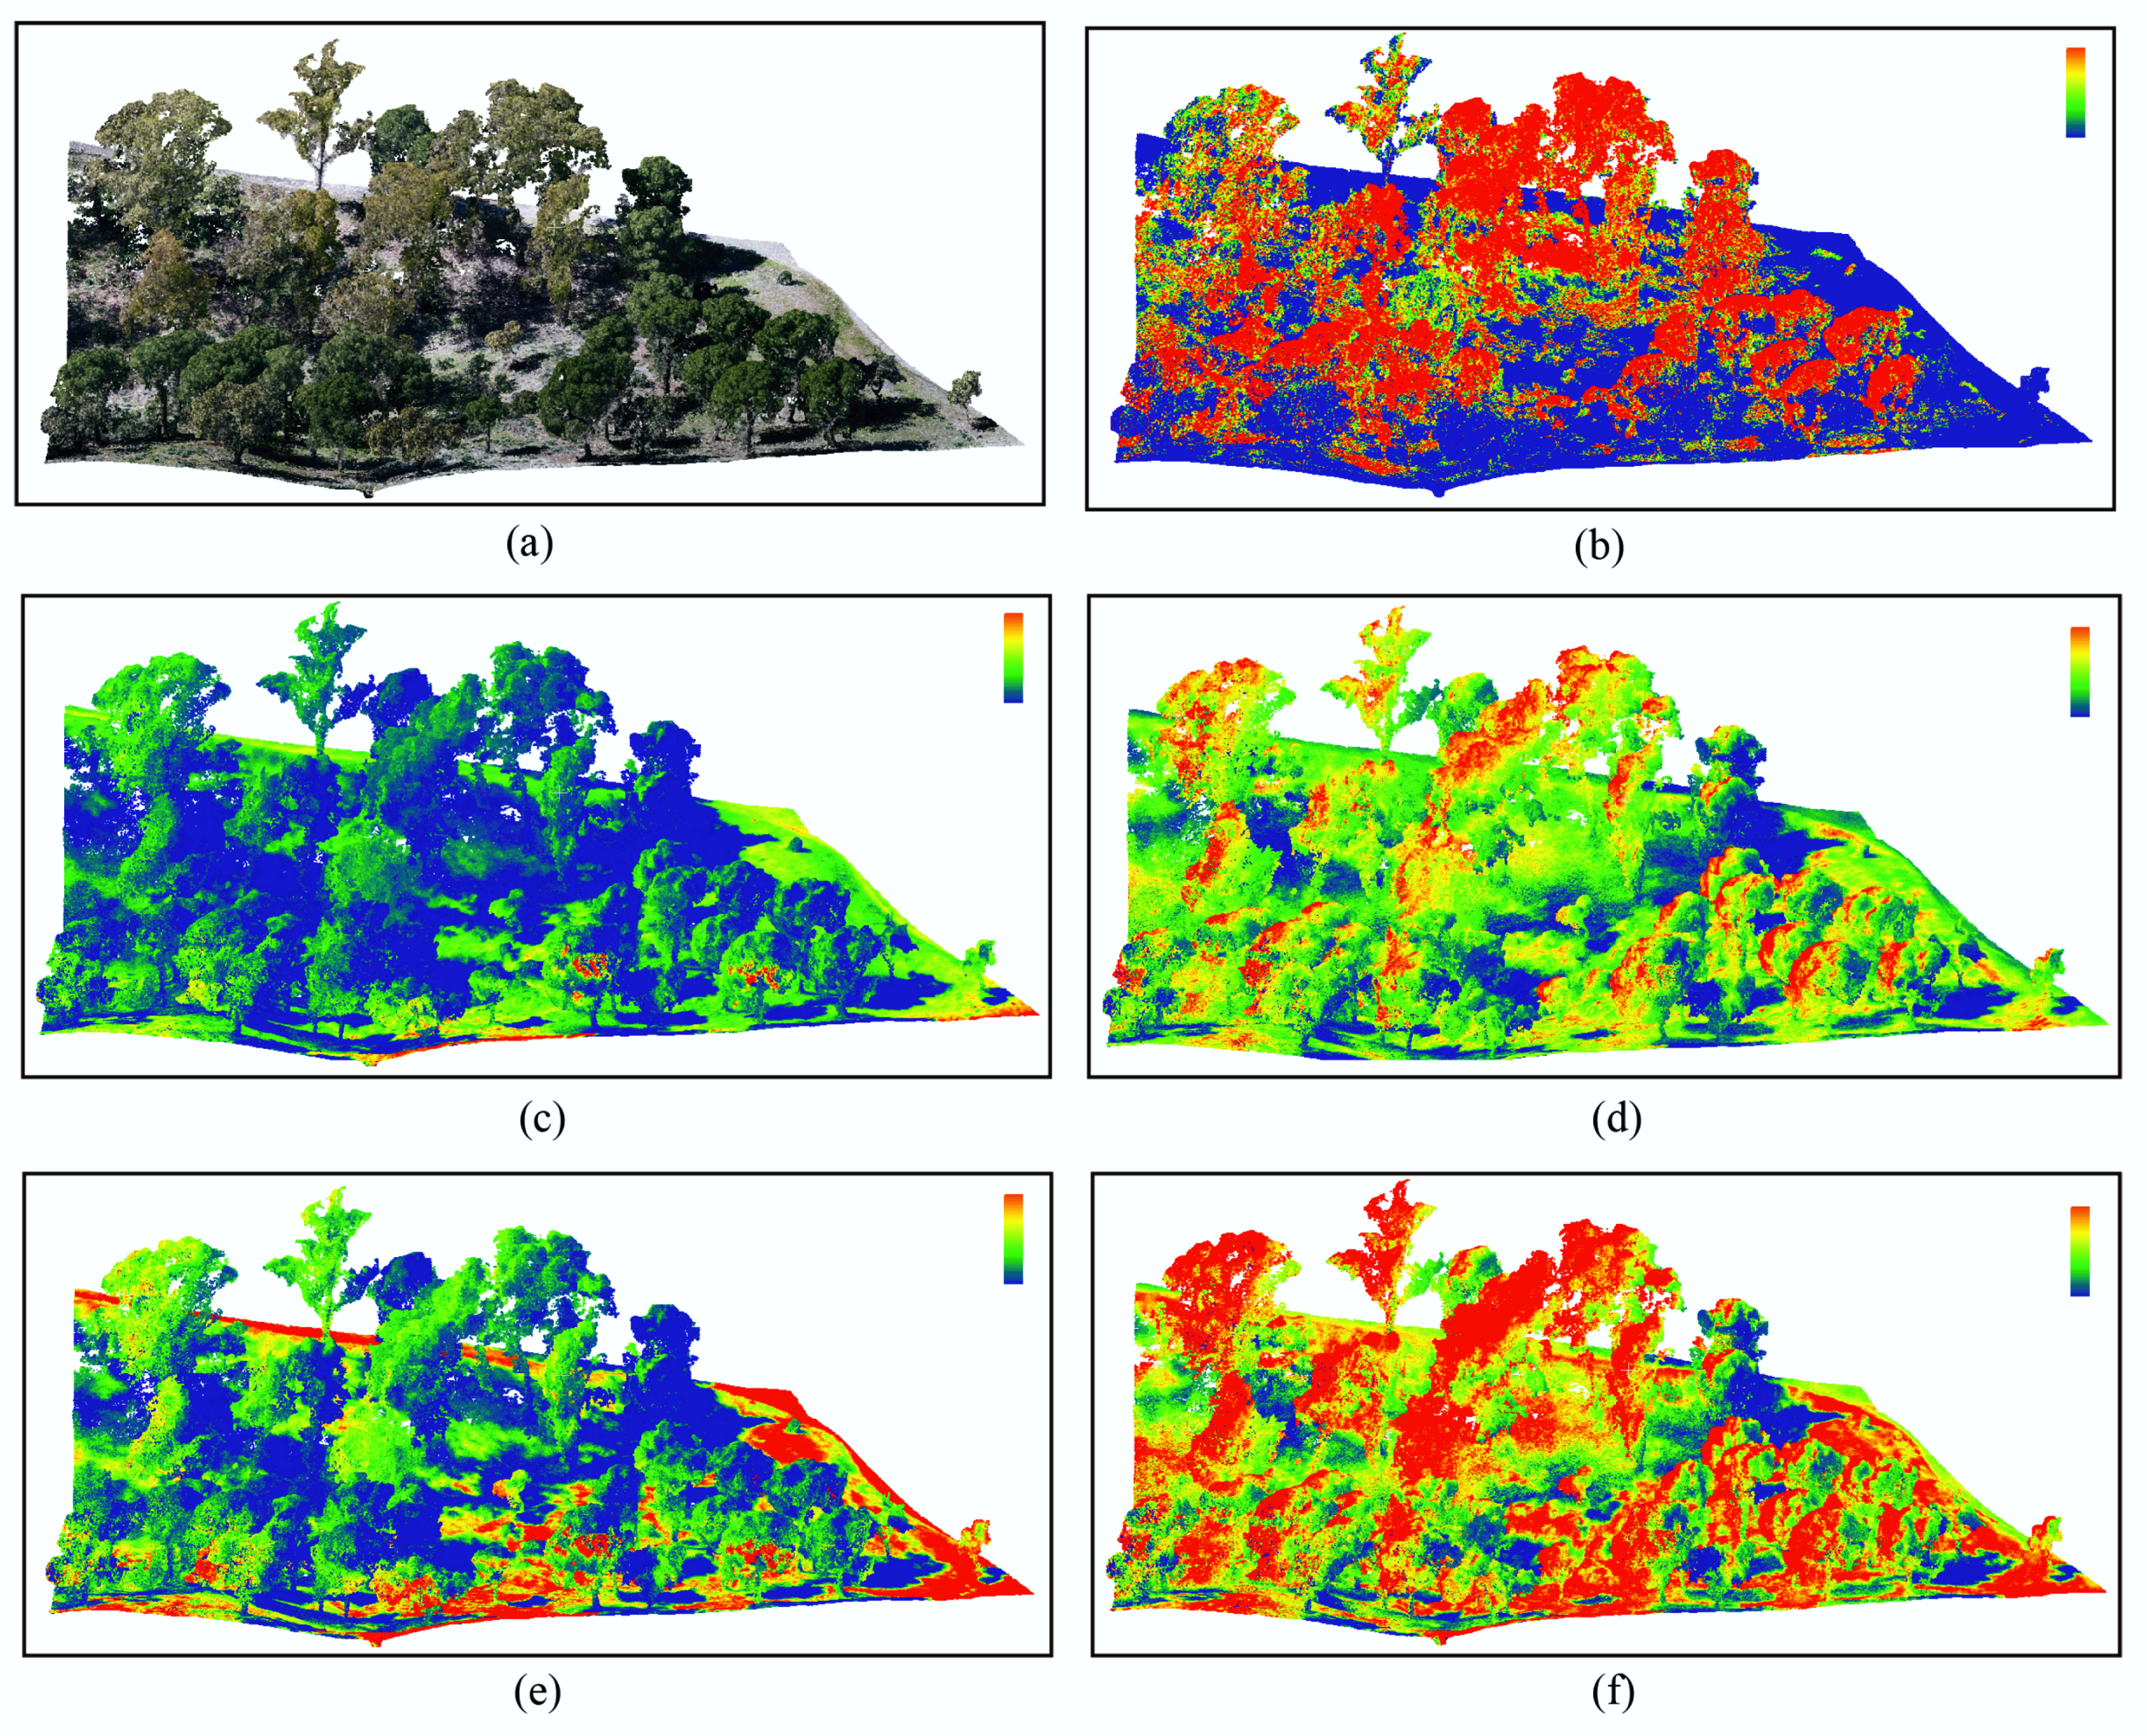
Once the comprehensive 3D structure of the forest was created and processed, it was enriched by multispectral features. Thus, useful study was carried out to analyze a wide variety of ecosystem functions and the impact of canopy reflectance on structural parameters of trees. In this work, we focused on the relationship between the tree structure and the spectral response in the tree canopy. Figure 9 shows the results of the point cloud reconstruction as well as the spectral models, which include the mean reflectance per point in the Red, Green, NIR and REG bands. Moreover, the NDVI point cloud is shown in order to review the overall status of the trees in the study area.
4.1. Forest Inventory
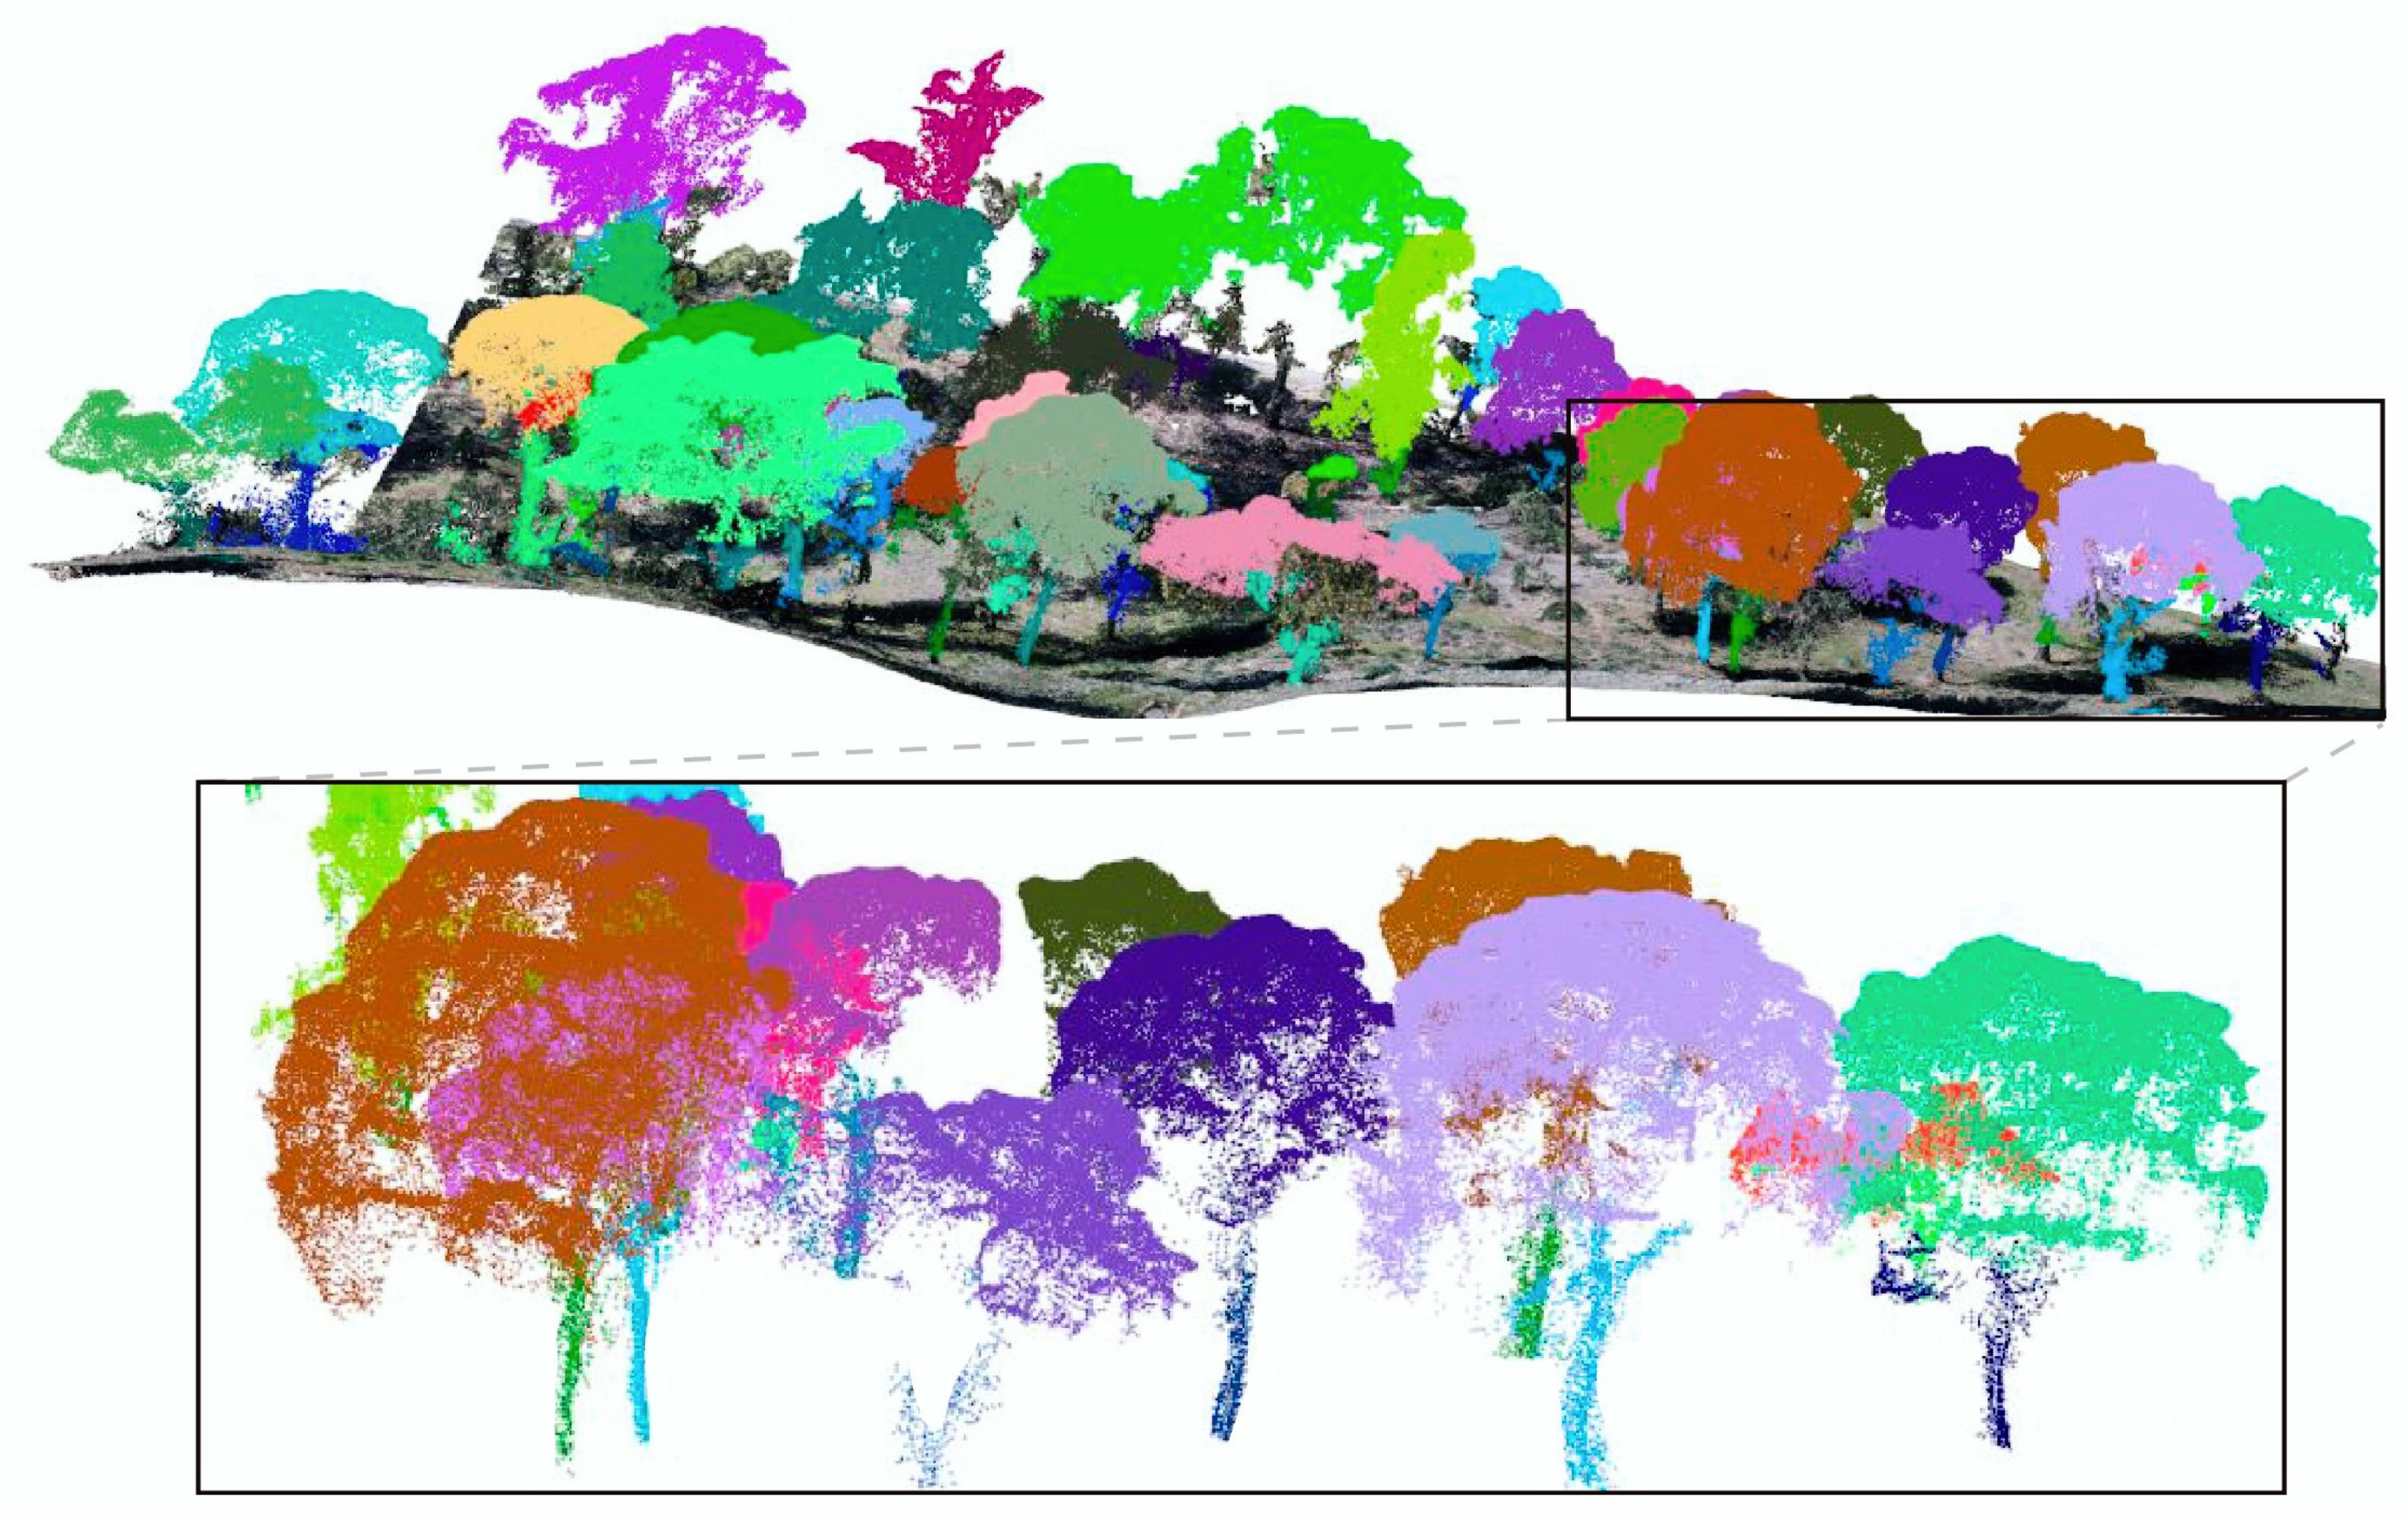
To ensure a detailed forest inventory, a spatial clustering was developed in order to detect individual trees in the study area. In addition, the tree structure was segmented by the trunk and crown. The segmented model is shown in Figure 10. As a result, 43 trees were automatically identified in the point cloud. Then, these were manually labeled according to their corresponding tree species. In summary, 10 eucalyptus trees, 7 oak trees and 26 pine trees were identified. Therefore, a detailed analysis of the spectral and structural parameters for each individual tree was performed and compared with different tree species.
Regarding the performance of methods, which were adopted for processing of data in the study area (0.6 ha), the hardware specifications are: Intel Xeon(R) W-2145 (CPU), 64 GB (RAM) and GeForce RTX 2070 (GPU). The 3D reconstruction was the most computationally expensive process, whose execution time was 3 h and 20 min. The time required to map every multispectral image on 3D model (3.136.174 points) was 0.64 s, thus the total time for all images was 14 min and 76 s. Finally, the processing time for the recognition of individual trees as well as the crown and trunk segmentation for each tree was 5.82 s.
4.2. Analysis of Tree Parameters
Structural and spectral parameters were automatically measured on the point cloud in order to characterize the 3D shape and the spectral behaviour for single-trees. Regarding the heterogeneity of the forest extension, which was observed in this research, the tree parameters were analyzed by distinguishing the tree species.
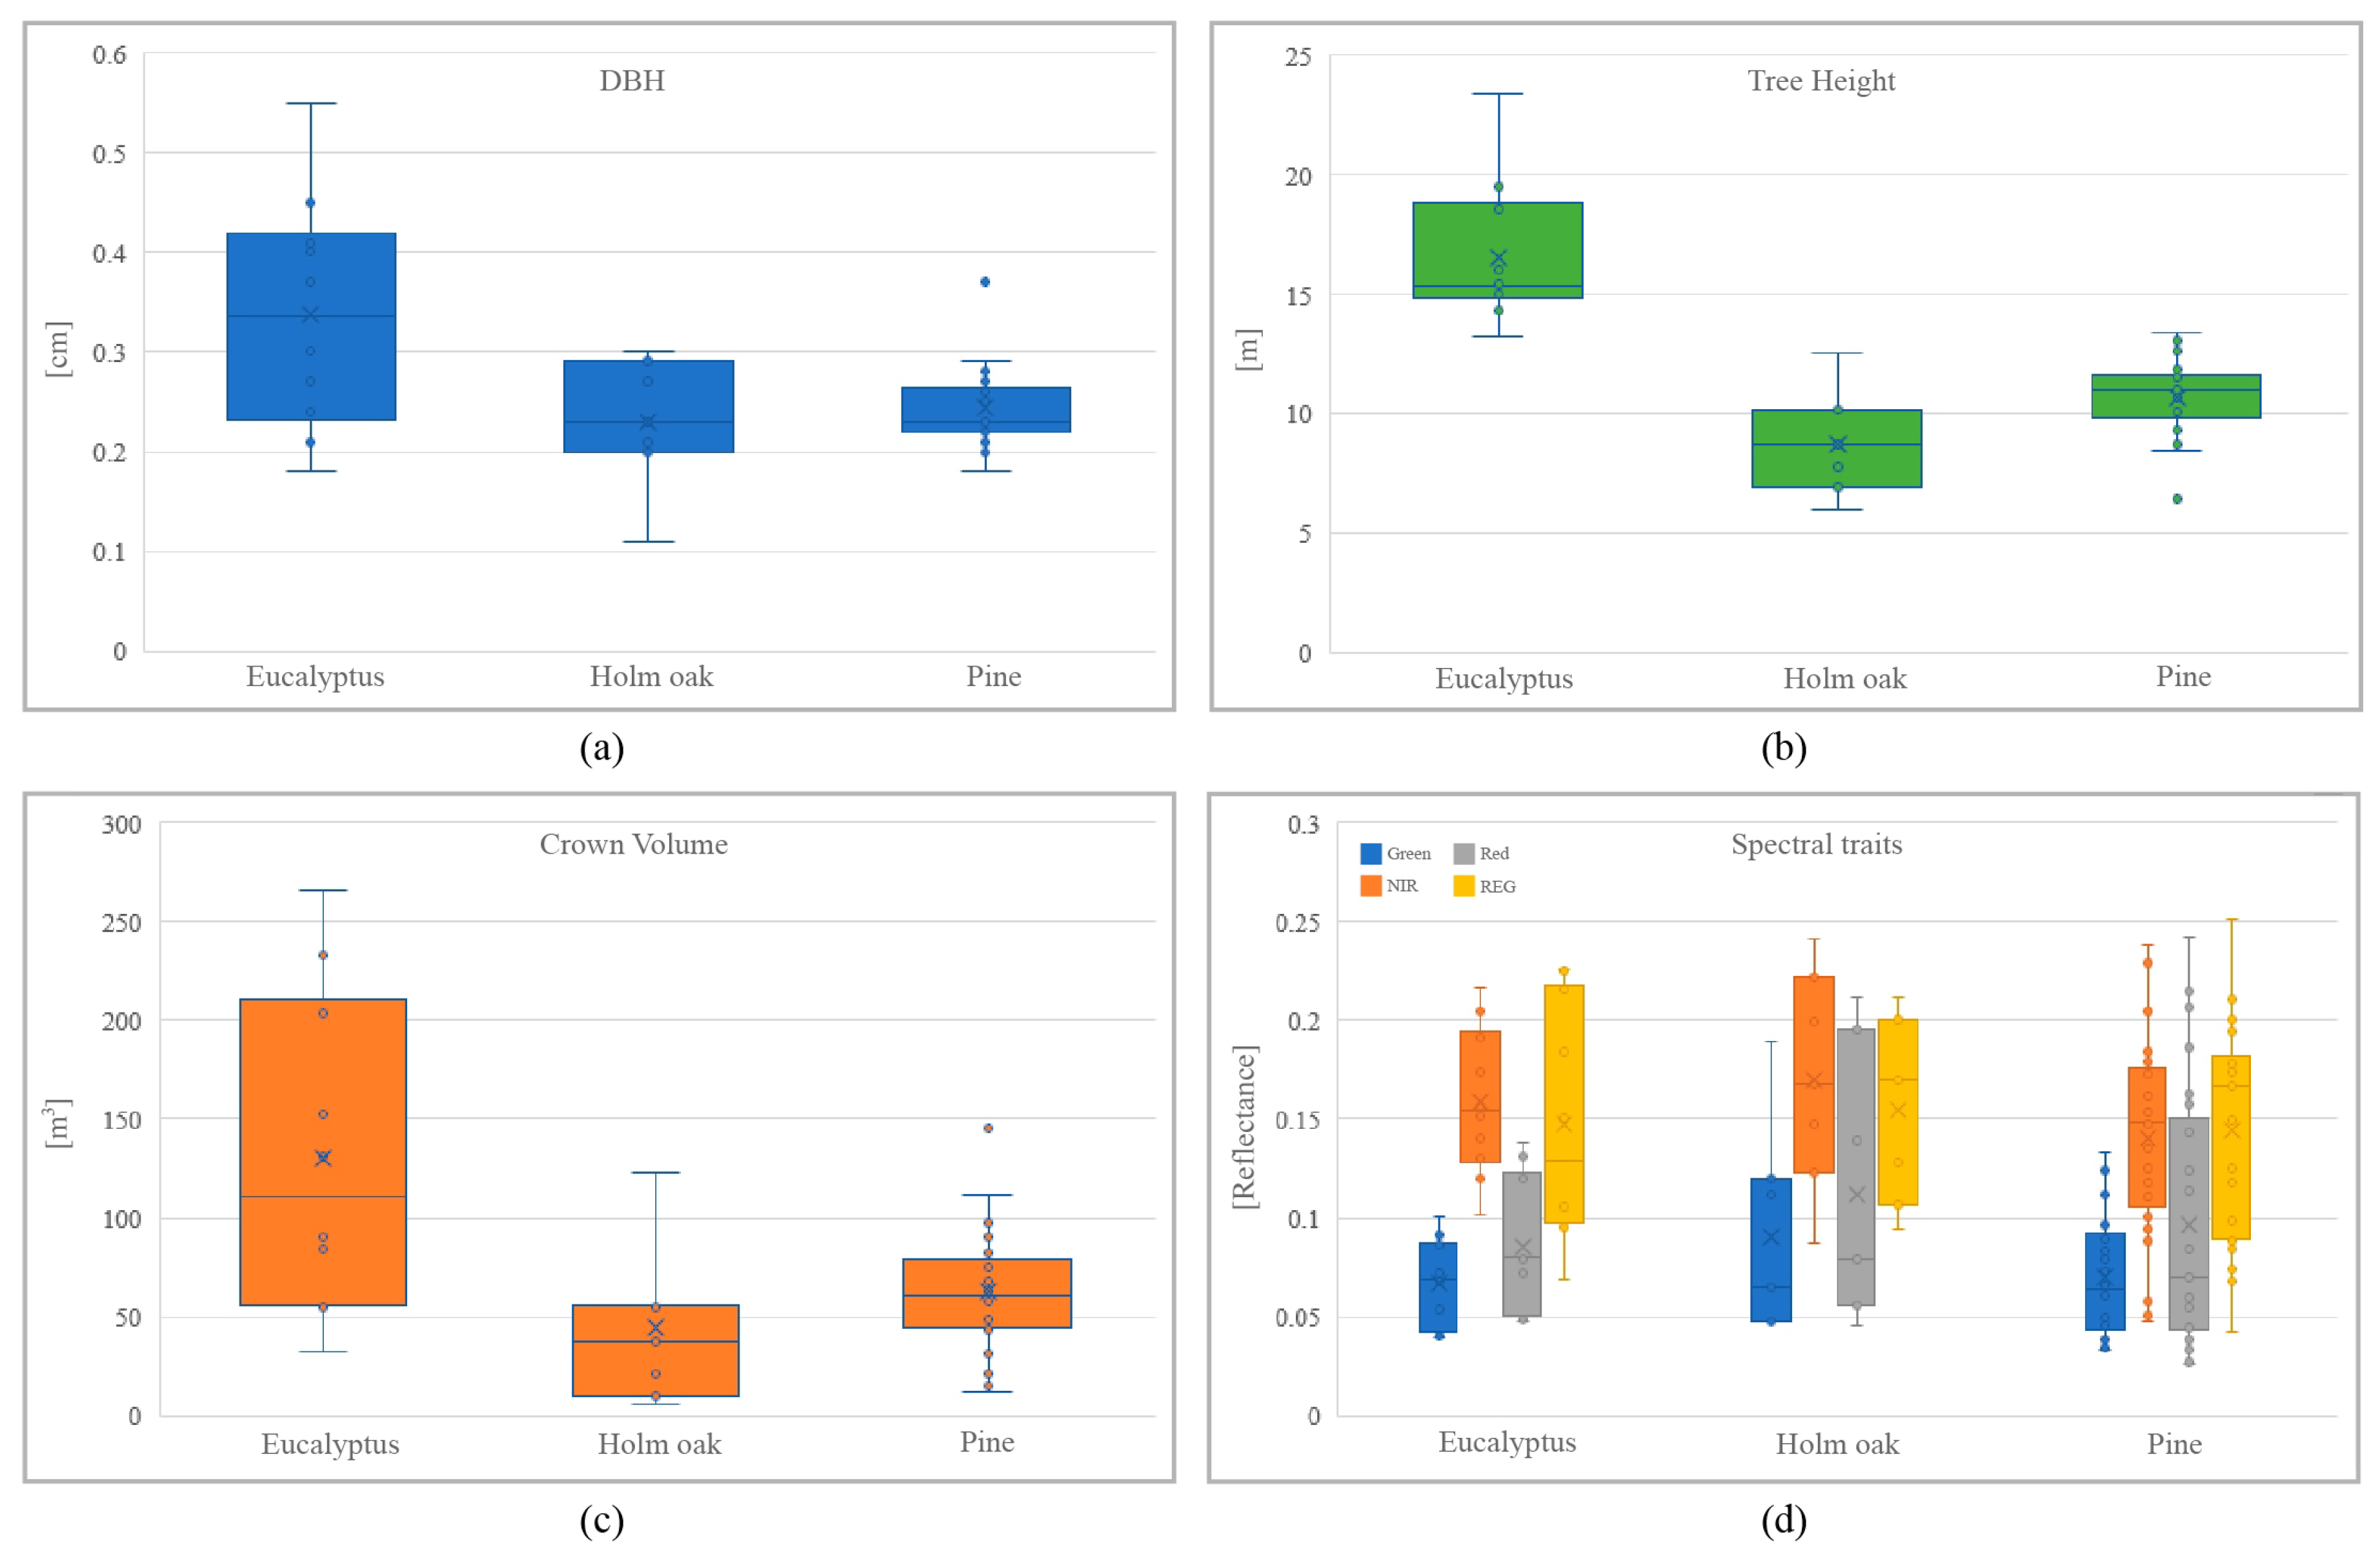
Figure 11 shows four boxplots, which depict the variability of studied features for each tree species. According to the structure-based parameters, the eucalyptus tree is characterized by having the highest crown volume, height and DBH. The mean values are 110.81 m, 16.56 m and 0.33 cm respectively. Then, the DBH of pines and oaks is very similar, as close as 0.235 cm. However, pines have higher mean values of tree height and crown volume (10.68 m, 62.57 m,) than oaks (8.70 m, 37.12 m). According to the mean reflectance, which was measured for each multispectral band, some significant variations can be observed in Figure 11d. First, the eucalyptus reflects the highest quantity of incident sunlight in the REG band and absorbs most of light in the visible range (green and red). Secondly, oaks have the mean highest reflectance in the NIR and REG bands. Moreover, this type of tree is characterized with the highest reflectance in the Red band. Finally, pines have a high absorption in the Green band and the highest reflectance values are observed in the NIR and REG bands. Generally, pines absorb most of green light and heterogeneous reflectance values are detected in the Red band. The cause of these fluctuations are discussed in Section 5.
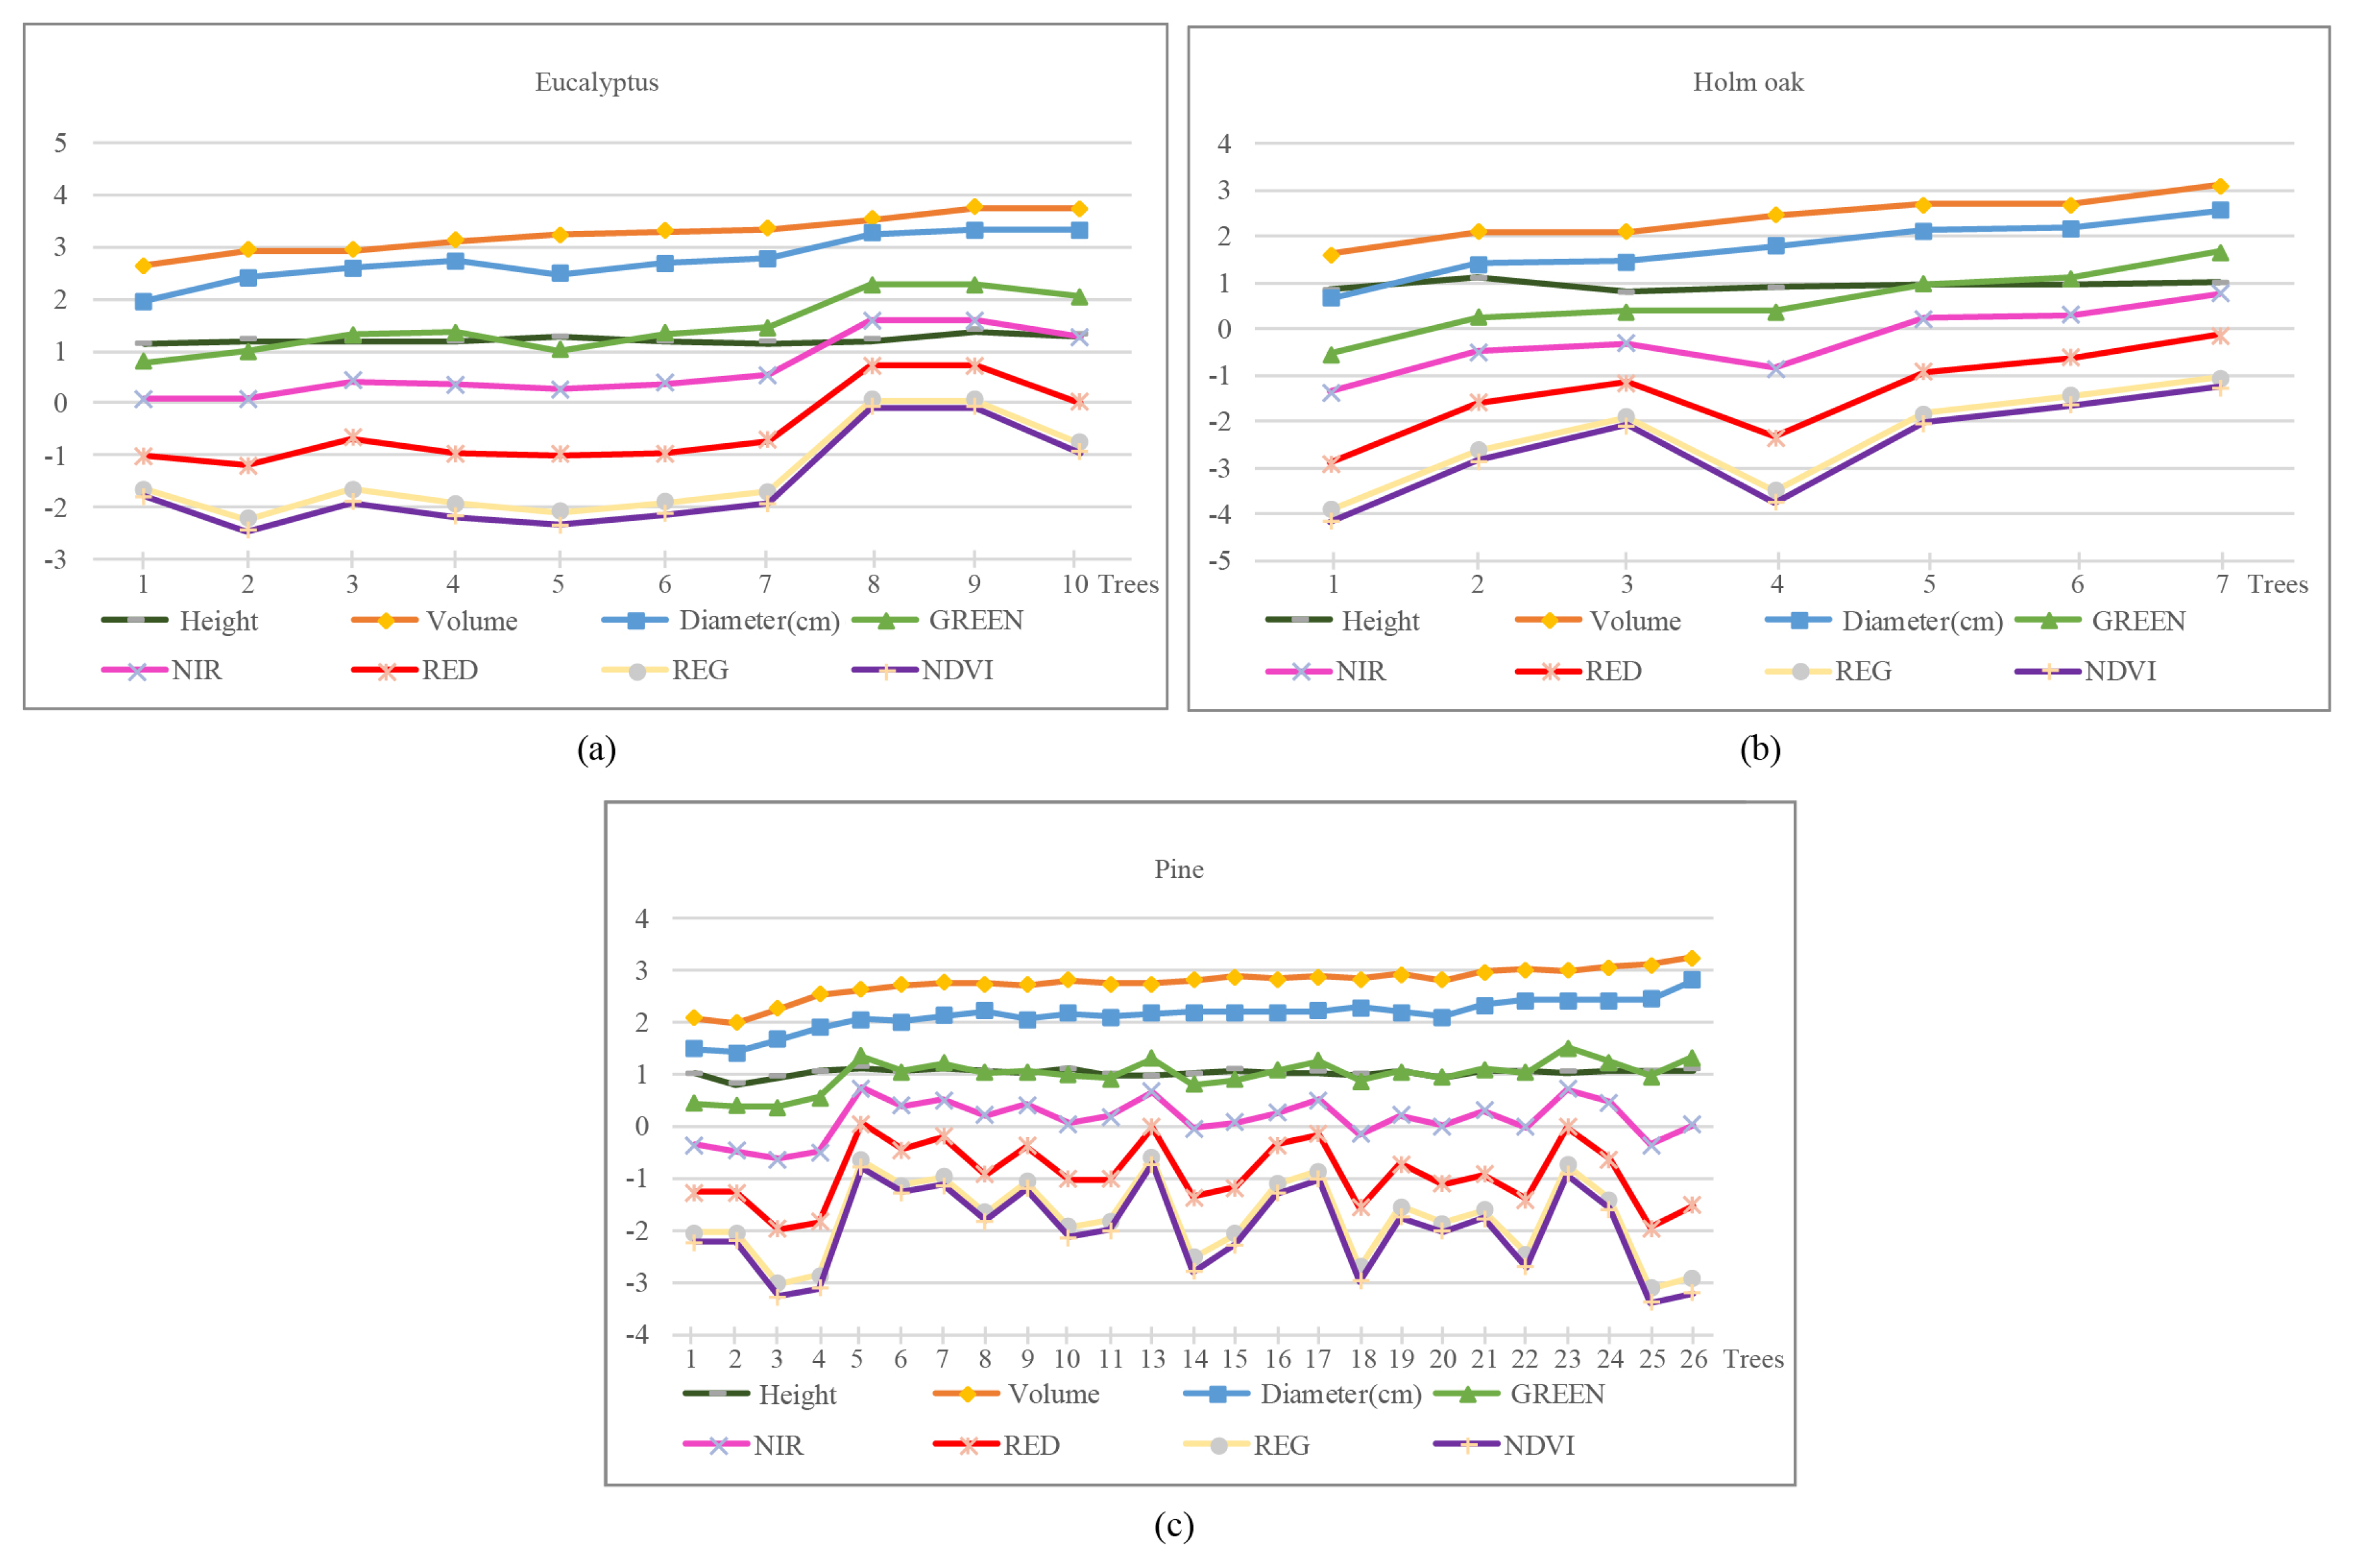
Once the tree parameters were described, the impact of the mean reflectance for each tree species was studied. Regarding Figure 12, a normalization of the studied measurements was carried out, using the Napierian logarithm, in order to study the correlations between them. Regarding the most meaningful relationships between the tree geometry and the canopy reflectance, the crown volume was the structural parameter, which was more closely related to the light reflection or absorption. Moreover, the height of trees was directly proportional to the canopy reflectance because the highest tree were not under shadows of surrounding trees. Consequently, if the tree height and crown volume increased, the mean reflectance on the tree canopy was higher too. Nevertheless, critical changes were observed on some specific trees, which did not follow this trend. Those were produced by some anomalies in the tree-based functions whose analysis is out of scope of this work. According to the NDVI values, no significant changes were detected between different tree species. They were slightly higher in the canopy of pines (0.64 as average) and they decreased in the canopy of oaks (0.59). By applying the previous analysis, it was demonstrated that reflectance is directly related to the 3D tree structure. Therefore, our results can be used to assess the biodiversity in a forest as well as detect critical changes of reflectance and structure on single trees.
4.3. Geometry Accuracy
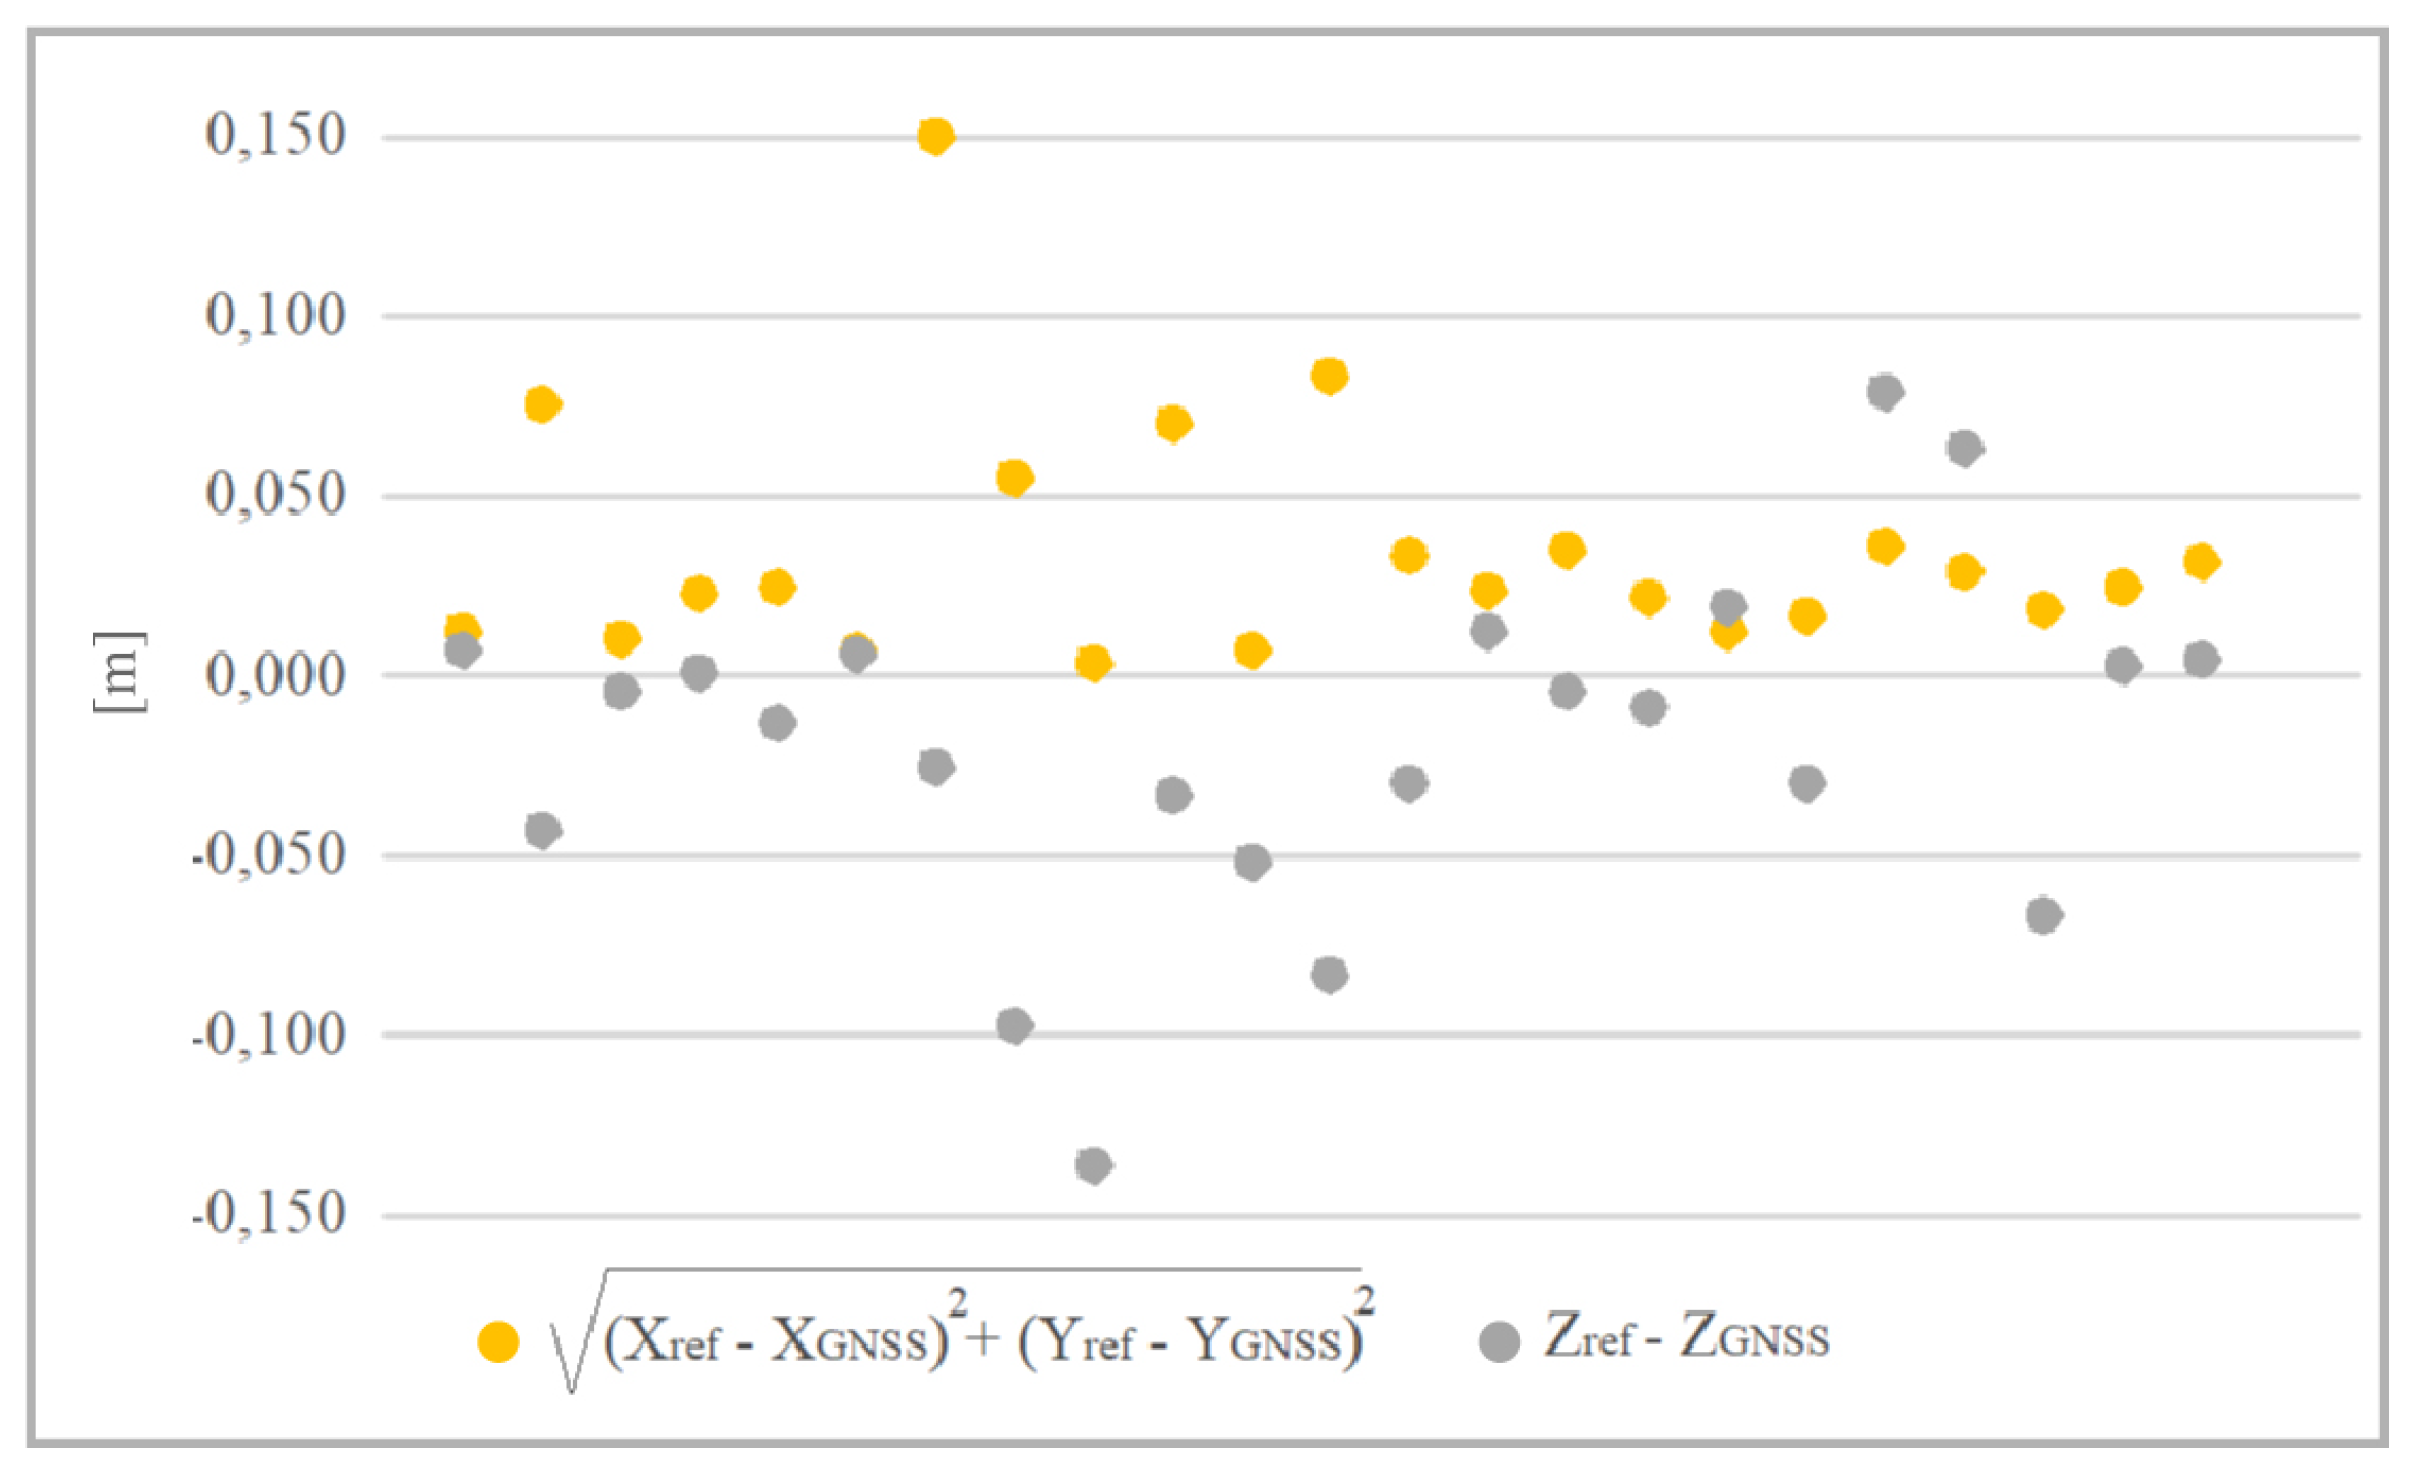
The geometric quality of the generated model was analyzed from different points of view. First, the quality of the point cloud was evaluated in terms of preserving the scale, namely the accuracy of distances measured on the model in any direction. To carry out this analysis, as mentioned in Section 3.8, the cross-validation method was applied. Figure 13 shows a correlation between the geometric quality in the horizontal and vertical direction.
In general, the variations between planimetric and altimetric coordinates for each point were very similar. In this regard, the sharpness with which the GCPs were identified in the model was a very important factor. These results demonstrate a high accuracy in the X, Y (RMSE: 0.048 m) and Z (RMSE: 0.050 m) on the point cloud. Consequently, it is feasible to make measurements on the model in both, horizontal and vertical directions, obtaining geometric magnitudes of adequate quality.
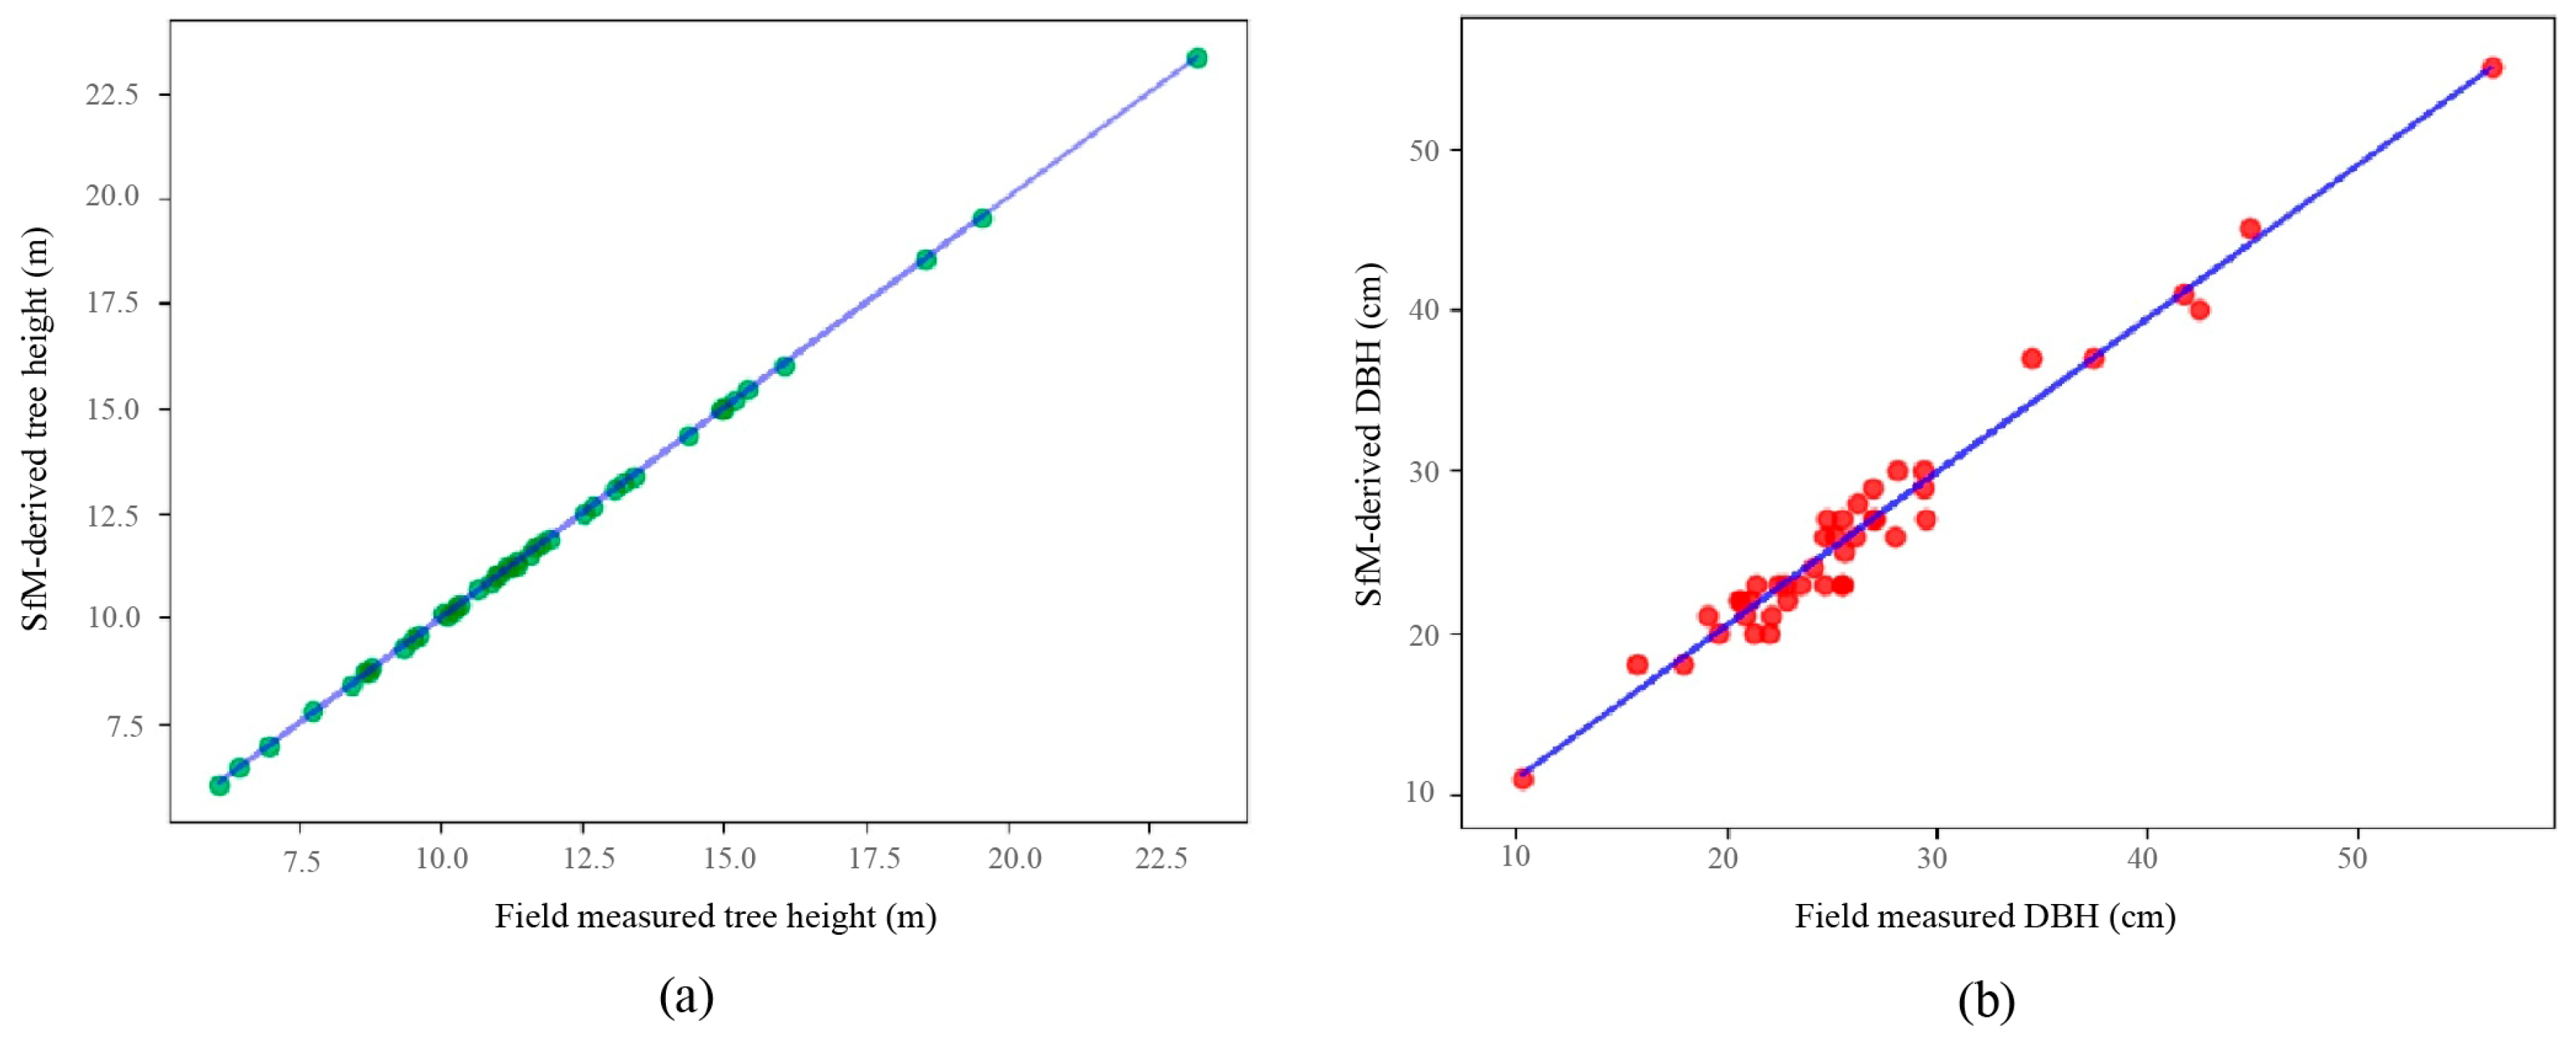
Secondly, the assessment of the geometry accuracy was based on the validation of the estimated measurements on the point cloud. For this purpose, the field data acquired by the TS were used to study the mean error for the estimation of the height and DBH. Figure 14 correlates the SfM-derived and field-measured tree heights and trunk diameters for the correctly detected trees (43 samples). A linear regression is used to fit the lines (marked in blue) and to study the dispersion for each dataset. The tree height measurements on the point cloud (green points) are on the line because the mean error is very low (4 cm) by considering the magnitude of the measure (m). According to the measurements of DBH, a higher accuracy is required because the distances are much lower. Regarding the mean DBH error by the estimation on the point cloud, it was 2.5 cm.
5. Discussion
This paper addressed the methodology of SfM-based remote sensing for individual tree-level forest inventory and the impact-based analysis of canopy reflectance on the 3D tree structure. The study area was researched by using multispectral and high-resolution RGB images. In our previous work, we developed a method for the multispectral image mapping on point clouds [33]. In this research, the proposed methods for the segmentation of trees, the crown and trunk recognition and the characterization of the 3D tree structure went one step further than the existing scheme, by considering different species and more structural parameters of trees.
To achieve a comprehensive knowledge of the tree parameters, a novel method was proposed for the detection of individual trees in forest as well as the crown and trunk segmentation on the 3D tree structure. Traditionally, clustering algorithms based on k-means were used for this purpose. Nevertheless, the pre-defined value of k is one the most important drawbacks because the number of trees in the study area is unknown. To overcome this problem, various CHM-based methods were proposed using LiDAR data or satellite images in order to detect the treetops [42,43]. In this study, we used the original point cloud rather than rasterized images. It is generally acknowledged that the point-based methods outperform CHM-based approaches [44]. Moreover, we proposed a method for the recognition of the tree on photogrammetric point clouds. Regarding the results, Figure 10 shows that every tree was automatically detected in the point cloud and the tree structure was divided into the crown and trunk. Therefore, tree parameters were extracted such as the tree height, the crown volume and the trunk diameter (DBH). By considering the tree crown and trunk as single clusters for each tree, we were able to measure the mentioned parameters and characterize the 3D tree structure in large forest stands.
According to the spectral features, the reflected light in the Green and Red bands is often influenced by the leaf chlorophyll content. In fact, the mean reflectance in these bands was lower than in others due to the fact that visible light was highly absorbed by leaves. In the NIR and REG bands, the forest foliage had a higher reflectance owing to the fact that these wavelengths were slightly influenced by chlorophyll pigments. Regarding the spectral response for each tree species, Figure 12 summarizes the variability of the spectral values measured on the tree canopy in every multispectral band. The eucalyptus had the highest absorption in the Red and Green bands (the visible range), so the mean reflectance was close to 15%. The pine had the highest mean reflectance in these bands as well as in the NIR and REG bands. The oak trees presented a higher reflectance in visible bands than the eucalyptus, but a lower reflected light in the NIR and REG bands than the pine. Finally, the highest values of NDVI were detected in the upper canopy of eucalyptus due to the high contrast between the NIR and Red bands.
Regarding the analysis of individual trees, the pine and oak had a high fluctuation in the NDVI, Red and REG bands. On the one hand, one oak was characterized by a more dispersed branching structure so the mean reflectance was significantly low. On the other hand, the variation of reflectance in these bands was determined by the shadow effects, which had an important impact in the Green and Red bands. The results of the analysis by fusing structural and spectral features for each tree of different species showed some meaningful conclusions. The eucalyptus and oak species generally presented higher values of infrared reflectance on trees which had a higher crown volume and height. Specifically, the eucalyptus showed a relevant increase of reflectance when the crown volume was higher than 130 m. Regarding the variation of the reflectance of Holm oak, these trees showed a homogeneous increase of the spectral reflectance as the tree size. Nevertheless, only one of them did not follow this trend in the Red and REG bands, as mentioned before. Finally, the spectral responses of the observed pines are the most irregular. The lowest values of reflected light in the infrared bands were not directly related to a lower crown volume or tree height. Multiple pine trees presented a significant decrease of reflected light in the NDVI, Red and REG bands despite their crown volumes were greater than the rest of trees. These critical changes could have been produced by the internal shadow between branches in the tree canopy. A further research will be developed to clarify the main causes of these fluctuations on pines.
Finally, regarding the quality of the geometry of the model, it is important to highlight that the accuracy of the GNSS and TS measurements were higher than the measurements estimated on the point cloud; therefore the procedure applied was feasible to validate the geometric quality of the point cloud. Results showed a high accuracy for the estimation of the tree height and DBH. In summary, the proposed framework can be used for assessing the biodiversity and green capacity of the forest, which is high demanded research in remote sensing.
6. Conclusions
This study was focused on mapping and analyzing the spectral reflectance on the 3D structure of individual trees. For the purposes of our research, a Mediterranean forest, where different tree species coexist, was researched using UAV-based sensors (a digital RGB camera and a multispectral sensor). By applying the SfM method, a dense point cloud was generated with a high spatial resolution (GSD: 1.09 cm). Then, the point cloud was characterized by the spectral reflectance from many multispectral observations. One of the main contributions of this work is the semantic segmentation of the point cloud. A spatial clustering was carried out in order to identify every single tree. Then, a fully automatic method was proposed for the recognition of the tree trunk. As a result, 43 trees were correctly identified, and thus the spectral and structural measurements were obtained for each individual tree.
In this research, every single-tree architecture was analyzed by considering the incident sunlight on the tree canopy and its influence on structural parameters such as the tree height, trunk diameter and the crown volume. Regarding the shape and spectral response of each tree, meaningful relationships were determined between the 3D structure and the mean reflectance in the canopy. In general, trees with a higher crown volume and height generally had a higher reflectance in the near infrared range and a strong absorption in the visible range. Nevertheless, some critical changes were observed between the studied tree species. The shadow effect played a key role on the oak trees, which had a lower height. We have concluded that by applying the proposed methodology, researchers can inspect single-trees using the 3D canvas of our tool and observe the spectral reflectance in the tree canopy. The main novelties of this research were the fusion and analysis of spectral and structural features of individual trees as well as the development of methodological advancements of describing competition for light and its impact on the 3D tree structure.
Several open problems can be subject of further research. Regarding the obtained features about the morphology and spectral response of each tree, we will focus on using neural networks for the recognition of real materials in natural environments. In addition, we would like to accelerate the process for the multispectral image mapping on the point cloud using a GPU-based approach. Finally, the application of this data model for a fully automatic classification of tree species is an interesting topic to approach in the future.
Author Contributions
Conceptualization, J.M.J., M.I.R. and F.R.F.; methodology, J.M.J. and F.R.F.; investigation, J.M.J., M.I.R. and C.E.; validation, M.I.R. and C.E.; supervision, F.R.F., and C.E.; writing—original draft preparation, J.M.J. and F.R.F.; writing—review and editing, J.M.J. and M.I.R.; visualization, J.M.J. and F.R.F. All authors have read and agreed to the published version of the manuscript.
Funding
This research was partially funded with support from the Ministerio de Economía y Competitividad and the European Union (via ERDF funds) through the research project TIN2017-84968-R.
Conflicts of Interest
The authors declare no conflict of interest.
References
- Trochta, J.; Krůček, M.; Vrška, T.; Král, K. 3D Forest: An application for descriptions of three-dimensional forest structures using terrestrial LiDAR. PLoS ONE 2017, 12, e0176871. [Google Scholar] [CrossRef] [Green Version]
- Kangas, A.; Maltamo, M. Forest Inventory: Methodology and Applications; Springer Science & Business Media: Berlin/Heidelberg, Germany, 2006; Volume 10. [Google Scholar]
- Feng, Z.; Chen, Y.; Hakala, T.; Hyyppä, J. Range calibration of airborne profiling radar used in forest inventory. In Proceedings of the 2016 IEEE International Geoscience and Remote Sensing Symposium (IGARSS), Beijing, China, 10–15 July 2016; pp. 6672–6675. [Google Scholar] [CrossRef]
- Su, Y.; Guo, Q.; Xue, B.; Hu, T.; Alvarez, O.; Tao, S.; Fang, J. Spatial distribution of forest aboveground biomass in China: Estimation through combination of spaceborne lidar, optical imagery, and forest inventory data. Remote Sens. Environ. 2016, 173, 187–199. [Google Scholar] [CrossRef] [Green Version]
- Rahlf, J.; Breidenbach, J.; Solberg, S.; Næsset, E.; Astrup, R. Digital aerial photogrammetry can efficiently support large-area forest inventories in Norway. For. Int. J. For. Res. 2017, 90, 710–718. [Google Scholar] [CrossRef]
- Jurado, J.; Cárdenas, J.; Ogayar, C.; Ortega, L.; Feito, F. Accurate plant modeling based on the real light incidence. In Proceedings of the 14th International Conference on Computer Graphics Theory and Applications (GRAPP), Prague, Czech Republic, 25–27 February 2019. [Google Scholar]
- Pearse, G.D.; Dash, J.P.; Persson, H.J.; Watt, M.S. Comparison of high-density LiDAR and satellite photogrammetry for forest inventory. ISPRS J. Photogramm. Remote Sens. 2018, 142, 257–267. [Google Scholar] [CrossRef]
- Torresan, C.; Berton, A.; Carotenuto, F.; Di Gennaro, S.F.; Gioli, B.; Matese, A.; Miglietta, F.; Vagnoli, C.; Zaldei, A.; Wallace, L. Forestry applications of UAVs in Europe: A review. Int. J. Remote Sens. 2017, 38, 2427–2447. [Google Scholar] [CrossRef]
- Guimarães, N.; Pádua, L.; Marques, P.; Silva, N.; Peres, E.; Sousa, J.J. Forestry Remote Sensing from Unmanned Aerial Vehicles: A Review Focusing on the Data, Processing and Potentialities. Remote Sens. 2020, 12, 1046. [Google Scholar] [CrossRef] [Green Version]
- Tomaštík, J.; Mokroš, M.; Saloň, Š.; Chudỳ, F.; Tunák, D. Accuracy of photogrammetric UAV-based point clouds under conditions of partially-open forest canopy. Forests 2017, 8, 151. [Google Scholar] [CrossRef]
- Tian, J.; Dai, T.; Li, H.; Liao, C.; Teng, W.; Hu, Q.; Ma, W.; Xu, Y. A Novel Tree Height Extraction Approach for Individual Trees by Combining TLS and UAV Image-Based Point Cloud Integration. Forests 2019, 10, 537. [Google Scholar] [CrossRef] [Green Version]
- Ehbrecht, M.; Schall, P.; Ammer, C.; Fischer, M.; Seidel, D. Effects of structural heterogeneity on the diurnal temperature range in temperate forest ecosystems. For. Ecol. Manag. 2019, 432, 860–867. [Google Scholar] [CrossRef]
- Seidel, D.; Ehbrecht, M.; Annighöfer, P.; Ammer, C. From tree to stand-level structural complexity—Which properties make a forest stand complex? Agric. For. Meteorol. 2019, 278, 107699. [Google Scholar] [CrossRef]
- Chehata, N.; David, N.; Bretar, F. LIDAR data classification using hierarchical K-means clustering. In Proceedings of the ISPRS Congress, Beijing, China, 3–11 July 2008; Volume 37, pp. 325–330. [Google Scholar]
- Gupta, S.; Weinacker, H.; Koch, B. Comparative analysis of clustering-based approaches for 3-D single tree detection using airborne fullwave lidar data. Remote Sens. 2010, 2, 968–989. [Google Scholar] [CrossRef] [Green Version]
- Yin, D.; Wang, L. Individual mangrove tree measurement using UAV-based LiDAR data: Possibilities and challenges. Remote Sens. Environ. 2019, 223, 34–49. [Google Scholar] [CrossRef]
- Chen, W.; Hu, X.; Chen, W.; Hong, Y.; Yang, M. Airborne LiDAR remote sensing for individual tree forest inventory using trunk detection-aided mean shift clustering techniques. Remote Sens. 2018, 10, 1078. [Google Scholar] [CrossRef] [Green Version]
- Berni, J.A.J.; Zarco-Tejada, P.J.; Suarez, L.; Fereres, E. Thermal and Narrowband Multispectral Remote Sensing for Vegetation Monitoring From an Unmanned Aerial Vehicle. IEEE Trans. Geosci. Remote Sens. 2009, 47, 722–738. [Google Scholar] [CrossRef] [Green Version]
- Lu, M.; Chen, B.; Liao, X.; Yue, T.; Yue, H.; Ren, S.; Li, X.; Nie, Z.; Xu, B. Forest types classification based on multi-source data fusion. Remote Sens. 2017, 9, 1153. [Google Scholar] [CrossRef] [Green Version]
- Adão, T.; Hruška, J.; Pádua, L.; Bessa, J.; Peres, E.; Morais, R.; Sousa, J.J. Hyperspectral imaging: A review on UAV-based sensors, data processing and applications for agriculture and forestry. Remote Sens. 2017, 9, 1110. [Google Scholar] [CrossRef] [Green Version]
- Johansen, K.; Raharjo, T.; McCabe, M.F. Using multi-spectral UAV imagery to extract tree crop structural properties and assess pruning effects. Remote Sens. 2018, 10, 854. [Google Scholar] [CrossRef] [Green Version]
- Tu, Y.H.; Johansen, K.; Phinn, S.; Robson, A. Measuring canopy structure and condition using multi-spectral UAS imagery in a horticultural environment. Remote Sens. 2019, 11, 269. [Google Scholar] [CrossRef] [Green Version]
- Nikopensius, M.; Pisek, J.; Raabe, K. Spectral reflectance patterns and seasonal dynamics of common understory types in three mature hemi-boreal forests. Int. J. Appl. Earth Obs. Geoinf. 2015, 43, 84–91. [Google Scholar] [CrossRef]
- Seidel, D.; Hoffmann, N.; Ehbrecht, M.; Juchheim, J.; Ammer, C. How neighborhood affects tree diameter increment – New insights from terrestrial laser scanning and some methodical considerations. For. Ecol. Manag. 2015, 336, 119–128. [Google Scholar] [CrossRef]
- Gallego Galán, C.; Torralbo, P.; José Pérez-Palazón, M.; Galán, C.; José Polo, M. Trend Analysis of climatic variables and impacts in dehesa systems: A study case in Sierra Morena, Southern Spain. In Proceedings of the 21st EGU General Assembly, EGU2019, Vienna, Austria, 7–12 April 2019. [Google Scholar]
- Gertsis, A.; Fountas, D.; Arpasanu, I.; Michaloudis, M. Precision agriculture applications in a high density olive grove adapted for mechanical harvesting in Greece. Procedia Technol. 2013, 8, 152–156. [Google Scholar] [CrossRef] [Green Version]
- Cristiano, P.M.; Madanes, N.; Campanello, P.I.; Di Francescantonio, D.; Rodríguez, S.A.; Zhang, Y.J.; Carrasco, L.O.; Goldstein, G. High NDVI and potential canopy photosynthesis of South American subtropical forests despite seasonal changes in leaf area index and air temperature. Forests 2014, 5, 287–308. [Google Scholar] [CrossRef] [Green Version]
- Rusu, R.B.; Cousins, S. 3D is here: Point cloud library (pcl). In Proceedings of the 2011 IEEE International Conference on Robotics and Automation, Shanghai, China, 9–13 May 2011; pp. 1–4. [Google Scholar]
- Bradski, G.; Kaehler, A. Learning OpenCV: Computer Vision with the OpenCV library; O’Reilly Media, Inc.: Sebastopol, CA, USA, 2008. [Google Scholar]
- Schönberger, J.L.; Frahm, J. Structure-from-Motion Revisited. In Proceedings of the 2016 IEEE Conference on Computer Vision and Pattern Recognition (CVPR), Las Vegas, NV, USA, 27–30 June 2016; pp. 4104–4113. [Google Scholar] [CrossRef]
- Iglhaut, J.; Cabo, C.; Puliti, S.; Piermattei, L.; O’Connor, J.; Rosette, J. Structure from motion photogrammetry in forestry: A review. Curr. For. Rep. 2019, 5, 155–168. [Google Scholar] [CrossRef] [Green Version]
- Carrivick, J.L.; Smith, M.W.; Quincey, D.J. Structure from Motion in the Geosciences; John Wiley & Sons: Hoboken, NJ, USA, 2016. [Google Scholar]
- Jurado, J.; Ortega, L.; Cubillas, J.; Feito, F. Multispectral mapping on 3D models and multi-temporal monitoring for individual characterization of olive trees. Remote Sens. 2020, 12, 1106. [Google Scholar] [CrossRef] [Green Version]
- Zhou, K.; Hou, Q.; Wang, R.; Guo, B. Real-time kd-tree construction on graphics hardware. ACM Trans. Graph. (TOG) 2008, 27, 1–11. [Google Scholar] [CrossRef]
- Keller, J.M.; Gray, M.R.; Givens, J.A. A fuzzy K-nearest neighbor algorithm. IEEE Trans. Syst. Man Cybern. 1985, SMC-15, 580–585. [Google Scholar] [CrossRef]
- Strîmbu, V.F.; Strîmbu, B.M. A graph-based segmentation algorithm for tree crown extraction using airborne LiDAR data. ISPRS J. Photogramm. Remote Sens. 2015, 104, 30–43. [Google Scholar] [CrossRef] [Green Version]
- Yun, T.; Jiang, K.; Hou, H.; An, F.; Chen, B.; Jiang, A.; Li, W.; Xue, L. Rubber Tree Crown Segmentation and Property Retrieval using Ground-Based Mobile LiDAR after Natural Disturbances. Remote Sens. 2019, 11, 903. [Google Scholar] [CrossRef] [Green Version]
- Kanungo, T.; Mount, D.M.; Netanyahu, N.S.; Piatko, C.D.; Silverman, R.; Wu, A.Y. An efficient k-means clustering algorithm: Analysis and implementation. IEEE Trans. Pattern Anal. Mach. Intell. 2002, 24, 881–892. [Google Scholar] [CrossRef]
- Edelsbrunner, H.; Mücke, E.P. Three-dimensional alpha shapes. ACM Trans. Graph. (TOG) 1994, 13, 43–72. [Google Scholar] [CrossRef]
- Vo, A.V.; Truong-Hong, L.; Laefer, D.F.; Bertolotto, M. Octree-based region growing for point cloud segmentation. ISPRS J. Photogramm. Remote Sens. 2015, 104, 88–100. [Google Scholar] [CrossRef]
- Leica Geosystems. Leica TPS800 Series User Manual, 2.1.0 ed.; 2005; Available online: https://bit.ly/2x8HfEZ (accessed on 9 March 2020).
- Amiri, N.; Yao, W.; Heurich, M.; Krzystek, P.; Skidmore, A. Estimation of regeneration coverage in a temperate forest by 3D segmentation using airborne laser scanning data. Int. J. Appl. Earth Obs. Geoinf. (JAG) 2016, 52, 252–262. [Google Scholar] [CrossRef]
- Ferraz, A.; Saatchi, S.; Mallet, C.; Meyer, V. Lidar detection of individual tree size in tropical forests. Remote Sens. Environ. 2016, 183, 318–333. [Google Scholar] [CrossRef]
- Gaulton, R.; Malthus, T.J. LiDAR mapping of canopy gaps in continuous cover forests: A comparison of canopy height model and point cloud based techniques. Int. J. Remote Sens. 2010, 31, 1193–1211. [Google Scholar] [CrossRef]
Figure 1.
Research area. The left image represents the south of Spain (Andalusia). The right image is the map of the observed forest in Jaén. The coordinates (m) are UTM, zone 30 referred to ETRS89.
Figure 1.
Research area. The left image represents the south of Spain (Andalusia). The right image is the map of the observed forest in Jaén. The coordinates (m) are UTM, zone 30 referred to ETRS89.

Figure 2.
The flow diagram of the proposed methodology.

Figure 3.
The flight path in the study area (coordinates (m): UTM zone 30N referred to ETRS89).

Figure 4.
The point-based filter of a cutout of the point cloud. (a) The original dense point cloud; and (b) The filtered point cloud.
Figure 4.
The point-based filter of a cutout of the point cloud. (a) The original dense point cloud; and (b) The filtered point cloud.

Figure 5.
The 3D space of the point cloud which is covered from a multispectral image.

Figure 6.
The ground removal determined by two cutting-planes (P1 and P2). (a) The representation of planes on the elevation map; and (b) The position and orientation of planes in 3D.
Figure 6.
The ground removal determined by two cutting-planes (P1 and P2). (a) The representation of planes on the elevation map; and (b) The position and orientation of planes in 3D.

Figure 7.
The segmentation of the tree trunk. (a) The top view of the alpha-shape and centroid on the tree crown; and (b) The points labeled as the tree trunk.
Figure 7.
The segmentation of the tree trunk. (a) The top view of the alpha-shape and centroid on the tree crown; and (b) The points labeled as the tree trunk.

Figure 8.
Field measurements of structural parameters of trees. (a) The target tree, (b) The manually marking of the lowest point of the tree trunk, (c) Leica TCR-805 (TS); and (d) The view of the pointing to the pin on each side of the trunk.
Figure 8.
Field measurements of structural parameters of trees. (a) The target tree, (b) The manually marking of the lowest point of the tree trunk, (c) Leica TCR-805 (TS); and (d) The view of the pointing to the pin on each side of the trunk.

Figure 9.
The 3D forest models. (a) The RGB point cloud, (b) The point cloud of Green band, (c) The point cloud of NIR band, (d) The point cloud of Red band, (e) The point cloud of REG band; and (f) The NDVI point cloud.
Figure 9.
The 3D forest models. (a) The RGB point cloud, (b) The point cloud of Green band, (c) The point cloud of NIR band, (d) The point cloud of Red band, (e) The point cloud of REG band; and (f) The NDVI point cloud.

Figure 10.
The segmentation of individual trees and the recognition of the crown and trunk for each tree.
Figure 10.
The segmentation of individual trees and the recognition of the crown and trunk for each tree.

Figure 11.
Tree parameters for each species. (a) The diameter breast height, (b) The tree height, (c) The crown volume; and (d) The spectral reflectance.
Figure 11.
Tree parameters for each species. (a) The diameter breast height, (b) The tree height, (c) The crown volume; and (d) The spectral reflectance.

Figure 12.
The distribution of structural and spectral features of trees organized by species. (a) Eucalyptus, (b) Holm oak; and (c) Pine.
Figure 12.
The distribution of structural and spectral features of trees organized by species. (a) Eucalyptus, (b) Holm oak; and (c) Pine.

Figure 13.
Differences (m) of GCPs between the coordinates measured with GNSS and those obtained on the point cloud.
Figure 13.
Differences (m) of GCPs between the coordinates measured with GNSS and those obtained on the point cloud.

Figure 14.
Field measures with the TS and estimated values on the SfM-based point cloud. (a) Tree height; and (b) Trunk diameter (DBH).
Figure 14.
Field measures with the TS and estimated values on the SfM-based point cloud. (a) Tree height; and (b) Trunk diameter (DBH).


Table 1.
A summary of the studied characteristics for each tree structure.
| Feature | Description |
|---|---|
| Multispectral traits | |
| Green | A low reflectance is measured on the tree canopy. |
| Red | In this band the forest foliage tends to be darker. |
| NIR | It is the least sensitive band to chlorophyll. |
| REG | This band is relevant for the assessment of plant stress. |
| NDVI | It is used for detection of tree health. |
| Structural parameters | |
| Tree height | The vertical distance between the tree base and the highest leaf. |
| Diameter at breast height (DBH) | The diameter of the trunk. |
| Crown volume | The 3D space occupied by the tree crown. |
© 2020 by the authors. Licensee MDPI, Basel, Switzerland. This article is an open access article distributed under the terms and conditions of the Creative Commons Attribution (CC BY) license (http://creativecommons.org/licenses/by/4.0/).
Share and Cite
MDPI and ACS Style
Jurado, J.M.; Ramos, M.I.; Enríquez, C.; Feito, F.R. The Impact of Canopy Reflectance on the 3D Structure of Individual Trees in a Mediterranean Forest. Remote Sens. 2020, 12, 1430. https://0-doi-org.brum.beds.ac.uk/10.3390/rs12091430
AMA Style
Jurado JM, Ramos MI, Enríquez C, Feito FR. The Impact of Canopy Reflectance on the 3D Structure of Individual Trees in a Mediterranean Forest. Remote Sensing. 2020; 12(9):1430. https://0-doi-org.brum.beds.ac.uk/10.3390/rs12091430
Chicago/Turabian StyleJurado, J. M., M. I. Ramos, C. Enríquez, and F. R. Feito. 2020. "The Impact of Canopy Reflectance on the 3D Structure of Individual Trees in a Mediterranean Forest" Remote Sensing 12, no. 9: 1430. https://0-doi-org.brum.beds.ac.uk/10.3390/rs12091430
Note that from the first issue of 2016, this journal uses article numbers instead of page numbers. See further details here.