The Retrieval of Total Precipitable Water over Global Land Based on FY-3D/MWRI Data
by
 , and
, and
Baolong Du
1,2, 
Dabin Ji
1,*,
Jiancheng Shi
1,3,
Yongqian Wang
2,
Tianjie Lei
4,
Peng Zhang
5 and
and
Husi Letu
1 1
State Key Laboratory of Remote Sensing Science, Aerospace Information Research Institute, Chinese Academy of Sciences, Beijing 100101, China
2
College of Resources and Environment, Chengdu University of Information Technology, Chengdu 610225, China
3
University of Chinese Academy of Science, Beijing 100049, China
4
China Institute of Water Resources and Hydropower Research (IWHR), Beijing 100038, China
5
National Satellite Meteorological Center, China Meteorological Administration, Beijing 100081, China
*
Author to whom correspondence should be addressed.
Remote Sens. 2020, 12(9), 1508; https://0-doi-org.brum.beds.ac.uk/10.3390/rs12091508
Submission received: 4 April 2020
/
Revised: 4 May 2020
/
Accepted: 7 May 2020
/
Published: 9 May 2020
(This article belongs to the Section Remote Sensing in Geology, Geomorphology and Hydrology)
Abstract
:Total precipitable water (TPW) is an important key factor in the global water cycle and climate change. The knowledge of TPW characteristics at spatial and temporal scales could help us to better understand our changing environment. Currently, many algorithms are available to retrieve TPW from optical and microwave sensors. There are still no available TPW data over land from FY-3D MWRI, which was launched by China in 2017. However, the TPW product over land is a key element for the retrieval of many ecological environment parameters. In this paper, an improved algorithm was developed to retrieve TPW over land from the brightness temperature of FY-3D MWRI. The major improvement is that surface emissivity, which is a key parameter in the retrieval of TPW in all-weather conditions, was developed and based on an improved algorithm according to the characteristics of FY-3D MWRI. The improvement includes two aspects, one is selection of appropriate ancillary data in estimating surface emissivity parameter Δε18.7/Δε23.8 in clear sky conditions, and the other is an improvement of the Δε18.7/Δε23.8 estimation function in cloudy conditions according to the band configuration of FY-3D MWRI. Finally, TPW retrieved was validated using TPW observation from the SuomiNet GPS and global distributed Radiosonde Observations (RAOB) networks. According to the validation, TPW retrieved using observations from FY-3D MWRI and ancillary data from Aqua MODIS had the best quality. The root mean square error (RMSE) and correlation coefficient between the retrieved TPW and observed TPW from RAOB were 5.47 and 0.94 mm, respectively.
1. Introduction
Total precipitable water (TPW),known as total column water vapor in the atmosphere, is a key meteorological parameter often used by weather forecasting experts to predict heavy precipitation [1,2]. At the same time, water vapor is also a key parameter in the global water cycle. Water vapor is a key parameter in the formation of clouds and precipitation. Water vapor enters the atmosphere via evaporation by absorbing heat from the surrounding environment, and is further transported through the stratosphere and troposphere to form clouds [3], finally forming precipitation during the process of condensation and latent heat release. If there is no water vapor, there will be no circulation of water between the atmosphere and the earth surface. Water vapor also plays an important role in the energy cycle [4,5]. Weather phenomenon change is mostly caused by the change of water vapor in the atmosphere. Water vapor absorbs and releases a large amount of latent heat in the phase change of water. The phase change of water vapor will directly affect the air temperature, and further influences vertical stability of the atmosphere and the evolution of convective weather systems. Knowing accurate total precipitation water distribution will help us to improve precipitation forecasting and better understand the global water cycle and energy cycle. At present, most research mainly uses ground-based observation and remote sensing to obtain TPW [6]. Ground-based observation methods mainly include radiosonde, GPS, solar spectrophotometer, and ground-based microwave radiometer. Ground-based TPW observation usually has high accuracy but is limited in spatial coverage. Satellite remote sensing has the advantage to provide large spatial coverage. Remote sensing can be divided into two categories: optical remote sensing and microwave remote sensing. The optical remote sensing of TPW mainly includes the near-infrared method, thermal infrared split window method, and the infrared profile method [7,8]. These methods are widely used and have better accuracy, but they also have some limitations. For example, near-infrared remote sensing cannot obtain TPW at night, and is seriously affected by clouds. Although thermal infrared and infrared remote sensing of total precipitable water can obtain data at night, it is greatly affected by clouds, and the accuracy of retrieved TPW is lower than that retrieved from near-infrared remote sensing [9].
Microwave remote sensing can obtain observations at both day and night, and is seldomly affected by clouds due to the long wavelength of microwaves [10,11]. In microwave bands, the water vapor absorption channel at frequency 23.8 GHz and a window channel at 18.7 GHz are usually used in the retrieval of TPW. Currently, it is more difficult to retrieve TPW over land areas than ocean areas using observations from 23.8 GHz and related window channels of microwave radiometers, because the land surface usually has a higher surface emissivity (usually greater than 0.9) than the ocean surface (~0.5) at microwave bands. The high value of land surface emissivity will greatly suppress the atmospheric information received by satellite, which makes it difficult to retrieve TPW over land areas. In order to retrieve TPW over land areas using microwave radiometers, several methods were developed. Aires et al. retrieved total precipitable water, cloud liquid water, surface temperature, and surface emissivity based on SSM/I data over land using the artificial neural network method [12]. The error of retrieved total precipitable water was 3.8 mm in clear sky and 4.9 mm in cloudy sky. However, this method needs to collect a large amount of training data and has poor portability, so it cannot be directly applied to other sensors. Liu and Weng [13] established a one-dimensional dynamic change radiation transfer model to develop a simulation method to retrieve total precipitable water using observations from Advance Microwave Sounding Unit (AMSU) and related atmospheric profiles. Deeter proposed a parametric method to retrieve atmospheric water vapor [14]. In the algorithm, the ratio of the brightness temperature polarization difference between 18.7 GHz and 23.8 GHz of the Advanced Microwave Scanning Radiometer for EOS (AMSR-E) was mainly used to retrieve atmospheric water vapor because of their sensitivity to water vapor. Due to errors in spatial scale between ground observation data and inversion data in the verification process, tRMSE reached 6.4 mm after removing 29% of the worst matching verification data. The advantage of this method is that it does not depend on the surface emissivity, especially over land. However, the method relies too much on the measured data on the ground. Wang [15] proposed a parameterized method on the basis of Deeter’s research. The parameterized method established a simulated database using a microwave radiative transfer model based on atmospheric profile and simulated surface emissivity from the advanced integral equation model (AIEM). By analyzing the data in the simulated database, it was found that the polarization ratio of the 18.7 and 23.8 GHz bands had good linear correlation with the atmospheric water vapor. The advantage of this method is that the surface emissivity in the simulation database is obtained by AIEM model. Thus, the parameterized method is free from regional limitations and can be used globally. However, the disadvantage is that the AIEM model is only a bare soil surface reflectivity model, it is only applicable to bare soil surface on the global scale. The verification result shows that the error of this method is 8.8 mm over land. In order to reduce the influence of land surface during the retrieval of TPW, the two algorithms mentioned above usually set the land surface emissivity parameter Δε18.7/Δε23.8 as a constant. However, in the actual verification, it was found that land surface emissivity parameter changes with different land surface types and seasons. Therefore, setting the land surface emissivity parameter as a constant in the inversion process will introduce great errors [16].
Accurate land surface condition is very important to the retrieval of TPW over land. However, it is difficult to directly obtain accurate land surface emissivity, especially over cloud-covered areas. Currently, the uncertainty of the land surface emissivity parameter makes it difficult to retrieve total precipitable water over land areas using passive microwave radiometers such as AMSR-E, AMSR2, and FY-3D MWRI. Ji et al. [17] developed an algorithm to retrieve total precipitable water over land based on AMSR-E by developing a new land surface emissivity parameter estimation method. The RMSE of the retrieved total precipitable water in the algorithm can reach up to 3.5 mm. It was an obvious improvement in the retrieval of total precipitable water over land based on observations from AMSR-E. However, the algorithm developed by Ji et al. was only designed for AMSR-E, and it is still a large challenge to adapt the algorithm to other microwave radiometers due to the configuration difference of sensors on different satellites.
FY-3D is the latest polar orbit meteorological satellite of China, launched in 2017. The satellites of the FY-3 series form an observation network and improve the ability of FY series satellites in atmosphere and environment observations [18]. At present, only total precipitable water over ocean areas retrieved from FY-3D Microwave Radiation Imager (MWRI) is provided to the public due to the influence of high surface emissivity in the retrieval of total precipitable water over land. In order to obtain total precipitable water over land, an improved total precipitable water retrieval algorithm over land for FY-3D MWRI is developed in this study, based on a previous study [17]. The major improvement of the retrieval algorithm for FY-3D MWRI still focuses on estimating the ratio of polarization difference of surface emissivity at two frequencies (Δε18.7/Δε23.8) accurately according to configuration of FY-3D MWRI. One important step in the estimation of Δε18.7/Δε23.8 in all-weather conditions is to estimate Δε18.7/Δε23.8 in a clear sky condition first by using pre-estimated water vapor products. The quality of water vapor products will affect the estimation of Δε18.7/Δε23.8 directly. The water vapor product from MODIS usually has good quality. However, there is an obvious time interval between MODIS and FY-3D MWRI observations. Water vapor product from FY-3D MERSI almost has simultaneous observation time with FY-3D MWRI, but the quality of water vapor product from FY-3D MERSI is not as good as that from MODIS. Thus, the two water vapor products from FY-3D MERSI and MODIS are used and compared in the estimation of Δε18.7/Δε23.8 in a clear sky condition. For the estimation of Δε18.7/Δε23.8 in a cloudy sky condition, the estimation function is also improved to adapt the FY-3D MWRI due to the difference of the band configuration between FY-3D MWRI and AMSR-E.
2. Data Used in the Study
The data used in this study mainly include brightness temperature from FY-3D MWRI, water vapor, and land surface temperature products from FY-3D MERSI and Aqua MODIS, SuomiNet GPS TPW observations from Global Network, and atmospheric profiles from global distributed radiosonde observations (RAOB). The details are described as follows.
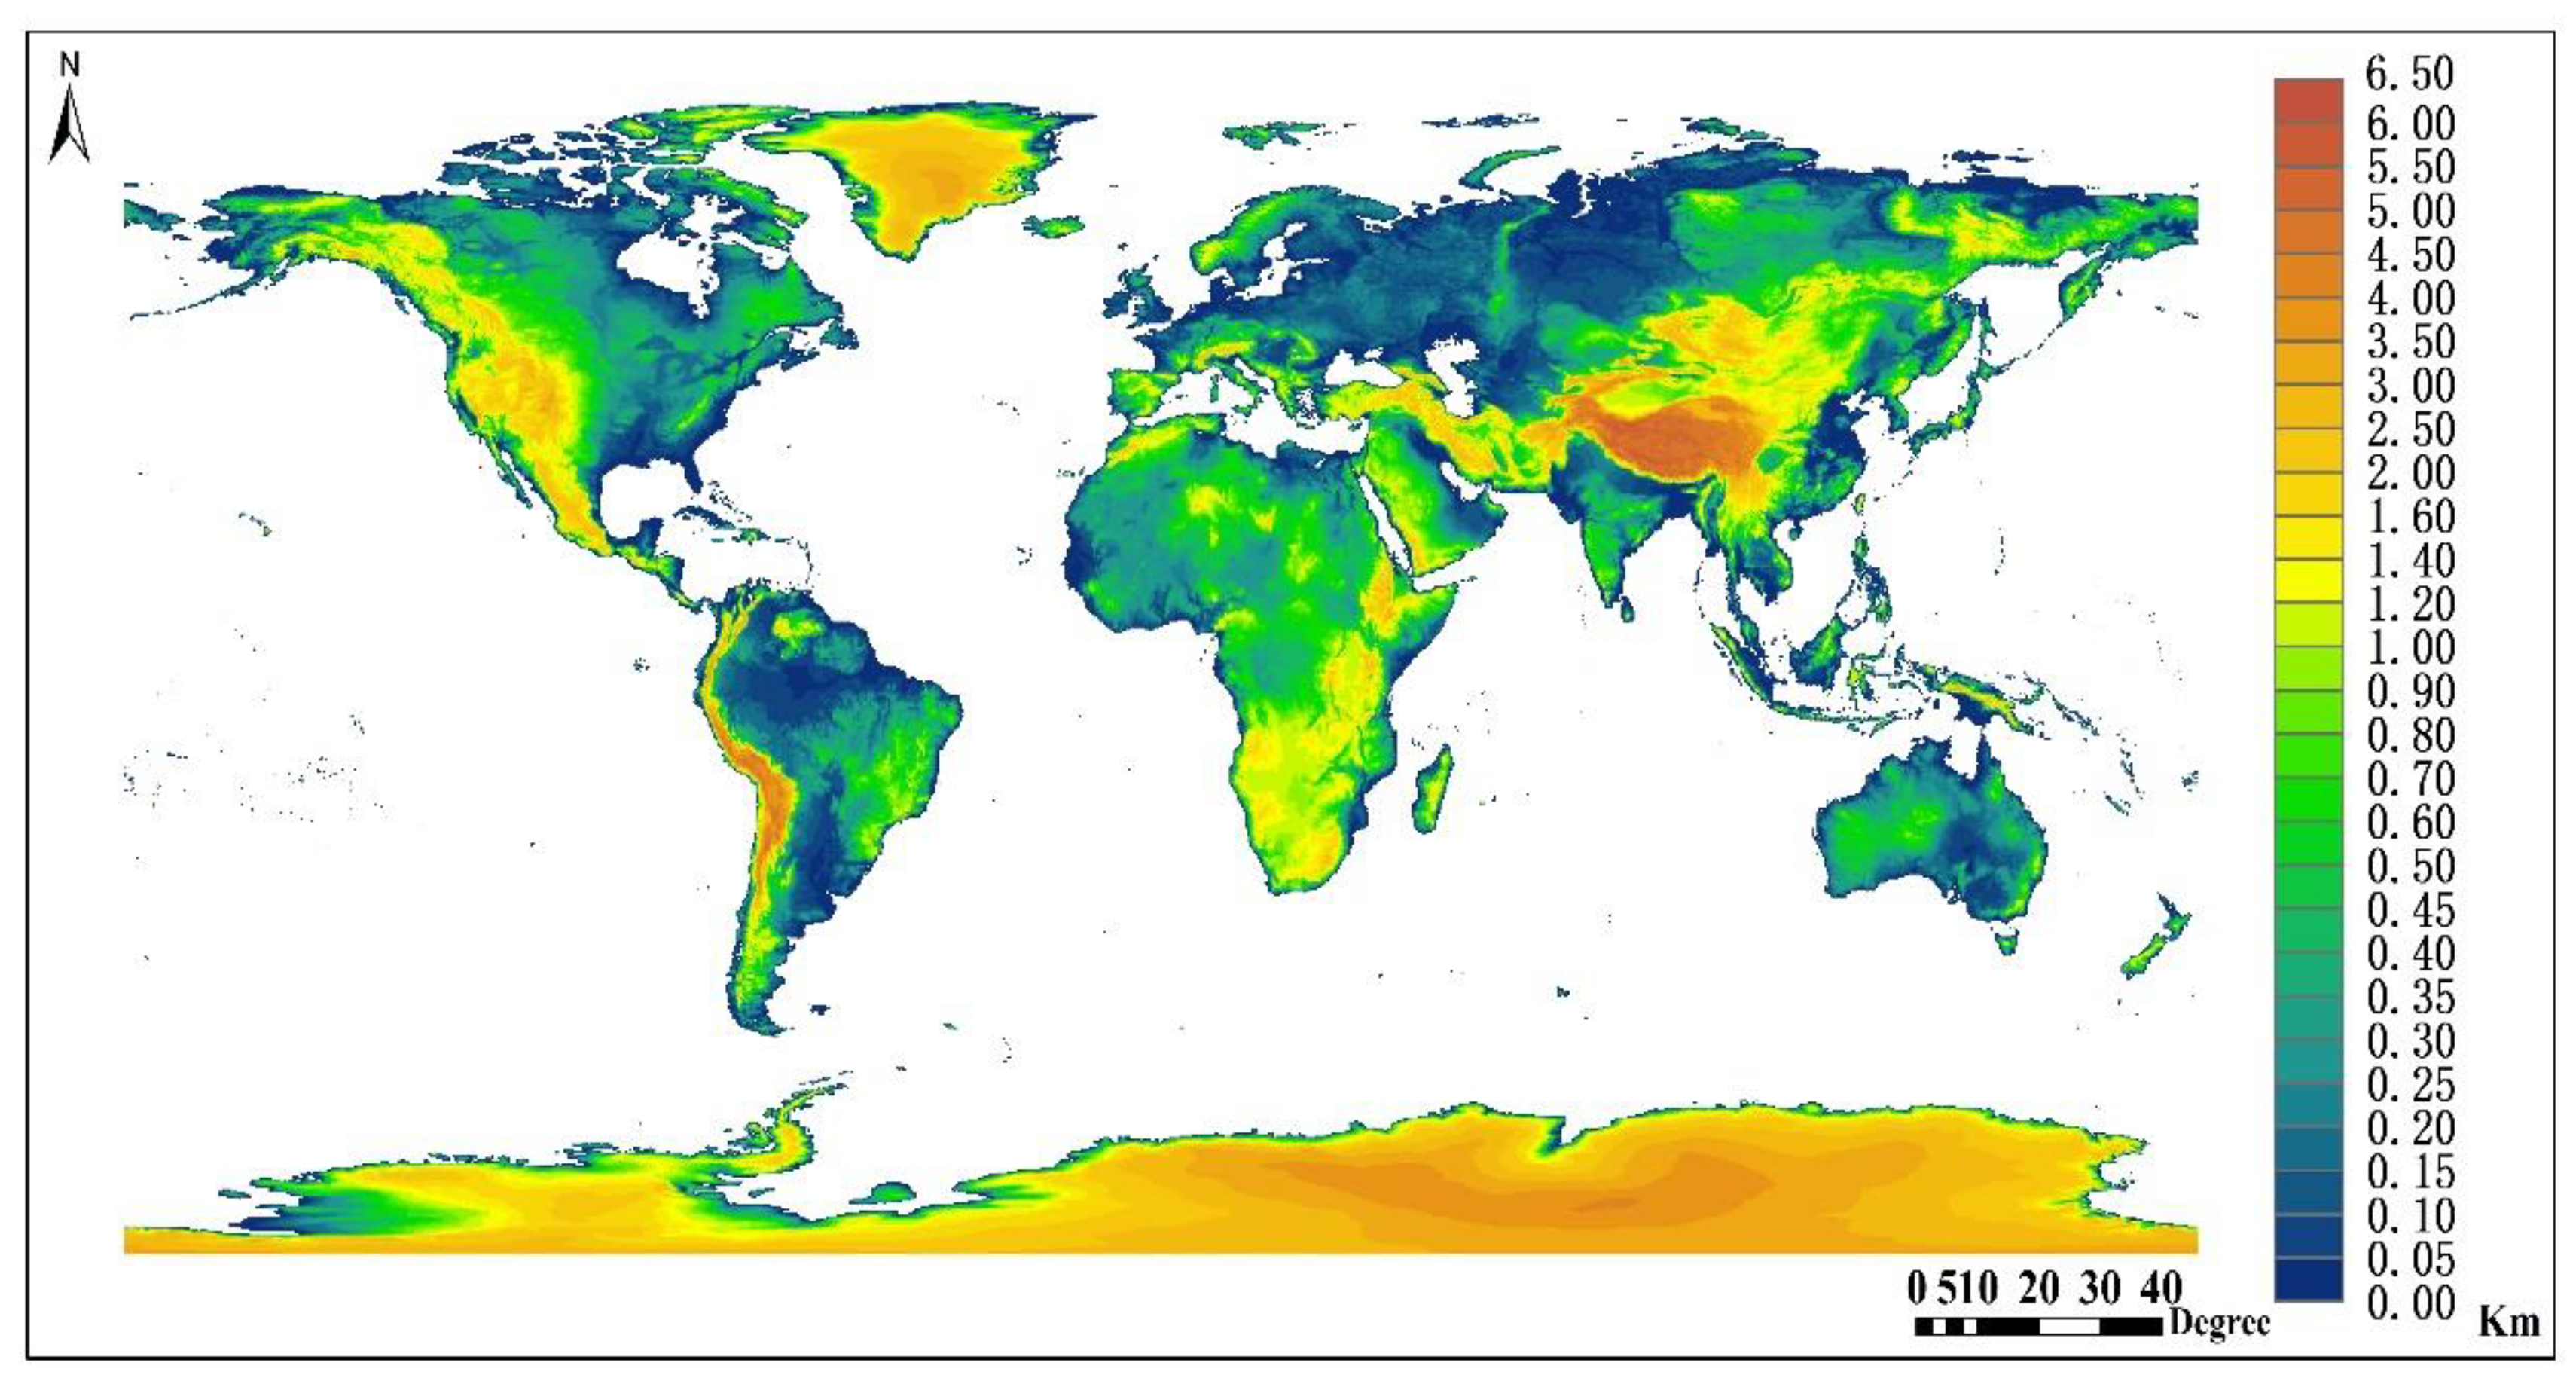
Brightness temperature from FY-3D MWRI. FY-3D is the second generation of polar orbit operational weather satellite of China, which is equipped with 10 advanced remote sensing sensors [19,20,21]. FY-3D MWRI receives horizontal and vertical polarization of electromagnetic radiation from the earth’s surface and atmosphere at frequencies 10.65 GHz, 18.7 GHz, 23.8 GHz, 36.5 GHz, and 89 GHz. The observations can be used to monitor environmental information such as spatial and temporal distributions of precipitation, clouds, water vapor content in the atmosphere, surface vegetation, soil moisture, sea ice, and snow cover [22,23]. The FY-3D MWRI L1 brightness temperature can be accessed on the website of the national satellite meteorological center. Table 1 shows detail of FY-3D MWRI. In this study, the ratio of brightness temperature polarization difference between 18.7 and 23.8 GHz was used as a key parameter to retrieve TPW over land. Meanwhile, the vertical and horizontal polarized brightness temperature at 10.65 and 18.7 GHz was used as auxiliary data to estimate other key parameters in the process of retrieving TPW. At the same time, surface elevation is a key factor that should not be ignored when using land surface brightness temperature to retrieve TPW. FY-3D MWRI L1 brightness temperature science datasets provide a kind of 25 km spatial resolution daily digital elevation model (DEM) data file. As we know, ground surface elevation will not change much in a short time. Therefore, this paper used the maximum value composition method to generate a global DEM in 2018 as generic data for the retrieval model. Figure 1 shows spatial distribution map of the DEM from FY-3D MWRI in 2018.
Water vapor from FY-3D MERSI. The water vapor product retrieved from the thermal infrared bands of FY-3D MERSI was mainly used to retrieve the surface emissivity parameter Δε18.7/Δε23.8 in a clear sky condition. The spatial resolution of the water vapor product is 5 km. The advantage of using the water vapor product from FY-3D MERSI is that MERSI almost has simultaneous observations with MWRI. However, the quality of the water vapor product of MERSI might be the major limitation for estimating the surface emissivity parameter Δε18.7/Δε23.8. The water vapor product of MERSI is available on the website of NSMC (http://www.nsmc.org.cn/NewSite/NSMC/Home/Index.html).
Water vapor from Aqua-MODIS. As an alternative, the water vapor product retrieved from the thermal infrared bands of Aqua MODIS was also used in the estimation of surface emissivity parameter Δε18.7/Δε23.8 in a clear sky condition. The Aqua-MODIS level 2 TPW product produced using infrared algorithm has a spatial resolution of 5 × 5 km and is available at both day and night. The advantage of the water vapor product from MODIS is that it has a higher quality than that from MERSI. The disadvantage is that the time difference of observations between Aqua-MODIS and FY-3D MWRI is larger than the time difference of observations between FY-3D MERSI and FY-3D MWRI. However, the positive aspect is that the satellites Aqua and FY-3D have similar postmeridian satellite orbits. Equator crossing time of FY-3D is at 2 p.m., which is half an hour later than Aqua in local time zones [24,25]. The small observation time interval between Aqua and FY-3D makes it possible to estimate the surface emissivity parameter Δε18.7/Δε23.8 in a clear sky condition using the water vapor product from MODIS and brightness temperature from FY-3D MWRI. The water vapor product from Aqua MODIS can be accessed at website (https://ladsweb.modaps.eosdis.nasa.gov/).
Land surface temperature is another parameter mainly used in the estimation of Δε18.7/Δε23.8 in a clear sky condition. FY-3D MERSI LST product was used together with FY-3D MERSI TPW in the estimation of Δε18.7/Δε23.8. As an alternative, the Aqua MODS LST product was used together with Aqua MODIS TPW in the estimation of Δε18.7/Δε23.8.The LST from FY-3D MERSI can be accessed at website (http://www.nsmc.org.cn/NSMC/Home/). The LST from Aqua MODIS can be accessed at website (https://ladsweb.modaps.eosdis.nasa.gov/).
Atmospheric profiles from radiosonde observations. Atmospheric profiles from the global distributed radiosonde observations (RAOB) were used to build lookup tables for estimating Δε18.7/Δε23.8 and TPW. The profile data used to build the lookup table included height, relative humidity, temperature, and pressure profiles. There are more than 800 observation points, and every observation point provides two observations per day. The observations can be accessed in website (http://www.esrl.noaa.gov/raobs/).
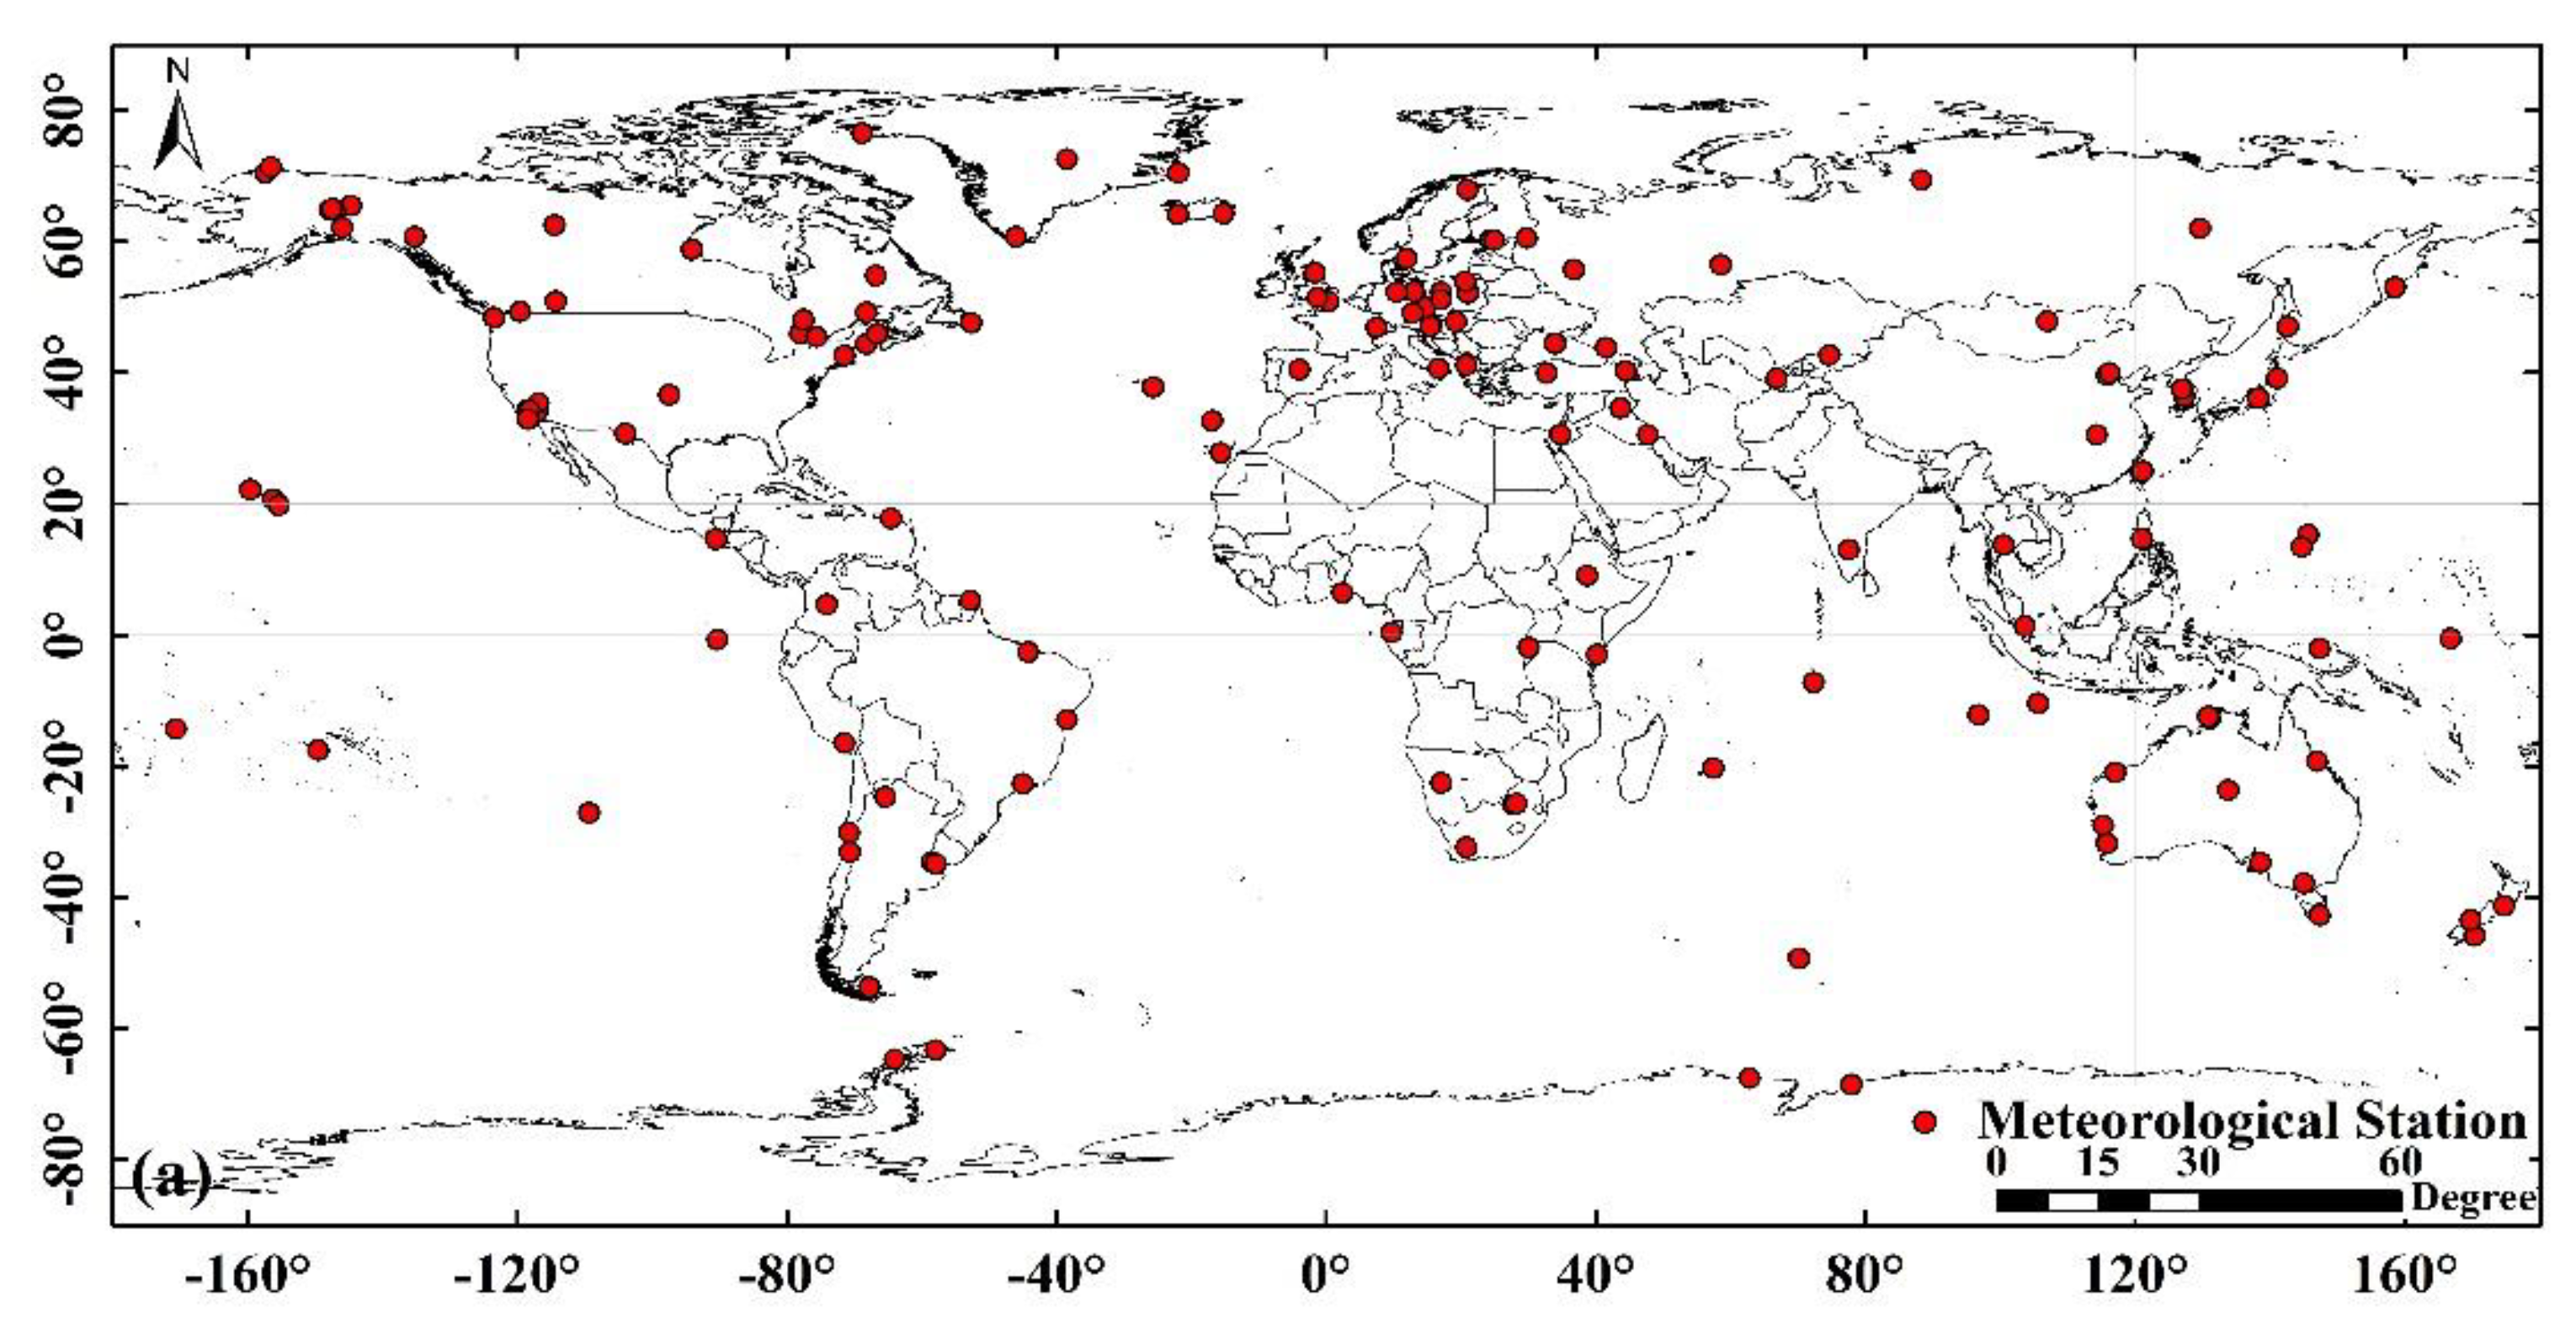
TPW obtained from SuomiNet GPS. The total precipitable water retrieved from the SuomiNET GPS network was used to validate the retrieved TPW from FY-3D MWRI. SuomiNET is an international network of GPS receivers. The goal of SuomiNET is to make large amounts of spatially and temporally dense GPS-sensed PW vapor data widely available in real time for academic research and education [26]. TPW measured by SuomiNET GPS is the product of zenith delay and conversion factor, and the error of TPW retrieved by this method is better than 2 mm [27]. Figure 2 shows the distribution map of TPW observation sites from the Global SuomiNET GPS network.
3. Retrieval Algorithm
3.1. Basic Theory for Retrieval of Total Precipitable Water (TPW)
The retrieval of TPW is mainly based on the water vapor absorption channel at frequency 23.8 GHz. In order to further enhance the sensitivity to water vapor, a window channel at frequency 18.7 GHz was used to create a water vapor sensitivity parameter ΔTb18.7/ΔTb23.8. The sensitivity of the parameter ΔTb18.7/ΔTb23.8 to water vapor was verified in previous studies [14,15,16,17]. According to previous studies, the parameter ΔTb18.7/ΔTb23.8 can greatly enhance sensitivity to water vapor compared to a single channel at frequency 23.8 GHz, and at the same time, the parameter is also able to greatly reduce its sensitivity to clouds.
The basic theory for TPW retrieval in this study was discussed by previous studies [16,17]; it will be presented here again for clarity. The theoretical basis of retrieving TPW is the atmospheric radiative transfer equation. According to the integrated radiative transfer equation for a nonscattering, plane-parallel atmosphere with a nonblackbody surface boundary condition, the brightness temperature received by a sensor at the top of the atmosphere can be expressed by Equation (1) [16,17]:
where represents upward brightness temperature received by satellite at pressure level p = 0 and frequency ν; q is vertical (V) or horizontal (H) polarization state; represents surface emissivity at frequency ν and polarization state q; represents surface temperature, where the subscript “s” denotes surface value; represents atmospheric transmittance for a layer between pressure level p and p = 0; and represents cosmic background temperature, 2.7 K. Based on Equation (1), the polarization difference of brightness temperature at any frequency can be deduced. The equation for the polarization difference of brightness temperature is shown in Equation (2) [16,17]:
where and represent brightness temperatures at frequency ν for vertical and horizontal polarizations, respectively, and and represent surface emissivity at frequency ν for vertical and horizontal polarizations, respectively. According to Equation (2), the basic TPW retrieval equation based on the TPW sensitive parameter ΔTb18.7/ΔTb23.8 is shown in Equation (3) [16,17]:
where and are differences between vertical (V) and horizontal (H) polarizations of 18.7 and 23.8 GHz microwave remote data; when ignoring the presence of clouds, is a function of surface temperature, surface elevation, and TPW. According to the Equation (3), ΔTb18.7/ΔTb23.8 and surface elevation are from observations of FY-3D. If Δε18.7/Δε23.8 and the surface temperature are known, then TPW can be retrieved. According to Equation (3), a key parameter in the retrieval of TPW is the surface emissivity parameter Δε18.7/Δε23.8. The accuracy of Δε18.7/Δε23.8 directly determines the precision of retrieved TPW. Due to complexity of land surface, it is challenging to estimate Δε18.7/Δε23.8 accurately. In this study, the surface emissivity Δε18.7/Δε23.8 in a clear sky condition was first estimated, and then the surface emissivity Δε18.7/Δε23.8 in a cloudy sky condition was estimated based on Δε18.7/Δε23.8 for the clear sky condition and an estimation function.
3.2. Estimation of Land Surface Emissivity Parameter in Clear Sky
The basic equation for estimating Δε18.7/Δε23.8 in clear sky is shown in Equation (4), which is an inverse function of Equation (3). Considering the complexity of function , a lookup table method was used to estimate Δε18.7/Δε23.8 in a clear sky condition. The building of the lookup table was based on the method mentioned in [17]. The lookup table was built based on 1-Dimensional Microwave Radiative Transfer Model (1DMWRTM) [28,29,30,31] and atmospheric profiles from RAOB. The temperature, humidity, pressure, and height profiles were used to build the lookup table. The atmospheric profiles were selected according to surface temperature, TPW of each profile, and the elevation of RAOB sites. The steps for surface temperature and TPW in the lookup table are 1 K and 0.1 mm, respectively. The step for elevation is 50 m between 0 and 500 m, 100 m between 500 and 1000 m, 200 m between 1000 and 1600 m, 400 m between 1600 and 2000 m, and 500 m between 2000 and 6500 m; the profiles with a site elevation greater than 6500 m are classified into the last category. The range of Δε18.7/Δε23.8 is 0.4 to 1.6 with a step of 0.01. When ΔTb18.7/ΔTb23.8, surface elevation, surface temperature, and TPW in a clear sky condition are given, then the parameter Δε18.7/Δε23.8 can be obtained. In the estimation of Δε18.7/Δε23.8, the parameters ΔTb18.7/ΔTb23.8 and Surf_elev can be obtained from the FY-3D level 1 brightness temperature product. The major improvements in the estimation of Δε18.7/Δε23.8 in a clear sky condition are selecting the appropriate water vapor product and Land Surface Temperature (LST) product for a clear condition. For the parameter Ts in the Equation (4), it was obtained through an empirical LST estimation equation in previous study [16,17]. However, the empirical equation designed for AMSR-E is not suitable for the brightness temperature from FY-3D MWRI due to the difference of band configuration. Therefore, in this study, two kinds of LST products were used and compared in the estimation of Δε18.7/Δε23.8. One is the Aqua MODIS LST product (MYD11), and the other is the FY-3D MERSI LST product. Table 2 shows the comparison of the two LST products.
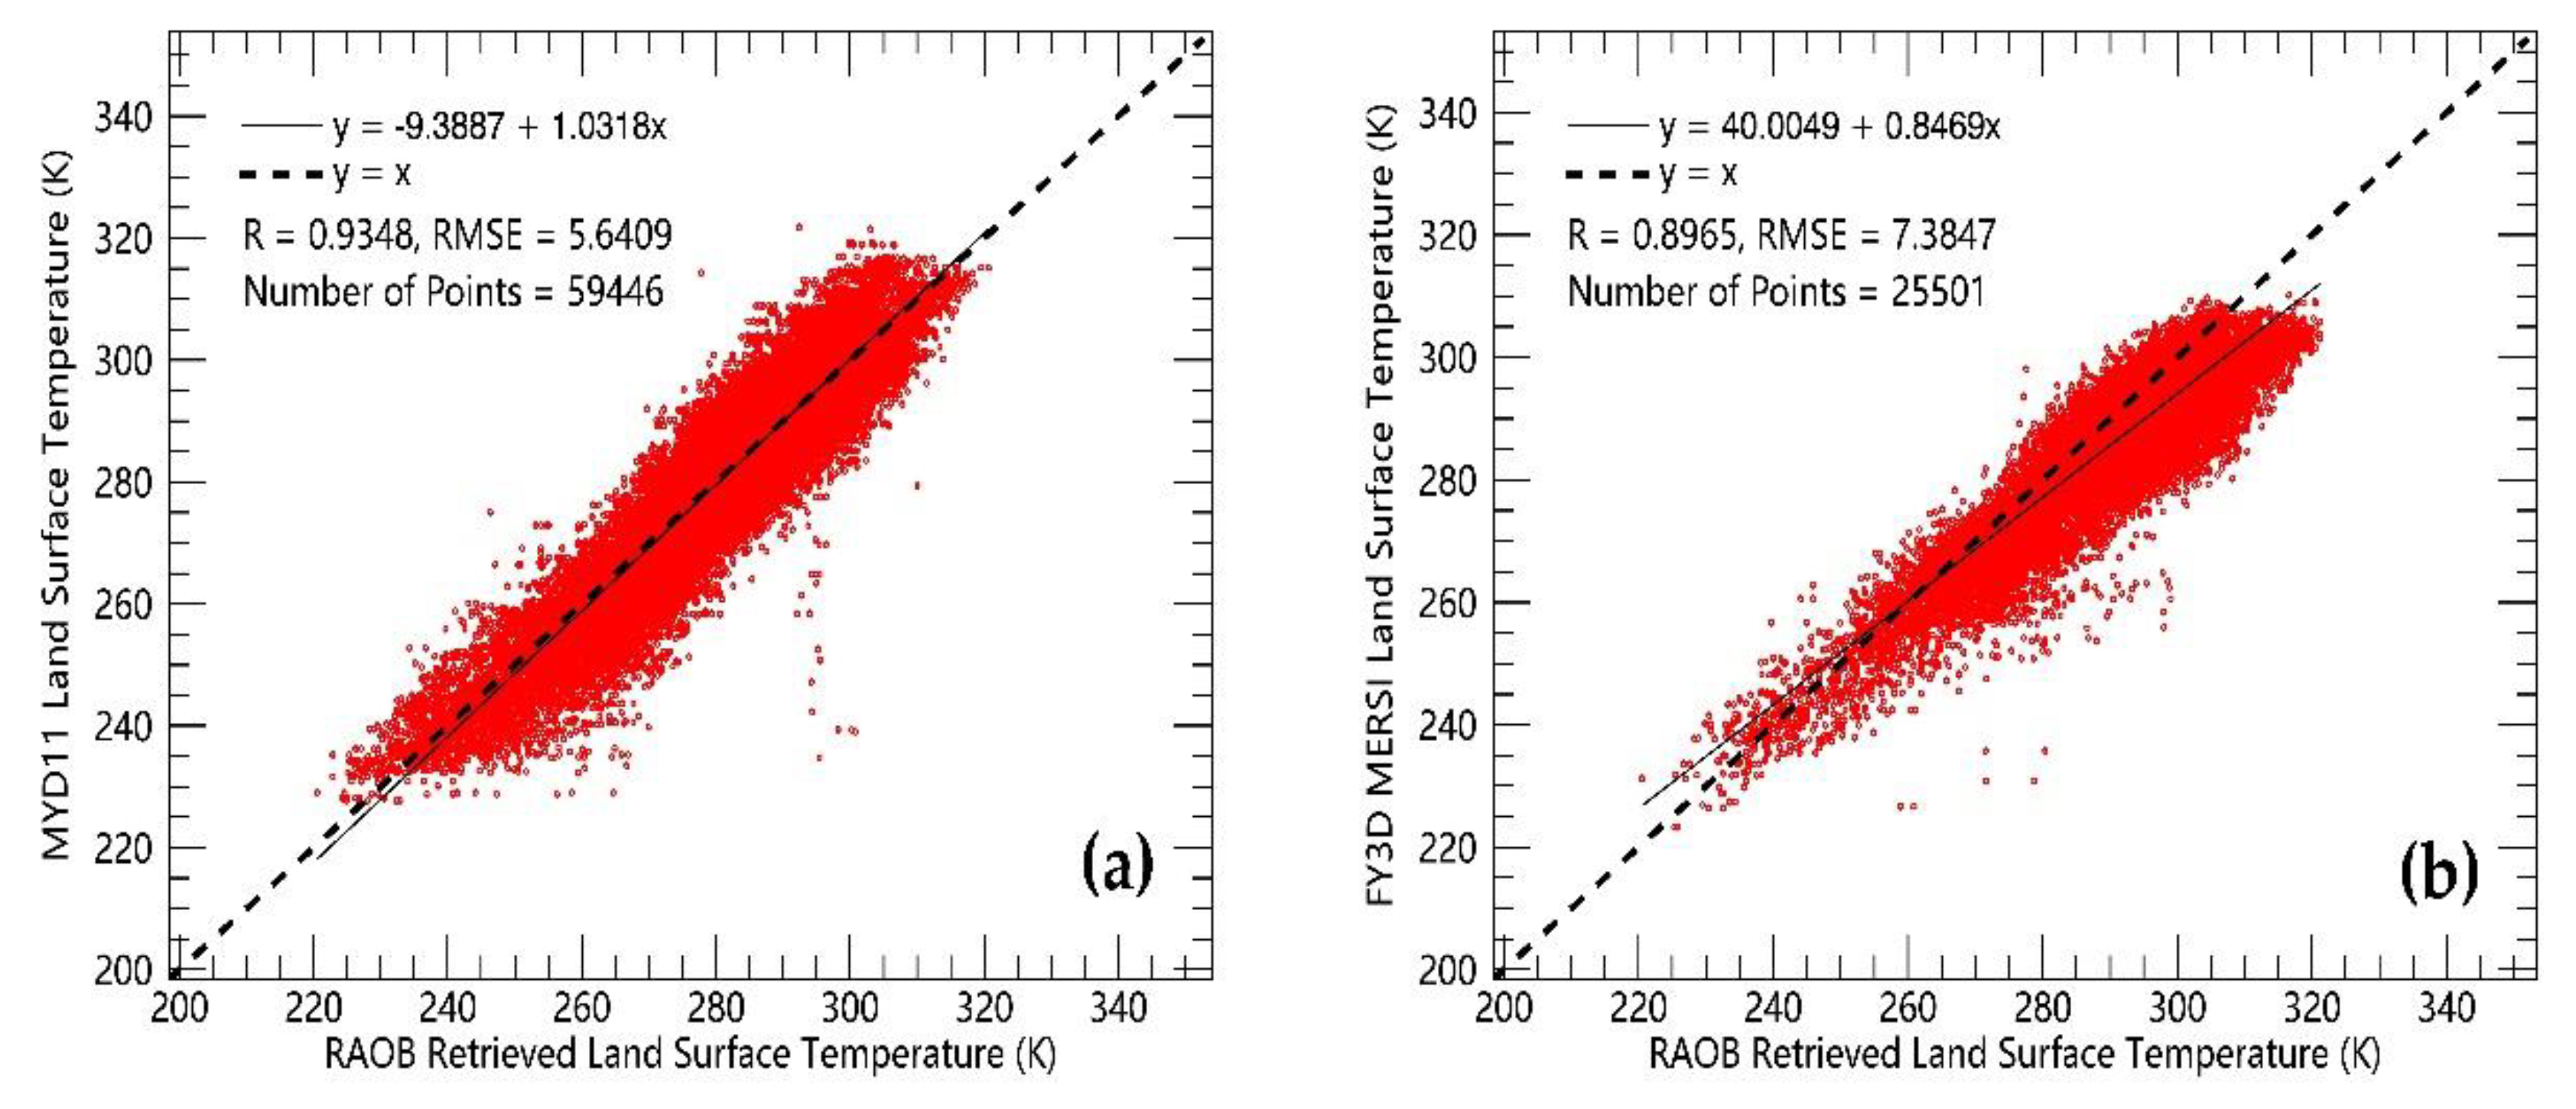
In order to choose an appropriate LST for the estimation of Δε18.7/Δε23.8 and TPW, the two LST products were compared with LST observations from RAOB separately. Figure 3 shows the comparison results of the two products. Figure 3a shows the scatter diagram between Aqua MODIS LST and LST from RAOB. Figure 3b shows the scatter diagram between FY-3D MERSI LST and LST from RAOB. The dashed line is diagonal and the solid line is the regression line of the two comparison datasets. In comparison, both Aqua MODIS LST and FY-3D MERSI LST were validated on instantaneous and quarter-degree scale. It can be concluded from the Figure 3 that Aqua MODIS LST is better than FY-3D MERSI LST in both linear correlation coefficient (R) and root mean square error (RMSE). In Figure 3a, the linear correlation coefficient and root mean square error between Aqua MODIS LST and RAOB LST are 0.93 and 5.64 K, respectively. In Figure 3b, the linear correlation coefficient and root mean square error between FY-3D MERSI LST and RAOB LST are 0.90 and 7.38 K, respectively. According to the previous study [17], an error of 10 K in LST will cause a 0.07 mm error of TPW. Thus, the error of LST from Aqua MODIS and FY-3D MERSI is acceptable.
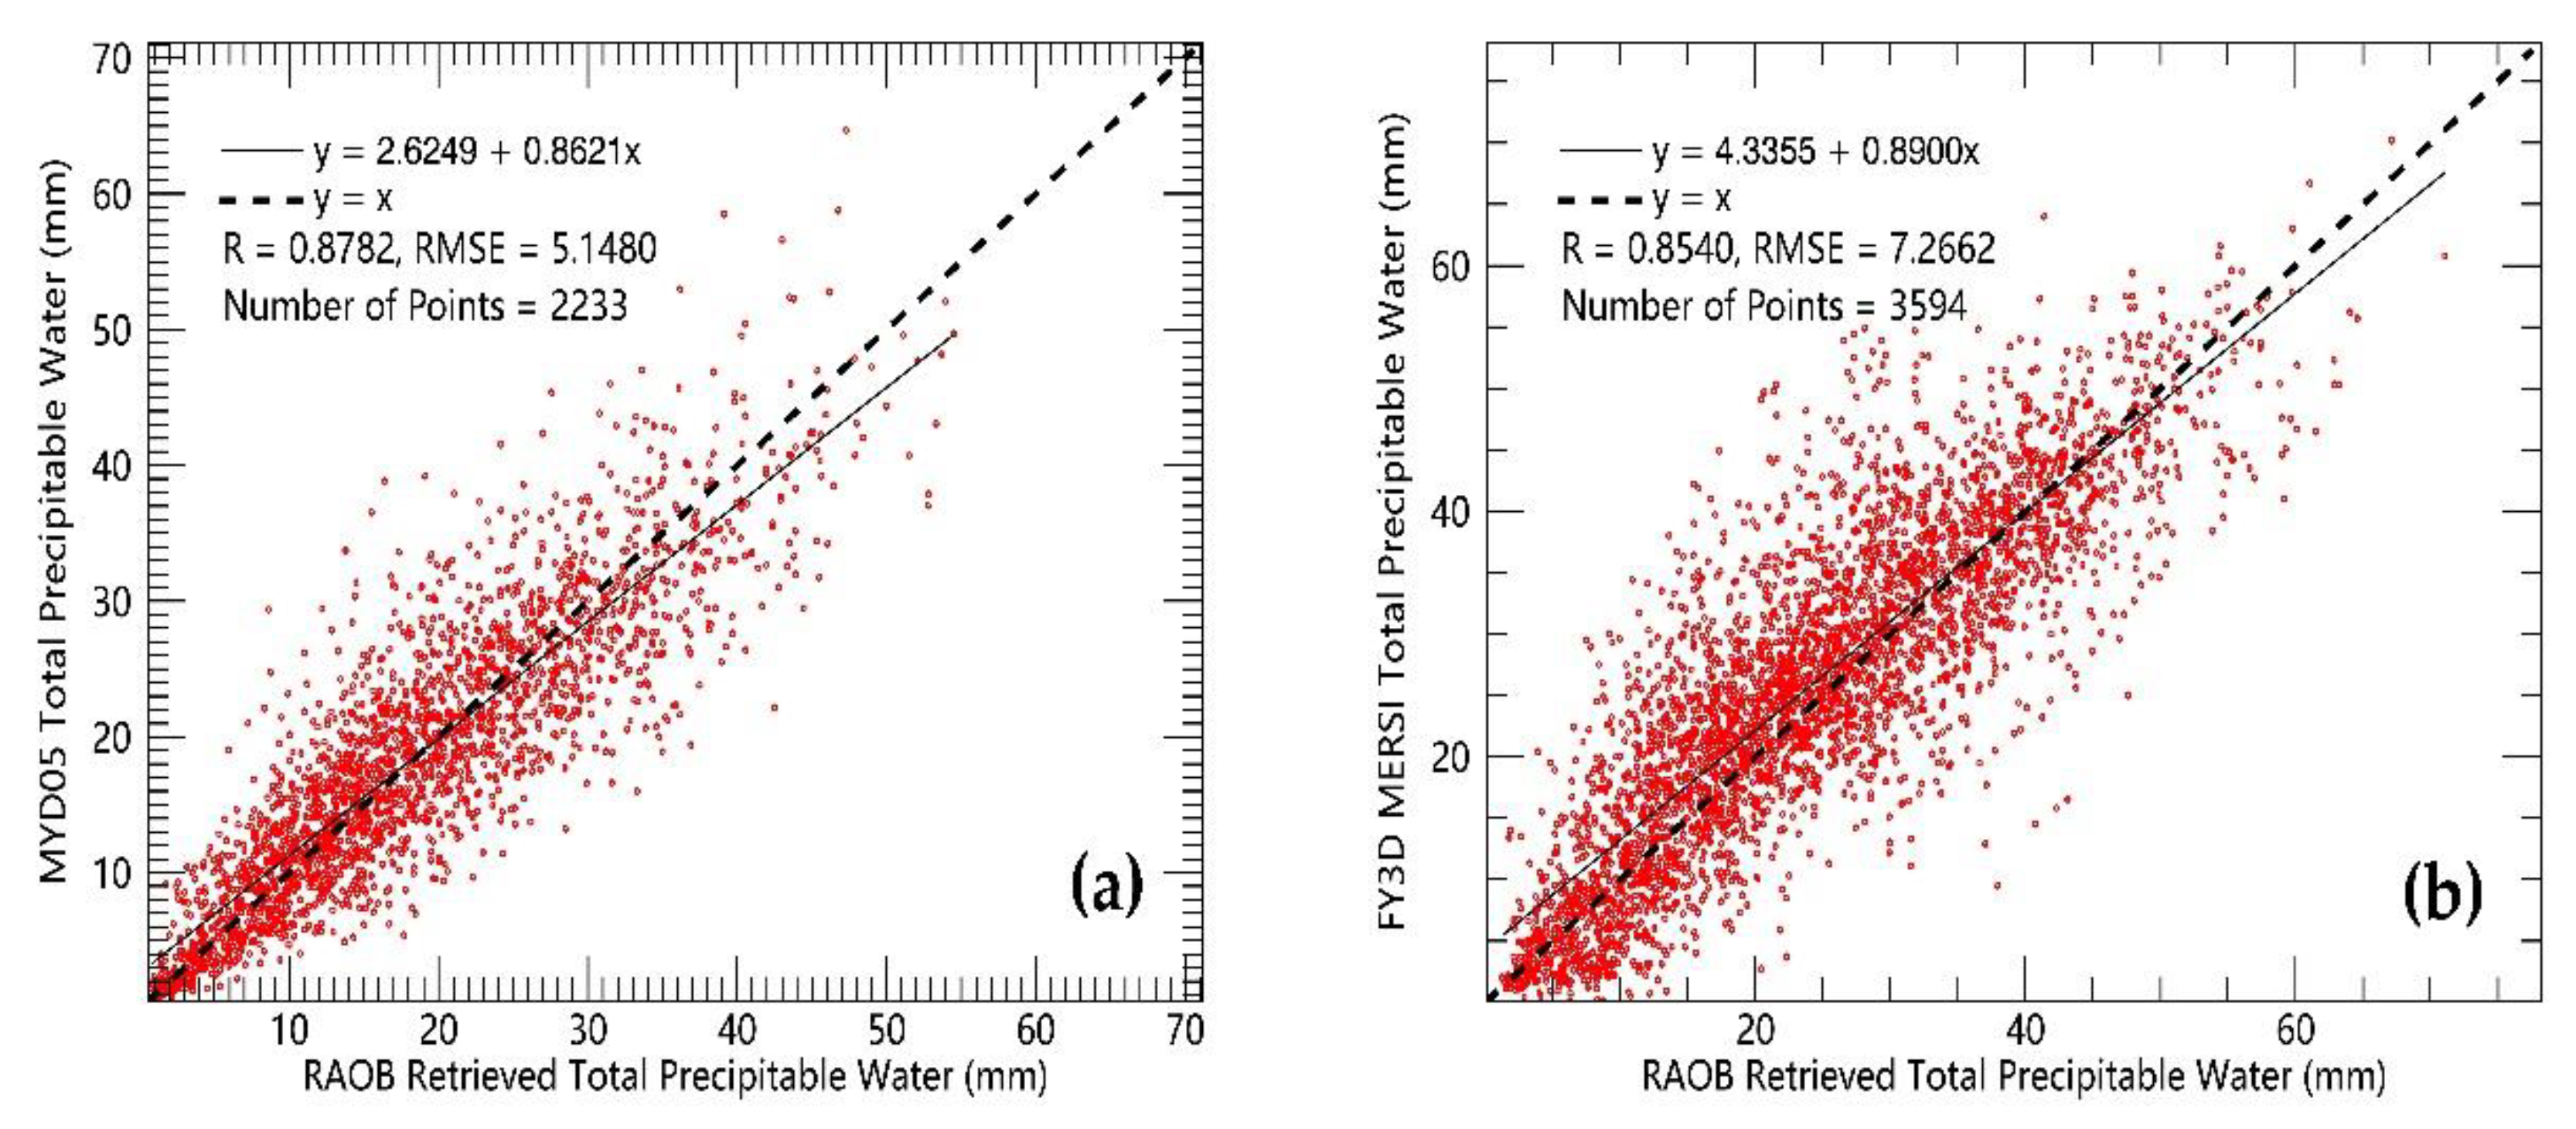
TPW in a clear sky condition is another important parameter in the estimation of Δε18.7/Δε23.8 for a clear sky condition. The accuracy of TPW in a clear sky condition directly affects the precision of the estimated Δε18.7/Δε23.8 in a clear sky condition, and then affects the accuracy of Δε18.7/Δε23.8 in an all-weather condition. As the land surface emissivity parameter Δε18.7/Δε23.8 in an all-weather condition is a key parameter for the retrieval of TPW in an all-weather condition, according to Equation (3), the accuracy of the TPW in a clear sky condition is important to the retrieval of TPW in an all-weather condition using FY-3D MWRI. In order to choose an appropriate TPW dataset in the estimation of Δε18.7/Δε23.8, two TPW products were considered and compared. One is TPW from the Aqua MODIS water vapor product, the other is TPW from the FY-3D MERSI water vapor product. In comparison, the two TPW products were compared with TPW from RAOB on instantaneous and quarter-degree scale. Figure 4 shows the comparison results of the two products. In Figure 4a, the linear correlation coefficient and root mean square error between TPW from Aqua MODIS and TPW from RAOB are 0.88 and 5.15 mm, respectively. In Figure 4b, the linear correlation coefficient and root mean square error between TPW from FY-3D MERSI and TPW from RAOB are 0.85 and 7.27 mm, respectively. According to the comparison, the accuracy of TPW from Aqua MODIS is better than the accuracy of TPW from FY-3D MERSI.
From the above-mentioned comparison, there are two kinds of methods to estimate surface emissivity Δε18.7/Δε23.8. The first is Method A, based on Aqua MODIS LST and Aqua MODIS TPW. The second is Method B, based on FY-3D MERSI LST and FY-3D MERSI TPW. It is difficult to tell which method is better in estimating Δε18.7/Δε23.8,, because it is hard to validate the accuracy of Δε18.7/Δε23.8 directly. The purpose of estimating Δε18.7/Δε23.8 is to provide a surface boundary condition in the process of retrieving TPW. Thus, further comparison of the two retrieval methods appropriate for retrieving TPW based on observations from FY-3D MWRI is discussed in the following TPW comparison section.
A lookup table was used in retrieval of Δε18.7/Δε23.8. There are five key parameters in the lookup table for retrieving Δε18.7/Δε23.8 in a clear sky condition. The five parameters include land surface elevation, land surface temperature, TPW in a clear sky condition, Δε18.7/Δε23.8, and ΔTb18.7/ΔTb23.8. The ΔTb18.7/ΔTb23.8 parameter and land surface elevation can be obtained from the FY-3D MWRI level 1 brightness temperature product. Global land surface temperature can be obtained from the Aqua Modis LST product (MYD11) or FY-3D MERSI LST product. TPW in a clear sky condition is from Aqua Modis TPW product (MYD05) or FY-3D MERSI TPW product, which were produced based on thermal infrared observations. When all the four parameters are given, the surface emissivity Δε18.7/Δε23.8 in a clear sky condition can be estimated using the lookup table.
3.3. Estimation of Land Surface Emissivity Parameter in Cloudy Sky
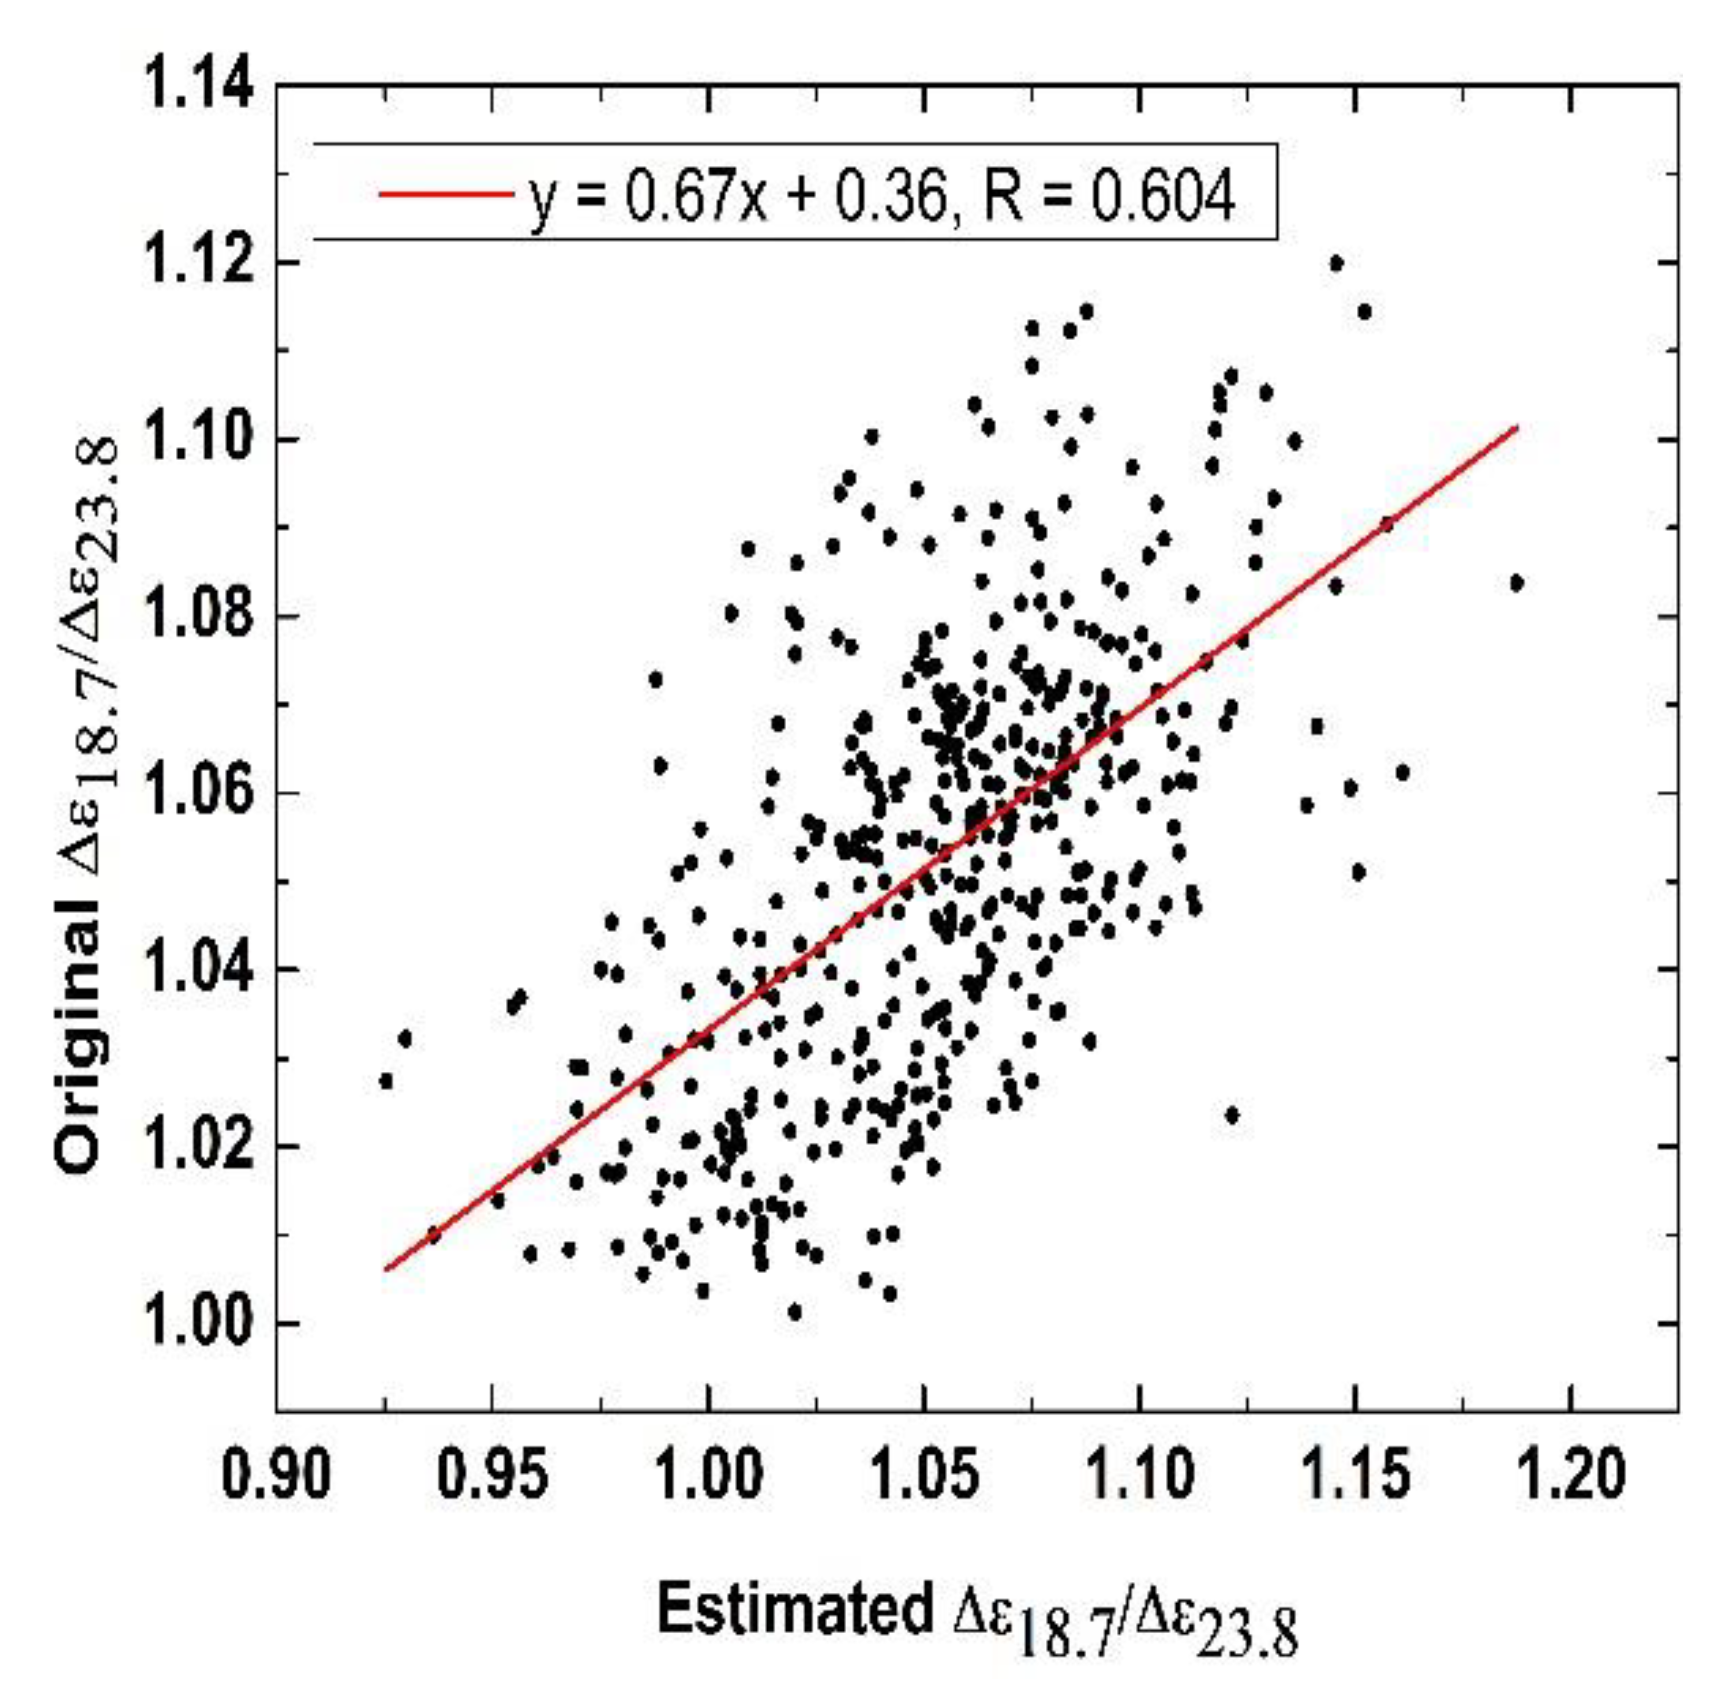
The land surface emissivity parameter Δε18.7/Δε23.8 in a cloudy sky condition is a key parameter for TPW retrieval in an all-weather condition. A multiple linear regression equation of Δε18.7/Δε23.8 under a cloudy sky condition, Δε18.7/Δε23.8 in the clear sky condition, and brightness temperature of low frequencies were developed in previous studies [16]. However, the multiple linear regression equation developed in the previous study is only suitable for AMSR-E, and it is difficult to directly apply the regression equation to FY-3D MWRI due to the difference of band configuration. Thus, an improved estimation equation for Δε18.7/Δε23.8 in a cloudy sky was developed to suit the band configuration of FY-3D MWRI. The improved multiple linear regression equation for estimating Δε18.7/Δε23.8 in a cloudy sky is shown in Equation (5):
where a, b, and c are regression coefficients that are estimated by the multiple linear regression method using the Δε18.7/Δε23.8 in clear sky, r10 in clear sky, and r18 in clear sky. Variables r10 and r18 are ratio of vertical and horizontal polarized brightness temperatures of FY-3D MWRI at 10.65 and 18.7 GHz. As a verification of Equation (5), two random 15 × 15 pixel research areas in a clear sky condition from ascending and descending orbits were selected. A scatter plot between the original Δε18.7/Δε23.8 and the estimated Δε18.7/Δε23.8 using Equation (5) in a clear sky condition is shown in Figure 5. According to the figure, there is a linear relationship between original Δε18.7/Δε23.8 and the estimated Δε18.7/Δε23.8. The linear relationship between the two Δε18.7/Δε23.8 datasets proves that Equation (5) can be used to do an initial estimate of the real Δε18.7/Δε23.8.
The results of surface emissivity polarization difference ratio (Δε18.7/Δε23.8) in a cloudy sky condition calculated using Equation (5) is still a preliminary result for retrieval of TPW [16]. A great uncertainty might be caused if the preliminary result of Δε18.7/Δε23.8 was directly used to retrieve TPW. Therefore, a calibration equation mentioned in [16,17] was used in this study to further improve the accuracy of the estimated Δε18.7/Δε23.8. The calibration equation is shown in Equation (6):
where is the value of Δε18.7/Δε23.8 in the pixel; is mean value of 15×15 pixels whose center pixel is ; is the value of ΔTb18.7/ΔTb23.8 in the pixel that has the same location as ; and is the mean value of 15 × 15 pixels whose center pixel is . On the basis of Equation (6), the calibrated results of surface emissivity polarization difference ratio (Δε18.7/Δε23.8) in clear and cloudy sky can be used to retrieve global TPW.
4. TPW Retrieval and Results Comparison
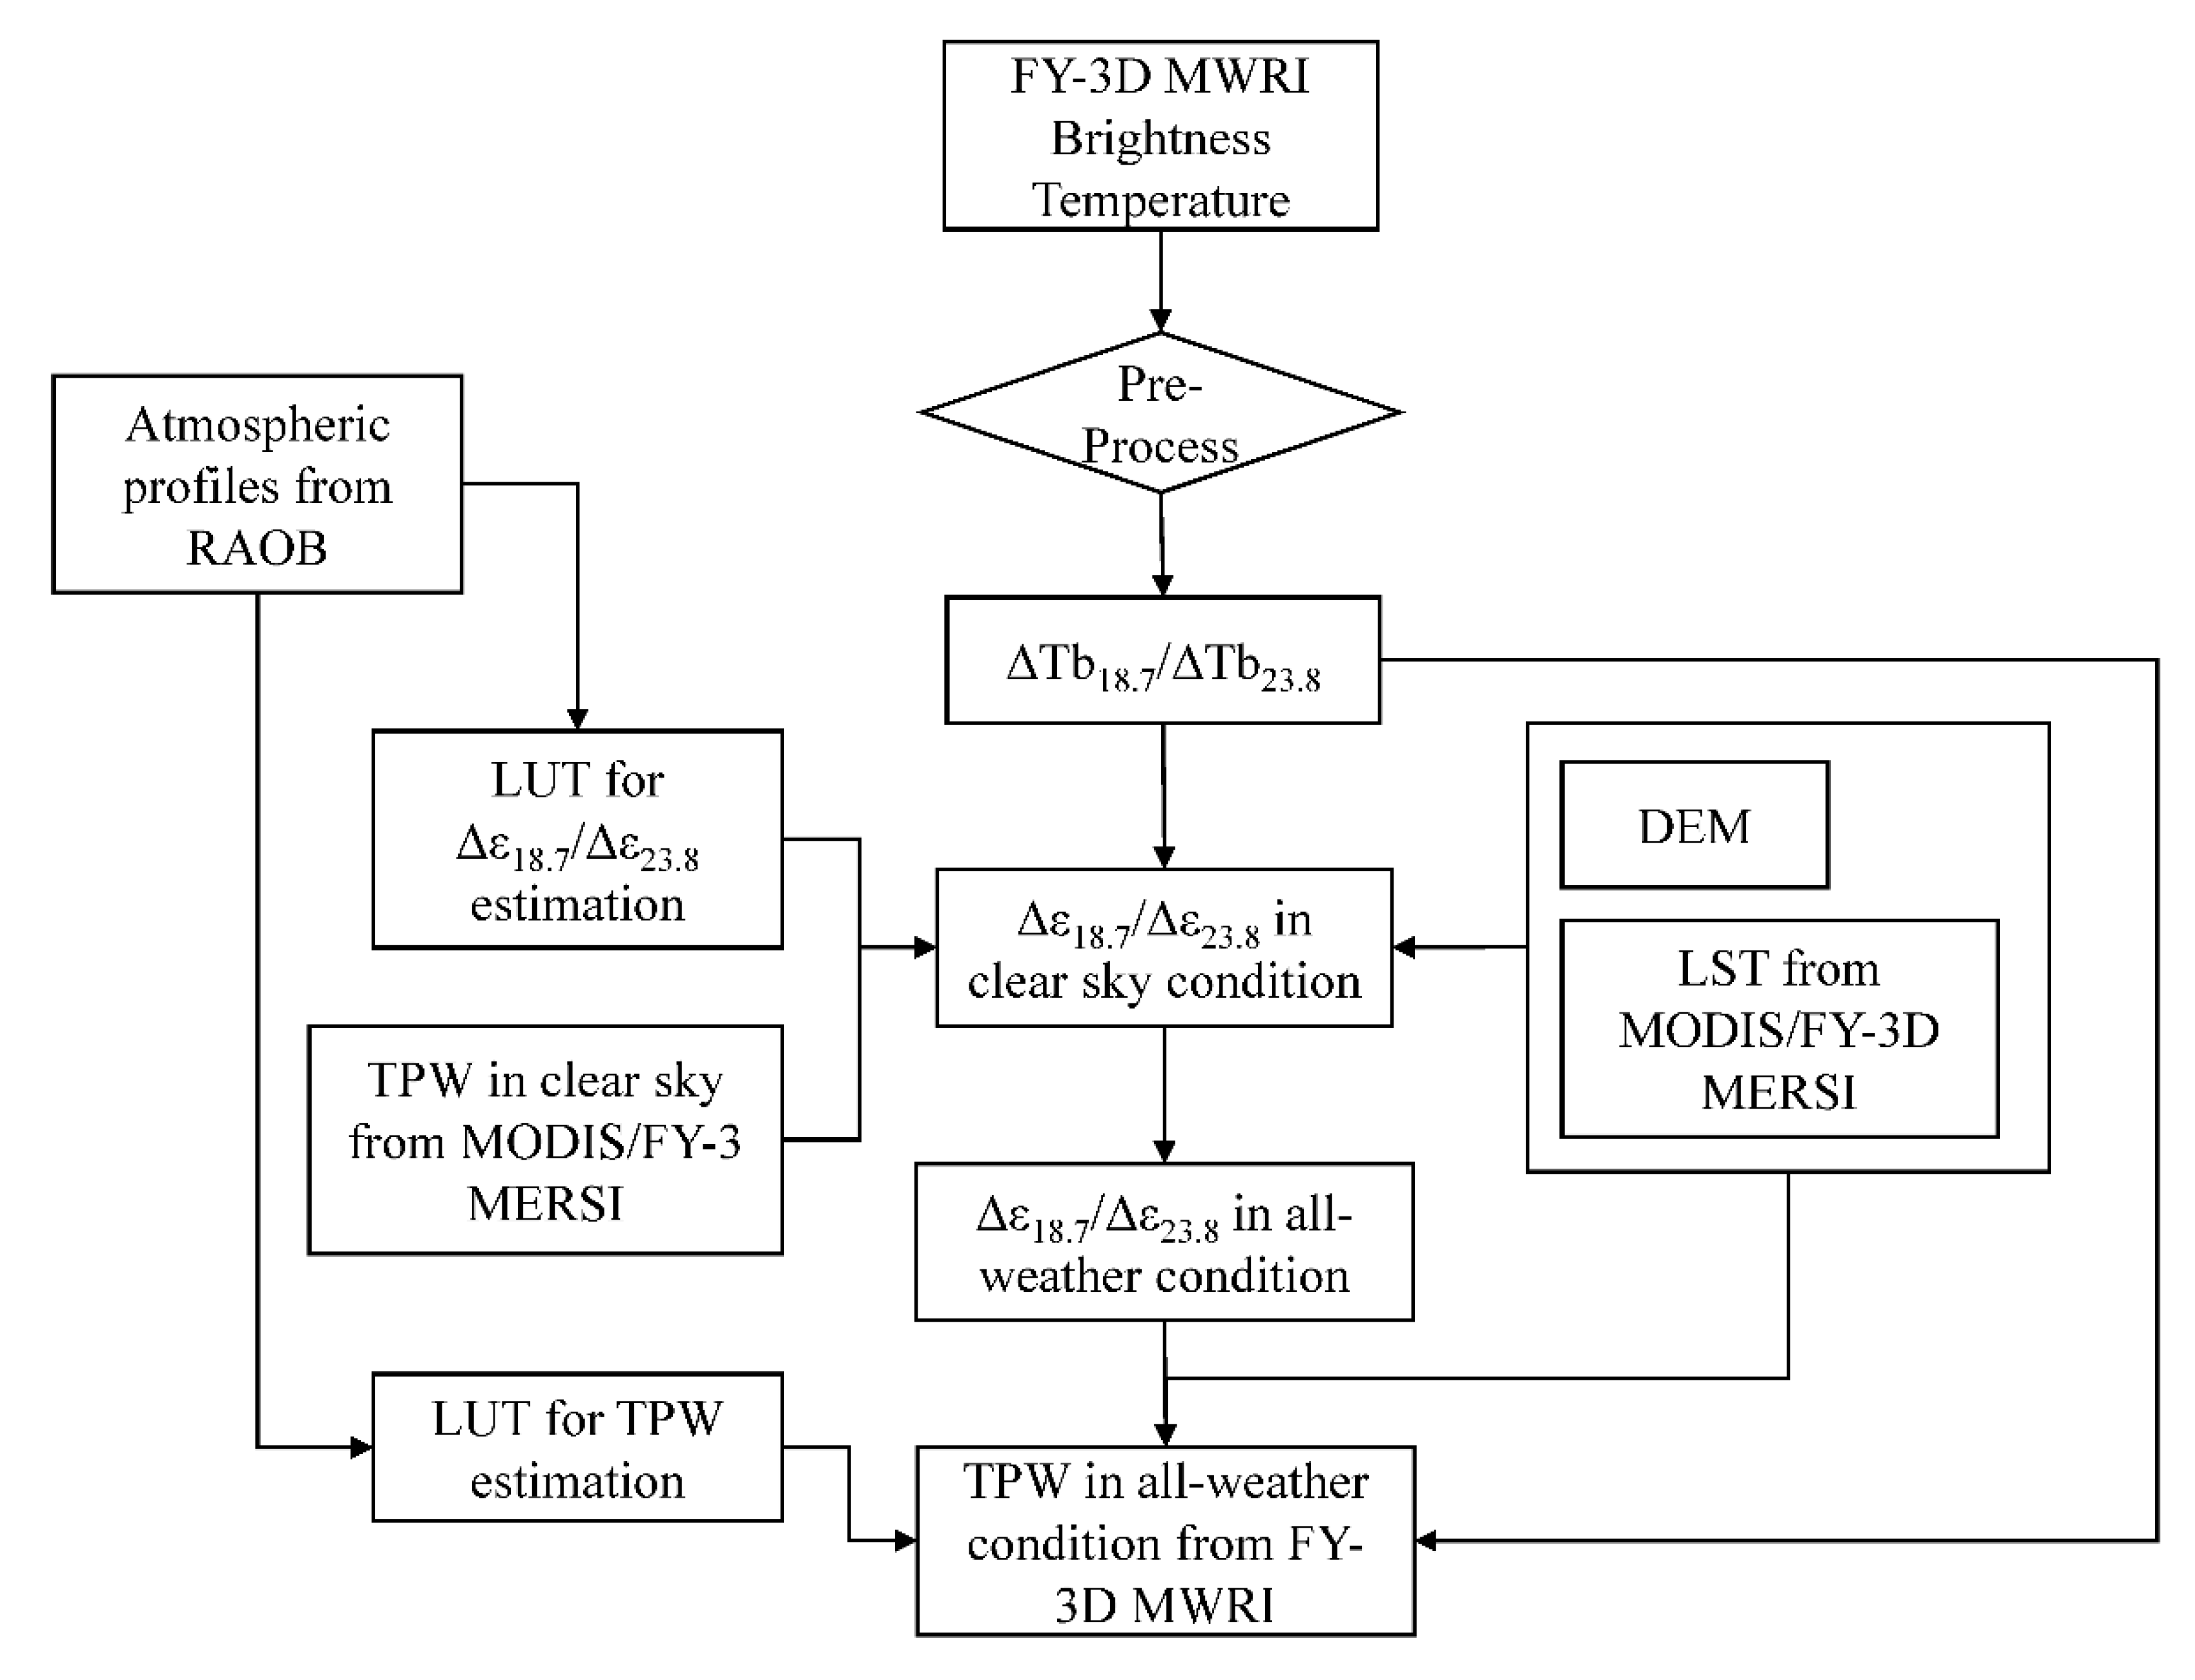
The retrieval of TPW is based on the water vapor sensitivity parameter ΔTb18.7/ΔTb23.8. As a preprocess, all remote sensing datasets were reprojected into a 0.25° × 0.25° grid image. In the reprojection, a mean value was used to fill the grid when multiple pixels were located in the same grid. In order to distinguish between clear and cloudy sky conditions, the cloud mask obtained from Aqua MODIS cloud product was used. The grid was defined as a cloudy grid if the number of cloud pixels in the grid was greater than 60%. One of the key steps in the retrieval of TPW is to estimate surface emissivity parameter Δε18.7/Δε23.8 in a clear sky condition. The estimation was based on water vapor products from Aqua MODIS and FY-3D MERSI, and brightness temperature from FY-3D MWRI using a Δε18.7/Δε23.8 retrieval lookup table. Then the emissivity parameter Δε18.7/Δε23.8 in a cloudy sky condition was estimated based on the emissivity parameter Δε18.7/Δε23.8 in a clear sky condition and an improved multiple linear regression function that was created to suit the band configuration of FY-3D MWRI. Finally, the TPW was retrieved based on the pre-estimated land surface parameters and ΔTb18.7/ΔTb23.8 using a TPW retrieval lookup table. Figure 6 shows a flowchart of the TPW retrieval process. Detailed description of the TPW retrieval algorithm is described in the following sections.
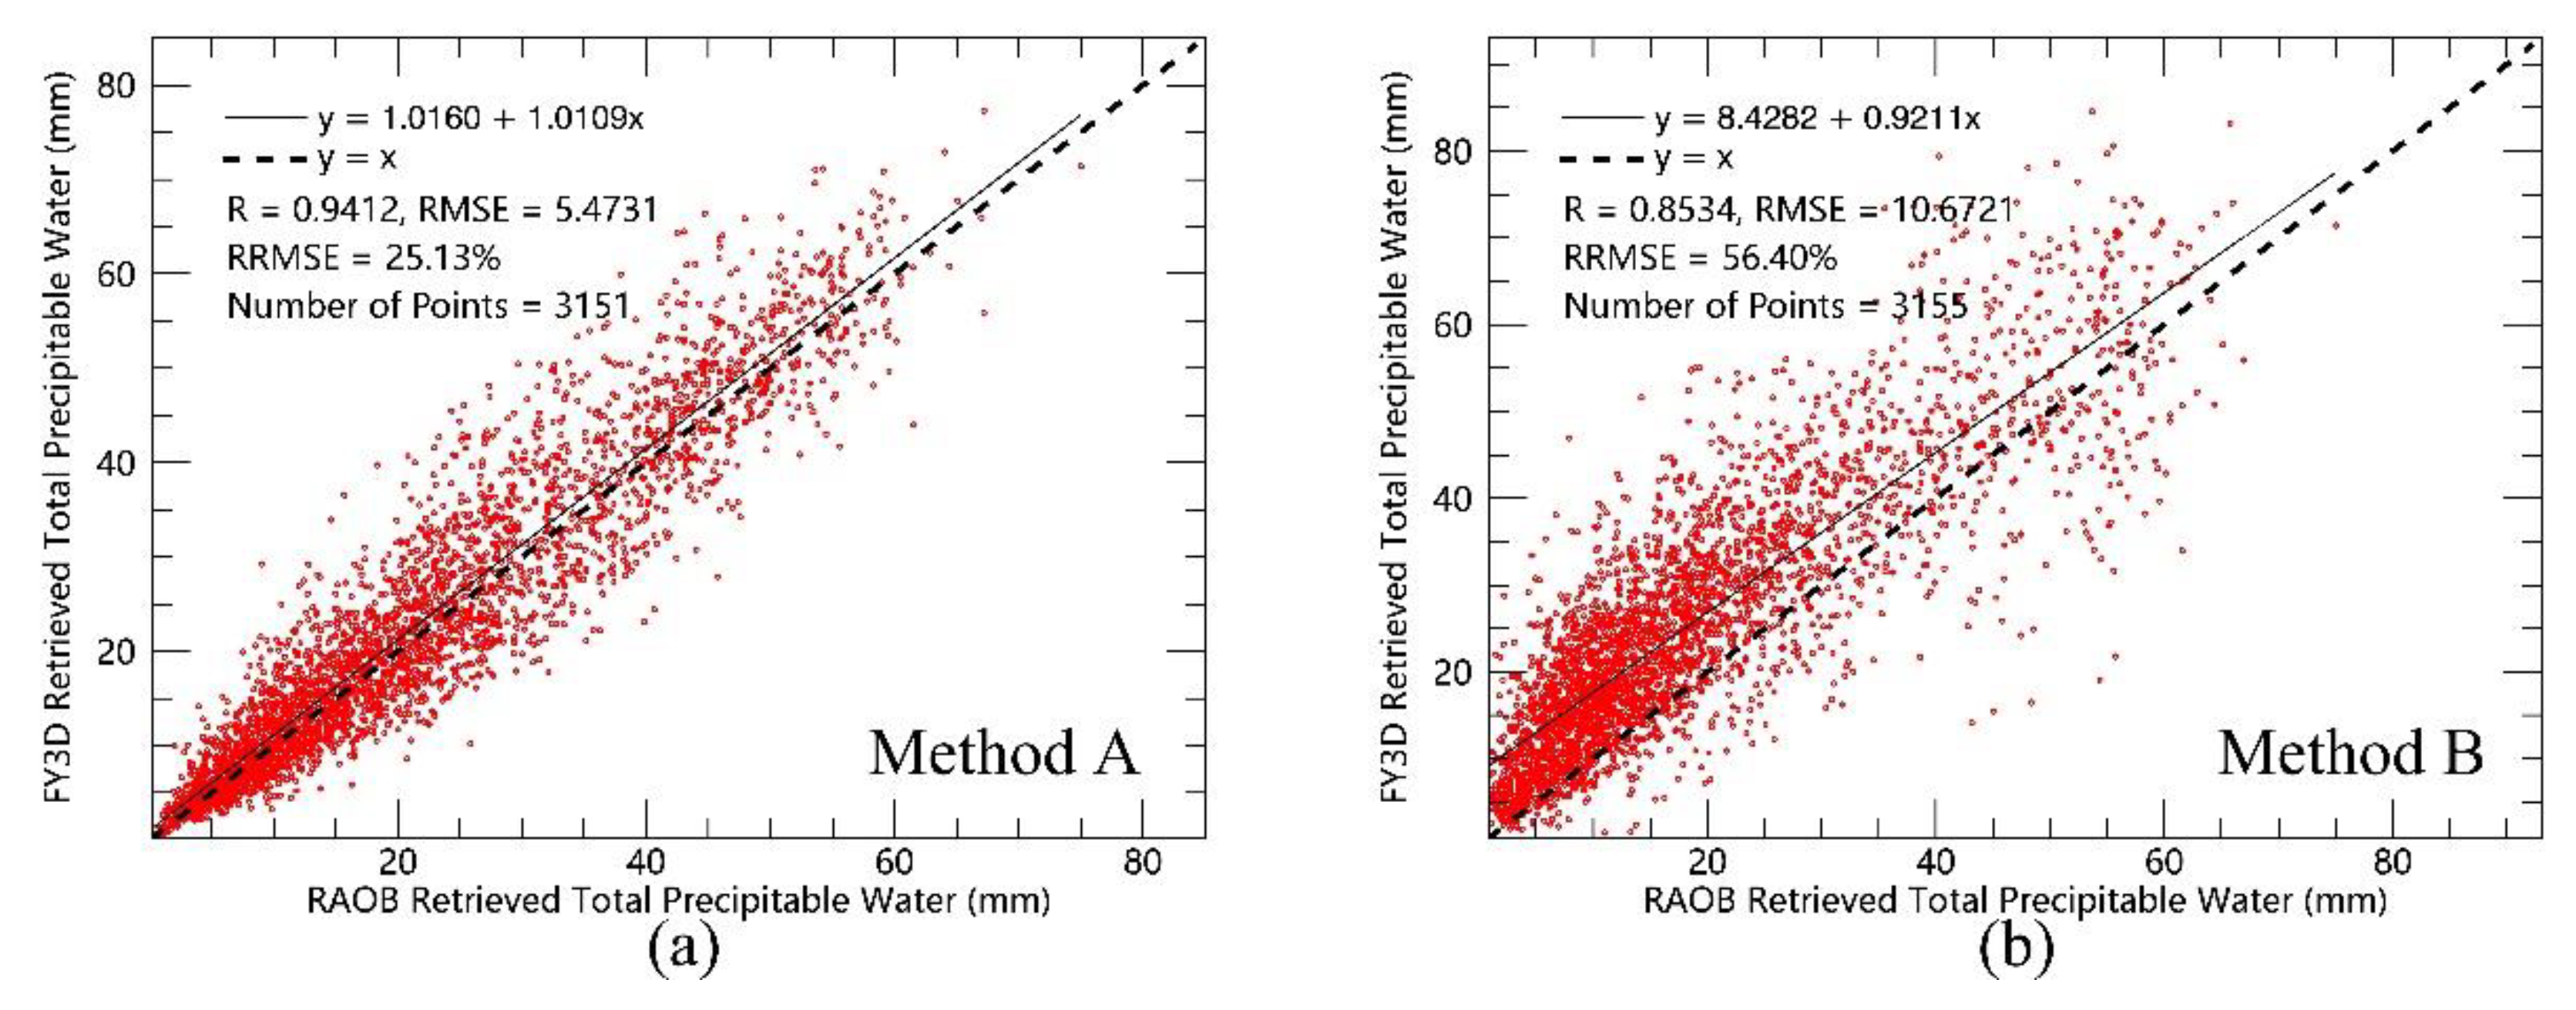
According to the discussion in Section 3.1, Equation (2) is the basic equation in the retrieval of TPW. However, it is hard to directly calculate the TPW from Equation (2) due to the complexity of the equation. In view of the convenience of the retrieval algorithm, a lookup table method was used in the retrieval of TPW. The TPW retrieval lookup table was built using the same model and input datasets that were used to build the lookup table for the estimation of Δε18.7/Δε23.8. However, the structure of the TPW retrieval lookup table is different from the lookup table for estimating Δε18.7/Δε23.8. There are also five fields in the TPW retrieval lookup table, including surface elevation, surface temperature, Δε18.7/Δε23.8, total precipitable water, and ΔTb18.7/ΔTb23.8. If the surface elevation, land surface temperature, Δε18.7/Δε23.8, and ΔTb18.7/ΔTb23.8 are known, then the TPW is retrieved by searching the lookup table. Land surface elevation can be obtained from the DEM of the FY3D MWRI level 1 brightness temperature product. ΔTb18.7/ΔTb23.8 comes from 18.7 and 23.8 GHz brightness temperature of the FY3D MWRI level 1 brightness temperature product. The estimation of LST and Δε18.7/Δε23.8 were discussed in Section 3. When all these input parameters are ready, the TPW is retrieved according to the lookup table. As there are two methods to estimate Δε18.7/Δε23.8, which were mentioned in Section 3.2 and 3.3, both Δε18.7/Δε23.8 datasets in an all-weather condition were used in the retrieval of TPW for FY-3D MWRI. Based on the TPW retrieval method mentioned above, two TPW datasets over land with a spatial resolution of 0.25° × 0.25° in an all-weather condition in the year 2018 were retrieved using brightness temperature from FY-3D MWRI. In the retrieval of the two TPW datasets, one of the TPW datasets was retrieved based on the surface emissivity parameter Δε18.7/Δε23.8 that was estimated using Method A (Aqua MODIS LST and TPW products were used in the retrieval of Δε18.7/Δε23.8 in a clear sky condition). The other TPW dataset was retrieved based on Δε18.7/Δε23.8 that was estimated using Method B (FY-3D MERSI LST and TPW products were used in the retrieval of Δε18.7/Δε23.8 in a clear sky condition). As a validation, the two retrieved TPW datasets in an all-weather condition (except for a precipitation condition) were validated using TPW observations from RAOB. The validation of the two TPW datasets is shown in Figure 7. Figure 7a shows the comparison between TPW datasets retrieved using Method A and TPW observed from RAOB. According to the figure, the correlation coefficient, RMSE, and relative RMSE (RRMSE) of the two TPW datasets are 0.94, 5.47 mm, and 25.13%, respectively. Figure 7b shows the comparison between TPW datasets retrieved using Method B and TPW observed from RAOB. From the figure, the correlation coefficient, RMSE, and RRMSE of the two TPW datasets are 0.85, 10.67 mm, and 56.4%, respectively. According to the comparison of the two plots in Figure 7, the TPW retrieved using Method A is better than the TPW retrieved using Method B, the reason is that the quality of LST and TPW from Aqua MODIS is better than the quality of LST and TPW from FY-3D MERSI. Thus, LST and TPW in a clear sky condition from Aqua MODIS are more suitable ancillary datasets in the TPW retrieval algorithm for FY-3D MWRI. For convenience, only the retrieved TPW using Method A that is from FY-3D MWRI is used in the following validation and comparison part.
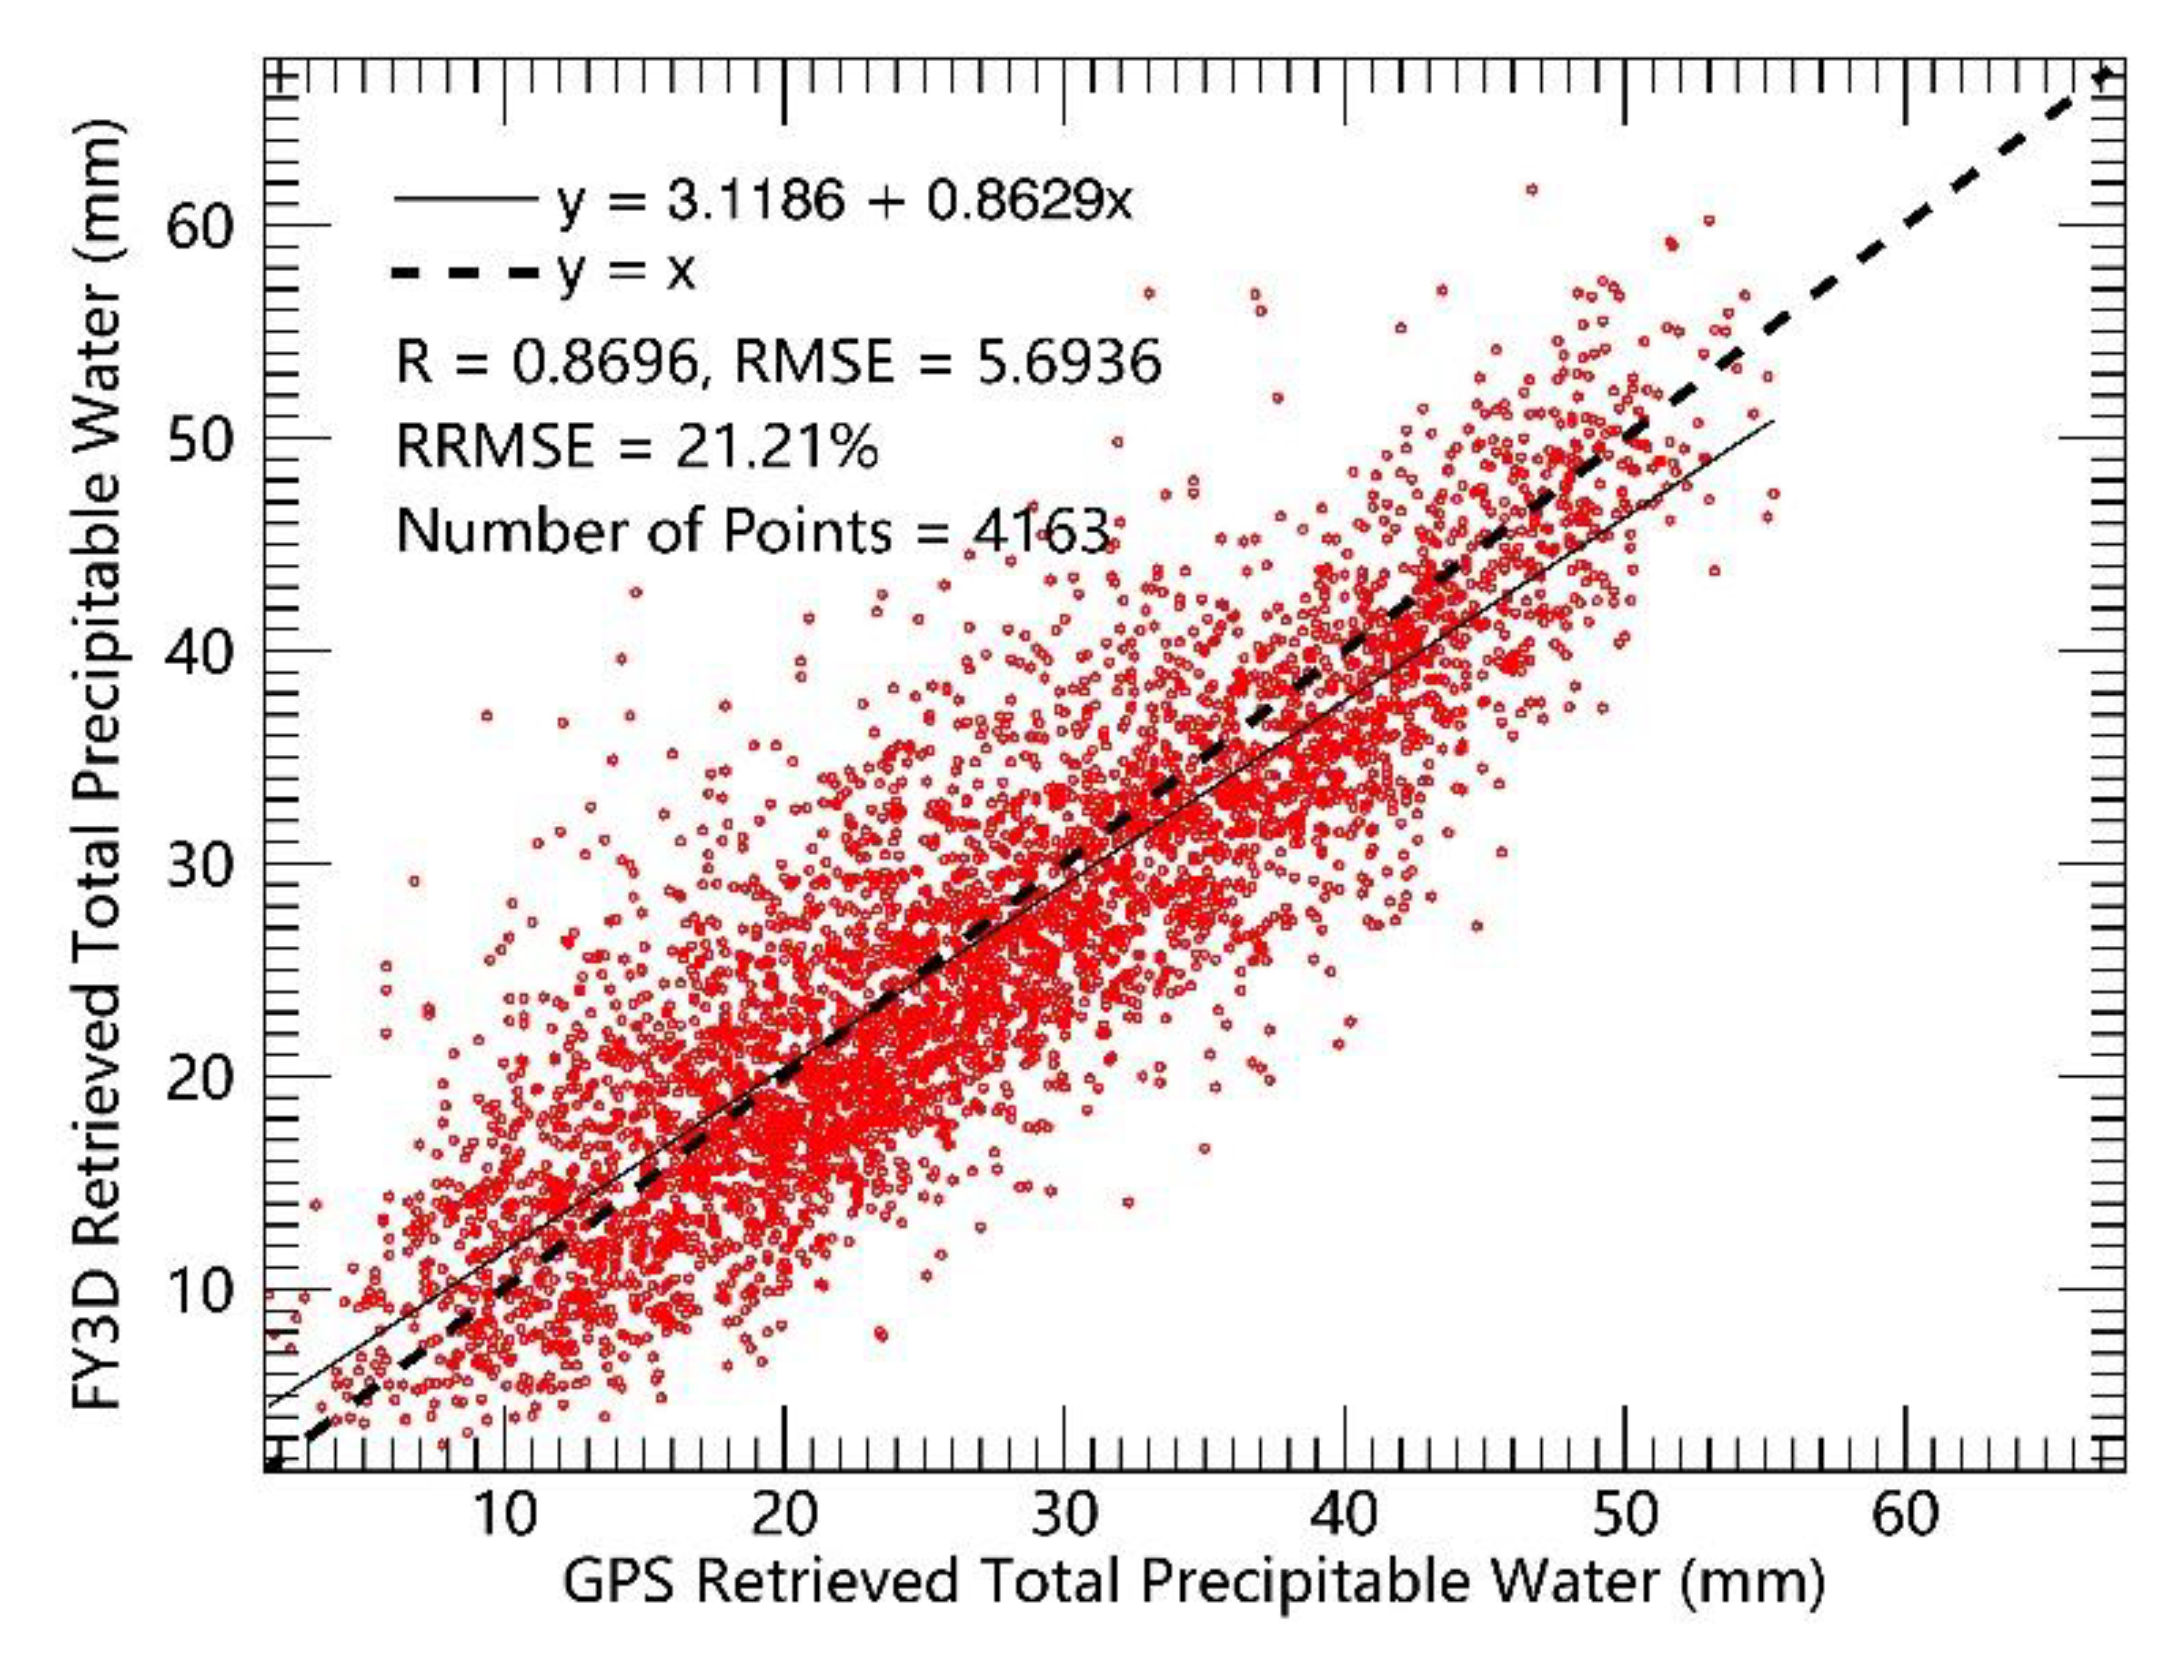
As another validation, TPW derived from the SuomiNET GPS global network was used to further validate the precision of retrieved TPW from FY-3D MWRI using Method A. Figure 8 presents the validation of the retrieved TPW in the year 2018 using TPW observations from the global SuomiNET GPS network. According to the validation, the correlation coefficient, RMSE, and RRMSE are 0.87, 5.69 mm, and 21.21%, respectively.
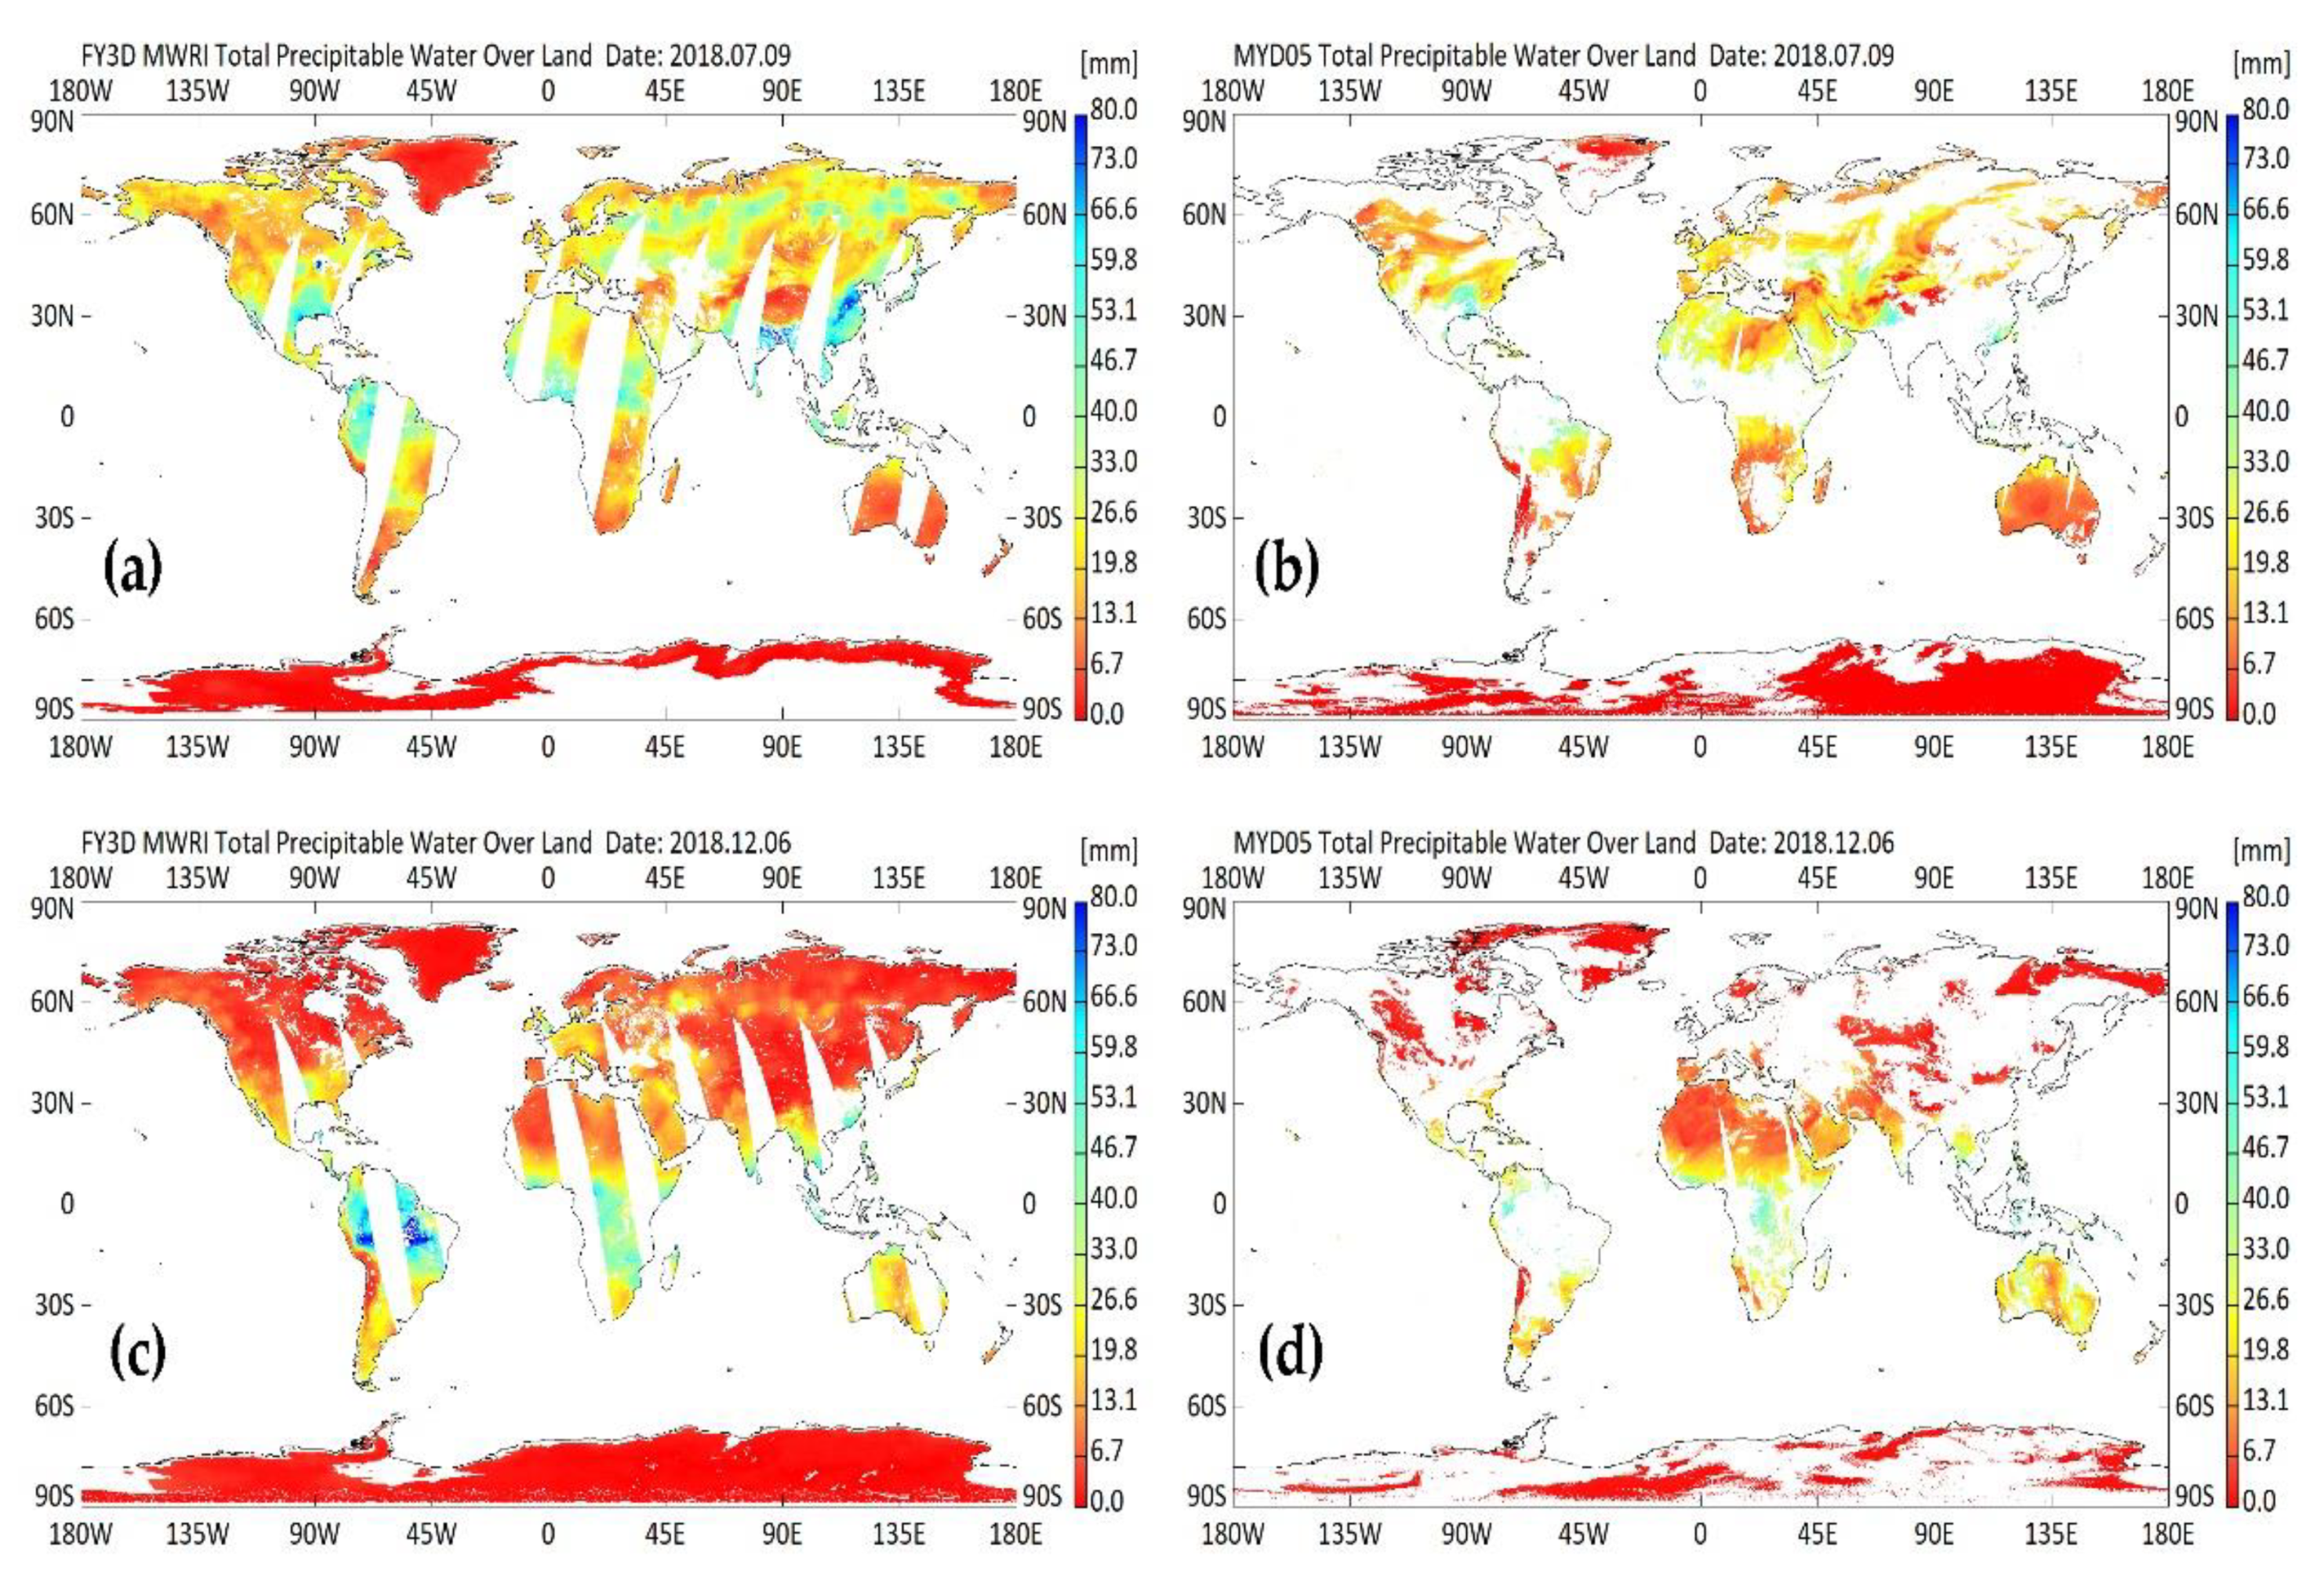
Besides quantitative validation using observation from the ground network, comparison in spatial distribution is also a good way to qualitatively validate the retrieved TPW from FY-3D MWRI. Figure 9 shows a comparison between daily global quarter-degree gridded TPW retrieved from FY-3D over land and TPW derived from Aqua MODIS. Figure 9a presents a daily global TPW retrieved from FY-3D MWRI in descending orbit on 9 July 2018. As a comparison, Figure 9b shows a daily global TPW derived from Aqua MODIS on the same day in descending orbit. Figure 9c,d present the same comparison between TPW from FY-3D MWRI and Aqua MODIS on 6 December 2018 in ascending orbit. According to the comparison of the four maps in Figure 9, TPW datasets derived from FY-3D MWRI and Aqua MODIS have similar spatial distribution characteristics in the areas where the two TPW datasets are both available. In addition, the TPW from FY-3D MWRI has a better spatial coverage than TPW from Aqua MODIS, because the radiometer FY-3D MWRI has an advantage to retrieve TPW in an all-weather condition.
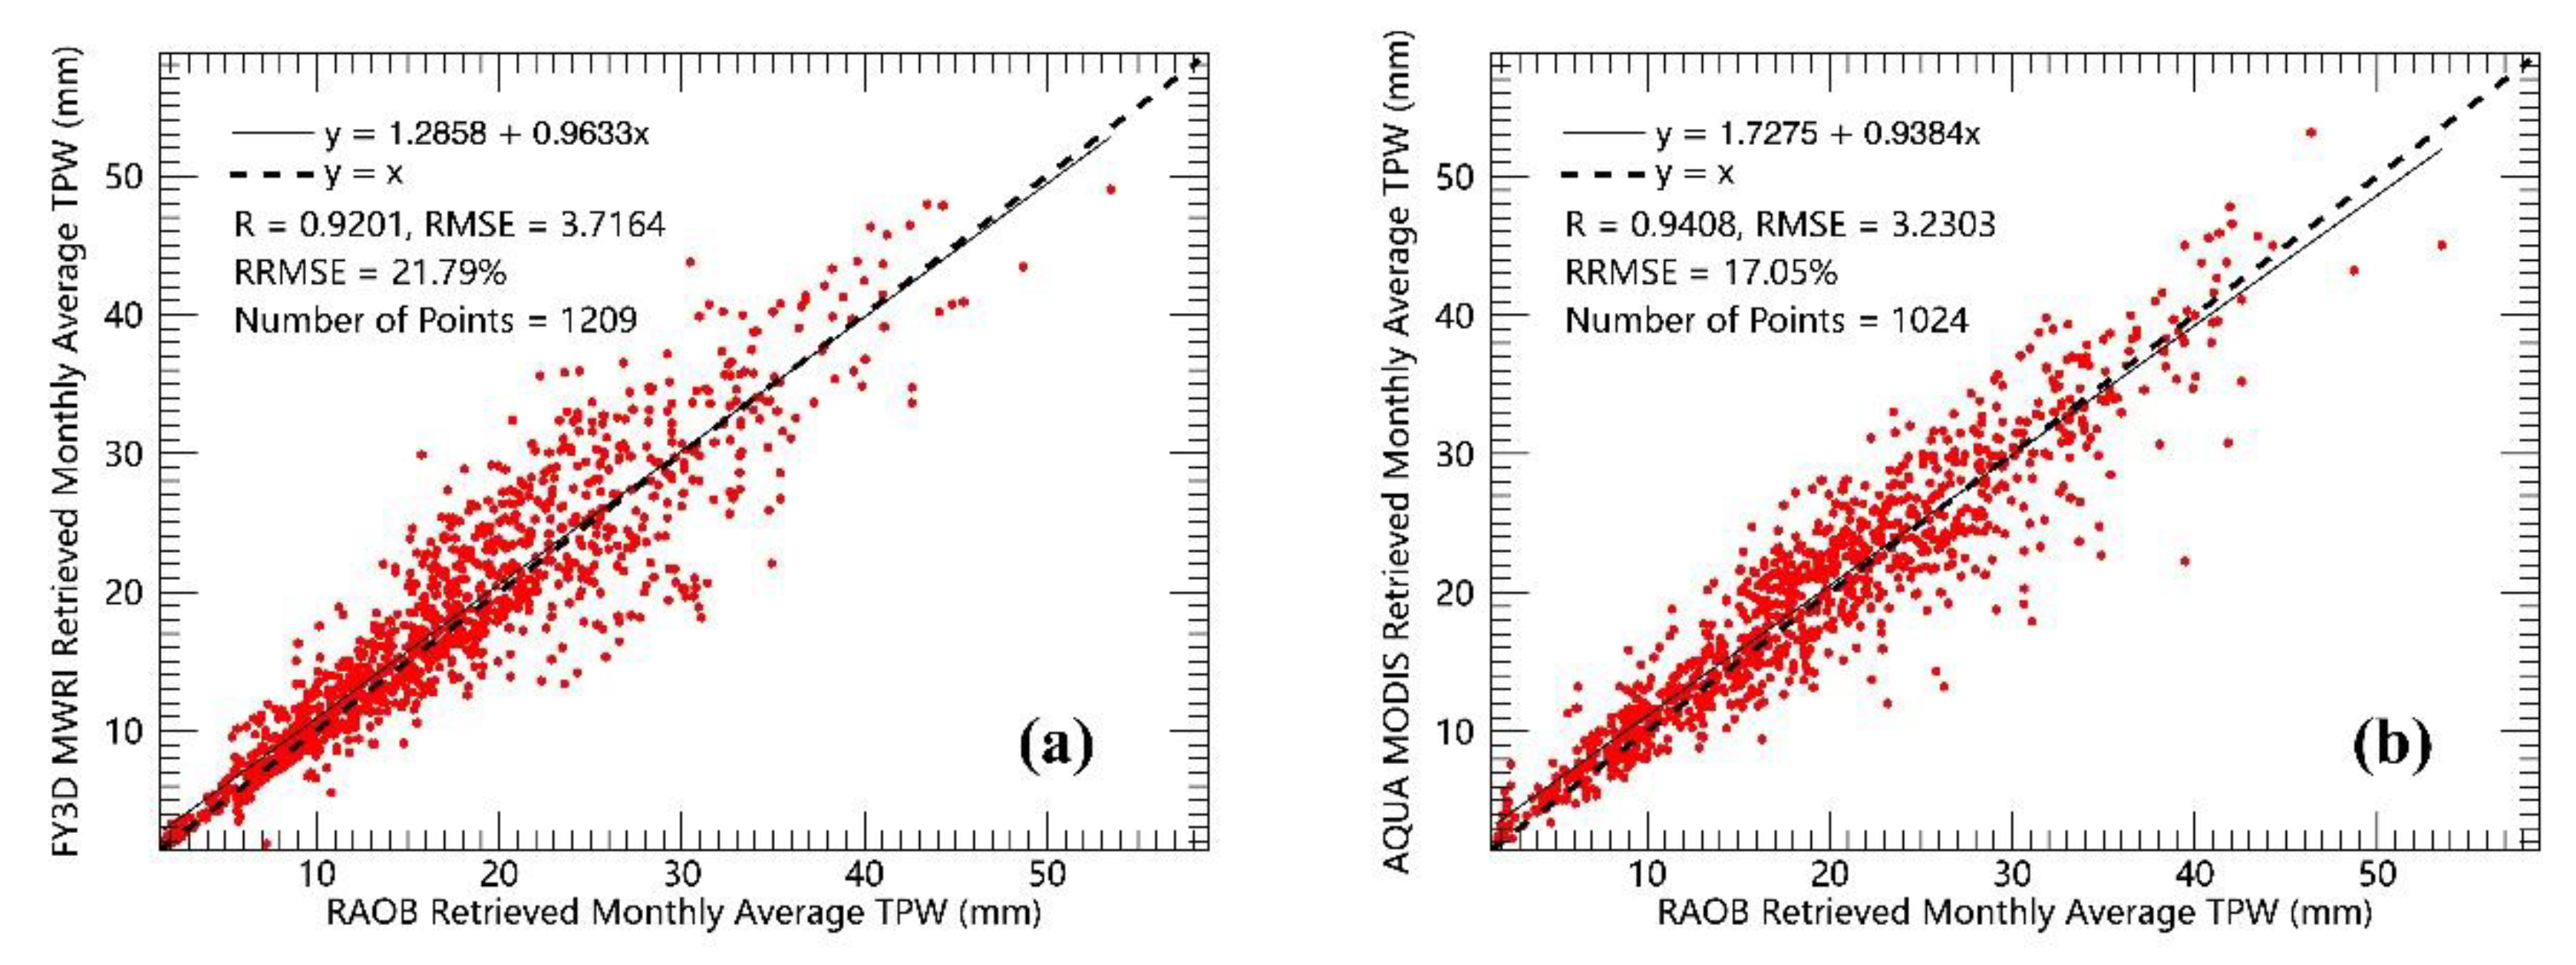
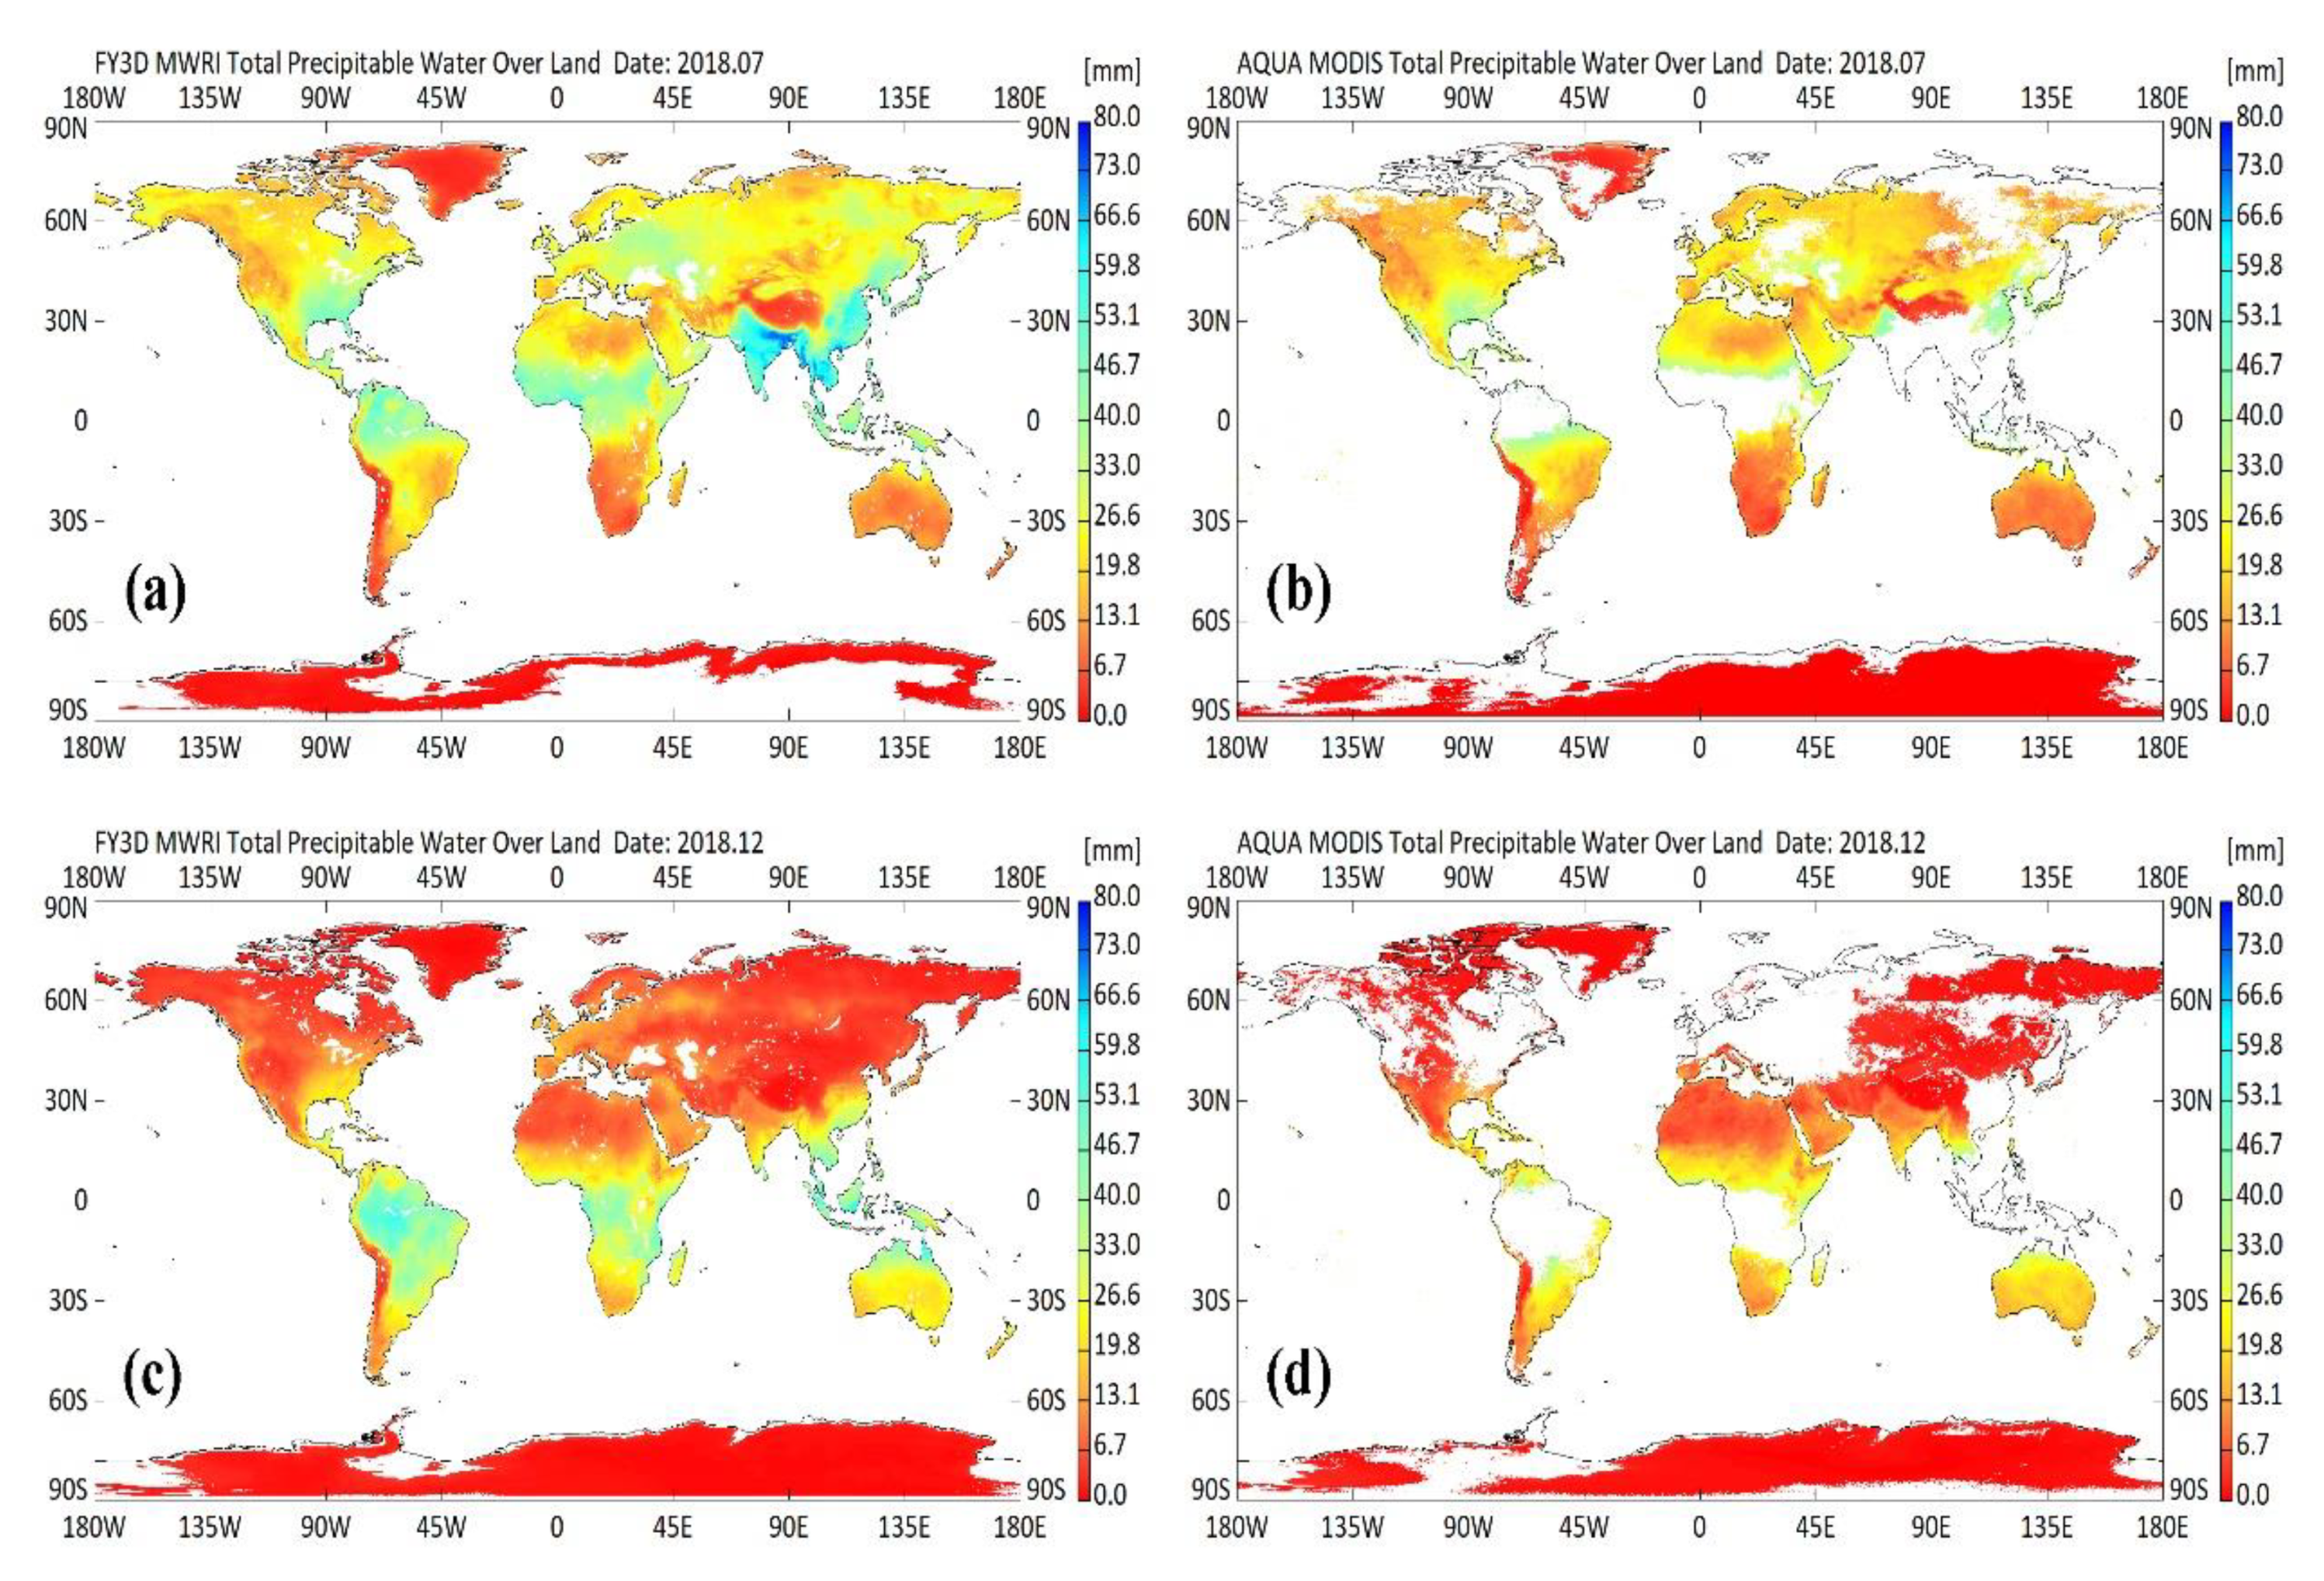
Monthly average of TPW is also an important parameter in long-term trend analysis of changing climate. Therefore, it is necessary to validate TPW on a monthly average scale. Figure 10 presents validation of TPW from FY-3D MWRI and Aqua MODIS using observations from RAOB on a monthly average scale at the spatial resolution of 0.25° × 0.25°. When calculating monthly average TPW for each pixel, not all of the pixels have enough valid TPWs in a month due to the influence of clouds or lack of observations. Therefore, the monthly average TPW is only calculated on the pixels which have valid values on at least 16 days in a month. Figure 10a shows validation of monthly average TPW from FY-3D MWRI using observations from RAOB and Figure 10b shows validation of monthly average TPW from Aqua MODIS using observations from RAOB. According to Figure 10, the correlation coefficient, RMSE, and RRMSE of the monthly average TPW from FY-3D MWRI are 0.92, 3.72 mm, and 21.79%, respectively. As a comparison, the correlation coefficient, RMSE, and RRMSE of the monthly average TPW from Aqua MODIS are 0.94, 3.23 mm, and 17.05%, respectively. According to the comparison in Figure 10, the accuracy of monthly average TPW from Aqua MODIS is slightly better than that from FY-3D MWRI. However, the monthly average TPW from Aqua MOIDS is not available when a month is too cloudy. As is shown in Figure 11b,d, there are many missing values in the monthly average TPW from Aqua MODIS in tropical regions and high latitudes of the north hemisphere due to the influence of clouds. As a contrast, Figure 11a,c presents the distribution of monthly average TPW from FY-3D MWRI. According to the two figures, the monthly average TPW from FY-3D MWRI covers almost all land areas except Antarctica, which is an advantage of FY-3D MWRI compared to Aqua MODIS in calculating monthly average TPW.
5. Conclusions
FY-3D is the second-generation environmental satellite of China. FY-3D has provided lots of products to the public. However, the TPW product in an all-weather condition over land is not available for FY-3D currently. Therefore, an improved TPW retrieval algorithm was developed according to the characteristics of FY-3D MWRI to create TPW in all-weather conditions (except for a precipitation condition) over land.
The major improvements in the TPW retrieval algorithm for FY-3D MWRI include two aspects. One is the comparison of a different source for TPW and LST products on the retrieval of surface emissivity parameter Δε18.7/Δε23.8 in a clear sky condition in order to find the best ancillary datasets for retrieval of TPW using FY-3D MWRI. The other is the improvement of the surface emissivity parameter Δε18.7/Δε23.8 estimation function in cloudy conditions according to the band configuration of FY-3D MWRI. Based on these improvements, the TPW in an all-weather condition was retrieved using two schemes. In one scheme, the data used in the retrieval include brightness temperatures from FY-3D MWRI and TPW and LST products in a clear sky condition from Aqua MODIS. In the other scheme, the data used in the retrieval include brightness temperature from FY-3D MWRI and TPW and LST products in a clear sky condition from FY-3D MERSI. Finally, ground observations from RAOB and SuomiNet GPS were used to validate the retrieved TPW.
According to the comparison between observations from the global RAOB network and the TPW retrieved using observations from FY-3D MWRI and Aqua MODIS, the correlation coefficient, RMSE, and RRMSE of the two TPW dataset are 0.94, 5.47 mm, and 25.13%, respectively. As a contrast, when the observations from global RAOB network were used to validate the TPW retrieved using observations from FY-3D MWRI and FY-3D MERSI, the correlation coefficient, RMSE, and RRMSE of the two TPW datasets are 0.85, 10.67 mm, and 56.4%, respectively. By testing the accuracy of the two schemes, the quality of TPW retrieved using observations from FY-3D MWRI and Aqua MODIS is better than the TPW retrieved using observations from FY-3D MWRI and FY-3D MERSI. Therefore, the observations from FY-3D MWRI and Aqua MODIS are the most appropriate data sources that are used to retrieve TPW in an all-weather condition over land using the algorithm developed in this study. In order to further validate the TPW retrieved using the combination of observations from FY-3D MWRI and Aqua MODIS, the TPW derived from the global SuomiNet GPS network was used in the validation. According to the validation, the correlation coefficient, RMSE, and RRMSE of the retrieved TPW are 0.87, 5.69 mm, and 21.21%, respectively. Besides the validation in an instantaneous scale, the TPW retrieved using a combination of observations from FY-3D MWRI and Aqua MODIS was also validated in monthly average scale using TPW derived from the RAOB network. According to the validation, the correlation coefficient, RMSE, and RRMSE are 0.92, 3.72 mm, and 21.79% respectively. As a comparison, monthly average TPW calculated from Aqua MODIS water vapor product was also validated using the same observations from RAOB network. From the validation, the correlation coefficient, RMSE, and RRMSE are 0.94, 3.23 mm, and 17.05%, respectively. Although the monthly average TPW from Aqua MODIS water vapor product shows slightly better accuracy than the monthly average TPW retrieved from FY-3D MWRI, the monthly average TPW from Aqua MODIS water vapor product is greatly affected by clouds and presents many missing values in tropical regions and high latitudes of the north hemisphere over land. However, the monthly average TPW retrieved from FY-3D MWRI is seldomly affected by clouds and presents good spatial coverage at global scale. This is an advantage of FY-3D MWRI compared to the optical sensor Aqua MODIS in retrieval of TPW.
Author Contributions
Conceptualization, D.J. and B.D.; Methodology, D.J. and B.D.; Validation, B.D.; Formal analysis, B.D.; Resources, D.J. and J.S.; Data curation, B.D., Y.W., T.L., P.Z. and H.L.; Writing—original draft preparation, B.D.; Writing—review and editing, D.J.; Supervision, Y.W., T.L., P.Z. and H.L.; Project administration, J.S., Y.W., T.L., P.Z. and H.L.; Funding acquisition, D.J. and J.S. All authors have read and agreed to the published version of the manuscript.
Funding
This research was supported by the National Key Research and Development Program of China (Grant No. 2017YFB0504105), Key Research Program of Frontier Sciences, CAS (Grant No. QYZDY-SSW-DQC011), the Strategic Priority Research Program of Chinese Academy of Sciences (Grant No. XDA20100309), and National Natural Science Foundation of China (Grant No. 41601569).
Conflicts of Interest
The authors declare no conflict of interest.
References
- Shi, F.; Xin, J.; Yang, L.; Cong, Z.; Liu, R.; Ma, Y.; Wang, Y.; Lu, X.; Zhao, L. The first validation of the precipitable water vapor of multisensor satellites over the typical regions in China. Remote Sens. Environ. 2018, 206, 107–122. [Google Scholar] [CrossRef]
- Liu, Y.; Iz, H.B.; Chen, Y. Monitoring the water vapor content in the atmosphere in Hong Kong through ground-based GPS technique. J. Wuhan Tech. Univ. Surv. Mapp. 1999, 24, 245–248. [Google Scholar]
- Ji, D. Atmosphere Water Vapor and Cloud Liquid Water Retrieval over Cloud Cover Area on Land Using Passive Microwave Remote Sensing; Chinese Academy of Science: Beijing, China, 2012. [Google Scholar]
- Letu, H.; Yang, K.; Nakajima, T.Y.; Ishimoto, H.; Nagao, T.M.; Riedi, J.; Baran, A.J.; Ma, R.; Wang, T.; Shang, H.; et al. High-resolution retrieval of cloud microphysical properties and surface solar radiation using Himawari-8/AHI next-generation geostationary satellite. Remote Sens. Environ. 2020, 239, 111583. [Google Scholar] [CrossRef]
- Ma, R.; Husi, L.; Yang, K.; Wang, T.; Shi, C.; Xu, J.; Shi, J.; Shi, C.; Chen, L. Estimation of Surface Shortwave Radiation from Himawari-8 Satellite Data Based on a Combination of Radiative Transfer and Deep Neural Network. IEEE Trans. Geosci. Remote Sens. 2020, 1–13. [Google Scholar] [CrossRef]
- Wang, Y.; Fu, Y.; Liu, G.; Liu, Q.; Sun, L. A new water vapor algorithm for TRMM Microwave Imager (TMI) measurements based on a log linear relationship. J. Geophys. Res. 2009, 114, 1–12. [Google Scholar] [CrossRef]
- Wang, Y.; Shi, J.; Zeng, Q.; Wang, H.; Feng, W. Retrieval of precipitable water vapor over land using TRMM/VIRS thermal split window measurements. J. Remote Sens. 2016, 20, 94–102. [Google Scholar]
- Liu, H.; Tang, S.; Hu, J.; Zhang, S.; Deng, X. An improved physical split-window algorithm for precipitable water vapor retrieval exploiting the water vapor channel observations. Remote Sens. Environ. 2017, 194, 366–378. [Google Scholar] [CrossRef]
- Chang, L.; Xiao, R.; Prasad, A.A.; Gao, G.; Feng, G.; Zhang, Y. Cloud mask-related differential linear adjustment model for MODIS infrared water vapor product. Remote Sens. Environ. 2019, 221, 650–664. [Google Scholar] [CrossRef]
- Shi, J.; Jackson, T.; Tao, J.; Du, J.; Bindlish, R.; Lu, L.; Chen, K. Microwave vegetation indices for short vegetation covers from satellite passive microwave sensor AMSR-E. Remote Sens. Environ. 2008, 112, 4285–4300. [Google Scholar] [CrossRef]
- Zhang, S.; Shi, J. A microwave wetland surface emissivity calibration scheme using SCE-UA algorithm and AMSR-E brightness temperature data. Remote Sens. Environ. 2011, 10, 2731–2739. [Google Scholar] [CrossRef] [Green Version]
- Aires, F.; Prigent, C.; Rossow, W.B.; Rothstein, M. A new neural network approach including first guess for retrieval of atmospheric water, cloud liquid water path, surface temperature, and emissivities over land from satellite microwave observations. J. Geophys. Res. 2001, 106, 14887–14907. [Google Scholar] [CrossRef]
- Liu, Q.; Weng, F. One-dimensional variational retrieval algorithm of temperature, water vapor, and cloud water profiles from advanced microwave sounding unit (AMSU). IEEE Trans. Geosci. Remote Sens. 2005, 43, 1087–1095. [Google Scholar]
- Deeter, M.N. A new satellite method for retrieving precipitable water vapor over land and ocean. Geophys. Res. Lett. 2007, 34, L02815-1–L02815-5. [Google Scholar] [CrossRef]
- Wang, Y. The Study of Algorithms for Retrieving Atmospheric Parameters by Passive Microwave Remote Sensing and Atmospheric Correction for Passive Microwave Remote Sensing; Chinese Academy of Science: Beijing, China, 2010. [Google Scholar]
- Ji, D.; Shi, J. Water vapor retrieval over cloud cover area on land using AMER-E and MODIS. IEEE J. Sel. Top. Appl. Earth Obs. Remote Sens. 2014, 7, 3105–3116. [Google Scholar] [CrossRef]
- Ji, D.; Shi, J.; Xiong, C.; Wang, T.; Zhang, Y. A total precipitable water retrieval method over land using the combination of passive microwave and optical remote sensing. Remote Sens. Environ. 2017, 191, 313–327. [Google Scholar] [CrossRef]
- Gao, D.; Fan, G.; Fan, Y.; Zhang, X.; He, Y.; Yu, Z. 3D visualization of humidity distribution from FY-3 MWHS and its application to severe weather monitoring. Remote Sens. Land Resour. 2014, 26, 139–143. [Google Scholar]
- Yang, J.; Jiang, L.; Wu, S.; Wang, G.; Wang, J.; Liu, X. Development of a snow depth estimation algorithm over China for the FY3D/MWRI. Remote Sens. 2019, 11, 977. [Google Scholar] [CrossRef] [Green Version]
- Zhang, P.; Lu, Q.F.; Hu, X.Q.; Gu, S.Y.; Yang, L.; Min, M.; Chen, L.; Xu, N.; Sun, L.; Bai, W.G.; et al. 2019: Latest progress of the Chinese meteorological satellite program and core data processing technologies. Adv. Atmos. Sci. 2019, 36, 1027–1045. [Google Scholar] [CrossRef]
- Yang, Z.D.; Zhang, P.; Gu, S.Y.; Hu, X.; Tang, S.; Yang, L.; Xu, N.; Zhen, Z.; Wang, L.; Wu, Q.; et al. 2019: Capability of Fengyun-3D satellite in earth system observation. J. Meteorol. Res. 2020, 33, 1113–1130. [Google Scholar] [CrossRef]
- Jin, C. A Study on Cloud Detection Algorithm of FengYun-3D Spectral Imager over Land; Nanjing University of Information Science & Technology: Nanjing, China, 2018. [Google Scholar]
- Zhu, A.; Hu, X.; Lin, M.; Jia, S.; Ma, Y. Global data acquisition methods and data distribution for FY-3D meteorological satellite. J. Mar. Meteorol. 2018, 38, 1–10. [Google Scholar]
- Liang, S.; Shi, J.; Yan, G. Recent progress in quantitative land remote sensing in China. Remote Sens. 2018, 10, 1490-1–1490-7. [Google Scholar] [CrossRef] [Green Version]
- Du, J.; Kimball, J.S.; Jones, L. Satellite microwave retrieval of total precipitable water vapor and surface air temperature over land from AMSR2. Trans. Geosci. Remote Sens. 2015, 53, 2520–2531. [Google Scholar] [CrossRef]
- Bevis, M.; Businger, S.; Herring, T.; Rocken, C.; Anthes, R.; Ware, R. GPS meteorology: Remote sensing of atmospheric water vapor using the global positioning system. J. Geophys. Res. 1992, 97, 15787–15801. [Google Scholar] [CrossRef]
- Ware, R.H.; Fulker, D.W.; Stein, S.A.; Anderson, D.N.; Avery, S.K.; Clark, R.D.; Droegemeier, K.K.; Kuettner, J.P.; Minster, J.B.; Sorooshian, S. SuomiNET: A real-time national GPS network for atmospheric research and education. Bull. Am. Meteorol. Soc. 2000, 81, 677–694. [Google Scholar] [CrossRef] [Green Version]
- Kummerow, C. On the accuracy of the Eddington approximation for radiative transfer in the microwave frequencies. J. Geophys. Res.-Atmos. 1993, 98, 2757–2765. [Google Scholar] [CrossRef]
- Kummerow, C.; Hong, Y.; Olson, W.S.; Yang, S.; Adler, R.F.; McCollum, J.; Ferraro, R.; Petty, G.; Shin, D.B.; Wilheit, T.T. The evolution of the Goddard Profiling Algorithm (GPROF) for rainfall estimation from passive microwave sensors. J. Appl. Meteorol. 2001, 40, 1801–1820. [Google Scholar] [CrossRef]
- Olson, W.S.; Bauer, P.; Viltard, N.F.; Johnson, D.E.; Tao, W.K.; Meneghini, R.; Liao, L. A melting-layer model for passive/active microwave remote sensing applications. Part I: Model formulation and comparison with observations. J. Appl. Meteorol. 2001, 40, 1145–1163. [Google Scholar] [CrossRef] [Green Version]
- Olson, W.S.; Bauer, P.; Kummerow, C.D.; Hong, Y.; Tao, W.K. A melting-layer model for passive/active microwave remote sensing applications. Part II: Simulation of TRMM observations. J. Appl. Meteorol. 2001, 40, 1164–1179. [Google Scholar] [CrossRef] [Green Version]
Figure 1.
Spatial distribution of the Digital Elevation Model from level 1 brightness temperature product of FY-3D Microwave Radiation Imager in 2018. Ground elevation increases from 0 to 6.5 km as shown by the color bar changes from blue to red.
Figure 1.
Spatial distribution of the Digital Elevation Model from level 1 brightness temperature product of FY-3D Microwave Radiation Imager in 2018. Ground elevation increases from 0 to 6.5 km as shown by the color bar changes from blue to red.

Figure 2.
Distribution map of total precipitable water (TPW) observation sites from the Global SuomiNET GPS network.
Figure 2.
Distribution map of total precipitable water (TPW) observation sites from the Global SuomiNET GPS network.

Figure 3.
Scatter diagram of Land Surface Temperature (LST) from global distributed radiosonde observations versus (a) Aqua MODIS LST and (b) FY-3D MERSI LST, respectively, in 2018. The dashed lines are diagonals and the solid lines are regression lines of the two comparison datasets.
Figure 3.
Scatter diagram of Land Surface Temperature (LST) from global distributed radiosonde observations versus (a) Aqua MODIS LST and (b) FY-3D MERSI LST, respectively, in 2018. The dashed lines are diagonals and the solid lines are regression lines of the two comparison datasets.

Figure 4.
Scatter diagram of RAOB TPW versus (a) Aqua MODIS TPW and (b) FY-3D MERSI TPW in 2018. The dashed lines are diagonals, and the solid lines are regression lines of the two comparison datasets.
Figure 4.
Scatter diagram of RAOB TPW versus (a) Aqua MODIS TPW and (b) FY-3D MERSI TPW in 2018. The dashed lines are diagonals, and the solid lines are regression lines of the two comparison datasets.

Figure 5.
Scatter diagram between the estimated Δε18.7/Δε23.8 and original Δε18.7/Δε23.8 in a clear sky condition.
Figure 5.
Scatter diagram between the estimated Δε18.7/Δε23.8 and original Δε18.7/Δε23.8 in a clear sky condition.

Figure 6.
Flowchart of total precipitable water retrieval used for this study.

Figure 7.
Validation of retrieved TPW datasets using RAOB observations. (a) FY-3D MWRI TPW retrieved using Method A and (b) FY-3D MWRI TPW retrieved using Method B.
Figure 7.
Validation of retrieved TPW datasets using RAOB observations. (a) FY-3D MWRI TPW retrieved using Method A and (b) FY-3D MWRI TPW retrieved using Method B.

Figure 8.
Comparison between TPW retrieved from FY-3D MWRI using Method A and TPW derived from the global SuomiNET GPS network in the year 2018.
Figure 8.
Comparison between TPW retrieved from FY-3D MWRI using Method A and TPW derived from the global SuomiNET GPS network in the year 2018.

Figure 9.
Comparison of daily global quarter-degree gridded TPW over land between FY-3D MWRI and Aqua MODIS. (a) TPW retrieved from FY-3D MWRI in descending orbit on 9 July 2018, (b) TPW derived from Aqua MODIS in descending orbit on 9 July 2018, (c) TPW retrieved from FY-3D MWRI in ascending orbit on 6 December 2018, and (d) TPW derived from Aqua MODIS in ascending orbit on 6 December 2018.

Figure 10.
Validation of monthly average TPW using TPW observations from RAOB. (a) Validation of monthly average TPW from FY-3D MWRI and (b) validation of monthly average TPW from Aqua MODIS.
Figure 10.
Validation of monthly average TPW using TPW observations from RAOB. (a) Validation of monthly average TPW from FY-3D MWRI and (b) validation of monthly average TPW from Aqua MODIS.

Figure 11.
Comparison of monthly average TPW between FY3D MWRI and Aqua Modis in spatial scale. The monthly average TPW from FY-3D MWRI are shown for July 2018 (a) and December 2018 (c); (b,d) show the monthly average TPW from Aqua MODIS for July 2018 and December 2018, respectively.
Figure 11.
Comparison of monthly average TPW between FY3D MWRI and Aqua Modis in spatial scale. The monthly average TPW from FY-3D MWRI are shown for July 2018 (a) and December 2018 (c); (b,d) show the monthly average TPW from Aqua MODIS for July 2018 and December 2018, respectively.


Table 1.
The parameters of FY-3D MWRI.
| Frequency (GHz) | Polarization (V: Vertical H: Horizontal) | Spatial Resolution (km × km) | Calibration Accuracy (K) | Sensitivity (K) | Band Width (MHz) |
|---|---|---|---|---|---|
| 10.65 | V H | 51 × 85 | 2.0 | 0.5 | 180 |
| 18.7 | V H | 30 × 50 | 2.0 | 0.5 | 200 |
| 23.8 | V H | 27 × 45 | 2.0 | 0.5 | 400 |
| 36.5 | V H | 18 × 30 | 2.0 | 0.5 | 900 |
| 89 | V H | 9 × 15 | 2.0 | 0.5 | 3000 |
Table 2.
Comparison table of land surface temperature (LST) data.
| Sensor | Satellite | Data Set | Temporal Resolution | Spatial Resolution |
|---|---|---|---|---|
| Aqua | Modis | MYD11-A2 | 8 Day | 1 km |
| FY-3D | MERSI | LST | Daily | 25 km |
© 2020 by the authors. Licensee MDPI, Basel, Switzerland. This article is an open access article distributed under the terms and conditions of the Creative Commons Attribution (CC BY) license (http://creativecommons.org/licenses/by/4.0/).
Share and Cite
MDPI and ACS Style
Du, B.; Ji, D.; Shi, J.; Wang, Y.; Lei, T.; Zhang, P.; Letu, H. The Retrieval of Total Precipitable Water over Global Land Based on FY-3D/MWRI Data. Remote Sens. 2020, 12, 1508. https://0-doi-org.brum.beds.ac.uk/10.3390/rs12091508
AMA Style
Du B, Ji D, Shi J, Wang Y, Lei T, Zhang P, Letu H. The Retrieval of Total Precipitable Water over Global Land Based on FY-3D/MWRI Data. Remote Sensing. 2020; 12(9):1508. https://0-doi-org.brum.beds.ac.uk/10.3390/rs12091508
Chicago/Turabian StyleDu, Baolong, Dabin Ji, Jiancheng Shi, Yongqian Wang, Tianjie Lei, Peng Zhang, and Husi Letu. 2020. "The Retrieval of Total Precipitable Water over Global Land Based on FY-3D/MWRI Data" Remote Sensing 12, no. 9: 1508. https://0-doi-org.brum.beds.ac.uk/10.3390/rs12091508
Note that from the first issue of 2016, this journal uses article numbers instead of page numbers. See further details here.