Landslide Detection with Himawari-8 Geostationary Satellite Data: A Case Study of a Torrential Rain Event in Kyushu, Japan


1
Department of Natural Resources and Environmental Management, University of Hawai‘i at Mānoa, Honolulu, HI 96822, USA
2
Earth Surface System Research Center, Research Institute for Global Change, Japan Agency for Marine-Earth Science and Technology, Yokohama, Kanagawa 236-0001, Japan
*
Author to whom correspondence should be addressed.
Remote Sens. 2020, 12(11), 1734; https://0-doi-org.brum.beds.ac.uk/10.3390/rs12111734
Submission received: 16 April 2020
/
Revised: 25 May 2020
/
Accepted: 26 May 2020
/
Published: 28 May 2020
(This article belongs to the Special Issue Earth Monitoring from A New Generation of Geostationary Satellites)
Abstract
:In this study, we investigated the utility of Himawari-8 Advanced Himawari Imager (AHI), one of third-generation geostationary satellite sensors, for mapping landslides caused by torrential rain that hit the northern Kyushu area in Japan in the summer of 2017. AHI normalized difference vegetation index (NDVI) time series data had distinctive temporal signatures over landslide areas where the NDVI abruptly decreased after the rain event. The observed changes in the NDVI were linearly correlated with the percent landslide area, the percentage of landslide areas within the AHI pixel footprint, obtained with aerial survey (r = 0.78). AHI 10 min resolution data obtained near cloud-free coverage of the landslide region by the 8th day after the disaster event. This was comparable to the amount of time it took to obtain near cloud-free image coverage with aerial survey, and better than those with the polar-orbiting satellite sensors of Suomi National Polar-orbiting Partnership Visible Infrared Imaging Radiometer Suite, Landsat-8 Operational Land Imager, and Sentinel-2A/B MultiSpectral Instrument. These results suggest that third-generation geostationary satellite data can serve as another useful resource for post-event, region-wide initial assessment of landslide areas after a heavy rain event.

1. Introduction
Extreme weather and climate events, such as heavy precipitation, have increased in frequency and are projected to continue increasing in this century [1,2]. These events can impact humans and ecosystems extremely, which can be conceptualized as disasters or emergencies and include major destruction of assets, loss of human lives, and loss of and impacts on plants, animals, and ecosystem services [3,4,5]. In Japan, typhoons and heavy rains can often result in disasters. Typhoon Hagibis, the latest typhoon that made landfall in Japan, for example, caused significant casualties and damage to housing and buildings (Table 1), leading the country to form a panel of experts to study remediation options and call for more attention to evacuation planning [6].
Remote sensing has been shown useful in various phases of disaster response, starting from early situational assessment to long-term recovery monitoring, and even to pre-event monitoring and mitigation planning [7]. A variety of remotely sensed data acquired from a range of platforms (drones, aircrafts, and satellites) have been utilized with the purpose of obtaining the information about the severity and spatial extent of impacts, or the “Area of Impact (AOI).” Chung et al. [8] used synthetic aperture radar (SAR) data and successfully mapped inundated areas within 24 hours after a flash flood event caused by Typhoon Soulik in July 2013. Visible Infrared Imaging Radiometer Suite (VIIRS) Day/Night Band (DNB) image data were used to rapidly assess the spatial extent of typhoon-affected areas and populations, and also to monitor their recovery [9,10]. Boschetti et al. [11] developed a rapid assessment approach based on SAR and Moderate Resolution Imaging Spectroradiometer (MODIS) data that provided pre-event, in-season information on the status of rice and other field crops, and their damage risk posed by tropical storms for food security.
Optical remote sensing data have widely been used to map the spatial extent and distribution of landslides [12,13]. The most frequently used approach has been to exploit the changes in the normalized difference vegetation index (NDVI) between pre- and post-events. The NDVI abruptly decreases over landslide areas due to the loss of vegetative cover. Various polar-orbiting satellite data have been employed, including MODIS [14], the Landsat series [15], and SPOT-5 [16]. Methodologies based on polar-orbiting optical satellite data have effectively been used for inventorying landslides and long-term recovery monitoring, but can be of limited use for early situational assessment because post-event image data are often unavailable immediately after heavy rain events due to persistent cloud cover.
A new generation of geostationary satellite sensors has been launched during the last decade. They include Advanced Baseline Imager (ABI) on Geostationary Environmental Satellites (GOES)-16 and -17 [18], and Advanced Himawari Imager (AHI) on Himawari-8 and -9 [19], and are characterized by very high frequency imaging (~10 min or less) and narrow spectral bands suitable for land monitoring (Table 2). Himawari-8 AHI, for example, has a red and near-infrared (NIR) bands similar to those of Suomi-National Polar-orbiting Partnership (NPP) Visible Infrared Imaging Radiometer Suite (VIIRS), one of the latest polar-orbiting satellite sensors, from which spectral vegetation index time series data can be generated for vegetation phenology studies [20].
Although moderate/low in spatial resolution (0.5–1 km at nadir), these sensors have the potential for disaster response applications, such as near real-time to short-term initial assessment of the spatial extent and severity of impacts (e.g., near real-time wildfire monitoring [21,22]). Geostationary satellite data have operationally been used for the monitoring and forecasting of extreme weather events, including the evolution, landfall, and passage of typhoons and heavy rains. The high frequency observation capability of new generation geostationary satellite sensors nearly guarantees to capture the first and any sunny moments after the passing of typhoons and heavy rains. Therefore, these sensors can serve as another resource to obtain post-event land surface imagery for initial impact assessment, in coordination with other remote sensing platforms, including drones, aircrafts, and polar-orbiting satellites, or possibly sooner than any of these platforms.
In this study, we investigated the utility of Himawari-8 AHI data for mapping the spatial extent of landslide-affected areas caused by a torrential rain event that hit the southern part of Japan in the summer of 2017. A primary objective of this study was to determine how well Himawari-8 AHI moderate/low spatial resolution data detected vegetation cover changes due to landslides. A secondary objective of this study was to assess how soon AHI 10 min resolution data could observe the disturbances after the rain event. We compared AHI latency results with those from other polar-orbiting satellite sensors, including VIIRS, Landsat-8, Sentinel-2, and aerial surveys.
2. Materials and Methods
2.1. Study Area
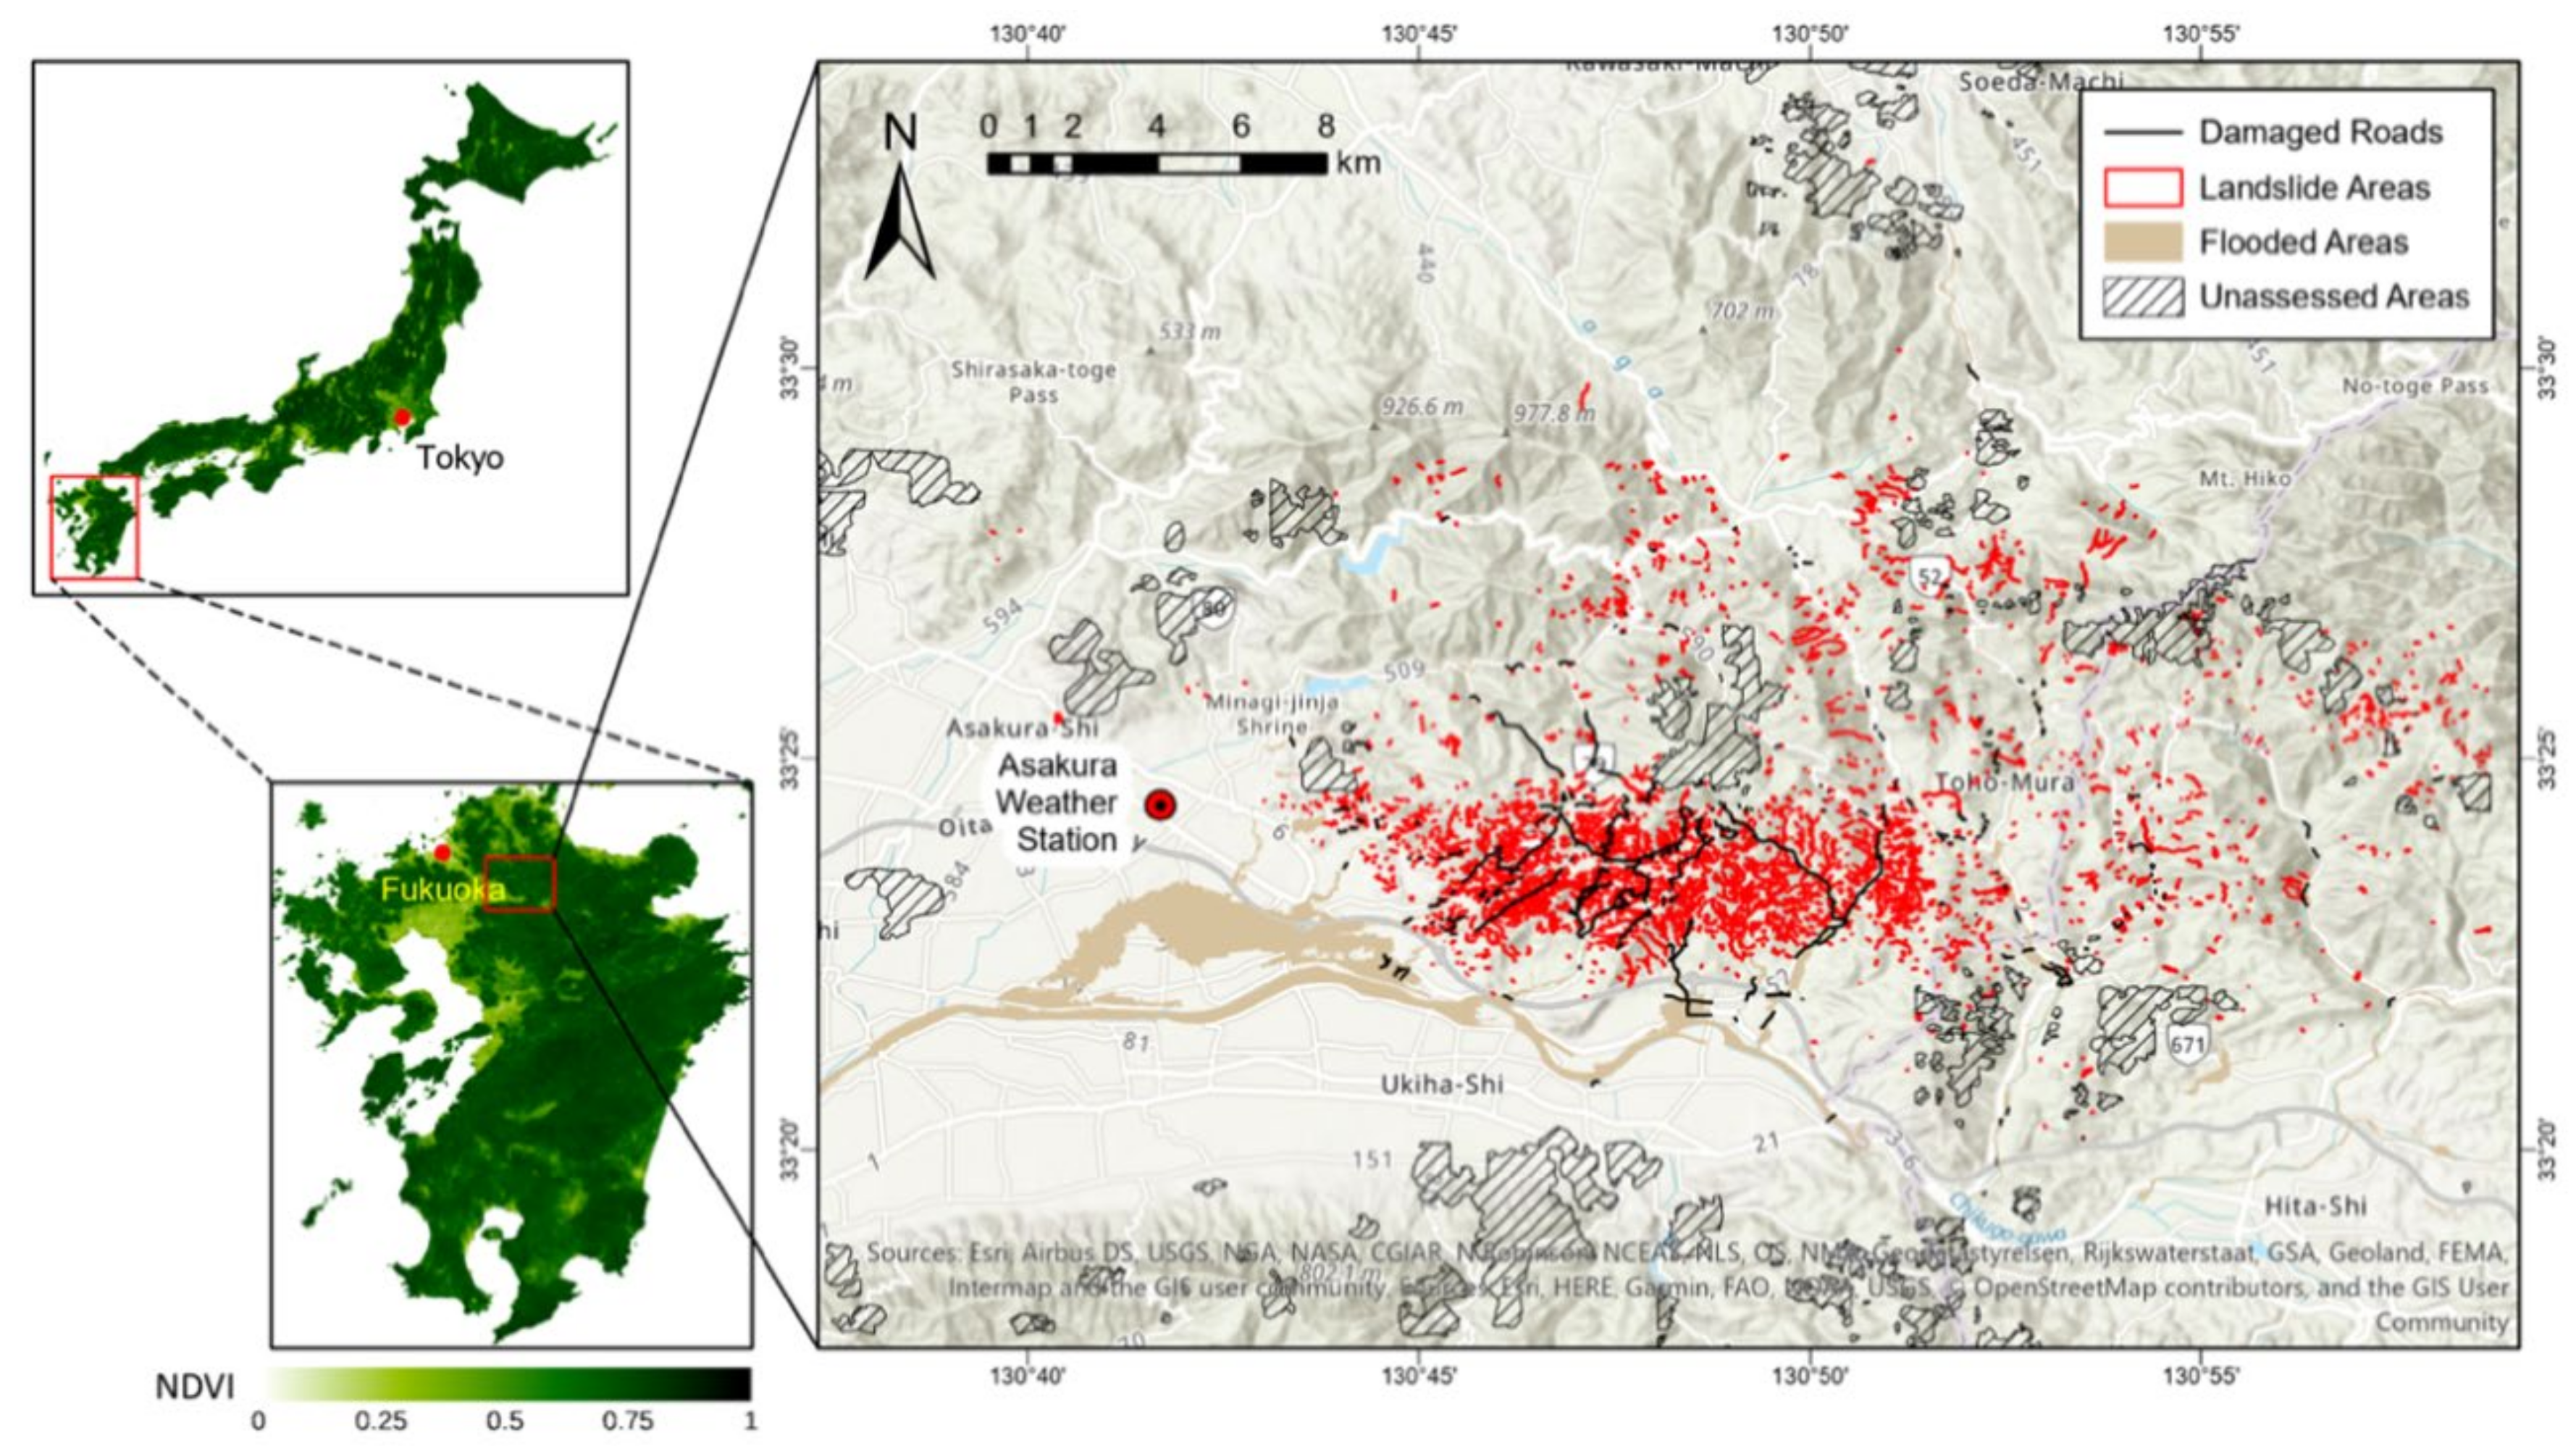
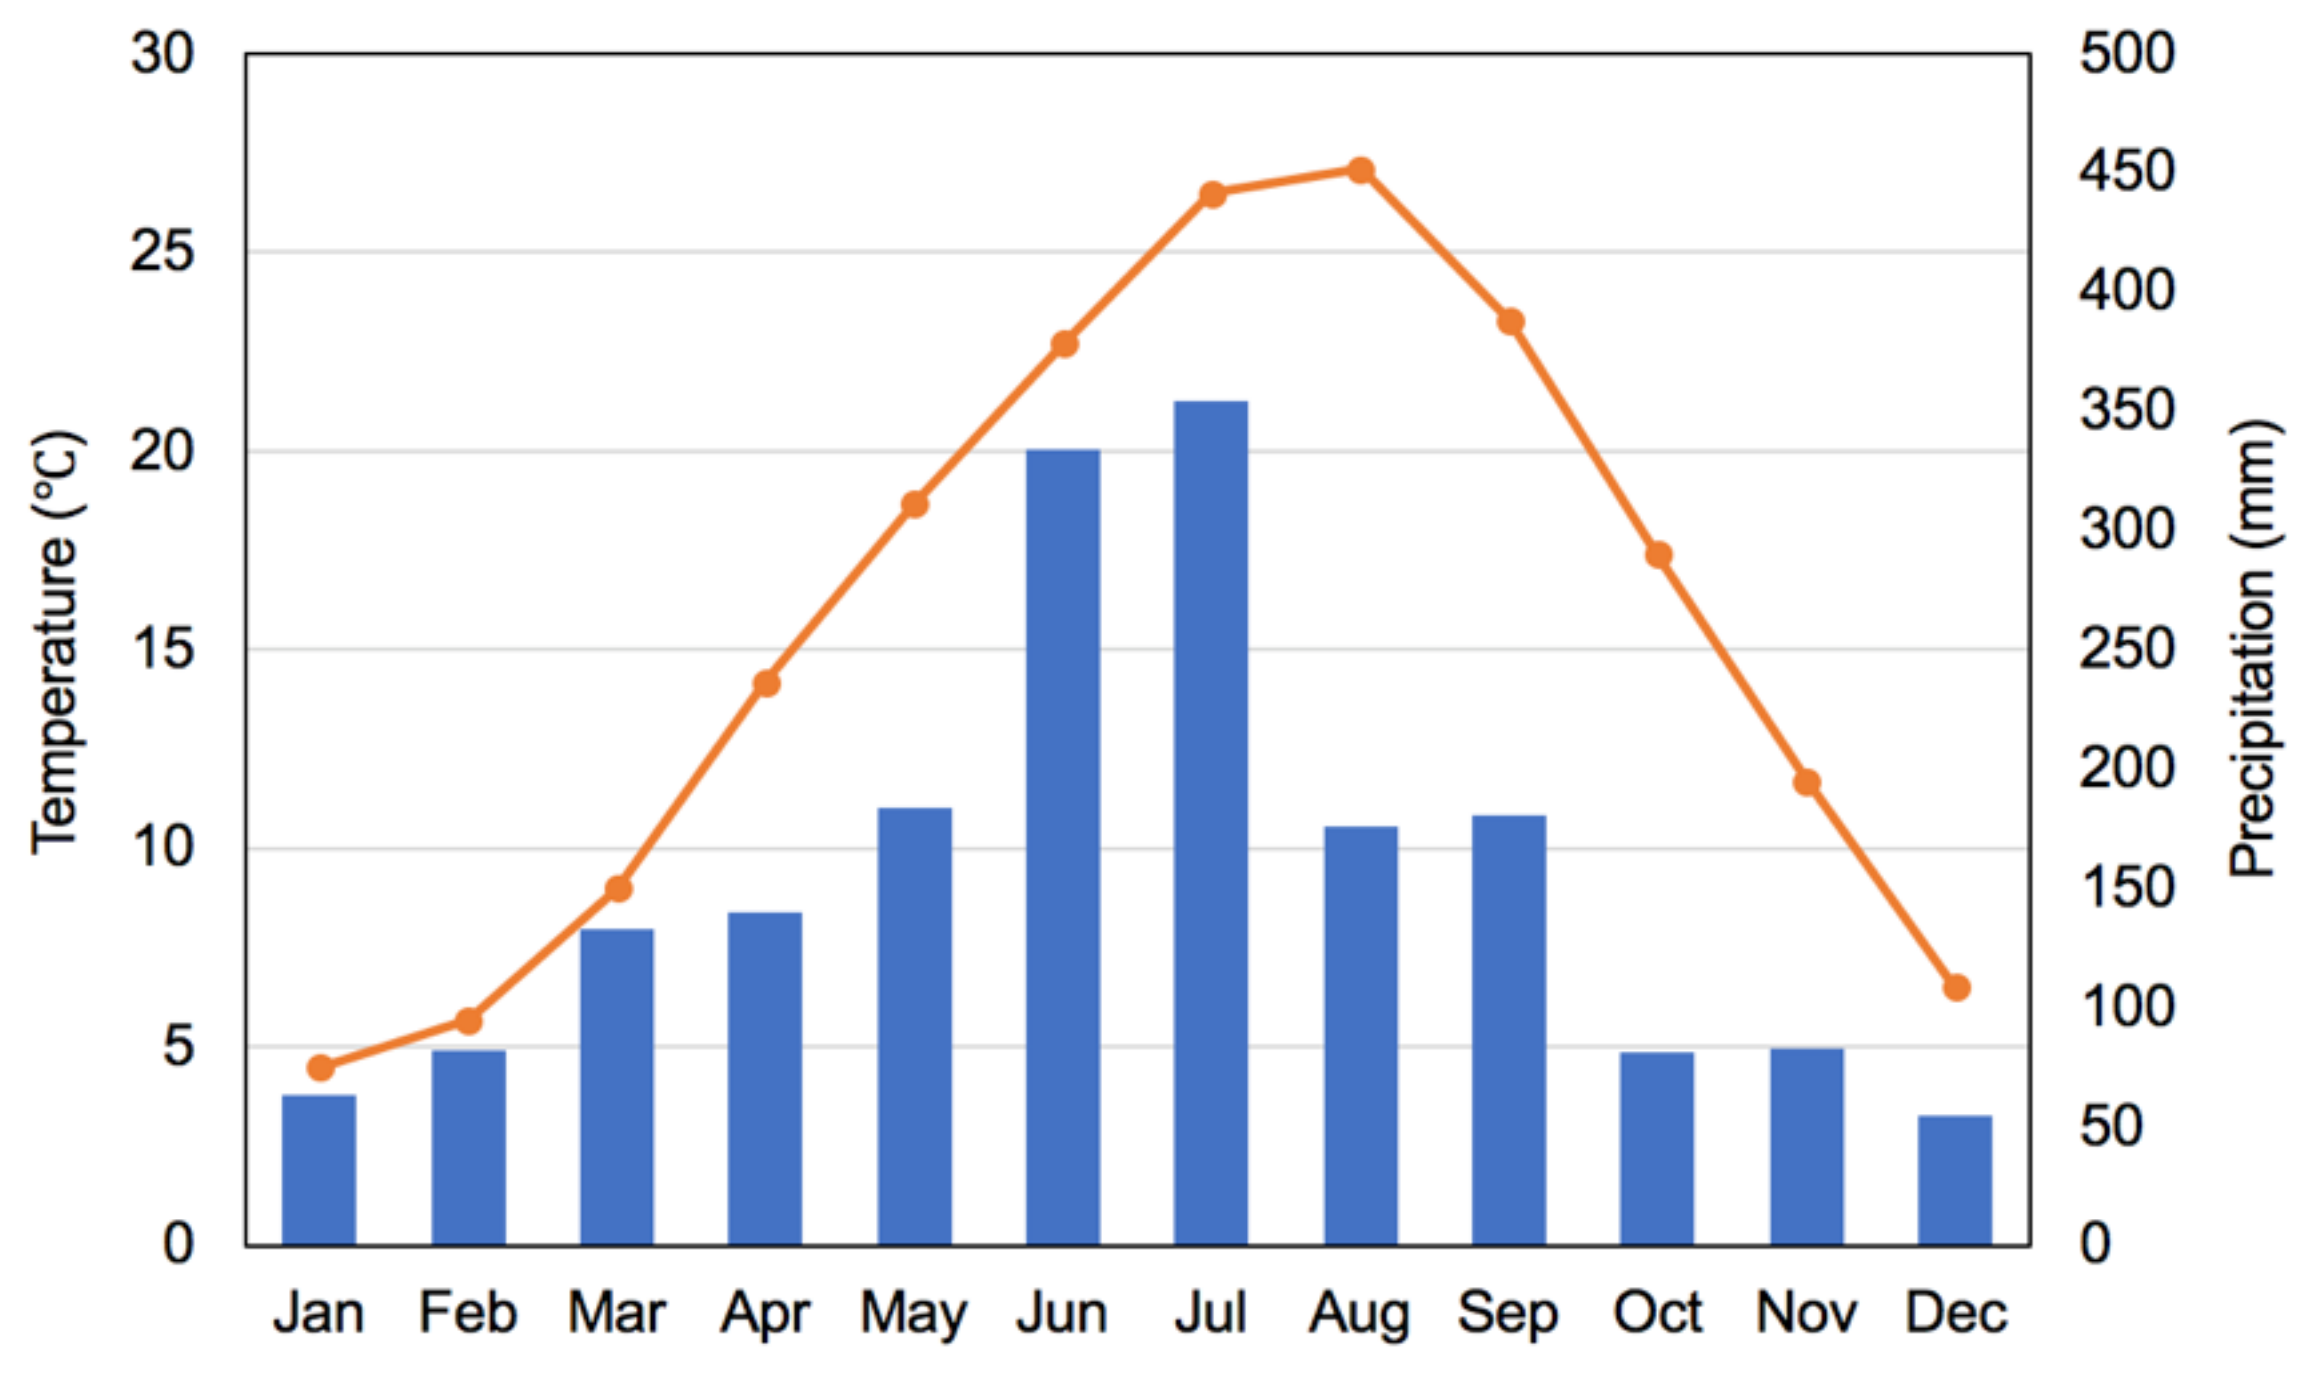
Our study area was located on a mountainous region that encompassed the eastern part of Asakura-shi, Fukuoka Prefecture and the northern part of Hita-shi, Oita Prefecture on the northern Kyushu in Japan (Figure 1). The topography of the study area is variable, ranging from 50 to 600 m in elevation [23]. The region is in the warm temperate climate zone. Monthly mean temperatures range from 4.5 °C in January to 27.1 °C in August, whereas the lowest and highest monthly rainfall amounts are 54.4 mm in December and 354.1 mm in July (Figure 2), based on 30 year measurements (1981 to 2010) at the Asakura weather station (33°24.4′N, 130°41.7′E, 38 m ASL) of the Automated Meteorological Data Assimilation System (AMeDAS).
The study area is underlain mainly by high-pressure schists and pelitic schists metamorphosed in Late Triassic time, and Late Cretaceous granodiorites [26]. Evergreen needleleaf forests cover the area with the dominant overstory species being Japanese cedar (Cryptomeria japonica), Japanese cypress (Chamaecyparis obtusa), and sawara cypress (Chamaecyparis pisifera) [27]. Small patches of Japanese red pine (Pinus densiflora) communities and orchards are found throughout the forests.
2.2. Torrential Rain and Landslides
The study area was hit by torrential rain on 5 July 2017. After the passing of Typhoon Nanmadol, a linear rainband formed over the northern Kyushu area, which brought about the torrential rain [28]. During the event, the maximum one hour precipitation amounts of 129.5 and 87.5 mm were observed, respectively, at the Asakura and Hita (33°19.3′N, 130°55.7′E, 83 m ASL) weather stations, which are also part of AMeDAS [29]. The maximum 24 hour precipitation amounts were 545.5 mm and 370 mm at Asakura and Hita, respectively, for the event. Kato et al. [30] and Ozaki et al. [31] describe the characteristics of the rain event in more detail.
The torrential rain caused landslides on many slopes of the mountainous region [32] (see Figure 1). The rainwater also flooded the riverine system in the region, causing riverbank and riverbed erosions. Debris and mud flows and fallen trees due to the landslides and erosions struck and damaged roads, railways, and houses in Asakura and Hita Cities. The death tolls were 37 in Asakura City and three in Hita City, and the two cities together had 336 and 1096 completely and partially destroyed houses, respectively [33].
Murakami and Yasuda [34] reported that landslides occurred in a 5 km (North–South) by 15 km (East–West) area, where it rained more than 500 mm during a 12 hour period from 10:00 a.m. to 10:00 p.m. on 5 July 2017. Furthermore, landslides were concentrated in an area where 3 hour total rainfall amounts exceeded 200 mm during the torrential rain event [35]. This area corresponded to the region bounded by 33°22′N–33°25′N and 130°44′E–130°32′E (Figure 1). No significant correlations between the occurrences of landslides and underlying rock types were found, according to the National Research Institute for Earth Science and Disaster Resilience (NIED) of Japan [36].
2.3. Landslide Data
A vector dataset of the study area delineating landslide areas along with damaged roads and flooded areas, was obtained from the Geospatial Information Authority of Japan (GSI) [24] (see Figure 1). The vector layer was derived by digitizing landslide areas, flooded areas, and damaged roads identified visually on orthophoto mosaics. The orthophoto mosaics were created from aerial photos acquired by GSI with an airplane on 13, 30, and 31 July 2017, and by the Ministry of Land, Infrastructure, Transport and Tourism with a helicopter on 8 July 2017. The aerial survey of 13 July 2017 acquired photos with near complete coverage of the impacted areas [37]. Portions of the mosaics affected by clouds and/or cloud shadows were not inspected for landslides and indicated as “unassessed areas” in the vector dataset. No ground-based validation of this landslide map was made due to the emergency situation [24].
The landslide polygons were spatially aggregated into 0.02° by 0.02° grid cells as the percentage of landslide areas for direct pixel-to-pixel comparisons with AHI NDVI data. A 0.01° by 0.01° linear latitude–longitude grid was overlaid onto the landslide polygon dataset. For every 0.01° by 0.01° grid cell, we applied a 0.005° buffer to increase the cell dimension to 0.02° by 0.02°, resulting in 0.02° by 0.02° grid cells spaced at 0.01° intervals. The percentage of landslide areas was computed for each grid by dividing a total of landslide areas found within a 0.02° by 0.02° grid cell by the area of the corresponding grid cell. The 0.02° by 0.02° grid size was used by following Yan et al. [20] that used the 0.02° by 0.02° grid cells, considering the effective resolution of AHI off-nadir pixel observations.
2.4. Himawari Data
Himawari-8 AHI precisely geolocated apparent reflectance data covering Japan (N 50°–N 20° and E 120°–E 150°) were obtained for a period of 1 January 2016 to 31 December 2017 from the Center for Environmental Remote Sensing (CERES) at Chiba University, Japan (http://www.cr.chiba-u.jp/databases/GEO/H8_9/FD/index.html). These data were on a 0.005 degree (red band) and 0.01 degree (blue, green, and NIR bands) linear latitude-longitude grid. The red band images were spatially aggregated into 0.01 degree pixels by taking arithmetic means of 2-by-2 pixels. The apparent reflectance data were converted to top-of-atmosphere (TOA) reflectance:
where
- TOA reflectance for band b at pixel i;
- Apparent reflectance for band b at pixel i;
- d Earth-Sun distance (AU);
- Solar zenith angle at pixel i.
The Earth-Sun distance was calculated on a daily basis whereas the solar zenith angle was calculated on a per scene, per pixel basis using an algorithm described in Reda and Andreas [38]. With Himawari-8 being a geostationary satellite, the illumination geometry of AHI observations constantly changed throughout the year. The NDVI was computed from the derived red and NIR TOA reflectances:
AHI NDVI data collected between 9:00 and 15:00 Japan standard time (± 3 hours of local noon) were retained for analysis as TOA NDVI were shown to change little during this time period [39]. For our study sites, the solar zenith angle (SZA) of AHI observations ranged from 10° to 73° with 42° being the annual average. Diurnally, they varied from 10° to 44° on the summer solstice, from 33° to 58° on the equinoxes, and from 57° to 73° on the winter solstice. AHI observations with SZA greater than 70° were only found close to 9:00 in the winter period (the end of November to the beginning of February). AHI view zenith and azimuth angles calculated by assuming negligible temporal variation of the Himawari-8 satellite position [40] were 40° and 162° degrees, respectively, for the study area.
2.5. VIIRS, Landsat-8, and Sentinel-2 Data
In order to compare the latency of obtaining cloud-free data among different sources, we obtained VIIRS data from the NOAA Comprehensive Large Array-data Stewardship System (CLASS, https://www.class.noaa.gov/), Landsat-8 Operational Land Imager (OLI) data from the USGS EarthExplorer (https://earthexplorer.usgs.gov/), and Sentinel-2A/B MultiSpectral Instrument (MSI) data from the Copernicus Open Access Hub (https://scihub.copernicus.eu/dhus/) over the study area for a period from 5 July 2017 to 31 July 2017. VIIRS red and NIR (I1 and I2, respectively) TOA reflectances, and sun and view zenith and azimuth angles were stitched and remapped onto a 0.00375 degree linear latitude–longitude grid and reduced into TOA NDVI using Equation (2). Stitching and remapping were made on a per orbit basis as VIIRS ground swaths from two adjacent orbits overlapped significantly (~30%). All OLI and MSI scenes acquired for the one month period were obtained and their true-color composites were visually inspected to estimate the degree of cloud contamination over the study area. These data were all open access data, distributed free of charge.
2.6. Sunshine Duration Data
We also obtained hourly sunshine duration data (decimal hour units) for a period of 1 July 2017 to 31 August 2017 for the Asakura weather station as an independent measure of sky conditions. Sunshine duration is defined as “the period during which direct solar irradiance exceeds a threshold value of 120 W/m2” [41]. In practice, this threshold can be associated with the appearance of shadows behind illuminated objects.
3. Results
3.1. Landslide Areas and AHI NDVI
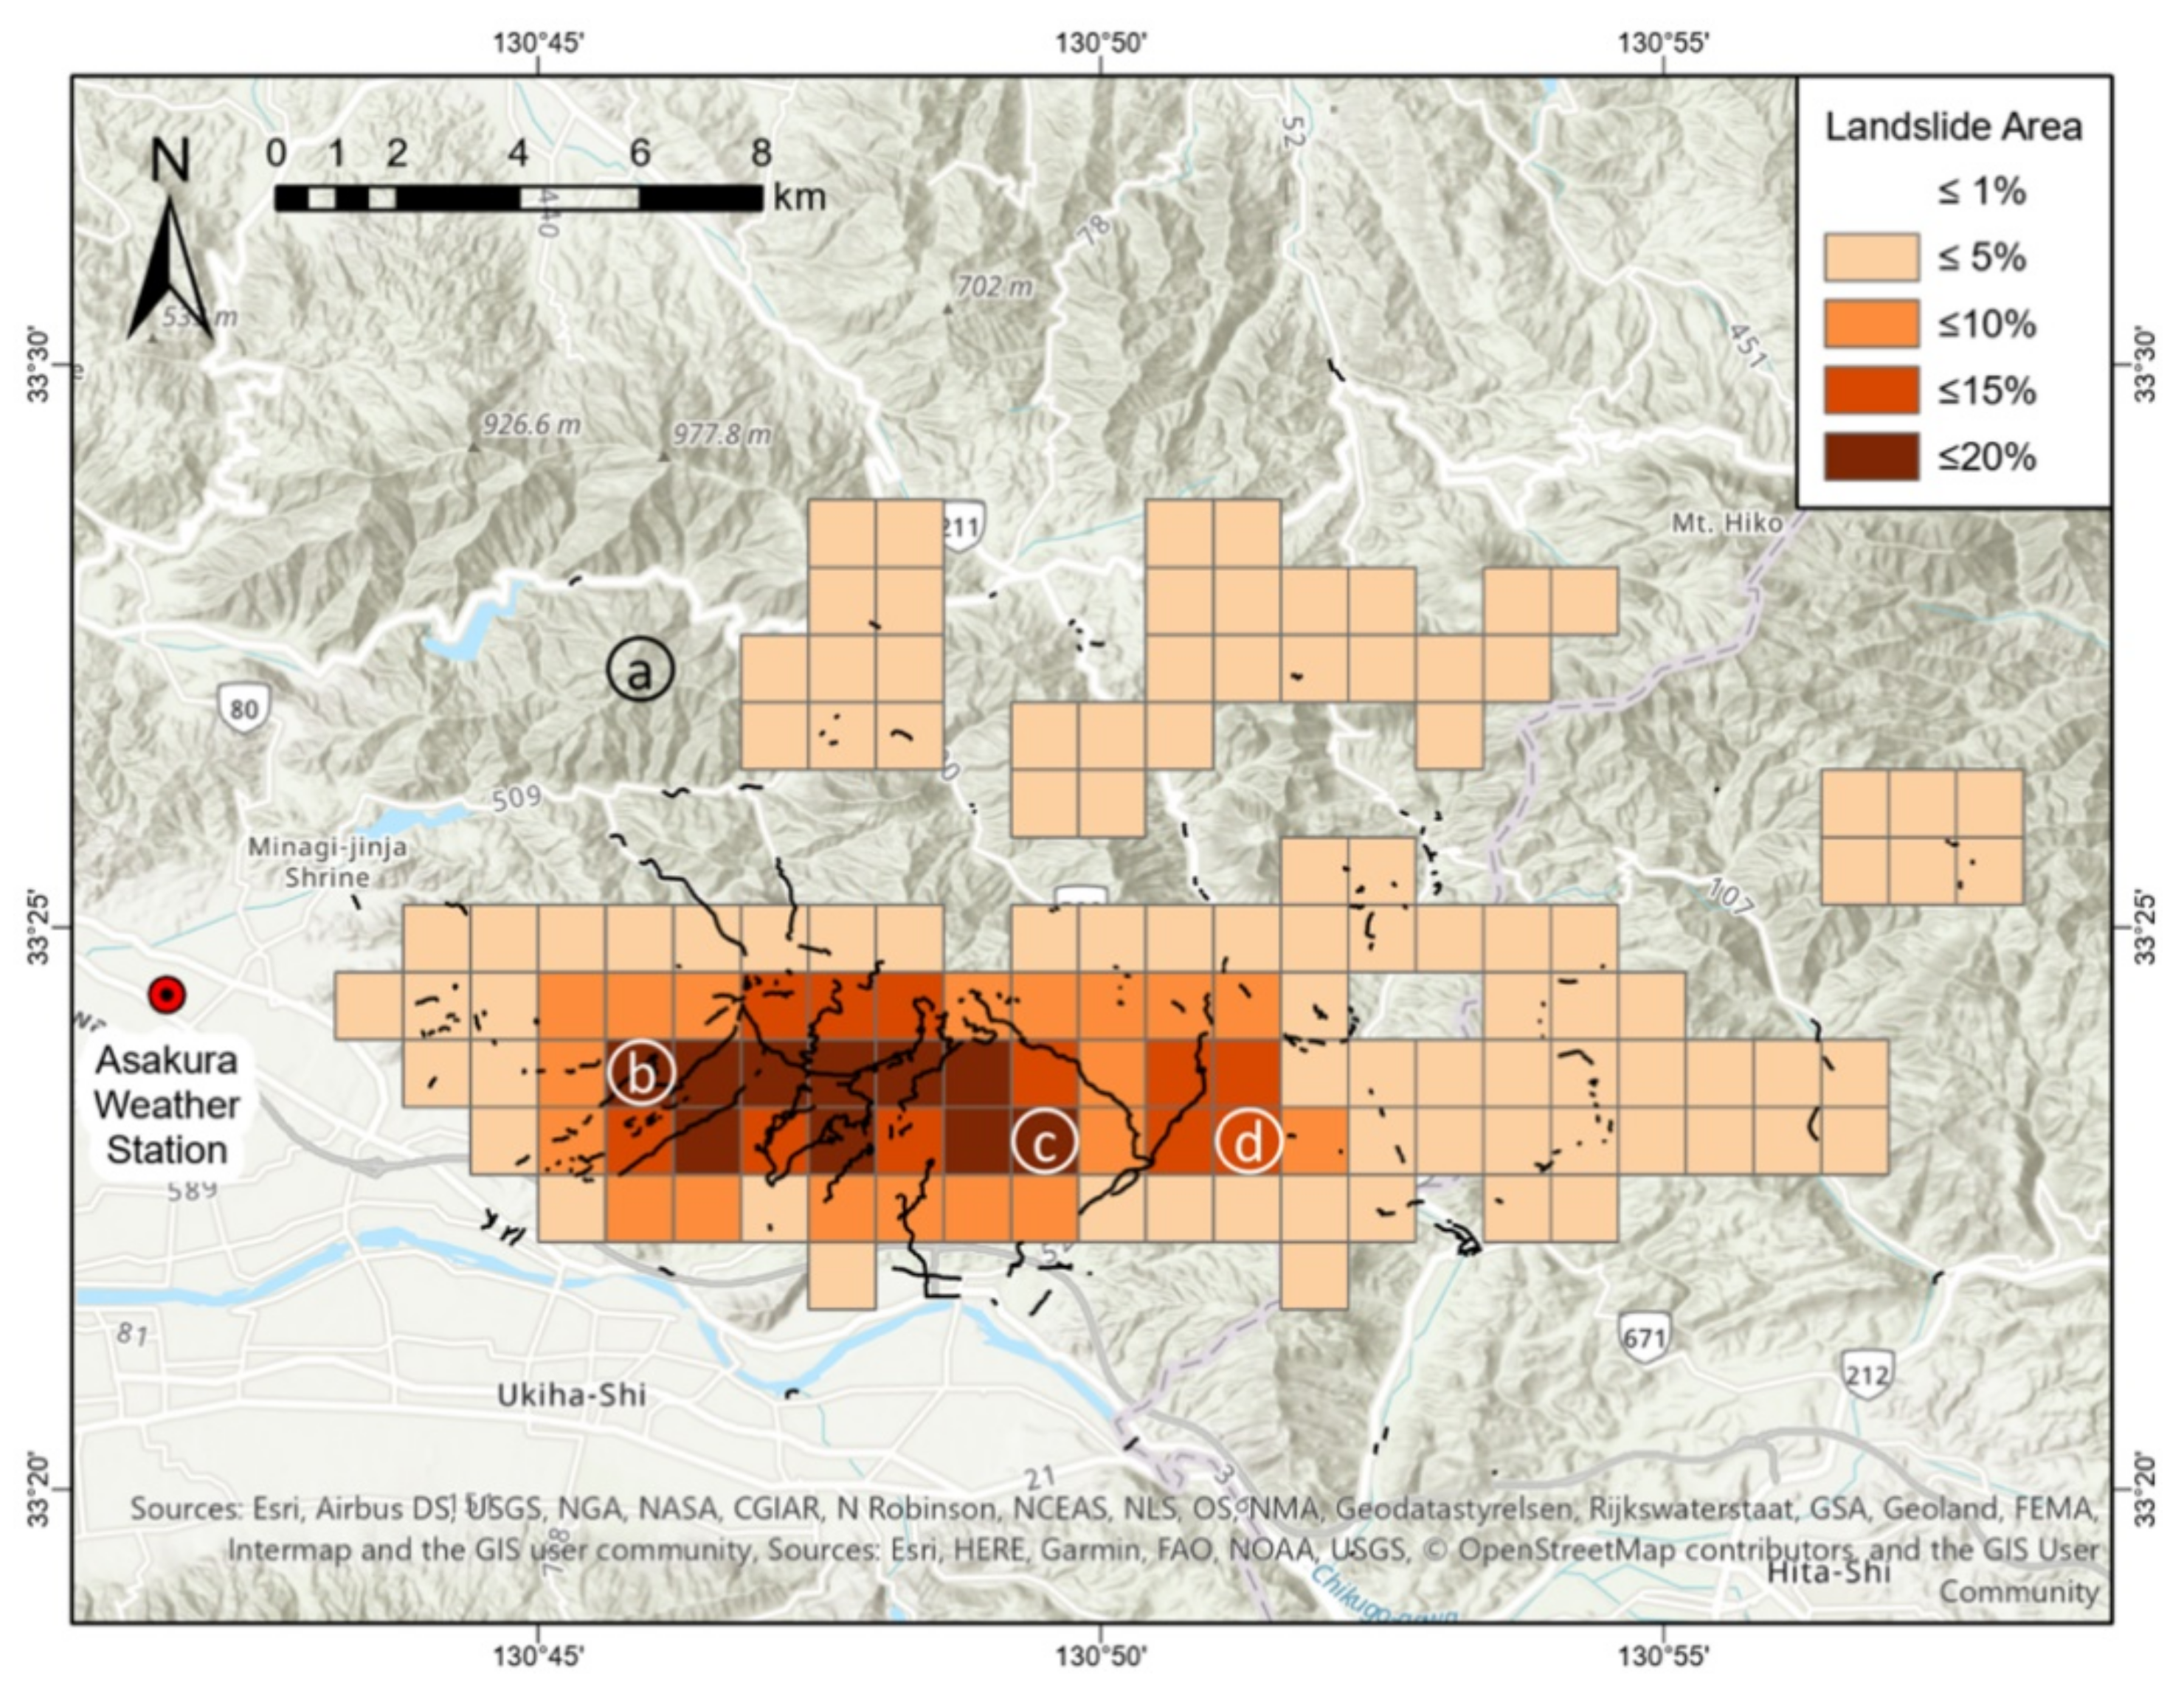
The derived percent landslide areas are shown as a map in Figure 3. At this spatial resolution, the percent landslide area values were 20% or less. The areas with >5% landslide areas were concentrated and only found in approximately a 4 km (North–South) by 12 km (East–West) region, corresponding to the most heavily rained region [34,35].
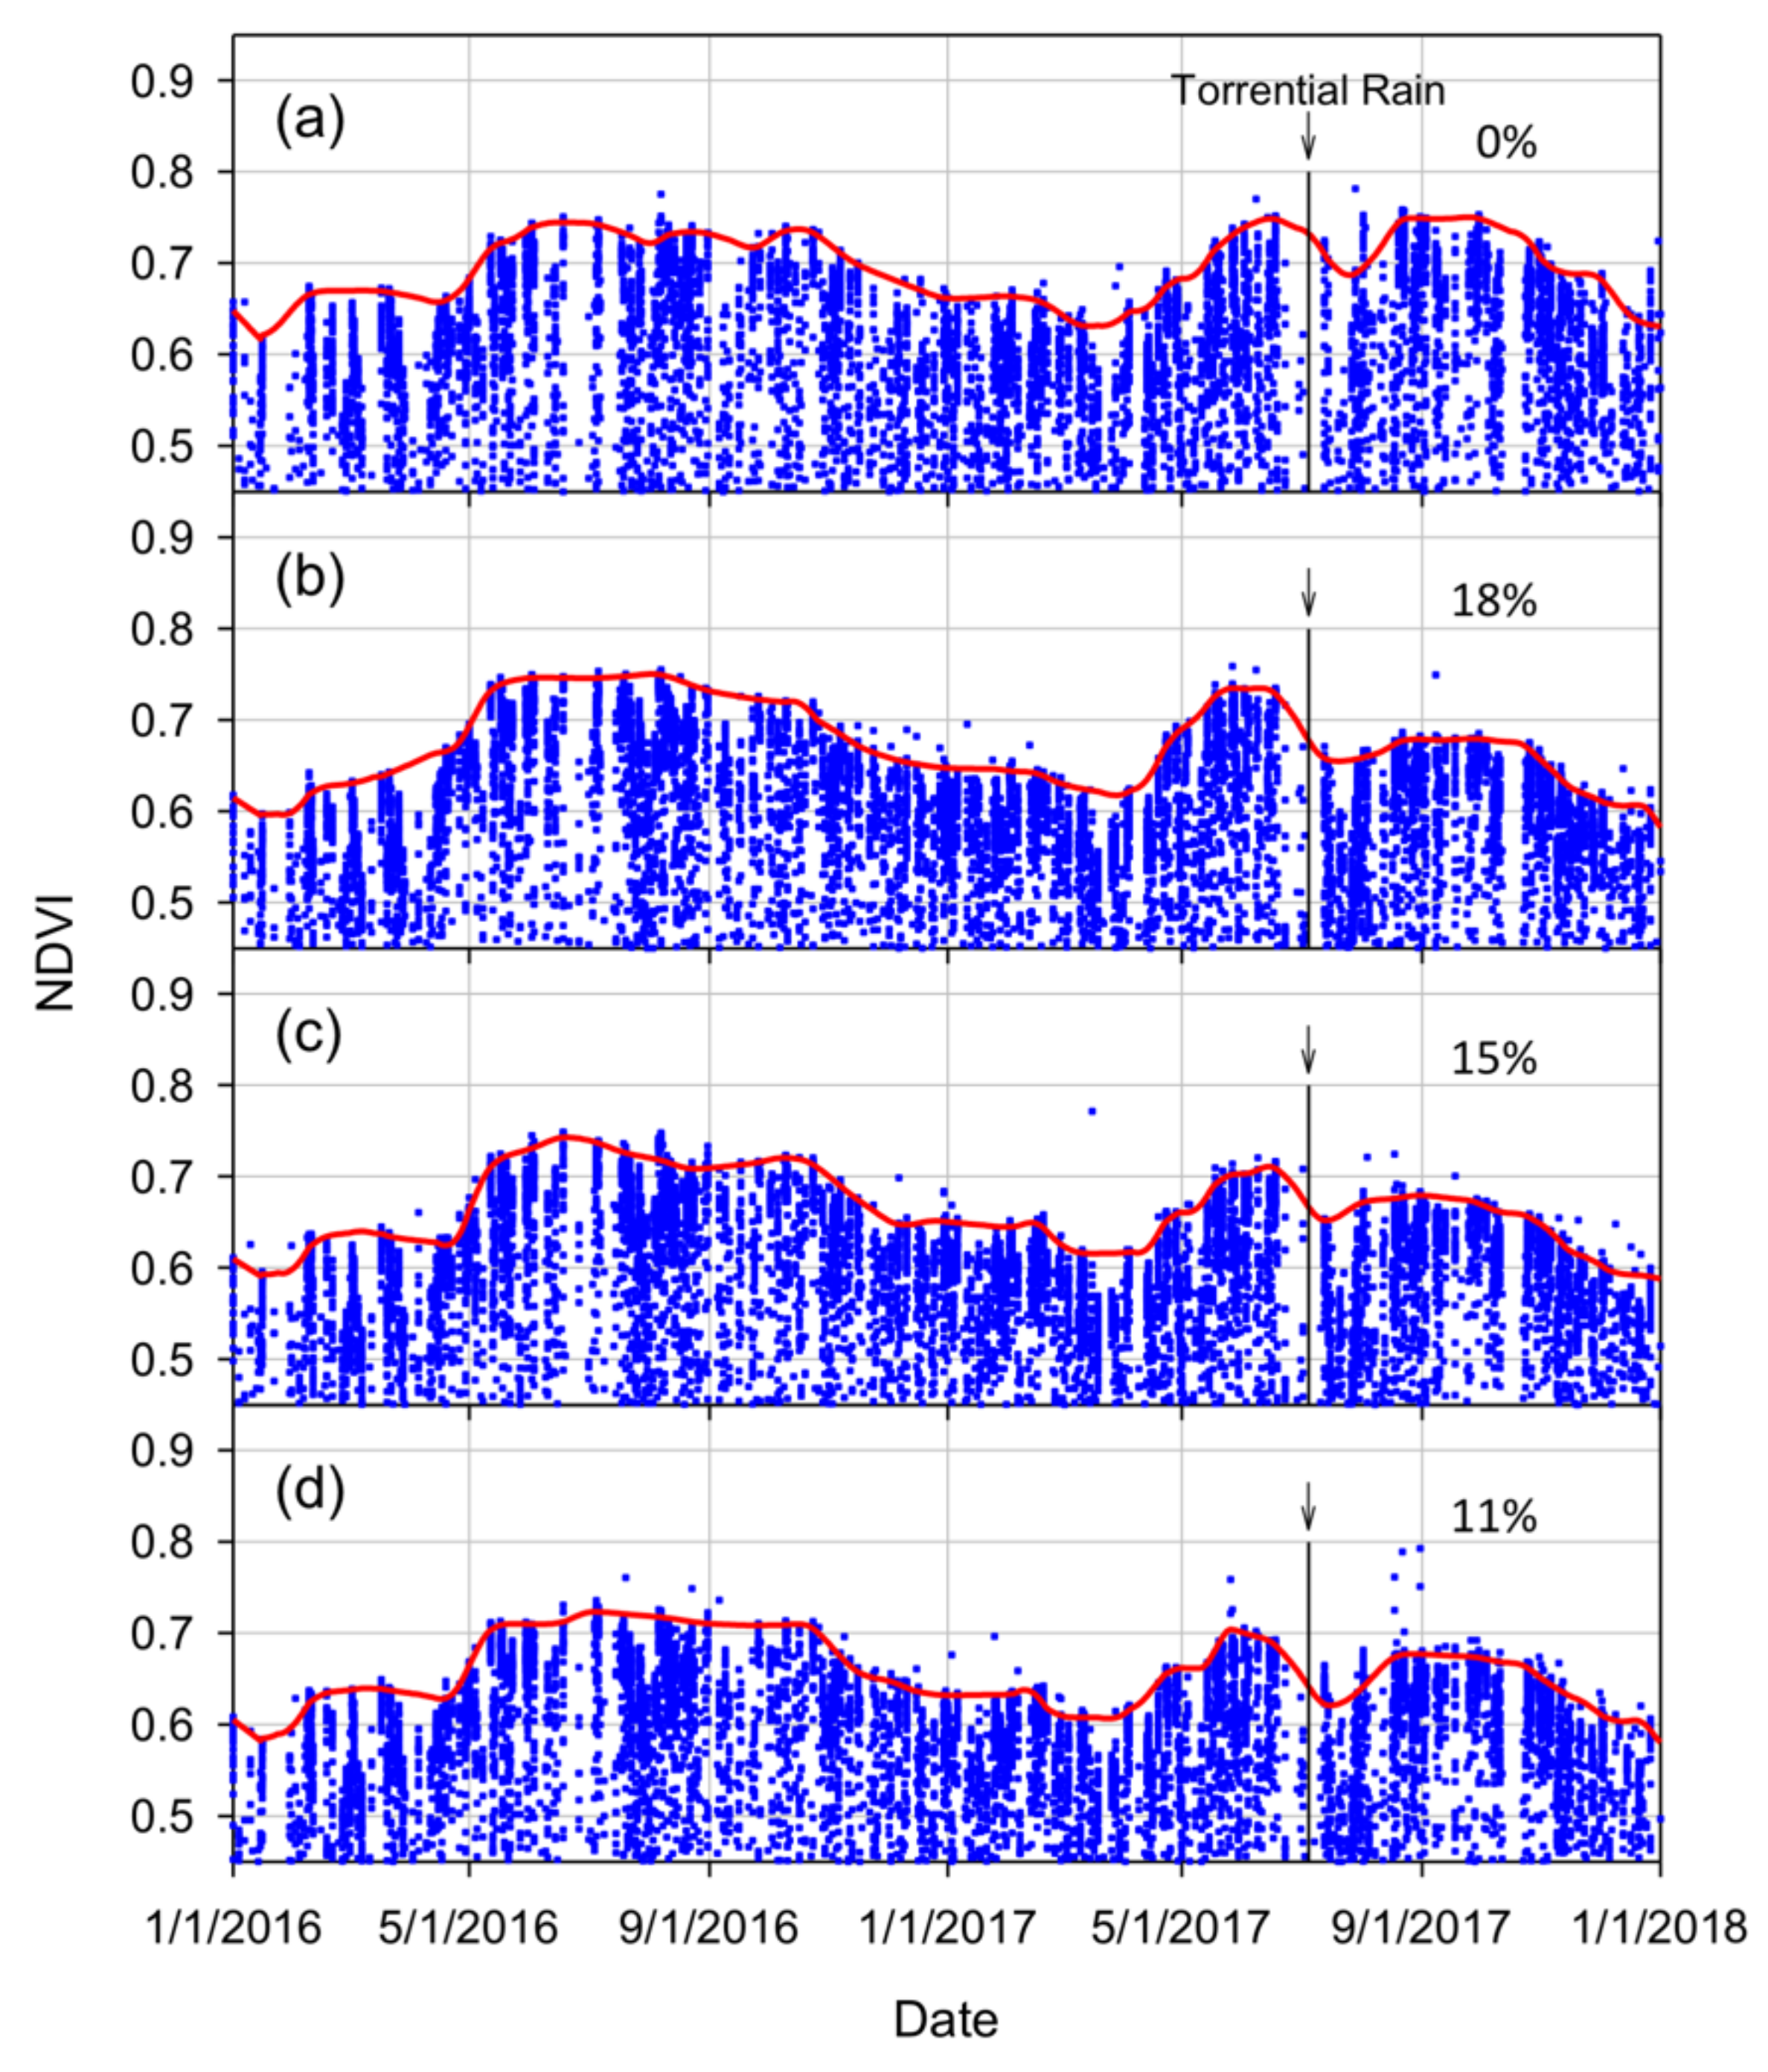
AHI NDVI temporal profiles of landslide-affected areas with various degrees are shown in Figure 4. These NDVI temporal profiles had a number of data gaps associated with persistent cloud cover, from January 2016 to April 2016, for June–July of the years 2016 and 2017, and in October 2017. All of the NDVI profiles also had one long peak growth period for the year 2016, starting in May and ending in October (Figure 4). For the year 2017, whereas the NDVI temporal profile from an unaffected area by landslides had a similar long peak growth (Figure 4a), the NDVI for the other landslide-affected areas abruptly dropped after the torrential rain event (Figure 4b–d). The degree of the NDVI changes appeared proportional to the percent landslide areas.
To quantify the NDVI change due to landslides, NDVI difference (ΔNDVI) was computed by subtracting post-event smoothed NDVI values from pre-event smoothed NDVI values on a per pixel basis. Five day local means centered on 8 June 2017 and 23 August 2017 were used as the pre-event and post-event NDVI values, respectively, based on the quality of the smoothed NDVI profiles. A smoothing algorithm sometimes removed clear-sky observations when they were bounded by consecutive cloudy observations, resulting in a concave shape in the NDVI profile (e.g., the small concave feature after the torrential rain in Figure 4a). The smoothing algorithm is described in detail in Appendix A.
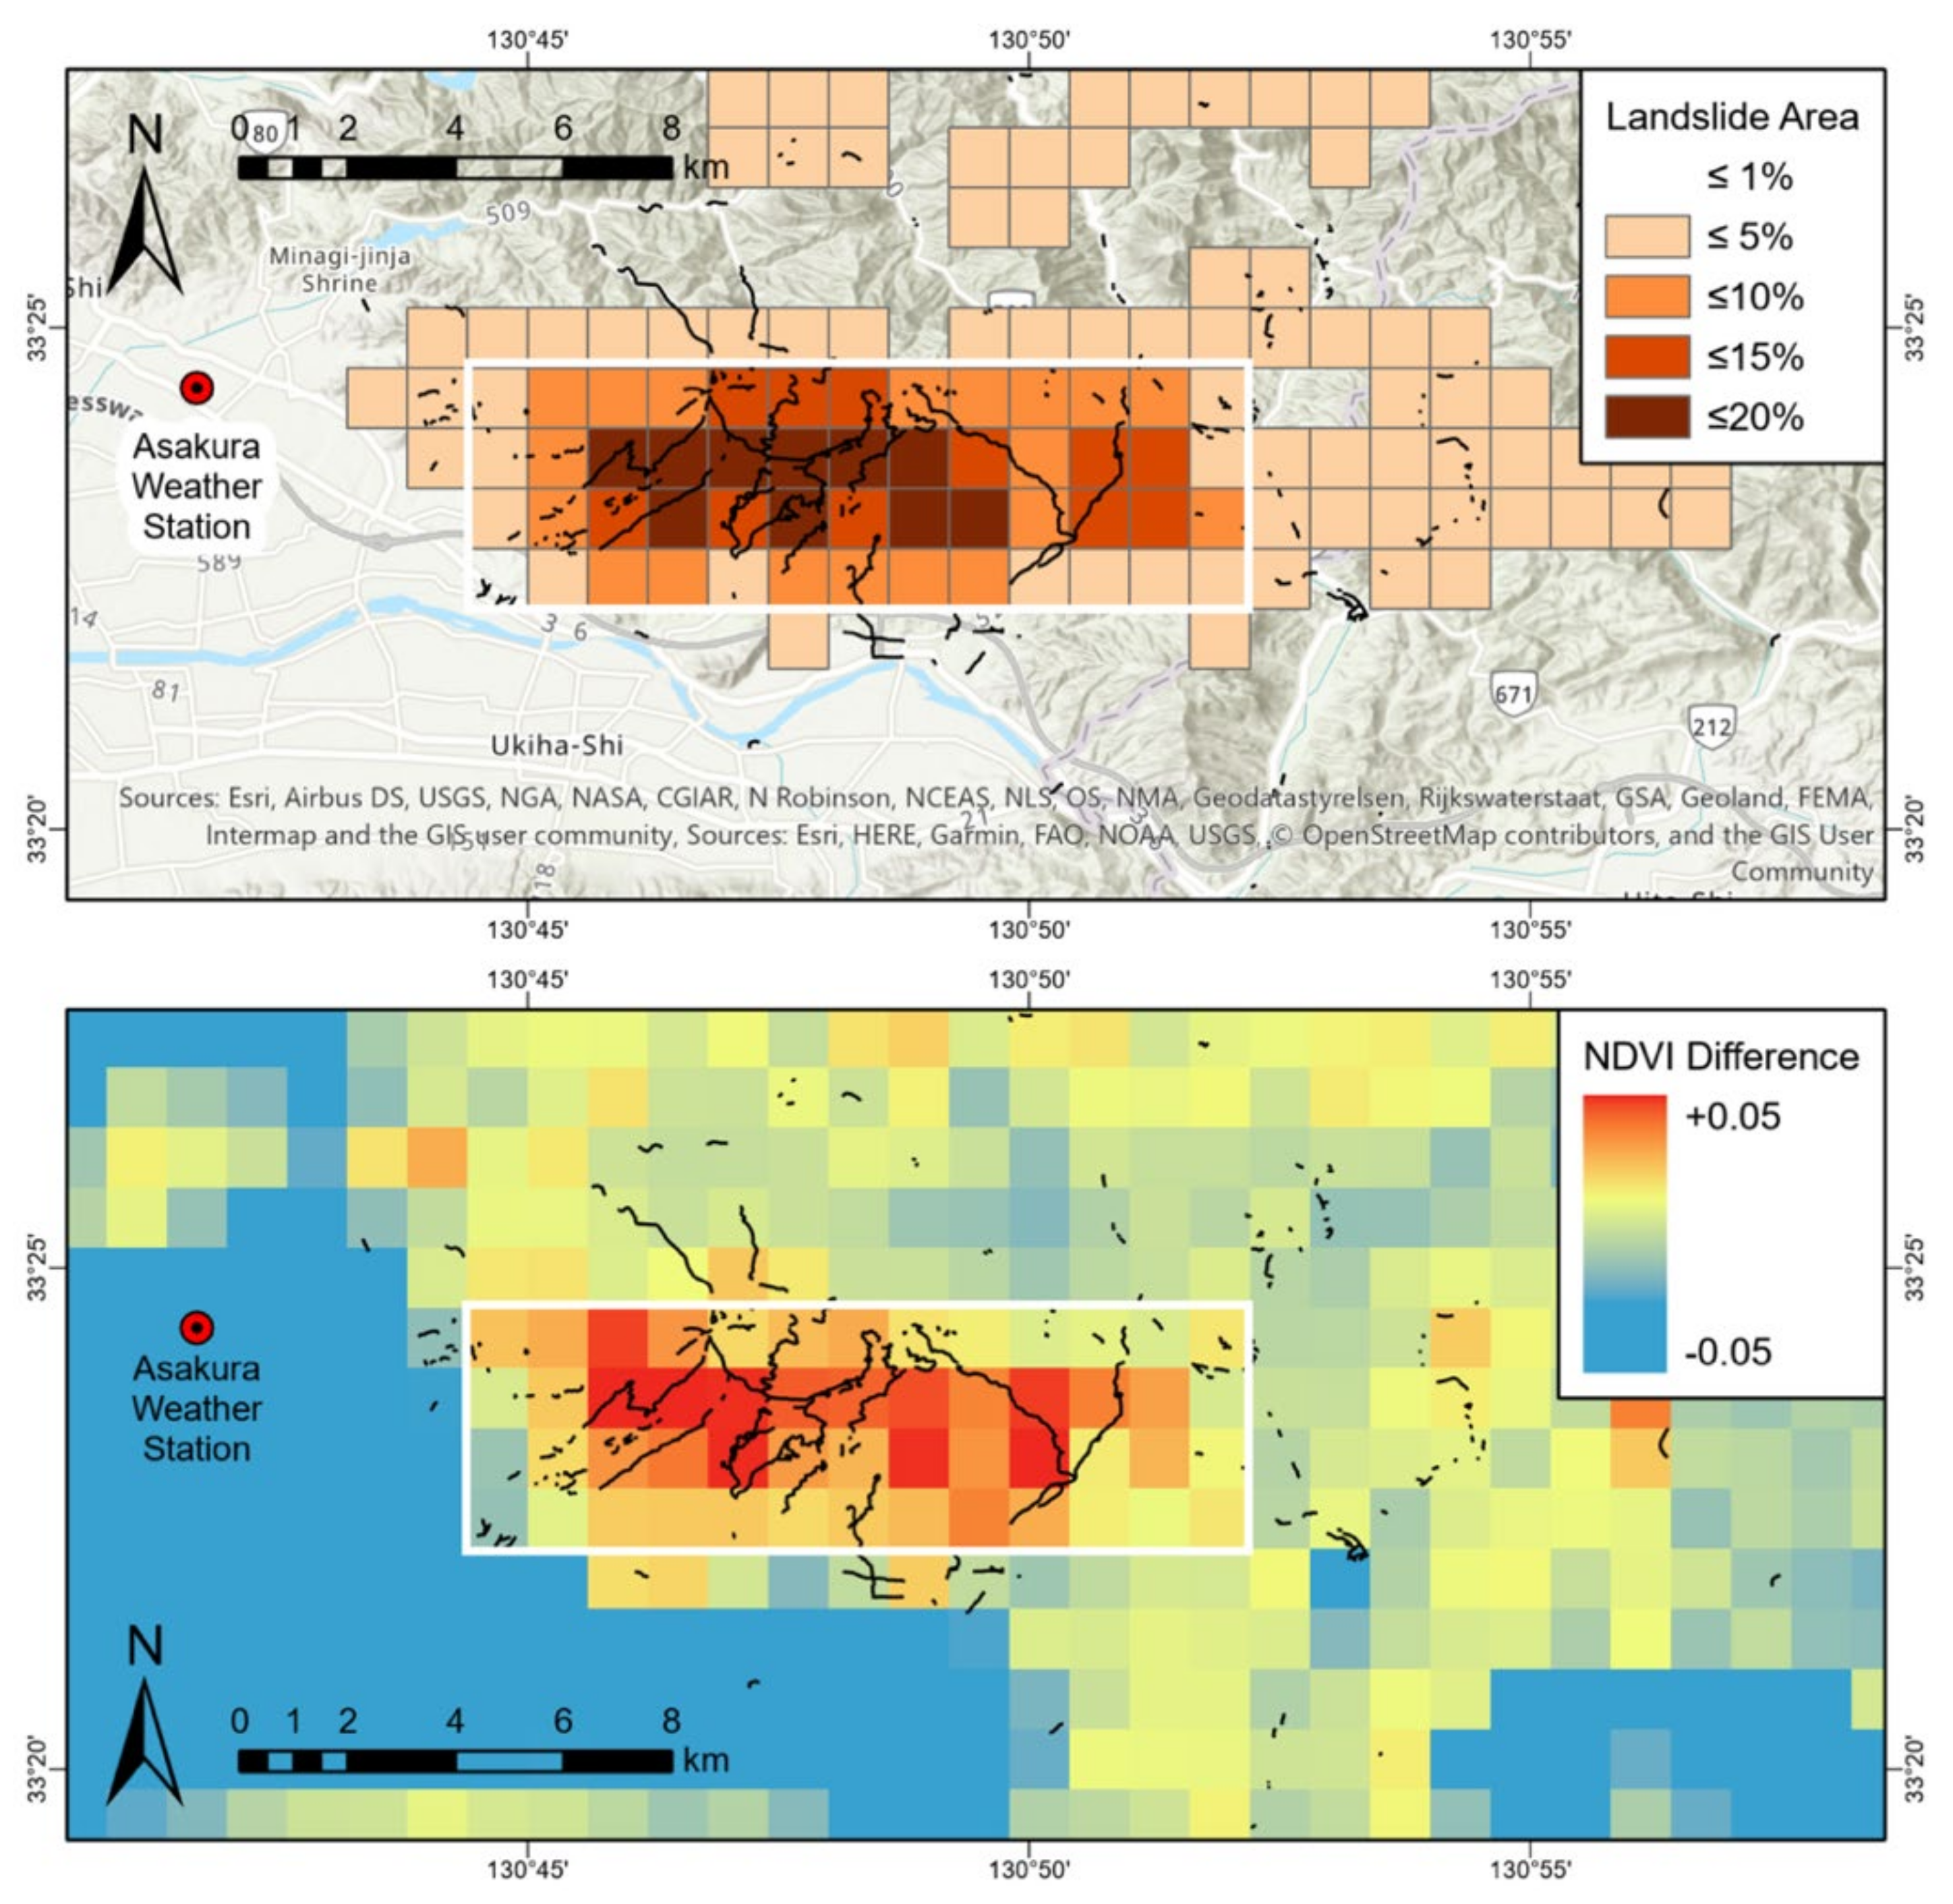
The derived ΔNDVI is shown in a map form in Figure 5. The spatial distribution of high ΔNDVI occurrences was very similar to that of the landslide areas, particularly for the region that had greater than 5% landslide areas (the white line boxed region in Figure 5). Those pixels with negative ΔNDVI were rice paddy fields or grasslands whose vegetation (and NDVI) peaked during the month of August.
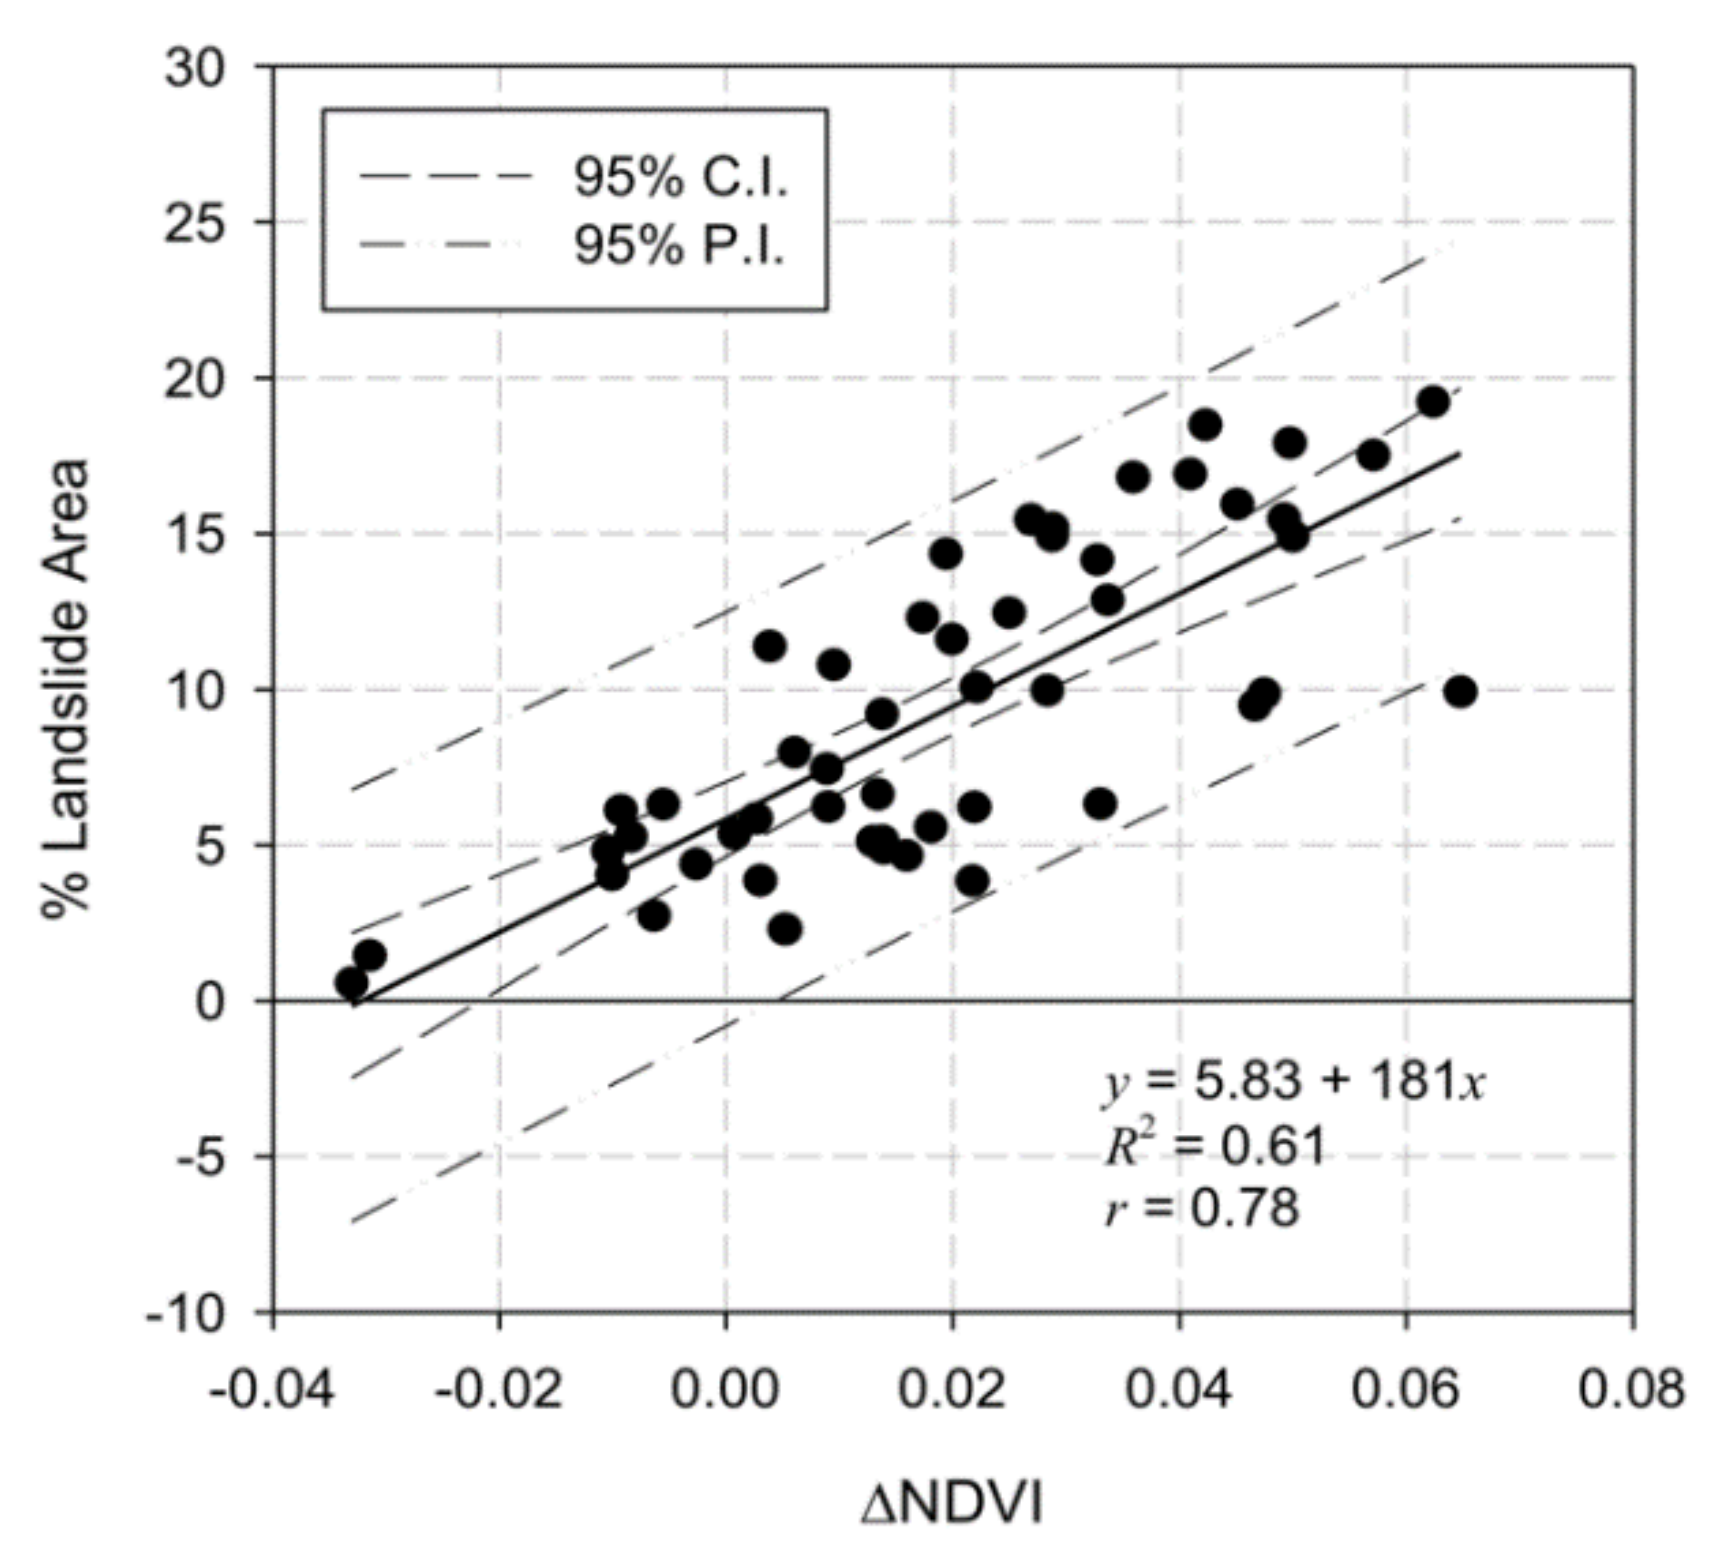
Using the observation pairs in the boxed region in Figure 5, the percent landslide area was regressed against ΔNDVI with a simple linear model. The relationship was statistically significant (p-value < 0.01, R2 = 0.61, and r = 0.78) (Figure 6). The regression results (the 95% prediction interval) indicated that, for a pixel with ΔNDVI greater than 0.005, we could be 95% confident that landslides occurred on that pixel and the areas impacted by landslides were ~7% on average (Figure 6).
3.2. Comparison of AHI to VIIRS, Landsat-8, and Sentinel-2
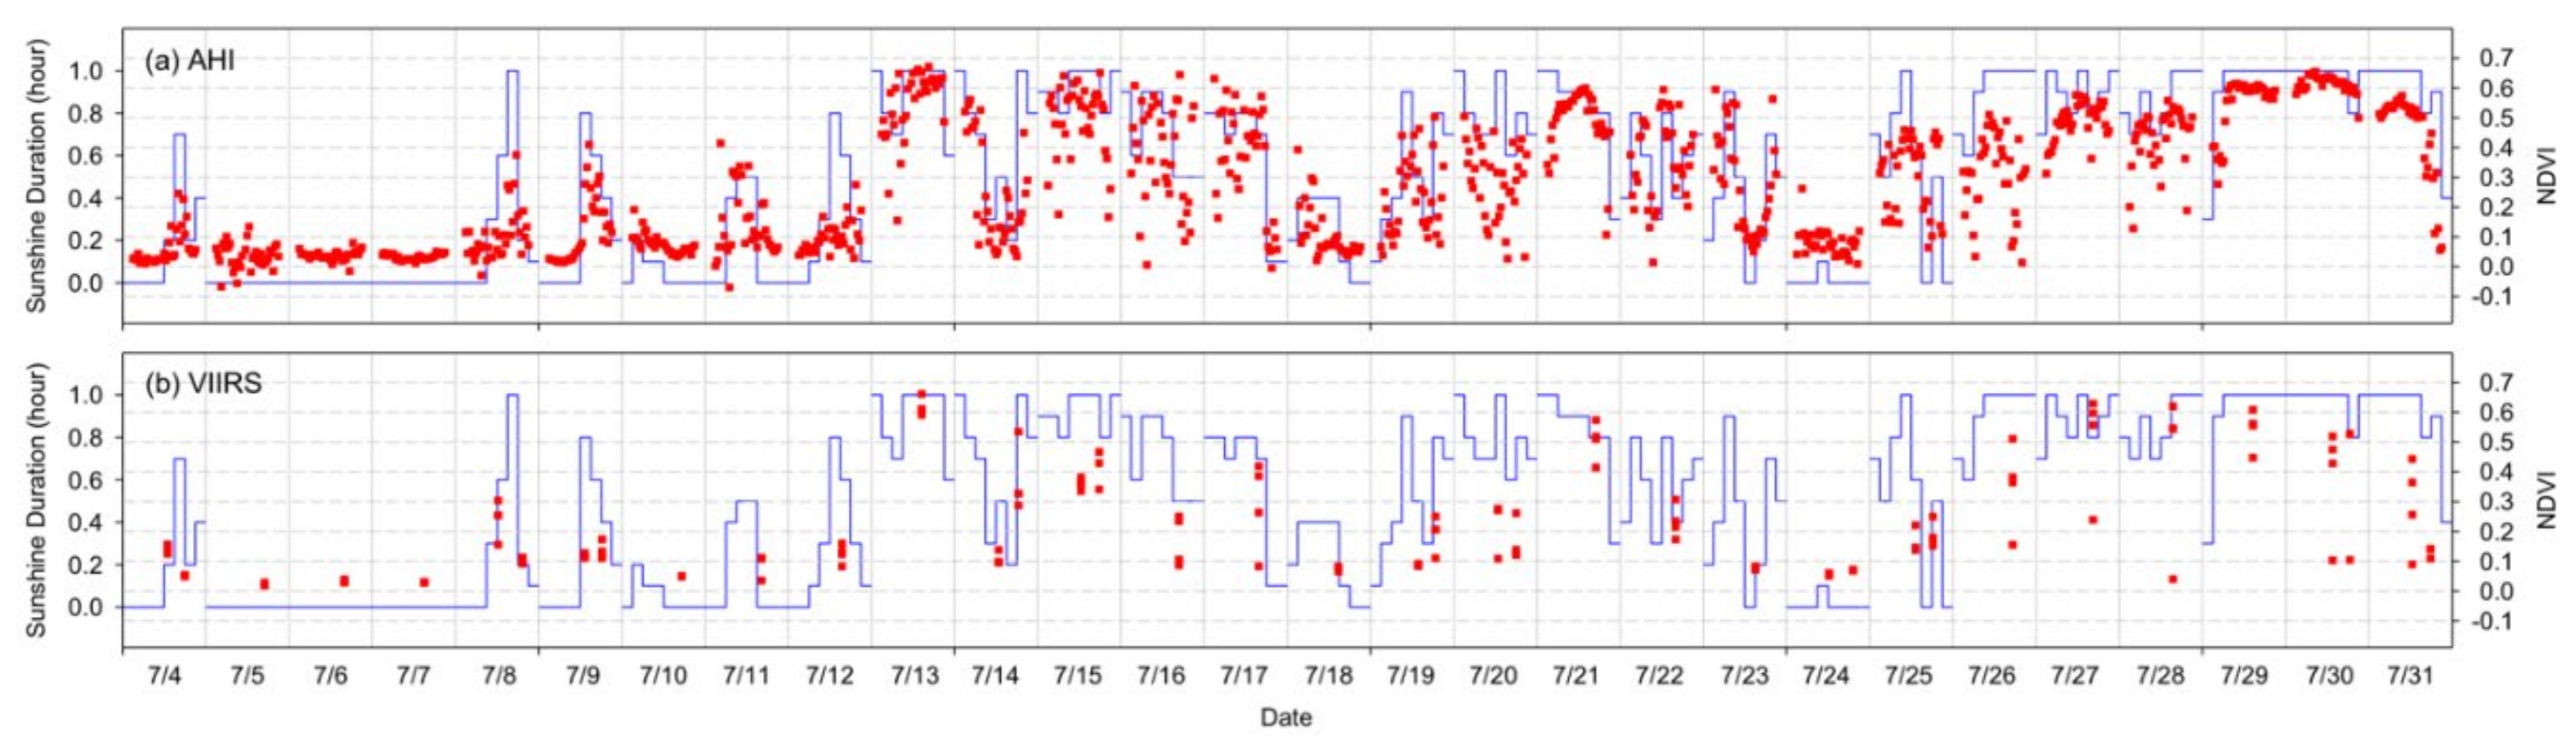
In Figure 7a, the same AHI NDVI temporal profile as plotted in Figure 4b is plotted along with one hour sunshine duration data for a period of 4 July 2017 to 31 July 2017. The extraction location of the AHI NDVI profile and the Asakura weather station were ~6.5 km apart (see Figure 3). AHI NDVI temporal changes were very similar to those of the sunshine duration. AHI NDVI was greater than 0.6 when the sunshine duration was longer than one hour. Based on the NDVI values supported by the sunshine duration data, the very first clear-sky observations of AHI were obtained over the site on 13 July, 8 days after the torrential rain event (Figure 7a). AHI was also able to acquire clear-sky observations on 15 July. The weather conditions apparently deteriorated and the next favorable sky conditions occurred on 21 July. It was then 29 and 30 July when additional clear-sky observations were acquired with AHI. We conducted the same analysis on AHI NDVI temporal profiles for other pixels inside the boxed region in Figure 5, which indicated that AHI accomplished cloud-free observation coverage over the whole region with those acquired by 12:30 p.m. Japan Standard Time (JST) on 13 July 2017, 8 days after the rain event.
Plotted in Figure 7b are VIIRS NDVI values extracted over a 2 pixel by 2 pixel window corresponding to the AHI NDVI extraction location (i.e., four pixels). As a wide-swath sensor in near-polar sun-synchronous orbit, VIIRS acquired one or two observations per day. Based on the NDVI values supported by the sunshine duration data, VIIRS also acquired the first clear-sky observations on 13 July and all of the four pixel observations were cloud-free. The next clear-sky observations were acquired on 27, 28, and 29 July where two, one, and one observations out of the four were cloud-free, respectively (Figure 7b). In contrast to AHI, no cloud-free observations were acquired with VIIRS on 15, 21, and 30 July.
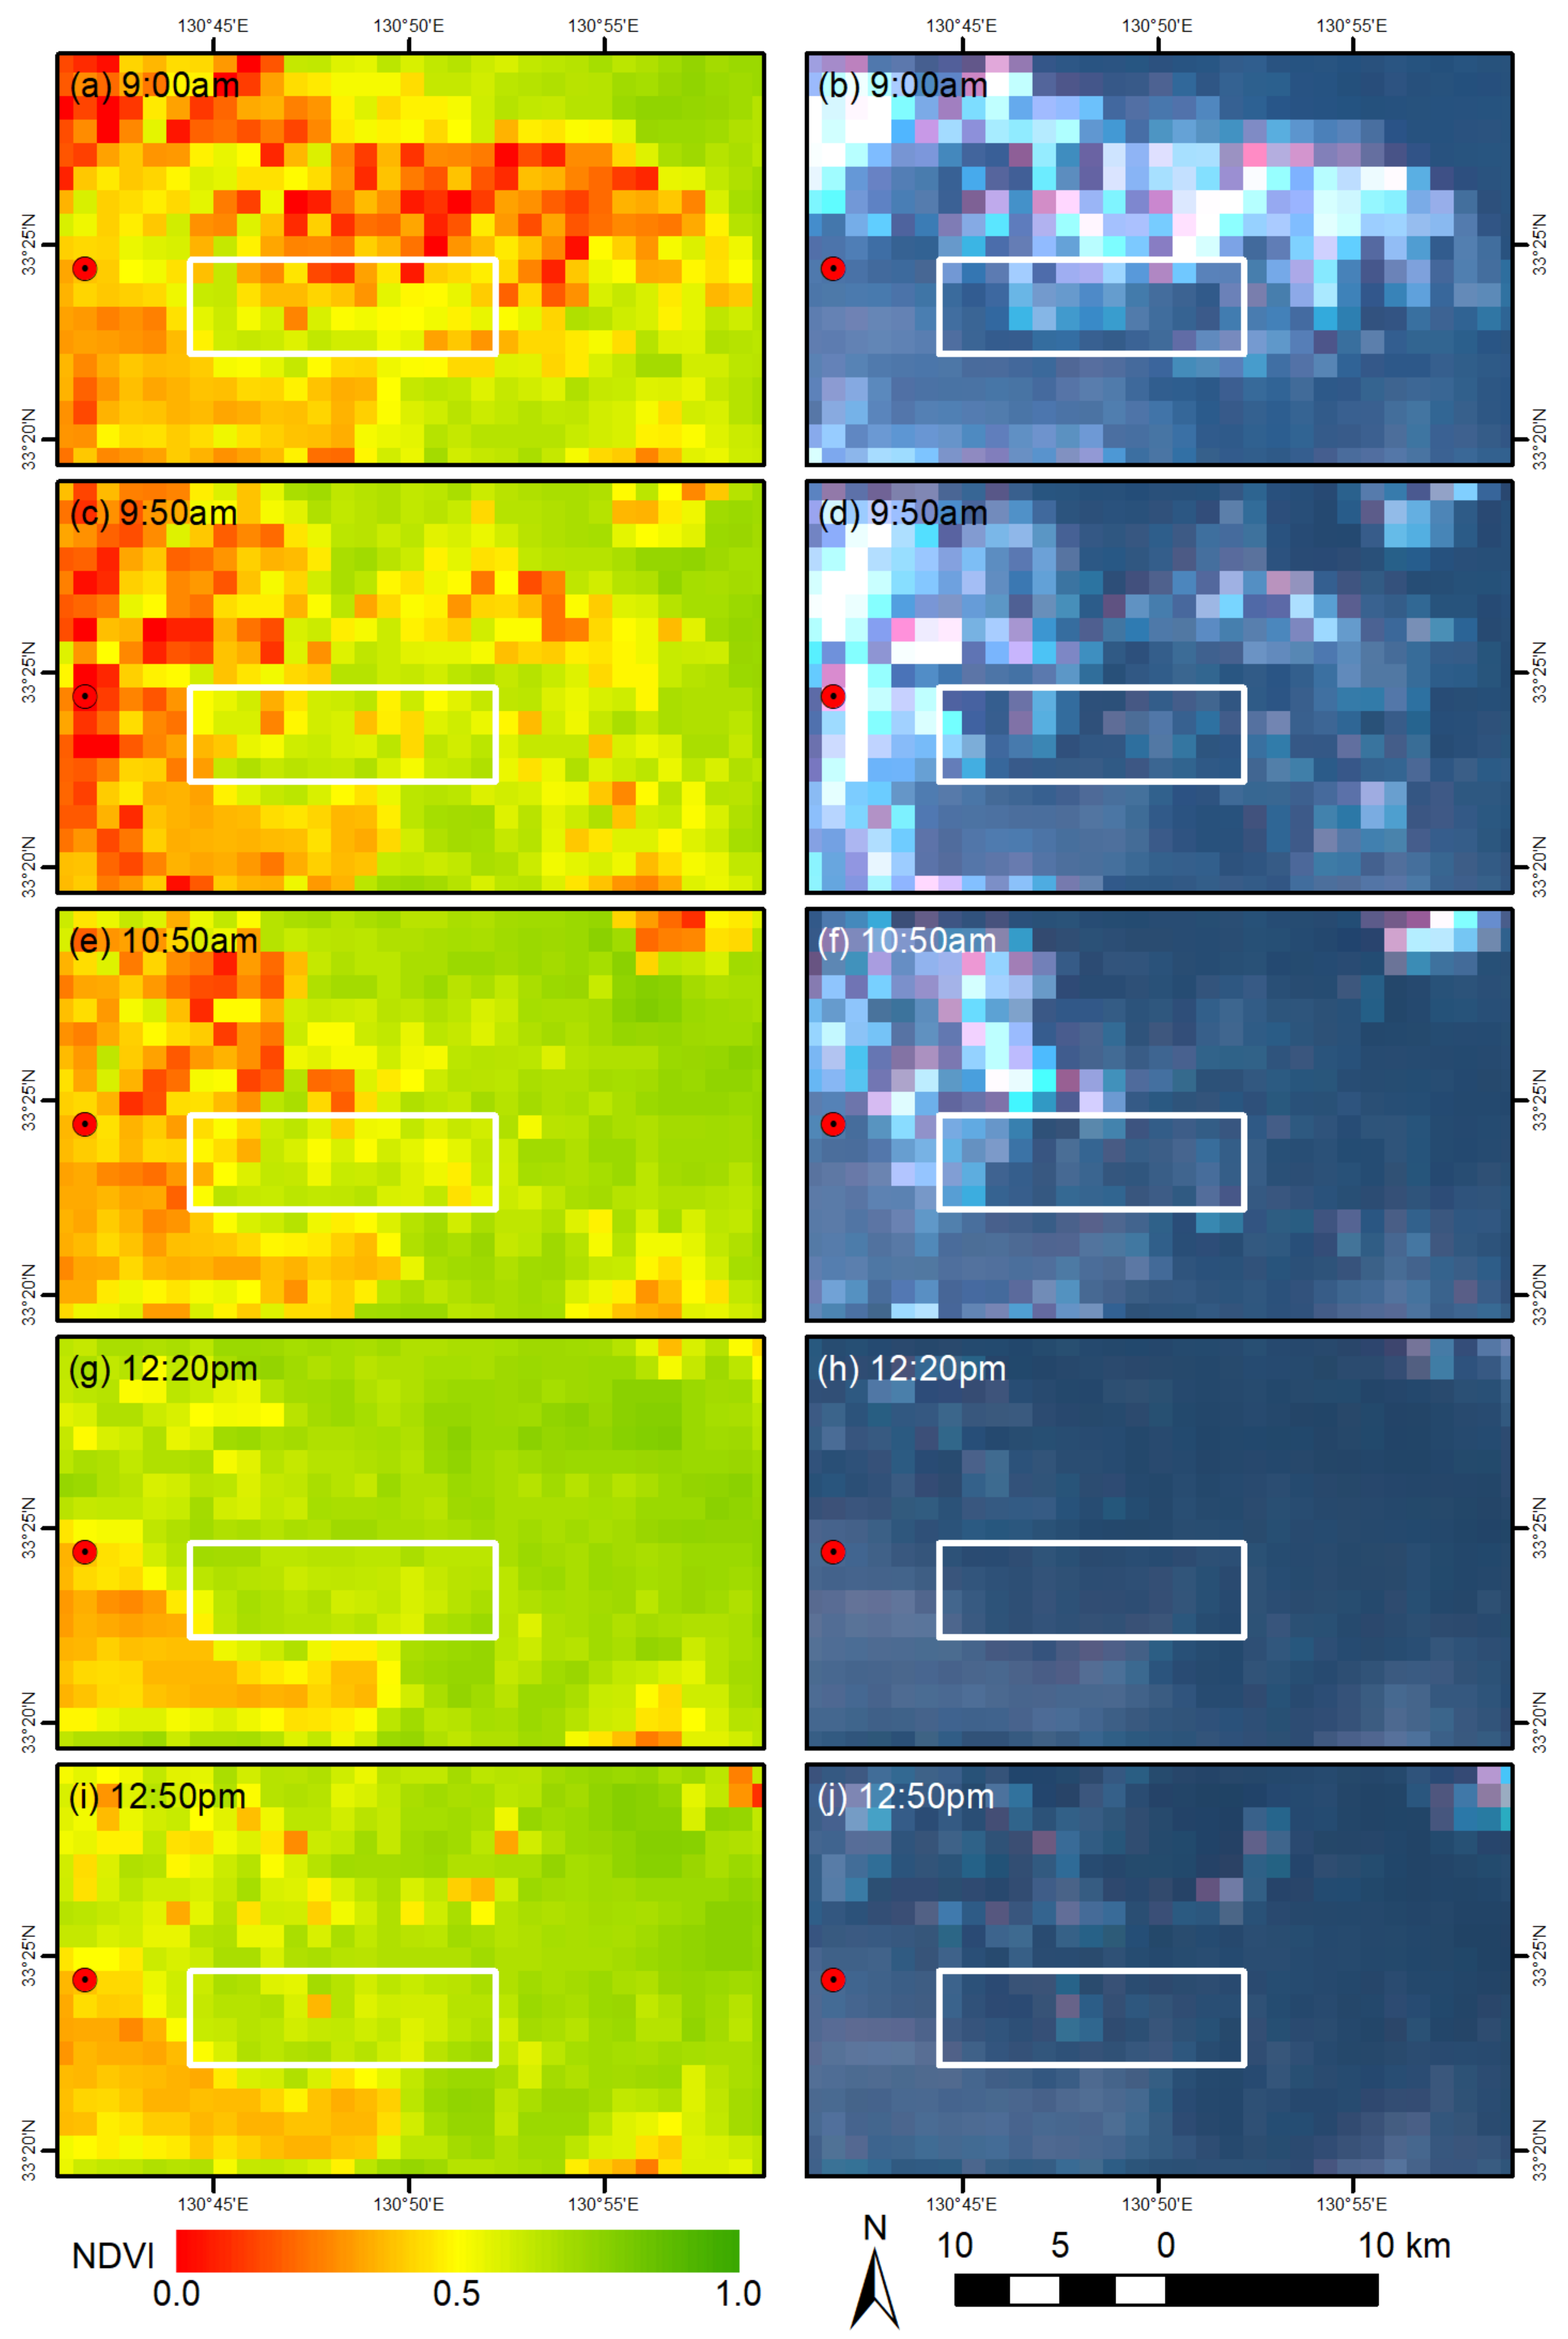
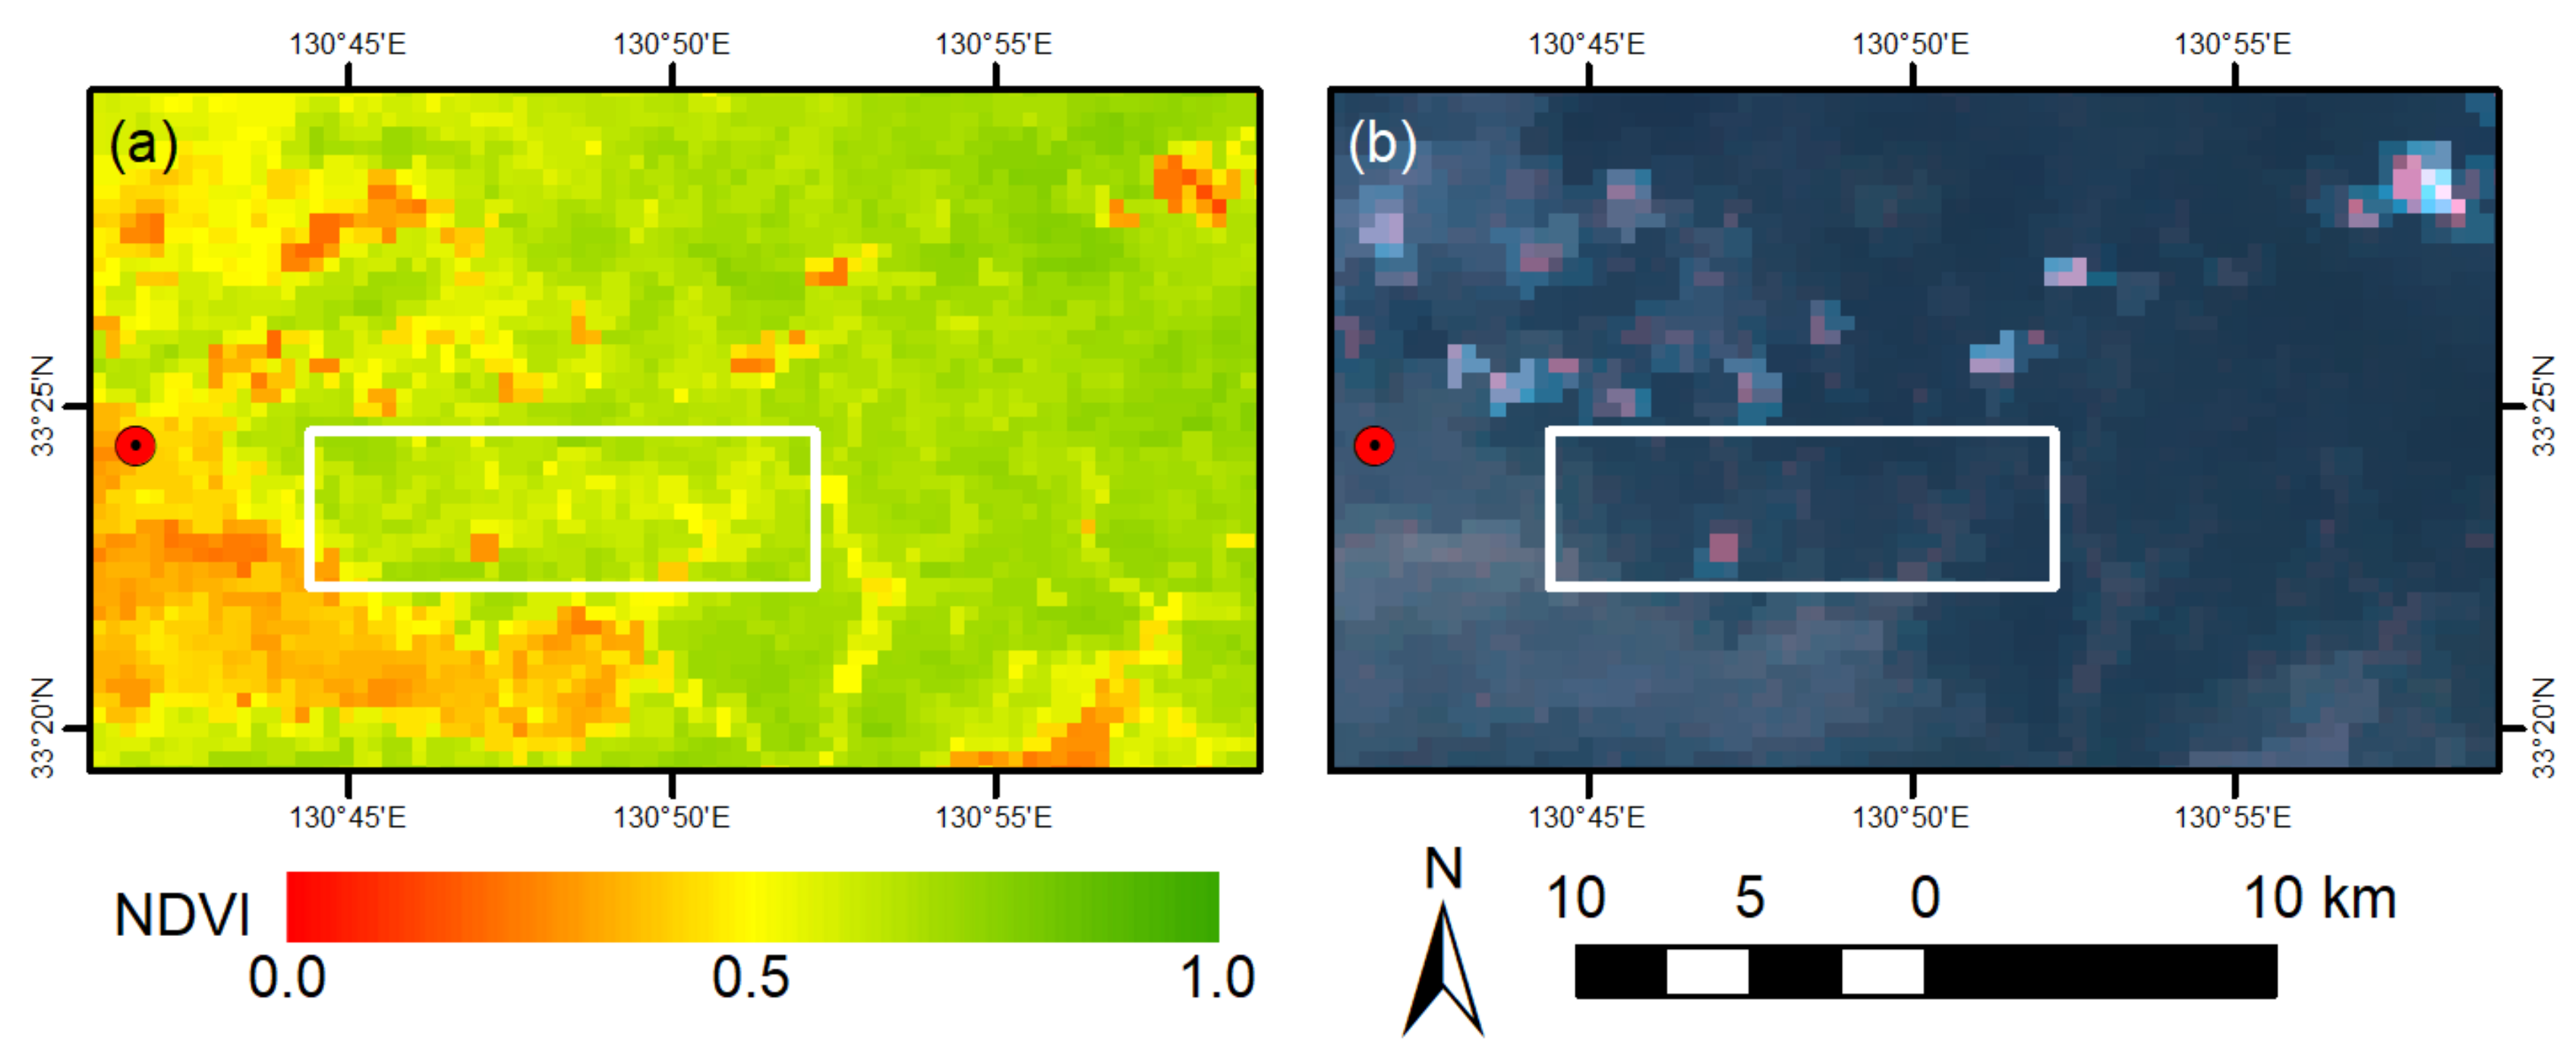
AHI NDVI and natural-color composite image pairs at select observation times for 13 July 2017 are shown in Figure 8. The landslide-affected region was covered by thick clouds at 9:00 a.m. JST (Figure 8a,b) which broke up and were dissipating at 9:50 a.m. JST (Figure 8c,d). At 10:50 a.m. JST (~Landsat-8 overpass time), the region was contaminated by several thick and thin clouds (Figure 8e,f). At 12:20 p.m. JST, there were apparently little or no clouds over the region (Figure 8g,h). A number of patchy clouds, including one in the middle of the most severely impacted region, were seen in the area at 12:50 p.m. (Figure 8i,j). VIIRS NDVI and natural-color composite images of 13 July 2017 are shown in Figure 9. A number of patchy clouds, including one in the lower middle of the most severely impacted region, were seen on the VIIRS scene. The VIIRS scene was more cloud-contaminated than the 12:20 p.m. AHI scene, but less cloud-contaminated than the 10:50 a.m. AHI scene.
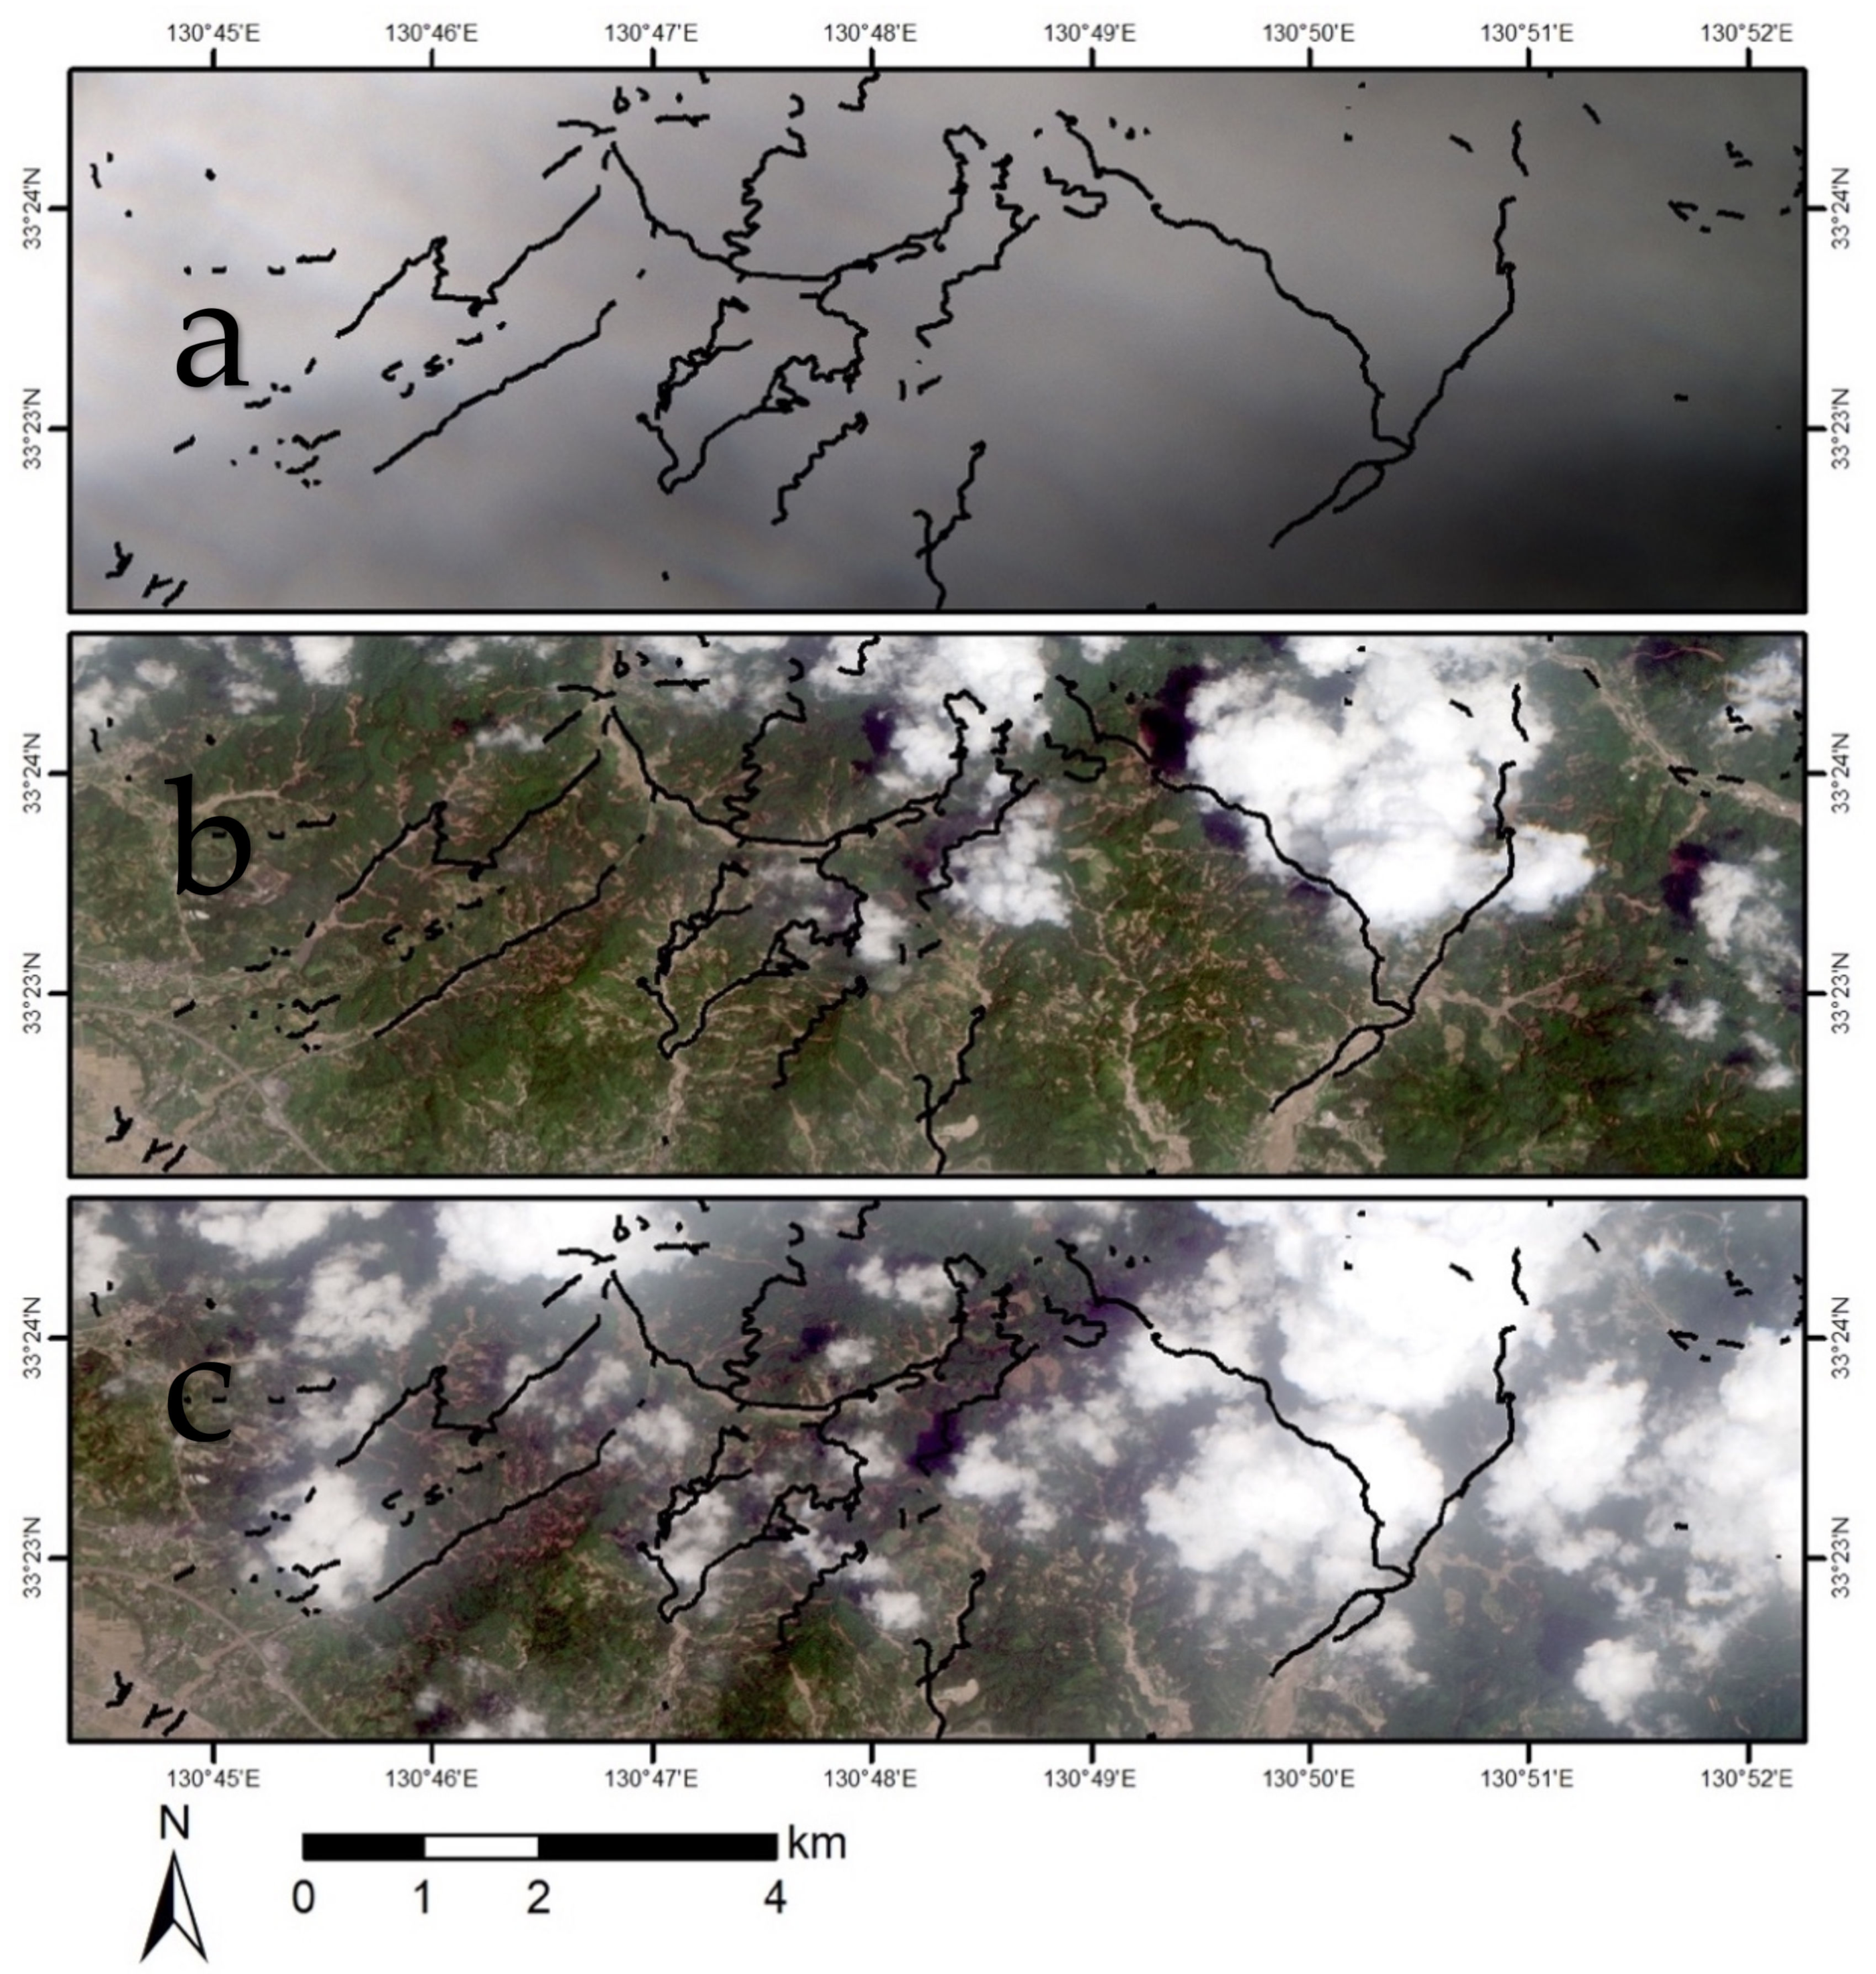
Landsat-8 OLI and Sentinel-2A/B MSI acquired three images each during the 5 July 2017 to 31 July 2017 period (Table 3). The study area happened to be located on an overlapped region of two neighboring paths of the World Reference System-2 and, thus, OLI images were available every ~8 days. Landsat-8 OLI acquired the first fair-sky condition image after the event on 13 July, the same as AHI and VIIRS as the date happened to coincide with a Landsat overpass date (Figure 10b). The second OLI image acquired on 20 July was heavily cloud-contaminated (Figure 10c). The third OLI image was acquired on 29 July and was another fair-sky image (Figure 10d). On the first and third OLI images, landslides were seen as light brown color objects due to the loss of vegetative cover.
Unlike Landsat-8, the three Sentinel-2A/B MSI images were acquired over the study area at irregular intervals on 6, 21, and 26 July 2017. The first MSI image was heavily cloud-contaminated and no surface was visible (Figure 11a). The second image was acquired over fair-sky conditions and ~80% of the heavily-landslide region was visible (Figure 11b). More than a half of the impacted region was covered by patchy clouds on the third image (Figure 11c). On the 21 July and 26 July MSI images, the areas outside patchy clouds were actually covered by optically thin clouds, but landslides could still be seen and recognizable after applying contrast stretching owing to MSI’s 10m spatial resolution.
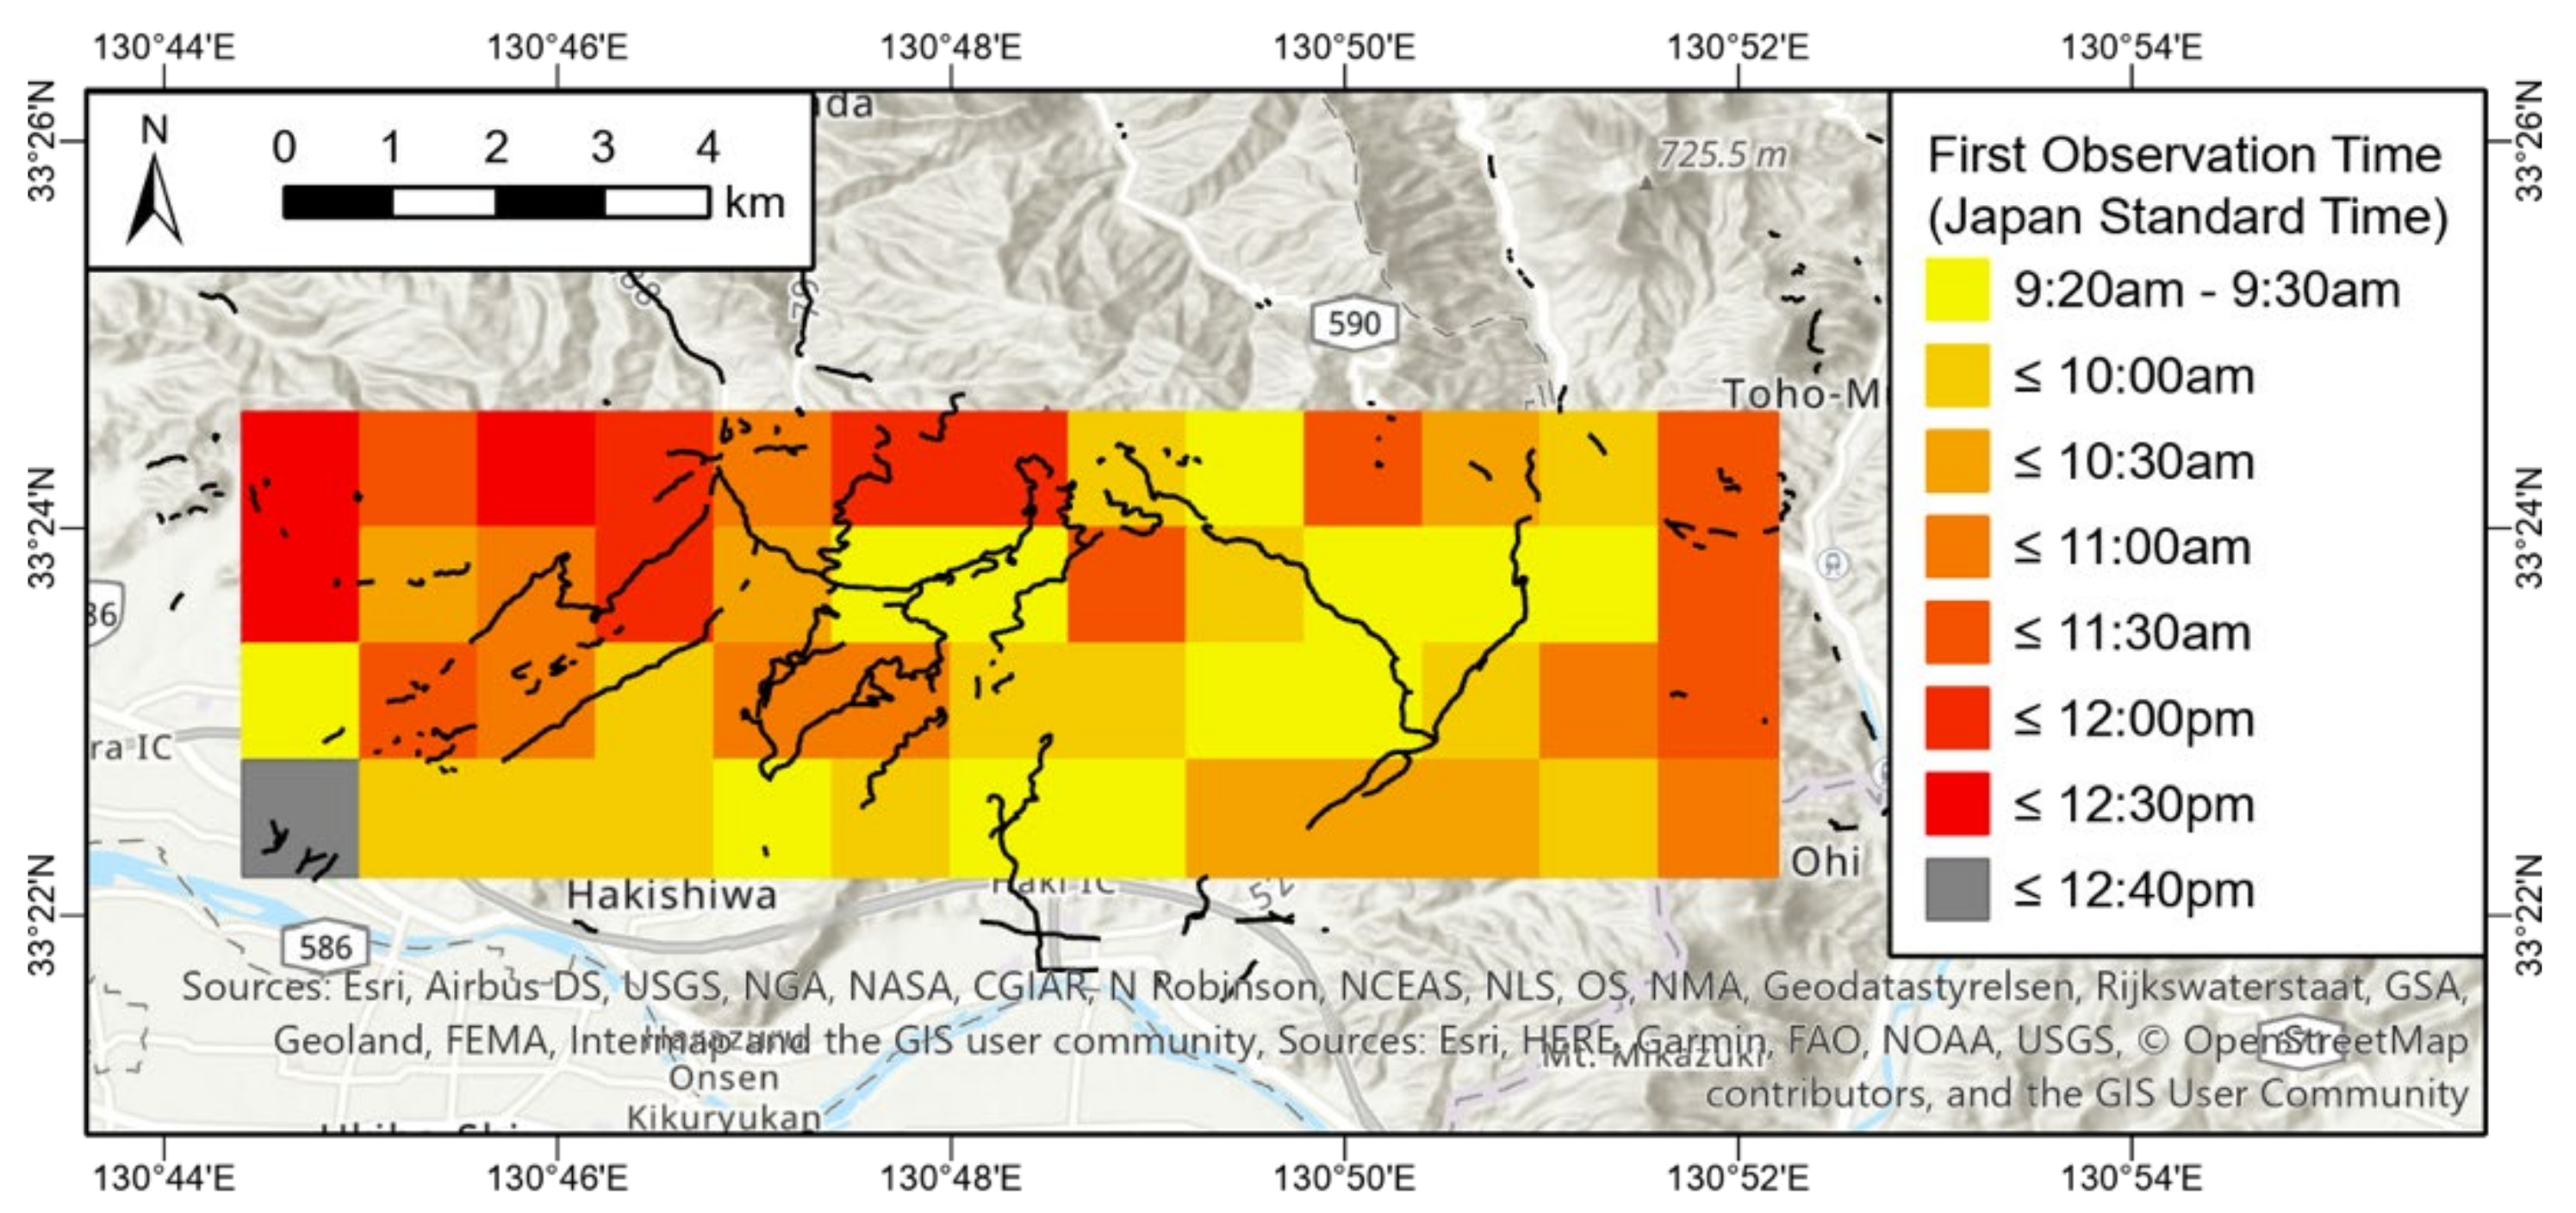
Lastly, we determined the time at which very first clear-sky observations were obtained with AHI for the boxed region in Figure 5 on 13 July 2017, the first sunny day after the rain event (Figure 12). The analysis of AHI NDVI temporal profiles with the sunshine duration data indicated that the NDVI slightly varied over time even over clear-sky conditions (i.e., Figure 7). Thus, we considered those observations whose NDVI values were greater than 0.95 times the maximum NDVI of that date confidently clear and recorded the time of first such observations found in AHI 10 min resolution data for every pixel. As seen in Figure 12, the first clear observations were acquired at various times from 9:20 a.m. JST to 12:30 p.m. JST, or a ~3 hour period. For the lower-left corner pixel, the first clear-sky observation was acquired at 12:40 p.m., but there occurred no landslide at this location (see Figure 5).
4. Discussions
4.1. AHI Landslide Detection and Latency
The study results have shown that Himawari-8 AHI NDVI, while moderate/low in spatial resolution, successfully detected landslides where the percent impacted areas were 7% or greater. Likewise, AHI NDVI 10 min temporal resolution data acquired cloud-free observations on the first sunny day (8th day) after the disaster event and also obtained cloud-free observation coverage of the whole landslide region by 12:30 p.m. JST on that day. This timing was comparable to aerial survey, which obtained near complete airphoto coverage of the region on the same 8th day [37], slightly better than SNPP VIIRS and Landsat-8 OLI, and better than Sentinel-2A/B MSI. The first near cloud-free VIIRS and OLI images were also acquired on the same 8th day after the rain event, but some part of the images were covered by patchy clouds. The first fair-sky MSI image was acquired on the 16th day after the event, 8 days later than AHI.
For this particular study, we were able to obtain a near cloud-free OLI image of the region with more landslides on the first sunny day after the torrential rain event simply because the first sunny day happened to coincide with a Landsat-8 overpass date. Sentintel-2 MSI did not have the claimed 5 day temporal resolution for the study area and, even if it had acquired image data every 5 days (i.e., on 11 and 16 July 2017), it would still have been the same date of 21 July 2017 on which MSI had acquired its first fair-sky image after the rain event. Based on the sunshine duration data and AHI NDVI temporal profiles, it was apparently cloudy on 11 and 16 July 2017. These results indicate that the chance of obtaining cloud-free imagery from Landsat- and Sentinel-type satellites may largely vary geographically. It should be noted, however, that OLI and MSI images were found still very useful for visual assessment of impacted areas even when they were covered by clouds as long as clouds were transparent to semi-transparent (e.g., cirrus clouds), owing to their high spatial resolution. Basic, conventional image enhancement techniques such as contrast stretching, easily improved the visibility of surface features well enough to observe and delineate landslides on the enhanced images. This would not be an applicable approach for the AHI or VIIRS moderate/low spatial resolution NDVI-based landslide detection method, as semi-transparent clouds lower the NDVI.
The study results also indicated that AHI had a higher chance of obtaining cloud-free observations than VIIRS due to its 10 min temporal resolution. There were, however, days when VIIRS acquired cloud-free observations, but AHI did not. On these days, not all the four VIIRS pixels within the corresponding AHI 1° by 1° grid were cloud-free, indicating the advantage of higher spatial resolution data. There were also days on which AHI NDVI and sunshine duration data indicated were sunny for most of the 6 hour (9:00 a.m. to 3:00 p.m. JST) analysis period, but VIIRS did not obtain any cloud-free observations. This can be attributed to the viewing geometry difference between the two sensors. It is likely that clouds had only been visible from the VIIRS line of sight, but not from AHI’s view zenith and azimuth angles.
4.2. AHI Landslide Detectability
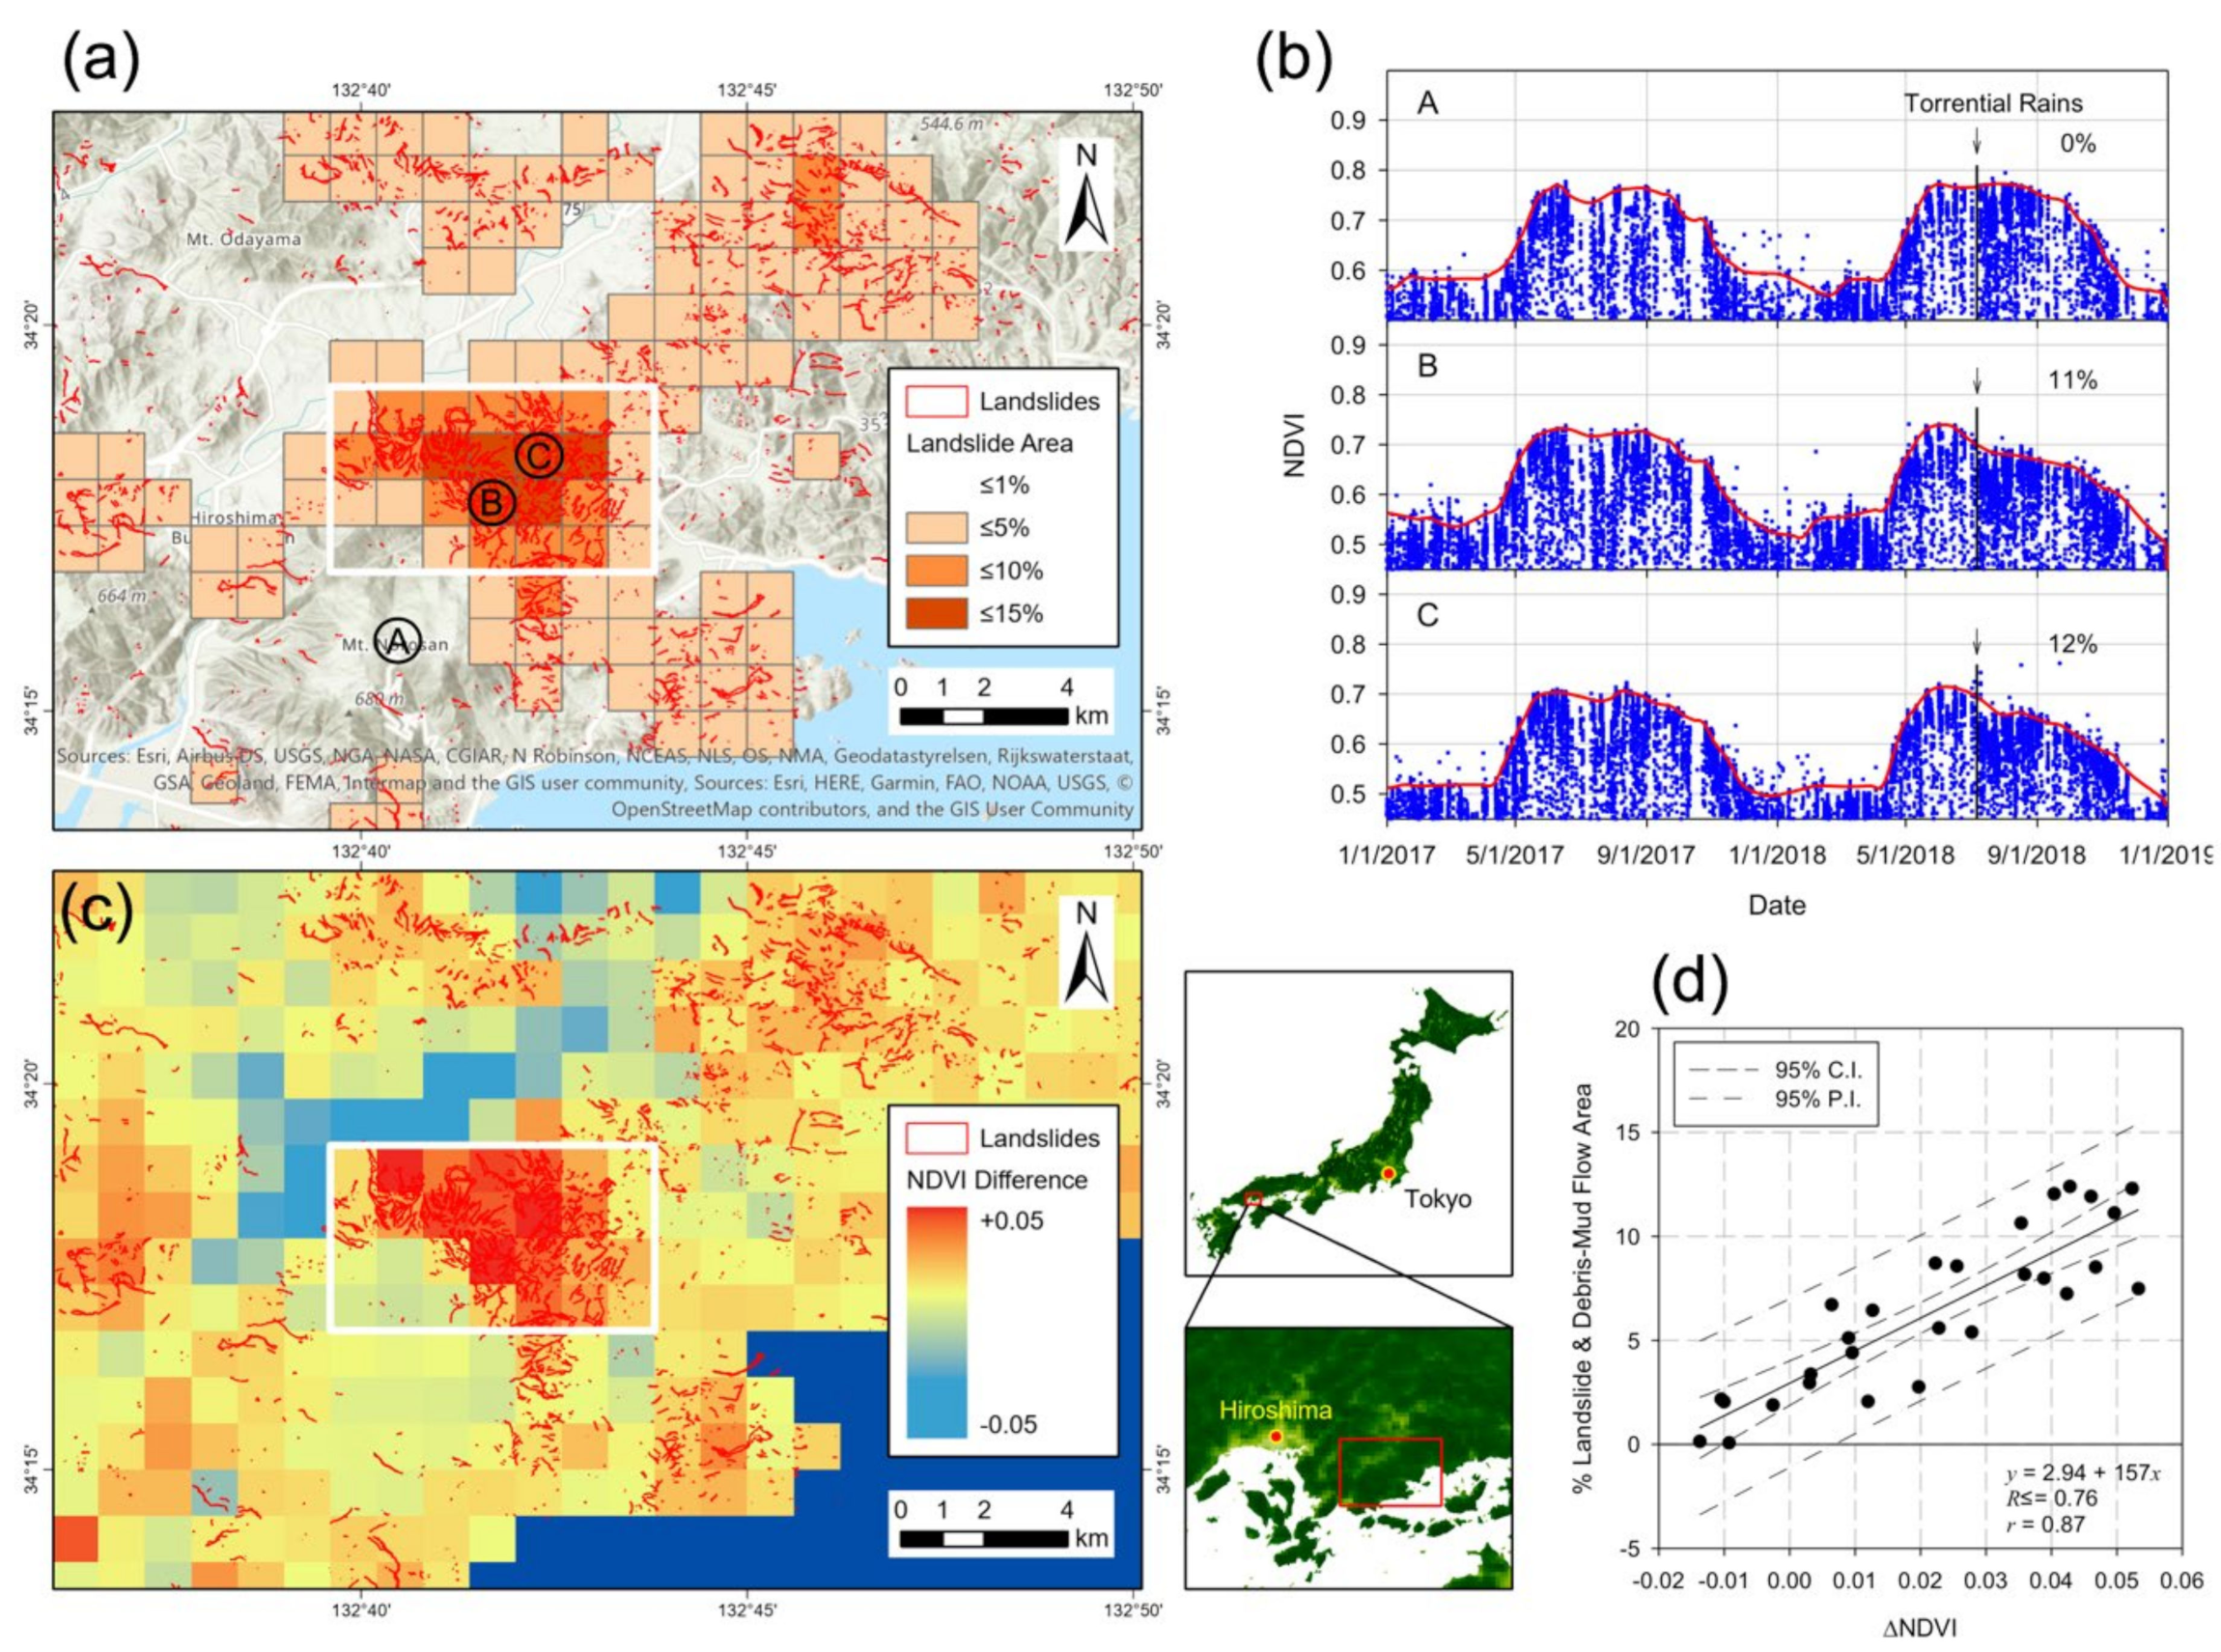
Can AHI detect landslides in other areas under different conditions? To address this question, the same methods were applied for detecting landslides in a mountainous region in Hiroshima, Japan (Figure 13) due to another torrential rain event, the “Western Japan Heavy Rain of July 2018” [42]. This heavy rain event was characterized by rainfall that was unusually widespread spatially and persistent temporally [43]. During the event, the maximum one hour and 24 hour precipitation amounts of 51.5 and 309.5 mm were observed at the AMeDAS Kure weather station (N 34°14.4′, E 132°33.0′, 4 m ASL) in Hiroshima [44]. In the prefecture, the death toll was 115 and 15,828 houses were completely destroyed or partially damaged [45]. The primary rock types in this mountainous region are Late Cretaceous rhyolites (Takada Rhyolites and Hikimi Group) and granites (Hiroshima Granitic Rocks) [26]. The region is covered by evergreen needleleaf forests, with the dominant overstory species of Japanese red pine (Pinus densiflora), Japanese cedar (Cryptomeria japonica), Japanese cypress (Chamaecyparis obtusa), and sawara cypress (Chamaecyparis pisifera), which are interspersed with deciduous broadleaf Quercus serrata communities [27]. A vector dataset of landslides and debris-mud flows delineated based on visual interpretations of aerial photos acquired by GSI after the rain event [46] was obtained and used as a reference (see Figure 13a,c) [47]. Additional AHI data were processed using the methods described in Section 2.4 and AHI NDVI data were extended to cover the year 2018.
The percent landslide area values in this event were not as large as those in the northern Kyushu event (Figure 13a). Those greater than 10% were found in a 3 km (North–South) by 4 km (East–West) region (inside the white line box in Figure 13a). AHI NDVI extracted from the region abruptly dropped after the rain event (Figure 13b), the same as what was observed for the northern Kyushu rain event. The spatial distribution of ΔNDVI was comparable to that of the landslide-impacted area (Figure 13c); however, ΔNDVI was apparently a good indicator of landslides when the percent landslide area was large (>7%) (Figure 13d). These results are comparable to those obtained for the northern Kyushu event.
4.3. Potential Operational Scenarios
The results of this study suggest that new generation geostationary satellite data can be useful for post-event, region-wide initial assessment of landslide-impacted areas after a heavy rain event because of their hyper-temporal resolution. Given that geostationary satellite data have operationally been used for the monitoring of evolving weather conditions and weather forecasting, it is a logical and new application of geostationary satellite data to monitor the surface conditions simultaneously. That is, while monitoring post-event weather conditions with geostationary satellite data, preliminary assessment of the area of impact (AOI) can be made at the same time. The derived preliminary impact assessment information can be used for more detail assessment planning with drone, helicopter, and airborne digital photography. In another application field of wildfire science, several studies have reported the great advantage of Himawari-8 AHI 10 min resolution data, which allowed for the near real-time monitoring of both the spread rate and direction of wildfire in Australia [21,22].
This study focused on the utility of Himawari-8 AHI NDVI data for the initial situational assessment of landslide-impacted areas. Geostationary satellite data have been shown to obtain finer NDVI temporal signatures than conventional polar-orbiting satellites [48]. Several researchers found remote sensing time series image data useful for studying the long-term impact of extreme weather events as well as repeated events on the ecosystem structure and functions [49,50,51,52]. Fine NDVI temporal signatures obtainable with geostationary satellite data present the potential to improve our understanding of long-term ecological impacts of extreme weather events. The improved ability of geostationary satellite data to characterize the ecosystem structure and functions is also expected to be useful for predicting and delineating landslide-suspected areas as part of pre-event assessment because the susceptibility of an area to landslide is often associated with the ecosystem structure of the area (e.g., primary vs. regenerating forests, and the existence of understory cover) [53,54]. Including other geophysical variables, such as those describing topographic characteristics, is expected to augment and enhance the satellite-based landslide prediction [55].
Recently, several studies reported the potential of satellite synthetic aperture radar (SAR) data for detecting landslides due to heavy rains [56,57]. Their detection methodologies were based on the backscattering coefficient difference and the intensity correlation between pre- and post-disaster SAR images. Radar remote sensing is an attractive tool to map landslides for their all weather and day/night observation capabilities, but the current methodologies still suffer from low accuracies (i.e., 30–40% producer’s and 30–40% user’s accuracies [56,57]). One effective approach can be to take advantage of all the weather observation capabilities of SAR data to augment the AOI assessment with hyper-temporal geostationary satellite data.
5. Conclusions
In this study, we investigated the utility of Himawari-8 AHI data for mapping the spatial extent of landslide-affected areas due to the torrential rain event that hit the northern Kyushu, Japan on 5 July 2017. The study results have shown that AHI NDVI moderate/low spatial resolution data successfully detected landslides where the percent landslide area was greater than 7%. The study has also shown that AHI NDVI 10 min temporal resolution data obtained near cloud-free coverage of the impacted region by the 8th day after the disaster event. This timeline was comparable to aerial survey, slightly better than SNPP VIIRS and Landsat-8 OLI, and better than Sentinel-2A/B MSI. These results suggest that new generation geostationary satellite data can be useful for post-event, region-wide initial assessment of disaster-impacted areas. Hyper-temporal, high-spatial resolution remote sensing is one significant gap in the current remote sensing technologies and the most desirable for disaster response and management. Geostationary high-spatial resolution satellite sensors may be one way to improve and enhance the satellite-based monitoring capabilities.
Author Contributions
Conceptualization, T.M. and S.N.; Methodology, T.M. and S.N.; Software, T.M.; Validation, T.M. and S.N.; Formal analysis, T.M.; Investigation, T.M.; Resources, T.M. and S.N.; Data curation, T.M. and S.N.; Writing—Original draft preparation, T.M.; Writing—Review and editing, S.N.; Visualization, T.M.; Supervision, T.M. and S.N.; Project administration, T.M. and S.N.; Funding acquisition, T.M. and S.N. All authors have read and agreed to the published version of the manuscript.
Funding
The study was supported partially by a Japan Society for the Promotion of Science (JSPS) Invitational Fellowship (ID No. L18554 T.M. and S.N.).
Acknowledgments
Himawari-8 gridded data used in the study were distributed by CEReS, Chiba University, Japan.
Conflicts of Interest
The authors declare no conflict of interest. The funders had no role in the design of the study; in the collection, analyses, or interpretation of data; in the writing of the manuscript, or in the decision to publish the results.
Appendix A. AHI NDVI Data Filtering and Smoothing
AHI NDVI data contained a large number of suspicious observations due to cloud contaminations and red-to-NIR inter-band misregistration [48] (see Figure 4). Thus, we extracted smoothed trends from AHI NDVI by adapting and applying a combination of popular filtering and smoothing methods to AHI 10 min resolution data [58,59]. Our algorithm first removed all observations whose NDVI values were below the 95th percentile on a daily basis. It then applied a 7 day moving window filter to remove remaining suspicious observations whose NDVI values were lower than the local maximum (found in the moving window) minus 0.06 NDVI units. The algorithm further applied a 31 day moving window filter to remove additional observations whose NDVI values were larger or smaller than the local mean ± two local standard deviations computed from all NDVI values found within the moving window. Third, we applied the best index slope extraction (BISE) method [60] to select a final set of row observations. Lastly, the algorithm linearly interpolated NDVI values for days without observations (daily time-step) and applied a Savitzky–Golay lowpass filter (31 days).
References
- Seneviratne, S.I.; Nicholls, N.; Easterling, D.; Goodess, C.M.; Kanae, S.; Kossin, J.; Luo, Y.; Marengo, J.; McInnes, K.; Rahimi, M.; et al. Changes in climate extremes and their impacts on the natural physical environment. In Managing the Risks of Extreme Events and Disasters to Advance Climate Change Adaptation. A Special Report of Working Groups I and II of the Intergovernmental Panel on Climate Change (IPCC); Field, C.B., Barros, V., Stocker, T.F., Qin, D., Dokken, D.J., Ebi, K.L., Mastrandrea, M.D., Mach, K.J., Plattner, G.-K., Allen, S.K., Eds.; Cambridge University Press: Cambridge, UK; New York, NY, USA, 2012; pp. 109–230. [Google Scholar]
- National Academies of Sciences, Engineering, and Medicine. Attribution of Extreme Weather Events in the Context of Climate Change; The National Academies Press: Washington, DC, USA, 2016. [Google Scholar]
- Handmer, J.; Honda, Y.; Kundzewicz, Z.W.; Arnell, N.; Benito, G.; Hatfield, J.; Mohamed, I.F.; Peduzzi, P.; Wu, S.; Sherstyukov, B.; et al. Changes in impacts of climate extremes: Human systems and ecosystems. In Managing the Risks of Extreme Events and Disasters to Advance Climate Change Adaptation. A Special Report of Working Groups I and II of the Intergovernmental Panel on Climate Change (IPCC); Field, C.B., Barros, V., Stocker, T.F., Qin, D., Dokken, D.J., Ebi, K.L., Mastrandrea, M.D., Mach, K.J., Plattner, G.-K., Allen, S.K., et al., Eds.; Cambridge University Press: Cambridge, UK; New York, NY, USA, 2012; pp. 231–290. [Google Scholar]
- Cogato, A.; Meggio, F.; De Antoni Migliorati, M.; Marinello, F. Extreme weather events in agriculture: A systematic review. Sustainability 2019, 11, 2547. [Google Scholar] [CrossRef] [Green Version]
- Franca, F.M.; Benkwitt, C.E.; Paalta, G.; Robinson, J.P.W.; Graham, N.A.J.; Tylianakis, J.M.; Berenguer, E.; Lees, A.C.; Ferreirav, J.; Louzada, J.; et al. Climatic and local stressor interactions threaten tropical forests and coral reefs. Philos. Trans. R. Soc. B 2020, 375, 20190116. [Google Scholar] [CrossRef] [PubMed] [Green Version]
- Normile, D. Deadly Typhoon Forces Japan to Face its Vulnerability to Increasingly Powerful Storms. Science 2019. Available online: https://www.sciencemag.org/news/2019/10/deadly-typhoon-forces-japan-face-its-vulnerability-increasingly-powerful-storms (accessed on 26 May 2020). [CrossRef]
- Huyck, C.; Verrucci, E.; Bevington, J. Chapter 1—Remote Sensing for Disaster Response: A Rapid, Image-Based Perspective. In Earthquake Hazard, Risk and Disasters; Shroder, J.F., Wyss, M., Eds.; Academic Press: Boston, MA, USA, 2014; pp. 1–24. [Google Scholar]
- Chung, H.-W.; Liu, C.-C.; Cheng, I.-F.; Lee, Y.-R.; Shieh, M.-C. Rapid response to a typhoon-induced flood with an SAR-derived map of inundated areas: Case study and validation. Remote Sens. 2015, 7, 11954–11973. [Google Scholar] [CrossRef] [Green Version]
- Zheng, Y.; Shao, G.; Tang, L.; He, Y.; Wang, X.; Wang, Y.; Wang, H. Rapid assessment of a typhoon disaster based on NPP-VIIRS DNB daily data: The case of an urban agglomeration along Western Taiwan Straits, China. Remote Sens. 2019, 11, 1709. [Google Scholar] [CrossRef] [Green Version]
- Román, M.O.; Stokes, E.C.; Shrestha, R.; Wang, Z.; Schultz, L.; Carlo, E.A.S.; Sun, Q.; Bell, J.; Molthan, A.; Kalb, V.; et al. Satellite-based assessment of electricity restoration efforts in Puerto Rico after Hurricane Maria. PLoS ONE 2019, 14, e0218883. [Google Scholar] [CrossRef]
- Boschetti, M.; Nelson, A.; Nutini, F.; Manfron, G.; Busetto, L.; Barbieri, M.; Laborte, A.; Raviz, J.; Holecz, F.; Mabalay, R.O.M.; et al. Rapid assessment of crop status: An application of MODIS and SAR data to rice areas in Leyte, Philippines affected by Typhoon Haiyan. Remote Sens. 2015, 7, 6535–6557. [Google Scholar] [CrossRef] [Green Version]
- Mondini, A.C.; Guzzetti, F.; Reichenbach, P.; Rossi, M.; Cardinali, M.; Ardizzone, F. Semi-automatic recognition and mapping of rainfall induced shallow landslides using optical satellite images. Remote Sens. Environ. 2011, 115, 1743–1757. [Google Scholar] [CrossRef]
- Huang, Q.; Wang, C.; Meng, Y.; Chen, J.; Yue, A. Landslide monitoring using change detection in multitemporal optical imagery. IEEE Geosci. Remote Sens. Lett. 2020, 17, 312–316. [Google Scholar] [CrossRef]
- Yang, W.; Wang, M.; Shi, P. Using MODIS NDVI time series to identify geographic patterns of landslides in vegetated regions. IEEE Geosci. Remote Sens. Lett. 2013, 10, 707–710. [Google Scholar] [CrossRef]
- Deijns, A.A.J.; Bevington, A.R.; van Zadelhoff, F.; de Jong, S.M.; Geertsema, M.; McDougall, S. Semi-automated detection of landslide timing using harmonic modelling of satellite imagery, Buckinghorse River, Canada. Int. J. Appl. Earth Obs. Geoinf. 2020, 84, 101943. [Google Scholar] [CrossRef]
- Hölbling, D.; Friedl, B.; and Eisank, C. An object-based approach for semi-automated landslide change detection and attribution of changes to landslide classes in northern Taiwan. Earth Sci. Inform. 2015, 8, 327–335. [Google Scholar] [CrossRef] [Green Version]
- Disaster Information, the Fire and Disaster Management Agency, the Ministry of Internal Affairs and Communcations. Available online: https://www.fdma.go.jp/disaster/info/2019/ (accessed on 28 December 2019). (In Japanese).
- Schmit, T.J.; Lindstrom, S.S.; Gerth, J.J.; Gunshor, M.M. Applications of the 16 spectral bands on the Advanced Baseline Imager (ABI). J. Oper. Meteorol. 2018, 6, 33–46. [Google Scholar] [CrossRef]
- Bessho, K.; Date, K.; Hayashi, M.; Ikeda, A.; Imai, T.; Inoue, H.; Kumagai, Y.; Miyazawa, T.; Murata, H.; Ohno, T.; et al. An introduction to Himawari-8/9—Japan’s new-generation geostationary meteorological satellites. J. Meteorol. Soc. Jpn. 2016, 94, 151–183. [Google Scholar] [CrossRef] [Green Version]
- Yan, D.; Zhang, X.; Nagai, S.; Yu, Y.; Akitsu, T.; Nasahara, K.N.; Ide, R.; Maeda, T. Evaluating land surface phenology from the Advanced Himawari Imager using observations from MODIS and the Phenological Eyes Network. Int. J. Appl. Earth Obs. Geoinf. 2019, 79, 71–83. [Google Scholar] [CrossRef]
- Xu, G.; Zhong, X. Real-time wildfire detection and tracking in Australia using geostationary satellite: Himawari-8. Remote Sens. Lett. 2017, 8, 1052–1061. [Google Scholar] [CrossRef]
- Liu, X.; He, B.; Quan, X.; Yebra, M.; Qui, S.; Yin, C.; Liao, Z.; Zhang, H. Near real-time extracting wildfire spread rate from Himawai-8 satellite data. Remote Sens. 2018, 10, 1654. [Google Scholar] [CrossRef] [Green Version]
- National Land Numerical Information Download Service. Available online: http://nlftp.mlit.go.jp/ksj-e/index.html (accessed on 11 February 2020).
- Geospatial Information Authority of Japan. 2017. Available online: https://www.gsi.go.jp/common/000194860.zip (accessed on 28 December 2019).
- Global Map Japan, Geospatial Information Authority of Japan. Available online: http://www.gsi.go.jp/kankyochiri/gm_japan_e.html (accessed on 21 December 2019).
- Online Geological Map of Japan, Geological Survey of Japan. Available online: https://www.gsj.jp/en/education/geomap-e/online-map.html (accessed on 24 May 2020).
- Vegetation Survey (6th -), Biodiversity Center of Japan. Available online: http://www.biodic.go.jp/trialSystem/EN/info/vg67.html (accessed on 24 May 2020).
- Northern Kyushu Torrential Rain of July 2017. Available online: http://www.jma.go.jp/jma/press/1707/19a/20170719_sankou.pdf (accessed on 11 February 2020). (In Japanese)
- Japan Meteorological Agency. Heavy Rain and Storm Associated with Baiu and Typhoon-3. 2017. Available online: https://www.data.jma.go.jp/obd/stats/data/bosai/report/2017/20170711/jyun_sokuji20170630-0710.pdf (accessed on 21 December 2019). (In Japanese)
- Kato, R.; Shimose, K.; Shimizu, S. Predictability of precipitation caused by linear precipitation systems during the July 2017 Northern Kyushu heavy rainfall event using a cloud-resolving numerical weather prediction model. J. Disaster Res. 2018, 13, 846–859. [Google Scholar] [CrossRef]
- Ozaki, A.; Hiramatsu, K.; Hama, T. Survey of agricultural reservoirs damaged by the July 2017 torrential rains in northern Kyushu, Japan. Paddy Water Environ. 2019, 17, 237–246. [Google Scholar] [CrossRef]
- Danjo, T.; Ishizawa, T.; Kimura, T. Spatial analysis of the landslide characteristics caused by heavy rainfall in the northern Kyushu district in July, 2017 using topography, geology, and rainfall levels. J. Disaster Res. 2018, 13, 832–845. [Google Scholar] [CrossRef]
- Fire and Disaster Management Agency. Data on Casualty and Damage Due to Torrential Rain Associated with Baiu and Typhoon-3. 2018. Available online: https://www.fdma.go.jp/disaster/info/items/b415db68eb0850414c74aca2f164cf3dbda5c43a.pdf (accessed on 11 February 2020). (In Japanese)
- Murakami, W.; Yasuda, Y. Relationship between landslides and rainfall distribution in the torrential rain in northern Kyushu in 2017. Bull. FFPRI 2018, 17, 111–115. [Google Scholar] [CrossRef]
- Natural Disaster Information Center of Western Japan. Western Japan NDIC News No. 58. 2018. Available online: http://www7.civil.kyushu-u.ac.jp/ndicwj/pdf/no58_2.pdf (accessed on 21 December 2019). (In Japanese).
- National Research Institute for Earth Science and Disaster Resilience. Field Suvery Report on Landslides and Flooding in the Northan Kyushu Area and Shimane Prefecture due to Torrential Rain of July 2017. 2017. Available online: http://mizu.bosai.go.jp/key/2017kyushushimane (accessed on 12 February 2020).
- Geospatial Information Authority of Japan. Information about the Northern Kyushu Torrential Rain of July 2017. 2017. Available online: https://www.gsi.go.jp/BOUSAI/H29hukuoka_ooita-heavyrain.html (accessed on 24 December 2020). (In Japanese)
- Reda, I.; Andreas, A. Solar position algorithm for solar radiation applications. Sol. Energy 2004, 76, 577–589. [Google Scholar] [CrossRef]
- Fensholt, R.; Anyamba, A.; Stisen, S.; Sandholt, I.; Pak, E.; Small, J. Comparisons of compositing period length for vegetation index data from polar-orbiting and geostationary satellites for the cloud-prone region of West Africa. Photogramm. Eng. Remote Sens. 2007, 73, 297–309. [Google Scholar] [CrossRef]
- Manago, N. Atmospheric correction of satellite image using python, Lecture series 2: Atmospheric correction with a standard atmosphere model. J. Remote Sens. Soc. Jpn. 2016, 36, 572–576. [Google Scholar]
- WMO. Guide to Meteorological Instruments and Methods of Observation; World Meteorological Organization: Geneva, Switzerland, 2008. [Google Scholar]
- The Torrential Rain of July 2018. Available online: https://www.data.jma.go.jp/obd/stats/data/bosai/report/2018/20180713/jyun_sokuji20180628-0708.pdf (accessed on 23 May 2020). (In Japanese).
- Tsuguti, H.; Seino, N.; Kawase, H.; Imada, Y.; Nakaegawa, T.; Takayabu, I. Meteorological overview and mesoscale characteristics of the Heavy Rain Event of July 2018 in Japan. Landslides 2019, 16, 363–371. [Google Scholar] [CrossRef]
- The Typhoon Prapiroon and Baiu Front Heavy Rain of 3–8 July 2018 (Hiroshima Prefecture Weather Report). Available online: https://www.jma-net.go.jp/hiroshima/siryo/20180709_sokuhou.pdf (accessed on 24 May 2020). (In Japanese).
- Damage Situation due to the Western Japan Heavy Rain of July 2018. Available online: http://www.bousai.go.jp/updates/h30typhoon7/pdf/310109_1700_h30typhoon7_01.pdf (accessed on 24 May 2020). (In Japanese)
- Geospatial Information Authority of Japan. 2018. Available online: https://www.gsi.go.jp/BOUSAI/H30.taihuu7gou.html (accessed on 19 May 2020). (In Japanese)
- Hiroshima University Disaster Investigation Group for the July 2018 Heavy Rain. Landslide Map of Hiroshima Prefecture due to the July 2018 Heavy Rain. 2018. Available online: http://ajg-disaster.blogspot.com/2018/07/3077.html (accessed on 19 May 2020). (In Japanese).
- Miura, T.; Nagai, S.; Takeuchi, M.; Ichii, K.; Yoshioka, H. Improved characterisation of vegetation and land surface seasonal dynamics in Central Japan with Himawari-8 hypertemporal data. Sci. Rep. 2019, 9, 15692. [Google Scholar] [CrossRef] [Green Version]
- Parker, G.; Martínez-Yrízar, A.; Álvarez-Yépiz, J.C.; Maass, M.; Araiza, S. Effects of hurricane disturbance on a tropical dry forest canopy in western Mexico. For. Ecol. Manag. 2018, 426, 39–52. [Google Scholar] [CrossRef]
- Buitre, J.C.M.; Zhang, H.; Lin, H. The mangrove forests change and impacts from tropical cyclones in the Philippines using time series satellite imagery. Remote Sens. 2019, 11, 688. [Google Scholar] [CrossRef] [Green Version]
- Lee, M.-F.; Lin, T.-C.; Vadeboncoeur, M.A.; Hwong, J.-L. Remote sensing assessment of forest damage in relation to the 1996 strong typhoon Herb at Lienhuachi Experimental Forest, Taiwan. For. Ecol. Manag. 2008, 255, 3297–3306. [Google Scholar] [CrossRef]
- Hong, N.M.; Chu, H.-J.; Lin, Y.-P.; Deng, D.-P. Effects of land cover changes induced by large physical disturbances on hydrological responses in Central Taiwan. Environ. Monit. Assess. 2010, 166, 503–520. [Google Scholar] [CrossRef]
- Dhakal, A.S.; Sidle, R.C. Long-term modelling of landslides for different forest management practices. Earth Surf. Process. Landf. 2003, 28, 853–868. [Google Scholar] [CrossRef]
- Imaizumi, F.; Sidle, R.C.; Kamei, R. Effects of forest harvesting on the occurrence of landslides and debris flows in steep terrain of central Japan. Earth Surf. Process. Landf. 2008, 33, 827–840. [Google Scholar] [CrossRef]
- Roy, J.; Saha, S.; Arabameri, A.; Blaschke, T.; Bui, T.D. A novel ensemble approach for landslide susceptibility mapping (LSM) in Darjeeling and Kalimpong Districts, West Bengal, India. Remote Sens. 2019, 11, 2866. [Google Scholar] [CrossRef] [Green Version]
- Konishi, T.; Suga, Y. Landslide detection using COSMO-SkyMed images: A case study of a landslide event on Kii Peninsula, Japan. Eur. J. Remote Sens. 2018, 51, 205–221. [Google Scholar] [CrossRef] [Green Version]
- Adriano, B.; Yokoya, N.; Miura, H.; Matsuoka, M.; Koshimura, S. A semiautomatic pixel-object method for detecting landslides using multitemporal ALOS-2 intensity images. Remote Sens. 2020, 12, 561. [Google Scholar] [CrossRef] [Green Version]
- Chen, J.; Jönsson, P.; Tamura, M.; Gu, Z.; Matsushita, B.; Eklundh, L. A simple method for reconstructing a high-quality NDVI time-series data set based on the Savitzky-Golay filter. Remote Sens. Environ. 2004, 91, 332–344. [Google Scholar] [CrossRef]
- Richardson, A.D.; Hufkens, K.; Milliman, T.; Aubrecht, D.M.; Chen, M.; Gray, J.M.; Johnston, M.R.; Keenan, T.F.; Klosterman, S.T.; Kosmala, M.; et al. Tracking vegetation phenology across diverse North American biomes using PhenoCam imagery. Sci. Data 2018, 5, 180028. [Google Scholar] [CrossRef]
- Viovy, N.; Arino, O.; Belward, A. The Best Index Slope Extraction (BISE): A method for reducing noise in NDVI time-series. Int. J. Remote Sens. 1992, 13, 1585–1590. [Google Scholar] [CrossRef]
Figure 1.
Map of study area encompassing the eastern part of Asakura-shi, Fukuoka and the northern part of Hita-shi, Oita, Japan. The vector layer delineating landslide areas, damaged roads, and flooded areas along with unassessed areas was obtained from the Geospatial Information Authority of Japan (GSI) [24] (see Section 2.3). The Himawari-8 AHI smoothed and gap-filled NDVI image of 21 June 2017 was used in the upper-left and lower-left frames. The coastline vector dataset used in those two frames was obtained from the GSI [25]. The map was created with ArcGIS® software (ArcGIS® Pro 2.4.1, Esri, Redlands, CA, USA, http://www.esri.com).

Figure 2.
Monthly mean temperature (filled circles and lines) and monthly precipitation (bars) at Asakura station (N 33°24.4′, E 130°41.7′, 38m ASL), Fukuoka, Japan. These are 30 year mean values (from 1981 to 2010).
Figure 2.
Monthly mean temperature (filled circles and lines) and monthly precipitation (bars) at Asakura station (N 33°24.4′, E 130°41.7′, 38m ASL), Fukuoka, Japan. These are 30 year mean values (from 1981 to 2010).

Figure 3.
Percent landslide areas derived from the landslide polygon dataset. The damaged roads [24] are shown as black lines for reference. The circled letters (a, b, c, and d) correspond to the locations where AHI NDVI temporal signatures in the next figure (Figure 4) were extracted. The map was created with ArcGIS® software (ArcGIS® Pro 2.4.1, Esri, Redlands, CA, USA, http://www.esri.com).

Figure 4.
AHI NDVI temporal profiles of landslide-affected pixels with varying degrees: (a) 0%, (b) 18%, (c) 15%, and (d) 11% landslide areas. The filled squares are AHI NDVI values, whereas the red lines are the smoothed NDVI profiles (see Appendix A). The extraction locations of these profiles are shown in Figure 3.

Figure 5.
ΔNDVI (bottom) compared to percent landslide areas (top). The white line boxes on the maps represent the region used for subsequent correlative analysis (see the text and Figure 6). The damaged roads [24] are shown as black lines for reference. The map was created with ArcGIS® software (ArcGIS® Pro 2.4.1, Esri, Redlands, CA, USA, http://www.esri.com).

Figure 6.
Percent landslide area vs. ΔNDVI crossplot. The C.I. and P.I. are, respectively, the confidence and prediction intervals.
Figure 6.
Percent landslide area vs. ΔNDVI crossplot. The C.I. and P.I. are, respectively, the confidence and prediction intervals.

Figure 7.
AHI NDVI (a) and VIIRS NDVI (b) plotted along with sunshine durations at Asakura station (N 33o24.4′, E 130o41.7′, 38 m ASL), Fukuoka, Japan.
Figure 7.
AHI NDVI (a) and VIIRS NDVI (b) plotted along with sunshine durations at Asakura station (N 33o24.4′, E 130o41.7′, 38 m ASL), Fukuoka, Japan.

Figure 8.
AHI NDVI and natural-color composite image pairs at select observation times for 13 July 2017: (a) NDVI and (b) color composite at 9:00 a.m. JST; (c) NDVI and (d) color composite at 9:50 a.m. JST; (e) NDVI and (f) color composite at 10:50 a.m. JST; (g) NDVI and (h) color composite at 12:20 a.m. JST; and (i) NDVI and (j) color composite at 12:50 p.m. JST. The white line boxes represent the region used for the correlative analysis (see Section 3.1 and Figure 6). The map was created with ArcGIS® software (ArcMapTM 10.6.1, Esri, Redlands, CA, USA, http://www.esri.com).

Figure 9.
VIIRS images over the study area for 13 July 2017: (a) NDVI and (b) natural-color composite. The VIIRS overpass time was ~12:50 p.m. JST on the date. The white line boxes represent the region used for the correlative analysis (see Section 3.1 and Figure 6). The map was created with ArcGIS® software (ArcMapTM 10.6.1, Esri, Redlands, CA, USA, http://www.esri.com).

Figure 10.
Landsat-8 OLI true-color composite images acquired in the month of July 2017 after the torrential rain event. The extent of the images corresponds to the white line boxed region in Figure 5. The landslide areas are shown as red polygons in (a) and the damaged roads are shown as black lines in (a–d) for reference (the GSI, https://www.gsi.go.jp/common/000194860.zip). The map was created with ArcGIS® software (ArcMap™ 10.6.1, Esri, Redlands, CA, USA, http://www.esri.com).

Figure 11.
Sentinel-2A/B MSI true-color composite images acquired in the month of July 2017 after the torrential rain event. The extent of the images corresponds to the white line boxed region in Figure 5. The landslide areas are shown as red polygons in (a) and the damaged roads are shown as black lines in (a–c) for reference Sentinel-2A/B MSI (the GSI, https://www.gsi.go.jp/common/000194860.zip). The map was created with ArcGIS® software (ArcMapTM 10.6.1, Esri, Redlands, CA, USA, http://www.esri.com).

Figure 12.
AHI first clear-sky observation time on 13 July 2017. The first sunny conditions after the torrential rain event of 5 July 2017 occurred over this region on that date. The damaged roads [24] are shown as black lines for reference. The map was created with ArcGIS® software (ArcGIS® Pro 2.4.1, Esri, Redlands, CA, USA, http://www.esri.com).

Figure 13.
Summary of AHI NDVI landslide detection analysis for a torrential rain event in Hiroshima, Japan in the summer of 2018. The location of the analysis area is indicated on the two frames at the bottom center. (a) Percent landslide areas (including debris-mud flow areas) derived from the landslide- and debris-mud flow polygon dataset (shown as “Landslides” on the map) [47]. The circled letters (A, B, and C) correspond to the locations where AHI NDVI temporal signatures in (b) were extracted. The white line box represents the region used for the correlative analysis in (d). (b) AHI NDVI temporal profiles of landslide- and debris-mud flow-affected pixels. The filled squares are AHI NDVI values whereas the red lines are the smoothed NDVI profiles (see Appendix A). (c) ΔNDVI (pre-event NDVI minus post-event NDVI). Five day local means centered on 18 June 2018 and 5 August 2018 were used as pre-event and post-event NDVI values, respectively. (d) Percent landslide and debris-mud flow area vs. ΔNDVI crossplot. The C.I. and P.I. are, respectively, the confidence and prediction intervals. The maps were created with ArcGIS® software (ArcGIS® Pro 2.4.1, Esri, Redlands, CA, USA, http://www.esri.com).


Table 1.
Summary of 2019 Weather Disasters in Japan [17].
Table 1.
Summary of 2019 Weather Disasters in Japan [17].
| Date | Weather Event | Casualty | Housing Damage | ||
|---|---|---|---|---|---|
| Deaths | Missing | Injuries | |||
| 18−20 May | Heavy rain | 0 | 0 | 5 | 48 |
| up to 31 May | Heavy snow | 40 | 0 | 650 | 24 |
| 20−24 July | Typhoon Danas + Baiu | 0 | 1 | 6 | 852 |
| 27−28 July | Typhoon Nari | 0 | 0 | 0 | 2 |
| 5−6 August | Typhoon Francisco | 1 | 0 | 5 | 10 |
| 9−10 August | Typhoon Lekima | 0 | 0 | 6 | 1 |
| 15 August | Typhoon Krosa | 2 | 0 | 57 | 20 |
| 6 September | Typhoon Lingling + Heavy Rain | 0 | 0 | 7 | 1 |
| 9 September | Typhoon Faxai | 1 | 0 | 151 | 57792 |
| 21−23 September | Typhoon Tapah | 2 | 0 | 68 | 648 |
| 3 October | Typhoon Mitag | 0 | 0 | 10 | 89 |
| 12−13 October | Typhoon Hagibis | 93 | 7 | 468 | 85983 |
| 14–20 November | Snow storm | 0 | 0 | 0 | 2 |
Table 2.
Select Characteristics of Himawari-8 AHI Compared to Himawari-7 Imager and Suomi-NPP VIIRS.
Table 2.
Select Characteristics of Himawari-8 AHI Compared to Himawari-7 Imager and Suomi-NPP VIIRS.
| Himawari-8 AHI | Himawari-7 Imager | Suomi-NPP VIIRS | ||||
|---|---|---|---|---|---|---|
| Band Center (μm) & Nadir Resolution (km) | 0.470 | 1 | - | - | 0.488 | 0.75 |
| 0.510 | 1 | 0.68 | 1 | 0.555 | 0.75 | |
| 0.640 | 0.5 | 0.640 | 0.375 | |||
| 0.857 | 1 | 0.865 | 0.375 | |||
| Temporal Resolution | 10 min (Full Disk) 2.5 min (Japan) | 30 min (Full Disk) | 1 or 2 per day | |||
Table 3.
Landsat-8 OLI and Sentinel-2A/B MSI Images Acquired during 5 July 2017 to 31 July 2017 and Their Cloud Cover Condition Estimates.
Table 3.
Landsat-8 OLI and Sentinel-2A/B MSI Images Acquired during 5 July 2017 to 31 July 2017 and Their Cloud Cover Condition Estimates.
| Sensor | Image Date (JST) | Cloud Cover | Viewable Area |
|---|---|---|---|
| Landsat-8 OLI | 2017-07-13 (10:47 am) | Fair | ~80% of the impacted region visible |
| 2017-07-20 (10:53 am) | Cloudy | <5% of the impacted region visible | |
| 2017-07-29 (10:47 am) | Fair | ~80% of the impacted region visible | |
| Sentinel-2A/B MSI | 2017-07-06 (10:56 am) | Cloudy | 0% of the impacted region visible |
| 2017-07-21 (10:56 am) | Fair | ~80% of the impacted region visible | |
| 2017-07-26 (10:56 am) | Fair | 40–50% of the region visible |
© 2020 by the authors. Licensee MDPI, Basel, Switzerland. This article is an open access article distributed under the terms and conditions of the Creative Commons Attribution (CC BY) license (http://creativecommons.org/licenses/by/4.0/).
Share and Cite
MDPI and ACS Style
Miura, T.; Nagai, S. Landslide Detection with Himawari-8 Geostationary Satellite Data: A Case Study of a Torrential Rain Event in Kyushu, Japan. Remote Sens. 2020, 12, 1734. https://0-doi-org.brum.beds.ac.uk/10.3390/rs12111734
AMA Style
Miura T, Nagai S. Landslide Detection with Himawari-8 Geostationary Satellite Data: A Case Study of a Torrential Rain Event in Kyushu, Japan. Remote Sensing. 2020; 12(11):1734. https://0-doi-org.brum.beds.ac.uk/10.3390/rs12111734
Chicago/Turabian StyleMiura, Tomoaki, and Shin Nagai. 2020. "Landslide Detection with Himawari-8 Geostationary Satellite Data: A Case Study of a Torrential Rain Event in Kyushu, Japan" Remote Sensing 12, no. 11: 1734. https://0-doi-org.brum.beds.ac.uk/10.3390/rs12111734
Note that from the first issue of 2016, this journal uses article numbers instead of page numbers. See further details here.