Article

Portable and Easily-Deployable Air-Launched GPR Scanner

by
María García-Fernández
1,
Yuri Álvarez López
1,*,
Alessandro De Mitri
2,
David Castrillo Martínez
1,
Guillermo Álvarez-Narciandi
1 and
Fernando Las-Heras Andrés
1
1
Area of Signal Theory and Communications, University of Oviedo, 33201–33212 Gijon, Spain
2
Department of Geoscience, University of Pisa, 56121–56128 Pisa, Italy
*
Author to whom correspondence should be addressed.
Remote Sens. 2020, 12(11), 1833; https://0-doi-org.brum.beds.ac.uk/10.3390/rs12111833
Submission received: 20 May 2020 / Revised: 2 June 2020 / Accepted: 3 June 2020 / Published: 5 June 2020
(This article belongs to the Special Issue Advanced Ground Penetrating Radar Theory and Applications)

Abstract

:
In recent years, Unmanned Aerial Vehicles (UAV)-based Ground Penetrating Radar (GPR) systems have been developed due to their advantages for safe and fast detection of Improvised Explosive Devices (IEDs) and landmines. The complexity of these systems requires performing extensive measurement campaigns in order to test their performance and detection capabilities. However, UAV flights are limited by weather conditions and battery autonomy. To overcome these problems, this contribution presents a portable and easily-deployable measurement setup which can be used as a testbed for the assessment of the capabilities of the airborne system. In particular, the proposed portable measurement setup replicates fairly well the conditions faced by the airborne system, which can hardly be reproduced in indoor GPR measurement facilities. Three validation examples are presented: the first two analyze the capability of the measurement setup to conduct experiments in different scenarios (loamy and sandy soils). The third example focuses on the problem of antenna phase center displacement with frequency and its impact on GPR imaging, proposing a simple technique to correct it.

Graphical Abstract

1. Introduction

1.1. Background

Ground Penetrating Radar (GPR) systems [1] are widely used for underground detection and imaging, thanks to the capability of detecting both metallic and non-metallic objects. Several applications can be cited, such as analysis and inspection of infrastructures [2,3], archaeological survey [4,5], glacier thickness analysis [6], material characterization [7,8] or landmine and Improvised Explosive Devices (IEDs) detection [9,10,11,12,13]. With respect to other underground detection methodologies such as magnetometry, GPR allows detecting both metallic and non-metallic targets.
Concerning the last area of application, air-launched GPR systems based on Unmanned Aerial Vehicles (UAVs) have been developed in the last years [14,15,16,17,18]. Their main advantages are: (i) safety, as contact with the ground is avoided and thus the risk of accidental IED detonation is minimized; (ii) speed, as UAV-based systems are generally faster than autonomous terrestrial robots; and (iii) capability to inspect difficult-to-access areas. Analyzing the features of the different implemented prototypes [14,15,16,17,18], it can be concluded that the main challenges are the need for precise positioning and geo-referring of the GPR measurements, the limited UAV flight autonomy, and the choice of proper radiofrequency components. In this regard, the design goal is to achieve a significant bandwidth (to increase range resolution), while using low-frequency bands (to increase the penetration depth).
UAV-based GPR systems for landmine and IED detection are based on air-launched GPR, where the distance from the ground to the airborne GPR is in the range of several meters. Air-launched GPR systems have several advantages over ground-coupled GPR [19,20], especially in the case of landmine and IED detection. However, they come at the expense of fewer penetration capabilities due to the impedance mismatch between the air and the ground that, together with the free-space propagation losses, reduces the dynamic range.
Improvement of UAV-based GPR systems requires exhaustive testing of the hardware, such as the GPR antennas or the geo-referring and positioning sensors. Besides, different kinds of targets buried in different scenarios (e.g., sandy and loamy soils, with different degrees of moisture) must be tested for a proper assessment of the detection capabilities of the system. This results in a large number of measurements and tests, which in the case of UAV-based GPR systems might be challenging due to the limited battery life, as well as the need for favorable weather conditions for the flights. In addition, it must be mentioned that flight and operation restrictions may limit the use of GPR systems on-board UAVs in some scenarios of interest (e.g., coastal areas and beaches, aiming to test sandy soils).
One possibility for conducting the aforementioned tests is the use of GPR indoor measurement facilities, which usually consist of a planar scanner equipped with motors and encoders that allows accurate positioning, being the scanner placed on top of a scenario filled with the kind of soil and buried objects to be tested. This kind of setups can be used for testing Down-Looking GPR [21,22] and Forward-Looking GPR systems [23]. However, measurement setups based on planar scanners do not allow testing the uncertainties that UAV-based GPR systems have to face [14], such as positioning and geo-referring uncertainty due to the sensors of the positioning subsystem on-board the UAV, or the need of working with irregular, non-uniform acquisition grids due to the deviation of the UAV from the pre-defined flight path. In the case of indoor GPR testing facilities, positioning uncertainty introduced by sensors on-board the UAV such as Real Time Kinematics (RTK) cannot be tested due to the lack of satellite coverage. Besides, the cost and complexity of building and operating such kind of facility can be beyond the possibilities of the research groups, as the scenario under test should be as large as possible to avoid edge effects (i.e., reflections on the structure of the planar scanner and on the walls of the recipient filled with the soil sample and the buried targets [21]). Finally, it is also worth noting the difficulty of changing the type of soil, since the material needed to fill the scenario is too heavy to be handled manually.

1.2. Aim and Scope

In order to provide a methodology that allows conducting extensive testing of the hardware of the payload of a UAV-based GPR system, as well as to test different kinds of buried targets in realistic scenarios, this contribution presents a portable and easily-deployable setup for the testing of air-launched GPR systems. In particular, the goal is to allow extensive testing of the payload to be integrated in the UAV in realistic conditions. For this purpose, the proposed portable setup can be easily carried to the scenario chosen for the tests and mounted within minutes. This setup was conceived as a result of the work conducted in [21], where a portable setup for the linear acquisition was implemented to test the GPR processing techniques developed in that contribution.

2. Working Principle of the Portable Setup

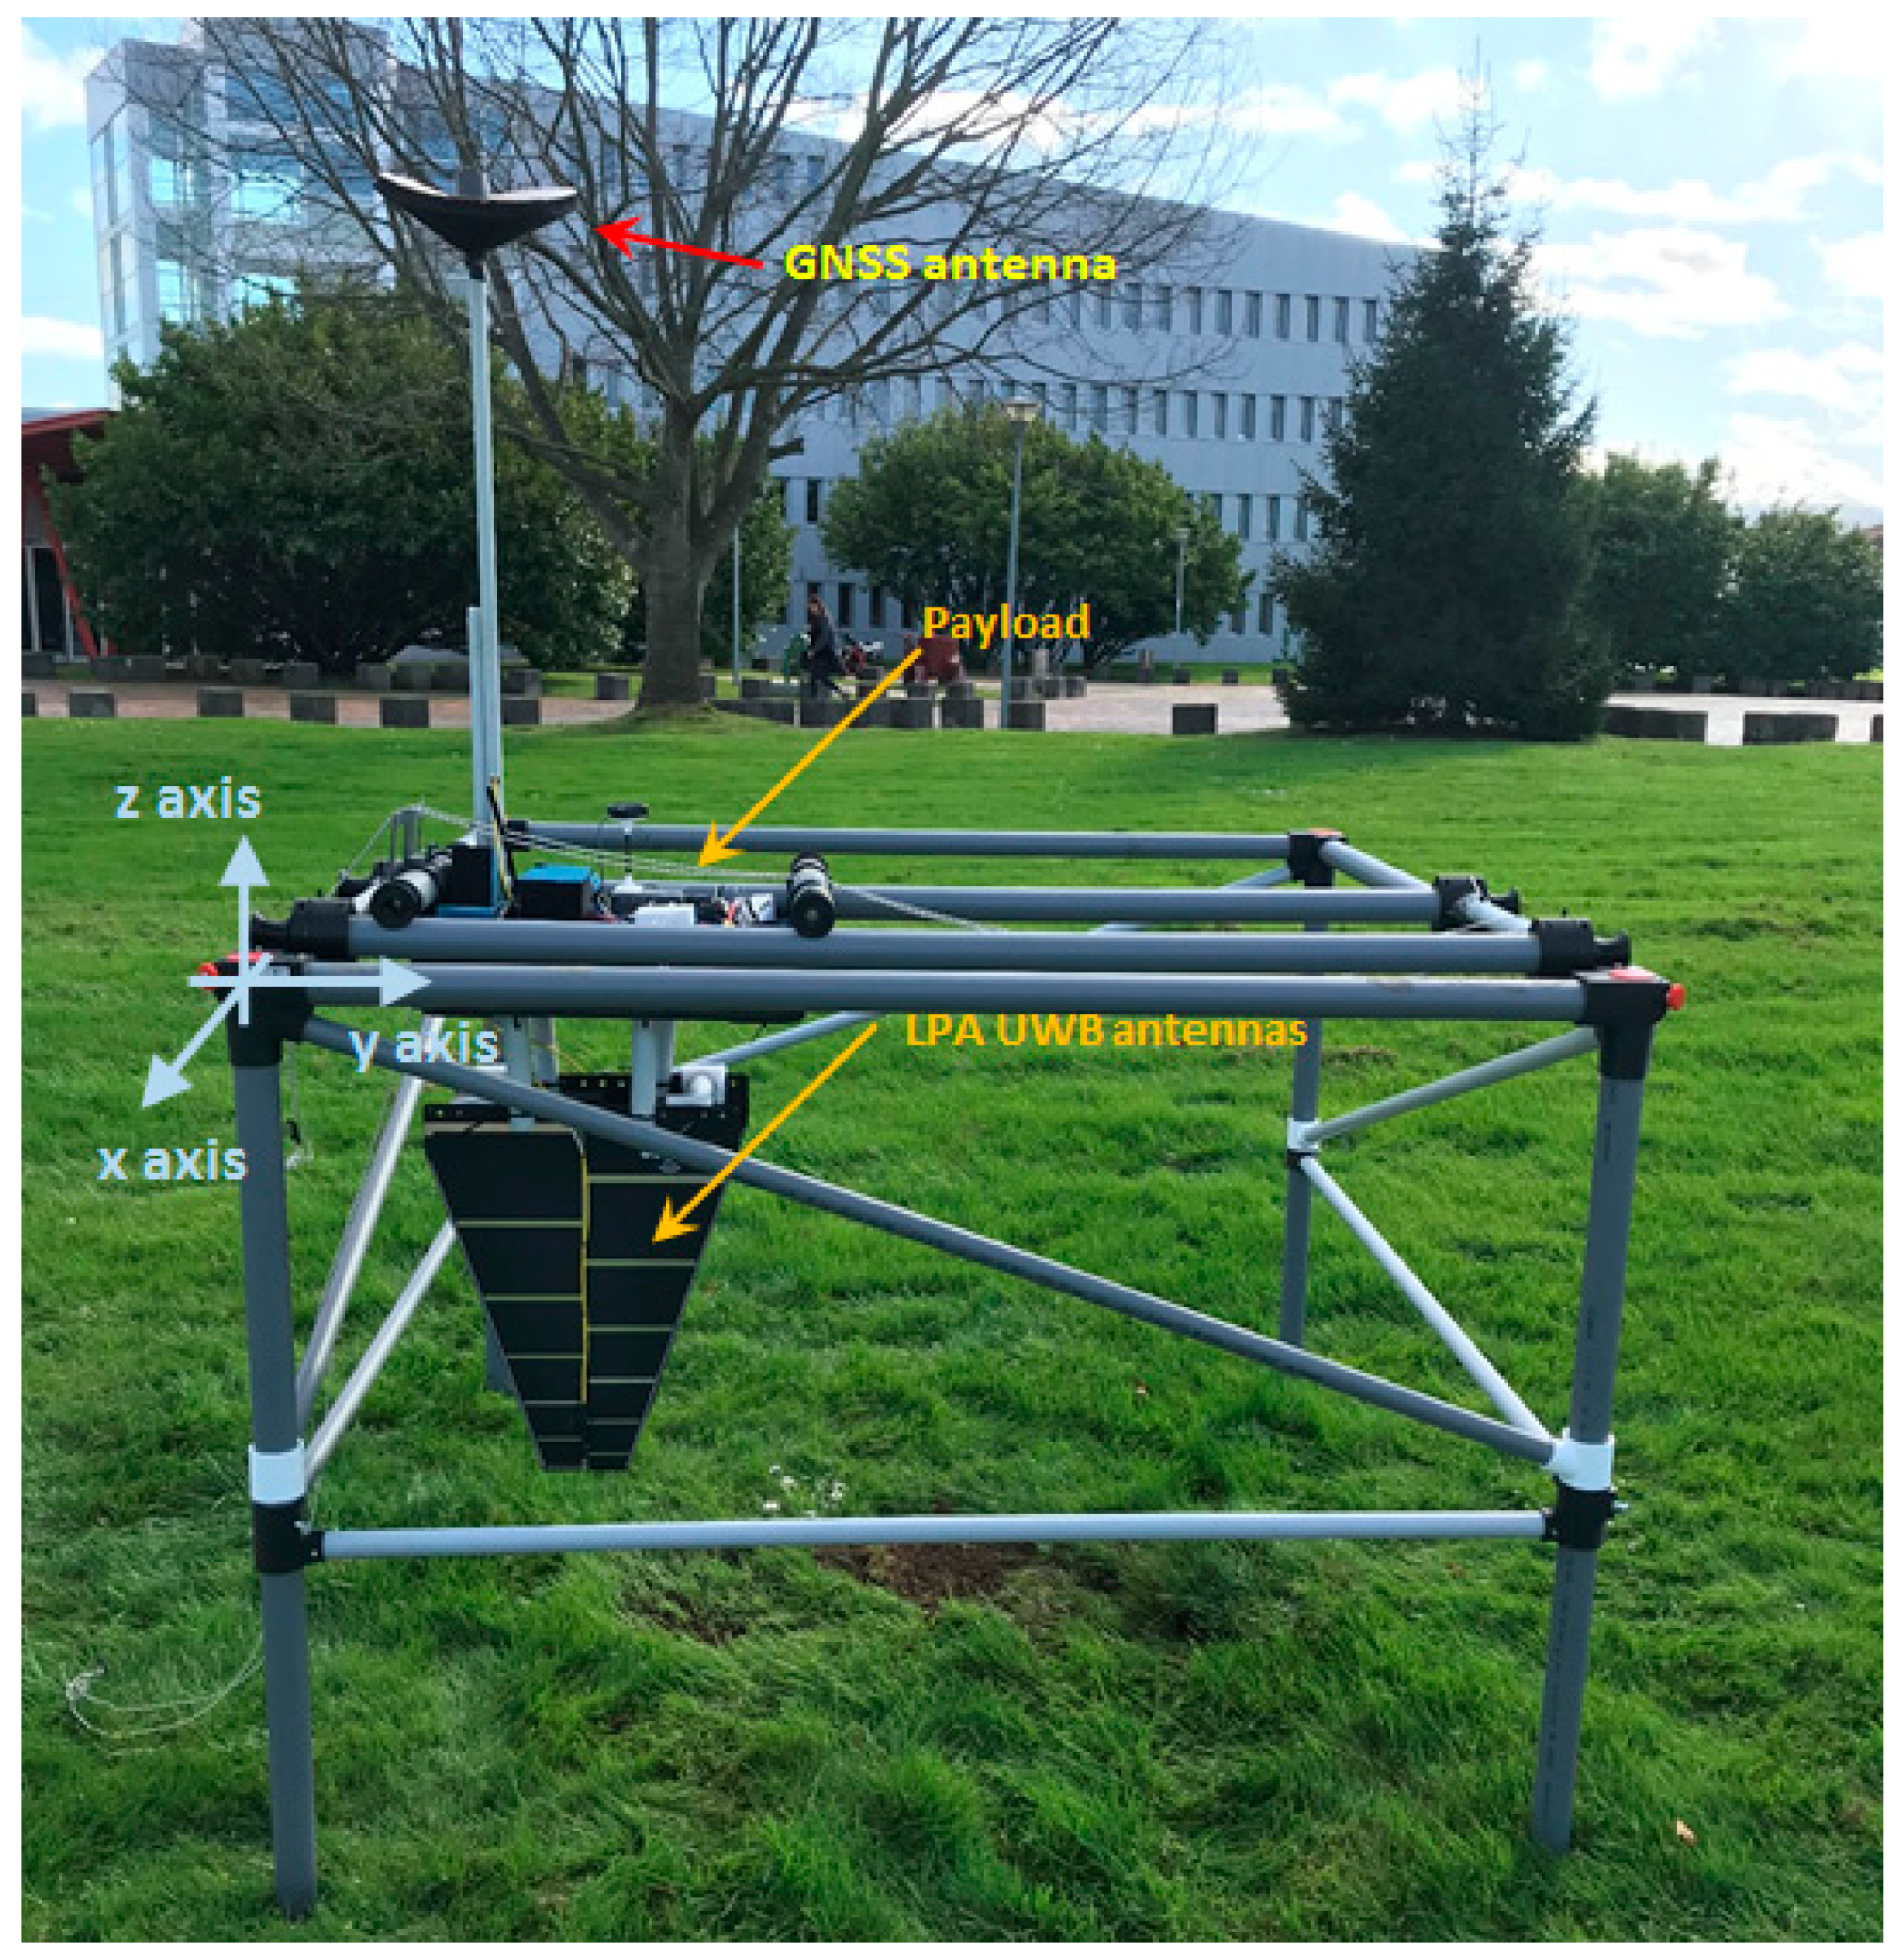
2.1. Hardware Description

The portable setup for air-coupled GPR testing is depicted in Figure 1. It consists of a plastic frame that supports a sliding arm that can be manually displaced along a distance of 150 cm. The sliding arm supports a plastic box (where the payload is placed) that can be also displaced along the arm by means of two ropes (a video illustrating this procedure can be watched at https://bit.ly/2WlbJxz). The dimensions of the sliding system and the plastic box limit the scanning area to 100 cm × 100 cm approximately, depending on the configuration of the payload. The height above the ground can be adjusted by means of screws located on the legs of the setup, allowing a maximum height of 130 cm. These screws allow adjusting each leg individually, making its deployment easier in the case of irregular terrains.
The payload mounted in the plastic box contains almost the same hardware to be integrated into the UAV [14]. As it can be observed in Figure 2, the main elements are: (1) the radar module, consisting of an M-sequence Ultra-Wide-Band (UWB) radar ranging from 100 MHz to 6 GHz [21]; (2) two UWB antennas (or three, depending on the number of the used receiving channels); (3) a dual-band Global Navigation Satellite System (GNSS) antenna connected to an RTK beacon [24]; (4) a micro-computer, that controls the communication between the different subsystems (positioning subsystem, radar subsystem) and a base station (a computer). The micro-computer used in this setup is the same as the one on-board the UAV [14]. The payload also includes, attached to the micro-computer, the common positioning sensors on-board UAVs, i.e., Inertial Measurement Units (IMUs), barometer and GNSS receiver. In the payload, the UAV control functionality is not required to be programmed in the micro-computer.
Figure 3 shows a scheme of the subsystems and devices of the air-launched GPR. Communication between the payload and the base station (payload control) is made using ad-hoc WiFi, as in the case of the UAV system [14]. The router that creates the WiFi also acts as the Internet gateway. RTK corrections are taken from a GNSS base station and sent to the payload via a mobile communications network. All the elements are powered using a LiPo battery and the required voltage converters. Finally, a radiofrequency (RF) attenuator was connected between the output port of the radar module and the transmitting antenna. The reason is that the signal transmitted by the radar can interfere with GNSS signals, worsening the Signal-to-Noise ratio below the threshold required by the RTK system to provide cm-level accuracy positioning. Figure 3 shows a variable attenuator that can be adjusted from 0 dB to 11 dB. In practice, small, lightweight attenuators can be used to reduce the weight of the payload.
Deployment of the setup takes around 10–15 min, requiring another 5 min to initialize all the hardware and software. Performing a full 100 cm × 100 cm area acquisition usually requires 10 min. It must be pointed out that the hardware and software of the portable setup can be operated by a single person, as the payload (radar and positioning sensors) is configured to work in continuous acquisition mode.

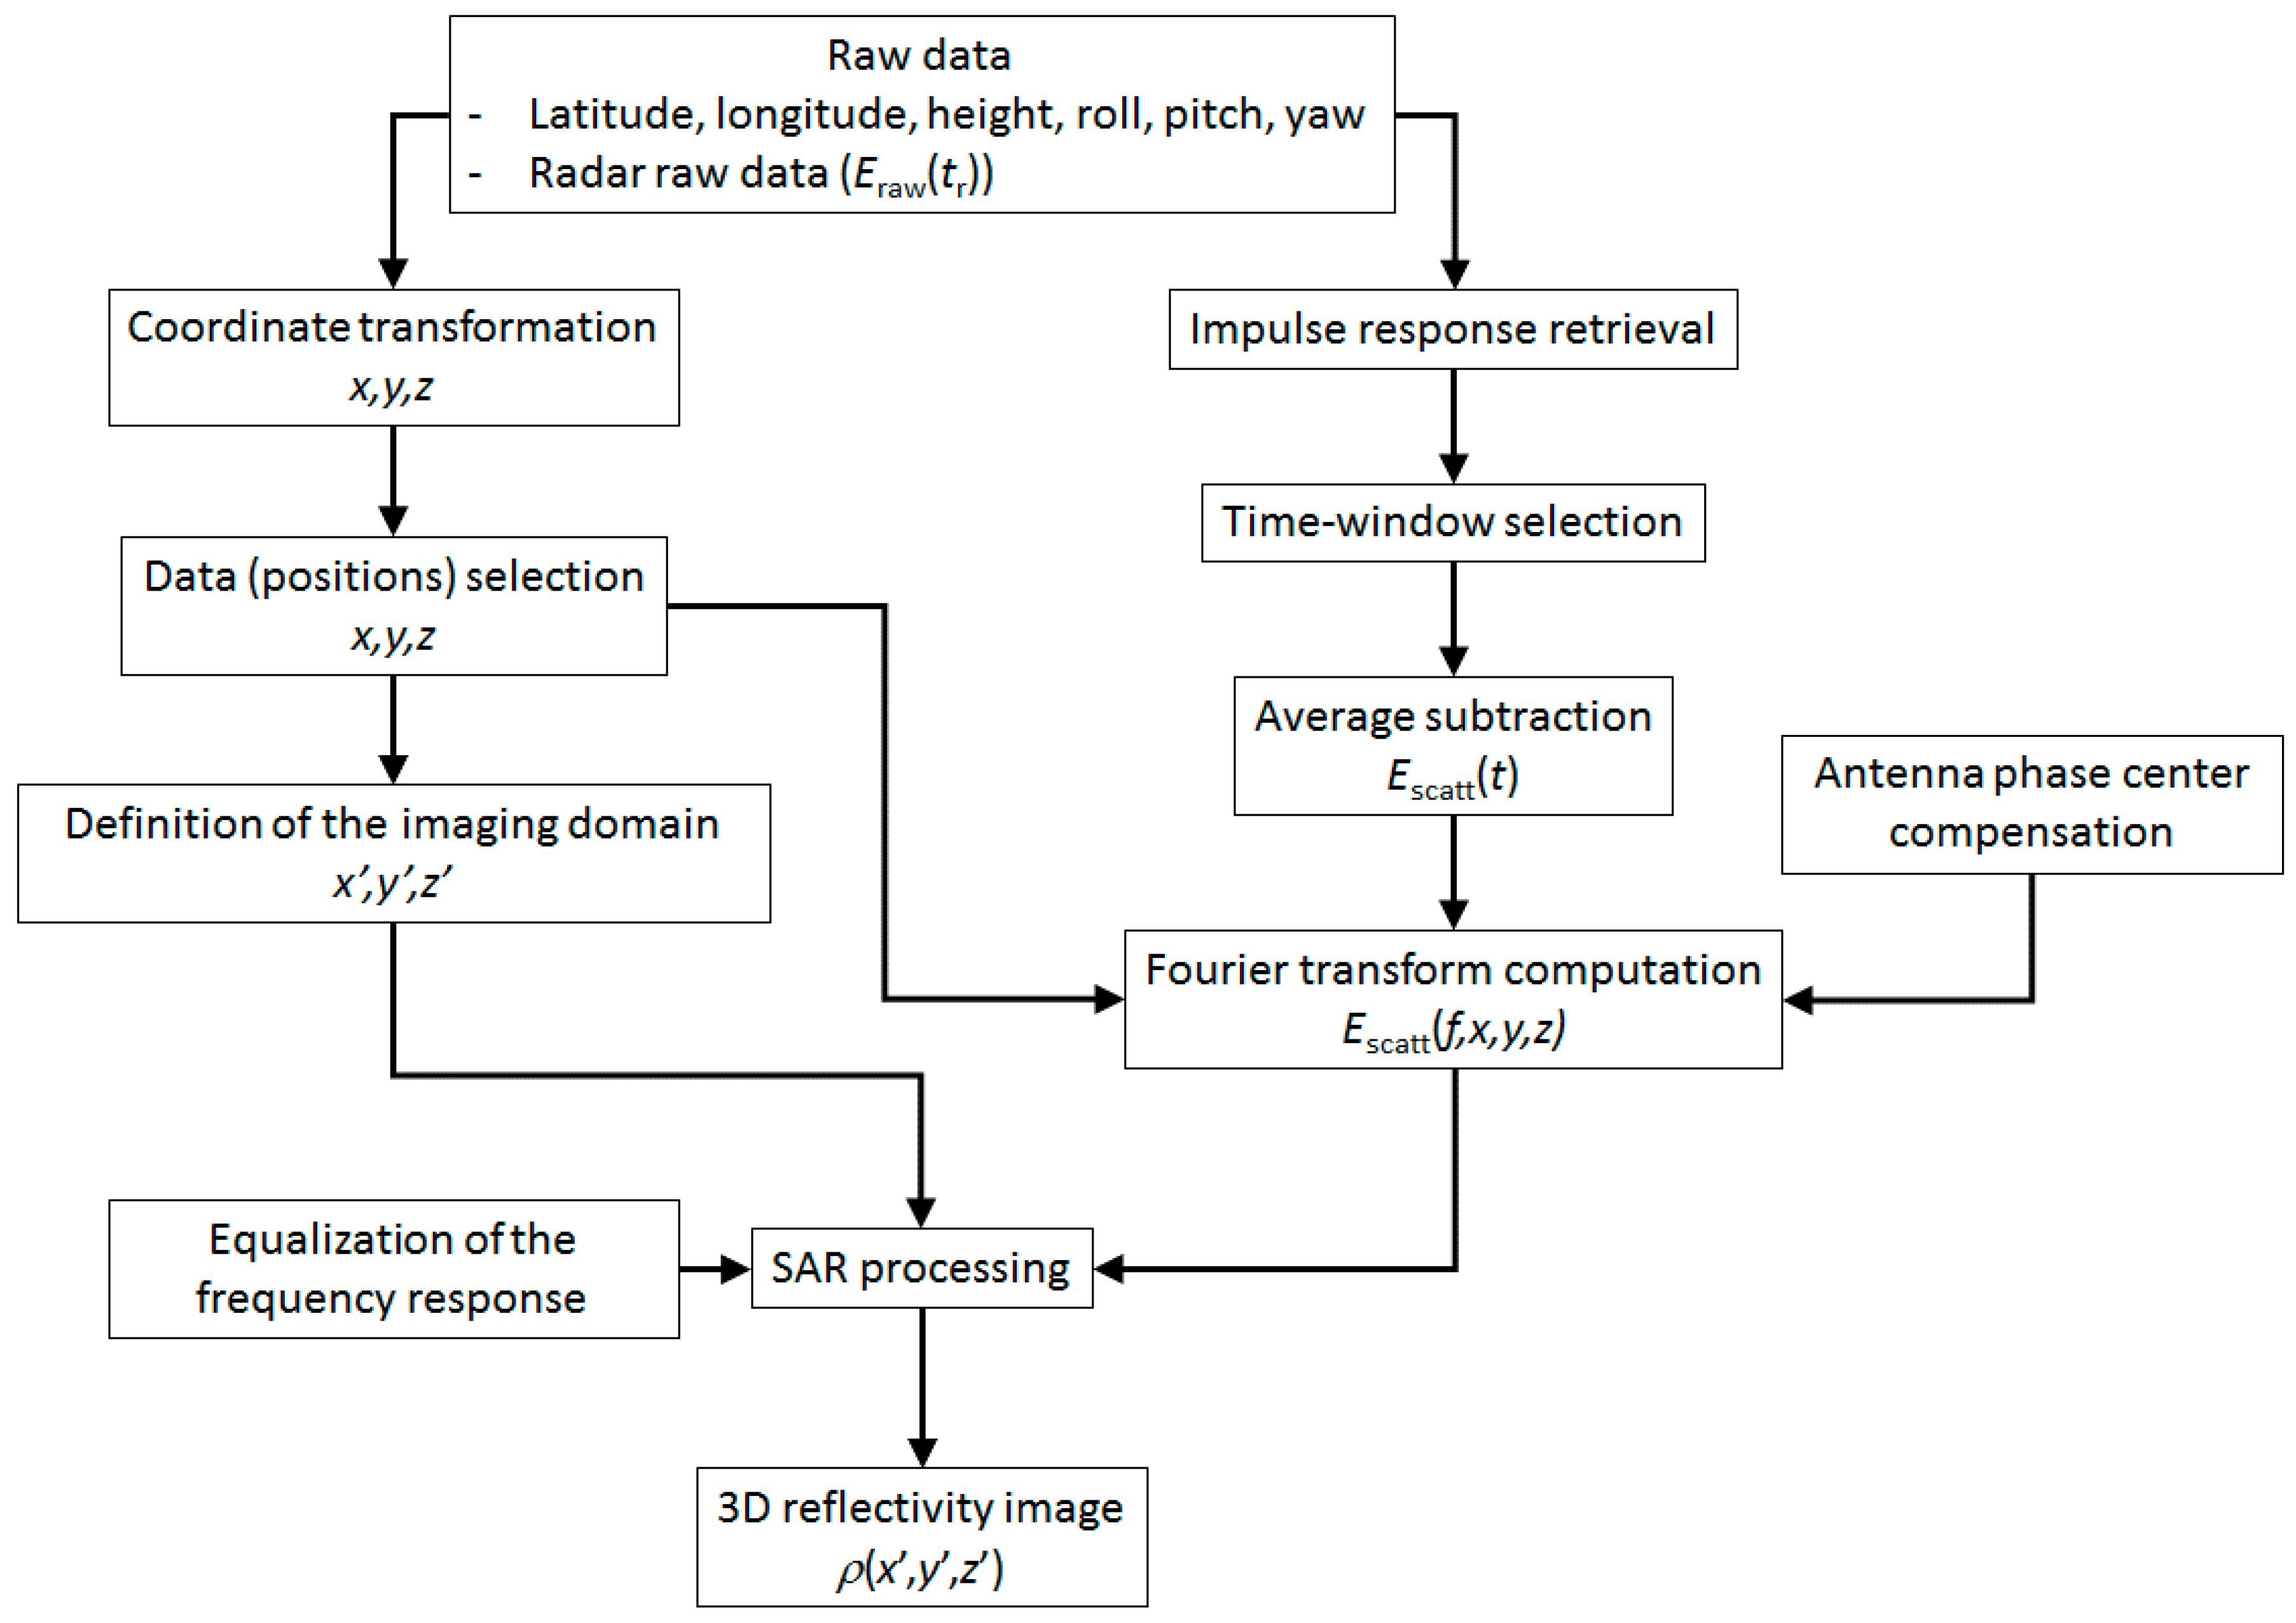
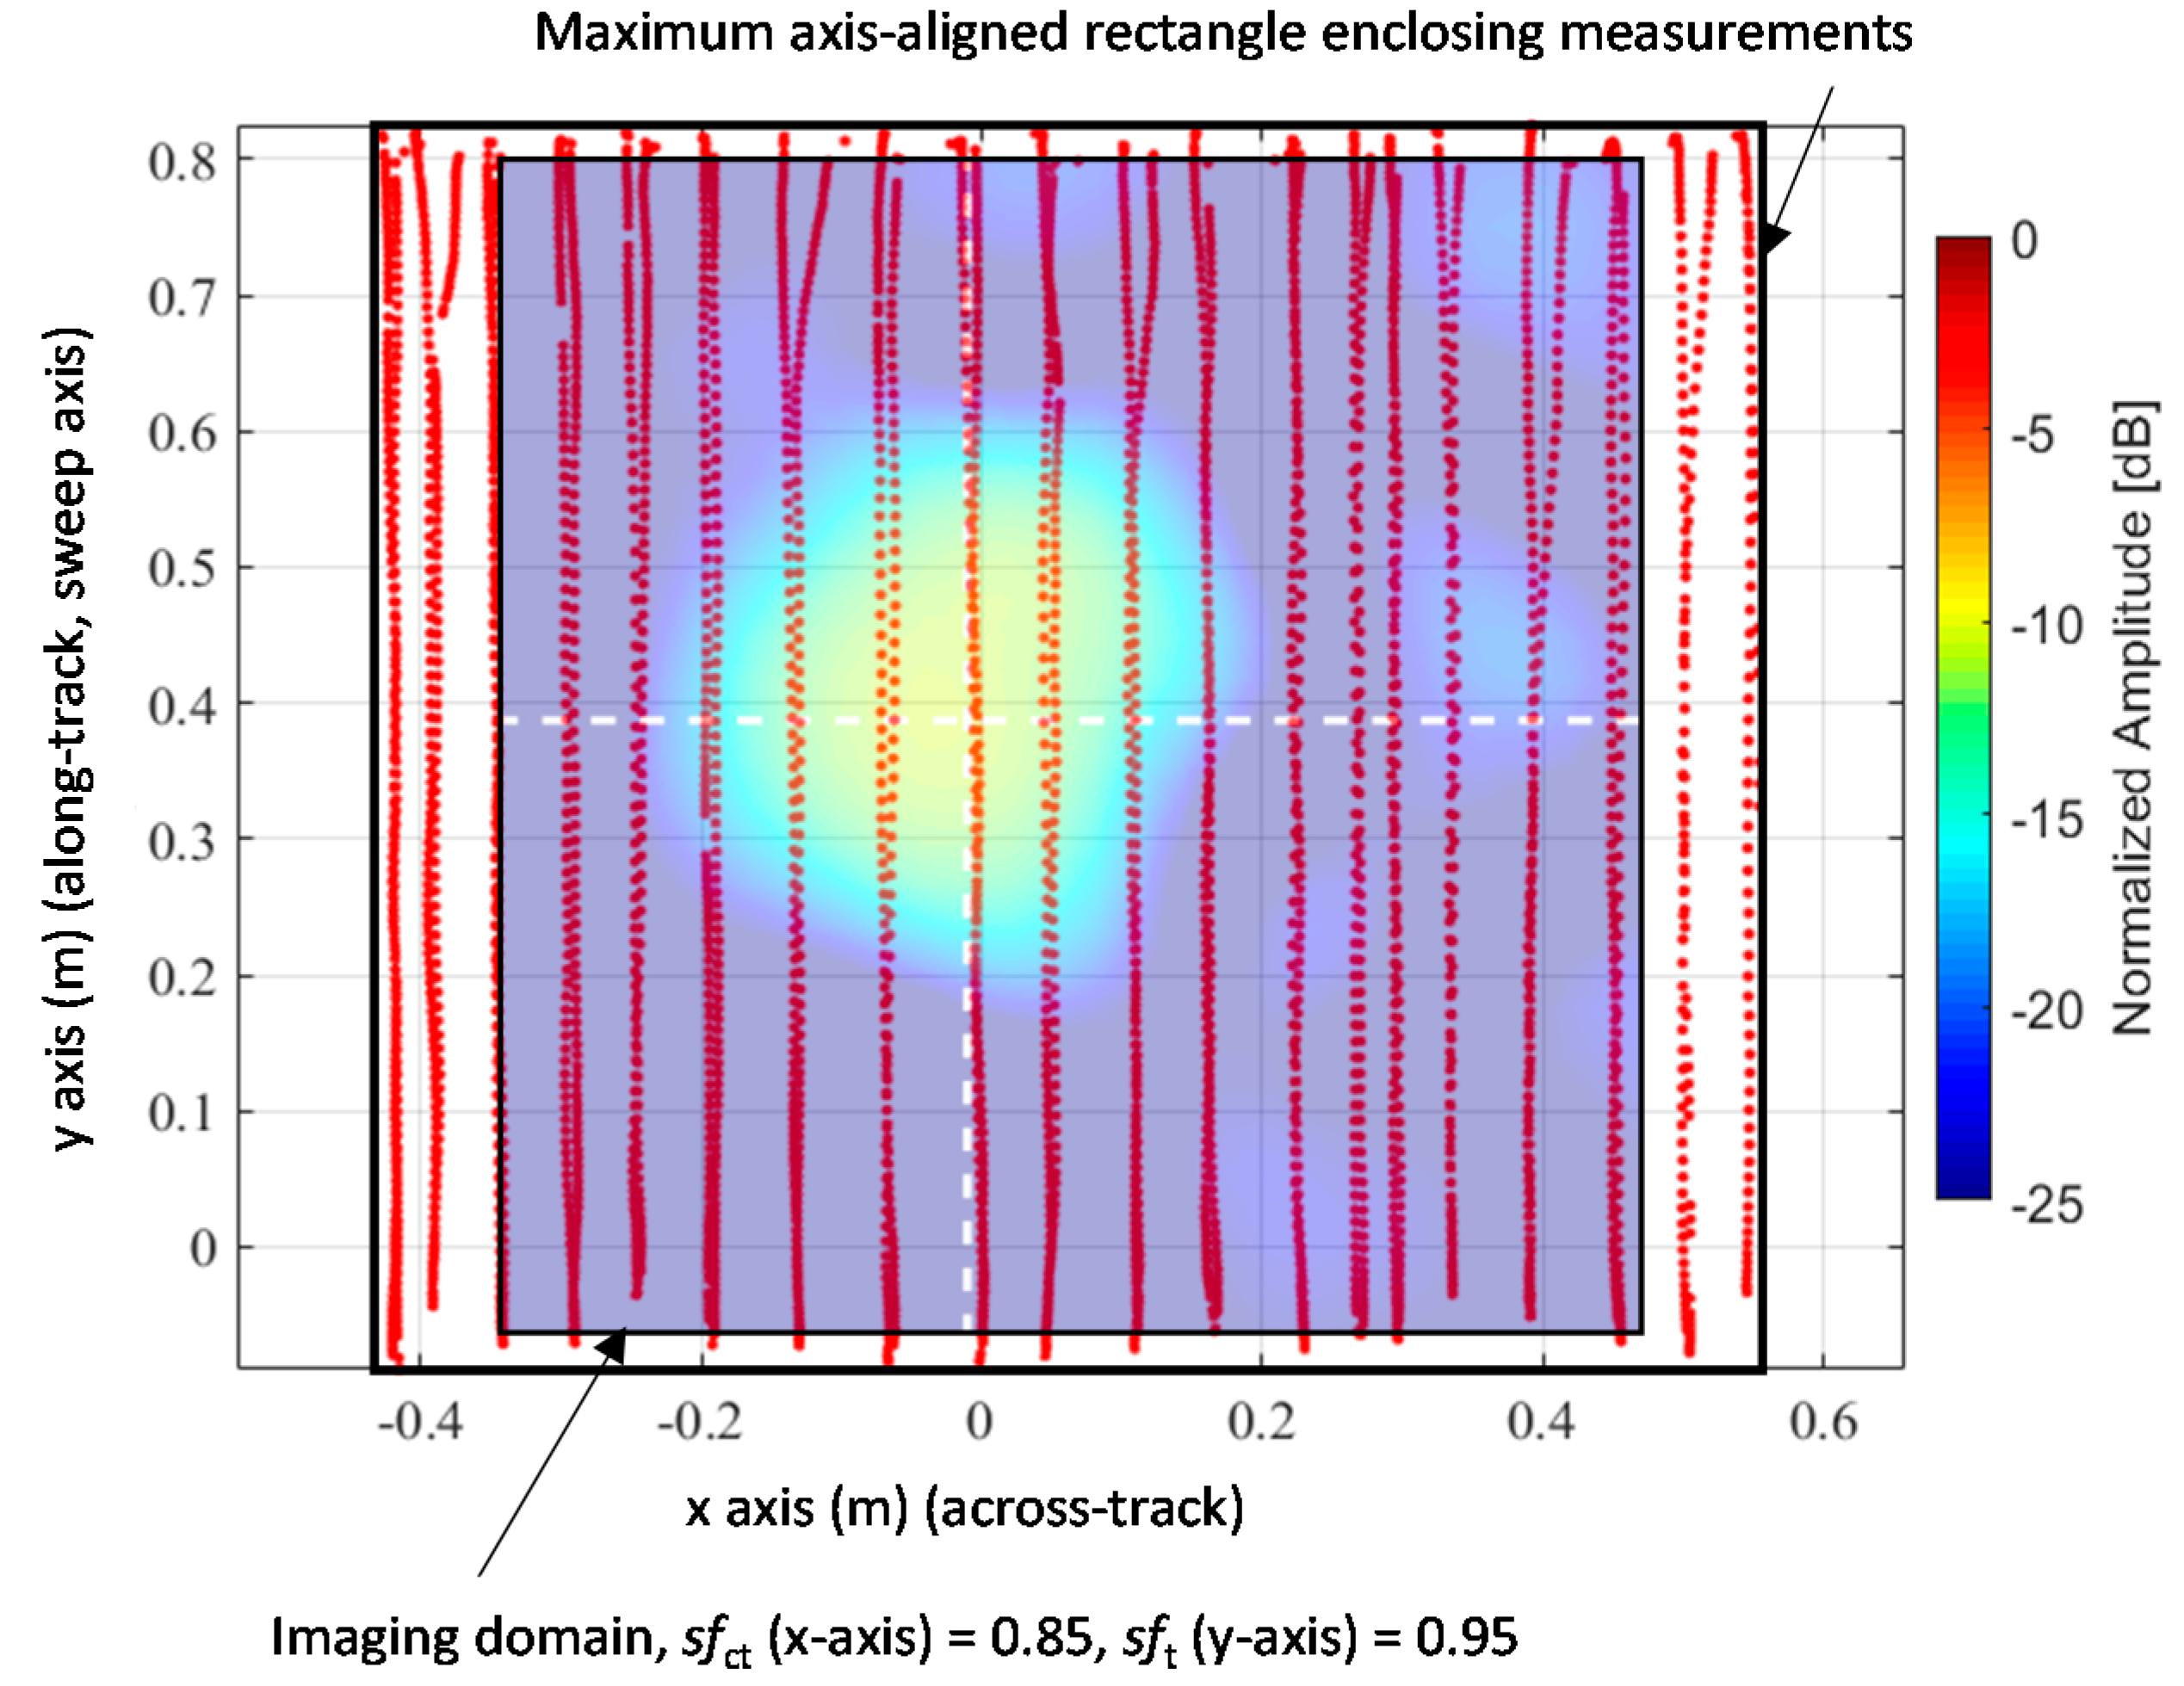
2.2. GPR-SAR Processing

Once the hardware is initialized and the operator verifies the correct configuration of the acquisition system, it is possible to start taking measurements. Raw radar data and positioning information are sent to the base station (laptop) where they are stored. The data processing flowchart is summarized in Figure 4, and it is based on the data processing presented in Section 3 of [14] for the case of the UAV-based GPR system.
Positioning and geo-referring information are provided by the RTK module and the IMU embedded in the micro-computer. As shown in the scheme of Figure 4, the positioning information is transformed into a local positioning system (x,y,z). Then the filtering algorithm described in [14] is applied to discard the data that could degrade the GPR image, mainly due to non-uniform sampling.
Pre-processing of radar data begins with the retrieval of the impulse response function, which requires performing a cross-correlation of the received raw radar data with the theoretical transmitted sequence. Then, the range of interest is selected (performing a time-window) to remove the coupling between the transmitting and receiving antennas and to discard measurements due to reflections too far from the radar. In the case of air-launched GPR, the reflection on the air-soil interface is strong enough so it can be used to set the zero reference for the z-axis. The next step is performing average subtraction in order to reduce radar clutter [14,21].
For each selected measurement position (x,y,z), radar measurements Escatt(t) are transformed into the frequency domain in order to select the frequency band of interest, mainly based on the frequency response of the transmitting and receiving antenna parameters: radiation pattern, return losses, and phase center. As indicated in the flowchart of Figure 4, antenna phase center compensation can be applied at this stage if required.
Given the acquisition (x,y,z) and imaging domains (x’,y’,z’) (i.e., the area where the radar image is computed), Synthetic Aperture Radar (SAR) processing [25] can be applied to the radar measurements in the frequency domain, Escatt(f,x,y,z), to recover a 3D image of the reflectivity, ρ(x’,y’,z’),
ρ ( x , y , z ) = N f N o b s E s c a t t ( f , x , y , z ) exp ( + j k 0 ( f ) R ( x , y , z ; x , y , z ) ) ,
being Nf the number of discrete frequencies in which the selected bandwidth is discretized, and Nobs the number of observation points. k0(f) is the wavenumber in free-space. R(x,y,z; x’,y’,z’) is defined as the distance between the transmitting antenna and the point of the imaging domain (x’,y’,z’), plus the distance from that point to the receiving antenna. Although the soil composition can be taken into account when calculating the path length [14,21], for the sake of clarity, results presented in this contribution are obtained considering free-space propagation (i.e., the relative permittivity, εr, of the entire imaging domain is set to 1).
The frequency response of the GPR is not uniform due to several factors such as the variation of the gain of the antennas with frequency. Besides, higher frequencies suffer from more attenuation and losses when propagating through the soil. Equalization techniques can be applied so that the contribution of each individual frequency to the SAR image has the same weight [21]. The main advantage is that the vertical resolution (range resolution) is improved. However, the dynamic range in the SAR image of the echoes of buried targets is decreased, resulting in a trade-off between range resolution and detection capabilities.

3. Results

As indicated in Section 1, the goal of the portable setup is to enable the testing of the payload in conditions and scenarios similar to the case where the payload is integrated into the UAV. Thanks to this, extensive measurement campaigns can be conducted, as the limitations required for UAV operation are overcome. For illustration purposes, three validation examples are described in this contribution.

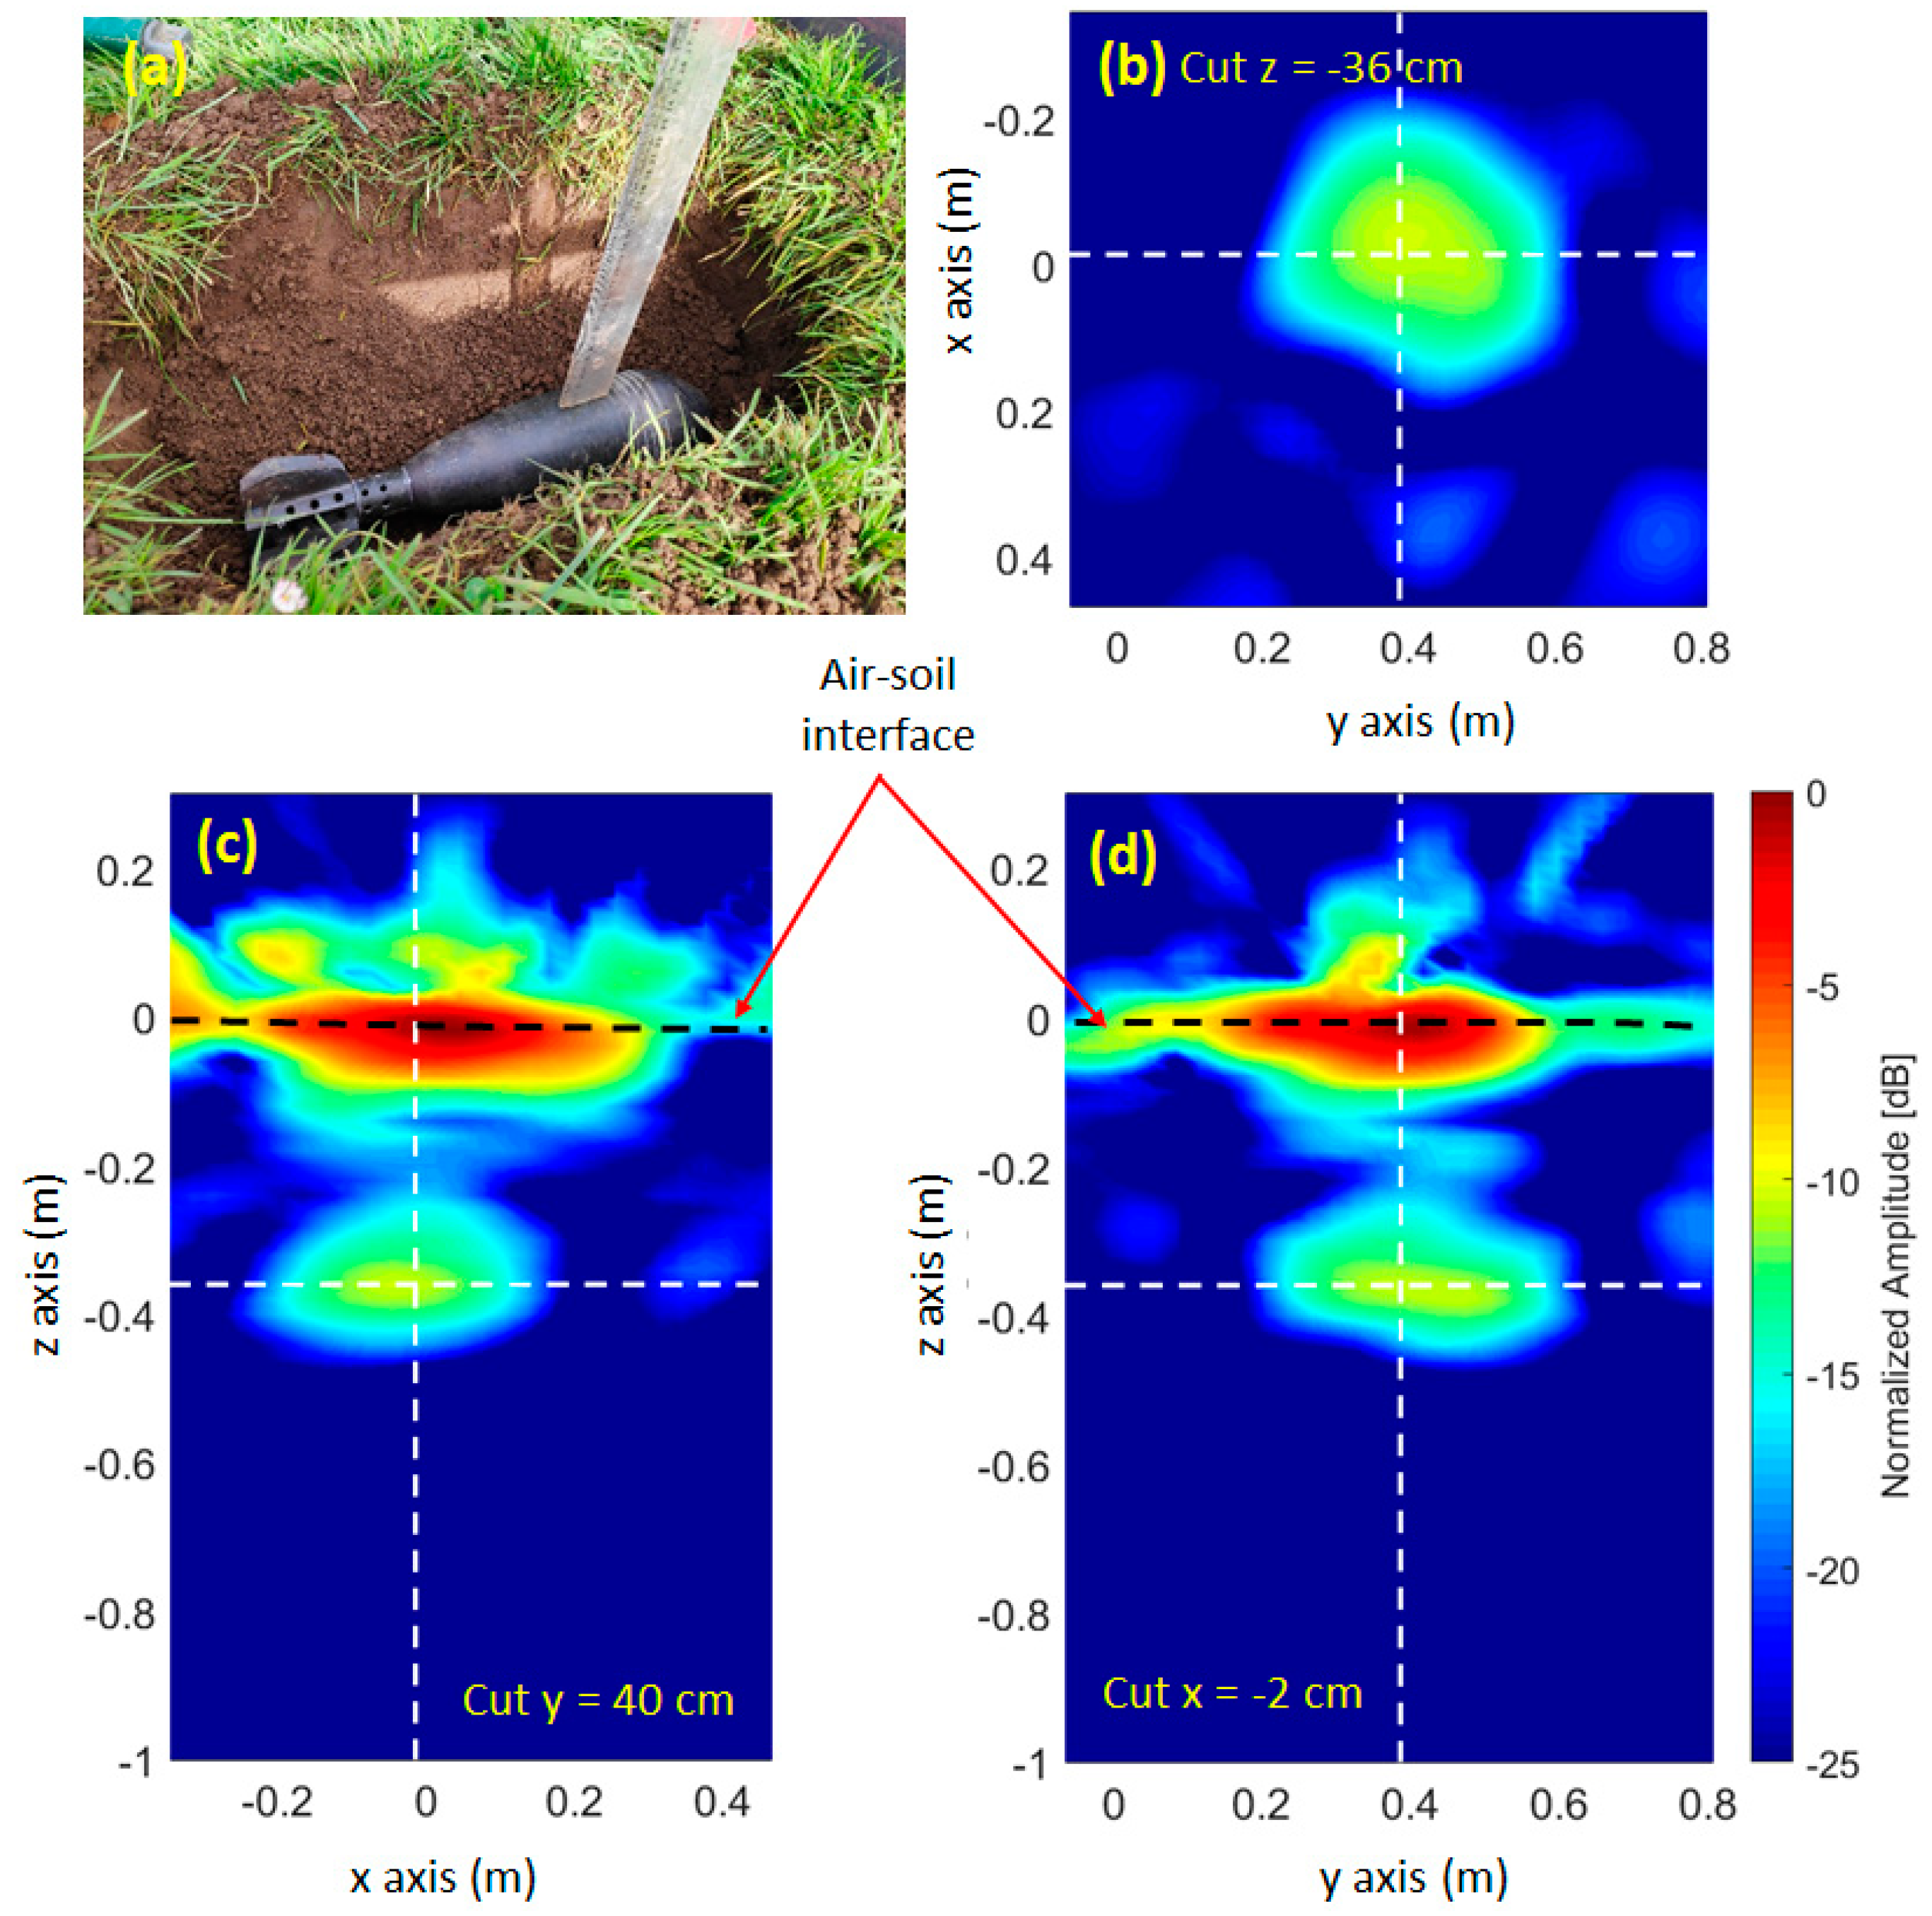
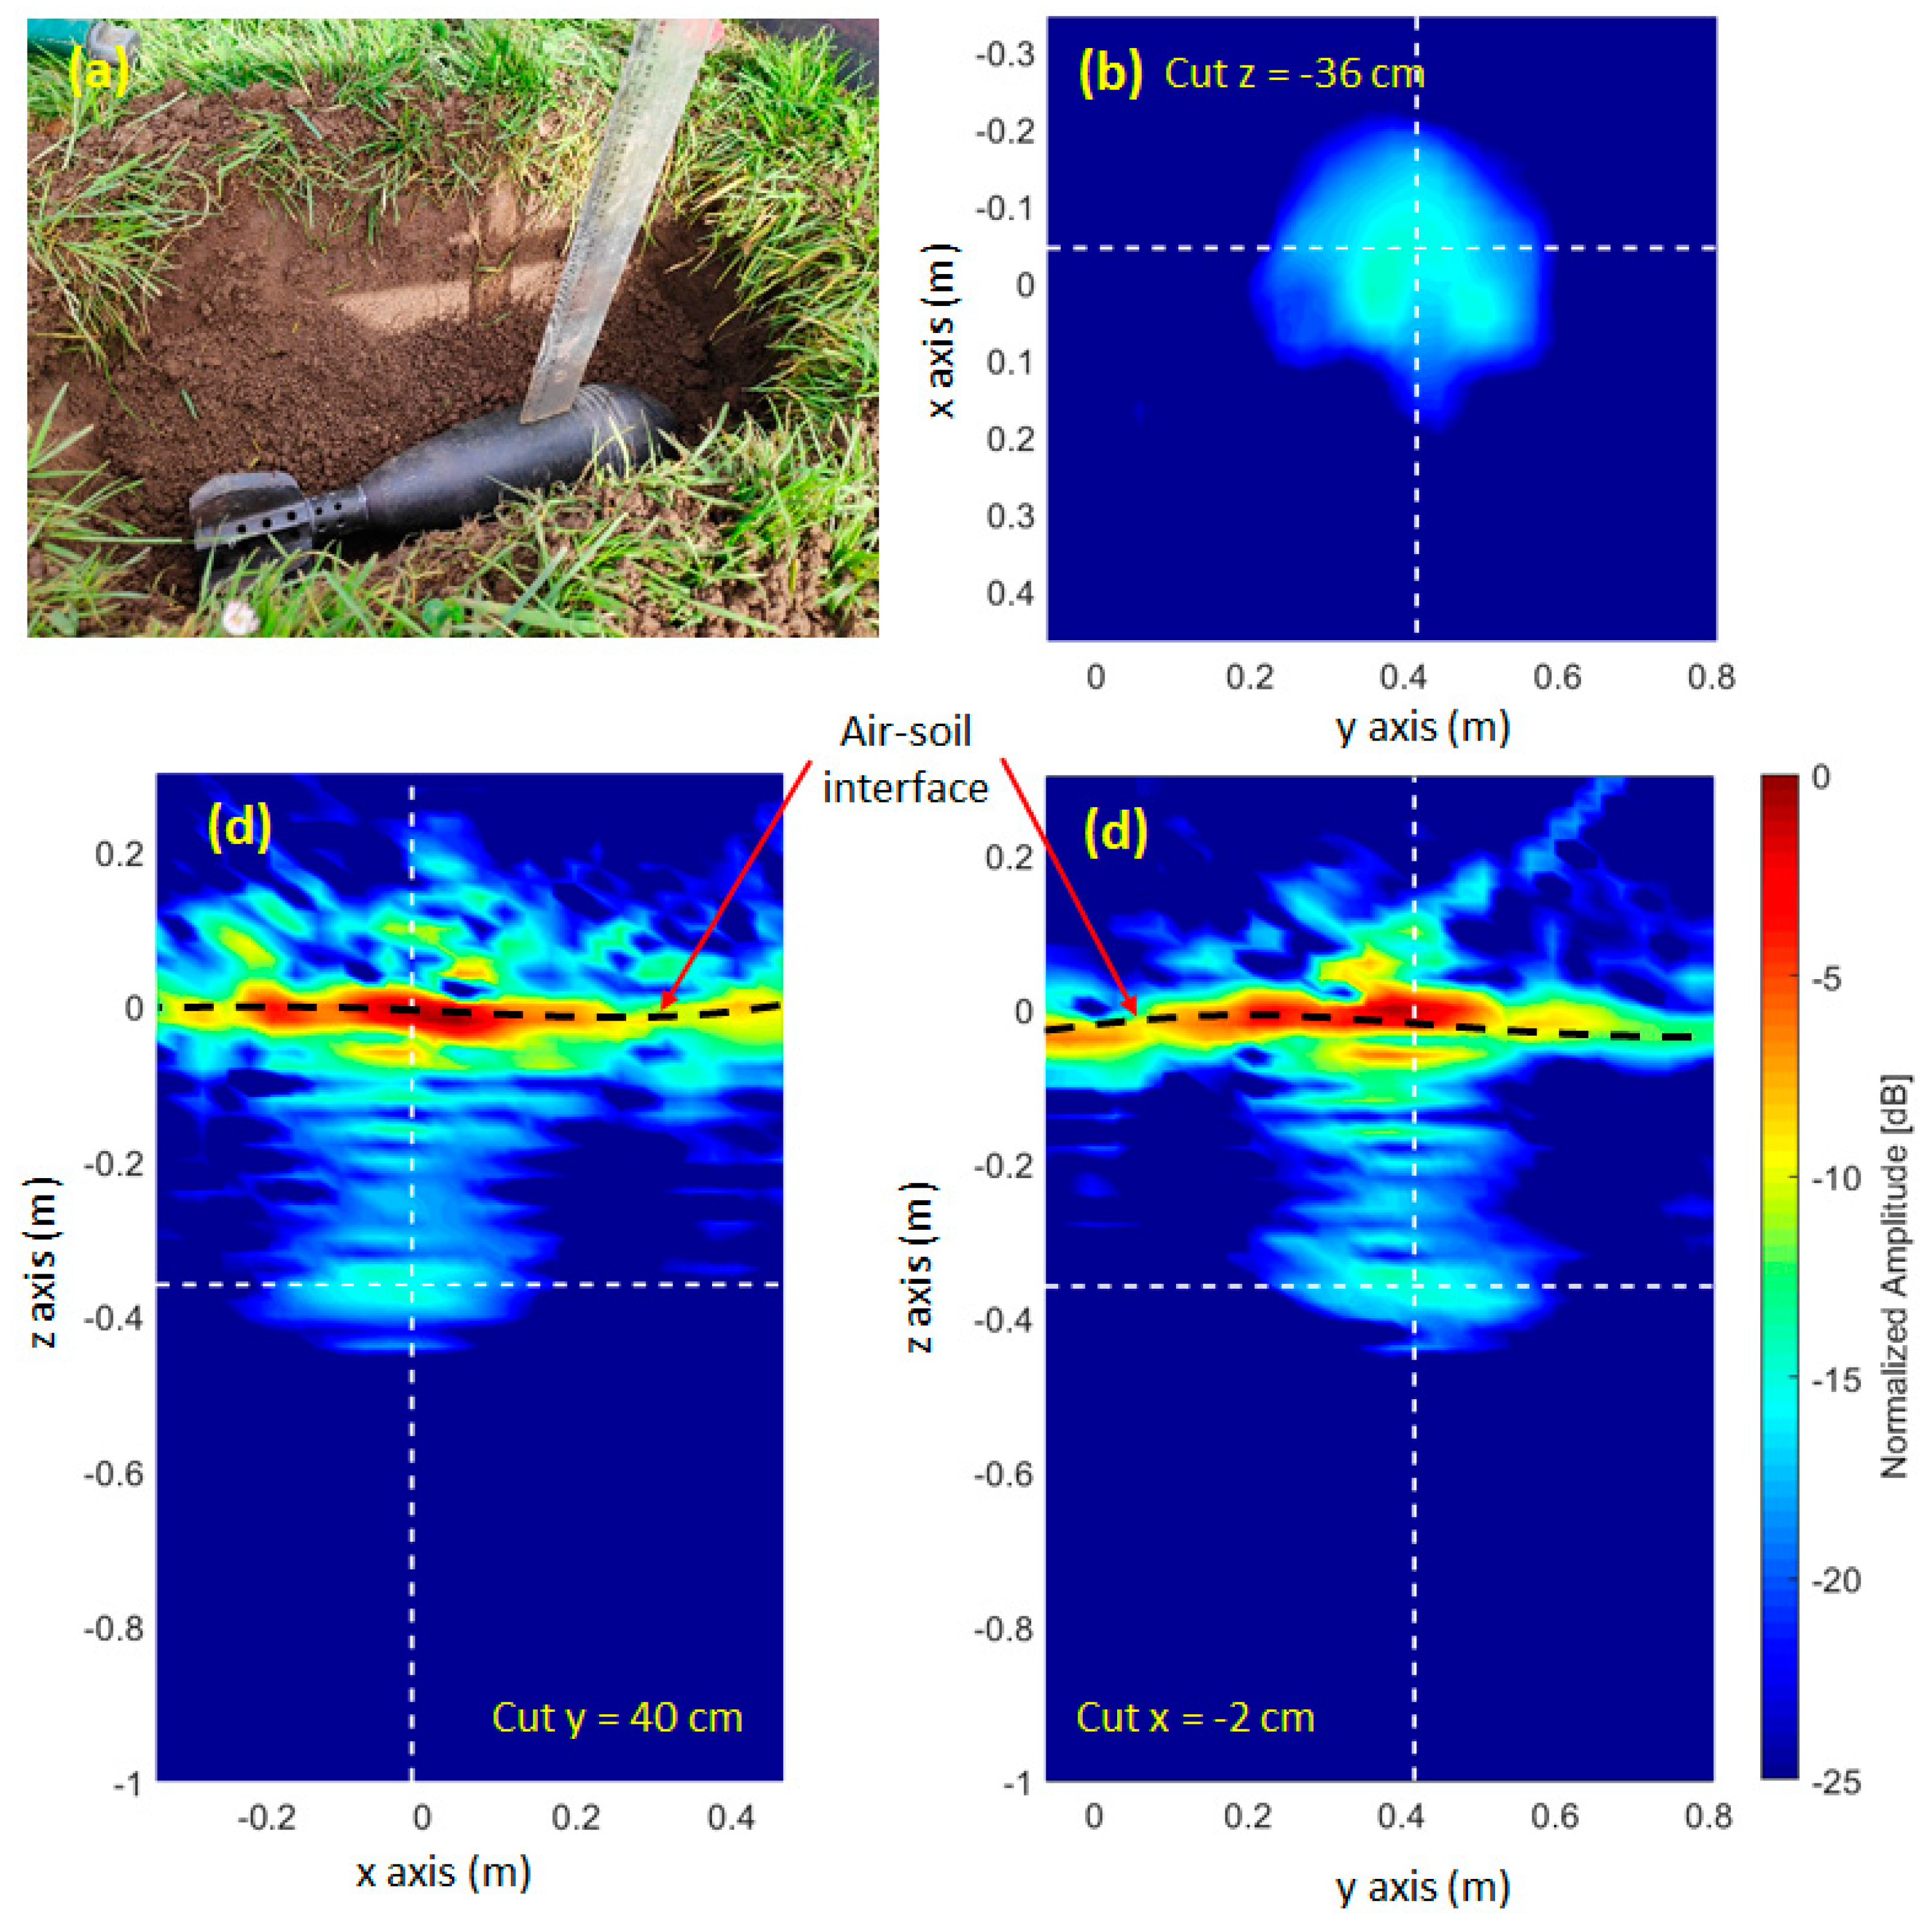
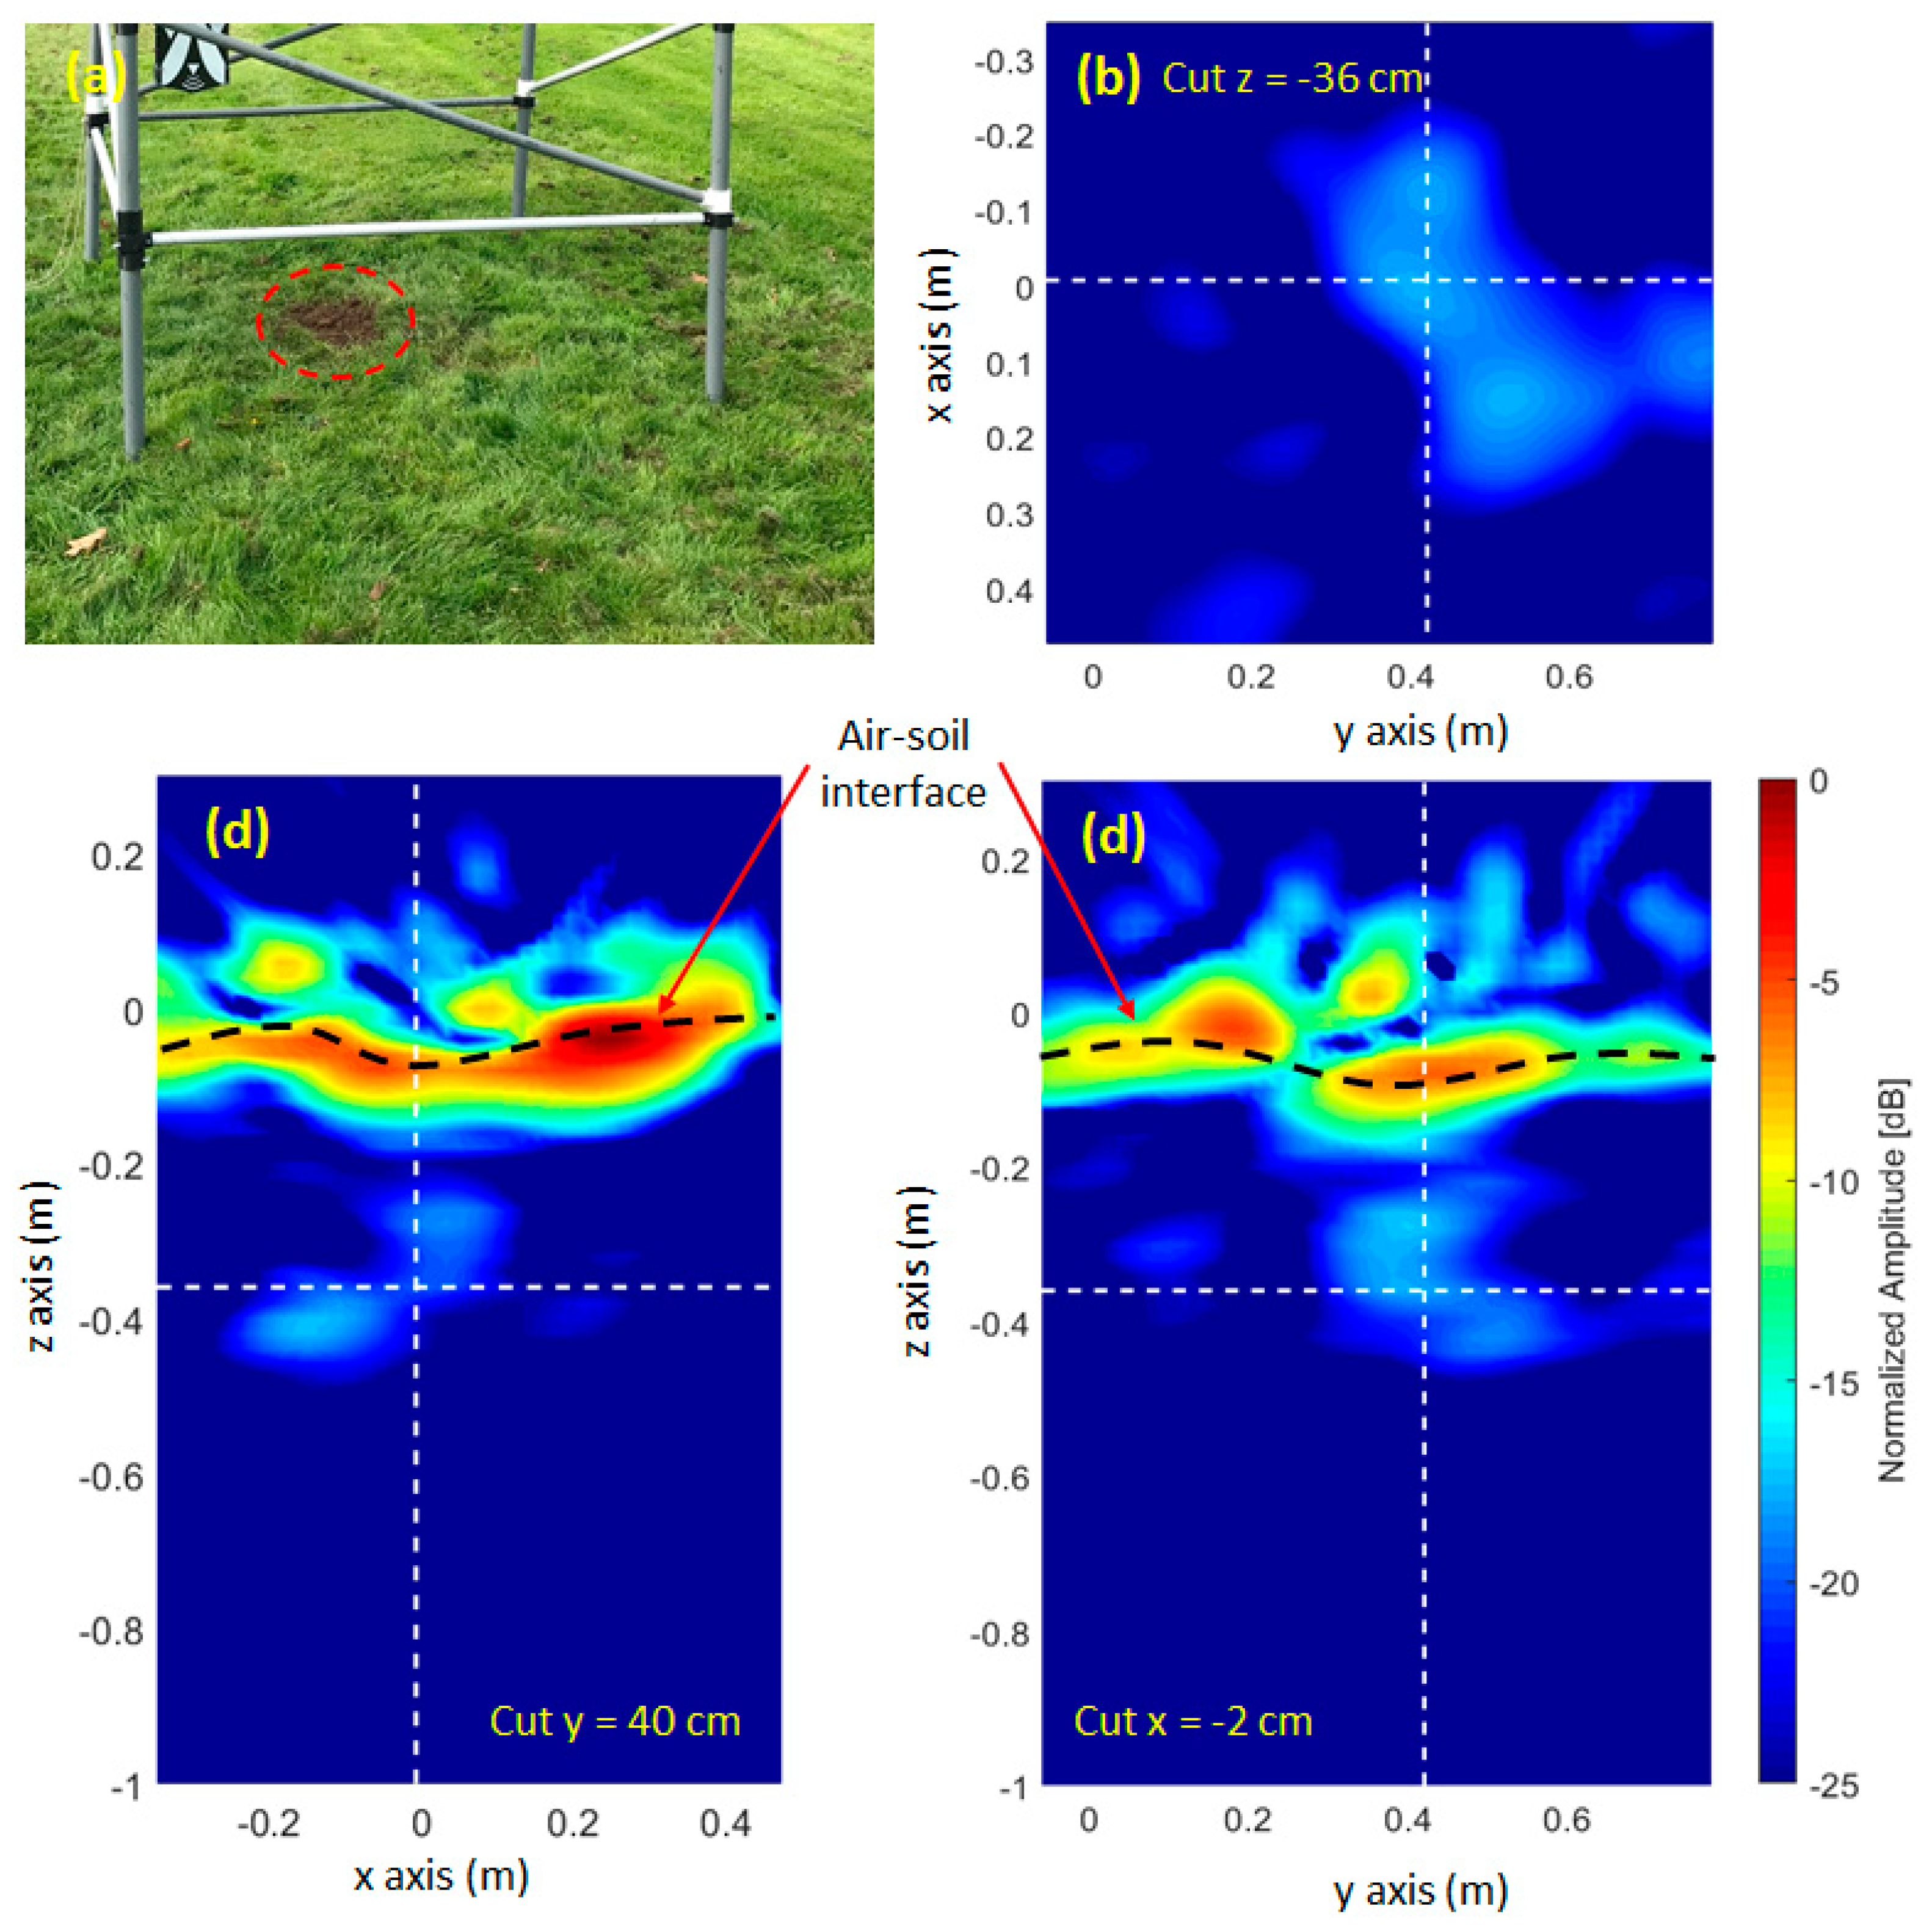
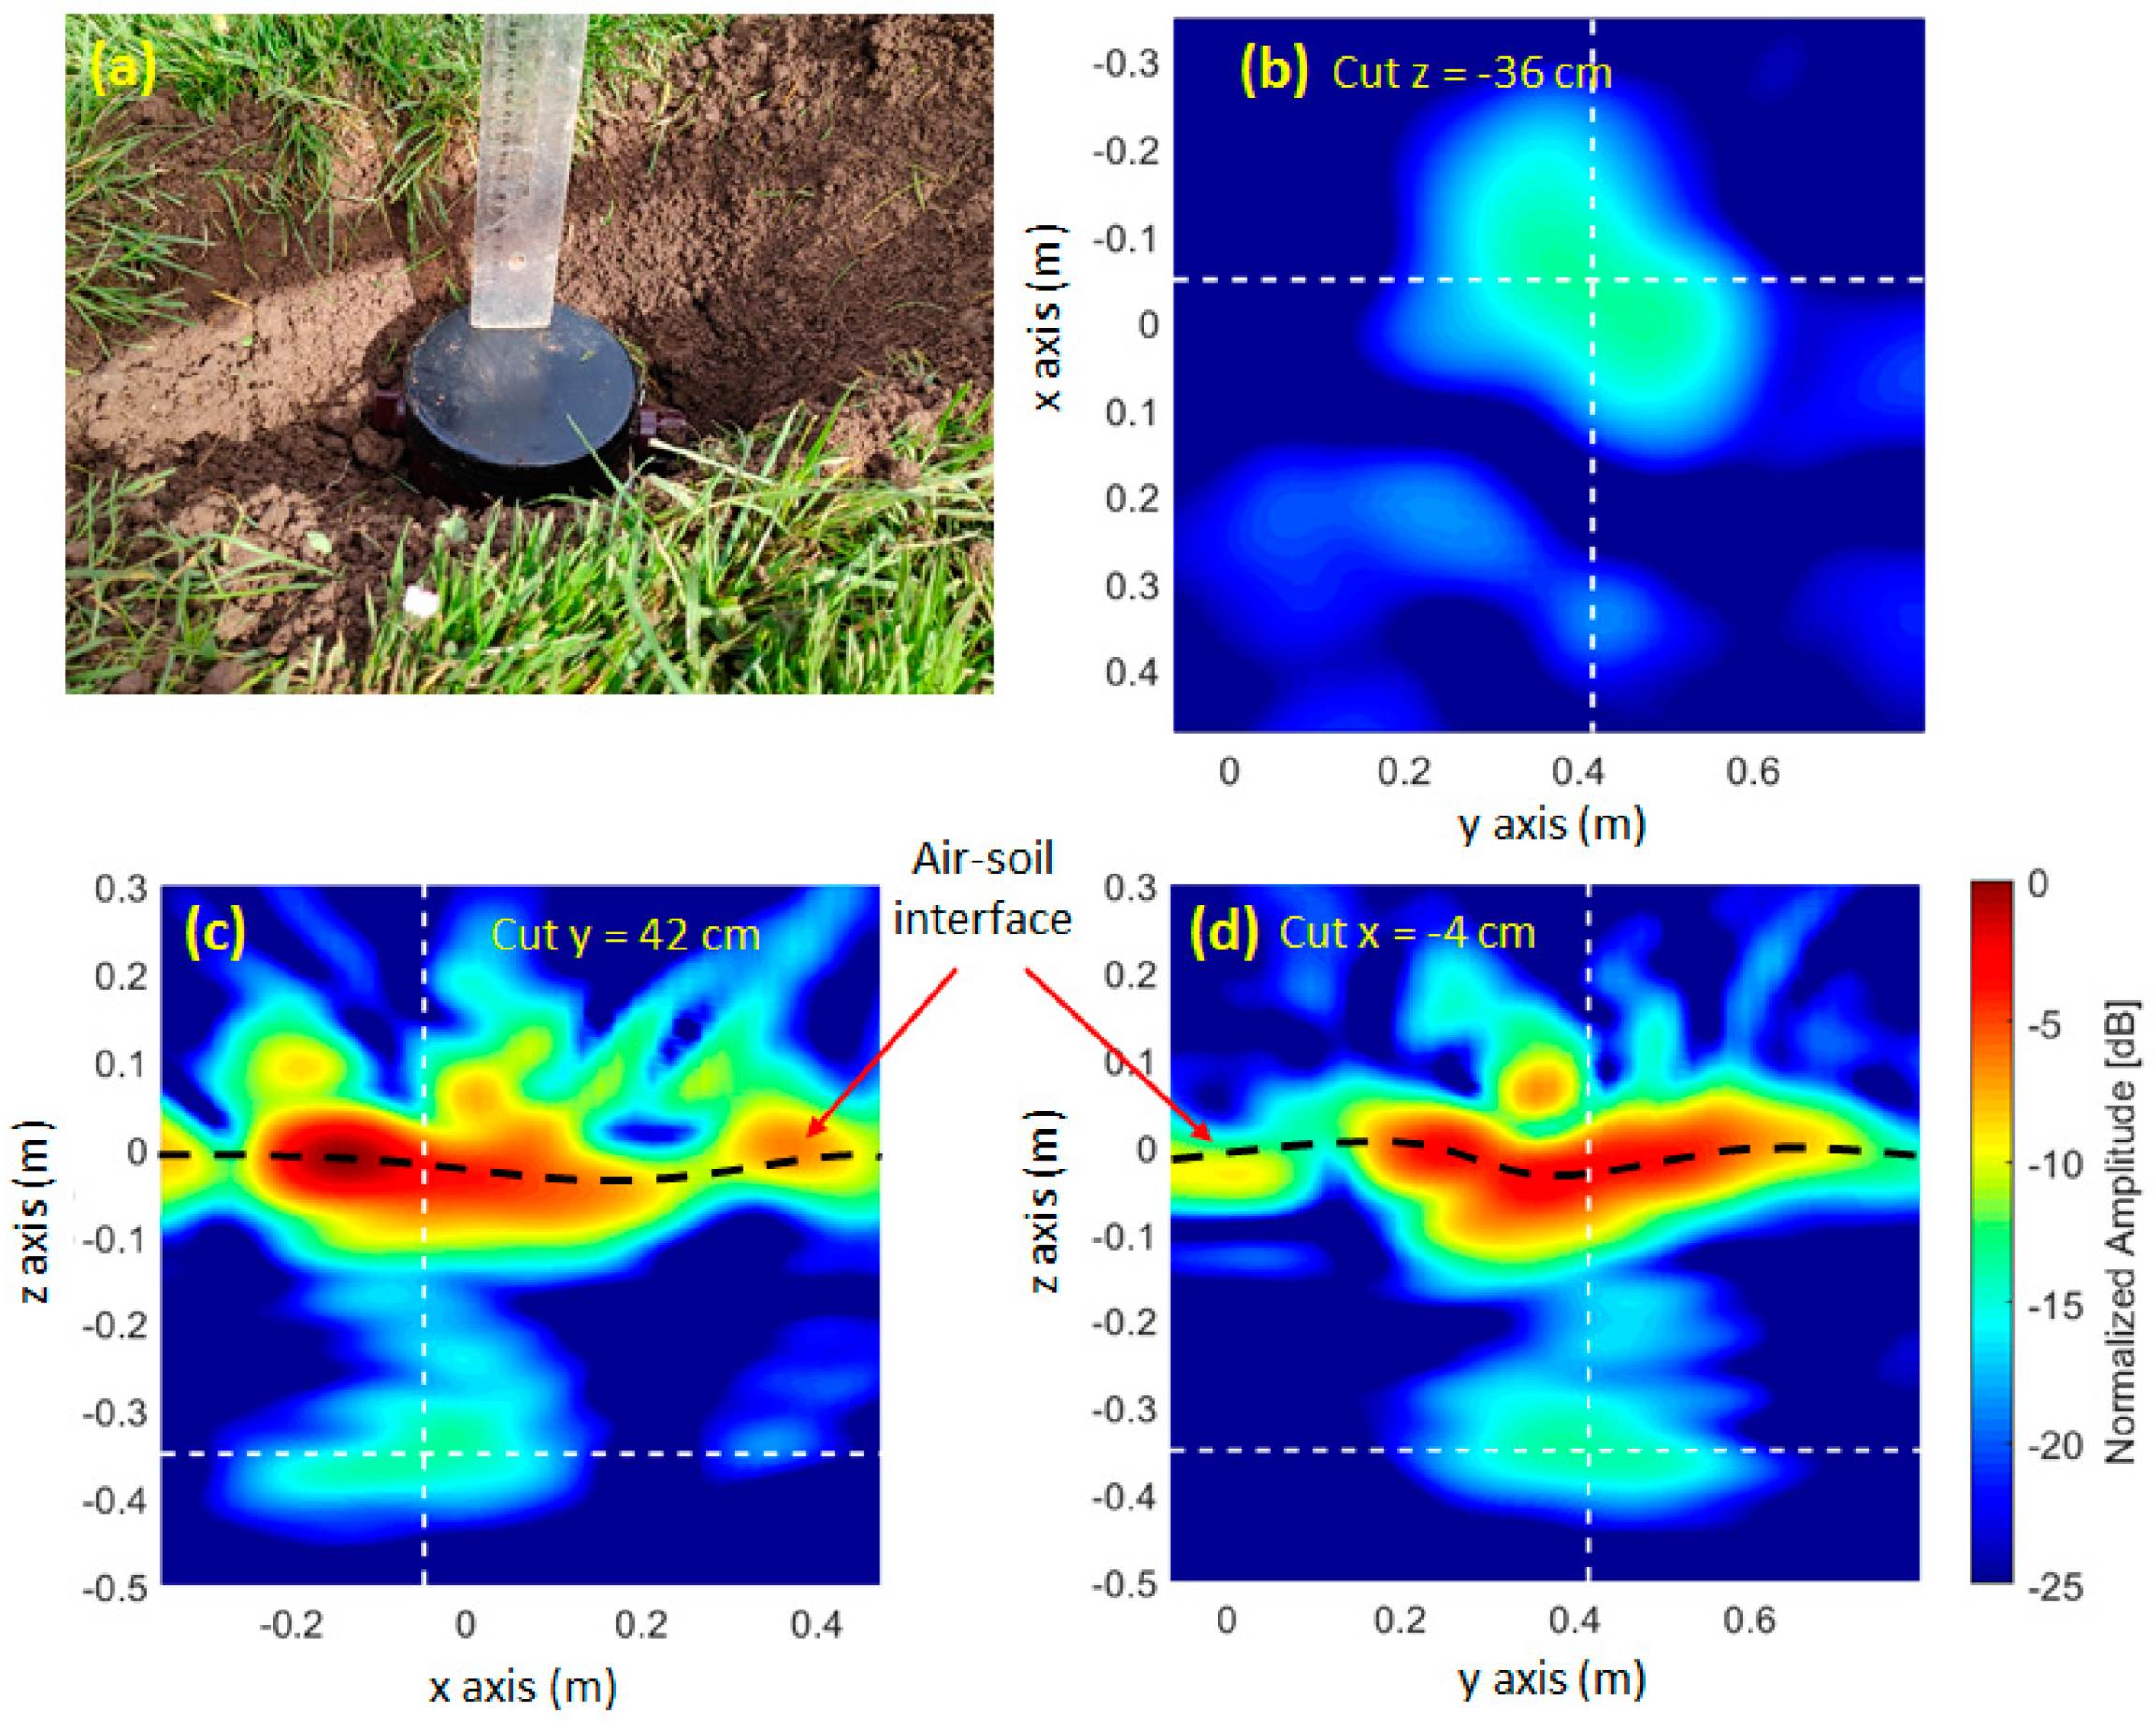
3.1. Detection of Metallic and Plastic Targets Buried in Loamy Soil

The first application focuses on the detection and imaging capabilities of landmines and IEDs. The payload consists of the same hardware described in [14] for the airborne-based GPR prototype. Taking advantage of the fact that the selected UWB radar module has two receiving ports, three antennas were mounted in the payload (see Figure 1) following an Rx-Tx-Rx configuration so the number of sweeps with the sliding system to cover the scanning area can be decreased with respect to a single Tx-Rx configuration (which requires more sweeps to avoid aliasing). UWB linear-polarized Vivaldi-like antennas, working from 600 MHz to 6000 MHz [26], were used. These antennas exhibit small displacement of the phase center with the frequency, so no phase center compensation techniques are required.
Linear sweep is performed by displacing the payload along the plastic arm on top of the frame of the setup (y-axis in the path shown in red color in Figure 5a). After performing a round-trip sweep, the plastic arm with the payload are manually moved to another position (displacement along the x-axis in the rotated path shown in Figure 5a) to perform the next sweep. The average spacing between consecutive sweeps was 5 cm.
Figure 5 shows the positions acquired after performing a full scan, and Figure 6 shows the roll, pitch, and yaw angles given by the IMU. In the case of the z coordinate, the overall variation is within a range of 6 cm. The fluctuations due to the direction of the sweep (forward and reverse) can be noticed in the height, as well as in the roll and the pitch.
The scenario for the test was a grass field, which is a loamy soil with estimated relative permittivity between 5 and 7 and moisture around 30–50%. Due to the high propagation losses for this kind of soil, an effective working frequency from 600 MHz to 3 GHz is considered for GPR data processing of the results that have been presented in this section. This maximum working frequency ensures that, given the aforementioned cross-line spacing of 5 cm, the Nyquist sampling theorem is fulfilled when applying SAR processing. The Nyquist sampling theorem requires the inspected area to be sampled with points separated a distance equal to or smaller than λ m i n / 2 , where λ m i n = c / f m a x is the minimum wavelength. For a maximum working frequency of 3 GHz it results in λ m i n = 10 cm, and thus λ m i n / 2 = 5 cm. The used Vivaldi antennas exhibit a gain ranging from 5 dB to 12 dB within the 600 MHz to 3 GHz frequency band [26].
As first target, an 81 mm metallic mortar grenade of 30 cm length was buried at a depth of 15 cm (Figure 7a). SAR imaging results without applying the equalization of the frequency response of the system are depicted in Figure 7. As aforementioned, free-space was considered as the constitutive parameter of the imaging domain, so the reflection on the buried target is delayed proportionally to the wave-speed in the soil. Provided that εr ∈ [5.0, 7.0], the following estimation of the true depth of the target can be calculated from the position of the echo (Figure 7b–d):
36 cm/([7.0, 5.0])1/2 = [13.6, 16.1] cm.
Taking into account the considered bandwidth (BW = 2400 MHz), the theoretical range or vertical resolution would be ∆R = c/(2BW) = 6.25 cm. However, it must be mentioned that no frequency response equalization is applied. Thus, lower frequencies will contribute more to the SAR image than higher frequencies [13,21], so the effective range resolution is worse than 6.25 cm, as can be observed in Figure 7c,d.
Figure 8 represents the XY cut of the SAR image at the position where the buried target is found with the selected measurement positions (red dots) on top, aiming to provide a comparison between the size of the acquisition grid and the imaging domain. For this example, around 5000 measurement positions were selected based on the criteria defined in [14]. Regarding the definition of the imaging domain, as explained in [14], the maximum axis-aligned rectangle in the horizontal plane inside the bounding box enclosing the observation domain (i.e., the measurements) is computed and this rectangle is shrunk by a scale factor of sft and sfct in the track and across-track directions respectively (to avoid edge effects in the SAR image). These scale factors were set to sft = 0.95 and sfct = 0.85 in this example. The imaging domain was discretized using a 2 cm step along the x, y and z axes, resulting in around 120,000 points.
If equalization of the frequency response is applied in the SAR processing [13,21], the range resolution is improved, as observed in Figure 9 (∆R is within the range of 5–7 cm). However, this equalization also reduces the amplitude of the echo of the target, as higher frequencies suffer from more free space losses than lower frequencies. If Figure 7 and Figure 9 are compared, there is a 5 dB loss in the amplitude of the echo of the buried mortar grenade.
One of the issues when digging a hole to bury a target is how the fact of altering the soil affects the results. For example, in figure 24c of [21], the reflection at the interface between the dry sand (the one used to fill in the hole) and the wet, compact sand can be observed. Aiming to test the impact of the contrast between the material used to fill in the hole and the surrounding, unaltered soil, a measurement with no target buried in the hole was conducted. Results are presented in Figure 10, where it can be observed that the reflectivity level at the same position where the mortar grenade was buried is now around −20 dB, that is, around 10 dB smaller than the reflectivity of the mortar grenade (Figure 7).
Next, a 16 cm diameter plastic anti-personnel landmine was buried also at a depth of 15 cm (Figure 11a). After performing a full acquisition with the portable setup, recovered SAR images are shown in Figure 11b–d. It can be observed that the echo due to the plastic landmine is clearly visible, being 3 dB weaker than the echo of the metallic mortar grenade (Figure 7). Despite the fact that the mortar grenade is metallic, it has a cylindrical shape whereas the plastic landmine has flat faces that contribute to enhance the specular reflection (i.e., strong backscattering).

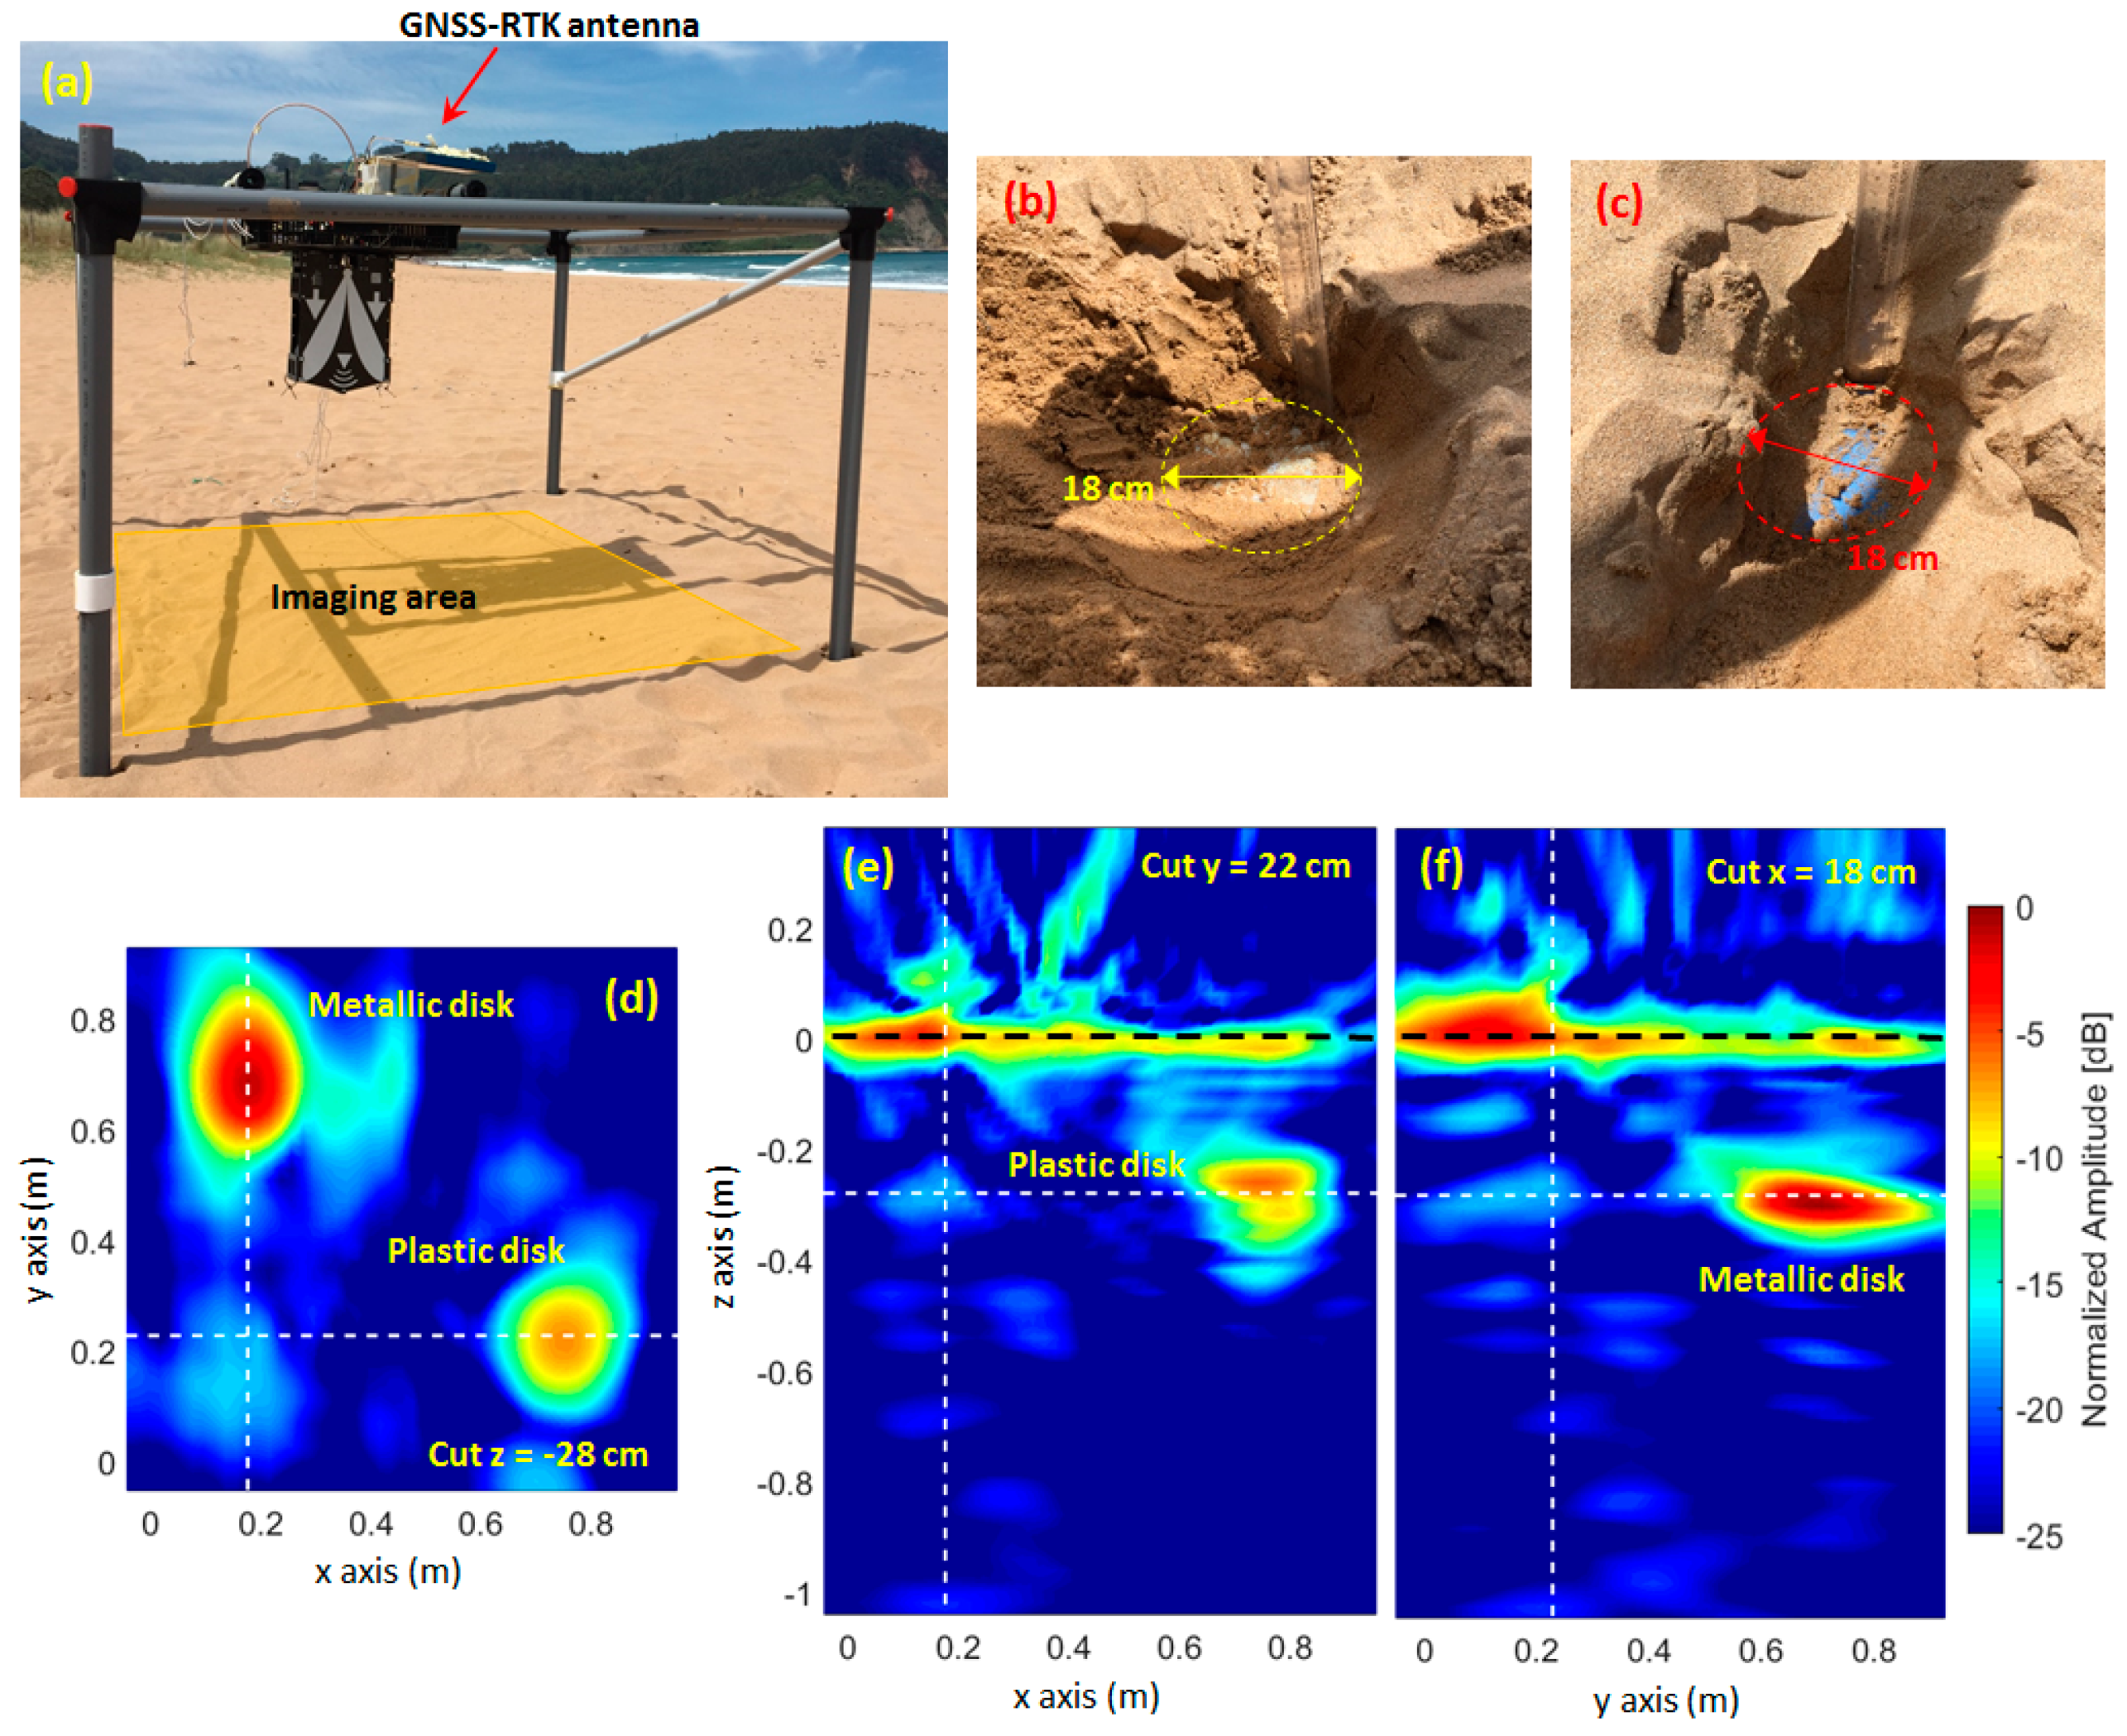
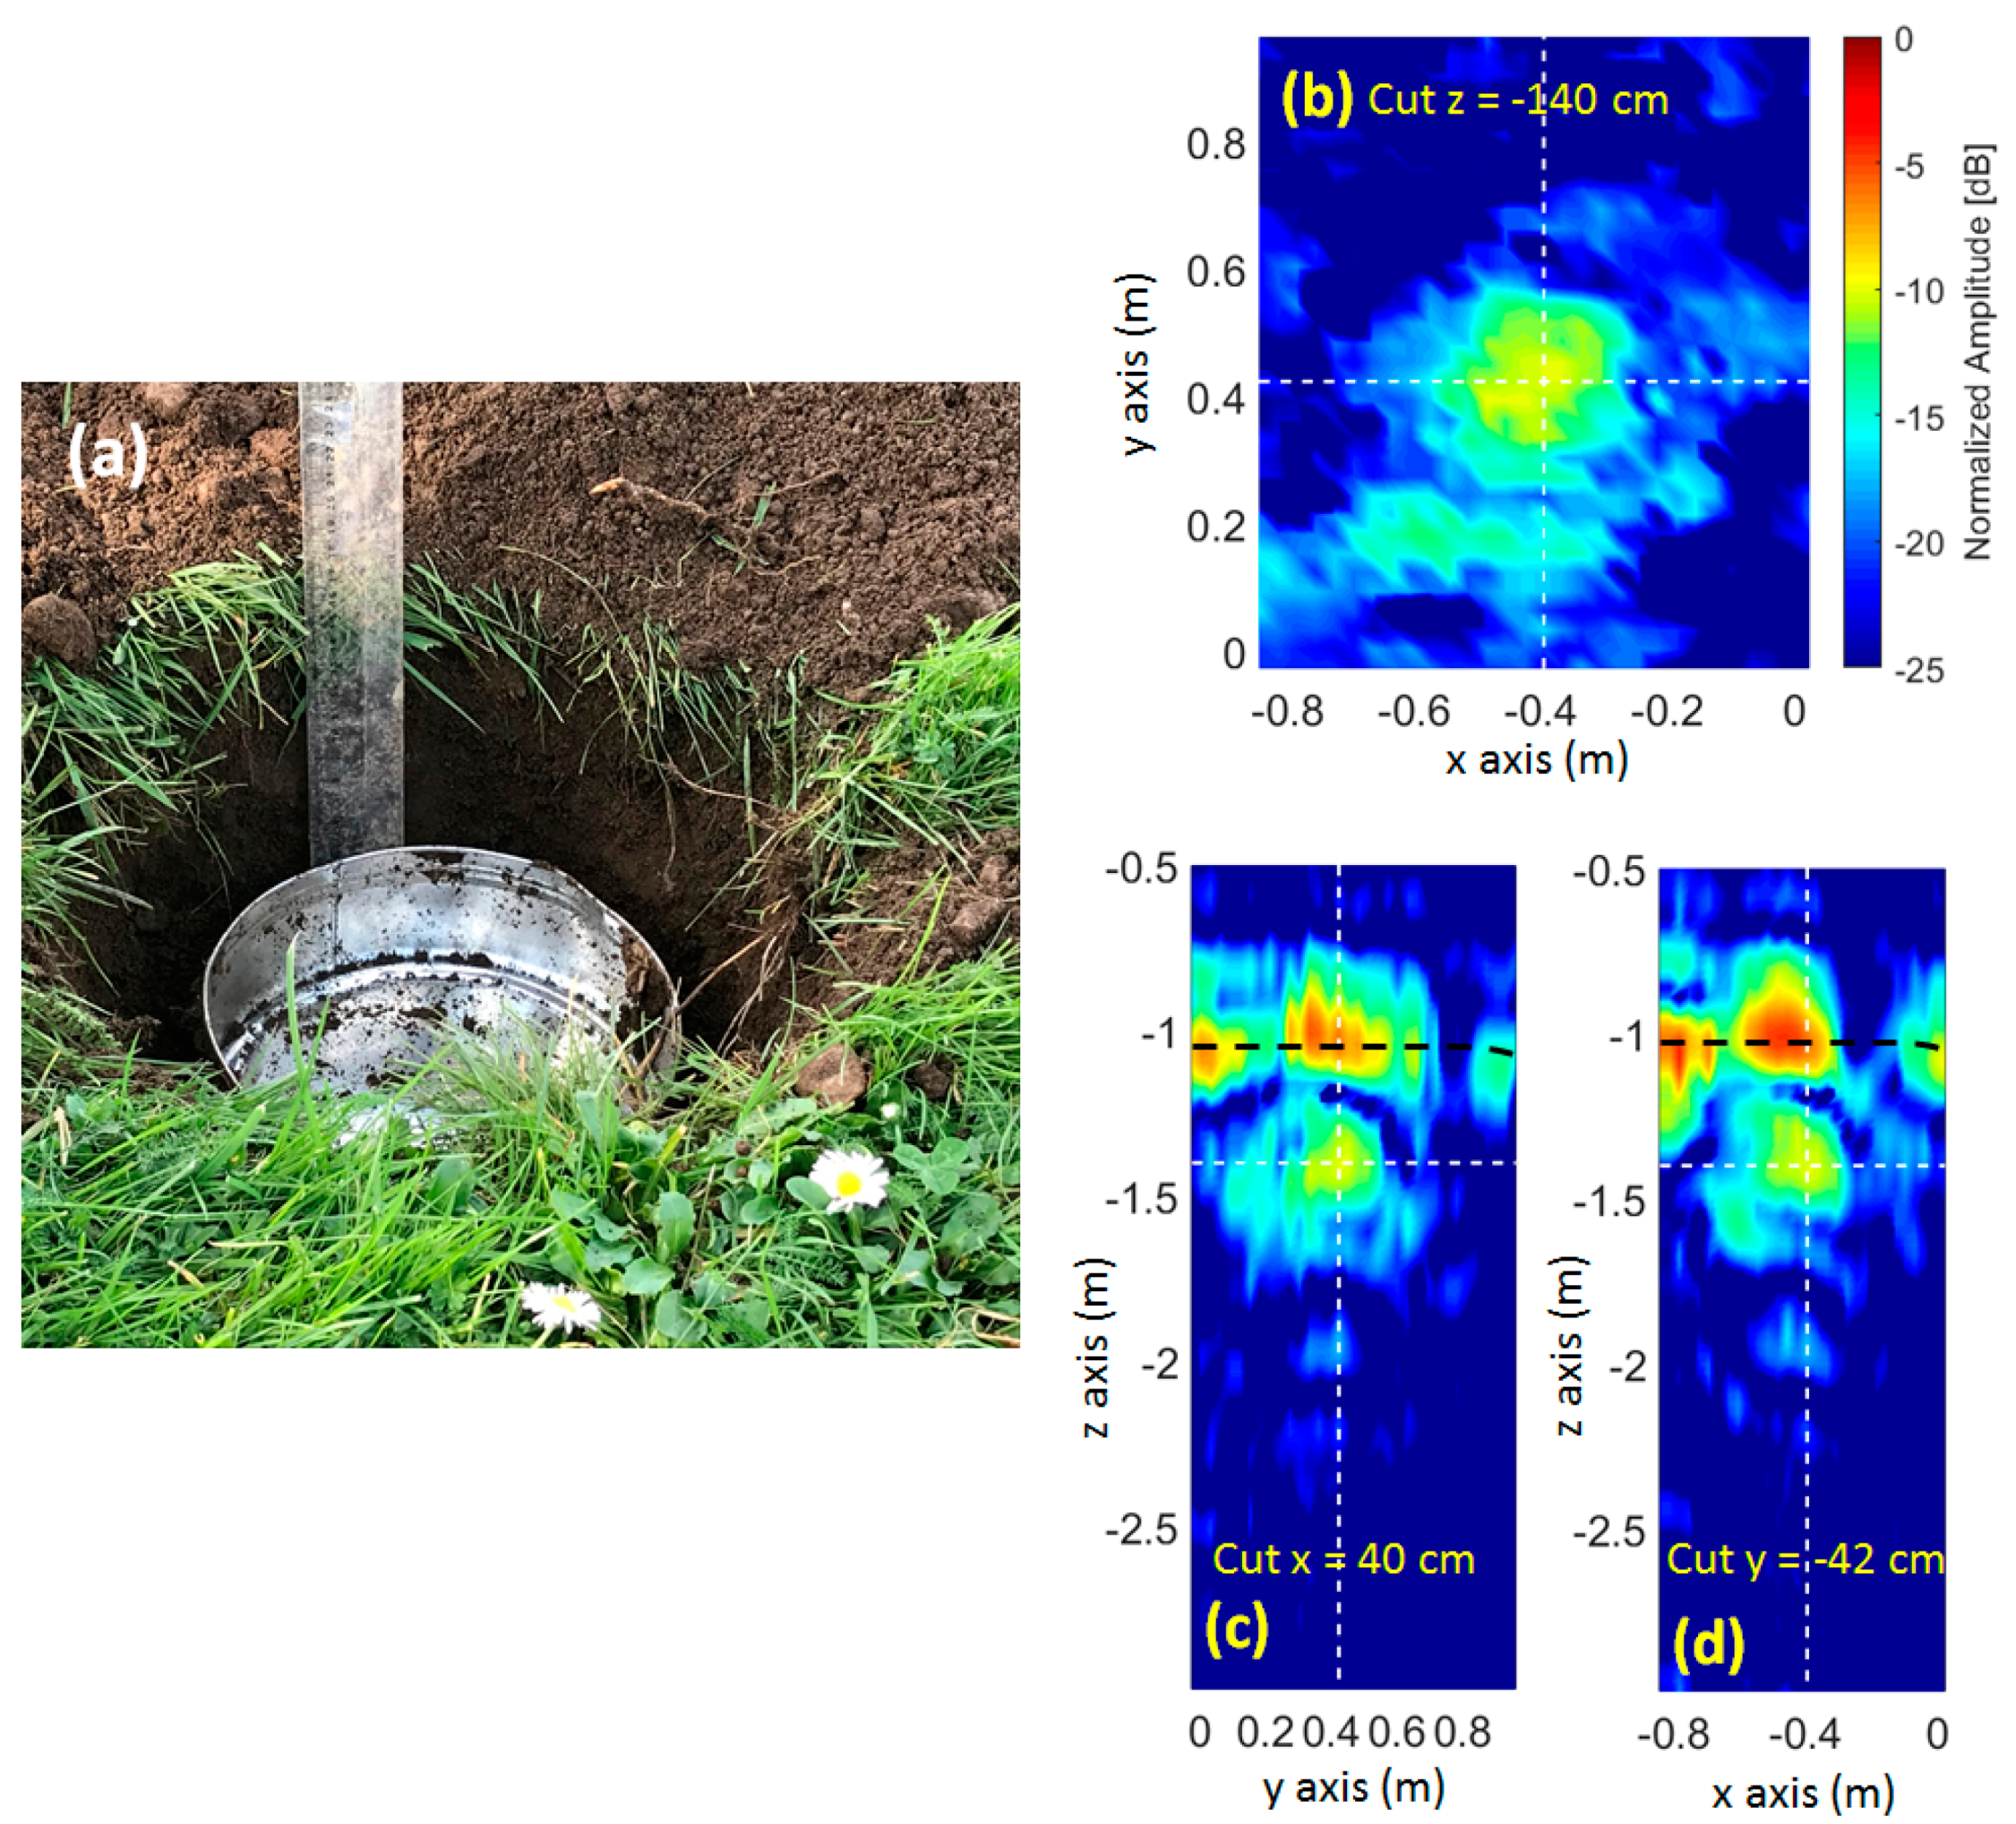
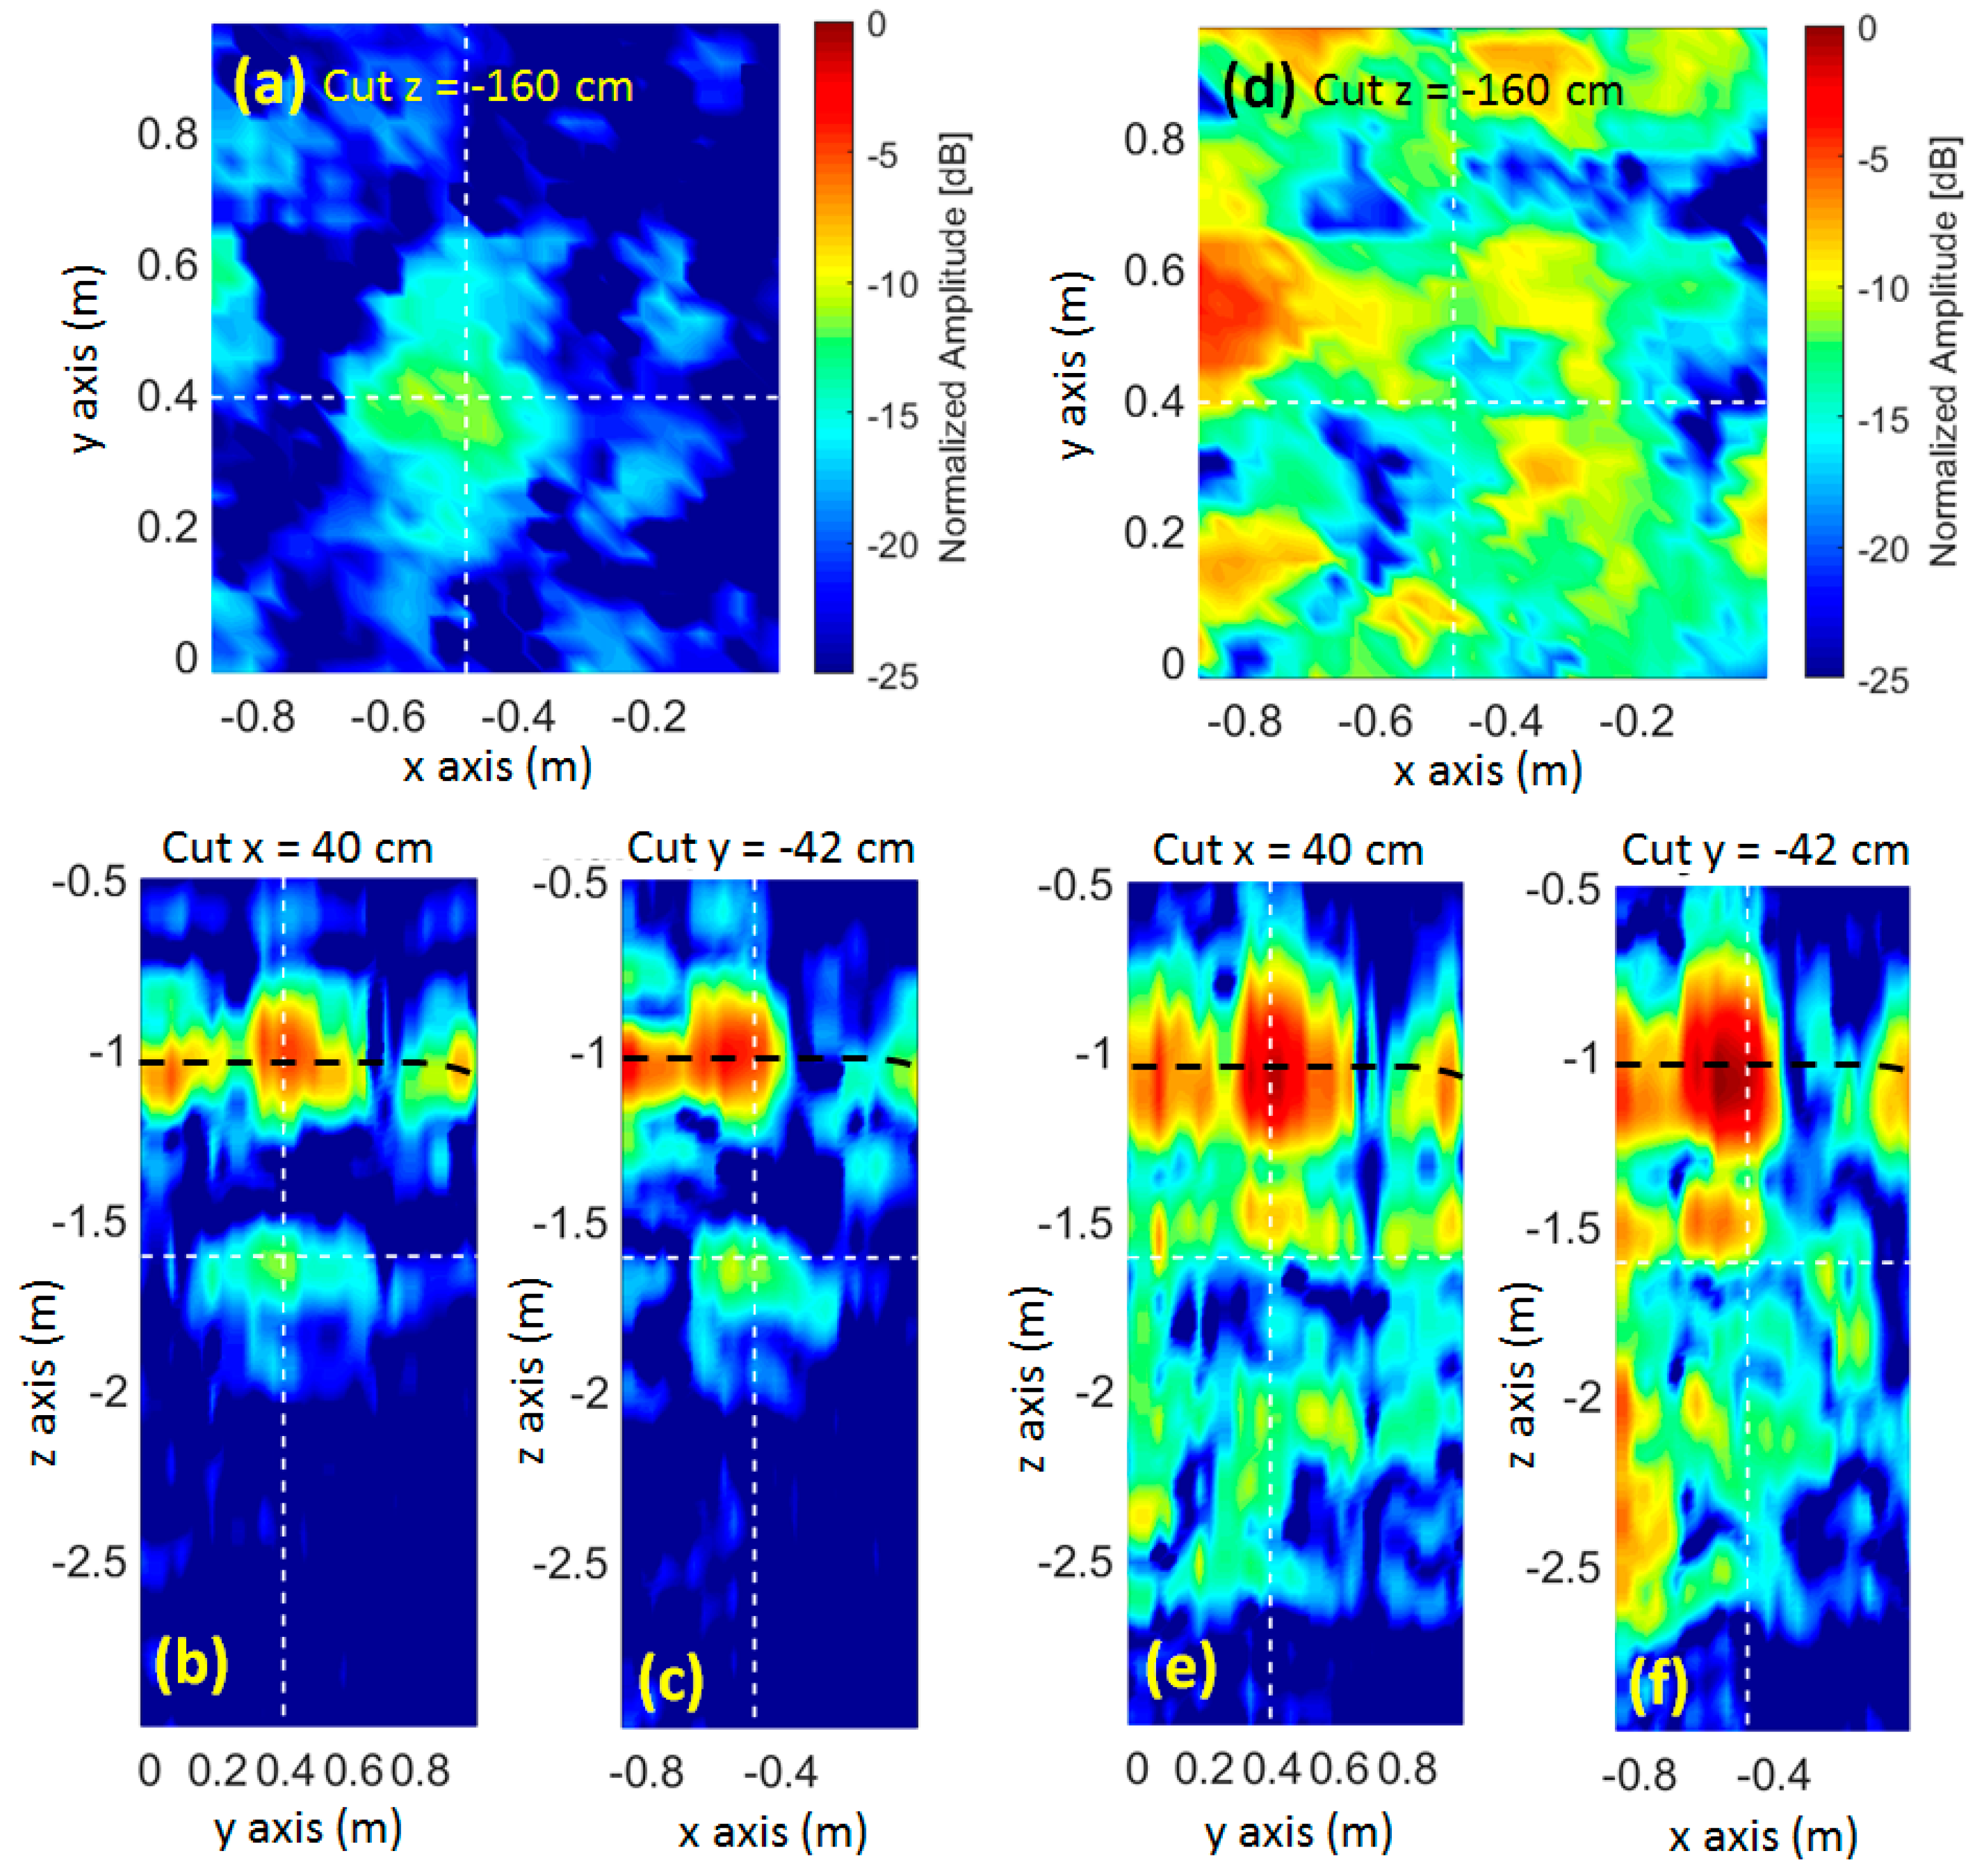
3.2. Test in A Dry Soil

The second example shows how the proposed portable setup can be used to test different kinds of soils and scenarios, aiming to assess the performance of the GPR system. The setup was deployed in a dry sandy beach, as shown in Figure 12a, using one transmitting and one receiving Vivaldi antenna as, at the time these measurements were conducted, only two Vivaldi antennas were available. Two targets were buried in the soil: an 18 cm diameter metallic disk at 18–20 cm depth (Figure 12b) and an 18 cm diameter plastic disk at 16–18 cm depth (Figure 12c).
After performing a full acquisition with the setup, several cuts of the recovered SAR image (without applying equalization) are shown in Figure 12d–f, where the buried targets are clearly distinguishable. As can be concluded from these results, the metallic disk is detected at around 29 cm depth and the plastic one at 26 cm. Considering that the typical value of the relative permittivity for this kind of soil is in the range εr ∈ [2.0, 3.0], the following estimation of the true depth of the targets can be calculated from the position of the echoes (Figure 12d–f): for the metallic disk 29 cm/([3.0, 2.0])1/2 = [16.7, 20.5] cm and for the plastic one 26 cm/([3.0, 2.0])1/2 = [15.0, 18.4] cm, in agreement with the true depth of the buried targets.

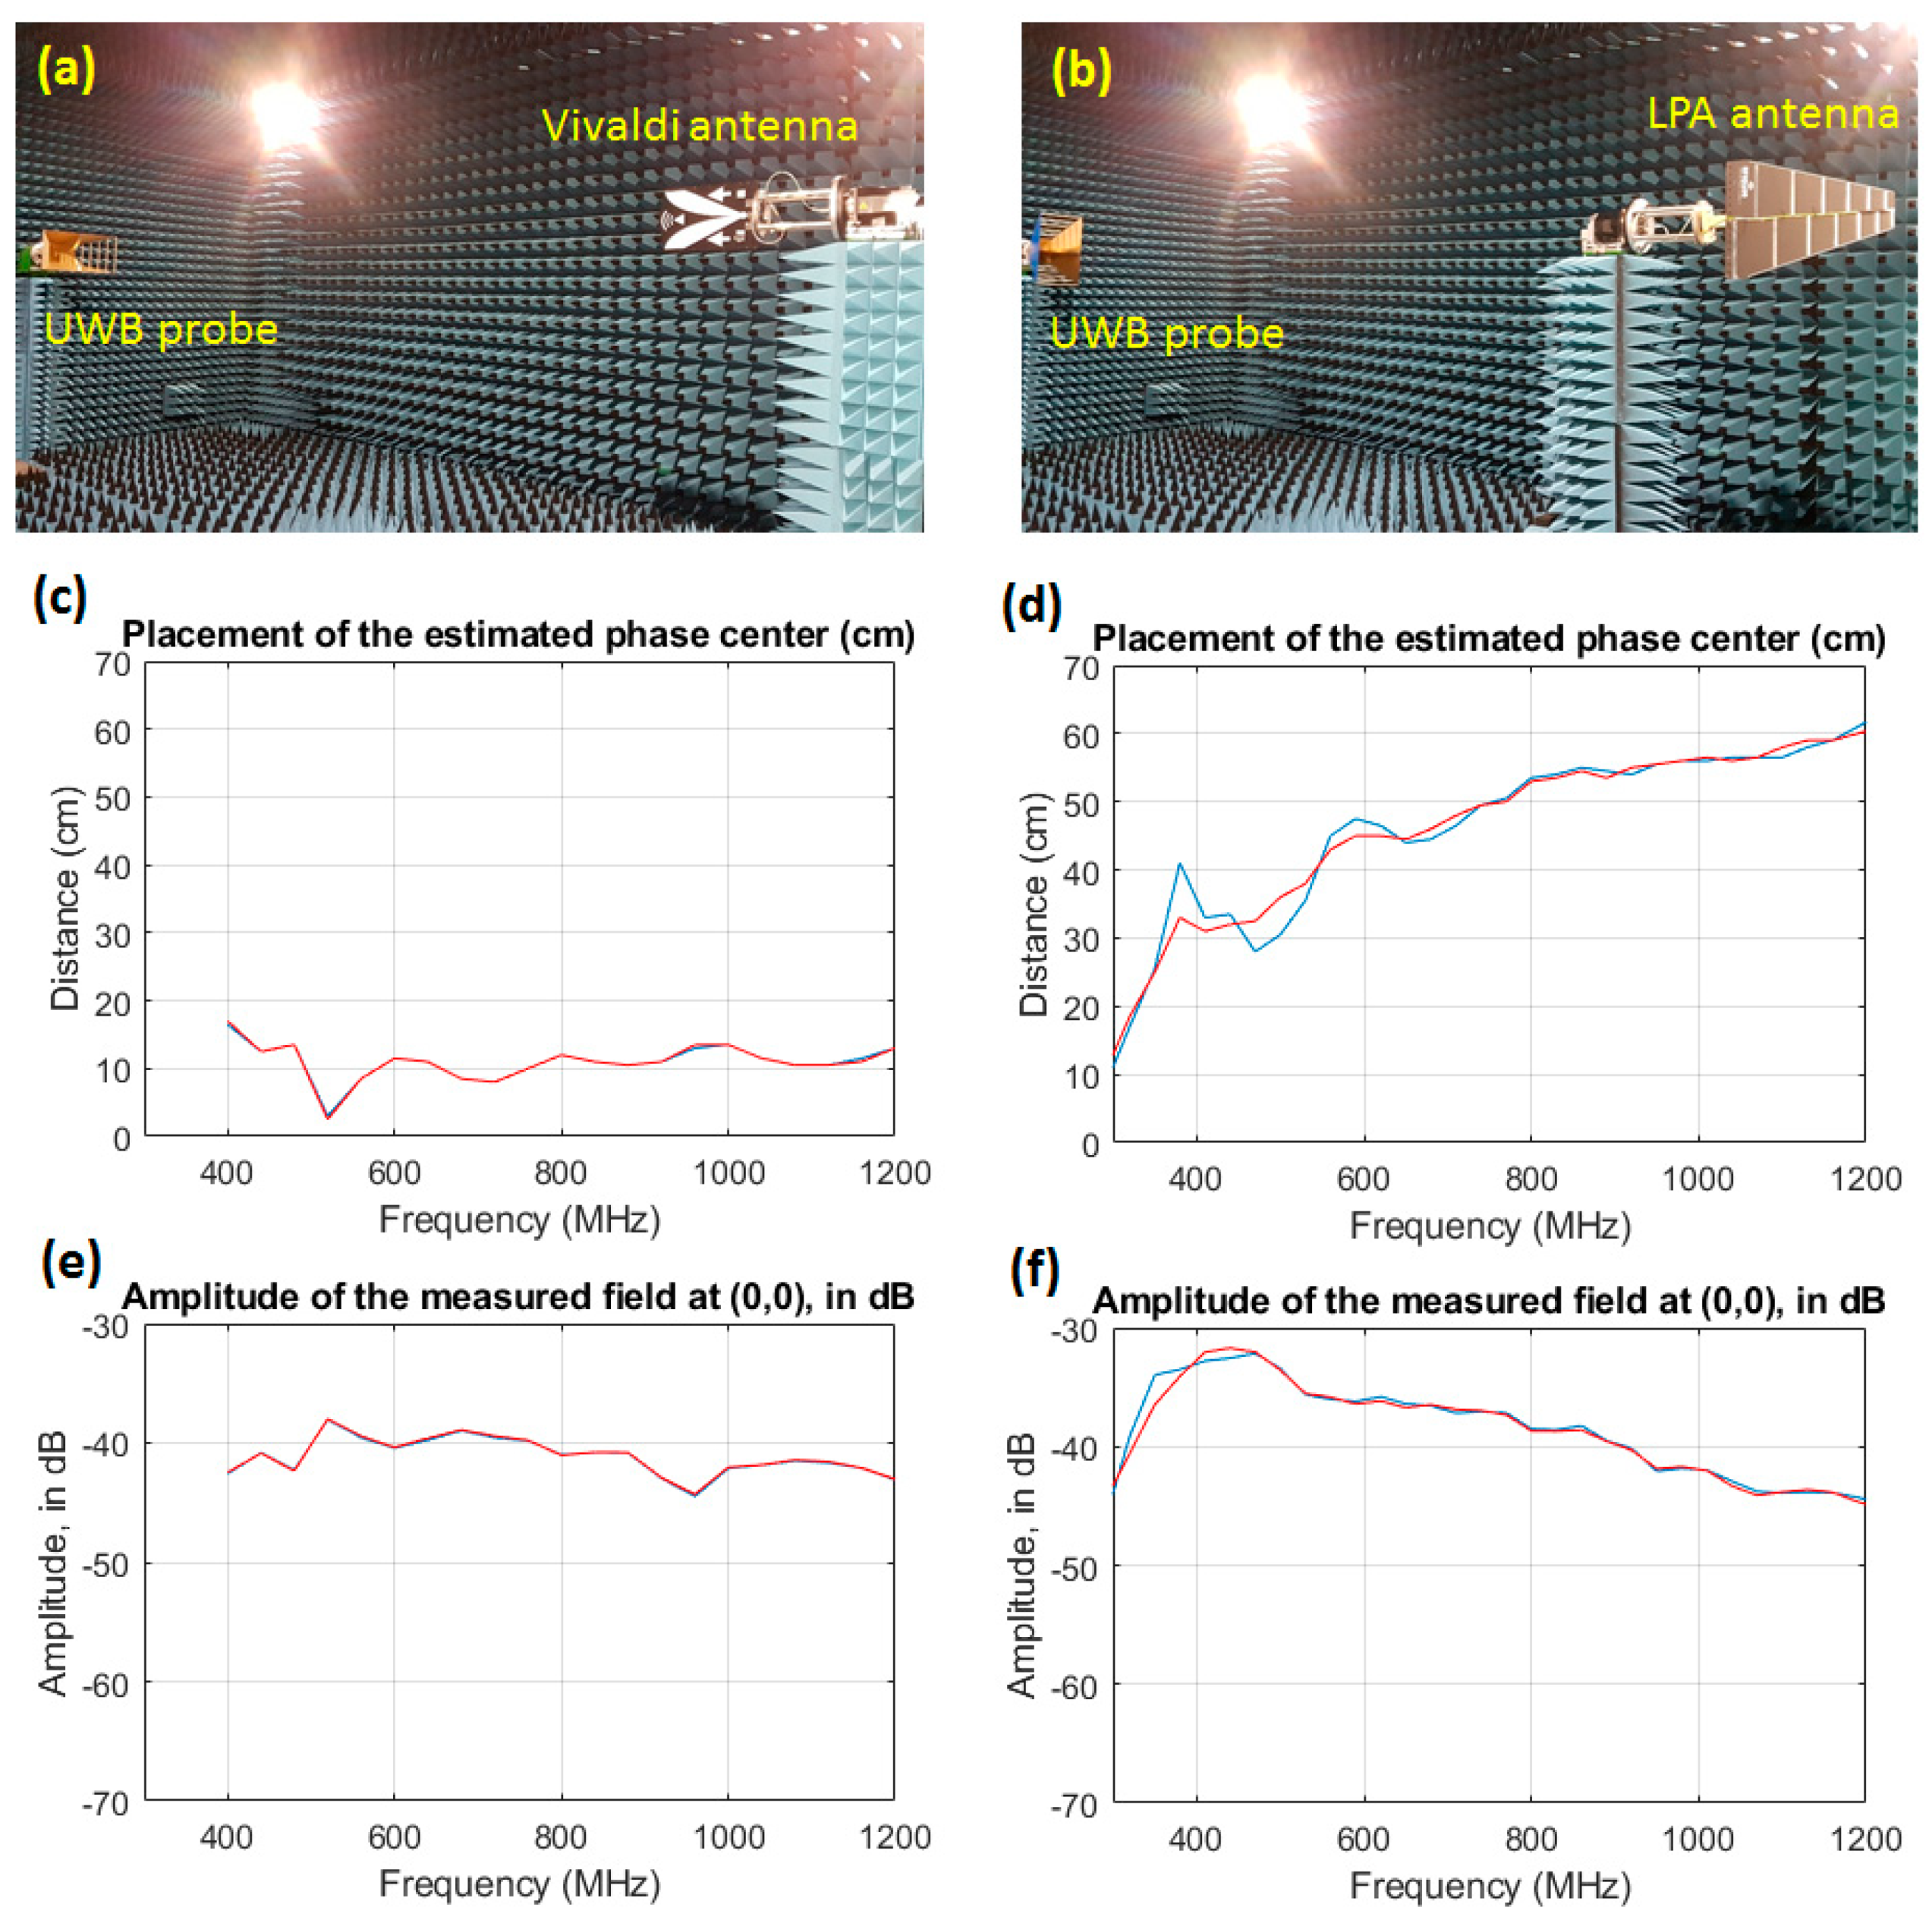
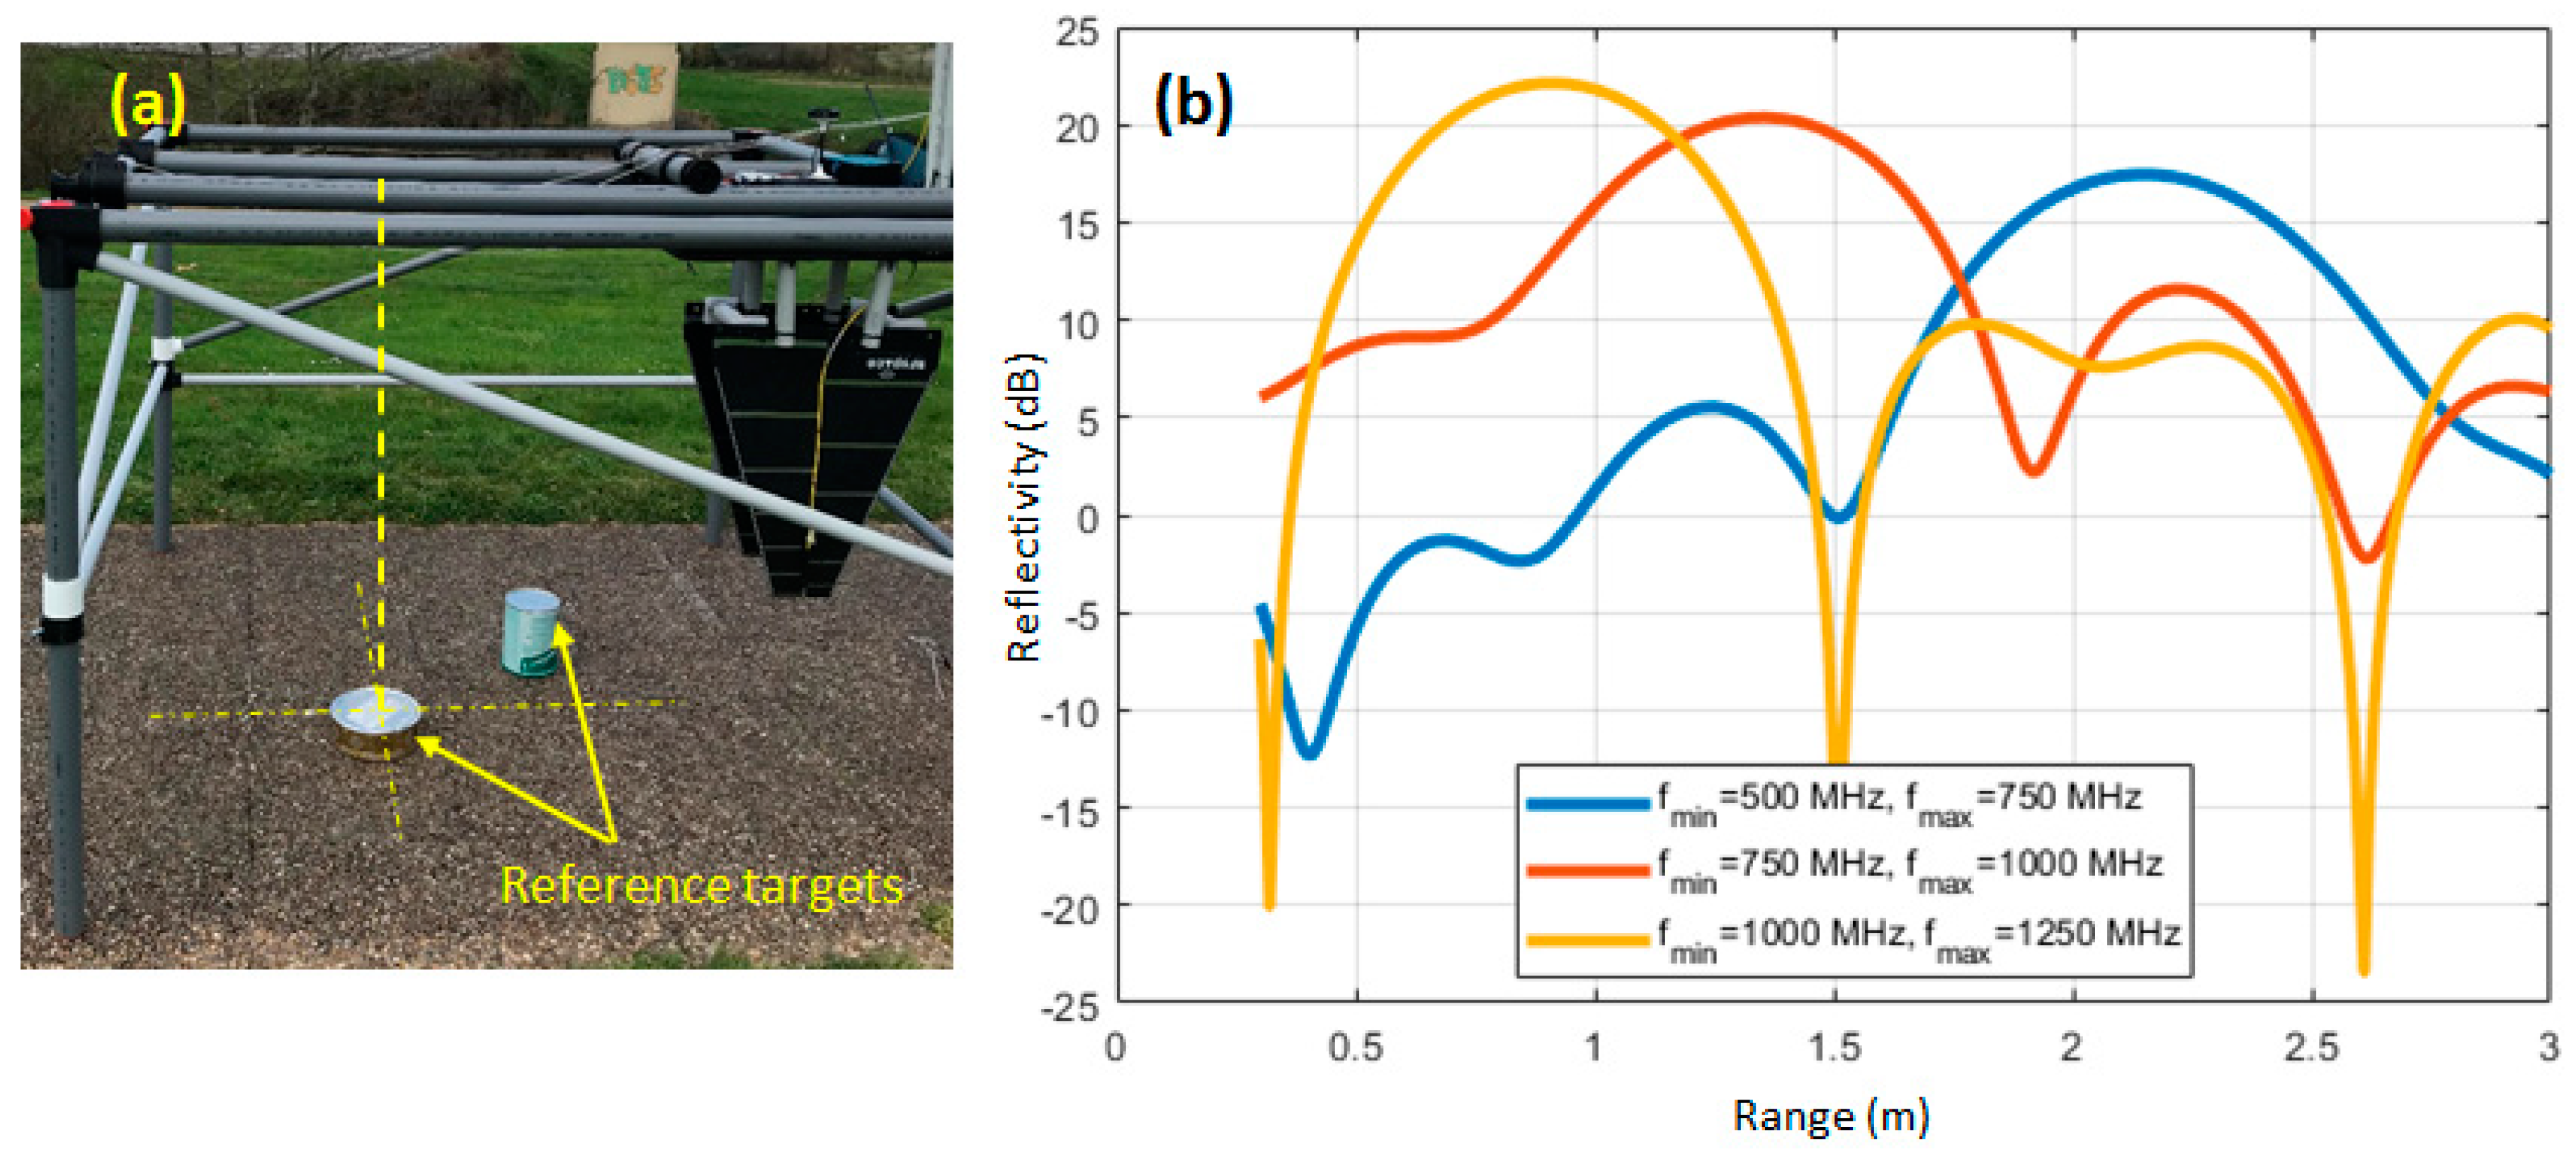
3.3. Testing of Antennas Exhibiting Large Displacement of the Phase Center

The last example is devoted to show how the proposed portable setup can be used to test different kinds of antennas, aiming to improve the detection capabilities of the GPR system. The Vivaldi antennas used for the measurements shown in Section 3.1 and Section 3.2 [26] have a minimum working frequency within the range 550–650 MHz, where the radiation pattern becomes less directive (antenna gain is around 4 dB). Thus, two Log-Periodic Antennas (LPA) working in the 400–1200 MHz band, whose gain is around 7 dB in the lower part of the working frequency band [27], were tested. These antennas were mounted in the payload as shown in Figure 13. It can be observed in the same figure how the GNSS antenna was placed on top of a 1 m plastic mast to minimize interferences between GNSS and radar signals.
Both Vivaldi and LPA antennas were measured at a spherical range in an anechoic chamber (Figure 14a,b), so the full characterization of the antenna parameters in their working frequency band is available. As mentioned before, Vivaldi antennas exhibit a quite flat response in the frequency domain (Figure 14c,e). However, the LPA antennas have a large displacement of the phase center, as can be observed in Figure 14d. If no phase center compensation is applied, that is, if it is assumed that the path traveled by the waves for each individual frequency is the same, the resulting SAR images would be blurred.
Different techniques for phase center compensation can be applied. For example, a model to correct the dispersion introduced by a sinuous antenna is proposed in [28]. In this contribution, a methodology based on the measurements taken with the portable setup was conducted, avoiding the need for accurate characterization of the antennas at a spherical range in an anechoic chamber. The method is based on placing flat metallic targets above the ground (Figure 15a), so the echo of these targets can be used to detect the path length from the transmitter to the receiver at different frequency bands. As the range or vertical resolution depends on the frequency bandwidth, and taking into account that the LPA bandwidth is around 800 MHz, the LPA frequency band was divided into three sub-bands of 250 MHz each, that provide 60 cm range resolution, enough to locate the placement of the reflection at the metallic target. The position of the peak of the reflectivity for each 250 MHz sub-band is shown in Figure 15b.
Next, the position of the peak of the reflectivity for each sub-band (doffset(f)) was recorded. If this distance is multiplied by the wavenumber, a phase of value k0(f)doffset(f)) is obtained. This phase term partially compensates the phaseshift introduced by the displacement of the LPA phase center with frequency. Thus, phase compensation is conducted as proposed in Equation (2):
E s c a t t , c o m p ( f , x , y , z ) = E s c a t t ( f , x , y , z ) exp ( + j k 0 ( f ) d o f f s e t ( f ) ) ,
where Escatt,comp(f,x,y,z) is the measured field at the position x,y,z after applying the phaseshift given by k0(f)doffset(f)).
Validation of the proposed method is shown in Figure 16, where a 20 cm diameter metallic box was buried at a depth of 17 cm (Figure 16a). Cuts of the recovered reflectivity are plotted in Figure 16b–d, where the buried metallic box is located at an apparent depth of 40 cm. Thus, the estimated true depth, given a relative permittivity within the [5.0, 7.0] range, was: 40 cm/([7.0, 5.0])1/2 = [15.1, 17.9] cm. From Figure 16c,d) it can be noticed that the range resolution is worse than when using the Vivaldi antennas, as the LPA bandwidth is 800 MHz. This means that these antennas are not suitable for detecting shallow targets, as the air–ground reflection can mask the reflection of the buried target. However, since they work at lower frequencies, they are useful for detecting targets buried in wet soils, since the attenuation becomes too high at higher frequencies.
Next, the metallic box was buried at a depth of 25 cm, aiming to assess if it can be detected using the LPA. Results are plotted in Figure 17a–c, where the echo appears at an apparent depth of 60 cm. With respect to the previous test, where the metallic box was buried at a depth of 17 cm, the amplitude of the reflectivity decreases from −10 dB to −13 dB. As a reference, when using the Vivaldi antennas for this case, the amplitude of the reflectivity was found to be around −18 dB. Besides, as the metallic box was buried deeper, the distance between the air-ground interface and the buried target is greater resulting in better identification of the target even though the range resolution provided by the LPA is worse than the one achieved with the Vivaldi antennas due to the narrower bandwidth.
Finally, to illustrate how phase center compensation improves SAR images, Figure 17d–f shows the same cuts of Figure 17a–c without LPA phase center compensation. It can be noticed that the buried target cannot be identified, due to the high level of clutter present in the image.

4. Discussion

Results presented in Section 3 prove the need for a proper choice of the antennas in the field of buried target-detection using GPR systems. In case of shallow landmines or IEDs, range resolution is demanded to clearly distinguish between the reflections from the targets and the reflection from the air-ground interface. In case of targets buried deeper, penetration capabilities must be prioritized at the expense of losing range resolution. Furthermore, the frequency response of the antennas must be taken into account, in order to be able to compensate, if needed, the dispersion introduced along the working frequency band.
A summary of the results presented in Section 3 is shown in Table 1. It can be noticed, for example, that the reflectivity of the metallic box decreases 3 dB within a depth of 8 cm, i.e., 37.5 dB/m approximately. This value is in agreement with the values provided in Figure 5 of [29], where the attenuation for a silt loam soil with 30–40% moisture is around 40–50 dB/m at the frequency of 900 MHz.
Another effect that can be observed in the reflectivity results corresponding to the loamy soil tests is that the maximum of the air-soil reflectivity happens on a position located above the buried target. The area corresponding to the surface of the hole dug to bury the targets (mortar grenade, plastic landmine, metallic box) has no grass, whereas the surrounding, unaltered scenario, has. The grass randomly scatters the incident field, so the reflectivity at the air–soil interface can be expected to be stronger if the interface has no grass. In the case of the sandy soil (Figure 12), the reflectivity at the air-sand interface is more homogeneous in the entire area-under-test.
With respect to the time required to perform the measurements with the proposed portable scanner, it must be taken into account that the survey of 1 m × 1 m with the setup took around ten minutes because the box where the radar was placed was manually moved. However, UAV flights can be performed at considerably higher speeds, while ensuring a proper sampling of the inspected area. In this regard, it should be noted that the positioning system included in the payload has an update rate of up to 100 Hz.

5. Conclusions

This contribution presented a portable measurement setup, conceived to enable extensive GPR measurements and devoted to testing the hardware that composes the payload of a UAV-based GPR system, as well as validating new algorithms to improve the quality of the resulting radar images. The implemented setup allows taking into account some of the uncertainties and factors that will be present in the airborne system, providing a validation and testing scenario closer to the one to be faced with a UAV.
Three validation examples have been presented: in the first two, the same payload configuration as the one described in [14] has been considered, aiming to assess the feasibility of the measurement setup to conduct experiments in different scenarios (loamy and sandy soils). The third example focuses on testing log-periodic antennas that can operate at lower frequencies than Vivaldi antennas, but at the expense of a larger phase center displacement. To overcome this issue, a phase center compensation technique that takes advantage of the measurements that can be carried out with the setup has been implemented and validated.

Author Contributions

Conceptualization, Y.Á.L., M.G.-F. and F.L.-H.A.; methodology, M.G.-F., D.C.M. and Y.Á.L.; software, M.G.-F., D.C.M., G.Á.-N. and Y.Á.L.; validation, A.D.M., D.C.M., G.Á.-N., M.G.-F. and Y.Á.L.; resources, Y.Á.L., F.L.-H.A. and M.G.-F.; data curation, M.G.-F. and Y.Á.L.; writing—original draft preparation, Y.Á.L., A.D.M. and D.C.M.; writing—review and editing, M.G.-F., G.Á.-N. and F.L.-H.A.; supervision, F.L.-H.A. and Y.Á.L.; project administration, F.L.-H.A. and Y.Á.L.; funding acquisition, F.L.H and Y.Á.L. All authors have read and agreed to the published version of the manuscript.

Funding

This research was funded by the Ministerio de Educación—Gobierno de España under Grant FPU15/06341 and FPU15/06431; by the Ministerio de Defensa—Gobierno de España and the University of Oviedo under Contract 2019/SP03390102/00000204/CN-19-002 (“SAFEDRONE”); by the Xunta de Galicia – Axencia Galega de Innovación (GAIN) under project 2018-IN855A 2018/10 (“RadioUAV: drones para aplicaciones más allá de lo visible”); by the Government of the Principality of Asturias (PCTI) and European Union (FEDER) under Grant IDI/2018/000191; and by the Instituto Universitario de Tecnología Industrial de Asturias (IUTA) under Project SV-19-GIJON-1-17 (“RadioUAV”).

Acknowledgments

The authors would like to acknowledge the CIED-COE (Col. José Luis Mingote Abad) for the lease of the mortar grenade used in the tests, and Cap. Santiago García Ramos for the supervision.

Conflicts of Interest

The authors declare no conflict of interest.

References

  1. Jol, H.M. Ground Penetrating Radar Theory and Applications; Elsevier Science: Amsterdam, The Netherlands, 2009. [Google Scholar]
  2. Santos-Assunçao, S.; Perez-Gracia, V.; Caselles, O.; Clapes, J.; Salinas, V. Assessment of Complex Masonry Structures with GPR Compared to Other Non-Destructive Testing Studies. Remote Sens. 2014, 6, 8220–8237. [Google Scholar] [CrossRef] [Green Version]
  3. Morris, I.; Abdel-Jaber, H.; Glisic, B. Quantitative Attribute Analyses with Ground Penetrating Radar for Infrastructure Assessments and Structural Health Monitoring. Sensors 2019, 19, 1637. [Google Scholar] [CrossRef] [Green Version]
  4. Conyers, L.B. Ground-Penetrating Radar Mapping Using Multiple Processing and Interpretation Methods. Remote Sens. 2016, 8, 562. [Google Scholar] [CrossRef] [Green Version]
  5. Ribolini, A.; Bini, M.; Isola, I.; Coschino, F.; Baroni, C.; Salvatore, M.C.; Zanchetta, G.; Fornaciari, A. GPR versus Geoarchaeological Findings in a Complex Archaeological Site (Badia, Pozzeveri, Italy). Archaeol. Prospection. 2016, 24. [Google Scholar] [CrossRef]
  6. Lippl, S.; Blindow, N.; Fürst, J.J.; Marinsek, S.; Seehaus, T.C.; Braun, M.H. Uncertainty Assessment of Ice Discharge Using GPR-Derived Ice Thickness from Gourdon Glacier, Antarctic Peninsula. Geosciences 2020, 10, 12. [Google Scholar] [CrossRef] [Green Version]
  7. Hislop, G. Limitations of characterizing layered earth with off-ground GPR. J. Geophys. Eng. 2016, 13, S1–S8. [Google Scholar] [CrossRef]
  8. De Chiara, F.; Fontul, S.; Fortunato, E. GPR Laboratory Tests for Railways Materials Dielectric Properties Assessment. Remote Sens. 2014, 6, 9712–9728. [Google Scholar] [CrossRef] [Green Version]
  9. Kwang, H.K.; Gyubin, J.; Kyungmi, P.; Kangwook, K. GPR-Based Landmine Detection and Identification Using Multiple Features. Int. J. Antennas Propag. 2012, 8226404, 7. [Google Scholar]
  10. Lombardi, F.; Lualdi, M.; Picetti, F.; Bestagini, P.; Janszen, G.; Di Landro, L.A. Ballistic Ground Penetrating Radar Equipment for Blast-Exposed Security Applications. Remote Sens. 2020, 12, 717. [Google Scholar] [CrossRef] [Green Version]
  11. Núñez-Nieto, X.; Solla, M.; Gómez-Pérez, P.; Lorenzo, H. GPR Signal Characterization for Automated Landmine and UXO Detection Based on Machine Learning Techniquse. Remote Sens. 2014, 6, 9729–9748. [Google Scholar] [CrossRef] [Green Version]
  12. Daniels, D.J. A review of GPR for landmine detection. Sens. Imaging Int. J. 2006, 7, 90–123. [Google Scholar] [CrossRef]
  13. Przemyslaw, K.; Godziuk, A.; Kapruziak, M.; Olech, B. Fast Analysis of C-Scans From Ground Penetrating Radar via 3-D Haar-Like Features With Application to Landimne Detection. IEEE Trans. Geosci. Remote Sens. 2015, 53, 3996–4009. [Google Scholar]
  14. Garcia-Fernandez, M.; Alvarez-Lopez, Y.; Las Heras, F. Autonomous Airborne 3D SAR Imaging System for Subsurface Sensing: UWB-GPR on Board a UAV for Landmine and IED Detection. Remote Sens. 2019, 11, 2357. [Google Scholar] [CrossRef] [Green Version]
  15. Šipoš, D.; Gleich, D. A Lightweight and Low-Power UAV-Borne Ground Penetrating Radar Design for Landmine Detection. Sensors 2020, 20, 2234. [Google Scholar] [CrossRef] [PubMed] [Green Version]
  16. Colorado, J.; Perez, M.; Mondragon, I.; Mendez, D.; Parra, C.; Devia, C.; Martinez-Moritz, J.; Neira, L. An integrated aerial system for landmine detection: SDR-based Ground Penetrating Radar onboard an autonomous drone. Adv. Robot. 2017, 31, 791–808. [Google Scholar] [CrossRef]
  17. Schreiber, E.; Heinzel, A.; Peichl, M.; Engel, M.; Wiesbeck, W. Advanced Buried Object Detection by Multichannel, UAV/Drone Carried Synthetic Aperture Radar. In Proceedings of the 2019 13th European Conference on Antennas and Propagation (EuCAP), Krakow, Poland, 31 March–5 April 2019; pp. 1–5. [Google Scholar]
  18. Schartel, M.; Burr, R.; Mayer, W.; Docci, N.; Waldschmidt, C. UAV-Based Ground Penetrating Synthetic Aperture Radar. In Proceedings of the 2018 IEEE MTT-S International Conference on Microwaves for Intelligent Mobility (ICMIM), Munich, Germany, 15–17 April 2018; pp. 1–4. [Google Scholar]
  19. Diamanti, N.; Annan, P. Air-launched and ground-coupled GPR data. In Proceedings of the 2017 11th European Conference on Antennas and Propagation (EUCAP), Paris, France, 19–24 March 2017. [Google Scholar]
  20. Comite, D.; Galli, A.; Catapano, I.; Soldovieri, F. Advanced imaging for down-looking contactless GPR systems. In Proceedings of the International Applied Computational Electromagnetics Society Symposium—Italy (ACES), Florence, Italy, 26–30 March 2017. [Google Scholar]
  21. Gonzalez-Diaz, M.; Garcia-Fernandez, M.; Alvarez-Lopez, Y.; Las Heras, F. Improvement of GPR SAR-based techniques for accurate detection and imaging of buried objects. IEEE Trans. Instrum. Meas. 2019. [Google Scholar] [CrossRef] [Green Version]
  22. Ardekani, S.; Lambot, S. Full-wave calibration of time- and frequency-domain Ground-Penetrating Radar in far-field conditions. IEEE Trans. Geosci. Remote Sens. 2013, 52, 664–668. [Google Scholar] [CrossRef]
  23. Zhang, Y.; Orfeo, D.; Burns, D.; Miller, J.; Huston, D.; Tian, X. Buried nonmetallic object detection using bistatic ground penetrating radar with variable antenna elevation angle and height. In Proceedings of the Nondestructive Characterization and Monitoring of Advanced Materials, Aerospace, and Civil Infrastructure, Portland, OR, USA, 26–29 March 2017; p. 10169. [Google Scholar] [CrossRef]
  24. Topcon B111 Receiver. Available online: https://www.topconpositioning.com/oem-components-technology/gnss-components/b111 (accessed on 9 May 2020).
  25. Johansson, E.M.; Mast, J.E. Three-dimensional ground-penetrating radar imaging using synthetic aperture time-domain focusing. In Proceedings of the International Symposium on Optics, Imaging, and Instrumentation, International Society for Optics and Photonics, San Diego, CA, USA, 14 September 1994. [Google Scholar]
  26. TSA-600 Ultra-Wideband PCB Tapered Slot Antenna. Available online: http://rfspace.com/RFSPACE/Antennas_files/TSA600.pdf (accessed on 9 May 2020).
  27. LPDAMAX Wideband PCB Log Periodic Antenna. Available online: http://rfspace.com/RFSPACE/Antennas_files/LPDA-MAX.pdf (accessed on 10 May 2020).
  28. Crocker, D.A.; Scott, W.R., Jr. Compensation of Dispersion in Sinuous Antennas for Polarimetric Ground Penetrating Radar Applications. Remote Sens. 2019, 11, 1937. [Google Scholar] [CrossRef] [Green Version]
  29. Miller, T.; Borchers, B.; Hendrickx, J.M.H.; Hong, S.-H.; Lensen, H.A.; Schwering, P.B.W.; Rhebergen, J. Effect of soil moisture on landmine detection using Ground Penetrating Radar. In Proceedings of the SPIE, Voulme 4742, Detection and Remediation Technologies for Mines and Minelike Targets VII. Event: AeroSense 2002, Orlando, FL, USA, 1–5 April 2002. [Google Scholar] [CrossRef]
Figure 1. Picture of the portable setup for air-launched Ground Penetrating Radar (GPR) imaging.
Remotesensing 12 01833 g001
Figure 2. Picture of the payload.
Remotesensing 12 01833 g002
Figure 3. Scheme of the subsystems and devices of the air-launched GPR.
Remotesensing 12 01833 g003
Figure 4. Flowchart of the GPR system processing algorithm.
Remotesensing 12 01833 g004
Figure 5. Example of measured Real Time Kinematics (RTK) positions for a single 2D acquisition grid with the portable setup. XY plane before (blue) and after (red) coordinate system transformation (a). Height above ground for each measurement position (b).
Remotesensing 12 01833 g005
Figure 6. Example of measured values of roll (a), pitch (b), and yaw (c) angles provided by the IMU on-board the controller for a single 2D acquisition grid with the portable setup. The solid black line represents the average value.
Remotesensing 12 01833 g006
Figure 7. Picture of the mortar grenade (a). Reflectivity normalized amplitude, in dB: cut z = −36 cm (b), cut y = 40 cm (c), cut x = −2 cm (d).
Remotesensing 12 01833 g007
Figure 8. Representation of the selected measurement positions (red dots) superimposed to the reflectivity image in the XY plane for the mortar grenade.
Remotesensing 12 01833 g008
Figure 9. Picture of the mortar grenade (a). Reflectivity normalized amplitude, in dB, after equalizing the frequency response of the GPR system: cut z = -36 cm (b), cut y = 40 cm (c), cut x = -2 cm (d).
Remotesensing 12 01833 g009
Figure 10. Picture of the scenario under test. Dashed red line indicates the placement of the filled hole with no objects in it (a). Reflectivity normalized amplitude, in dB: cut z = −36 cm (b), cut y = 40 cm (c), cut x = −2 cm (d).
Remotesensing 12 01833 g010
Figure 11. Picture of the anti-personnel plastic landmine (a). Reflectivity normalized amplitude, in dB: cut z = −36 cm (b), cut y = 42 cm (c), cut x = −4 cm (d).
Remotesensing 12 01833 g011
Figure 12. Measurements in sandy soil. Picture of the portable measurement setup in the selected scenario (a). Picture of the 18 cm diameter metallic disk, buried 18–20 cm deep (b). Picture of the 18 cm diameter plastic disk, buried 16–18 cm deep (c). Synthetic Aperture Radar (SAR) images, normalized reflectivity: cut z = -28 cm (d), cut y = 22 cm (e), and cut x = 18 cm (f).
Remotesensing 12 01833 g012
Figure 13. Picture of the portable air-launched GPR measurement with the Log-Periodic Antennas (LPA) antennas.
Remotesensing 12 01833 g013
Figure 14. Measurement setup of the Vivaldi antenna (a) and the LPA (b) at a spherical range in the anechoic chamber using a UWB probe antenna. Position of the phase center for the Vivaldi antenna (c) and the LPA (d). The amplitude of the measured field for the Vivaldi antenna (e) and the LPA (f). The blue line corresponds to the E-plane and the red line corresponds to the H-plane.
Remotesensing 12 01833 g014
Figure 15. Phase center compensation for the LPA. Picture of the measurement setup with the metallic reference objects (a). Reflectivity along z-axis (range) for a position located on top of a flat metallic object (b). Sub-bands of 250 MHz (∆R = 60 cm) are considered.
Remotesensing 12 01833 g015
Figure 16. Picture of the metallic box buried at 17 cm depth (a). Reflectivity normalized amplitude, in dB, calculated after applying the LPA phase center compensation. Cut z = −140 cm (b), cut x = 40 cm (c), cut y = −42 cm (d). The z = 0 position is defined at the plane where the LPA antennas are attached to the payload.
Remotesensing 12 01833 g016
Figure 17. Reflectivity normalized amplitude, in dB. Metal box buried at 25 cm depth. Applying LPA phase center compensation: cut z = −160 cm (a), cut x = 40 cm (b), cut y = -42 cm (c). Without applying LPA phase center compensation: cut z = −160 cm (d), cut x = 40 cm (e), cut y = −42 cm (f). The z = 0 position is defined at the plane where the LPA antennas are attached to the payload.
Remotesensing 12 01833 g017
Table 1. Summary of the results presented in Section 3. Reflectivity is indicated with respect to the reflectivity of the air–soil interface (0 dB). Measurements presented in Section 3.1 were conducted on 28 February 2020, measurements of Section 3.2 were collected on 15 May 2019, and those of Section 3.3, on 13 February 2020.
SectionTarget
(size, cm)
Depth (cm)SoilGPR Antennas
(Working BW)
Reflectivity
3.1Mortar grenade
(30 × 8)
15Loamy (εr ∈ [5.0, 7.0], moisture ∈ [30, 50]%)Vivaldi
600–3000 MHz
−10 dB
3.1.Hole filled with loamy soil, no target in it20Loamy (εr ∈ [5.0, 7.0], moisture ∈ [30, 50]%)Vivaldi
600–3000 MHz
−20 dB
3.1Plastic landmine
(Ø 16)
15Loamy (εr ∈ [5.0, 7.0], moisture ∈ [30, 50]%)Vivaldi
600–3000 MHz
−13 dB
3.2Metallic disk
(Ø 18)
18–20Sandy (εr ∈ [2.0, 3.0], moisture < 30%)Vivaldi
600–3000 MHz
+2 dB
3.2Plastic disk
(Ø 18)
16–18Sandy (εr ∈ [2.0, 3.0], moisture < 30%)Vivaldi
600–3000 MHz
−7 dB
3.3Metallic box
(Ø 20)
17Loamy (εr ∈ [5.0, 7.0], moisture ∈ [30, 50]%)LPA
400–1200 MHz
−10 dB
3.3Metallic box
(Ø 20)
25Loamy (εr ∈ [5.0, 7.0], moisture ∈ [30, 50]%)LPA
400–1200 MHz
−13 dB

