Article

Maximizing Temporal Correlations in Long-Term Global Satellite Soil Moisture Data-Merging

1
Collaborative Innovation Center on Forecast and Evaluation of Meteorological Disasters, School of Geographical Sciences, Nanjing University of Information Science & Technology, Nanjing 210044, China
2
School of Civil and Environmental Engineering, University of New South Wales, Sydney, NSW 2052, Australia
3
National Climate Center, China Meteorological Administration, Beijing 100081, China
*
Author to whom correspondence should be addressed.
Remote Sens. 2020, 12(13), 2164; https://0-doi-org.brum.beds.ac.uk/10.3390/rs12132164
Submission received: 31 May 2020 / Revised: 3 July 2020 / Accepted: 4 July 2020 / Published: 7 July 2020

Abstract

:
In this study, an existing combination approach that maximizes temporal correlations is used to combine six passive microwave satellite soil moisture products from 1998 to 2015 to assess its added value in long-term applications. Five of the products used are included in existing merging schemes such as the European Space Agency’s essential climate variable soil moisture (ECV) program. These include the Special Sensor Microwave Imagers (SSM/I), the Tropical Rainfall Measuring Mission (TRMM/TMI), the Advanced Microwave Scanning Radiometer-Earth Observing System (AMSR-E) sensor on the National Aeronautics and Space Administration’s (NASA) Aqua satellite, the WindSAT radiometer, onboard the Coriolis satellite and the soil moisture retrievals from the Advanced Microwave Scanning Radiometer 2 (AMSR2) sensor onboard the Global Change Observation Mission on Water (GCOM-W). The sixth, the microwave radiometer imager (MWRI) onboard China’s Fengyun-3B (FY3B) satellite, is absent in the ECV scheme. Here, the normalized soil moisture products are merged based on their availability within the study period. Evaluation of the merged product demonstrated that the correlations and unbiased root mean square differences were improved over the whole period. Compared to ECV, the merged product from this scheme performed better over dense and sparsely vegetated regions. Additionally, the trends in the parent inputs are preserved in the merged data. Further analysis of FY3B’s contribution to the merging scheme showed that it is as dependable as the widely used AMSR2, as it contributed significantly to the improvements in the merged product.

Graphical Abstract

1. Introduction

Surface soil moisture is a vital variable within the climate system to regulate terrestrial water and energy cycles. Within land–atmosphere interactions, soil moisture anomalies have been identified by many studies to play a key role by its control of the surface fluxes [1]. Additionally, existing studies have demonstrated the impact of soil moisture anomalies on extreme events such as heatwaves [2], floods [3] and droughts [4], as well as its importance in operational services and climate monitoring [5,6] at both regional and global scales. While they demonstrate the significant role of soil moisture, most of these studies rely on model simulations for which large uncertainties remain unexplored, thus, observations are necessary to understand the impact of soil moisture better.
The traditional method of observing soil moisture measurements has been through ground stations that produce point scale measurements. Even though this approach produces accurate observations, it is generally limited by its point–scale representation and may be more useful to small spatial scale applications. Furthermore, it is very expensive to set up networks of these in situ observations to monitor soil moisture over regional to global scales. Nonetheless, they are very useful when validating alternate sources such as satellite and model-based products even though the differences in spatial resolutions may pose a challenge because of the high spatial variability of the variable [7].
Recent advances in satellite remote sensing technologies have provided an avenue to monitor soil moisture over regional and global scales more consistently, filling the gap within the observational database [8]. Different imagers onboard satellites measure radiation and reflected backscatter from the earth’s surface that can be linked to surface soil moisture conditions. This is possible because of the significant contrast between the dielectric properties of dry soil and water, making the microwave radiance reflected or emitted by the surface soil volume largely linearly dependent on the soil–water mixing ratio [9]. In recent years, several soil moisture datasets have been developed from both scatterometer and radiometer observations, which have made their way into many application fields and scientific research [10,11]. While these satellite products are consistent over space and time, they are also limited by their operational lifespans, which makes it necessary to launch new satellites to replace old ones that have become non-operational. With the growing number of available passive microwave observations, the need to develop long-term products has become a focus. In the last decade, projects like the European Space Agency’s (ESA) Climate Change Initiative (CCI) have been extended to soil moisture with the goal of combining different soil moisture datasets into a consistent multidecadal framework (essential climate variable (ECV) [10,12]). In this particular scheme, both passive and active microwave soil moisture products were merged separately using an improved uncertainty characterization method to parameterize a statistically rigorous least-squares merging algorithm. Additionally, a combined product of the combined active and passive microwave soil moisture is provided in the scheme. Several small scale and large scale evaluations have demonstrated the good skill of the ECV soil moisture [13,14,15,16]. Furthermore, research and application endeavors with the ECV product have contributed to our understanding of soil moisture variability and its role within the climate system [17,18,19].
Apart from the ECV soil moisture scheme, other studies have shown the importance of combining different soil moisture sources into unified datasets to assess the added value of merging multiple-source records. For example, Zeng et al. [20] developed an improved soil moisture product over the Tibetan plateau by blending a model simulated soil moisture product constrained with in situ measurements, and a satellite product that was scaled to the rescaled model product. In another recent study, Kim et al. [21] developed a linear combination approach that merges two microwave satellite soil moisture products by maximizing the temporal correlation with a chosen reference. This improved performance comes from their complementary behavior under different physical and climatological retrieval conditions [22]. The approach was successfully applied to two different global soil moisture retrievals from the advanced microwave scanning radiometer 2 (AMSR2) to produce a superior combined product which had a significant improvement in temporal correlation coefficients. In a follow-up study, Kim et al. [23] modified this approach to perform the data-merging based on a non-stationary combination model. That is, while the former depended on temporally fixed weights, the latter depended on time-varying weights within the combination scheme. Consequently, while the dynamic approach obtained better results in the study mentioned above, it is heavily dependent on the selection of a time-window-length, which would entail some kind of tuning and, eventually, force the combined product to mimic the reference data. Given that this linear combination approach is different from the ECV scheme, it is worthwhile to further explore its potential in long-term soil moisture data-merging, which may add to the learning curve for existing schemes like the ECV.
In this study, we apply the linear approach presented in Kim et al. [21] to six global passive microwave satellite soil moisture retrievals from 1998 to 2015 to understand the merits of a correlation-dependent combination approach on long-term soil moisture data-merging relative to other long-term sources such as in situ observations and the ECV passive microwave product which is developed by minimizing errors. The contributions of the various satellite inputs to the merged product across different regions over the globe are also presented. The extent to which long-term changes are impacted in the merged product relative to the parent inputs is also explored by comparing the long-term changes in the merged with the changes in two of the input products. Furthermore, the study explores the added value of a new soil moisture product in this correlation-based combination scheme. Five of these satellite soil moisture products are already present in the input dataset of the ECV scheme. The sixth product, which is based on satellite retrievals obtained from the microwave imager onboard the Chinese FengYun-3B, is currently absent in the ECV record. Here, the focus is to assess how the soil moisture retrievals from the FengYun-3B observations contribute to the improvement of the merged data’s quality relative to a well-known product, AMSR2. In the rest of this study, the words merge and combine will be used interchangeably to imply the same idea. The study is structured as follows: Section 2 briefly presents a description of the datasets used in the study. In Section 3, the methodologies and the design of the merging scheme are introduced. The results of the validation of the merged data with in situ observations and the ECV passive microwave soil moisture data over different vegetation densities are presented in Section 4. Section 4 also presents trends preservation results as well as a detailed look at the contribution of the FengYun-3B soil moisture. Section 5 discusses the findings and Section 6, the conclusions of the study.

2. Data and Data Processing

2.1. Data

2.1.1. Passive Microwave Soil Moisture

The passive microwave soil moisture retrievals used in the merging scheme (see Table 1) include those from the special sensor microwave imagers (SSM/I) of the Defense Meteorological Satellite Program (DMSP) [24], the quasi-global tropical rainfall measuring mission (TRMM/TMI) which is the longest passive microwave data record from a single satellite mission, as well as the WindSAT (hereafter WindSat) radiometer, onboard the Coriolis satellite. Furthermore, included are the widely used retrievals from the Advanced Microwave Scanning Radiometer-Earth Observing System (AMSR-E) sensor on NASA’s (the National Aeronautics and Space Administration) Aqua satellite, as well as the Advanced Microwave Scanning Radiometer 2 (AMSR2) sensor onboard the Global Change Observation Mission on Water (GCOM-W). Soil moisture retrievals from the microwave radiometer imager (MWRI) onboard China’s Fengyun 3B (FY3B) satellite are also included in this merging scheme. The descending paths (nighttime observations from TRMM/TMI) are used here for all the products. Passive microwave radiometers can observe naturally emitted radiation in the microwave frequency range (1–100 GHz) both day and at night. Studies have demonstrated that both ascending and descending passive microwave observations have their strengths and limitations [25]. At night, canopy, near-surface air, and surface soil conditions have increased thermal equilibrium. Therefore, more reliable estimates of emitting layer temperatures are expected to be obtained from the descending paths [9,13,26]. All the products used here are provided at a spatial resolution of 0.25°. Table 1 presents a summary of the satellite products used in the merging scheme.
The European Space Agency’s CCI ECV passive microwave soil moisture is also used in this study. This product is a merged product of various existing passive microwave observations that have been routinely combined into one product. Over the years, this product has evolved and been consistently improved based on new inputs as well as the improvement of the merging algorithm used [10,12]. It comes at daily averages at a 0.25° spatial resolution. Here, the most recently developed ECV observations between 1998 and 2015 are used. The ECV merging scheme is based on minimizing errors while the scheme used in this study is based on maximizing correlations. Besides the differences in their merging schemes, another significant difference between the merged product developed from this study and ECV is the use of the FY3B soil moisture retrievals here. More details of the ECV and its development can be found in Gruber et al. [12].

2.1.2. Global Atmospheric Reanalysis Soil Moisture Product

By design, the merging approach used in this study requires a reference input. Ideally, ground measurements would be the best reference datasets to use. However, due to their spatial limitations, as well as the challenge of their availability, reanalysis products, which are based on assimilation of observations into climate models, have become a suitable alternative. In this study, the ERA5 soil moisture product is chosen as the reference for the combination approach based on a previous evaluation study of seven existing model-based soil moisture products with both in situ observations and the ECV products [26]. Their results demonstrated the superior performance of ERA5, indicating its reliability where observations may be absent. It is therefore expected here that the high quality of this chosen reference will provide a good roadmap on which a good quality merged product could be obtained. The ERA5 datasets are global atmospheric reanalysis datasets provided by the European Center for Medium-Range Weather Forecasts (ECMWF). The ERA5 project, which is the latest reanalysis project of the ECMWF was recently made public. Global and regional evaluations have shown ERA5’s capability to be an important additional source of information [13,26,31,32]. In this study, the aggregated 0.25° spatial resolution of the first level of this product at 06:00 each day are used within the period of 1998 to 2015. More details of this product can be found on https://apps.ecmwf.int/datasets/.

2.1.3. In Situ Soil Moisture Measurements

Ground measurements are considered as ground truth, and while they are limited by space and time, especially for large scale uses, they are very useful to validate independently alternate sources of soil moisture from both satellite observations and other climate model simulations. To better understand the skill of the merged dataset from this study, in situ measurements (depth < 10 cm) from the International Soil Moisture Network (ISMN) [33] are used to validate it. Here, the quality of the ISMN data are ensured by filtering out datasets that may not be dependable. First, quality controls suggested by Dorigo et al. [33] were applied. Next, very dense vegetation densities areas (NDVI > 0.85) determined on a multiyear mean of the normalized difference vegetation index were used to remove stations that were over highly vegetated areas. Only in situ stations that have more than 100 paired observations with the satellite products were included to ensure statistical robustness. Where multiple stations are found within a matched pixel of the satellite product, they are averaged. Even though we applied such strict filtering processes, it should be noted that there is still likely to be systematic differences among the datasets. The number of stations used per network as well the average length period used per network are summarized in Figure 1 below.

2.1.4. Normalized Difference Vegetation Index (NDVI)

Soil moisture is solved within the LPRM as a function of vegetation, which would suggest that the quality of the satellite soil moisture product would have a dependency on vegetation density. Previous studies have shown that the quality of satellite and model-based soil moisture anomalies varies as a function of vegetation density [26,34,35]. Here, an independent data source, the normalized difference vegetation index (NDVI), is used for a spatial evaluation to quantify the skill of the products over various vegetation densities. The NDVI data were obtained from the advanced very high resolution radiometer (AVHRR) sensor’s surface reflectance data, which comes at an initial spatial resolution of 0.05°. It is used as a vegetation indicator linked to greenness (0–1). In this study, the multiyear mean of monthly NDVI were resampled into 0.25° grid binned over the range, 0.1 < NDVI < 0.8 to assess the quality of datasets over different vegetation densities. This NDVI data can be obtained from https://climatedataguide.ucar.edu/climate-data/ndvi-normalized-difference-vegetation-index-noaa-avhrr.

2.2. Data Processing

To ensure a good quality of all of the remote sensing datasets used in this study, several preprocessing steps were applied. A common set of procedures was used to mask out unreliable soil moisture retrievals from the analyses [36]. These included the following conditions: (1) pixels with large open water fraction (where soil moisture values have reached saturation), such as oceans or lakes; (2) densely vegetated regions (annual mean of LPRM VOD at 6.9 GHz ≥ 0.8 and NDVI > 0.8) and (3) frozen conditions (that is, where soil temperature ≤ 273.15 K) [27].

3. Methodology

The entire combination process begins with first normalizing the two parent products (inputs) to the reference data (Equation (4)). This step is used to minimize systematic differences between the parent products. Next, spatially variable optimal weights are computed to account for the contributions of each parent product. Here, thresholds for the length of available observations are set to obtain only statistically robust optimal weights [23]. In a final step, the parent products are merged.

3.1. The Combination Scheme

The combination approach used here was first introduced by Bates and Granger [37], where it was used to develop a merged product with minimized mean square errors from the parent products. Since then, this linear combination has been widely applied in several other disciplines and improved the performance of data skills [38,39]. Recently, Kim et al. [23] presented two forms of the combination approach: A static form that combines two datasets based on computed temporally static weights and another which uses temporally dynamic weights that mimics the reference dataset more closely. In this study, the static approach is chosen since it gives more room for the merged product to mimic the strengths of the parent products more than the reference, thus preserving their intrinsic characteristics. A detailed description of the method can be found in Kim et al. [21] and a summary of the combination technique is as follows:
For two sets of unbiased soil moisture retrievals, θ 1 and θ 2 , set in a specified time-window, they are linearly combined into a combined product, θ c , at each time point by applying a single weight w (0 to 1) as in the Equation (1) below:
θ c = w θ 1 + ( 1 w ) θ 2 ,
where the optimal weight (w) of the normalized parent products is computed as
w = σ 2 ( R 1 . r e f R 1.2 R 2 . r e f ) σ 1 ( R 2 . r e f R 1.2 R 1 . r e f ) + σ 2 ( R 1 . r e f R 1.2 R 2 . r e f )
R represents the temporal correlation coefficient either between either the parent products (1 and 2) or a parent product and the reference data (ref). σ represents the standard deviation of the parent products. This implies that the optimal weight is a function of the correlations between the parents and the chosen reference. A minimum number of paired observations is necessary for a statistically significant correlation to be computed since a lack of paired observations may generate unreliable parameters. Kim et al. [21] demonstrated that the temporal correlation (R) could be expressed as a function of the optimal weight, which can be understood as an optimization problem. This is given in the relation:
R = f ( w ) = E [ ( θ c μ c ) ( θ r e f μ r e f ) ] σ c σ r e f ,
where the mean values of the merged product and the reference are given represented by μ c and μ r e f and the standard deviations, σ c and σ r e f . Thus, a more reliable estimation will depend significantly on robustly estimated mean and standard deviation, as seen from Equation (3). It is generally known that satellite-derived soil moisture estimates are systematically different from each other with different dynamic values and means. In this regard, scaling approaches have been commonly used to adjust the dynamic range of soil moisture estimates [40,41,42]. The rescaling of the products in this study is achieved based on a linear normalization shown in Equation (4). Of course, with such a simplified approach, the assumption is that the two parent products have an equal measure of noise, which will propagate into the weight estimation [43]. Following Draper et al. [43] the normalization is defined as
θ n = ( θ p θ p ¯ ) σ r e f σ p + θ r e f ¯
From Equation (4) θ p represents the parent product and σ r e f and σ p represent the standard deviations of the reference and parent product, respectively. However, the normalizing process is essential for reducing systematic differences, the approach in Equation (2) is mostly based on correlation estimations. Since correlations are not impacted by differences in biases that may exist in the datasets, the normalization is not a needed step to obtain the weights. This property of the approach used here highlights its advantage over error based combination approaches. Nonetheless, Equation (4) is applied in this study as it may have its own merits, which are explored in Section 4.1.

3.2. Design of the Merging Scheme

The whole study period is divided into four unequal periods, between two to eight years (See Table 2) since the approach used allows for the combination of two datasets at a time. Additionally, apart from TRMM which has a quasi-global coverage, none of the satellite products extends throughout the entire study period, which justifies the first advantage of the combination approach. In the first time period, the TRMM and SSMI are combined from January 1998 to January 2003, when AMSR-E and WindSat become fully available. Here, even though TRMM and SSMI still have available data, the switch to the different products is done, more especially because TRMM does not cover higher and lower latitudinal regions (quasi-global). AMSR-E and WindSat are maintained in a long period of combination from February 2003 till September 2011 when AMSR-E is no longer operational. At this point, AMSR-E is replaced with the FY3B product. Time period 3 goes from October 2011 until June 2012, after which the WindSat product becomes unavailable, and the AMSR2 product is combined with FY3B in time period 4. To focus on the complementarity from various passive microwave sensors, this study consistently uses soil moisture products retrieved with the land parameter retrieval model (LPRM) [27], which is one of the most commonly used soil moisture retrieval algorithm that links soil moisture to microwave brightness temperature from low frequencies observed by radiometers. Kim et al. [23] suggested using a 60-day window-length because of the 2–3-day revisit time of the satellite sensors. Since the temporal periods in this study are more than the minimum period suggested, statistically significant optimal weights should be obtained. Throughout the four periods, the ERA5 soil moisture product is maintained as the reference for the merging. Table 2 gives a summary of the different periods of combination.

3.3. Analysis of the Merging Preprocessing

To reduce discontinuity and abrupt mean shifts within the combined products, the six satellite products are first, normalized to the amplitude of the reference (Equation (4)), ERA5. The implications of this normalizing are here studied to quantify the change in the amplitude of the satellite products after they are rescaled. Figure 2a shows the results of a selected time series of AMSR-E before rescaling (blue), after rescaling (red) and the reference data’s time series of the same point (black). The results show that rescaling, while it transforms the satellite product into the amplitude of the reference, still preserves its temporal variability. Given that the added value of these satellite products lies with their ability to capture the soil moisture temporal dynamics, the correlations must be preserved at this stage. Also, this would imply that other properties that rely on the unbiased state of the datasets are preserved. Kim et al. [23] noted that the optimal weight tends to converge to 0 or 1 when there is a large difference between the standard deviations of the parent products. Thus, normalizing the time series is necessary to minimize the effects from the largely different standard deviations for maximizing the correlation coefficients. Figure 2b shows the degree to which the rescaling process changes the satellite product over the entire globe for AMSR-E (which is taken as an example) based on the difference between the product before and after normalization. Here, blue color implies that the normalized time series have larger amplitudes, while the red color implies that the original time series have larger amplitudes. The results demonstrate that most of the northern hemisphere in the satellite product is generally wetter than in the reanalysis product, which is a known problem of the LPRM soil moisture retrievals [44,45]. Therefore, this process can serve as a preliminary correction step, especially where the quality of the reference data are superior.

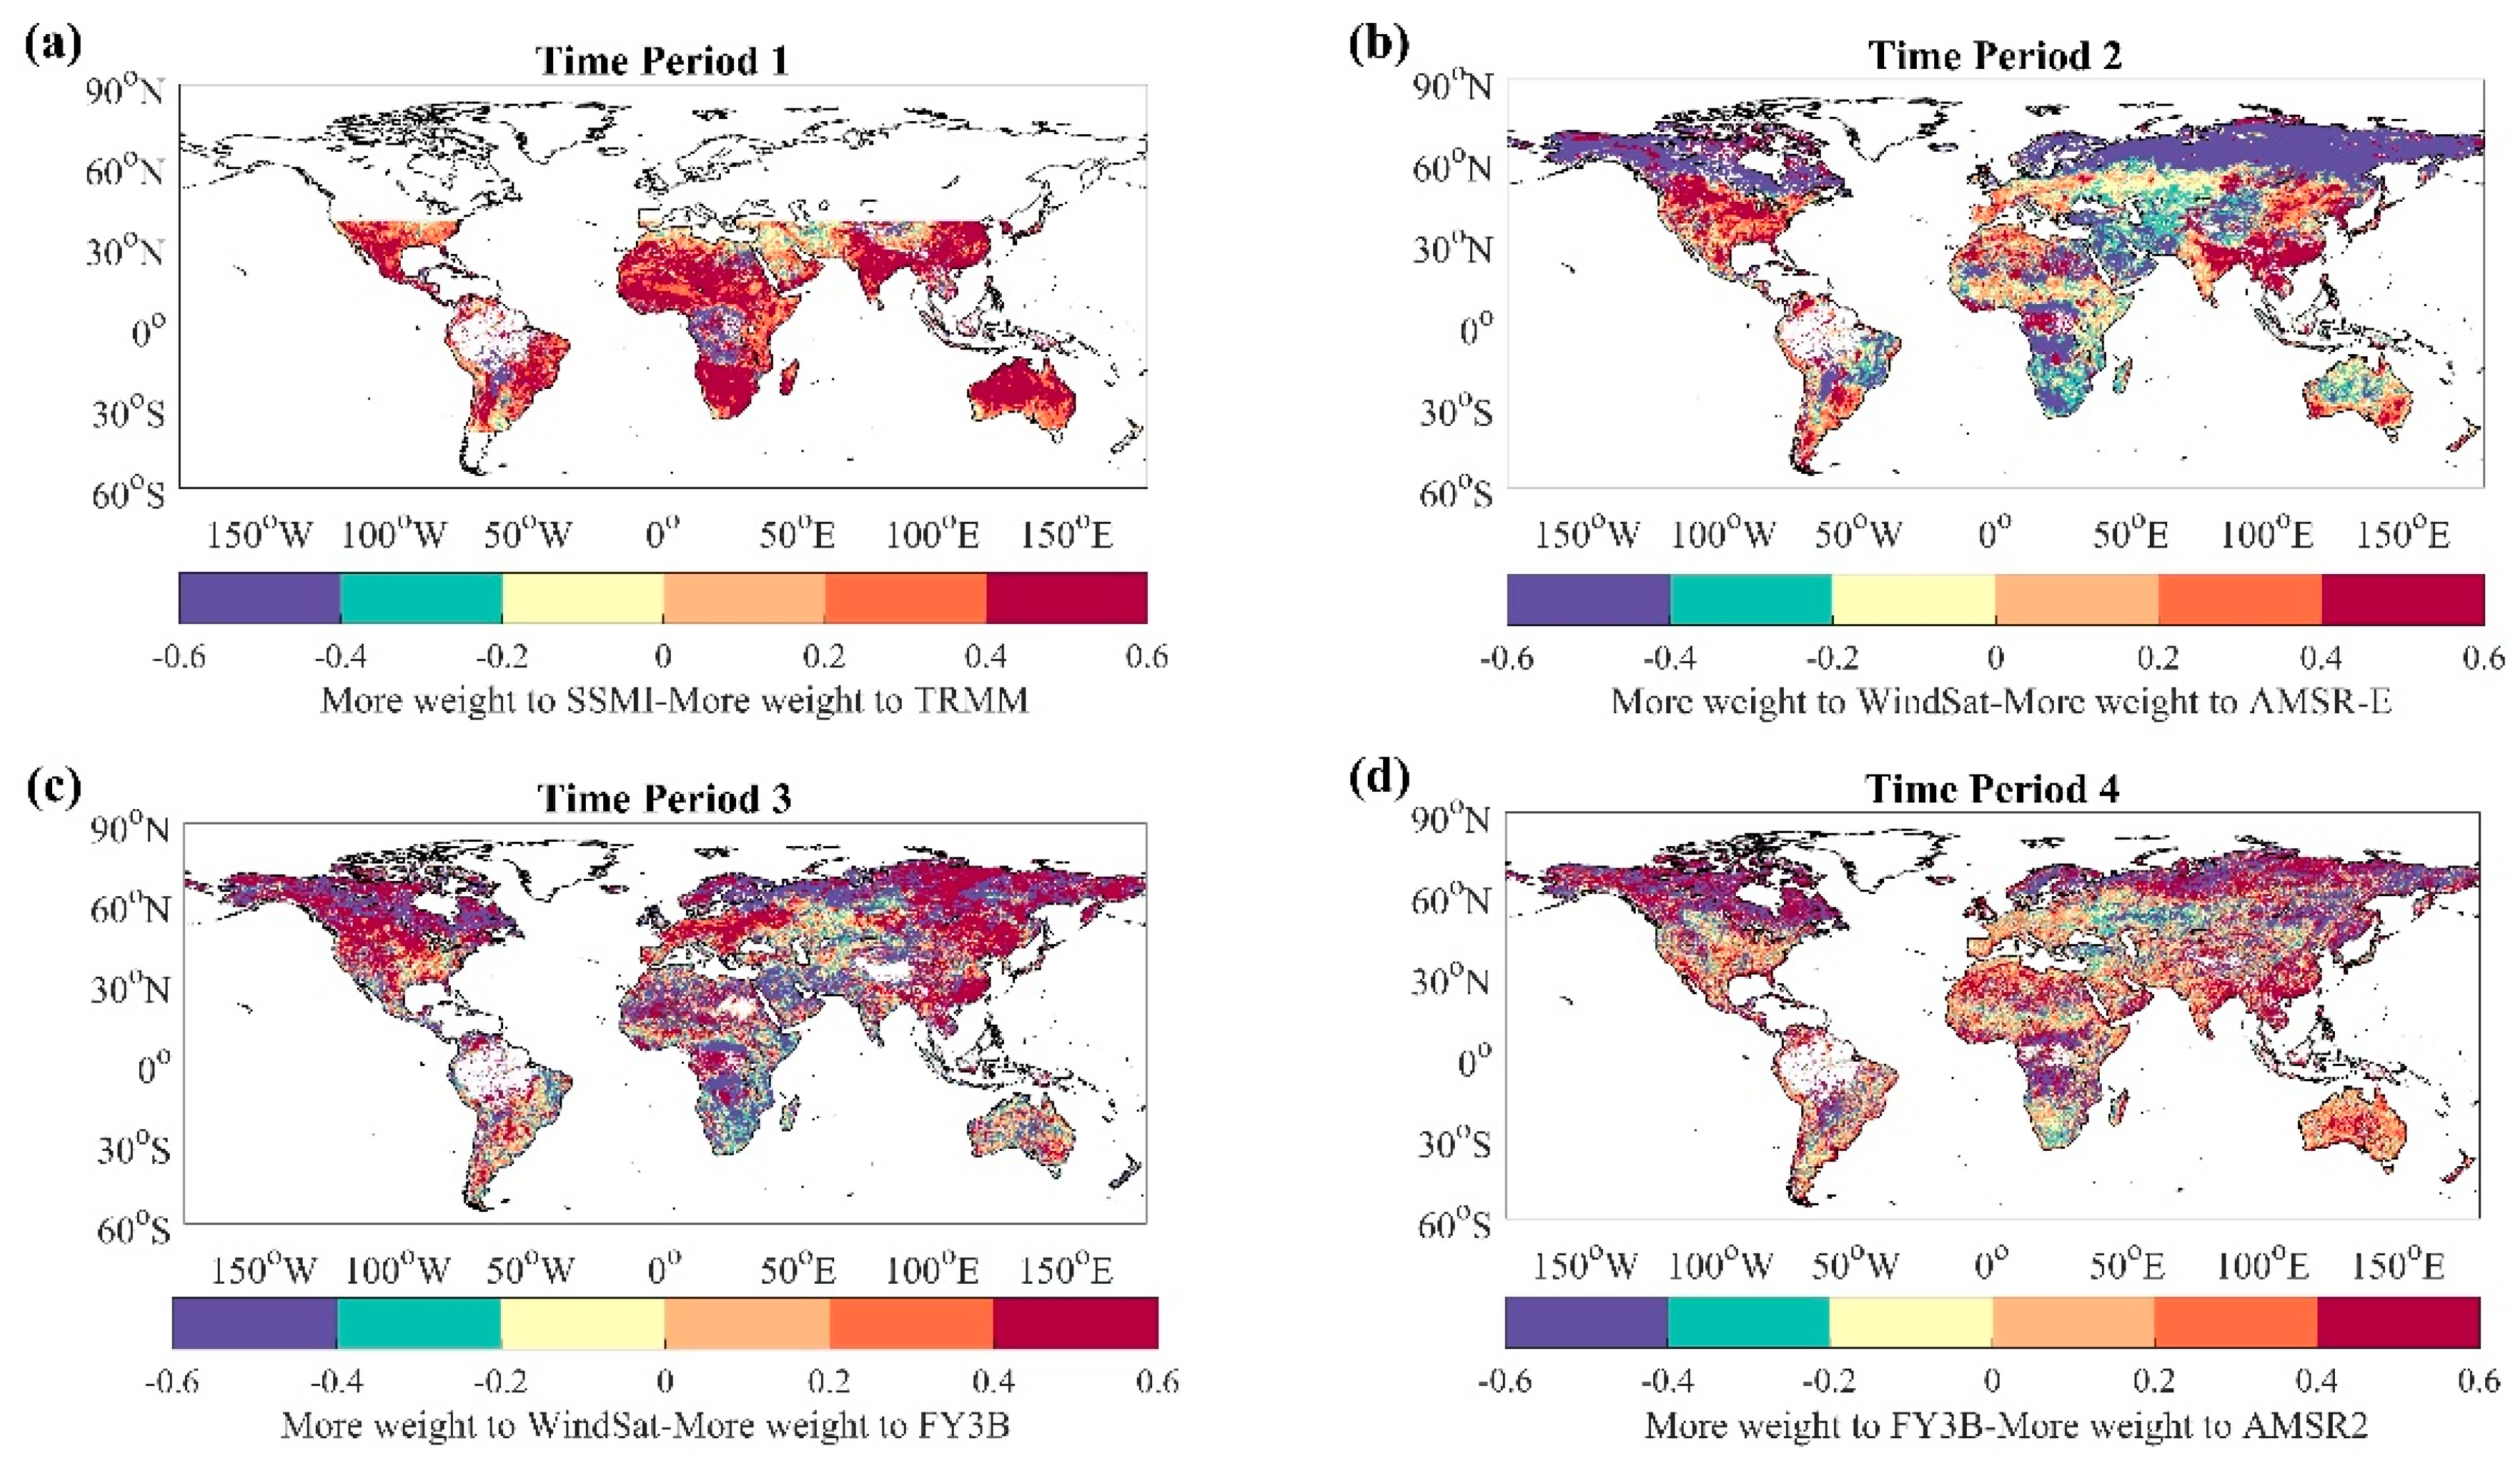
3.4. Relative Contributions of Satellite to the Merging Scheme

Since the optimal weights represent the relative contributions of each product to the merging in each period, it is possible to examine the individual contributions, as shown in Figure 3. This is also a reflection on the strengths and weaknesses of the satellite products relative to ERA5 soil moisture, which is used as the reference for the merging. This implies that higher contributions will be obtained for a particular parent product if it has a good skill relative to the reference. The weights in Figure 3 are normalized to fall between −0.6 to 0.6 for easy visualization, however, they actually fall between 0 and 1, as can be noted from Equations (1) and (2). The missing values, especially over the densely forested regions like the Amazon, are due to the masking over NDVI values greater than 0.8. Figure 3a shows the weights given to SSMI (yellow to blue—negative values) and TRMM (orange to red—positive values) in the first time period. Missing values in the higher and lower latitudes are a result of the absence of observations in TRMM, therefore, these areas are masked out. In this period, it is clear that TRMM contributed more to the combined product than SSMI, which is not surprising as SSMI’s challenging qualities have already been reported in previous studies which includes negatively correlated seasonal variabilities over some regions across the globe [46]. Nonetheless, SSMI’s contributions are observed over higher latitudinal areas, especially over the Mediterranean region. From mid-latitudes through the tropical areas to the lower latitudes, the combination is observed to be heavily dependent on the quality of TRMM. In the time period 2 (Figure 3b), both the WindSat (yellow to blue—negative values) and AMSR-E (orange to red—positive values) soil moisture products appear to have equal contributions to the merged product where AMSR-E seems to contribute more over the monsoon regions. Significant contributions of WindSat, on the other hand, appear mostly along the wet high latitudes and arid regions such as the Mediterranean areas. The third and fourth time periods (Figure 3c,d) present the contributions of FY3B set against WindSat and AMSR2 products. This is particularly important because while the latter two are included in existing merged products like the ECV soil moisture, FY3B is absent. Thus, Figure 3c,d allows us to quantify the potential of the FY3B product properly in such long records, although time period 3 may be too short for a reliable assessment. The period of Figure 3c (time period 3) is also crucial because it represents a period where observations are unavailable from both AMSR-E and AMSR2. Regions with significant contributions from AMSR-E in Figure 3b, are mostly linked to FY3B in Figure 3c where it is absent. This is necessary to promote consistency in long term soil moisture studies. Here, it is worth noting that time period 3 is a relatively short period. This could impact the computation of a robust optimal weights map (Equation (3)). Furthermore, regions around the east of the Sahara and over the Tibetan Plateau have missing values because one or both of the parent products had less available observations than the defined threshold for the period (Figure 3c). This is likewise for Figure 3d over the Congo basin. Figure 3d shows the contributions from FY3B and AMSR2 from 2012 to 2015. Here, contributions of both products are rather spread out over the globe, highlighting the added value of the FY3B not just in this combination study, but its potential to be significantly useful in other existing merging schemes and climate studies.

4. Results

4.1. Evaluation of Merged Product

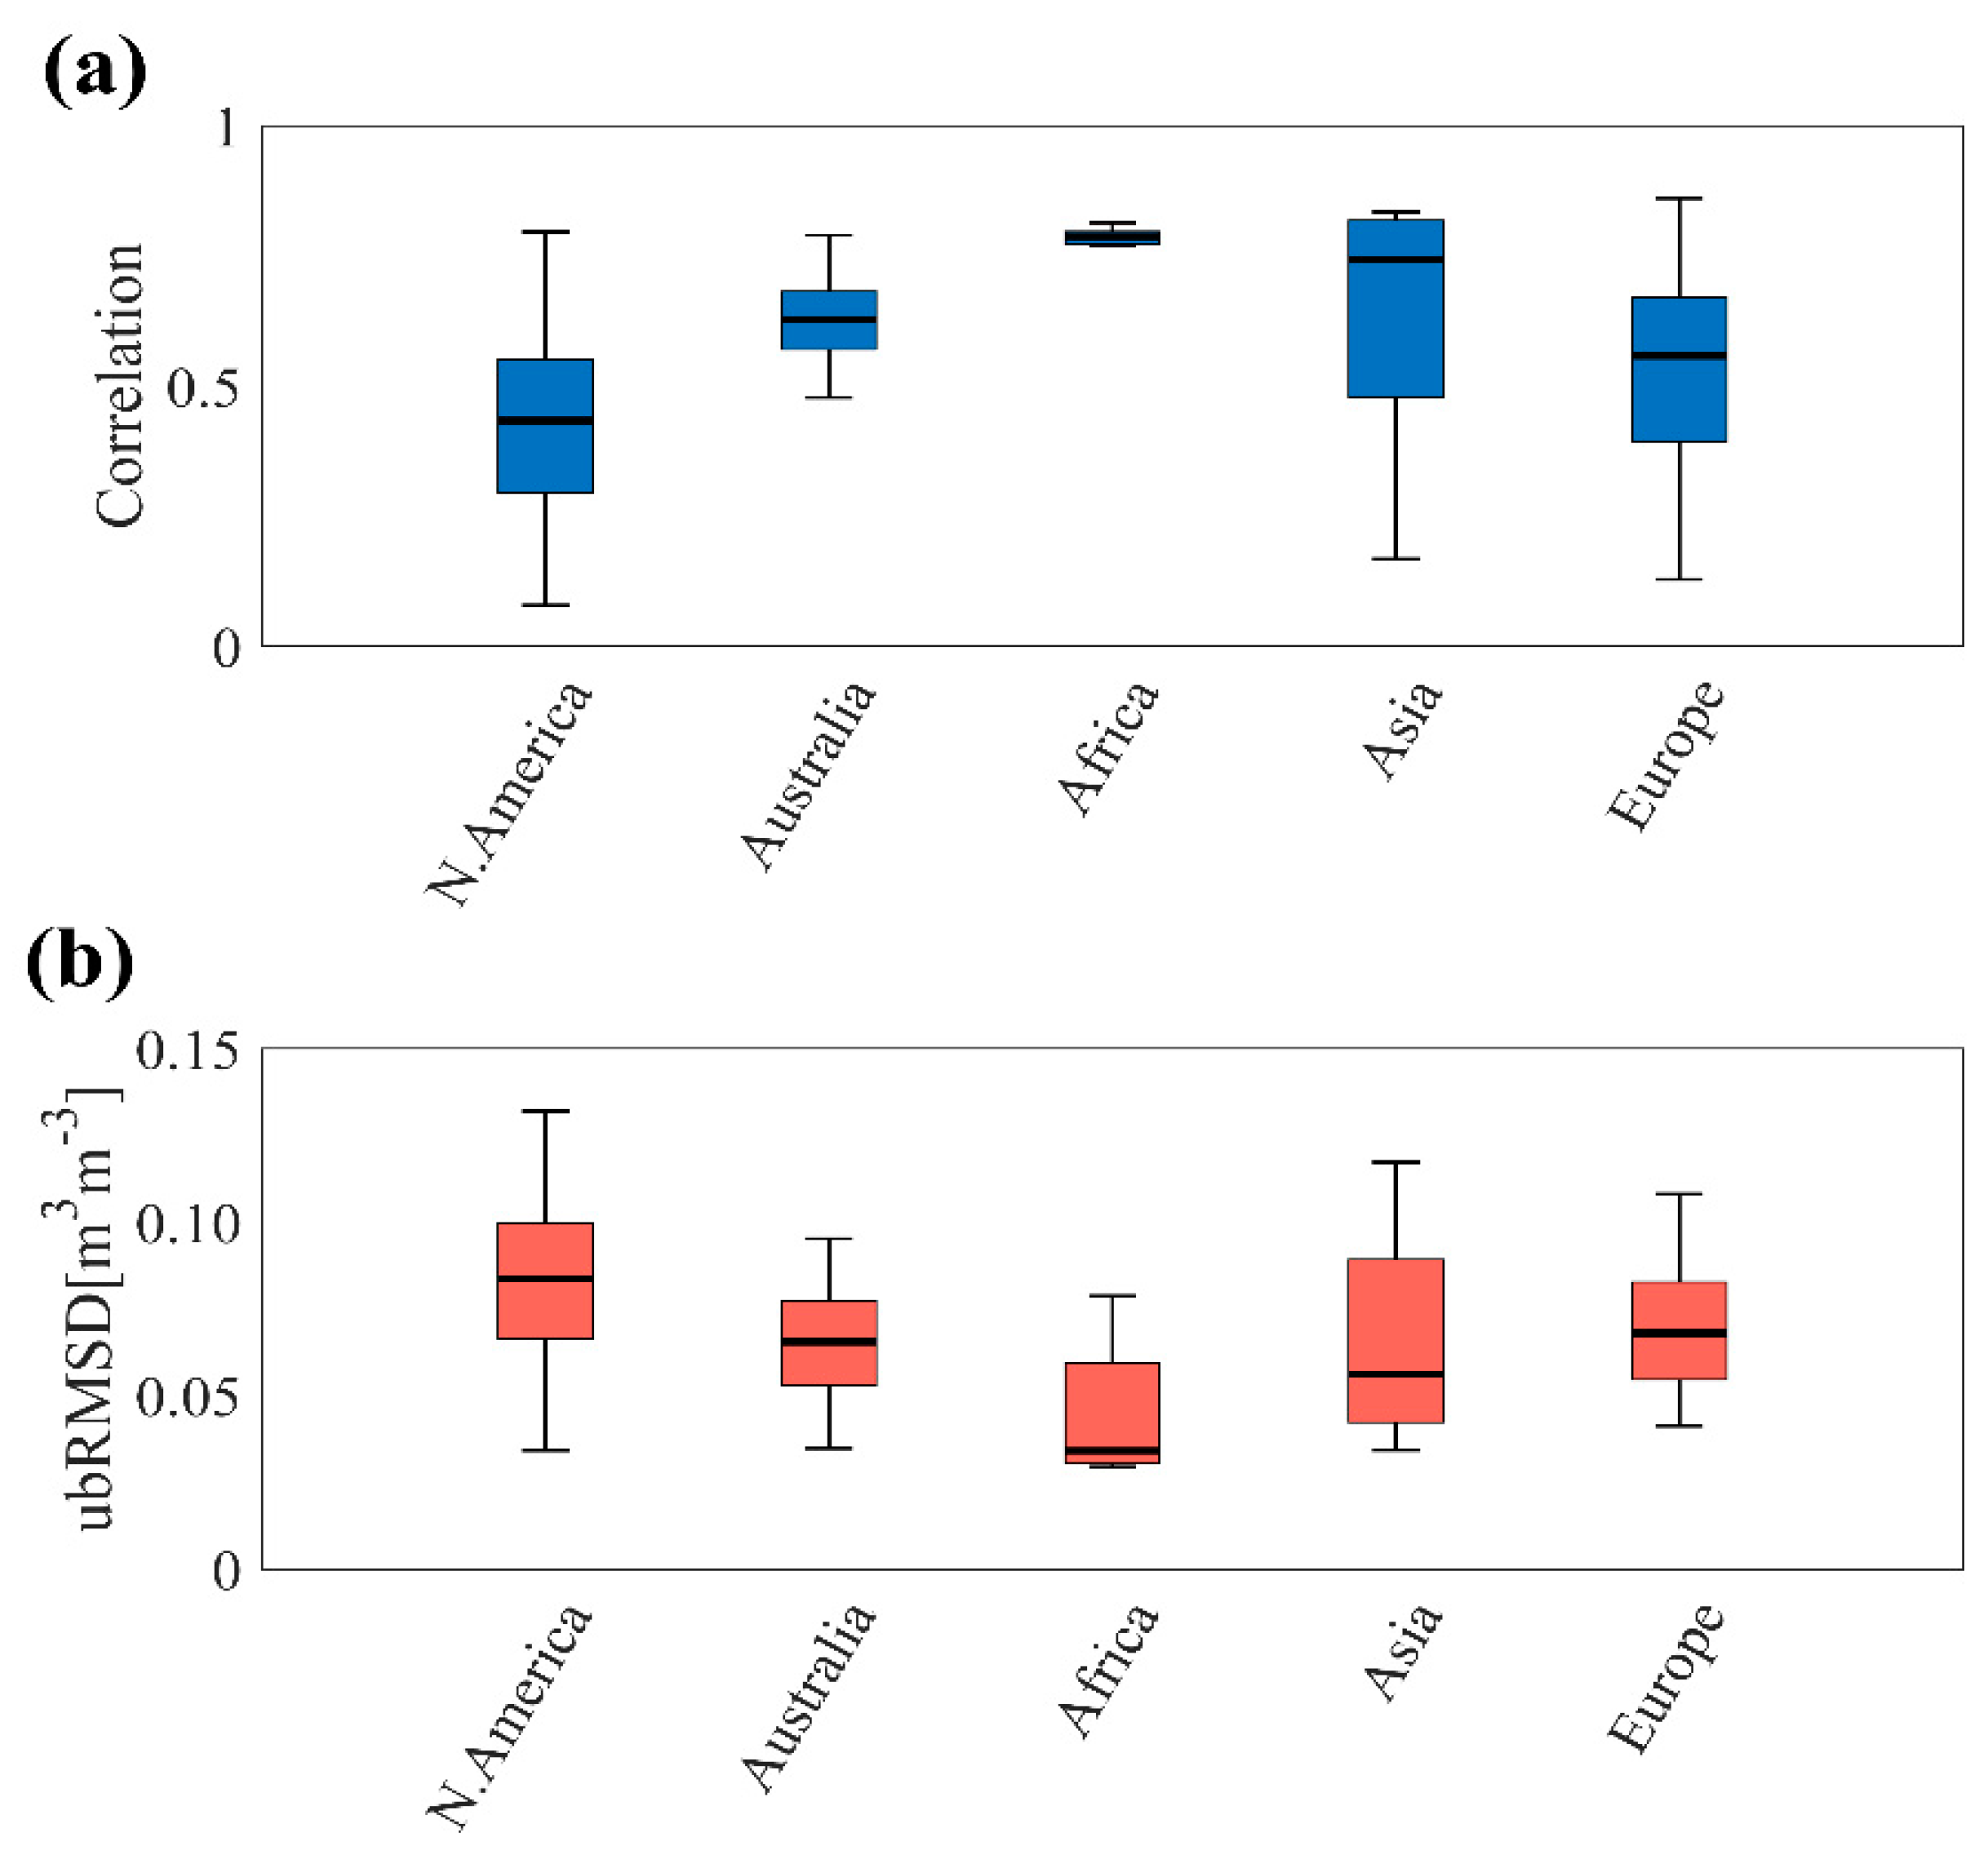
4.1.1. Validation with In Situ Soil Moisture

A key objective of this approach is to develop a merged product which harnesses the best correlations of both parent products. To understand how the merged product performs relative to the parent products, it is evaluated with the ISMN soil moisture datasets based on correlation analysis and unbiased root mean square difference (ubRMSD). The same evaluation is also applied to the rescaled parent product within the respective periods. Thus, it would indicate the extent to which the strengths of the parent products have been harnessed in the resulting merged product. Next the difference in correlations and ubRMSD between the merged product and the rescaled parent products are computed such that positive values indicate superior performance of the merged product. Figure 4a shows the correlation comparisons, and Figure 4b shows the ubRMSD comparisons. Here, these two performance metrics are chosen because they are generally not impacted by systematic differences that may exist among the datasets. Additionally, the use of the rescaled parent product in Figure 4 isolates the merit of the merging scheme from the normalization step in the ubRMSD comparisons. The results demonstrate that the merged product leverages the strengths of the parent products to obtain superior skills in each period as shown in Figure 4a,b. This is indicated by the consistent positive values in the plots. Significant correlation improvements can be seen in merged product relative to SSMI and WindSat in Figure 4a. In Figure 4b, the improvements are more significant relative SSMI, WindSat and FY3B, implying reduced differences with regard to the in situ observations. The results here also show that although the combination approach learns from the reference and parent product, the resulting merged product comes with its own set of skills. This is because individual parent products have their strengths and limitations. Therefore, the approach aims to combine, as much as possible, the strengths of the products into a single framework.
To have a more detailed understanding of the quality of the merged product over different regions globally based on the ISMN in situ datasets. Both correlation and ubRMSD results are presented over the different continents for the different networks used, as shown in Figure 5. Generally, most of the in situ datasets are distributed over Northern America (N. America) and Europe, and a rather limited number over Africa and Asia. Results from the African networks show the highest correlations (up to about 0.8) and the smallest errors (about 0.025 m3/m3). Even though the network distribution in Africa is not as dense or as spread out those in N. America and Europe, it is still good to see that results over the region are encouraging. The lack of observation data over the African continent makes long records such as this merged product necessary to fill the gap in missing observational records. Over regions such as the United States, Middle East, China and Japan, L-band and C-band soil moisture observations are usually replaced with X-band observations due to radio frequency interferences [34,47]. Therefore, improved X-band soil moisture observations will benefit large scale soil moisture applications over such regions without a compromise in quality. High mean correlations and lower ubRMSDs over Australia and Asia are also observed in Figure 5.

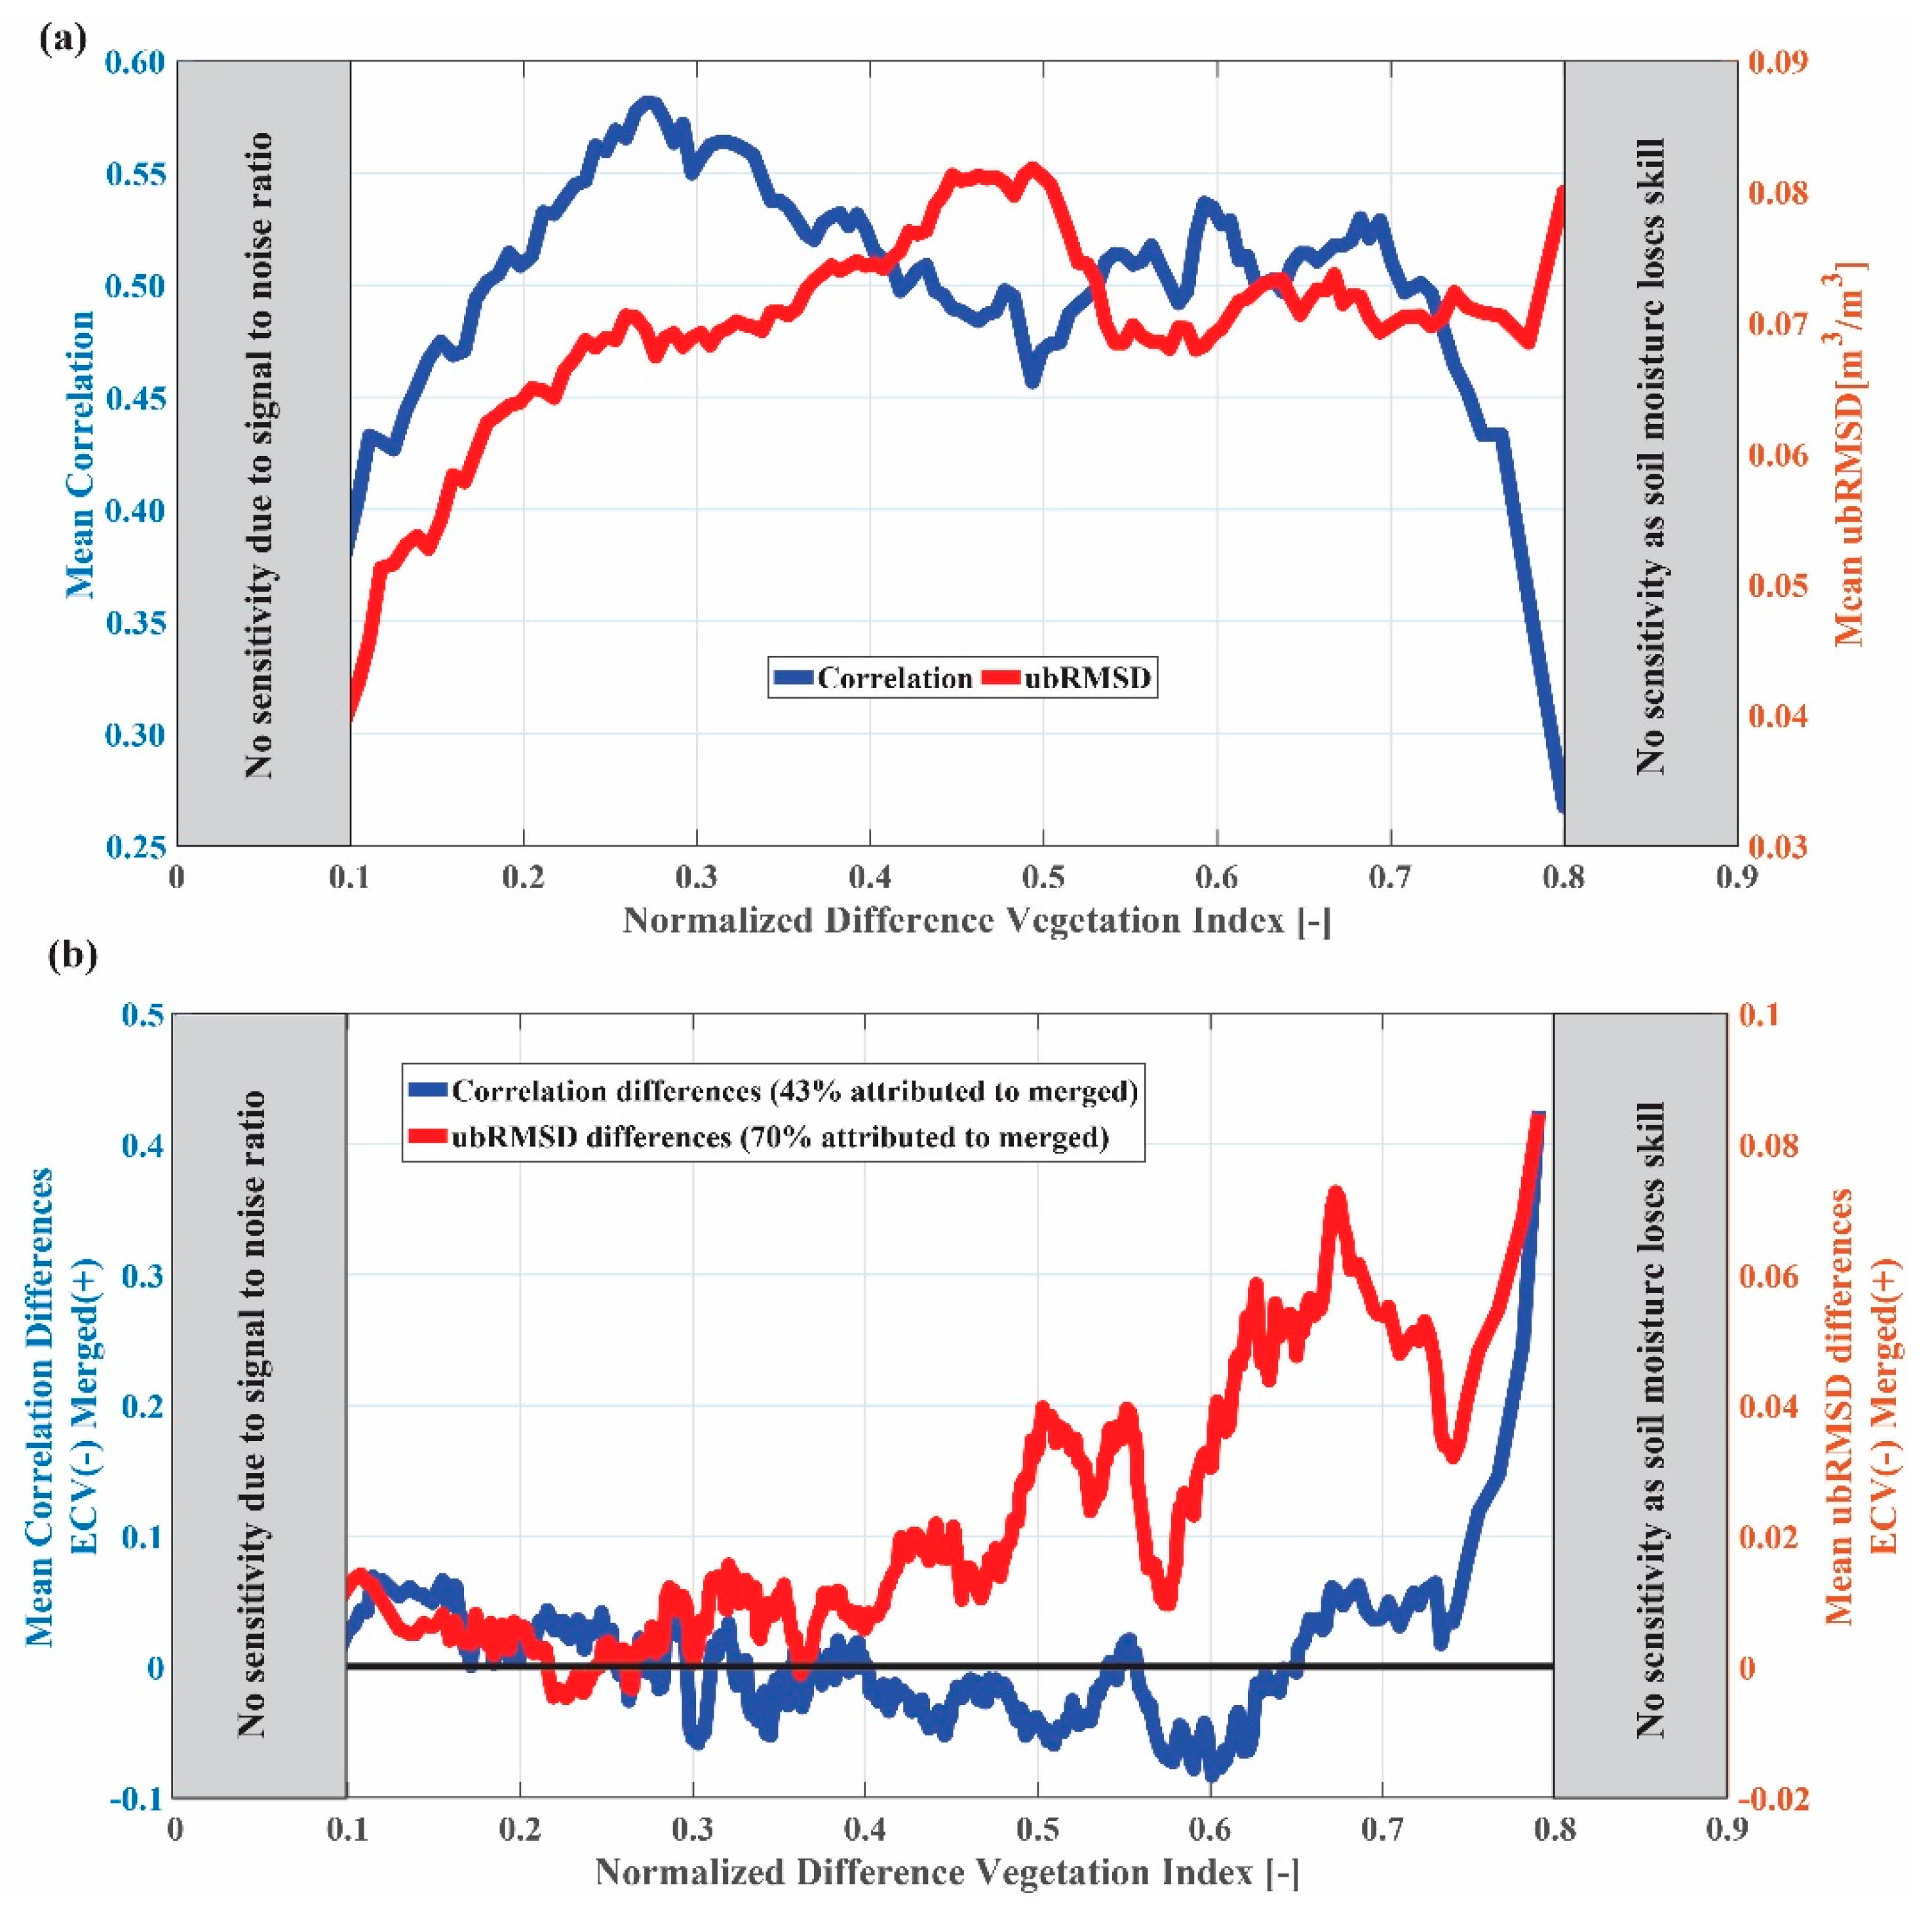
4.1.2. Evaluations over Different Vegetation Densities

Previous studies have shown that the quality of soil moisture products, both satellite and model-based, varies as a function of vegetation [26,34]. Here, the correlation coefficients and ubRMSDs within in situ soil moisture are binned over various NDVI scenarios (0.1 to 0.8) to understand how the skill of this merged product as a function of vegetation variability as shown in Figure 6a. Results generally show that the quality of the merged product drops with increasing vegetation density. However, it is worth noting that NDVI values from 0.2 to 0.7 are generally within a good range of quality with a mean correlation over 0.5 and a mean ubRMSD of about 0.07. Under very dry (NDVI: < 0.2) and very wet (NDVI: > 0.7) conditions, the skill set of the product is relatively lower. The merged product demonstrates a good skill of capturing soil moisture dynamics over a large range of vegetation densities. To isolate the added value of this merging approach, the merged product is here compared against the ECV passive microwave records. Here, the two merged products are first evaluated with in situ observations to assess both correlation and ubRMSD. The difference between their correlations and ubRMSD are then obtained such that positive values are linked to the merged product where correlations are larger and ubRMSDs are small. Conversely, negative values indicate a better performance of ECV. Figure 6b shows these results across various vegetation densities.
Overall, the results show that the merged product performs better over sparse and densely vegetated regions. Furthermore, Figure 6b also shows that regions with low vegetation densities also benefit more from the merged product. Essentially, it could be suggested that sparsely and densely vegetated regions benefit more from the merged product than from ECV. It should also be noted that the averaging across the different vegetation densities may impact the clarity of the results. The unaveraged (unbinned) are presented in the supplemental materials. Results in Figure S1 also show that both products have their own merits. The unbinned results suggest that 43% of all matched points to the in situ are observations have higher correlations with the merged product while 70% have lower ubRMSDs than the ECV soil moisture.

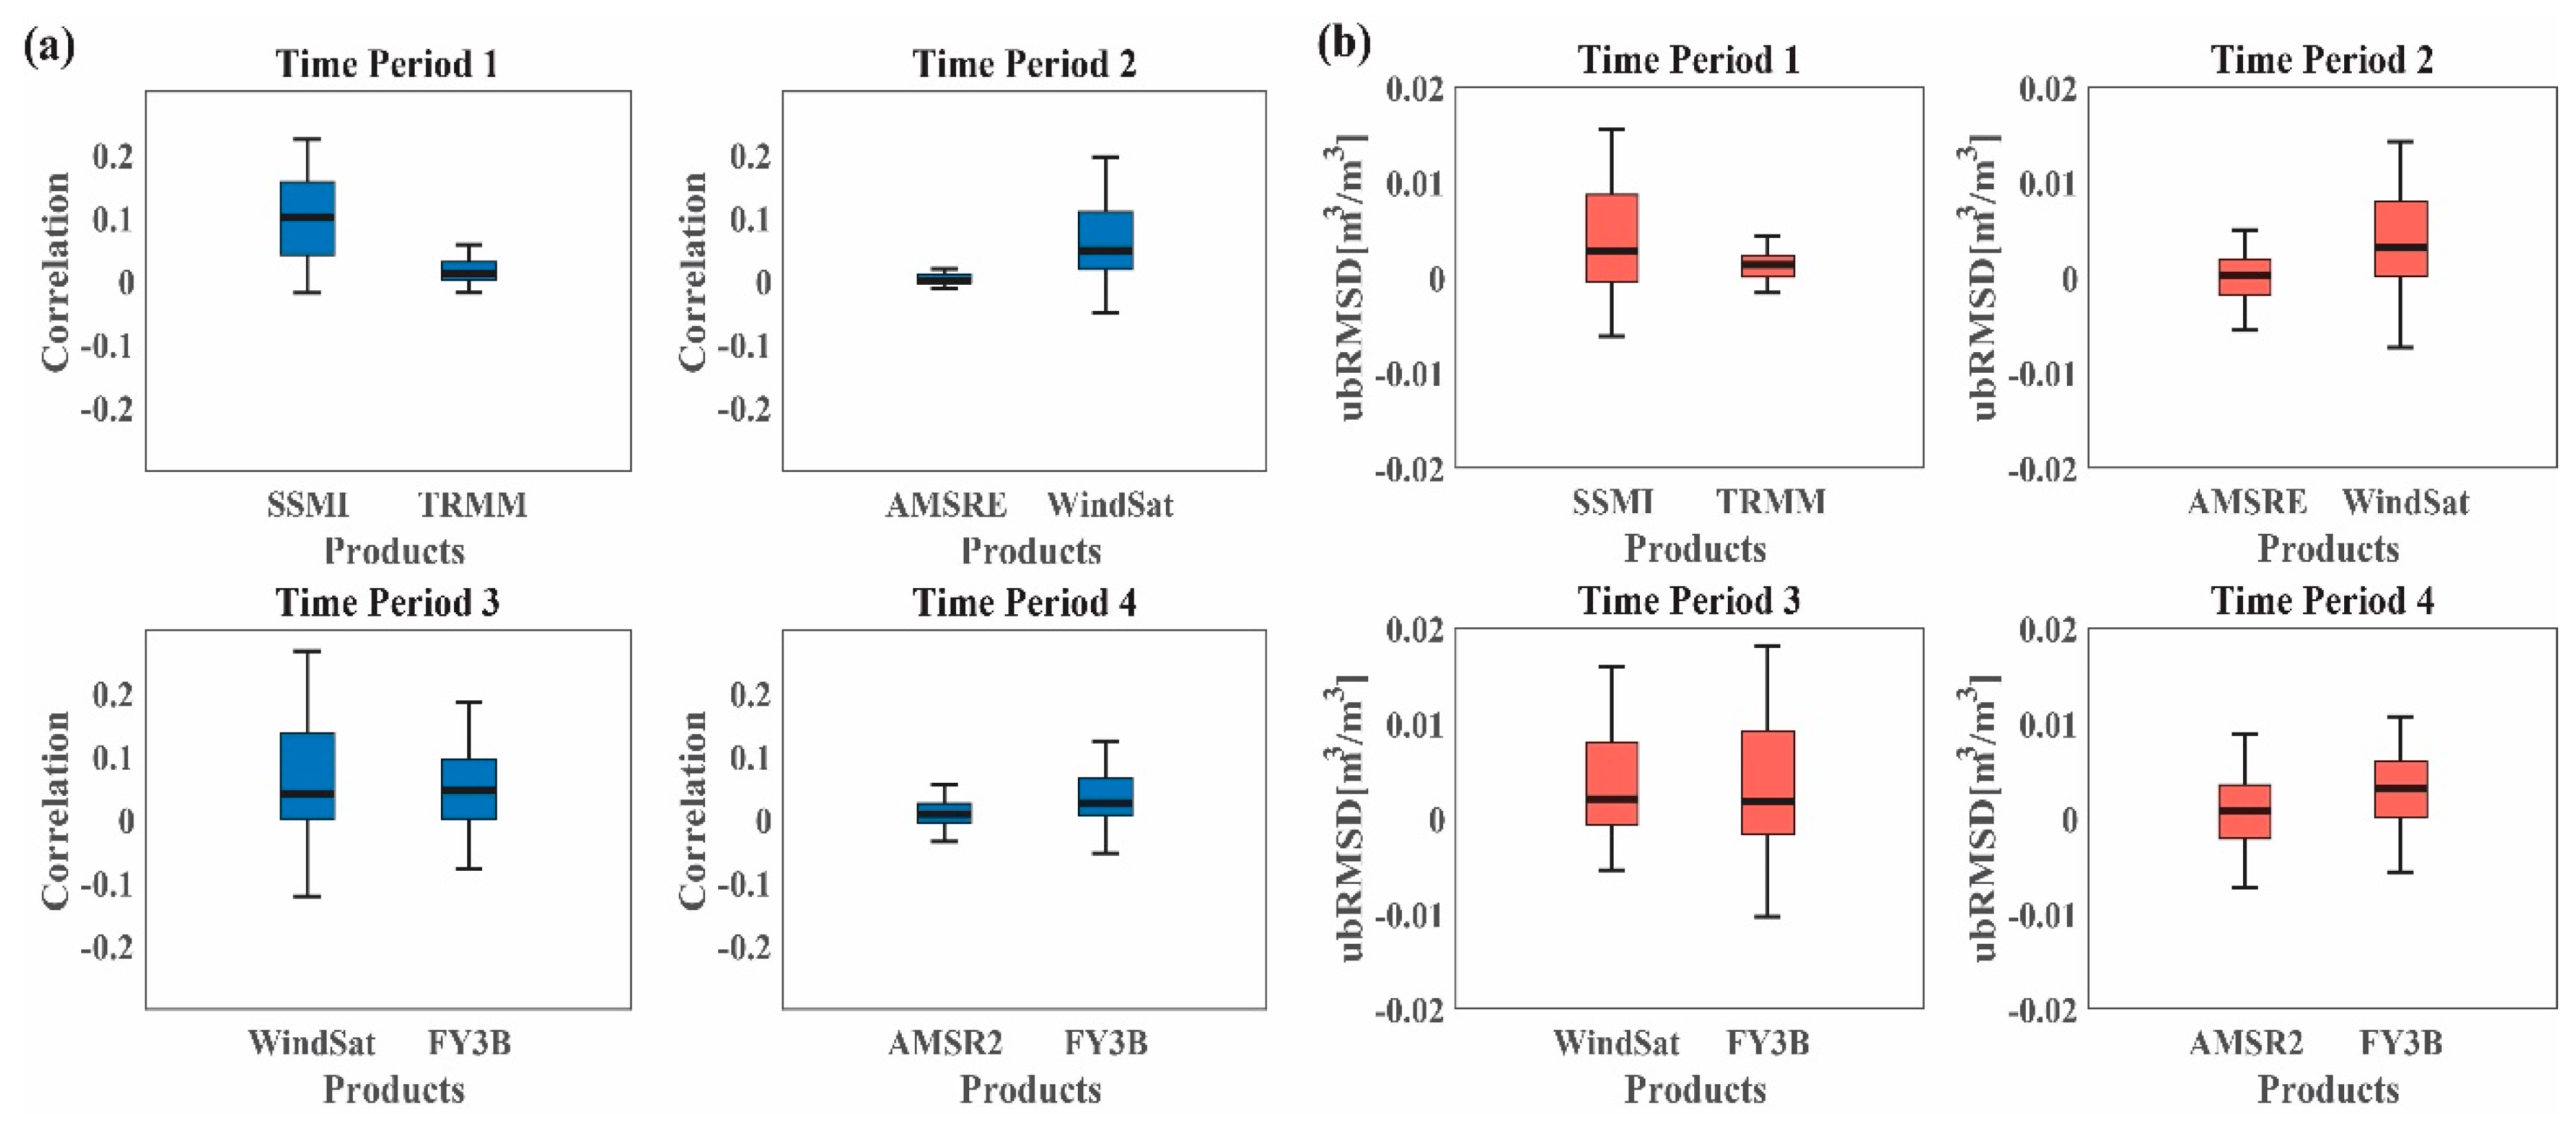
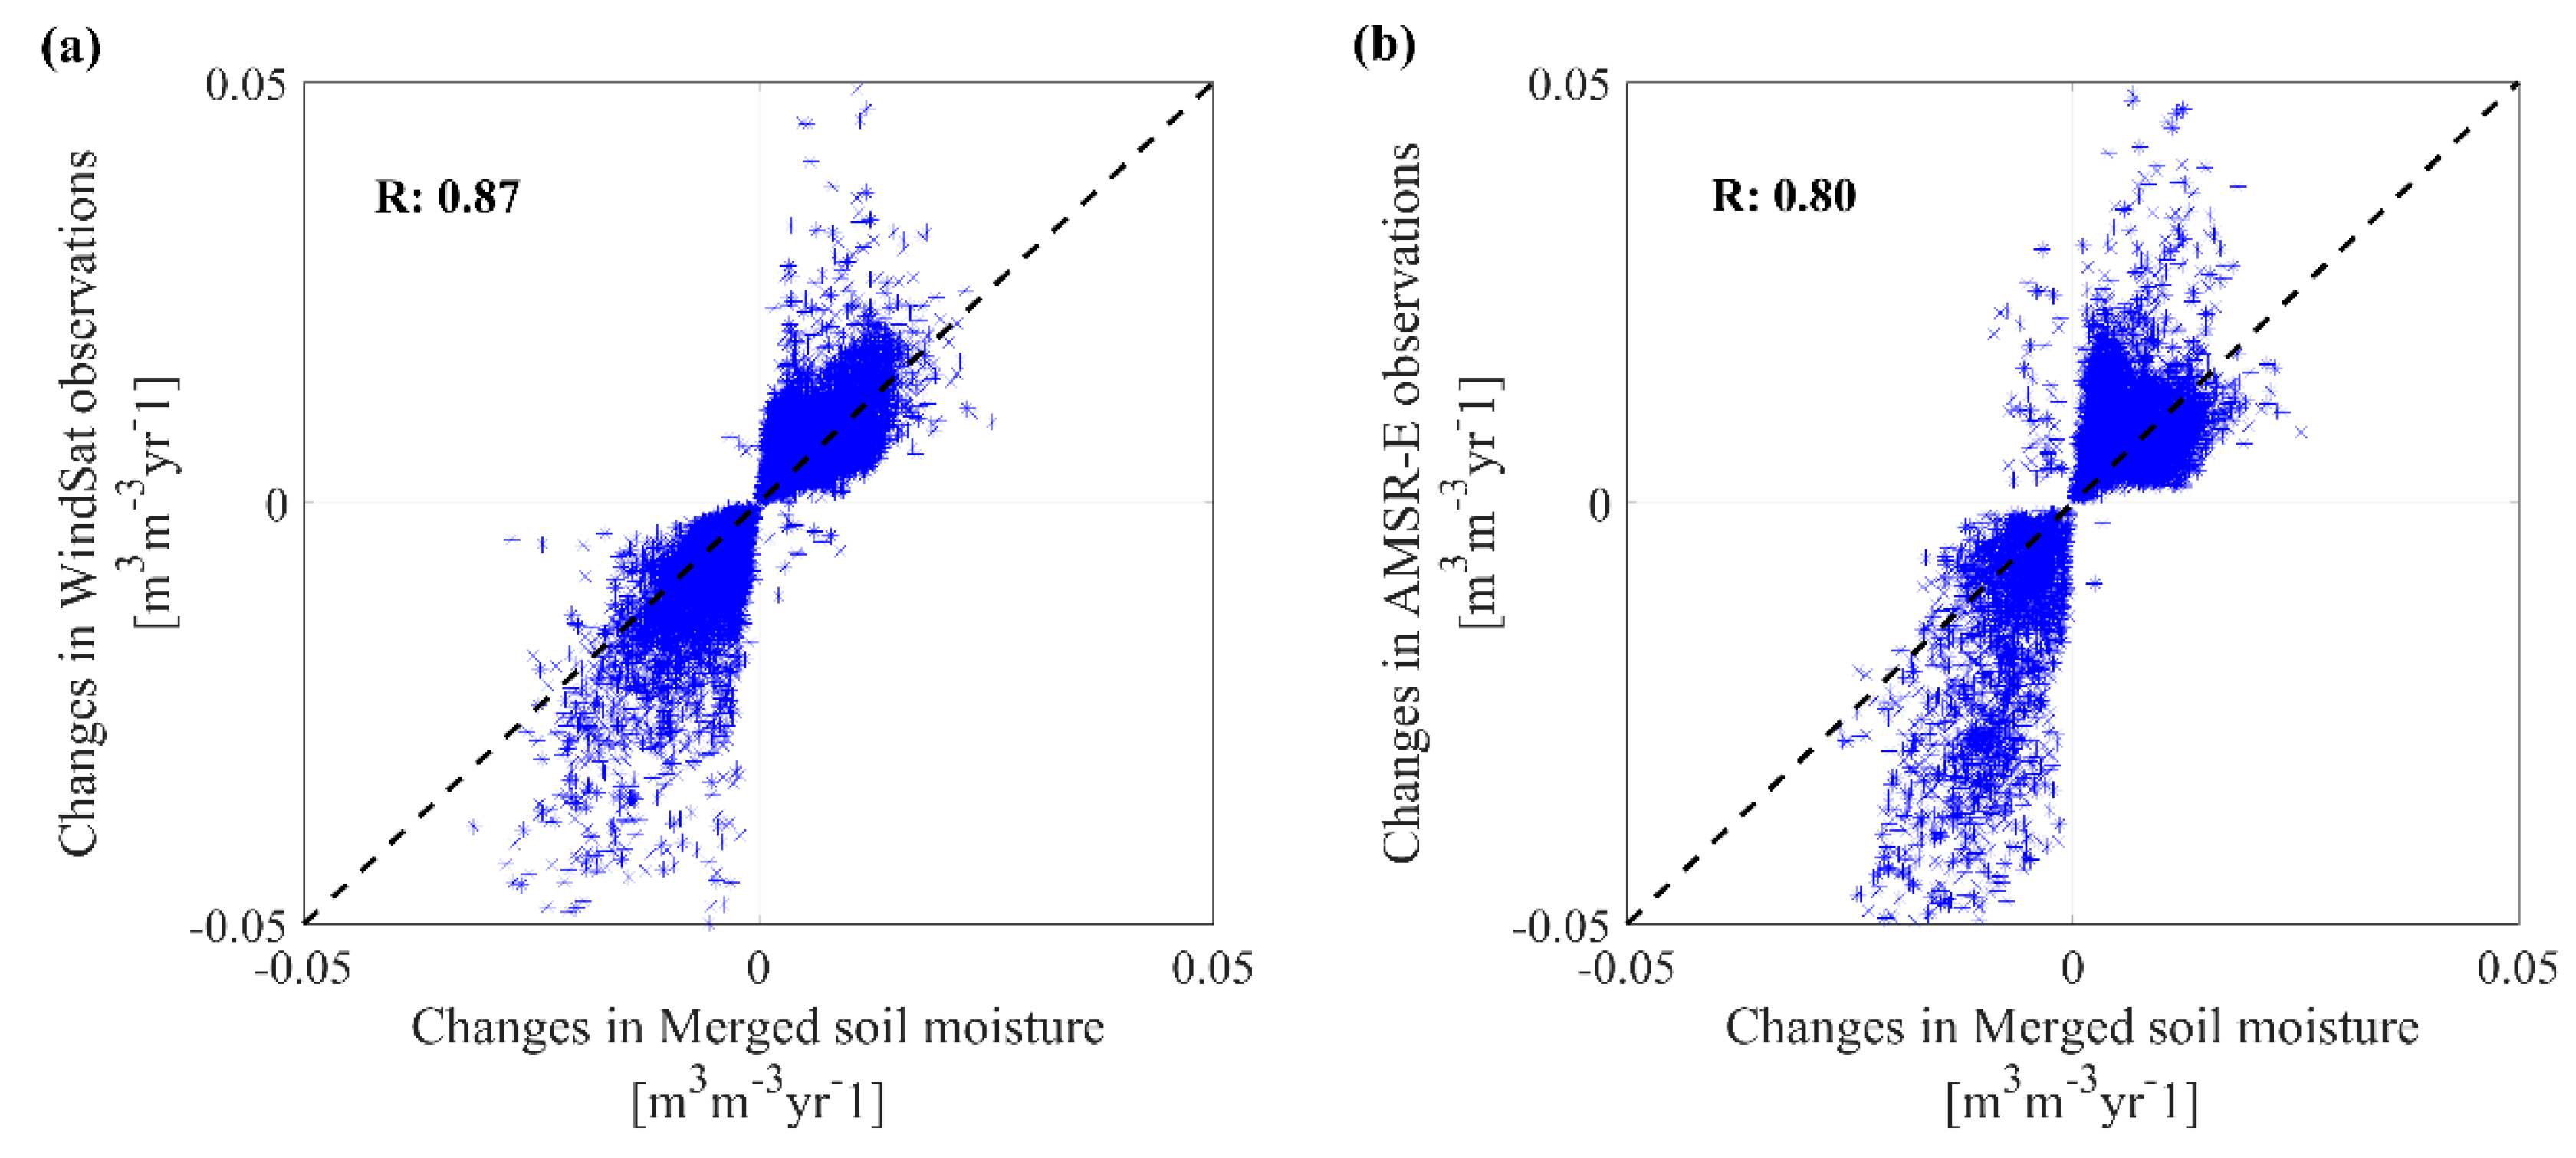
4.2. Preservation of Parent Product Trends

In a long-term merging exercise such as in this study, it is of interest to understand how trends may have been impacted in the final merged product relative to the original time series. It should be emphasized here that the aim of this section is only to assess how long term changes in the normalized soil moisture within the merged product have been impacted relative to the parent products. To do this, the nonparametric Thiel–Sen slope is used to obtain the magnitude of changes in the soil moisture estimates per year. This approach has been used in several studies to estimate long-term trends in hydrological and meteorological time series [48,49]. Here, the trends in the WindSat (Figure 7a) and AMSR-E (Figure 7b) are compared with the trends in the merged product matching the length of their data availability (essentially, years 2003 to 2012). The results show that, generally, the trends are preserved to an acceptable degree, where the similarities between the trends in the parent products and that of the merged product are up to correlation coefficients of 0.8 and higher. Figure 7 also shows that larger differences are found within the significantly large changes and higher similarities in smaller changes. Nonetheless, it is clear the direction of trends, which is usually more important, are very accurately preserved. Therefore, places of drying in the original products are similarly drying in the merged product. The same can be said about wetting trends as well. Thus, the product of such a combination scheme can be relied on for long-term studies and applications. Of course, it may be necessary to mention that where there are significant differences between the trends of the parent products, larger differences could be expected in the hybrid product.

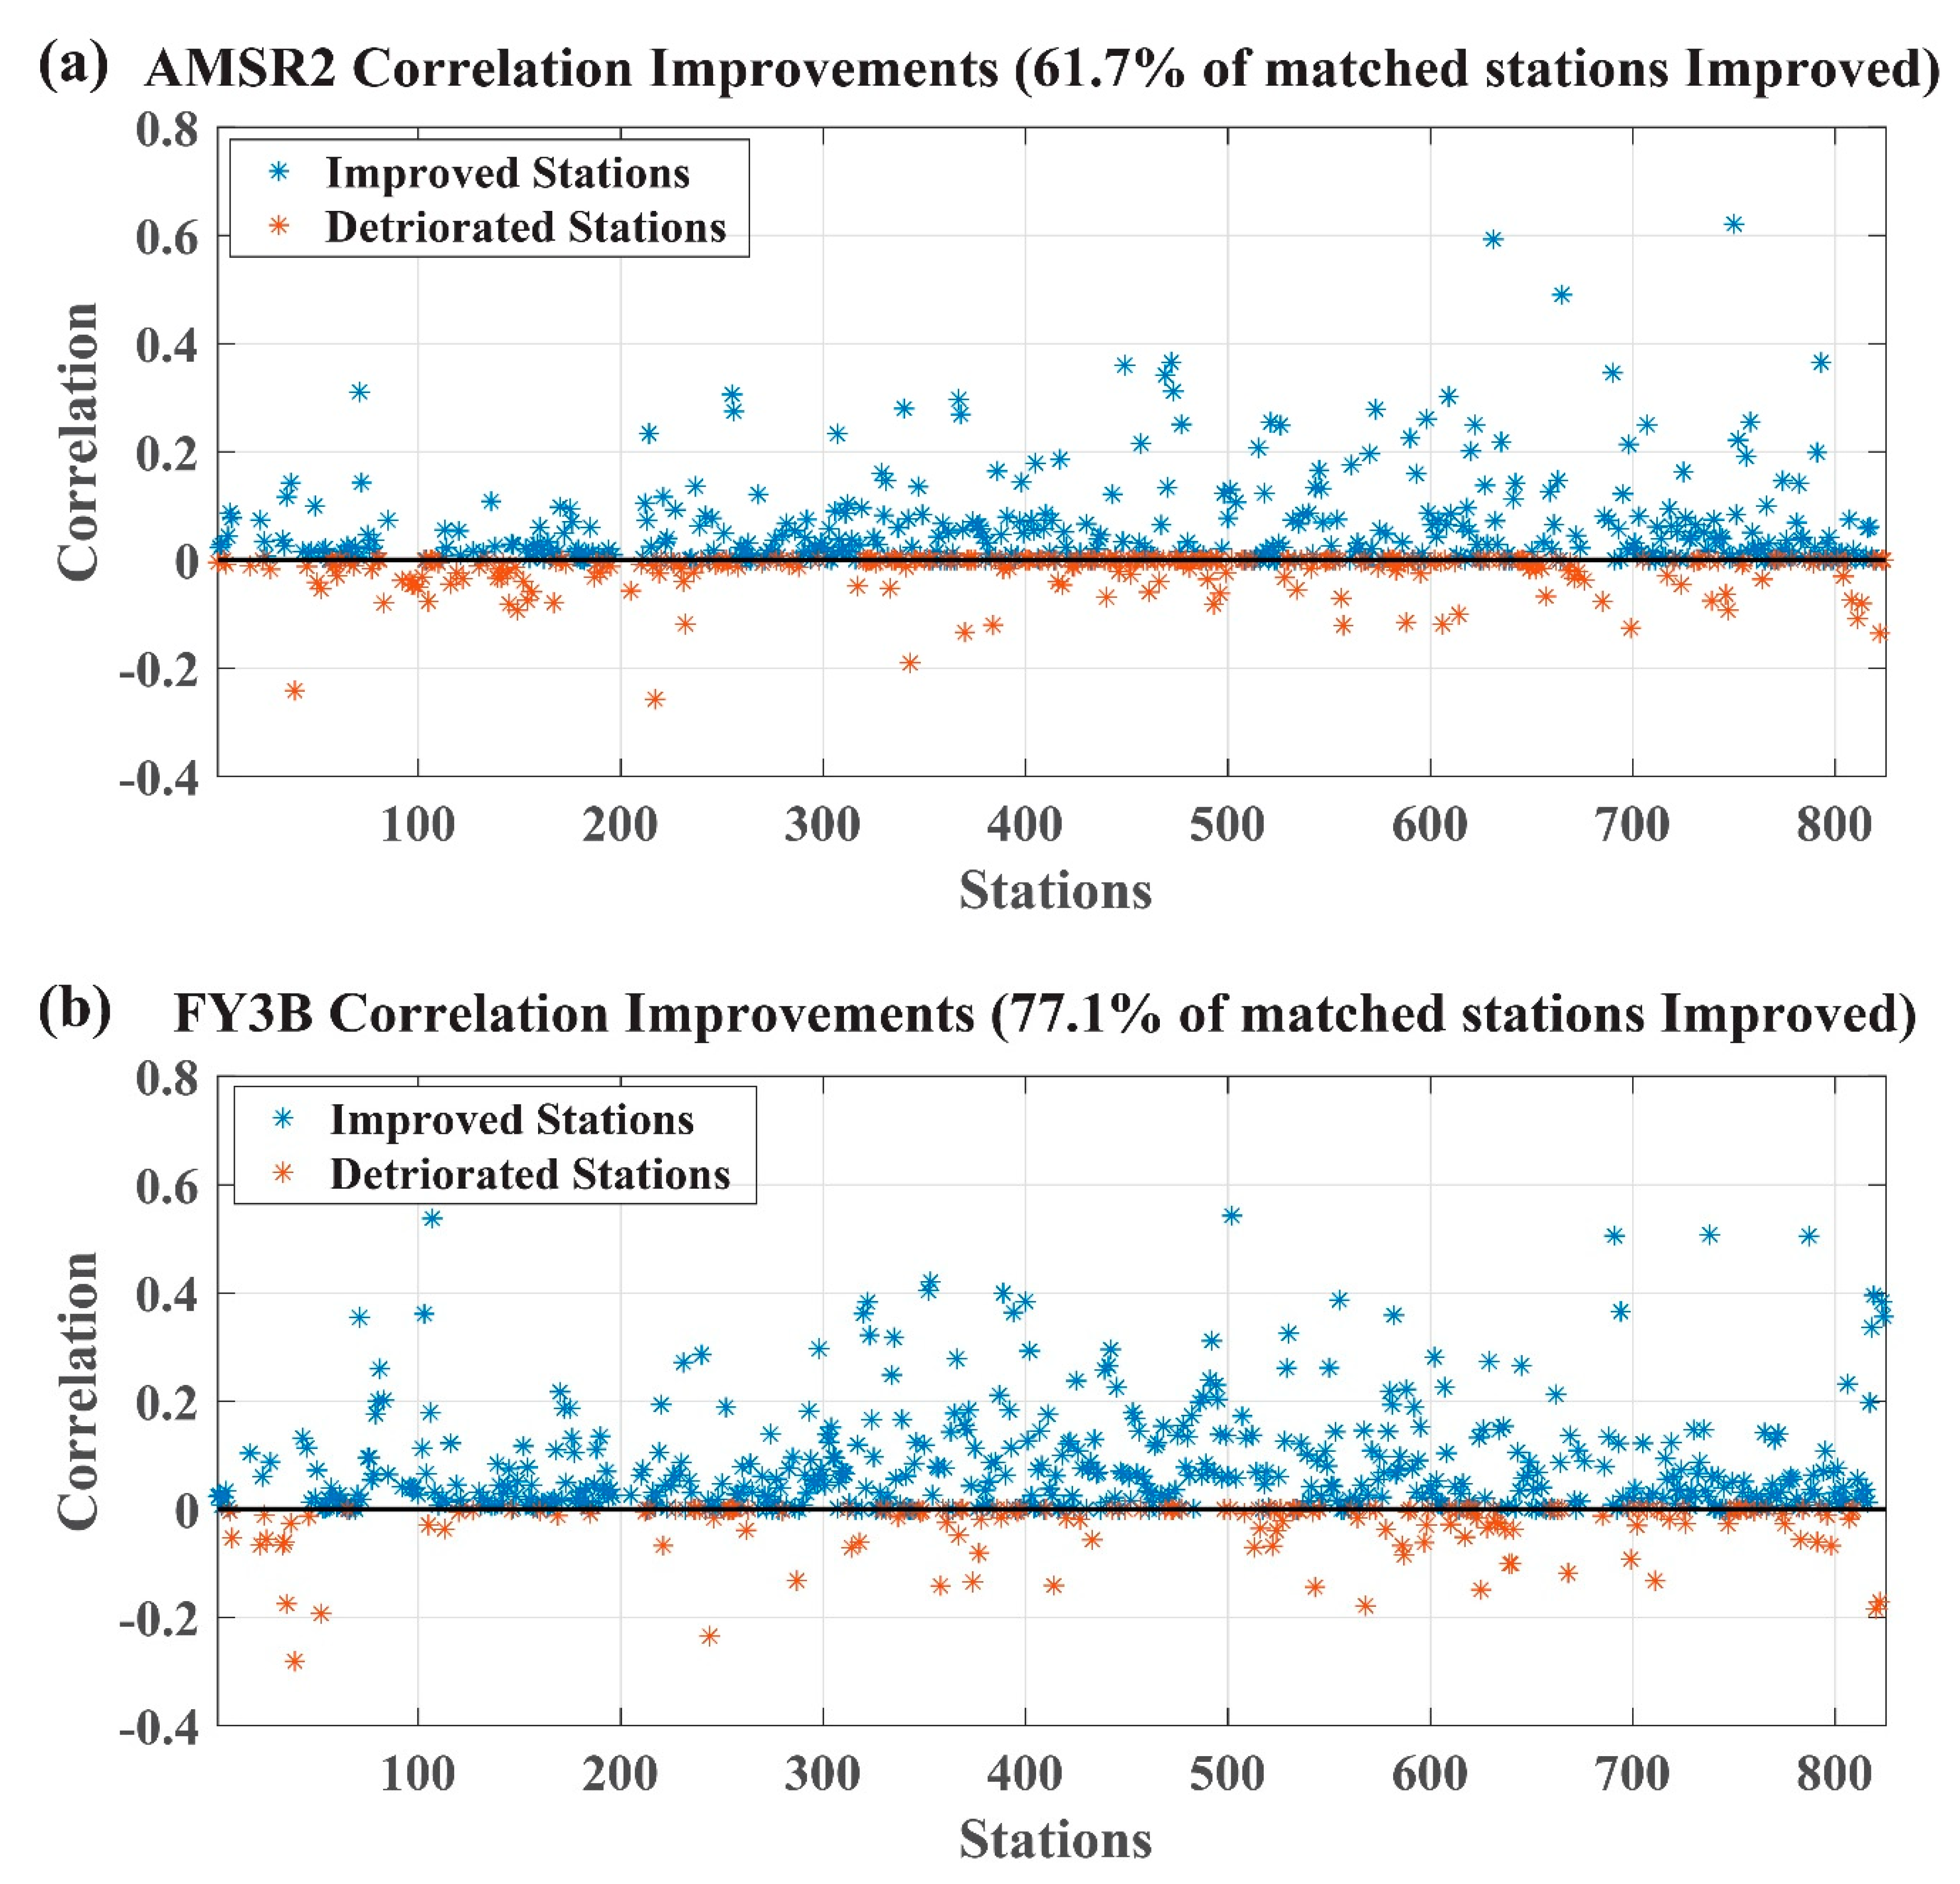
4.3. Relative Contributions of FY3B

As mentioned above, the FY3B is absent in existing merged long records of passive microwave-based soil moisture. Thus, understanding its potential will improve and enable its proper use. It serves as a suitable X-band based soil moisture substitute between 2011 and 2012, where observations are generally unavailable from the AMSR sensors. In challenging regions like the Tibetan Plateau, Wang et al. [50] demonstrated that the skill of FY3B is quite comparable to well-known products like TRMM. This study, therefore, builds on these previous studies by evaluating the potential of the FY3B soil moisture product in such a merging scheme.
In Figure 8, the study is limited to time period 4, where FY3B and AMSR2 are combined within the record here. To probe into their contributions, the magnitude of correlation improvements are associated with the weights given to the parent products (see Figure 3d). That is, where more than 50% of the weight of a grid point comes from a particular parent product, the change in correlation coefficients (either improvement or deterioration) is credited to that product. In Figure 8, the magnitude of correlation improvements (deterioration) relative to the in situ data (at a significant level of 0.05) is shown in blue (blue). Overall, Figure 8 demonstrates that more improvements are obtained. The results further indicate that about 77.1% of the matched points to the FY3B in this period were improved. Similarly, 61.7% of the matched points to AMSR2 were also improved. These results generally suggest two things: (1) The merging scheme used does have a laudable added value to improving the skill of soil moisture by leveraging the strengths of the parent products; (2) Comparably, the FY3B product does have the potential to contribute to merged satellite soil moisture record. Another general observation here is that the magnitude of the improvements is more significant than the deteriorations, which are mostly small magnitudes.

5. Discussion

The study here has used a recently developed combination scheme [21] to develop a long-term record (1998–2015) of satellite soil moisture from different passive microwave sensors. The added value of satellite soil moisture products has been suggested to be best found in their correlations [21]. Thus, the method here combines two products by maximizing temporal correlations to a chosen reference. Here, two ideas are investigated. The first is to learn lessons from such a scheme which are not utilized in other existing soil moisture merging schemes and to understand its value in long-term data-merging. Second, it seeks to understand the potential of a relatively unexplored product, soil moisture observations from the microwave imager onboard the Chinese FengYun-3B satellite. These are expected to serve as an auxiliary toolbox from which current merging schemes can explore to improve their frameworks.
Here, retrieved soil moisture from six passive microwave sensors (five of which are X-band retrievals) based on the land parameter retrieval model, LPRM, were sequentially combined by maximizing their temporal variabilities to a chosen reference. However, both passive and active microwave retrievals are impacted by radio frequency interferences, lower frequencies are more easily impacted [29,47]. Therefore, over regions of strong interferences, X-band retrievals become the preferred option [34]. This study, therefore, leverages this added value of X-band based retrievals to explore their merits in a long-term data-merging scheme. Like other data-merging approaches, a reference is required. While in situ observations would serve as the best option for a reference, they are limited by their obvious point–scale representation as well as discontinuities over time due to their rather expensive management. Previous studies have also depended on model-based soil moisture products to combine multiple products due to their high spatial and temporal consistencies. For instance, the multi-decadal global satellite-observed soil moisture dataset developed by the European Space Agency (ESA) as one of its Climate Change Initiative (CCI) uses model-based soil moisture estimates as a scaling reference to correct the systematic differences between the active and passive soil moisture datasets used in their combined (active + passive) product [40]. While these chosen references are generally dependable, the merging schemes are blind to the qualities of these reference datasets. As such, a good preliminary understanding of the relative qualities of the chosen reference is highly recommended. Existing studies have evaluated commonly used global model-based products with observations and have reported a high skill of soil moisture within the ERA5 global atmospheric reanalysis framework [26,31,32]. Based on these conclusions, ERA5 soil moisture is chosen here as a reference for the combination approach.
After normalizing the products to the reference, the weights of the magnitude of the individual satellite products’ contribution were computed relative to the reference data. To achieve this, the entire period was divided into four main periods to match the availability of satellite products. Here, it was observed that the different periods (of different time lengths) presented different challenges for the combination stage. For instance, several regions had to be masked out in shorter periods since reliable weights could not be obtained due to insufficient data points (Figure 3c). Thus, the quality of a superior combined product will depend heavily on a robust weight computation (Equation (1)). Comparing the merged output with in situ soil moisture observations from the International Soil Moisture Network (ISMN) showed that it is an overall improvement of the parent products (Figure 4). A more detailed comparison showed that over various continents, the merged product maintains high correlations and lower unbiased differences, especially of Africa, which is known to have a significant lack of reliable observation datasets (Figure 5). Across different vegetation densities, indicated with NDVI, the merged product demonstrated high median correlations of about 0.55 and a median ubRMSD of about 0.07.
A comparison with ECV is also presented. Here, it is important to note that since ECV products come at daily averages, this comparison is limited given that the merged product is based on descending overpass observations. The results showed that over moderately vegetated regions, the ECV performed better. On the other hand, better performance was observed in the merged product over densely vegetated regions and regions with sparse vegetation covering. The significant difference in the performances of the two merged products over densely vegetated regions is possibly due to negative correlations in the dense vegetation areas in the ECV comparison with the station datasets. The merging scheme of ECV is based on minimizing mean square error (MSE), which relies on error variances derived from triple collocation [51]. However, MSE-based approaches improve correlations, they are not as sensitive to correlations signs as the approach used in this study is. This becomes very necessary over regions where correlations in satellites products are not very good, as seen in dense vegetation areas. Furthermore, previous studies have reported reduced skill of passive microwave soil moisture over densely vegetated areas [34]. This highlights another important added value of the merged product presented in this study. Analysis of trends in the merged product indicated that regions with wetting trends in the parent retrievals also show wetting trends in the merged product. This also goes for the regions of drying trends. The trend analysis was conducted only to assess the impact of the merging scheme on the trends within the datasets.
A follow-up set of analyses investigated the added value of the FY3B soil moisture product since it is currently absent in widely used merged products such as the ECV soil moisture record. Correlation improvements showed that compared with the commonly used AMSR2 product, the FY3B could serve as an equally viable alternative for reliable soil moisture estimates. A direct comparison of the matched points of the FY3B product, where it contributes more than AMSR2 product, with the ISMN showed that the FY3B contributed to the about 77.1% of these matched points. Additionally, an overall comparison based on Figure 4d, where the number of grid points with a higher contribution (weights) from FY3B, showed that the FY3B contributed at least, 47% to the merged product in that period. This implies that the FY3B product is dependable not just within merging schemes alongside other products but is also dependable in its use to understand soil moisture dynamics on its own. This confirms the findings of previous studies in which FY3B soil moisture was demonstrated to have good skills [30,34,52].
A limitation of this merging approach is that it depends on available paired observations. A lack of this results in missing data. However, this limitation can be considerably reduced by using daily average soil moisture retrievals with both ascending and descending observations as the ECV scheme does.

6. Conclusions

Data merging schemes generally provide platforms to leverage the strengths of the inputs into a single framework where superior attributes are obtained. The limited operational lifespan of various satellites makes it necessary to develop such combination products. Here, an existing correlation-based merging approach has been used to combine six global passive microwave soil moisture retrievals over a long period. The approach maximizes the temporal correlations of the input soil moisture retrievals. Temporal correlation is an important indicator of the merits of satellite soil moisture. Spatially variable weighting factors were first obtained to provide a guide for the merging of normalized soil moisture products. Across the globe, it was observed that the different satellite retrievals had their unique contributions in various climate conditions at different periods. Validation of the final merged product with independent datasets in situ soil moisture measurements showed that the obtained product has a good skill over various vegetation densities. Compared to the ECV passive microwave soil moisture, significant improvements were observed over dense and sparsely vegetated regions. This finding is important because passive microwave soil moisture observations are known to reduce in quality over dense vegetation. Analysis of the trend preservation in the merged product also indicated that the trends in the merged product were similar to the trends in the parent retrievals. In addition to this, soil moisture retrievals from the FengYun-3B satellite, which is absent in other existing merged products was further assessed. The results showed that it possesses comparable skills to the widely used AMSR2, and as such, contributed to the improvements observed in the merged product.
In this study, the combination was performed with two input soil moisture retrievals at a time. Therefore, future studies will explore combining more than two inputs at a time. The impact of temporally dynamic weights will also be considered in such long-term combination schemes.

Supplementary Materials

Author Contributions

Conceptualization, D.F.T.H., G.W. and R.M.P.; data curation, W.U., A.S.B. and X.M.; formal analysis, D.F.T.H., S.K. and Y.L.; investigation, Y.L.; methodology, S.K.; resources, D.F.T.H. and R.M.P.; supervision, G.W. and R.M.P.; writing—original draft, D.F.T.H.; writing—review & editing, G.W., S.K., R.M.P., Y.L., W.U., A.S.B., X.M., T.J. and B.S. All authors have read and agreed to the published version of the manuscript.

Funding

This research was funded by the National Key Research and Development Program of China, Grant Number 2017YFA0603701; the National Natural Science Foundation of China Grant Numbers, 41875094 and 41850410492; and the Sino-German Cooperation Group Project (GZ1447).

Acknowledgments

We are grateful to the teams at the National Aeronautics Space Administration, the European Space Agency, and the European Center for Medium-Range Weather Forecast, the Japan Aerospace Exploration Agency, the National Satellite Meteorological Centre of China and TU Vienna for making their datasets available. We are also very grateful to the 3 anonymous reviewers who provided us with very helpful comments to improve the quality of the study.

Conflicts of Interest

The authors declare no conflicts of interest.

References

  1. Schwingshackl, C.; Hirschi, M.; Seneviratne, S.I. Quantifying Spatiotemporal Variations of Soil Moisture Control on Surface Energy Balance and Near-Surface Air Temperature. J. Clim. 2017, 30, 7105–7124. [Google Scholar] [CrossRef]
  2. Yuan, Q.; Wang, G.; Zhu, C.; Lou, D.; Hagan, D.F.T.; Ma, X.; Zhan, M. Coupling of Soil Moisture and Air Temperature from Multiyear Data During 1980–2013 over China. Atmosphere 2020, 11, 25. [Google Scholar] [CrossRef] [Green Version]
  3. Reager, J.T.; Thomas, A.C.; Sproles, E.A.; Rodell, M.; Beaudoing, H.K.; Li, B.; Famiglietti, J.S. Assimilation of GRACE Terrestrial Water Storage Observations into a Land Surface Model for the Assessment of Regional Flood Potential. Remote Sens. 2015, 7, 14663–14679. [Google Scholar] [CrossRef] [Green Version]
  4. Roundy, J.K.; Wood, E.F. The Attribution of Land–Atmosphere Interactions on the Seasonal Predictability of Drought. J. Hydrometeorol. 2015, 16, 793–810. [Google Scholar] [CrossRef]
  5. Das, N.N.; Andreadis, K.; Ines, A. Monitoring and Forecasting of Seasonal Rice Crop Productivity for Paddy Dominated Regions of India. Int. Arch. Photogramm. Remote Sens. Spat. Inf. Sci. 2019, XLII-3/W6, 201–209. [Google Scholar] [CrossRef] [Green Version]
  6. Zhang, X.; Tang, Q.; Liu, X.; Leng, G.; Li, Z. Soil Moisture Drought Monitoring and Forecasting Using Satellite and Climate Model Data over Southwestern China. J. Hydrometeorol. 2017, 18, 5–23. [Google Scholar] [CrossRef]
  7. Crow, W.T.; Berg, A.A.; Cosh, M.H.; Loew, A.; Mohanty, B.P.; Panciera, R.; de Rosnay, P.; Ryu, D.; Walker, J.P. Upscaling sparse ground-based soil moisture observations for the validation of coarse-resolution satellite soil moisture products. Rev. Geophys. 2012, 50. [Google Scholar] [CrossRef] [Green Version]
  8. Kim, S.; Zhang, R.; Pham, H.; Sharma, A. A Review of Satellite-Derived Soil Moisture and Its Usage for Flood Estimation. Remote Sens. Earth Syst. Sci. 2019, 2, 225–246. [Google Scholar] [CrossRef]
  9. Owe, M.; Jeu, R.d.; Walker, J. A methodology for surface soil moisture and vegetation optical depth retrieval using the microwave polarization difference index. IEEE Trans. Geosci. Remote Sens. 2001, 39, 1643–1654. [Google Scholar] [CrossRef] [Green Version]
  10. Dorigo, W.; Wagner, W.; Albergel, C.; Albrecht, F.; Balsamo, G.; Brocca, L.; Chung, D.; Ertl, M.; Forkel, M.; Gruber, A.; et al. ESA CCI Soil Moisture for improved Earth system understanding: State-of-the art and future directions. Remote Sens. Environ. 2017, 203, 185–215. [Google Scholar] [CrossRef]
  11. Karthikeyan, L.; Pan, M.; Wanders, N.; Kumar, D.N.; Wood, E.F. Four decades of microwave satellite soil moisture observations: Part 1. A review of retrieval algorithms. Adv. Water Resour. 2017, 109, 106–120. [Google Scholar] [CrossRef]
  12. Gruber, A.; Scanlon, T.; van der Schalie, R.; Wagner, W.; Dorigo, W. Evolution of the ESA CCI Soil Moisture climate data records and their underlying merging methodology. Earth Syst. Sci. Data 2019, 11, 717–739. [Google Scholar] [CrossRef] [Green Version]
  13. Beck, H.E.; Pan, M.; Miralles, D.G.; Reichle, R.H.; Dorigo, W.A.; Hahn, S.; Sheffield, J.; Karthikeyan, L.; Balsamo, G.; Parinussa, R.M.; et al. Evaluation of 18 satellite- and model-based soil moisture products using in situ measurements from 826 sensors. Hydrol. Earth Syst. Sci. Discuss. 2020, 2020, 1–35. [Google Scholar] [CrossRef]
  14. Dorigo, W.A.; Gruber, A.; De Jeu, R.A.M.; Wagner, W.; Stacke, T.; Loew, A.; Albergel, C.; Brocca, L.; Chung, D.; Parinussa, R.M.; et al. Evaluation of the ESA CCI soil moisture product using ground-based observations. Remote Sens. Environ. 2015, 162, 380–395. [Google Scholar] [CrossRef]
  15. Karthikeyan, L.; Pan, M.; Wanders, N.; Kumar, D.N.; Wood, E.F. Four decades of microwave satellite soil moisture observations: Part 2. Product validation and inter-satellite comparisons. Adv. Water Resour. 2017, 109, 236–252. [Google Scholar] [CrossRef]
  16. Peng, J.; Niesel, J.; Loew, A.; Zhang, S.; Wang, J. Evaluation of Satellite and Reanalysis Soil Moisture Products over Southwest China Using Ground-Based Measurements. Remote Sens. 2015, 7, 15729–15747. [Google Scholar] [CrossRef] [Green Version]
  17. Ciabatta, L.; Massari, C.; Brocca, L.; Gruber, A.; Reimer, C.; Hahn, S.; Paulik, C.; Dorigo, W.; Kidd, R.; Wagner, W. SM2RAIN-CCI: A new global long-term rainfall data set derived from ESA CCI soil moisture. Earth Syst. Sci. Data 2018, 10, 267–280. [Google Scholar] [CrossRef] [Green Version]
  18. Hirschi, M.; Mueller, B.; Dorigo, W.; Seneviratne, S.I. Using remotely sensed soil moisture for land–atmosphere coupling diagnostics: The role of surface vs. root-zone soil moisture variability. Remote Sens. Environ. 2014, 154, 246–252. [Google Scholar] [CrossRef] [Green Version]
  19. Peng, J.; Loew, A.; Crueger, T. The relationship between the Madden-Julian oscillation and the land surface soil moisture. Remote Sens. Environ. 2017, 203, 226–239. [Google Scholar] [CrossRef]
  20. Zeng, Y.; Su, Z.; Van der Velde, R.; Wang, L.; Xu, K.; Wang, X.; Wen, J. Blending Satellite Observed, Model Simulated, and in Situ Measured Soil Moisture over Tibetan Plateau. Remote Sens. 2016, 8, 268. [Google Scholar] [CrossRef] [Green Version]
  21. Kim, S.; Parinussa, R.M.; Liu, Y.Y.; Johnson, F.M.; Sharma, A. A framework for combining multiple soil moisture retrievals based on maximizing temporal correlation. Geophys. Res. Lett. 2015, 42, 6662–6670. [Google Scholar] [CrossRef]
  22. Kim, S.; Liu, Y.Y.; Johnson, F.M.; Parinussa, R.M.; Sharma, A. A global comparison of alternate AMSR2 soil moisture products: Why do they differ? Remote Sens. Environ. 2015, 161, 43–62. [Google Scholar] [CrossRef]
  23. Kim, S.; Parinussa, R.; Liu, Y.; Johnson, F.; Sharma, A. Merging Alternate Remotely-Sensed Soil Moisture Retrievals Using a Non-Static Model Combination Approach. Remote Sens. 2016, 8, 518. [Google Scholar] [CrossRef] [Green Version]
  24. Hollinger, J.P.; Peirce, J.L.; Poe, G.A. SSM/I instrument evaluation. IEEE Trans. Geosci. Remote Sens. 1990, 28, 781–790. [Google Scholar] [CrossRef]
  25. Lei, F.; Crow, W.T.; Shen, H.; Parinussa, R.M.; Holmes, T.R.H. The Impact of Local Acquisition Time on the Accuracy of Microwave Surface Soil Moisture Retrievals over the Contiguous United States. Remote Sens. 2015, 7, 13448–13465. [Google Scholar] [CrossRef] [Green Version]
  26. Hagan, D.F.T.; Parinussa, R.M.; Wang, G.; Draper, C. An Evaluation of Soil Moisture Anomalies from Global Model-Based Datasets over the People’s Republic of China. Water 2020, 12, 117. [Google Scholar] [CrossRef] [Green Version]
  27. Owe, M.; de Jeu, R.; Holmes, T. Multisensor historical climatology of satellite-derived global land surface moisture. J. Geophys. Res.: Earth Surf. 2008, 113. [Google Scholar] [CrossRef]
  28. Parinussa, R.M.; Holmes, T.R.H.; Jeu, R.A.M.d. Soil Moisture Retrievals from the WindSat Spaceborne Polarimetric Microwave Radiometer. IEEE Trans. Geosci. Remote Sens. 2012, 50, 2683–2694. [Google Scholar] [CrossRef]
  29. Parinussa, R.M.; Holmes, T.R.H.; Wanders, N.; Dorigo, W.A.; Jeu, R.A.M.d. A Preliminary Study toward Consistent Soil Moisture from AMSR2. J. Hydrometeorol. 2015, 16, 932–947. [Google Scholar] [CrossRef]
  30. Parinussa, R.M.; Wang, G.; Holmes, T.R.H.; Liu, Y.Y.; Dolman, A.J.; de Jeu, R.A.M.; Jiang, T.; Zhang, P.; Shi, J. Global surface soil moisture from the Microwave Radiation Imager onboard the Fengyun-3B satellite. Int. J. Remote Sens. 2014, 35, 7007–7029. [Google Scholar] [CrossRef]
  31. Albergel, C.; Dutra, E.; Munier, S.; Calvet, J.C.; Munoz-Sabater, J.; de Rosnay, P.; Balsamo, G. ERA-5 and ERA-Interim driven ISBA land surface model simulations: Which one performs better? Hydrol. Earth Syst. Sci. 2018, 22, 3515–3532. [Google Scholar] [CrossRef] [Green Version]
  32. Li, M.; Wu, P.; Ma, Z. A comprehensive evaluation of soil moisture and soil temperature from third-generation atmospheric and land reanalysis data sets. Int. J. Climatol. 2020, 2020. [Google Scholar] [CrossRef]
  33. Dorigo, W.A.; Xaver, A.; Vreugdenhil, M.; Gruber, A.; Hegyiová, A.; Sanchis-Dufau, A.D.; Zamojski, D.; Cordes, C.; Wagner, W.; Drusch, M. Global Automated Quality Control of In Situ Soil Moisture Data from the International Soil Moisture Network. Vadose Zone J. 2013, 12, vzj2012.0097. [Google Scholar] [CrossRef]
  34. Parinussa, R.; Wang, G.; Liu, Y.; Hagan, D.; Lin, F.; van der Schalie, R.; de Jeu, R. The Evaluation of Single-Sensor Surface Soil Moisture Anomalies over the Mainland of the People’s Republic of China. Remote Sens. 2017, 9, 149. [Google Scholar] [CrossRef] [Green Version]
  35. van der Schalie, R.; de Jeu, R.A.M.; Kerr, Y.H.; Wigneron, J.P.; Rodríguez-Fernández, N.J.; Al-Yaari, A.; Parinussa, R.M.; Mecklenburg, S.; Drusch, M. The merging of radiative transfer based surface soil moisture data from SMOS and AMSR-E. Remote Sens. Environ. 2017, 189, 180–193. [Google Scholar] [CrossRef]
  36. de Jeu, R.A.M.; Wagner, W.; Holmes, T.R.H.; Dolman, A.J.; van de Giesen, N.C.; Friesen, J. Global Soil Moisture Patterns Observed by Space Borne Microwave Radiometers and Scatterometers. Surv. Geophys. 2008, 29, 399–420. [Google Scholar] [CrossRef] [Green Version]
  37. Bates, J.M.; Granger, C.W.J. The Combination of Forecasts. J. Oper. Res. Soc. 1969, 20, 451–468. [Google Scholar] [CrossRef]
  38. Granger, C.W.J.; Ramanathan, R. Improved methods of combining forecasts. J. Forecast. 1984, 3, 197–204. [Google Scholar] [CrossRef]
  39. Wasko, C.; Sharma, A.; Rasmussen, P. Improved spatial prediction: A combinatorial approach. Water Resour. Res. 2013, 49, 3927–3935. [Google Scholar] [CrossRef]
  40. Liu, Y.Y.; Parinussa, R.M.; Dorigo, W.A.; de Jeu, R.A.M.; Wagner, W.; van Dijk, A.I.J.M.; McCabe, M.F.; Evans, J.P. Developing an improved soil moisture dataset by blending passive and active microwave satellite-based retrievals. Hydrol. Earth Syst. Sci. 2011, 15, 425–436. [Google Scholar] [CrossRef] [Green Version]
  41. Reichle, R.H.; Koster, R.D.; Dong, J.; Berg, A.A. Global Soil Moisture from Satellite Observations, Land Surface Models, and Ground Data: Implications for Data Assimilation. J. Hydrometeorol. 2004, 5, 430–442. [Google Scholar] [CrossRef]
  42. Yilmaz, M.T.; Crow, W.T. The Optimality of Potential Rescaling Approaches in Land Data Assimilation. J. Hydrometeorol. 2013, 14, 650–660. [Google Scholar] [CrossRef]
  43. Draper, C.S.; Walker, J.P.; Steinle, P.J.; de Jeu, R.A.M.; Holmes, T.R.H. An evaluation of AMSR–E derived soil moisture over Australia. Remote Sens. Environ. 2009, 113, 703–710. [Google Scholar] [CrossRef]
  44. Mladenova, I.E.; Jackson, T.J.; Njoku, E.; Bindlish, R.; Chan, S.; Cosh, M.H.; Holmes, T.R.H.; de Jeu, R.A.M.; Jones, L.; Kimball, J.; et al. Remote monitoring of soil moisture using passive microwave-based techniques—Theoretical basis and overview of selected algorithms for AMSR-E. Remote Sens. Environ. 2014, 144, 197–213. [Google Scholar] [CrossRef]
  45. Song, P.; Huang, J.; Mansaray, L.R.; Wen, H.; Wu, H.; Liu, Z.; Wang, X. An Improved Soil Moisture Retrieval Algorithm Based on the Land Parameter Retrieval Model for Water–Land Mixed Pixels Using AMSR-E Data. IEEE Trans. Geosci. Remote Sens. 2019, 57, 7643–7657. [Google Scholar] [CrossRef]
  46. Liu, Y.Y.; Dorigo, W.A.; Parinussa, R.M.; de Jeu, R.A.M.; Wagner, W.; McCabe, M.F.; Evans, J.P.; van Dijk, A.I.J.M. Trend-preserving blending of passive and active microwave soil moisture retrievals. Remote Sens. Environ. 2012, 123, 280–297. [Google Scholar] [CrossRef]
  47. Njoku, E.G.; Ashcroft, P.; Chan, T.K.; Li, L. Global survey and statistics of radio-frequency interference in AMSR-E land observations. IEEE Trans. Geosci. Remote Sens. 2005, 43, 938–947. [Google Scholar] [CrossRef]
  48. Bhatti, A.S.; Wang, G.; Ullah, W.; Ullah, S.; Fiifi Tawia Hagan, D.; Kwesi Nooni, I.; Lou, D.; Ullah, I. Trend in Extreme Precipitation Indices Based on Long Term In Situ Precipitation Records over Pakistan. Water 2020, 12, 797. [Google Scholar] [CrossRef] [Green Version]
  49. Wang, G.; Shen, C.; Pan, J.; Lou, D.; Hagan, D.F.T.; Parinussa, R.M.; Zhan, M.; Su, B.; Jiang, T. Analysis of the long-term high-resolution infrared radiation sounder land surface temperature against ground measurements during 1980–2009 in the Poyang Lake basin, China. Int. J. Climatol. 2018, 38, 5733–5745. [Google Scholar] [CrossRef]
  50. Wang, G.; Hagan, D.F.T.; Lou, D.; Chen, T. Evaluation of soil moisture derived from FY3B microwave brightness temperature over the Tibetan Plateau. Remote Sens. Lett. 2016, 7, 817–826. [Google Scholar] [CrossRef]
  51. Gruber, A.; Dorigo, W.A.; Crow, W.; Wagner, W. Triple Collocation-Based Merging of Satellite Soil Moisture Retrievals. IEEE Trans. Geosci. Remote Sens. 2017, 55, 6780–6792. [Google Scholar] [CrossRef]
  52. Parinussa, R.M.; Wang, G.; Liu, Y.; Lou, D.; Hagan, D.F.T.; Zhan, M.; Su, B.; Jiang, T. Improved surface soil moisture anomalies from Fengyun-3B over the Jiangxi province of the People’s Republic of China. Int. J. Remote Sens. 2018, 39, 8950–8962. [Google Scholar] [CrossRef]
Figure 1. (a) Overview of the number of International Soil Moisture Network (ISMN) soil moisture stations and (b) average duration of stations per network used in the study after quality controls were applied.
Remotesensing 12 02164 g001
Figure 2. (a) Comparison of a selected time–series (LON: 81.25°E, LAT: 40.65°N) to investigate the impact of the normalization process on the satellite products. Here, the time series is chosen from AMSR-E; (b) difference between standard deviations of the original advanced microwave scanning radiometer-earth observing system (AMSR-E) and normalized AMSR-E global soil moisture observations. Red color shows higher values in the original product and blue color shows higher amplitudes in the normalized product.
Remotesensing 12 02164 g002
Figure 3. Relative contributions of the individual satellite observations in the merging scheme for (a) time period 1, (b) time period 2, (c) time period 3 and (d) time period 4. Colors show where more weight in each period is from either of the satellite observations.
Remotesensing 12 02164 g003
Figure 4. Evaluation of improvements within the merged product based on differences in (a) correlation coefficients and (b) unbiased root mean square difference (ubRMSD) with the parent products relative to the International Soil Moisture Network (ISMN) datasets. Positive (+) values indicate higher qualities in the merged while negative (-) values indicate higher qualities in the parent products.
Remotesensing 12 02164 g004
Figure 5. Detailed (a) correlation and (b) ubRMSD results showing the performance of the merged product over the different continents.
Remotesensing 12 02164 g005
Figure 6. Evaluation over different vegetation densities (NDVI) of the merged product based (a) correlations and ubRMSD with the ISMN soil moisture measurements and (b) the differences between the correlations and ubRMSD with the in situ soil moisture and merged product and essential climate variable soil moisture (ECV). Positive values indicate higher correlations and smaller errors in the merged product, while negative values imply the same for ECV.
Remotesensing 12 02164 g006
Figure 7. Relationship between long-term trends (change in soil moisture per year) of the merged product for time period 2 and the long term changes in soil moisture of (a) WindSat and (b) AMSR-E over time.
Remotesensing 12 02164 g007
Figure 8. Contributions (change in correlation coefficients-either improvements or deterioration) of (a) the Advanced Microwave Scanning Radiometer 2 (AMSR2) and (b) Fengyun-3B (FY3B) in the merging scheme relative to verifications based on the in situ datasets. Blue points show improvements and red points show deteriorations.
Remotesensing 12 02164 g008
Table 1. Summary of passive microwave sensors used (the frequencies used are those with *).
PMWFrequency for Soil Moisture Retrieval (GHz)Data Period UsedDescending OrbitReference
DMSP SSM/I19.4 *Jan 1998–Jan 200306:30 AMOwe et al. [27]
TRMM/TMI6.9, 10.7 *Jan 1998–Jan 2003VariesOwe et al. [27]
AMSR-E6.9, 10.7 *Feb 2003–Sep 201101:30 AMOwe et al. [27]
WindSAT6.9, 10.7 *Feb 2003–Jun 201206:30 AMParinussa et al. [28]
AMSR26.9, 7.3, 10.7 *Jul 2012–Dec 201501:30 AMParinussa et al. [29]
FengYun-3B10.7 *Jun 2011–Dec 201501:40 AMParinussa et al. [30]
Table 2. Time Periods for the merging of the different products.
Time Period 1
Jan 1998–Jan 2003
Time Period 2
Feb 2003–Sep 2011
Time Period 3
Oct 2011–Jun 2012
Time Period 4
Jul 2012–Dec 2015
Parent Product 1TRMMAMSR-EFengyun 3BAMSR2
Parent Product 2SSM/IWindSatWindSatFengYun3B
ReferenceERA5 soil moisture

