The UAS-Based 3D Image Characterization of Mozarabic Church Ruins in Bobastro (Malaga), Spain

 , ,
, ,
Abstract
:
1. Introduction
2. Materials
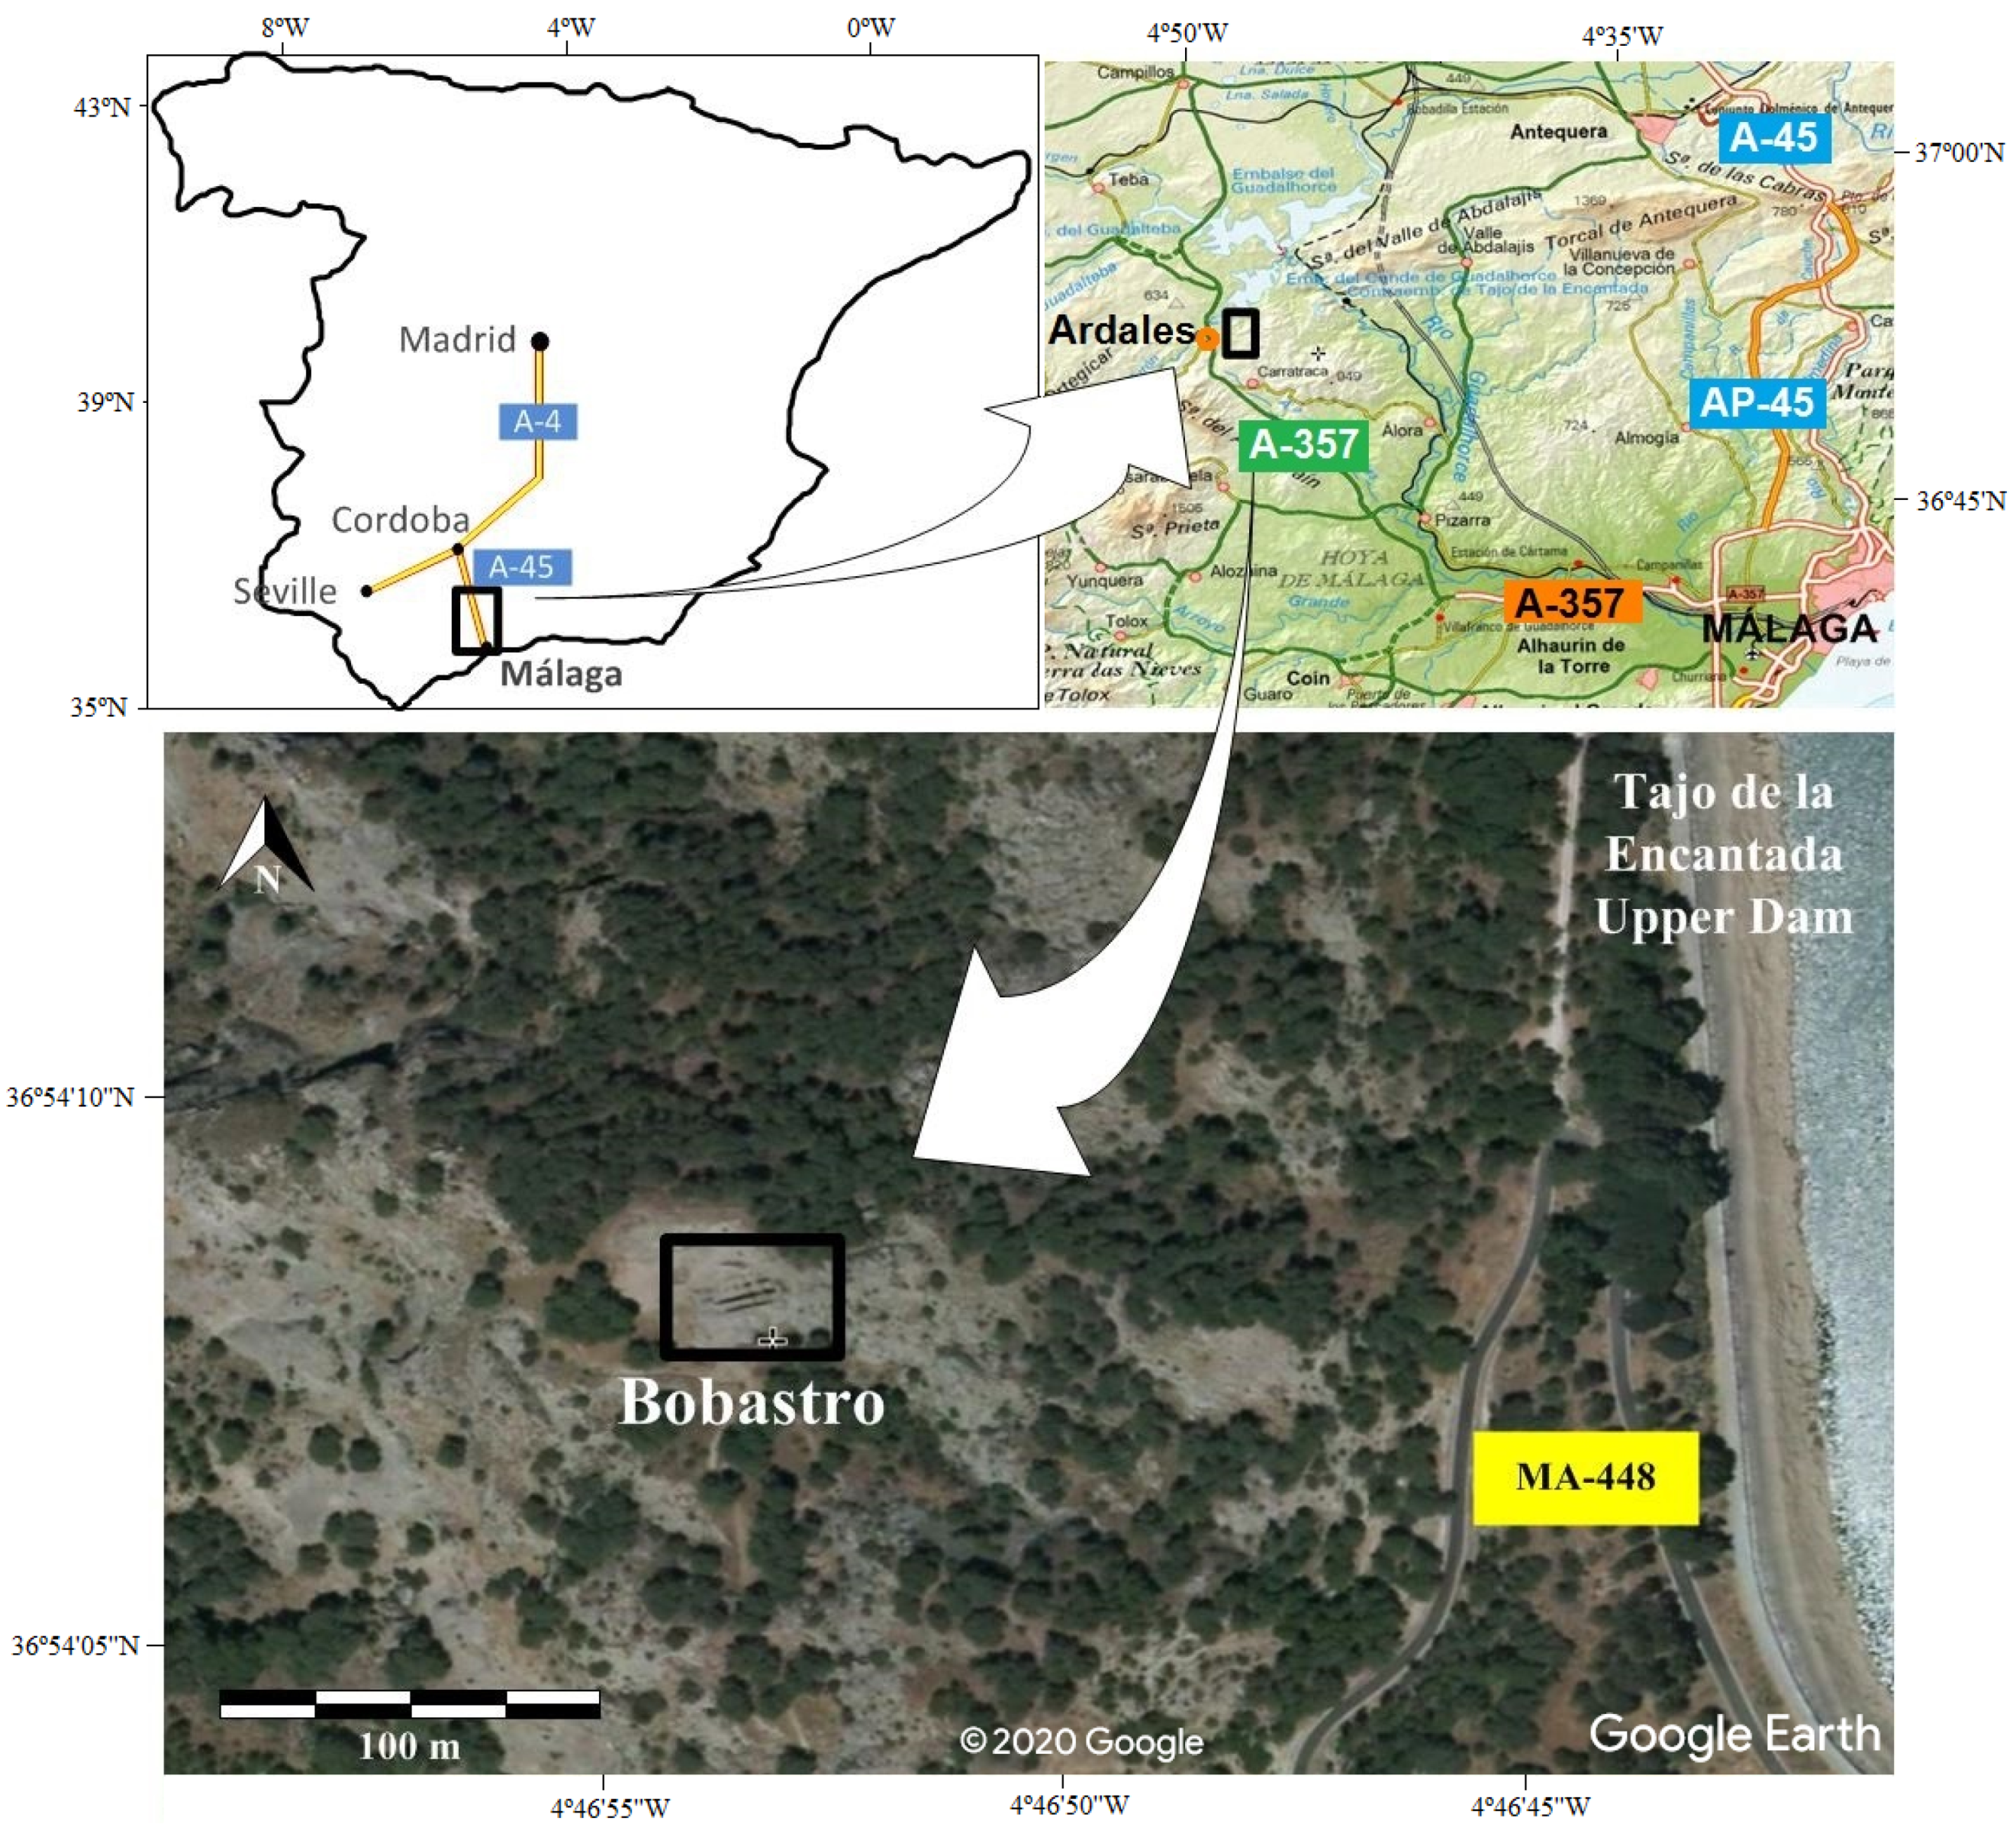
2.1. Study Area
2.2. UAS-Based and Field Data
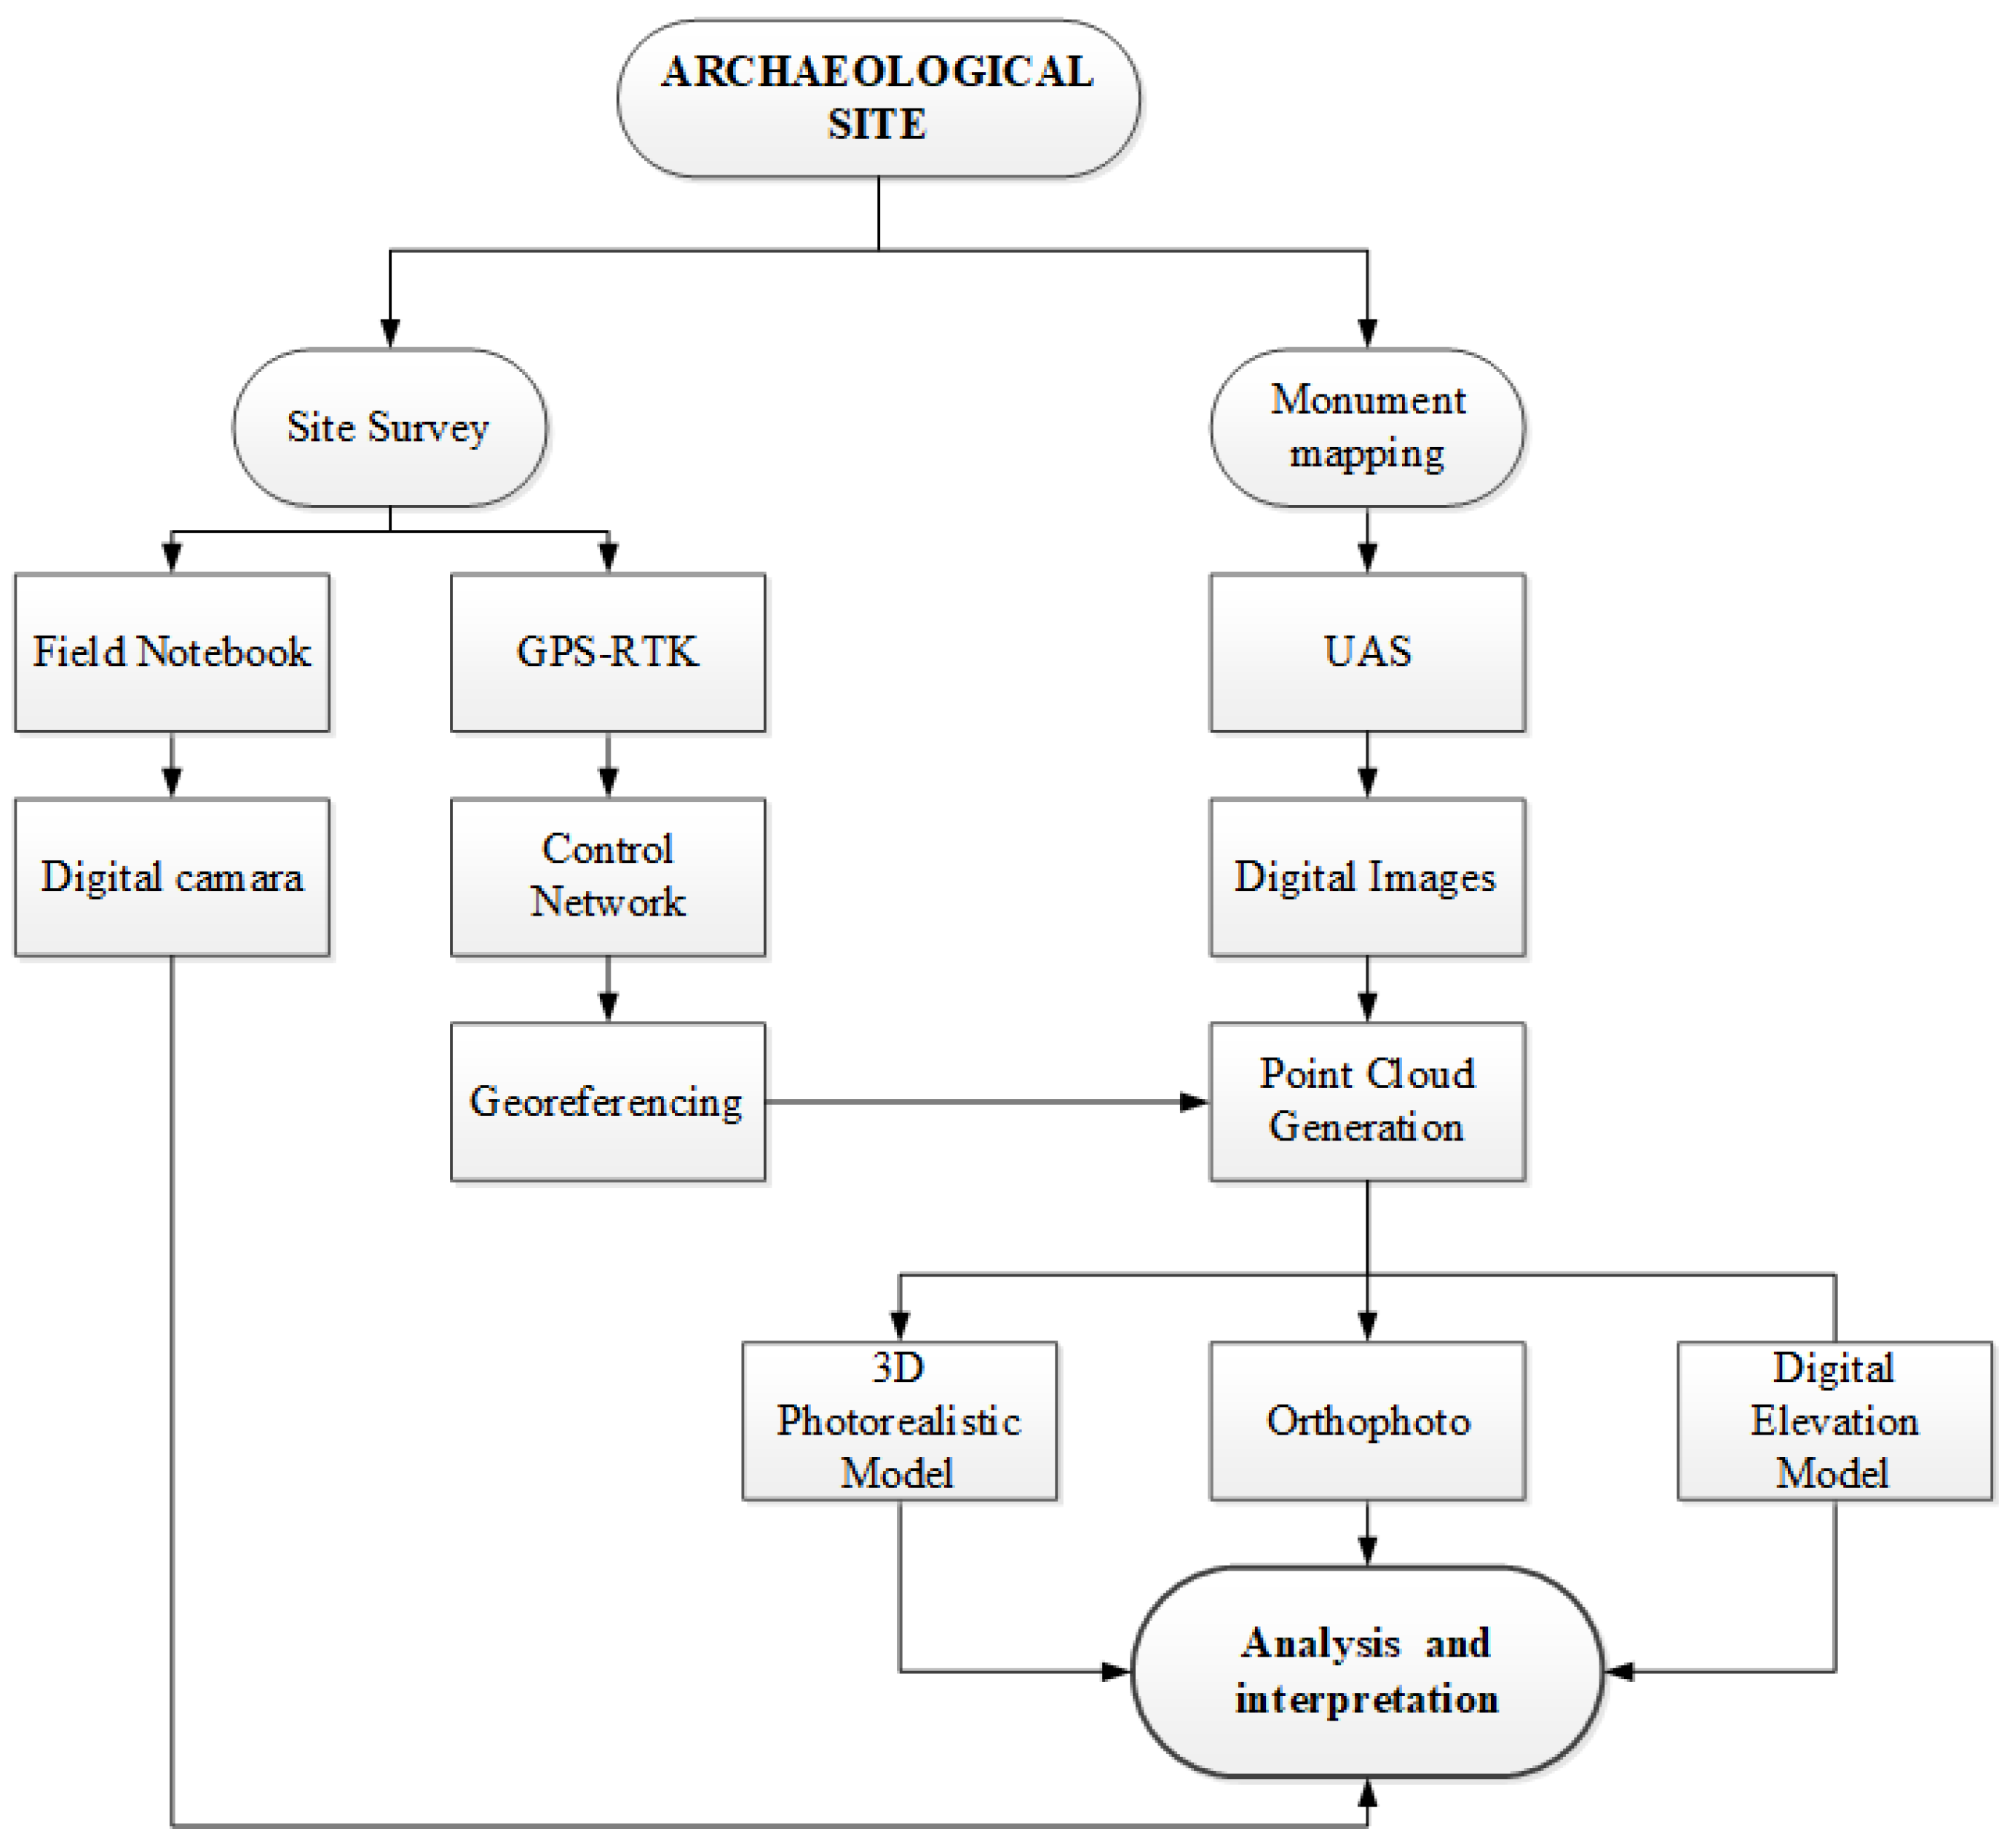
3. Methods
3.1. Getting Data
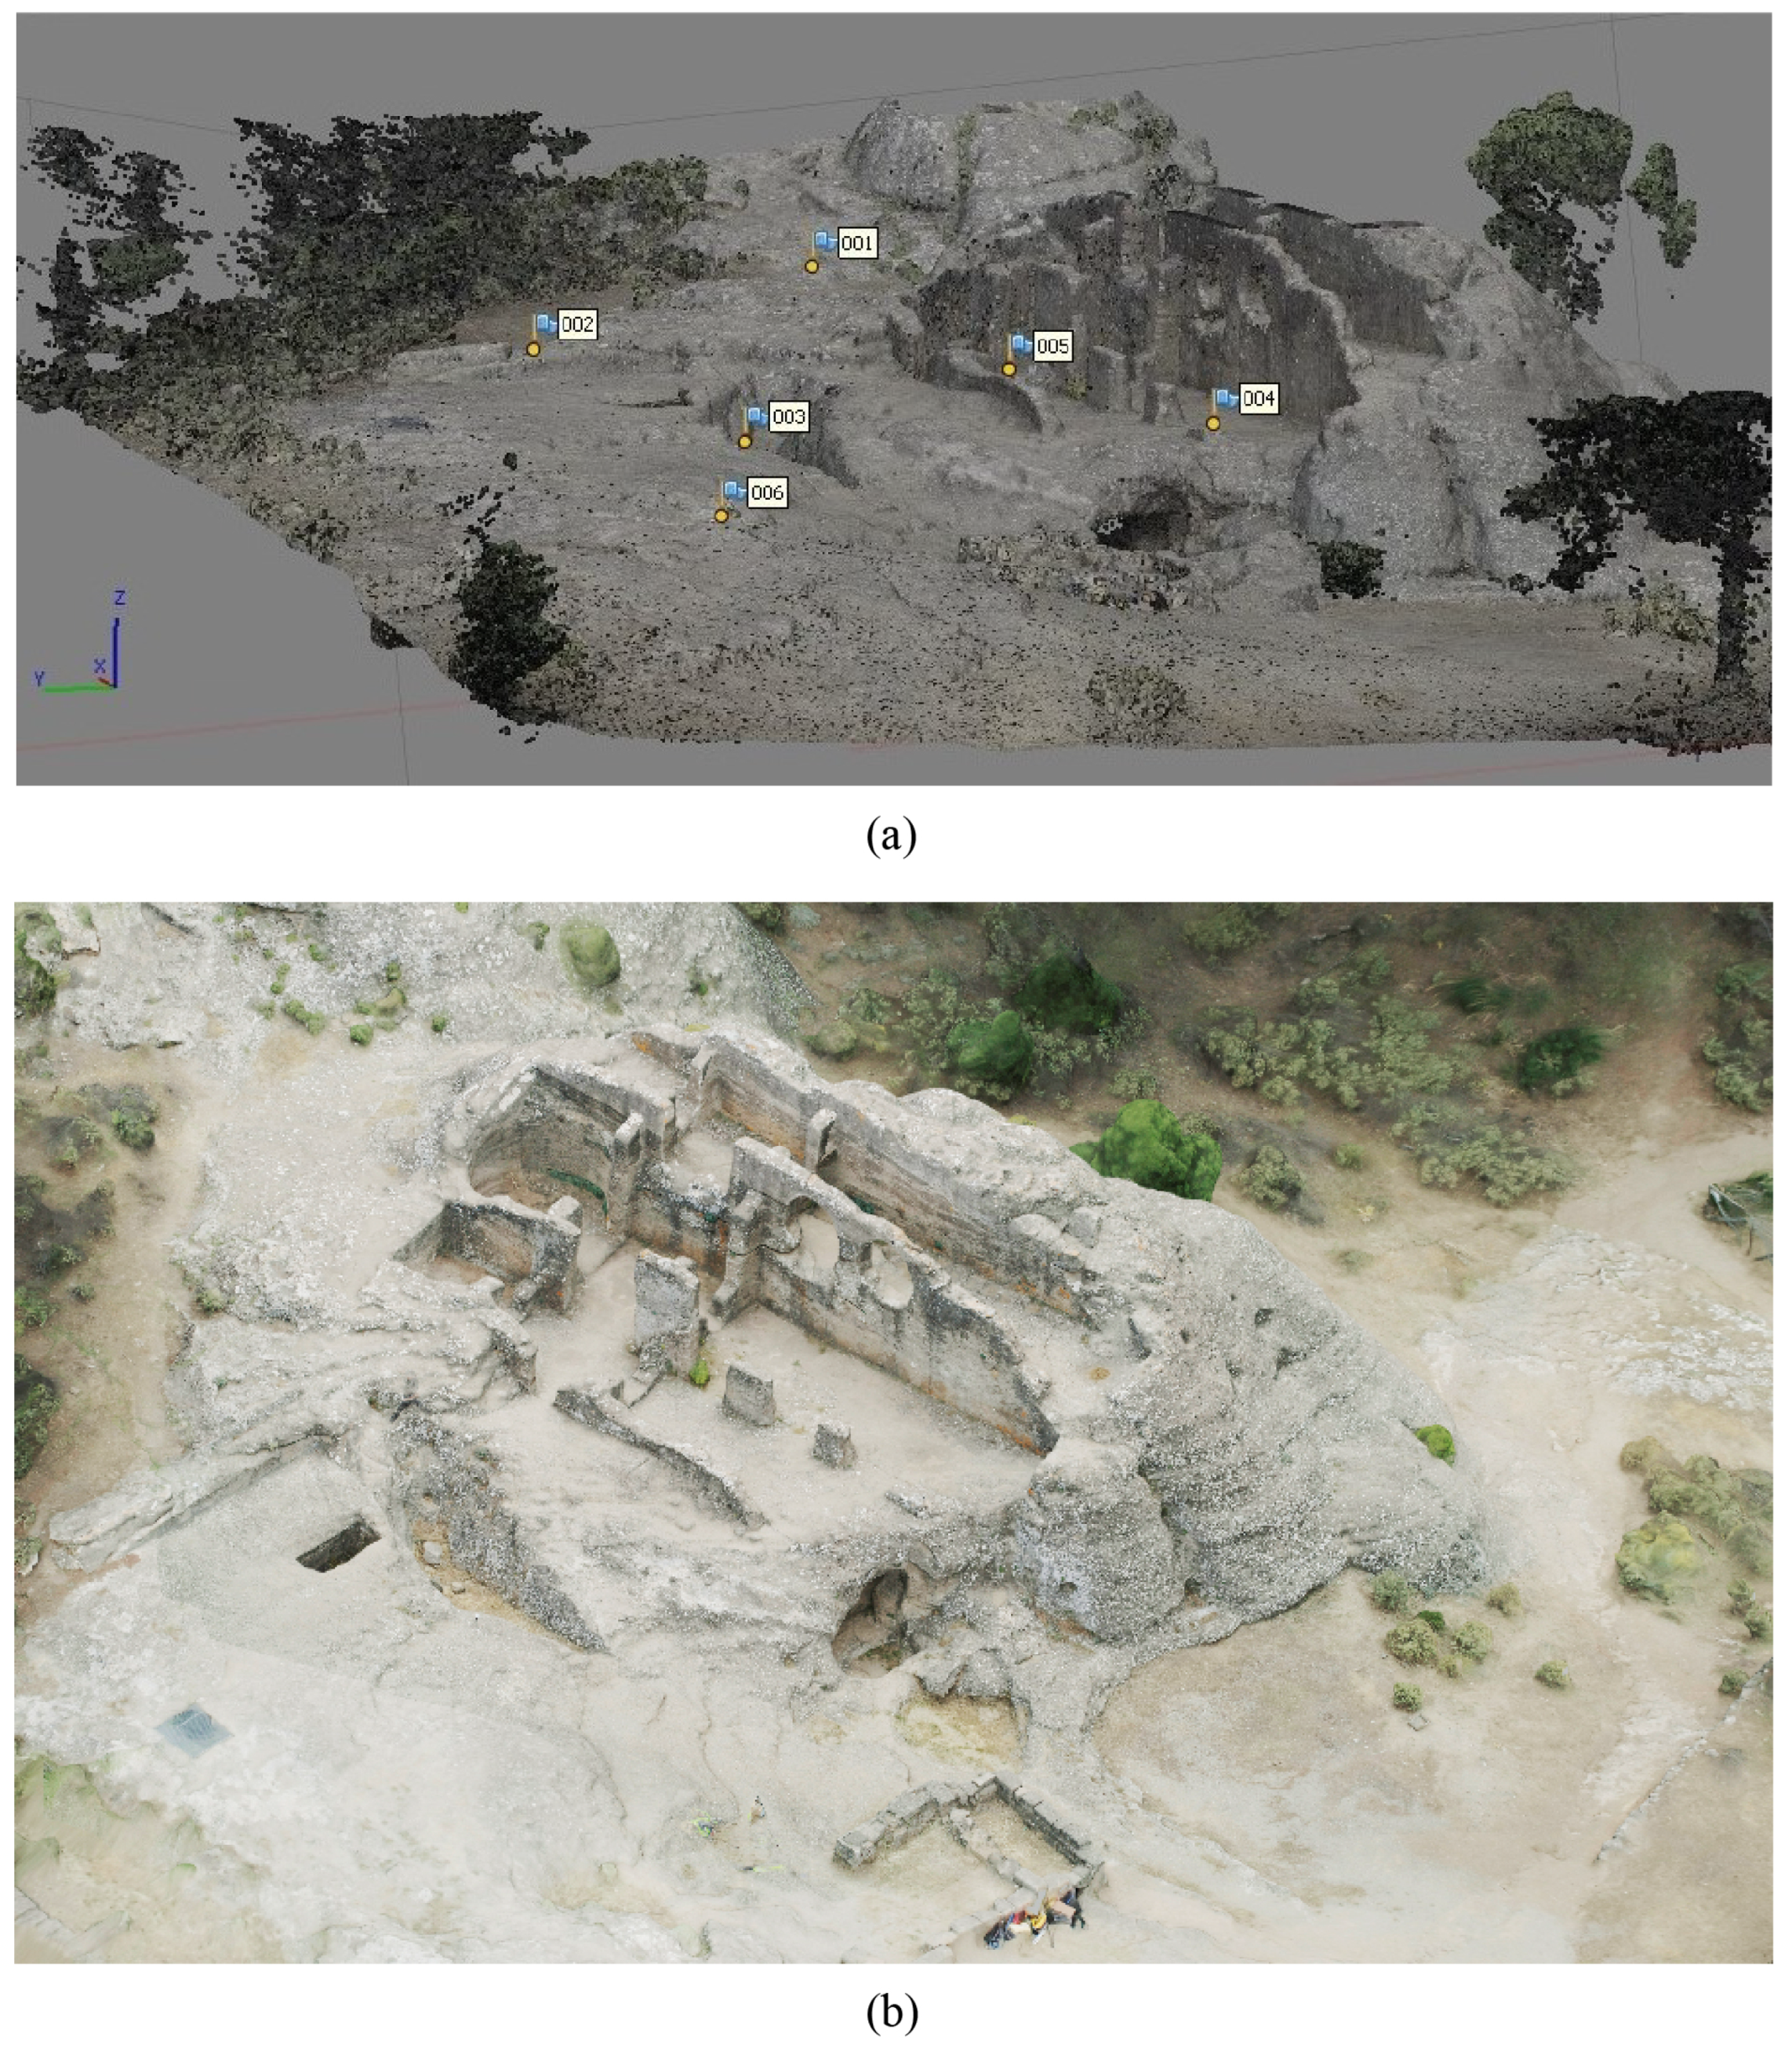
3.2. Ground Control Point: GNSS Measurements
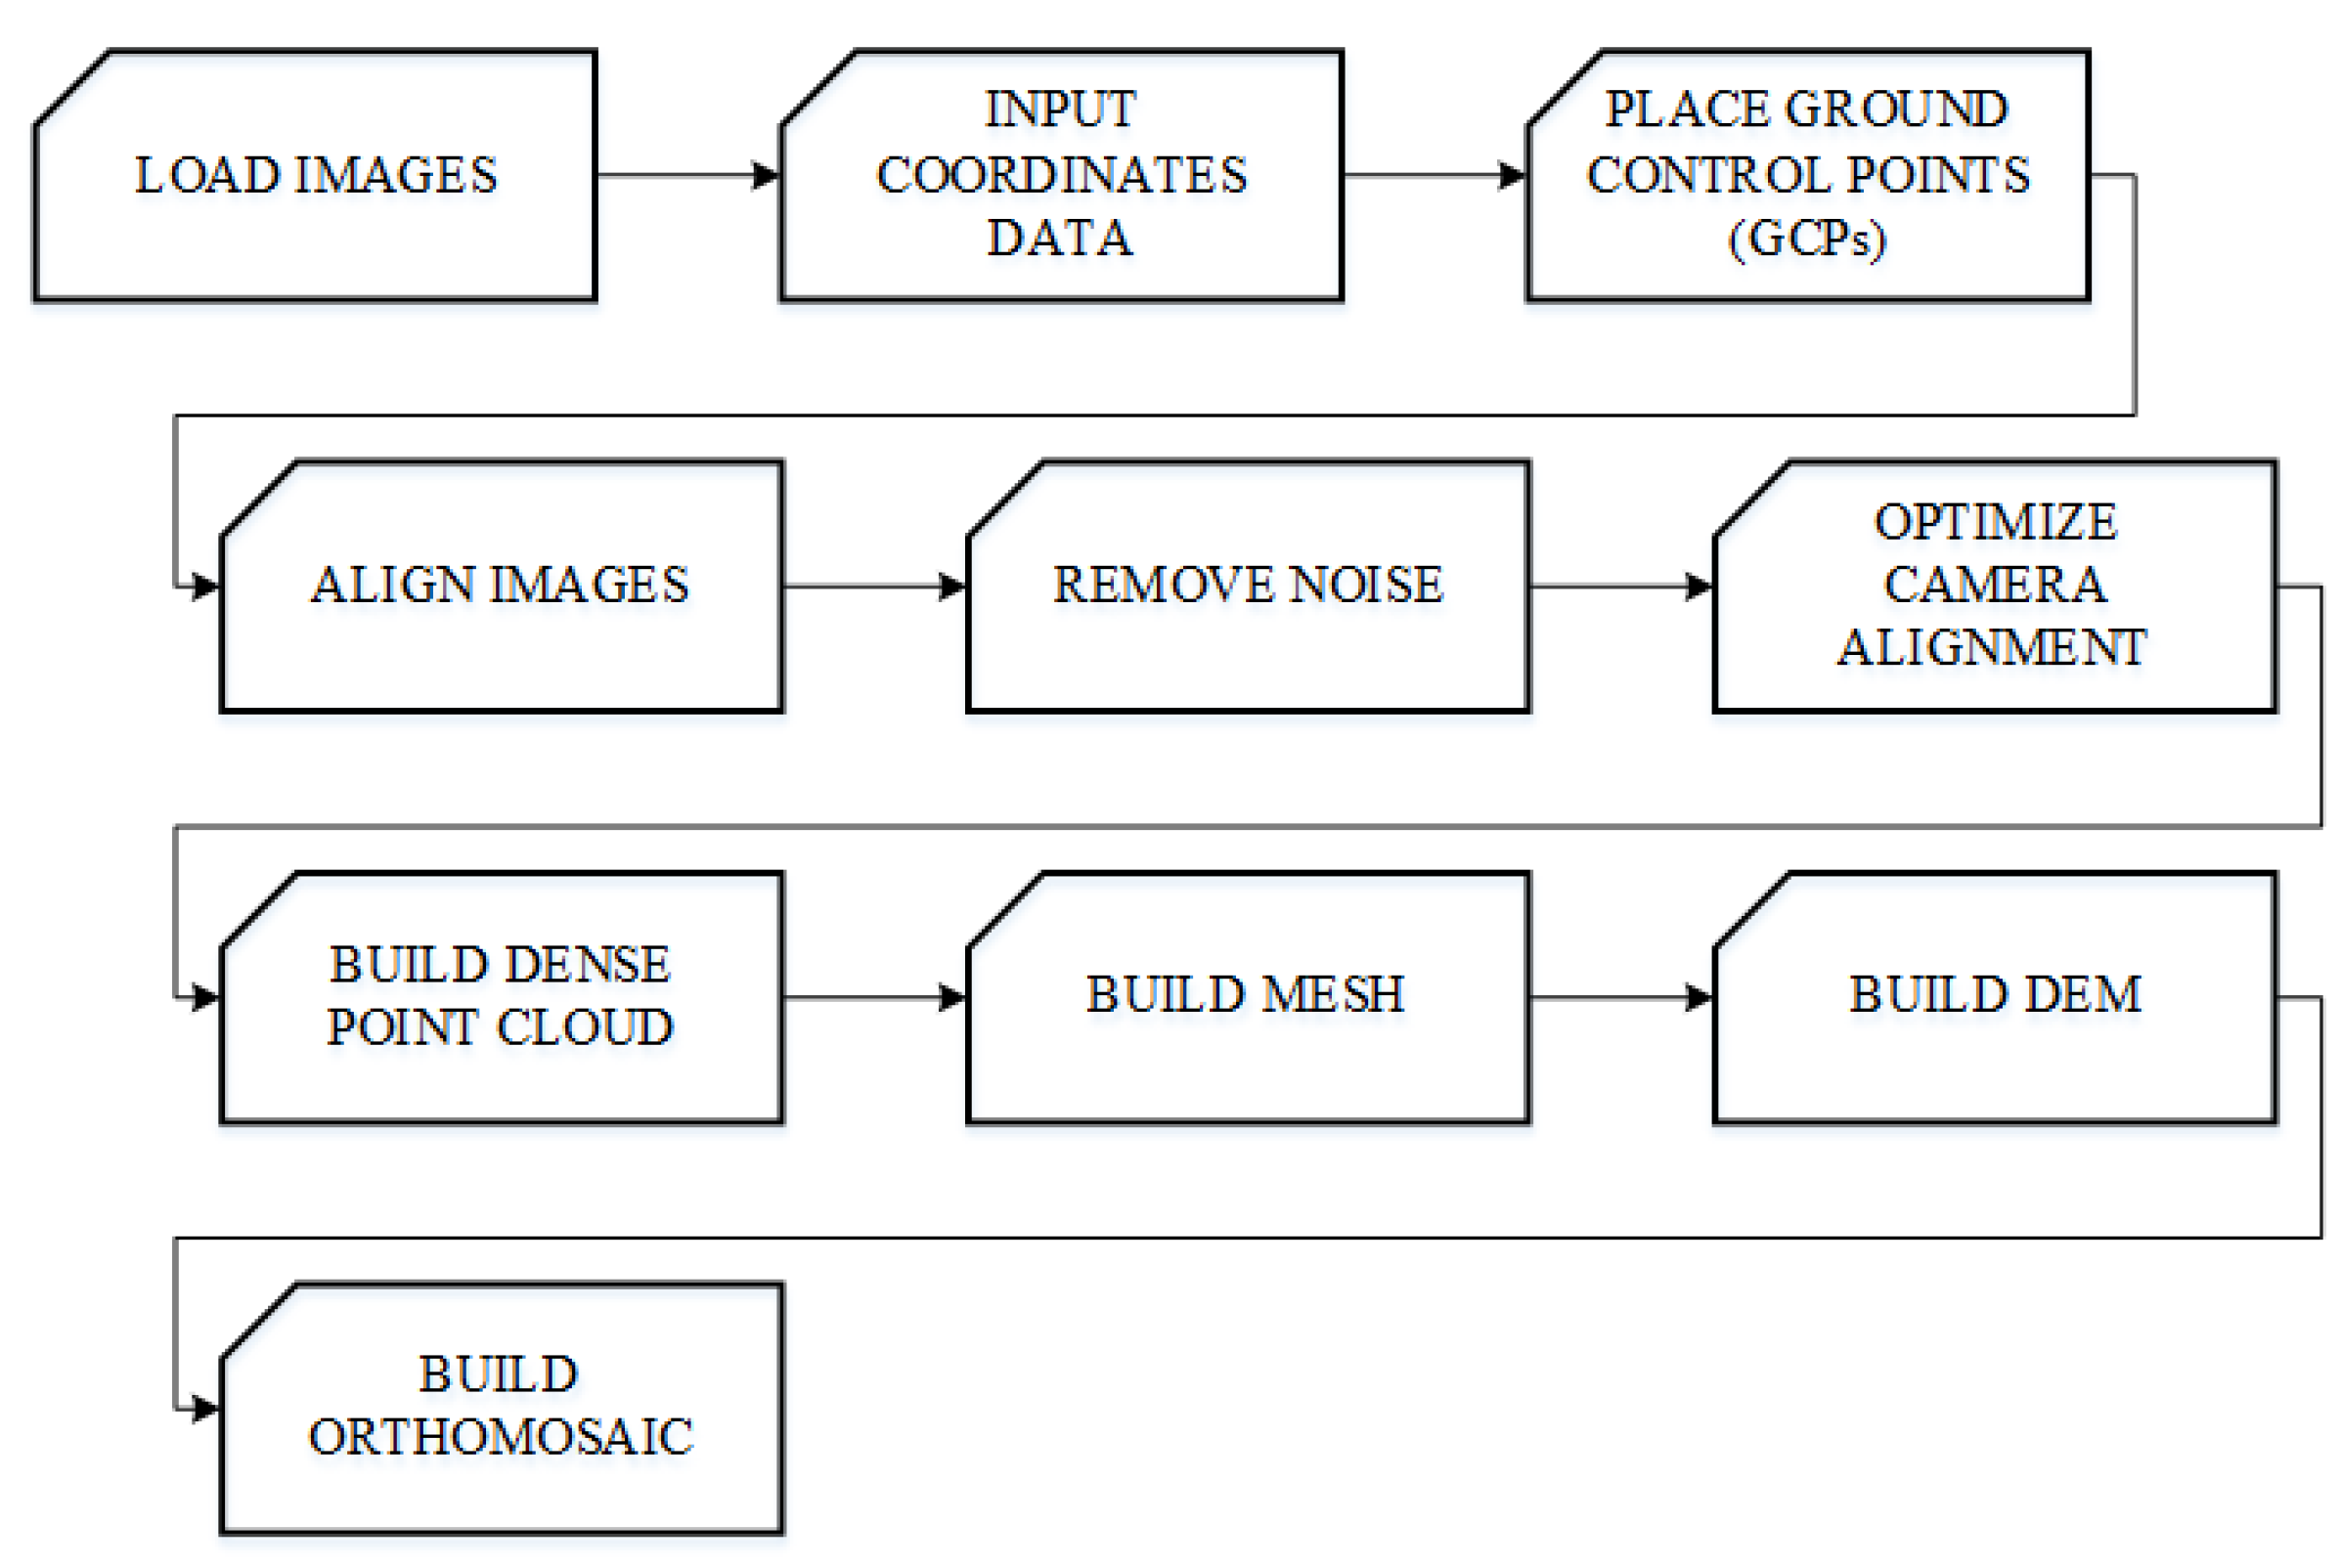
3.3. Point Cloud Reconstruction
- Loading images into Metashape: Before starting any operation, it is necessary to point out which images will be used as a source for photogrammetric processing. After inspecting loaded images, the unnecessary ones are removed.
- Input coordinate data: To reference the model, coordinates of at least three points on the scene should be specified.
- Identify GCPs in the images: This step will be useful if the alignment process fails.
- Aligning images: Once photos are loaded, Metashape needs to find common elements in two different images. This process is done automatically; however, if it fails you will have to do it manually, setting markers (at least 4 per photo) in these photos and indicating their projections on at least two photos from the already aligned subset. At that point, it is always a good idea to use GCPs as a markers wherever it is possible.
- Remove noise: To remove undesired data, like people or vegetation, the data must be cleaned and filtered. In addition, spurious data can be removed after the point cloud registration, if they may prove useful for registration in the absence of good overlaps, or if there is little ground control. To do so, first non-static objects during the data acquisition process should be removed from the images. Secondly, after the alignment is done and the sparse point cloud creates mislocated points, they should be deleted. As a tourist area, the ruins are visited by many people, which means there were visitors going back and forth during the survey. Therefore, we had to remove a large number of ‘ghost images’ in the images, before the point cloud generation. Nevertheless, the generated point cloud had a large amount of noise caused by the traffic of the people who were wandering about. It was necessary to perform an automatic cleaning of the point cloud by statistical filters to eliminate ‘out layers’.
- Optimizing camera alignment: Possible nonlinear deformations of the model can be removed by optimizing the estimated point cloud and camera parameters based on the known reference coordinates. During this optimization, Metashape adjusts estimated point coordinates and camera parameters minimizing the sum of reprojection errors and reference coordinate misalignment errors [22].
- Building a dense point cloud: Based on the estimated camera positions, Metashape calculates depth information for each camera to be combined into a single dense point cloud.
- Building mesh (3D polygonal model): After a dense point cloud has been reconstructed, it is possible to generate a polygonal mesh model based on the dense cloud data.
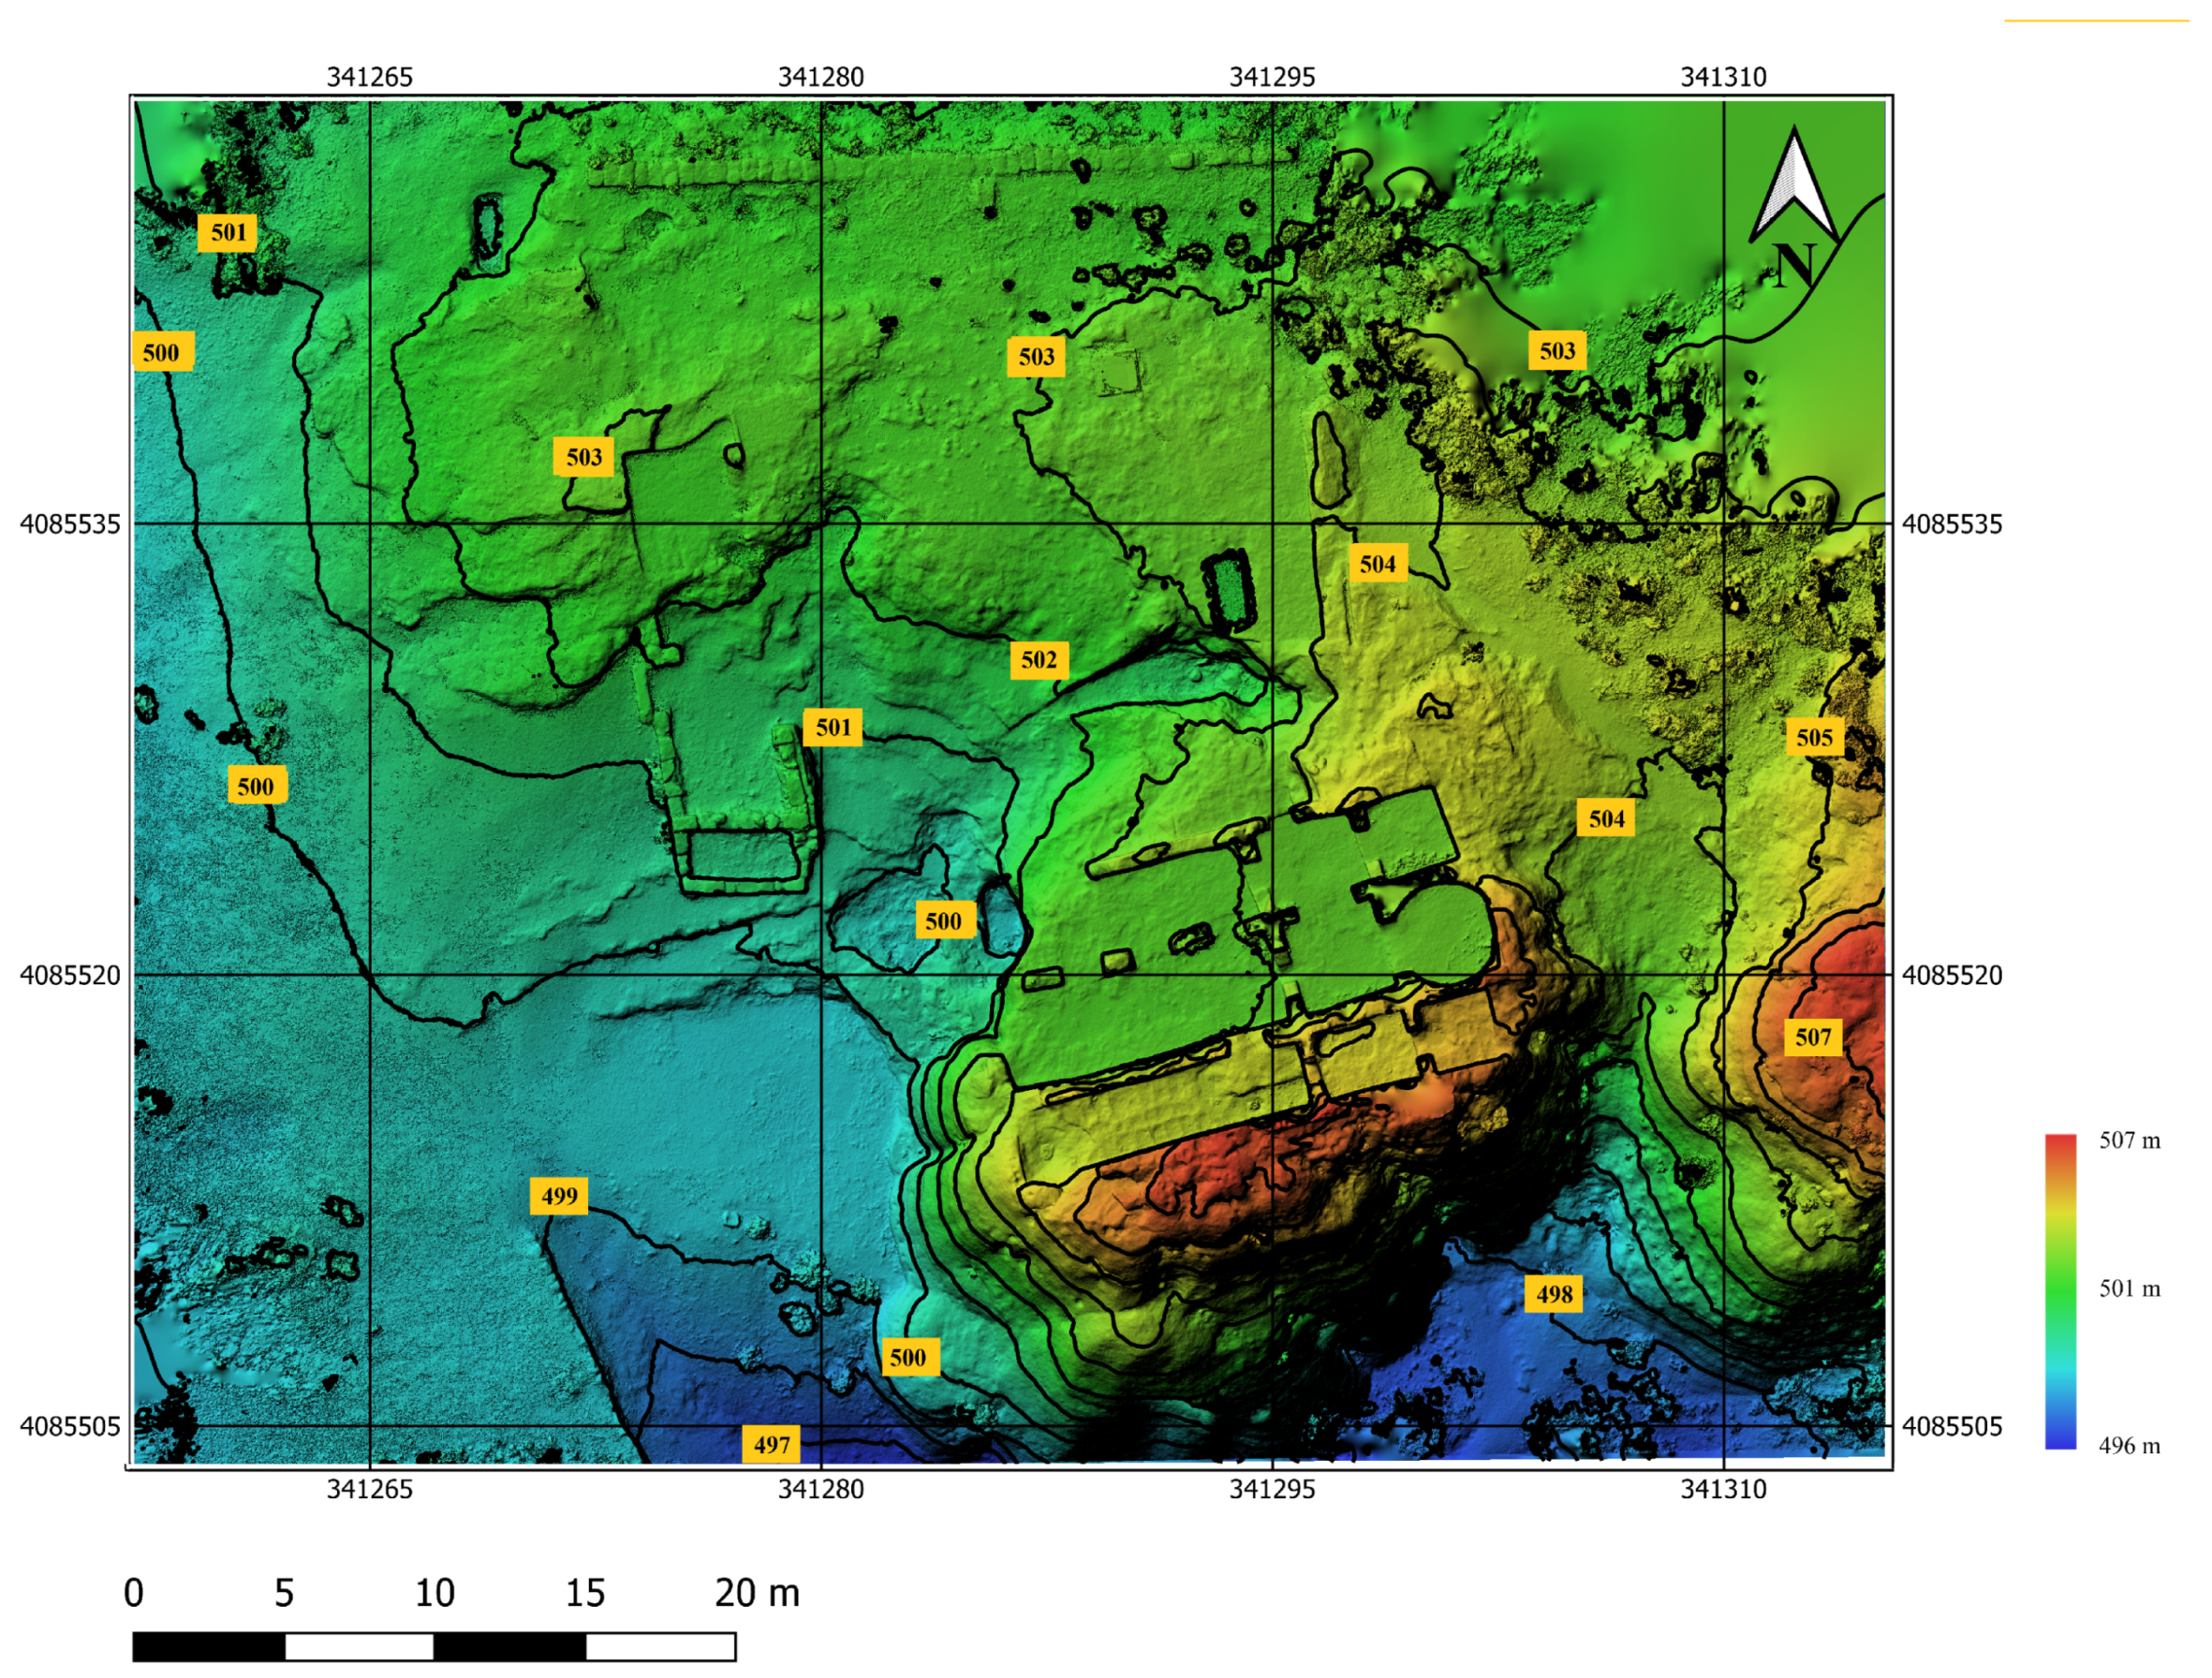
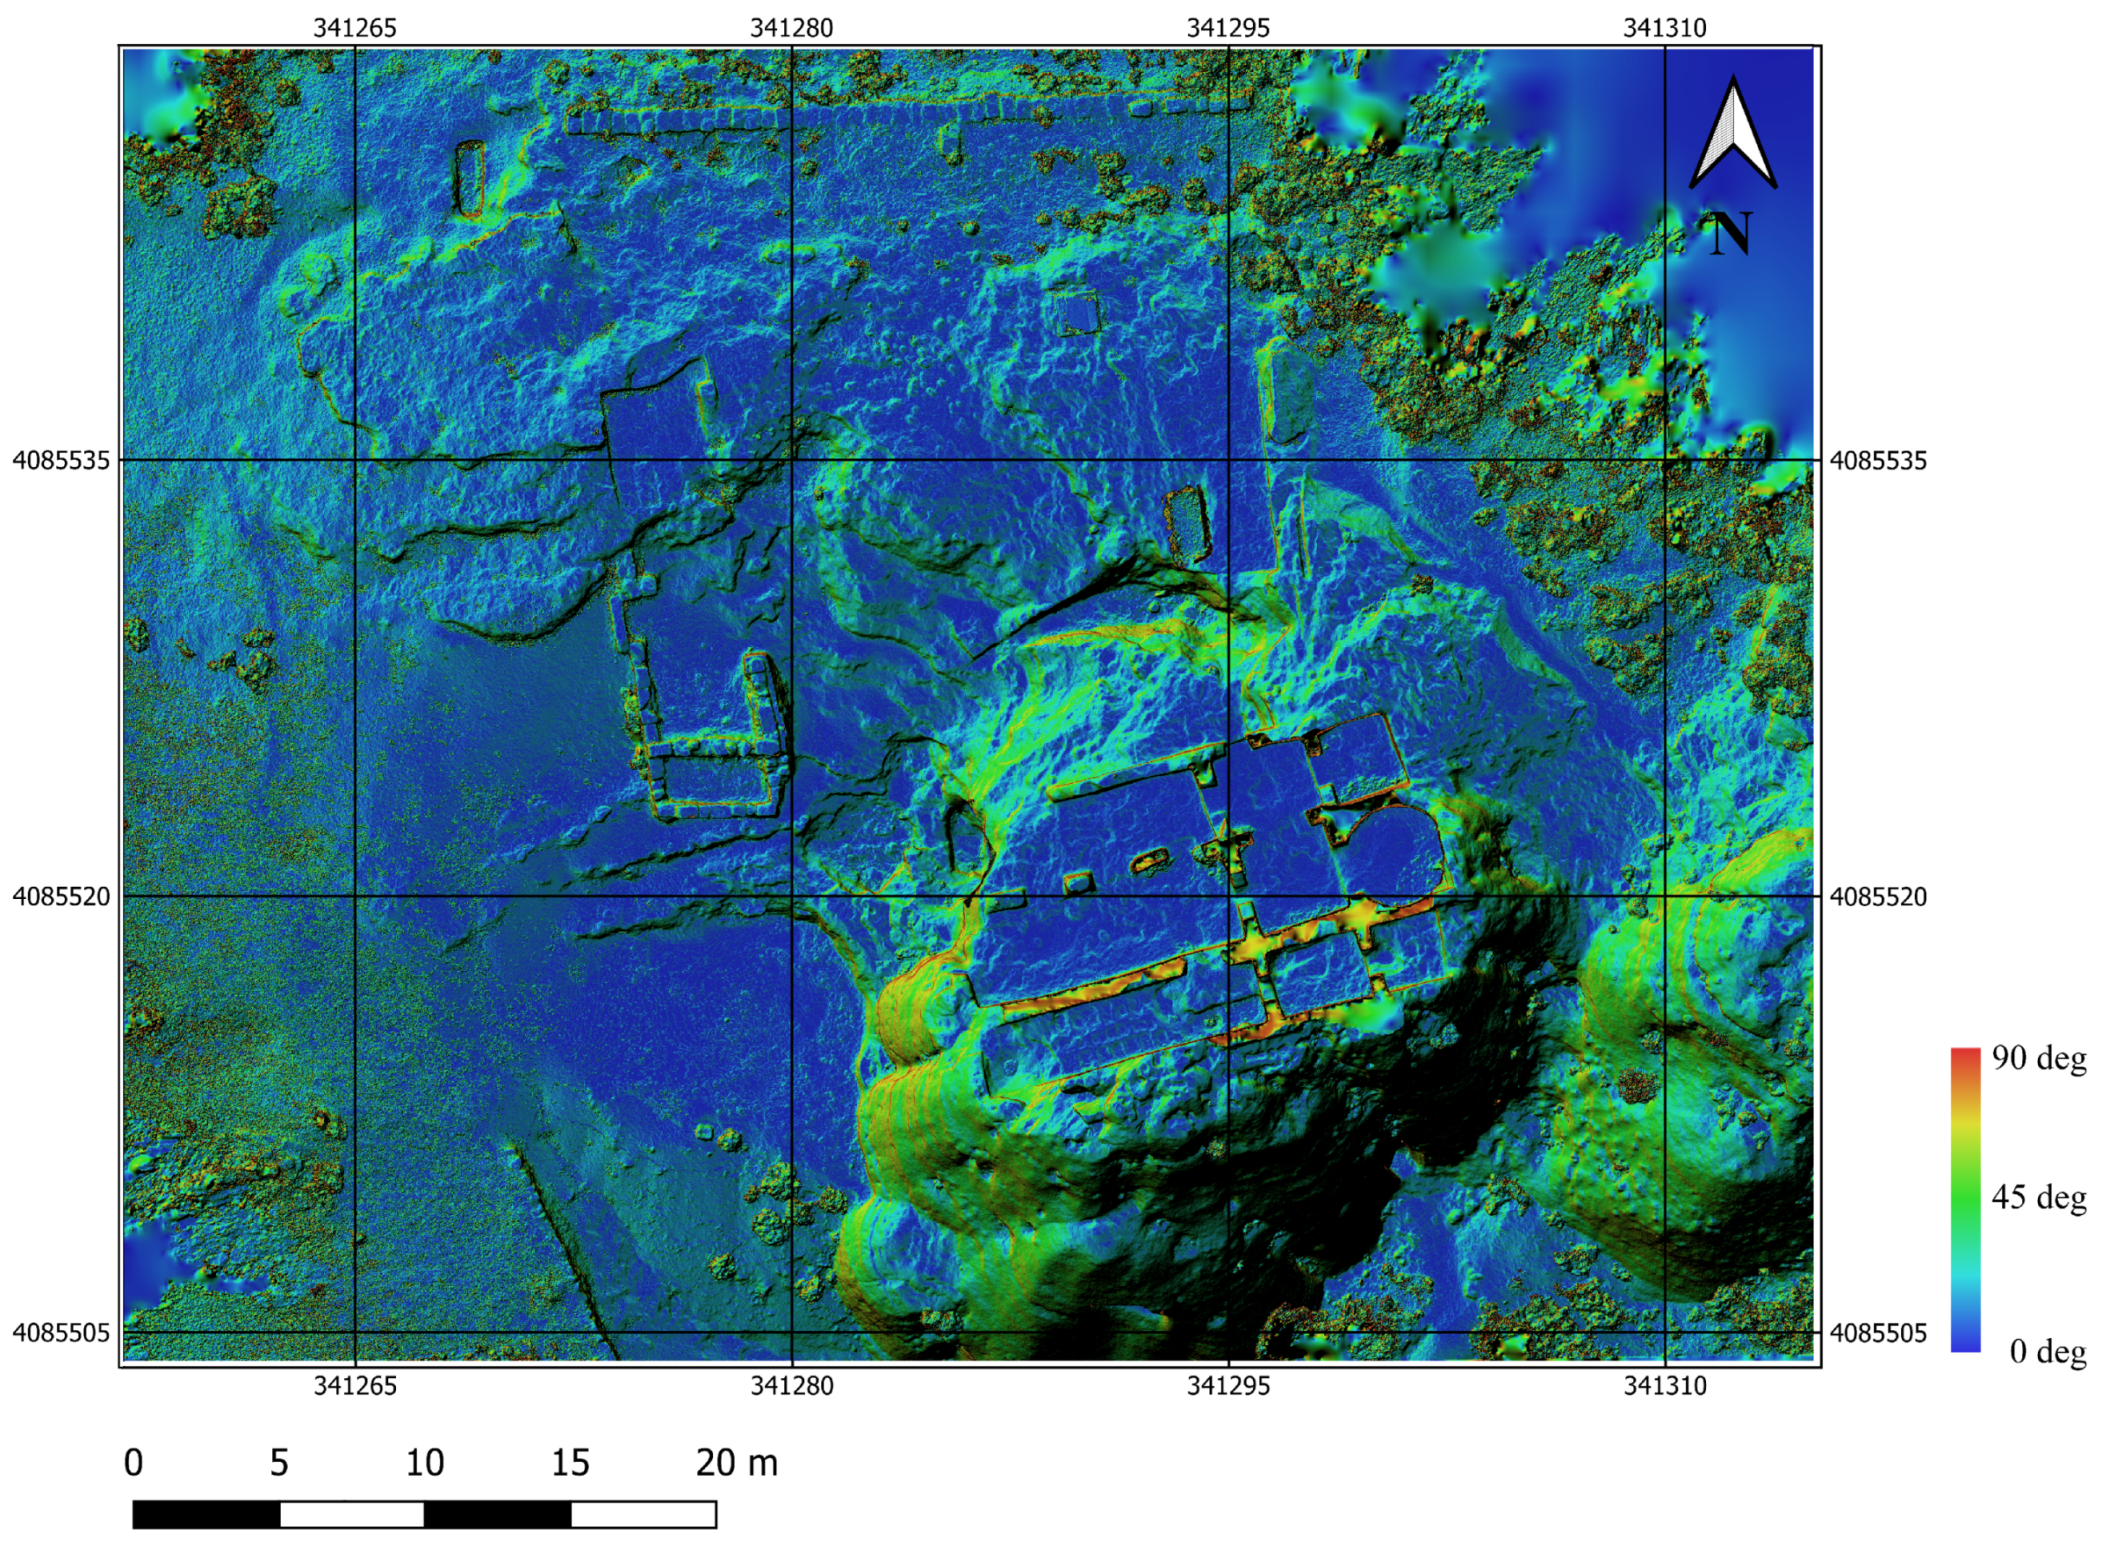
- Building digital elevation model (DEM): A georeferenced DEM is generated from the dense point cloud. It will serve as a basis for the orthopmosaic.
- Building orthomosaic: The orthomosaic is obtained by orthorectification of the original images, providing the scale is uniform throughout the image and, therefore, can be used to measure real distances.
3.4. The Digital Elevation Model (DEM) and the Orthomosaic
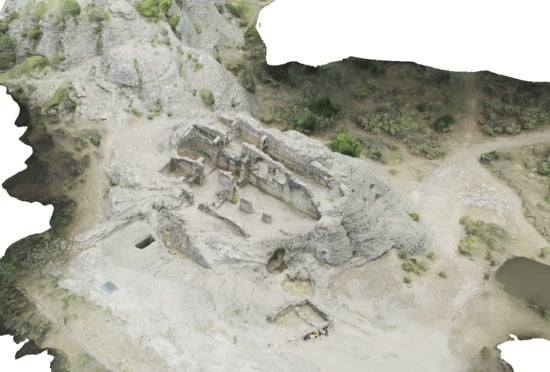
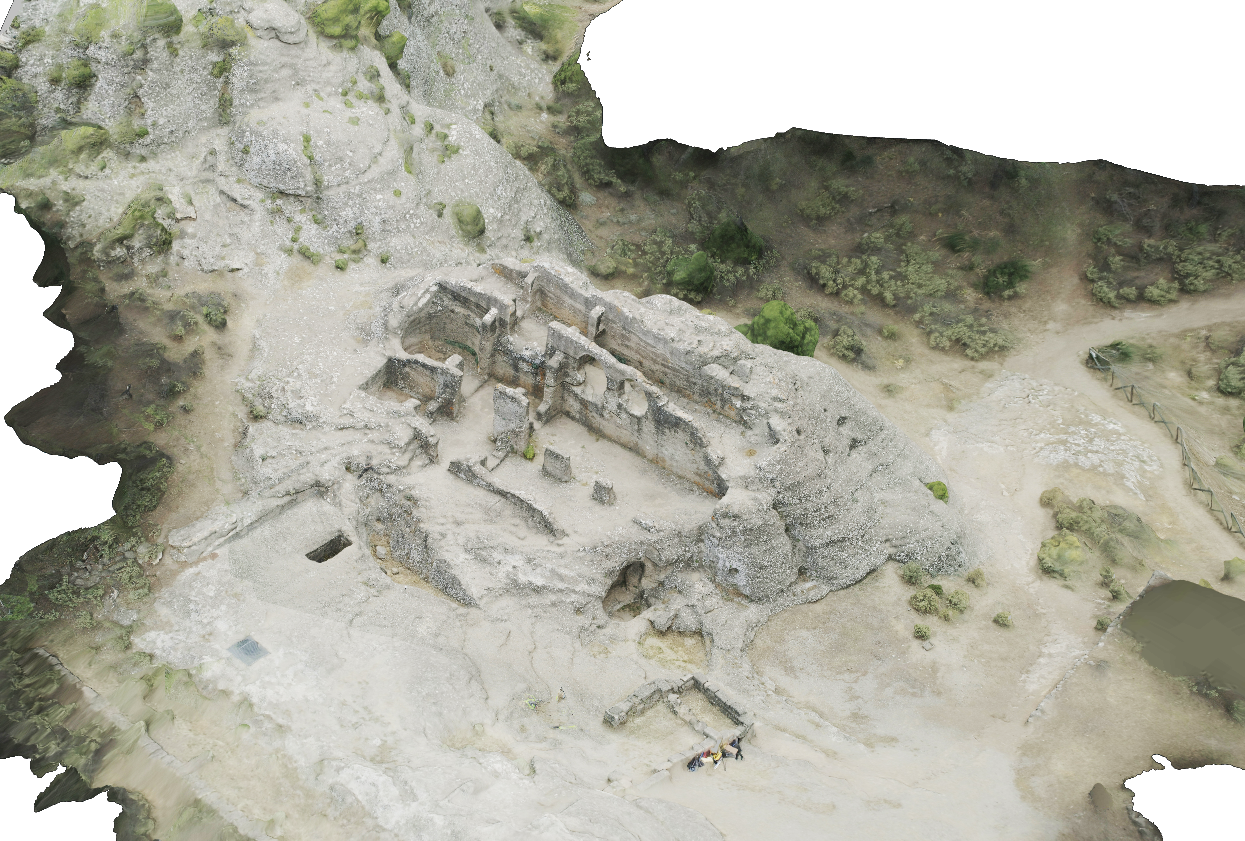
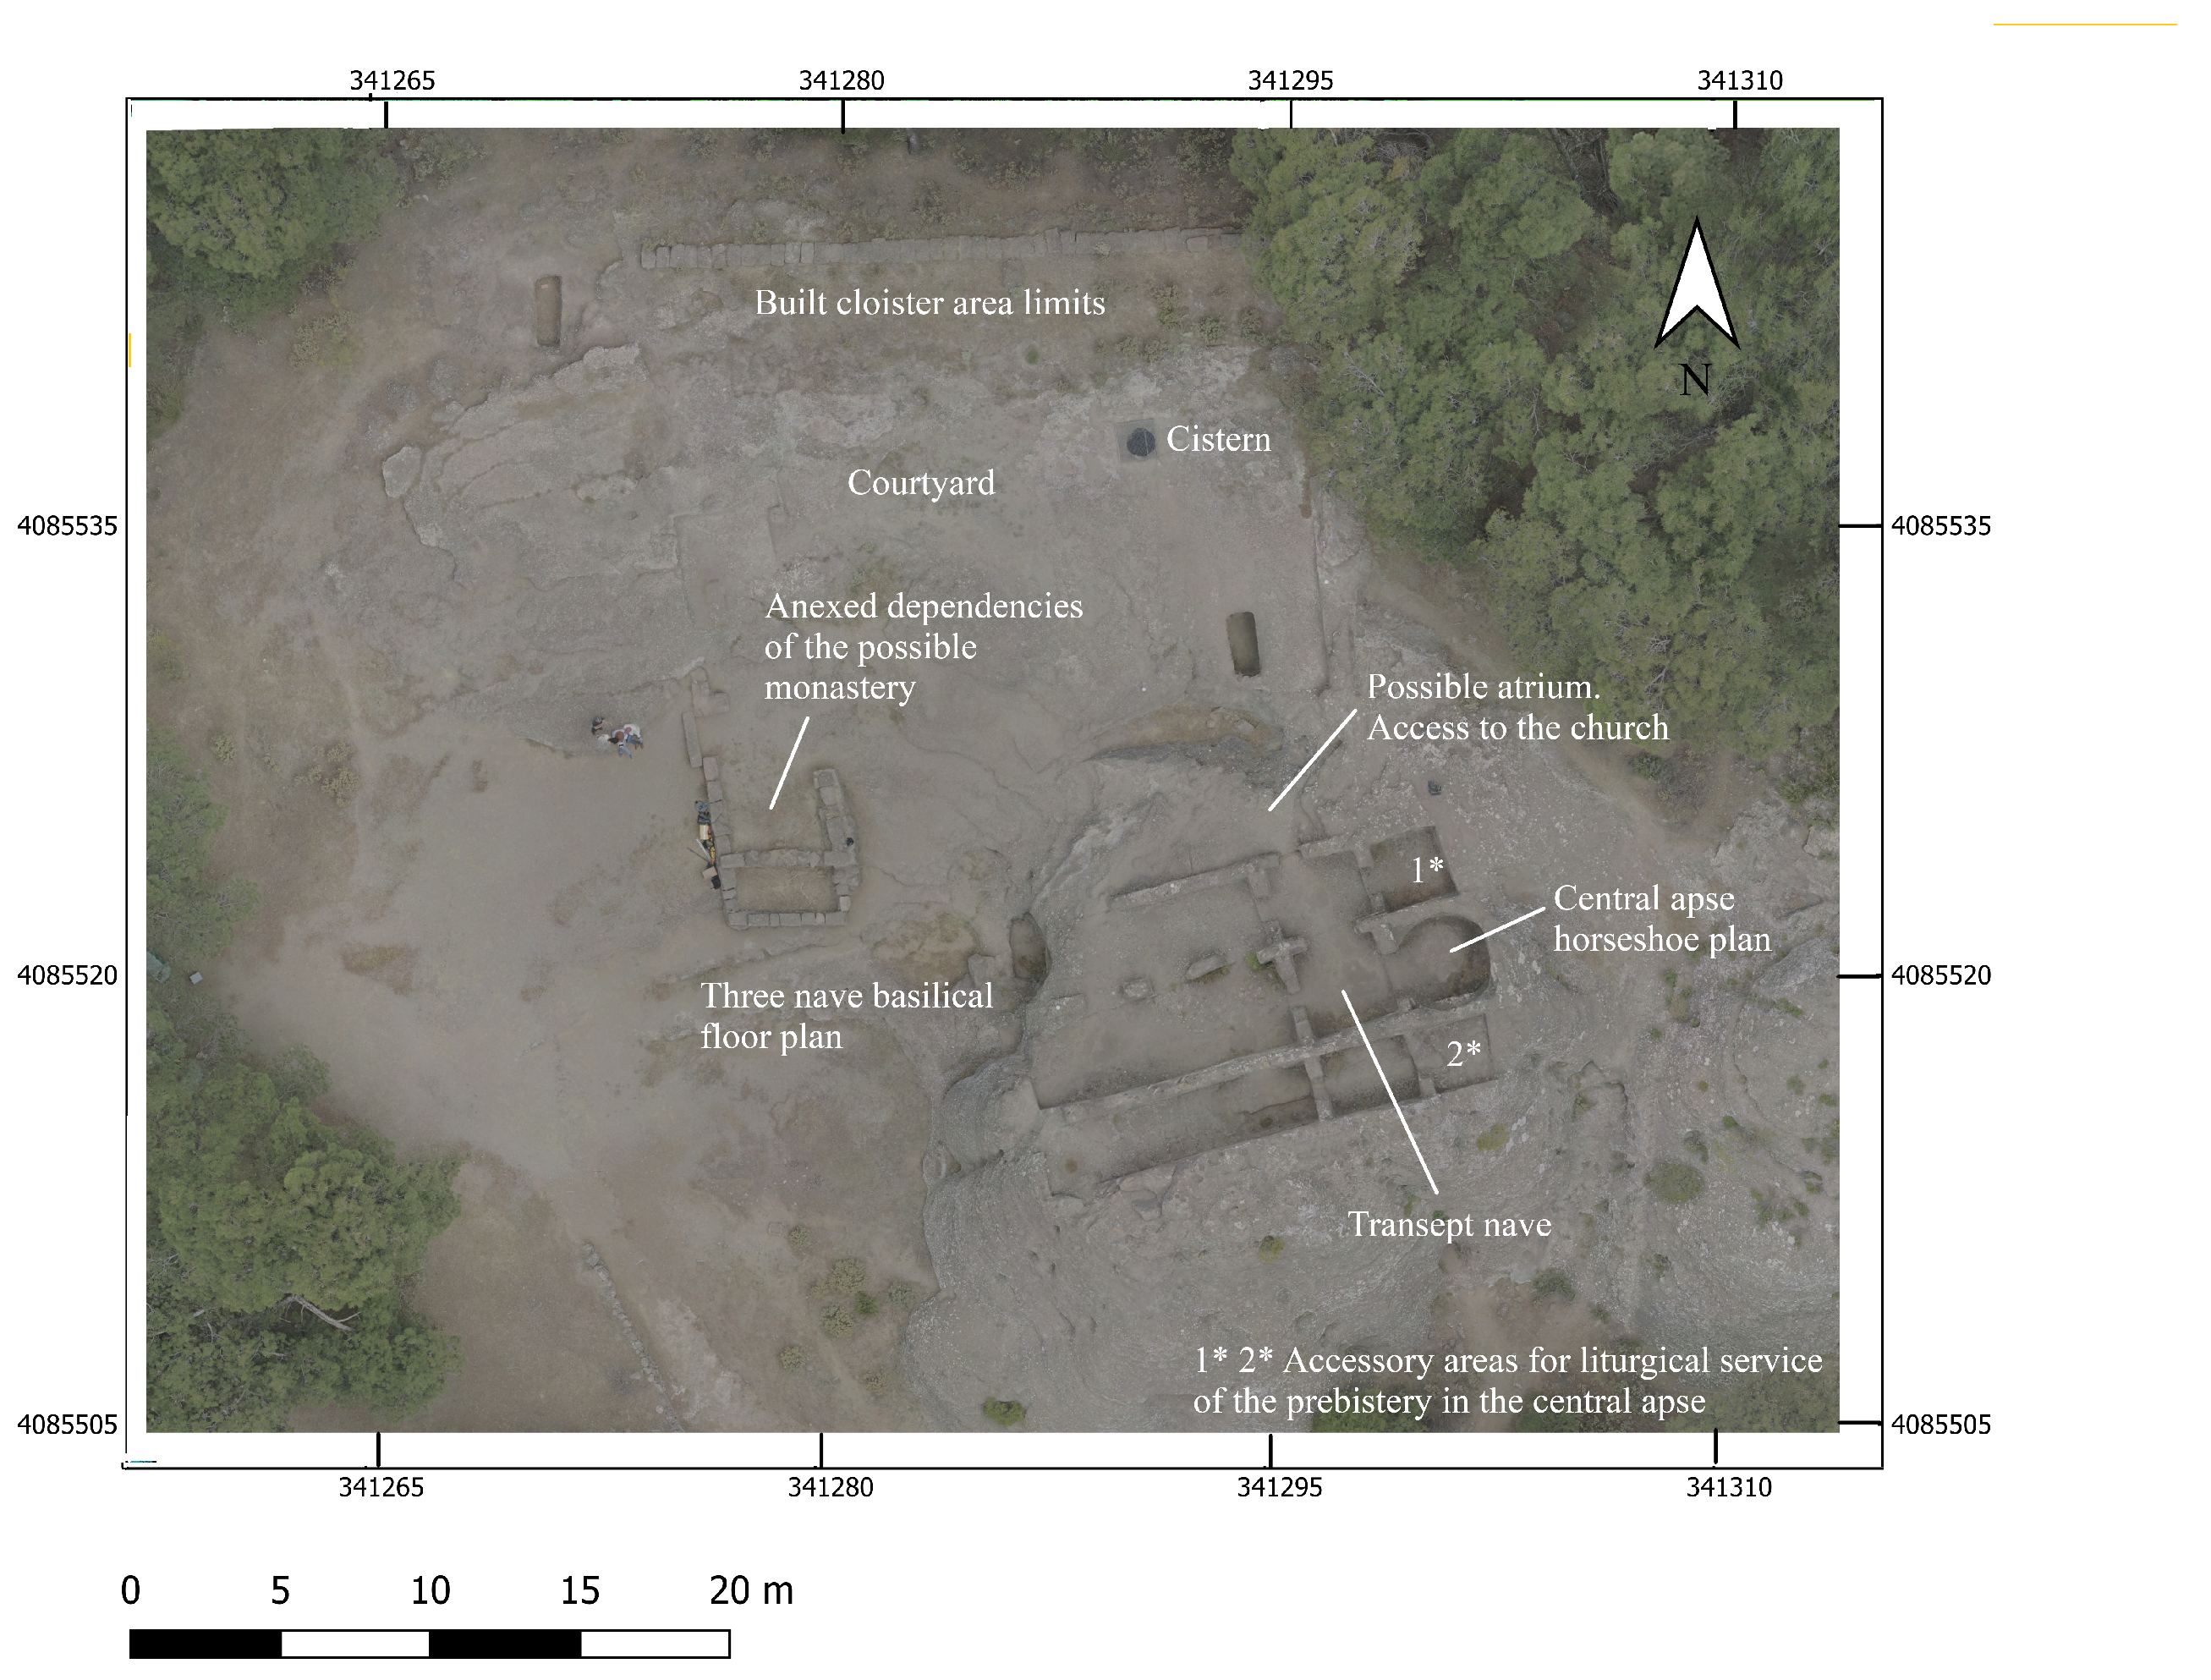
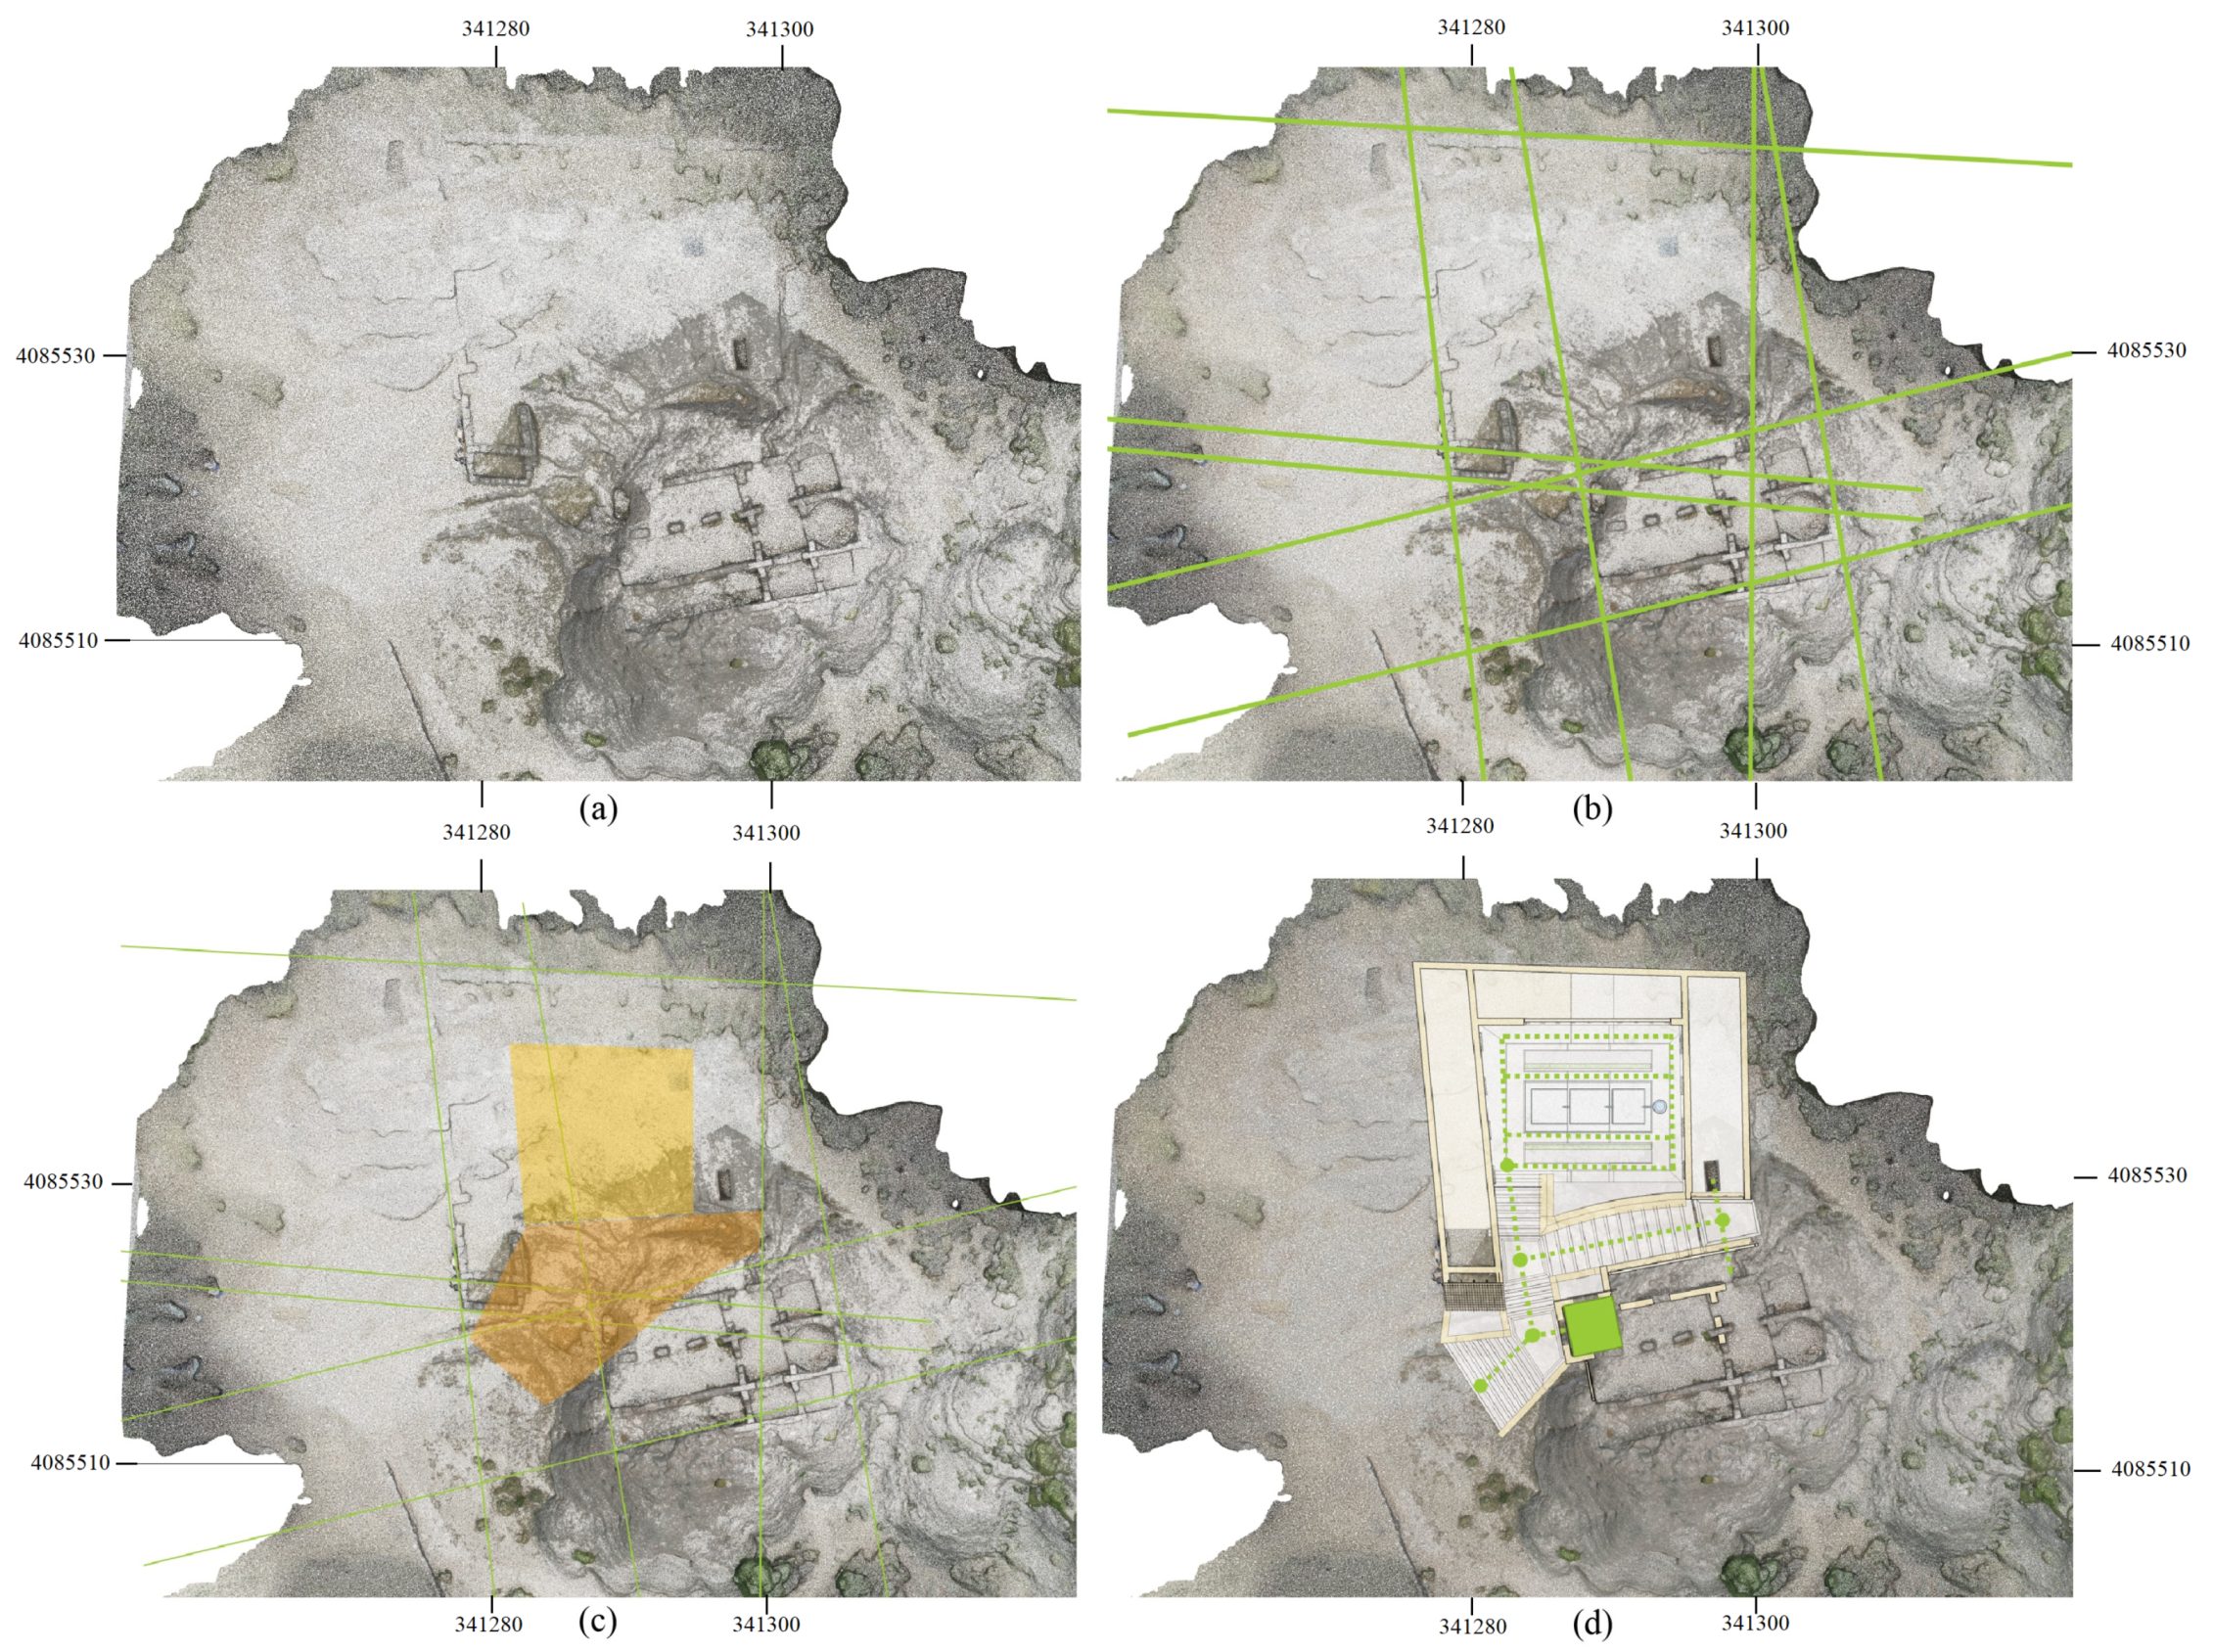
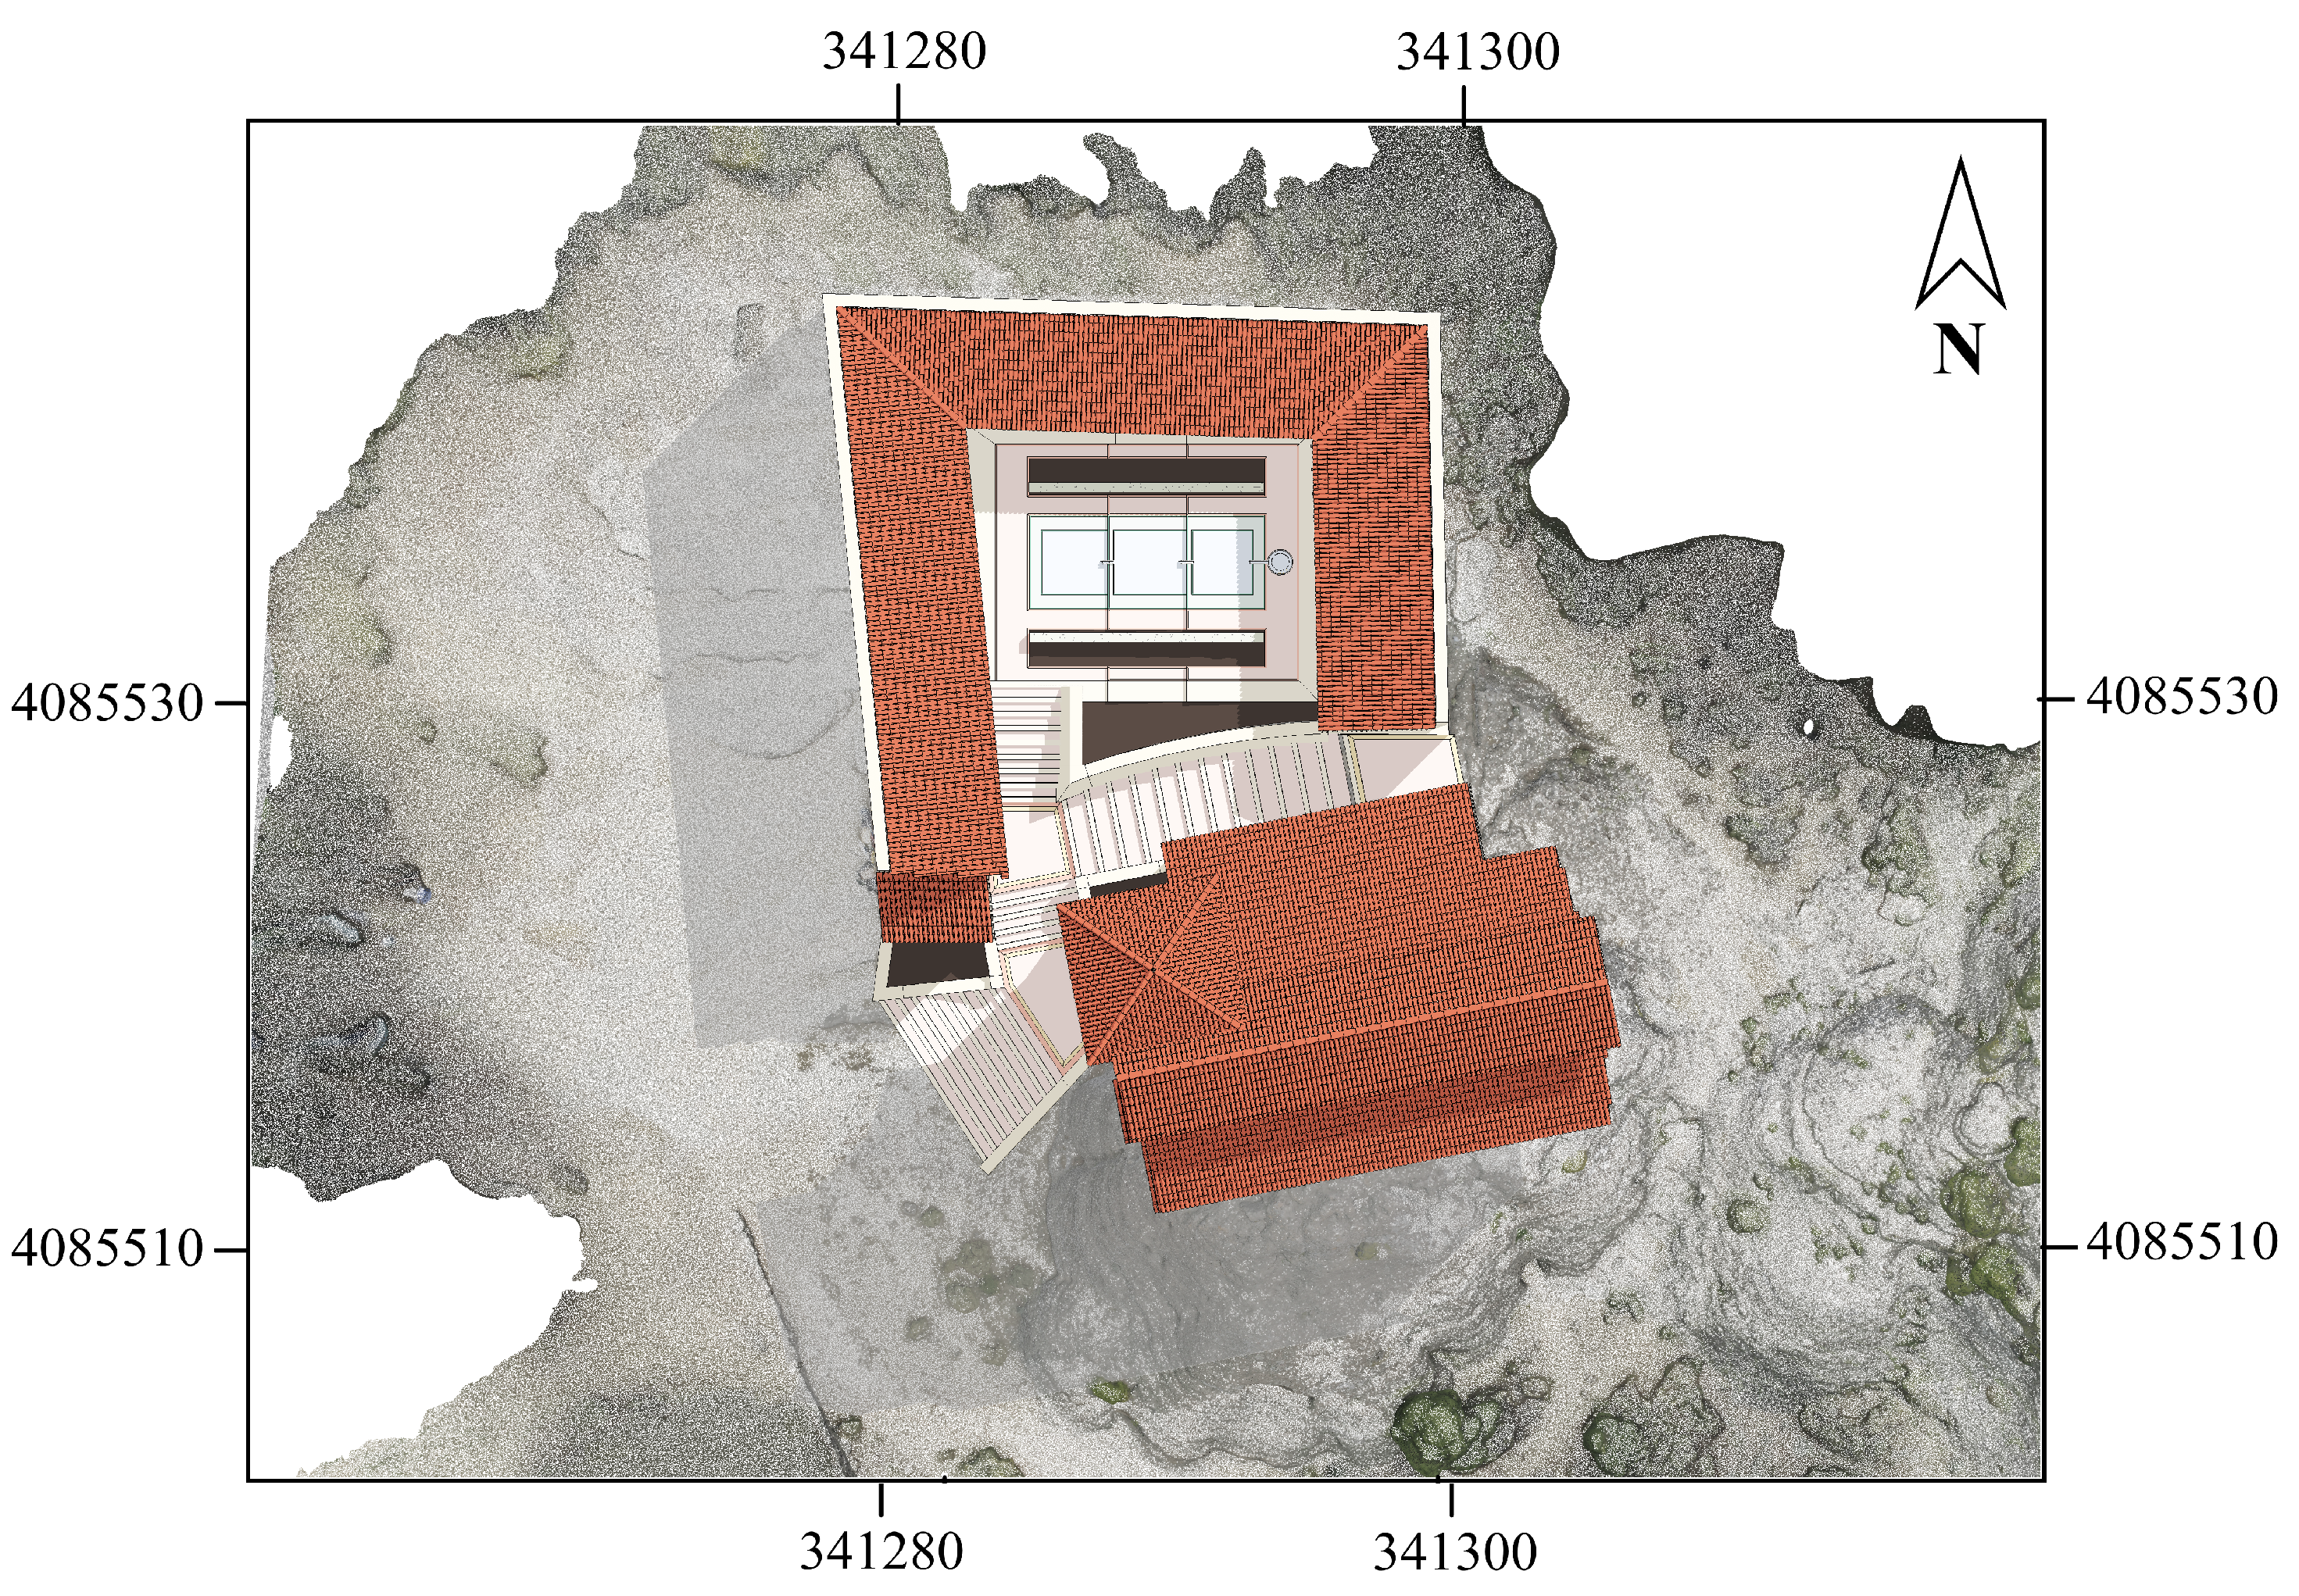
4. Results
5. Discussion
6. Conclusions
Author Contributions
Funding
Acknowledgments
Conflicts of Interest
References
- Campana, S. Drones in Archaeology. State-of-the-art and Future Perspectives. Archaeol. Prospect. 2017, 24, 275–296. [Google Scholar] [CrossRef]
- Waagen, J. New technology and archaeological practice. Improving the primary archaeological recording process in excavation by means of UAS photogrammetry. J. Archaeol. Sci. 2019, 101, 11–20. [Google Scholar] [CrossRef]
- Pecci, A.; Masini, N. Archaeology, historical site risk assessment and monitoring by UAV: Approaches and case studies. In Proceedings of the In EGU General Assembly Conference Abstracts, Vienna, Austria, 17–22 April 2016; p. 17424. [Google Scholar]
- Dubbini, M.; Curzio, L.I.; Campedelli, A. Digital elevation models from unmanned aerial vehicle surveys for archaeological interpretation of terrain anomalies: Case study of the Roman castrum of Burnum (Croatia). J. Archaeol. Sci. Rep. 2016, 8, 121–134. [Google Scholar] [CrossRef] [Green Version]
- Kršák, B.; Blišt’an, P.; Pauliková, A.; Puškárová, P.; Kovanič, L.; Palková, J.; Zelizňaková, V. Use of low-cost UAV photogrammetry to analyze the accuracy of a digital elevation model in a case study. Measurement 2016, 91, 276–287. [Google Scholar] [CrossRef]
- Agüera-Vega, F.; Carvajal-Ramírez, F.; Martínez-Carricondo, P. Assessment of photogrammetric mapping accuracy based on variation ground control points number using unmanned aerial vehicle. Measurement 2017, 98, 221–227. [Google Scholar] [CrossRef]
- Clapuyt, F.; Vanacker, V.; Van Oost, K. Reproducibility of UAV-based earth topography reconstructions based on Structure-from-Motion algorithms. Geomorphology 2016, 260, 4–15. [Google Scholar] [CrossRef]
- Frodella, W.; Elashvili, M.; Spizzichino, D.; Gigli, G.; Adikashvili, L.; Vacheishvili, N.; Kirkitadze, G.; Nadaraia, A.; Margottini, C.; Casagli, N. Combining InfraRed Thermography and UAV Digital Photogrammetry for the Protection and Conservation of Rupestrian Cultural Heritage Sites in Georgia: A Methodological Application. Remote Sens. 2020, 12, 892. [Google Scholar] [CrossRef] [Green Version]
- Jurado, J.; Ortega, L.; Cubillas, J.; Feito, F. Multispectral mapping on 3D models and multi-temporal monitoring for individual characterization of olive trees. Remote Sens. 2020, 12, 1106. [Google Scholar] [CrossRef] [Green Version]
- Gomez-Moreno, M. Iglesias Mozárabes. Arte Español de los Siglos IX al XI; Centro de Estudios Históricos: Madrid, Spain, 1919. [Google Scholar]
- de Mergelina, C. De arquitectura mozárabe. La iglesia rupestre de Bobastro. In Archivo Español de Arte y Arqueología; Centro de Estudios Históricos: Madrid, Spain, 1925; pp. 147–158. [Google Scholar]
- de Mergelina, C. Bobastro. Memoria de las Excavaciones Realizadas en las Mesas de Villaverde. El Chorro (Málaga); Technical Report 87 (num 7, 1925-26); Memorias de la Junta Superior de Excavaciones, Revista de Archivos: Madrid, Spain, 1927. [Google Scholar]
- Cano Medina, F. Mapa geológico y Memoria Explicativa de la hoja 1038 (Ardales). Escala 1:50.000. Available online: https://bit.ly/32GTA0T (accessed on 23 July 2020).
- ICAO. Unmanned Aircraft Systems (UAS). Cir 328 AN/190, International Civil Aviation Organitation, 999 University Street, Montréal, Quebec, Canada H3C 5H7 For. 2011. Available online: https://bit.ly/2ZLKnT1 (accessed on 23 July 2020).
- Peppa, M.V.; Hall, J.; Goodyear, J.; Mills, J.P. Photogrammetric assessment and comparison of DJI Phantom 4 Pro and Phantom 4 RTK small unmanned aircraft systems. ISPRS Int. Arch. Photogramm. Remote Sens. Spat. Inf. Sci. 2019, XLII-2/W13, 503–509. [Google Scholar] [CrossRef] [Green Version]
- Garrido, M.S.; Giménez, E.; de Lacy, M.C.; Gil, A.J. Dense Regional Active Networks and High Accuracy Positioning Services. A Case Study Based on the Andalusian Positioning Network (Southern Spain). IEEE J. Sel. Top. Appl. Earth Obs. Remote Sens. 2013, 6, 2421–2433. [Google Scholar] [CrossRef]
- W.F., L. Measuring the Face of the Past and Facing the Measurement. In Digital Methods and Remote Sensing in Archaeology. Quantitative Methods in the Humanities and Social Sciences; Forte, M., Campana, S., Eds.; Springer: Cham, Switzerland, 2016; pp. 349–369. [Google Scholar]
- Schonberger, J.L.; Frahm, J.-M. Structure-from-motion revisited. In Proceedings of the IEEE Conference on Computer Vision and Pattern Recognition, Las Vegas, NV, USA, 27–30 June 2016; pp. 4104–4113. [Google Scholar]
- Jurado, J.; Ramos, M.; Enríquez, C.; Feito, F. The Impact of Canopy Reflectance on the 3D Structure of Individual Trees in a Mediterranean Forest. Remote Sens. 2020, 12, 1430. [Google Scholar] [CrossRef]
- Lo Brutto, M.; Garraffa, A.; Meli, P. UAV Plataforms for Cultural Heritage Survey: First, Results. ISPRS Ann. Photogramm. Remote Sens. Spat. Inf. Sci. 2014, 2, 227–234. [Google Scholar] [CrossRef] [Green Version]
- Themistocleous, K.; Agapiou, A.; Cuca, B.; Hadjimitsis, D.G. Unmanned aerial systems and spectroscopy for remote sensing applications in archaeology. In Proceedings of the 2015 36th International Symposium on Remote Sensing of Environment, Berlin, Germany, 11–15 May 2015. [Google Scholar]
- Agisoft LLC. Agisoft Metashape User Manual. Professional Edition. Version 1.6. 2020. Available online: https://www.agisoft.com/pdf/metashape-pro_1_5_en.pdf (accessed on 23 July 2020).
- Vision International. Imagine OrthoMax User’s Guide Version 8.2; Vision International: Atlanta, GA, USA, 1994. [Google Scholar]
- Puerta Tricas, R. Iglesias prerrománicas hispánicas (Siglos VIII al XI). In Ensayo de Tipología Arquitectónica, Mainake, XXI-XXII, Diputación Provincial, 1999–2000; 2000; pp. 139–198. Available online: https://bit.ly/2OJsJsT (accessed on 23 July 2020).
- Daza Pardo, E. La edilicia rupestre en el norte de Guadalajara. Hábitat y eremitismo en la transición de la Antigüedad a la Edad Media, Codex aquilarensis. In Cuadernos de investigación del Monasterio de Santa María la Real; Fundación Santa María la Real: Palencia, Spain, 2007; pp. 6–27. [Google Scholar]
- Bango Torviso, I. El Espacio para Enterramientos Privilegiados en la Arquitectura Medieval Española; Technical Report; Anuario del Departamento de Historia y Teoría del Arte: Madrid, Spain, 1992. [Google Scholar]
- Martínez Enamorado, V. Bobastro (Ardales, Málaga): La ciudad de Ibn Hafsun. Archeol. Islam. 1997, 7, 27–44. [Google Scholar]
- Domínguez Perela, E. Las contradicciones de la cultura mozárabe y el núcleo bizantino del noroeste. Arch. Esp. Arqueol. 1992, 65, 223–262. [Google Scholar] [CrossRef]
- Puerta Tricas, R. La iglesia rupestre de las Mesas de Villaverde (Ardales, Málaga). Mainake 1979, 179–204. Available online: https://bit.ly/2D0OXDO (accessed on 23 July 2020).
- Cobb, H.; Harris, O.J.T.; Jones, C.; Richardson, P. Reconsidering Archaeological Fieldwork; Springer: New York, NY, USA, 2012. [Google Scholar]


| Camera Characteristics | |
|---|---|
| Camera | DJI FC6310 |
| Sensor | 1″ CMOS 20 megapixel |
| Nominal focal length | 8.8 mm |
| Pixel resolution | 5472 × 3648 pixels (13.2 × 8.8 mm) |
| Label | E (m) | N (m) | H (m) | E | N | H | Total (cm) |
|---|---|---|---|---|---|---|---|
| Control points | |||||||
| 001 | 341,309.363 | 4,085,524.571 | 504.181 | −1.4 | < 0.1 | 1.1 | 1.8 |
| 002 | 341,296.562 | 4,085,534.953 | 504.180 | −1.6 | 2.2 | 1.3 | 3.0 |
| 004 | 341,287.024 | 4,085,519.773 | 503.365 | 3.5 | 1.9 | 0.2 | 4.0 |
| 006 | 341,273.320 | 4,085,535.914 | 503.336 | −1.7 | 1.3 | 2.3 | 3.1 |
| Total | 2.2 | 1.6 | 1.4 | 3.1 | |||
| Check points | |||||||
| 003 | 341,290.016 | 4,085,531.161 | 502.767 | 5.2 | −2.4 | −5.7 | 8.1 |
| 005 | 341,291.095 | 4,085,524.135 | 504.225 | −4.0 | −3.0 | 0.7 | 5.0 |
| Total | 4.6 | 2.7 | 4.1 | 6.7 |
| Count | E | N | H | EN | Total |
|---|---|---|---|---|---|
| Control points | |||||
| 4 | 2.2 | 1.6 | 1.4 | 2.7 | 3.1 |
| Check points | |||||
| 2 | 4.6 | 2.7 | 4.1 | 5.4 | 6.8 |
| Hardware | Specification |
|---|---|
| RAM | 31.64 GB |
| CPU | Intel(R) Core(TM) i7-8700 CPU @ 3.20 GHz |
| GPU(s) | GeForce GTX 1060 6 GB |
| Flight Parameters | |
|---|---|
| Flight time | 24 min |
| Flying altitude | 100 m |
| Number of images | 279 |
| Dense Point Cloud Generation | |
| Points | 111,045,063 |
| Point colors | 3 bands, uint 8 |
| Depth maps generation parameters | |
| Quality | Ultra High |
| Filtering mode | Moderate |
| Processing time | 16 h 13 min |
| Dense cloud generation parameters | |
| Processing time | 8 h 39 min |
© 2020 by the authors. Licensee MDPI, Basel, Switzerland. This article is an open access article distributed under the terms and conditions of the Creative Commons Attribution (CC BY) license (http://creativecommons.org/licenses/by/4.0/).
Share and Cite
Enríquez, C.; Jurado, J.M.; Bailey, A.; Callén, D.; Collado, M.J.; Espina, G.; Marroquín, P.; Oliva, E.; Osla, E.; Ramos, M.I.; et al. The UAS-Based 3D Image Characterization of Mozarabic Church Ruins in Bobastro (Malaga), Spain. Remote Sens. 2020, 12, 2377. https://0-doi-org.brum.beds.ac.uk/10.3390/rs12152377
Enríquez C, Jurado JM, Bailey A, Callén D, Collado MJ, Espina G, Marroquín P, Oliva E, Osla E, Ramos MI, et al. The UAS-Based 3D Image Characterization of Mozarabic Church Ruins in Bobastro (Malaga), Spain. Remote Sensing. 2020; 12(15):2377. https://0-doi-org.brum.beds.ac.uk/10.3390/rs12152377
Chicago/Turabian StyleEnríquez, Carlos, Juan Manuel Jurado, Alexandro Bailey, Danilo Callén, María José Collado, Gabriel Espina, Pablo Marroquín, Erick Oliva, Edgar Osla, María Isabel Ramos, and et al. 2020. "The UAS-Based 3D Image Characterization of Mozarabic Church Ruins in Bobastro (Malaga), Spain" Remote Sensing 12, no. 15: 2377. https://0-doi-org.brum.beds.ac.uk/10.3390/rs12152377