Article

Impact of Expansion Pattern of Built-Up Land in Floodplains on Flood Vulnerability: A Case Study in the North China Plain Area

1
Key Laboratory of Environmental Change and Natural Disaster, Ministry of Education, Beijing Normal University, Beijing 100875, China
2
Engineering Research Center of Desertification and Blown-sand Control, Ministry of Education, Beijing Normal University, Beijing 100875, China
3
Faculty of Geographical Science, Academy of Disaster Reduction and Emergency Management, Beijing Normal University, Beijing 100875, China
*
Author to whom correspondence should be addressed.
Remote Sens. 2020, 12(19), 3172; https://0-doi-org.brum.beds.ac.uk/10.3390/rs12193172
Submission received: 17 August 2020 / Revised: 12 September 2020 / Accepted: 23 September 2020 / Published: 28 September 2020
(This article belongs to the Section Urban Remote Sensing)

Abstract

:
Built-up land in floodplains (BLF) is a driver and a disaster-bearing body of flood risk from a socio-hydrological perspective. The relationship between BLF growth and flood vulnerability is the key to understanding and managing flood risk. However, previous studies have focused more on the relationship between BLF growth and flood exposure, ignoring flood vulnerability. We examined the BLF expansion pattern (patch size and expansion type) in the North China Plain Area from 1975 to 2014 (1975–1990–2000–2014) using GIS (geographic information system)-based landscape analysis and revealed its relationship with flood vulnerability. The results show that the BLF area experienced rapid growth (288.26%) from dispersion to coalescence. Small patches dominated the number and area of BLF growth, and edge-expansion patches were the expansion type with the most area growth. We discovered that flood vulnerability was significantly correlated with the growth in small (R = 0.36, p < 0.01), edge-expansion (R = 0.53, p < 0.01), and outlying patches (R = 0.51, p < 0.01). Large patches were not significantly correlated with flood vulnerability (R = 0.18, p > 0.1), but there was a negative trend. Infilling patch growth was significantly associated with flood vulnerability over a long period (R = 0.27, p < 0.05). In addition, we suggest nature-based soft adaptations or village merging for small patches and outlying patches. Our findings have important scientific significance for adequately understanding the interplay between BLF growth and flood risk. It has practical implications for the formulation of integrated flood risk management strategy and the sustainable development of floodplains.

Graphical Abstract

1. Introduction

Floodplains can be defined as the periodically inundated areas by the lateral overflow of rivers [1,2]. Historically, humankind has tended to settle in floodplains because of the role of rivers as transportation corridors and the fertility of riparian areas. It is estimated that almost one billion people currently live in floodplains [3,4]. Recently, floods are causing increasing havoc in floodplains due to unprecedented urbanization and improper development [5]. In China, there were 157 major river floods in floodplains during 1992–2015, which killed 21,660 people, affected 1.48 billion people, and caused economic losses of $182.18 billion [1]. Thus, understanding the impact of built-up land expansion on flood risk and responding to challenges has become an urgent need for sustainable development in floodplains.
From a socio-hydrology perspective, built-up land in floodplains (BLF) is not only a disaster-bearing body of flooding but also a driving factor [6]. Sivapalan proposed the concept of socio-hydrology in 2012, which views human activities (such as urbanization and land-use change) as endogenous to water system dynamics rather than boundary conditions or external forcing of river-floodplain systems [7]. The socio-hydrology focuses on revealing the feedback and co-evolutionary role between human society and hydrological systems [4,6,7]. Its purpose is to guide the sustainable development challenges facing by human society in a changing environment [4,6,7]. In this paper, BLF growth is considered to be a driver of flood risk. As shown in Figure 1, the relationship between BLF expansion and flood risk may be regarded as a two-way coupling. The BLF expansion affects flood risk through hydrological processes, quantity, and expansion patterns. In turn, the dynamics of flood risk due to BLF expansion can be fed back into flood risk adaptation strategies for the floodplain [4].
Previous studies focused more on quantifying urban expansion and its impact on flood exposure. For example, Früh-Müller et al. studied flood exposure and settlement expansion in northern Bavaria from 1850 to 2011; they found that built-up land increased almost five-fold in the Main River floodplain under investigation [8]. Wu et al. quantified the spatio-temporal changes of built-up land in the Hangzhou metropolitan area from 1978 to 2008 and analyzed its socio-economic drivers [9]. Luo et al. revealed that the built-up land and population expansion in the Yangtze River Delta was significant for the city’s sustainable development from a collaborative perspective [10]. Additionally, Sun et al. quantified and compared the magnitude, rates, forms, and dynamics of urban expansion for 13 cities across the Jing-Jin-Ji Urban Agglomeration, and examined the relationship of urban patch structure and hierarchical structure of urban growth over the past four decades [11].
Less attention has been given to the impact of the BLF expansion pattern (patch size and expansion type) on flood vulnerability and its flood adaptation strategies [12]. However, understanding the relationship between BLF expansion and flood vulnerability plays a crucial role in flood risk management and the sustainable development of floodplains [13,14]. In recent years, advanced progress in remote sensing techniques and flood inundation models have provided sufficient data to investigate this issue, which has made it possible to identify the landscape structure of BLF in floodplains [15,16]. According to flood control practices, the BLF patch size is directly associated with flood control capabilities due to the different populations and resources they possessed [17,18]. We assume that large patches have more population and flood control resources, which makes them relatively less vulnerable to flooding compared to small patches. For example, the Flood Control Standard in China stipulates the flood prevention level for a city based on the size-related population and economy [17].
In addition to patch size, we believe that the expansion type of BLF may also affect flood vulnerability. First, identifying expansion types of new growth patches can reflect whether they are within the existing flood control system. For example, outlying patches have scattered distribution characteristics, and their rapid growth may lead to a dramatic increase in flood vulnerability because most of them are outside the existing flood prevention measures [19]. Second, different expansion types of BLF are closely related to patch size, which is directly associated with flood control capabilities [11]. Moreover, the impact of the BLF expansion pattern on flood vulnerability can be further fed back in flood adaptation strategies [4,20]. In the spirit of socio-hydrology, flood adaptation strategies can also change correspondingly as the impact of BLF expansion on flood vulnerability [6,7]. Therefore, the discussion of adaptation strategies under changing flood vulnerability environments reflects the feedback mechanism and co-evolution of socio-hydrology.
Our analysis mentioned above is primarily derived from the flood control practice and related studies. Whether and how the BLF expansion pattern affects flood vulnerability and how we can adjust to the impact needs further empirical research. In our research, using the North China Plain Area (NCPA) as an example, we first quantified the spatio-temporal dynamics of the BLF based on remote sensing data and identified the expansion pattern of BLF growth patches in different periods (1975–1990–2000–2014) employing the GIS-based landscape analysis method. Then, the impact of the BLF expansion pattern (patch size and expansion type) on flood vulnerability was investigated. Finally, adaptation strategies were discussed to reduce flood damage. Our research focuses on the impact of the BLF expansion pattern on flood vulnerability and its adaptations from the socio-hydrology perspective. This study is of great significance for flood prevention and the sustainable development of floodplains.

2. Materials and Methods
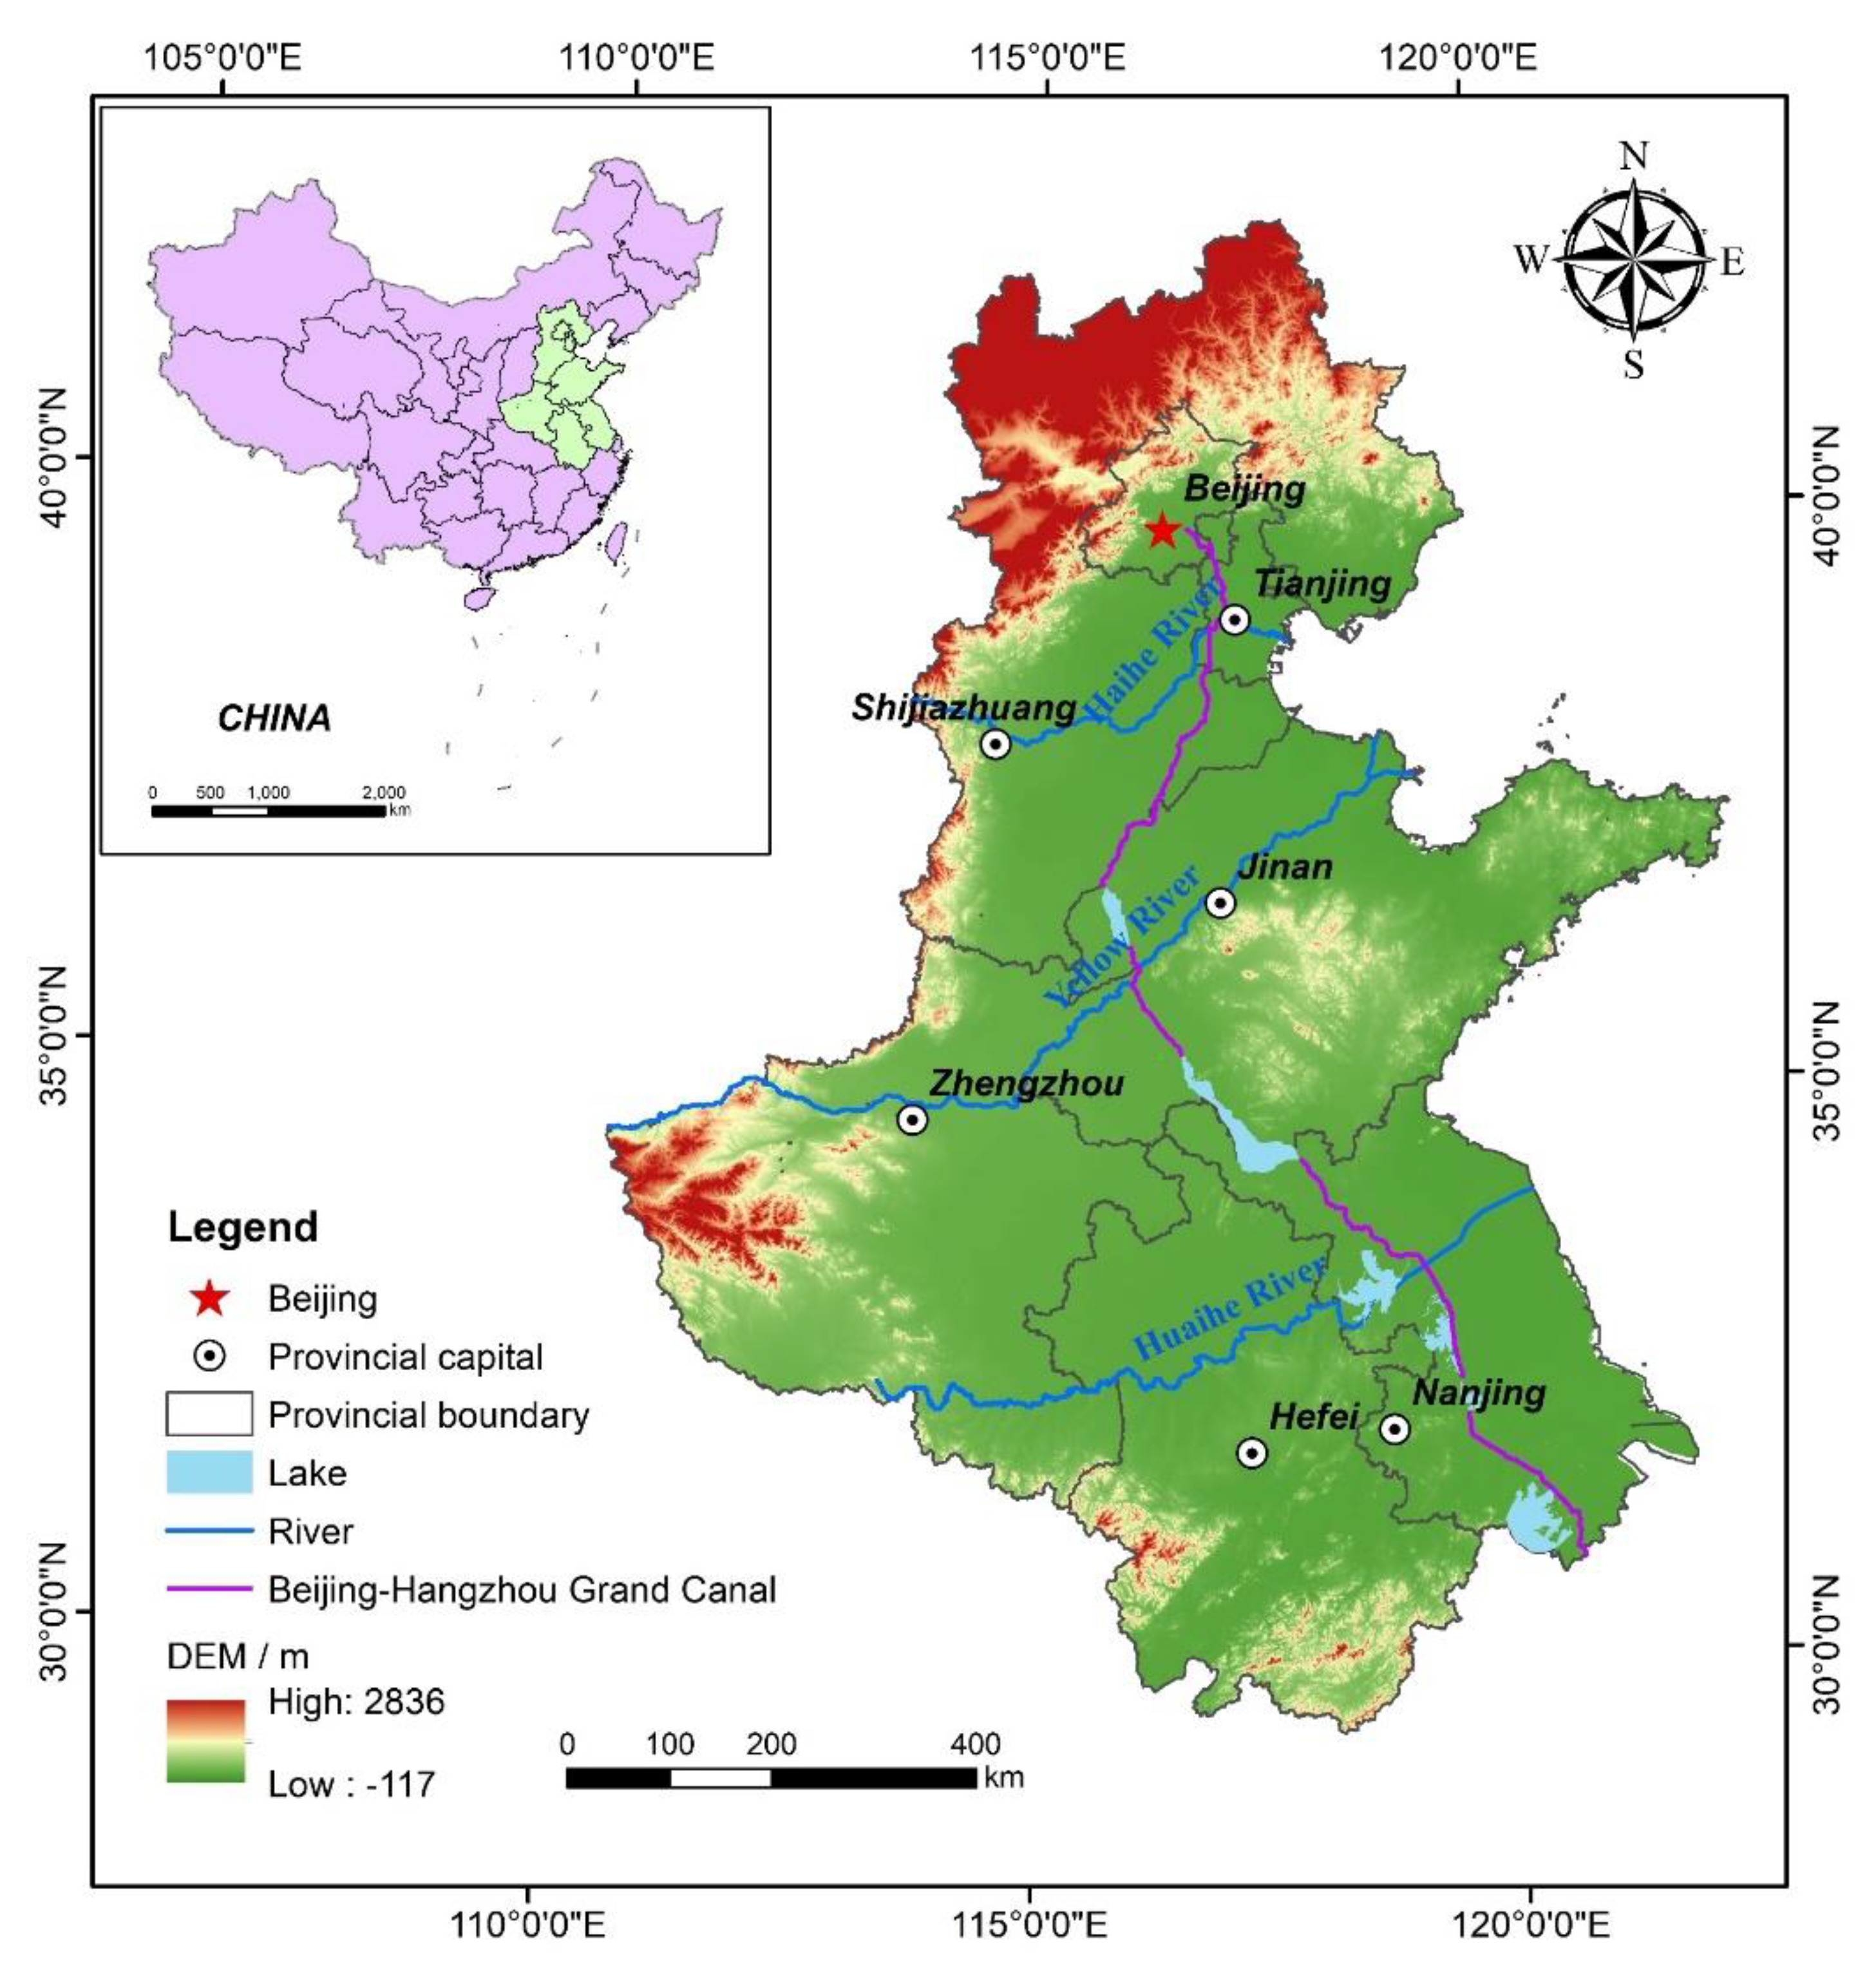
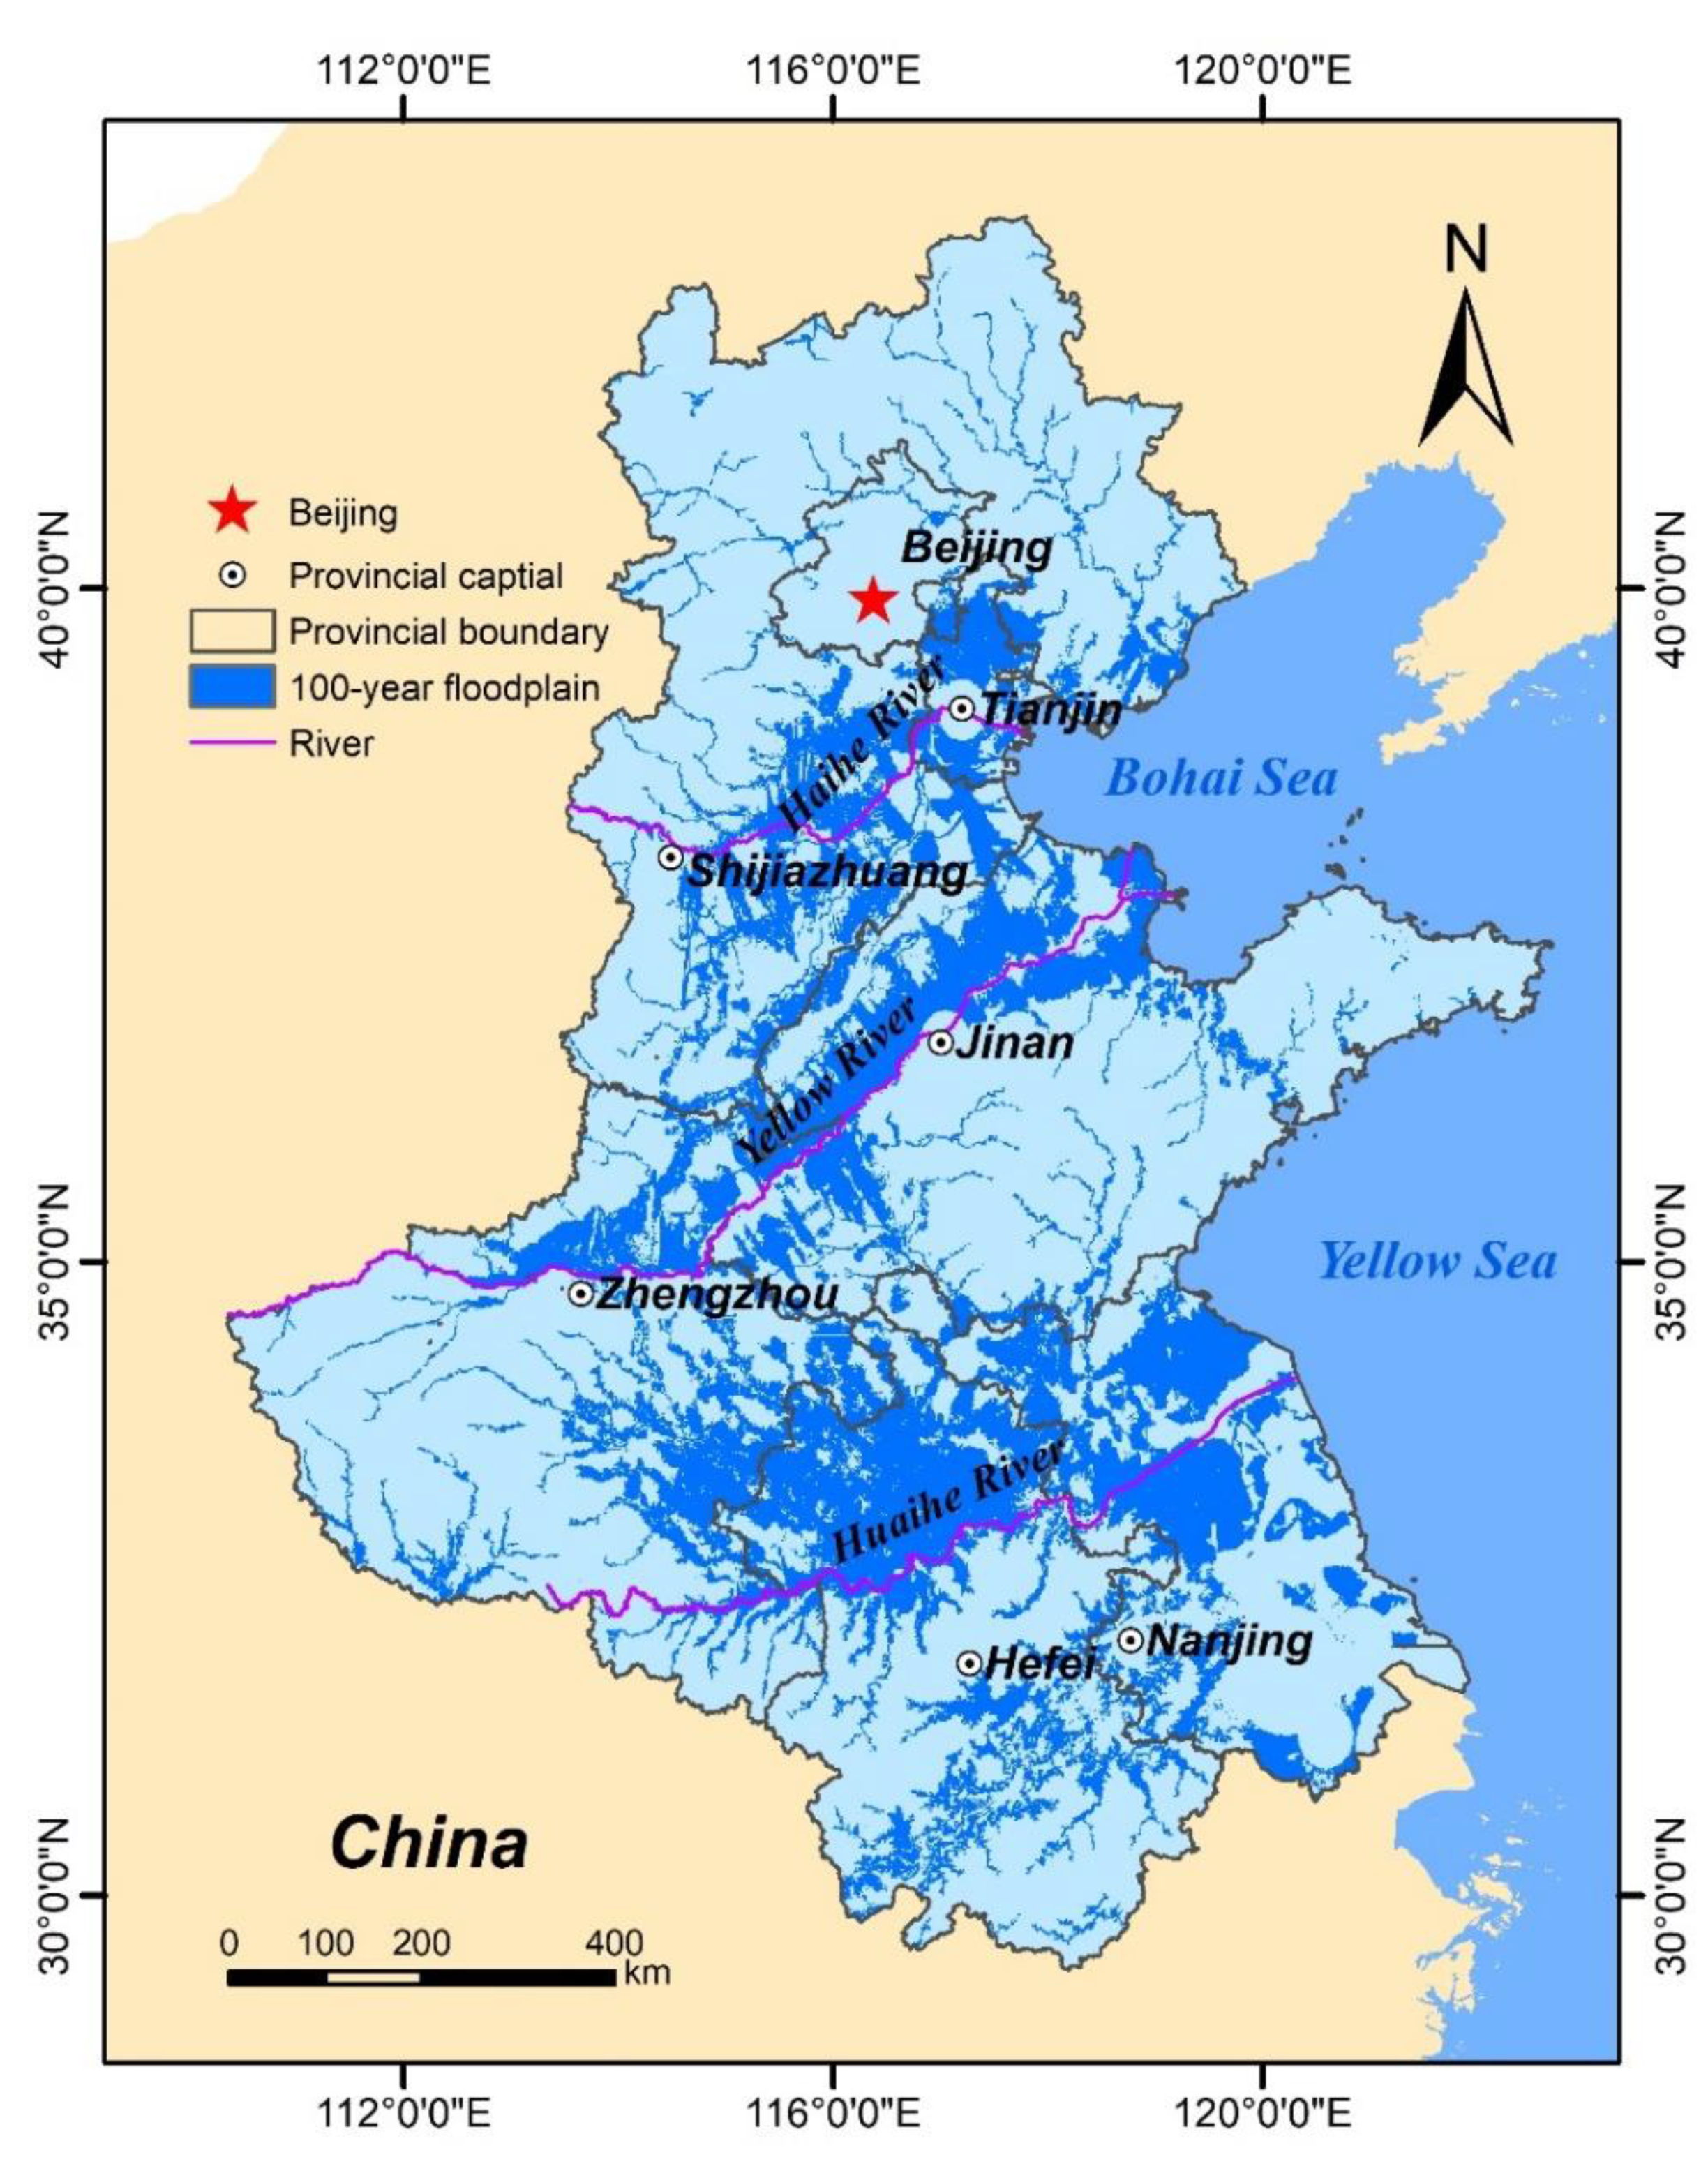
2.1. Study Area

The North China Plain Area (NCPA) lies between 29°41′–42°40′ N and 110°21′–122°43′ E and includes the two municipalities of Beijing and Tianjin and the five provinces of Hebei, Shandong, Henan, Anhui, and Jiangsu, covering a total area of 7.8 × 10⁵ km2 (Figure 2). The study area is a large Mesozoic and Cenozoic sedimentary basin composed of surrounding mountains and the North China Plain (NCP) [21]. The NCP is the second-largest plain in China with average elevations below 50 m. The annual precipitation of NCP ranges from 500 to 600 mm/yr and is concentrated in June to August [22]. The NCPA has a transition from a humid subtropical climate to a warm temperate humid and semi-humid climate from south to north [21]. In addition, there are many freshwater lakes and ecological wetlands, such as Taihu Lake, Chaohu Lake, Weishan Lake, and Baiyangdian Lake.
The NCPA is the most densely populated and arable land in China. The population and regional GDP (gross domestic product) of the NCPA were 440 million and $4.84 trillion (2018), accounting for 31.56% and 36.18% of the country’s total population and GDP, respectively [23]. The NCPA has experienced rapid urbanization since the reform and opening-up. The overall annual urban expansion rate in the Beijing-Tianjin-Hebei region was 5.5% ± 2.0% between 1978 and 2015 [11]. The expansion of the built-up area and the decline of vegetated land led to an increase of 1047 million m3 in total water yield [24]. Additionally, more extreme hydrological events occurred in floodplains and caused severe damage. One hundred and fifty-seven major river floods occurred in China’s floodplains from 1992–2015. [1]. A 60-year return period extreme rainstorm hit the Beijing-Tianjin-Hebei region on 21 July 2012, with the maximum rainfall of 541 mm in Hebei Town, Fangshan District, Beijing. This extreme rainstorm resulted in wide waterlogging and torrential flood in Beijing, with 79 human casualties and a direct economic loss of $1.6 billion [25]. During 2009–2018, about 21 million people were affected by floods in the NCPA each year. Therefore, understanding the impact of the BLF expansion on flood risk is paramount to the sustainable development of floodplains.

2.2. Data and Pre-Processing

Three datasets were employed to analyze the relationship between the BLF expansion pattern and flood vulnerability. The built-up land dataset is a multi-temporal (1975–1990–2000–2014) and multi-resolution (30 m, 250 m, 1000 m) raster accessed from the Joint Research Centre of the European Commission (https://ghslsys.jrc.ec.europa.eu/ghs_bu2019.php). The built-up land was based on 33,202 Global Land Survey (GLS) images and processed using the symbol machine learning (SML) method designed for remote sensing big data analysis [16]. A per-pixel accuracy assessment was performed using a total of 342,568 SU tiles derived from the reference building footprints [15]. The balanced accuracy of the built-up land data in the 2018 version is 0.86, which shows that the dataset has high accuracy [15].
Moreover, 4000 random points were selected for the built-up and non-built-up land in different periods of the study area. Then the random points were verified with high-resolution satellite images derived from Google Earth and Gaofen satellite (GF-1). The overall average accuracy of the built-up dataset is higher than 90.63%, and the highest accuracy in 2014 reached 92.48%. Therefore, the 30 m-resolution datasets were mainly used in the 2018 version to define the spatial extent of the built-up land in the NCPA.
The floodplain extent used in this paper was extracted from the inundation area of flood events with a 100-year return period. The flood dataset was obtained from the Global Risk Data Platform (http://preview.grid.unep.ch/), which was generated by the Centro Internazionale in Monitoraggio Ambientale Research Foundation (CIMA). The dataset was shaped by the accumulated effects of geomorphic and hydrologic processes and has been validated with historical floods [26]. Considering the inundation area of floods with a 100-year return period is not only closely related to the current urban-rural construction and socio-economic but provides a more overall depiction of floodplain extent. Therefore, the floodplain extent of NPCA was defined by the inundation area of floods with a 100-year return period (Figure 3).
Moreover, the flood-affected areas of 77 prefecture-level cities in the NCPA during the study period were obtained from the Dartmouth Flood Observatory (DFO) [27]. We used GIS to superimpose the vector data layers to obtain the cumulative flood-affected areas of each prefecture-level city, demonstrating the spatio-temporal variations in flood occurrence. The dataset was utilized to reveal the relationship between the BLF expansion pattern (patch size and expansion type) and flood vulnerability. Besides, the administrative region of the NCPA that we used originated from the National Geomatics Center of China in 2017 (http://www.ngcc.cn/ngcc/).

2.3. Methods

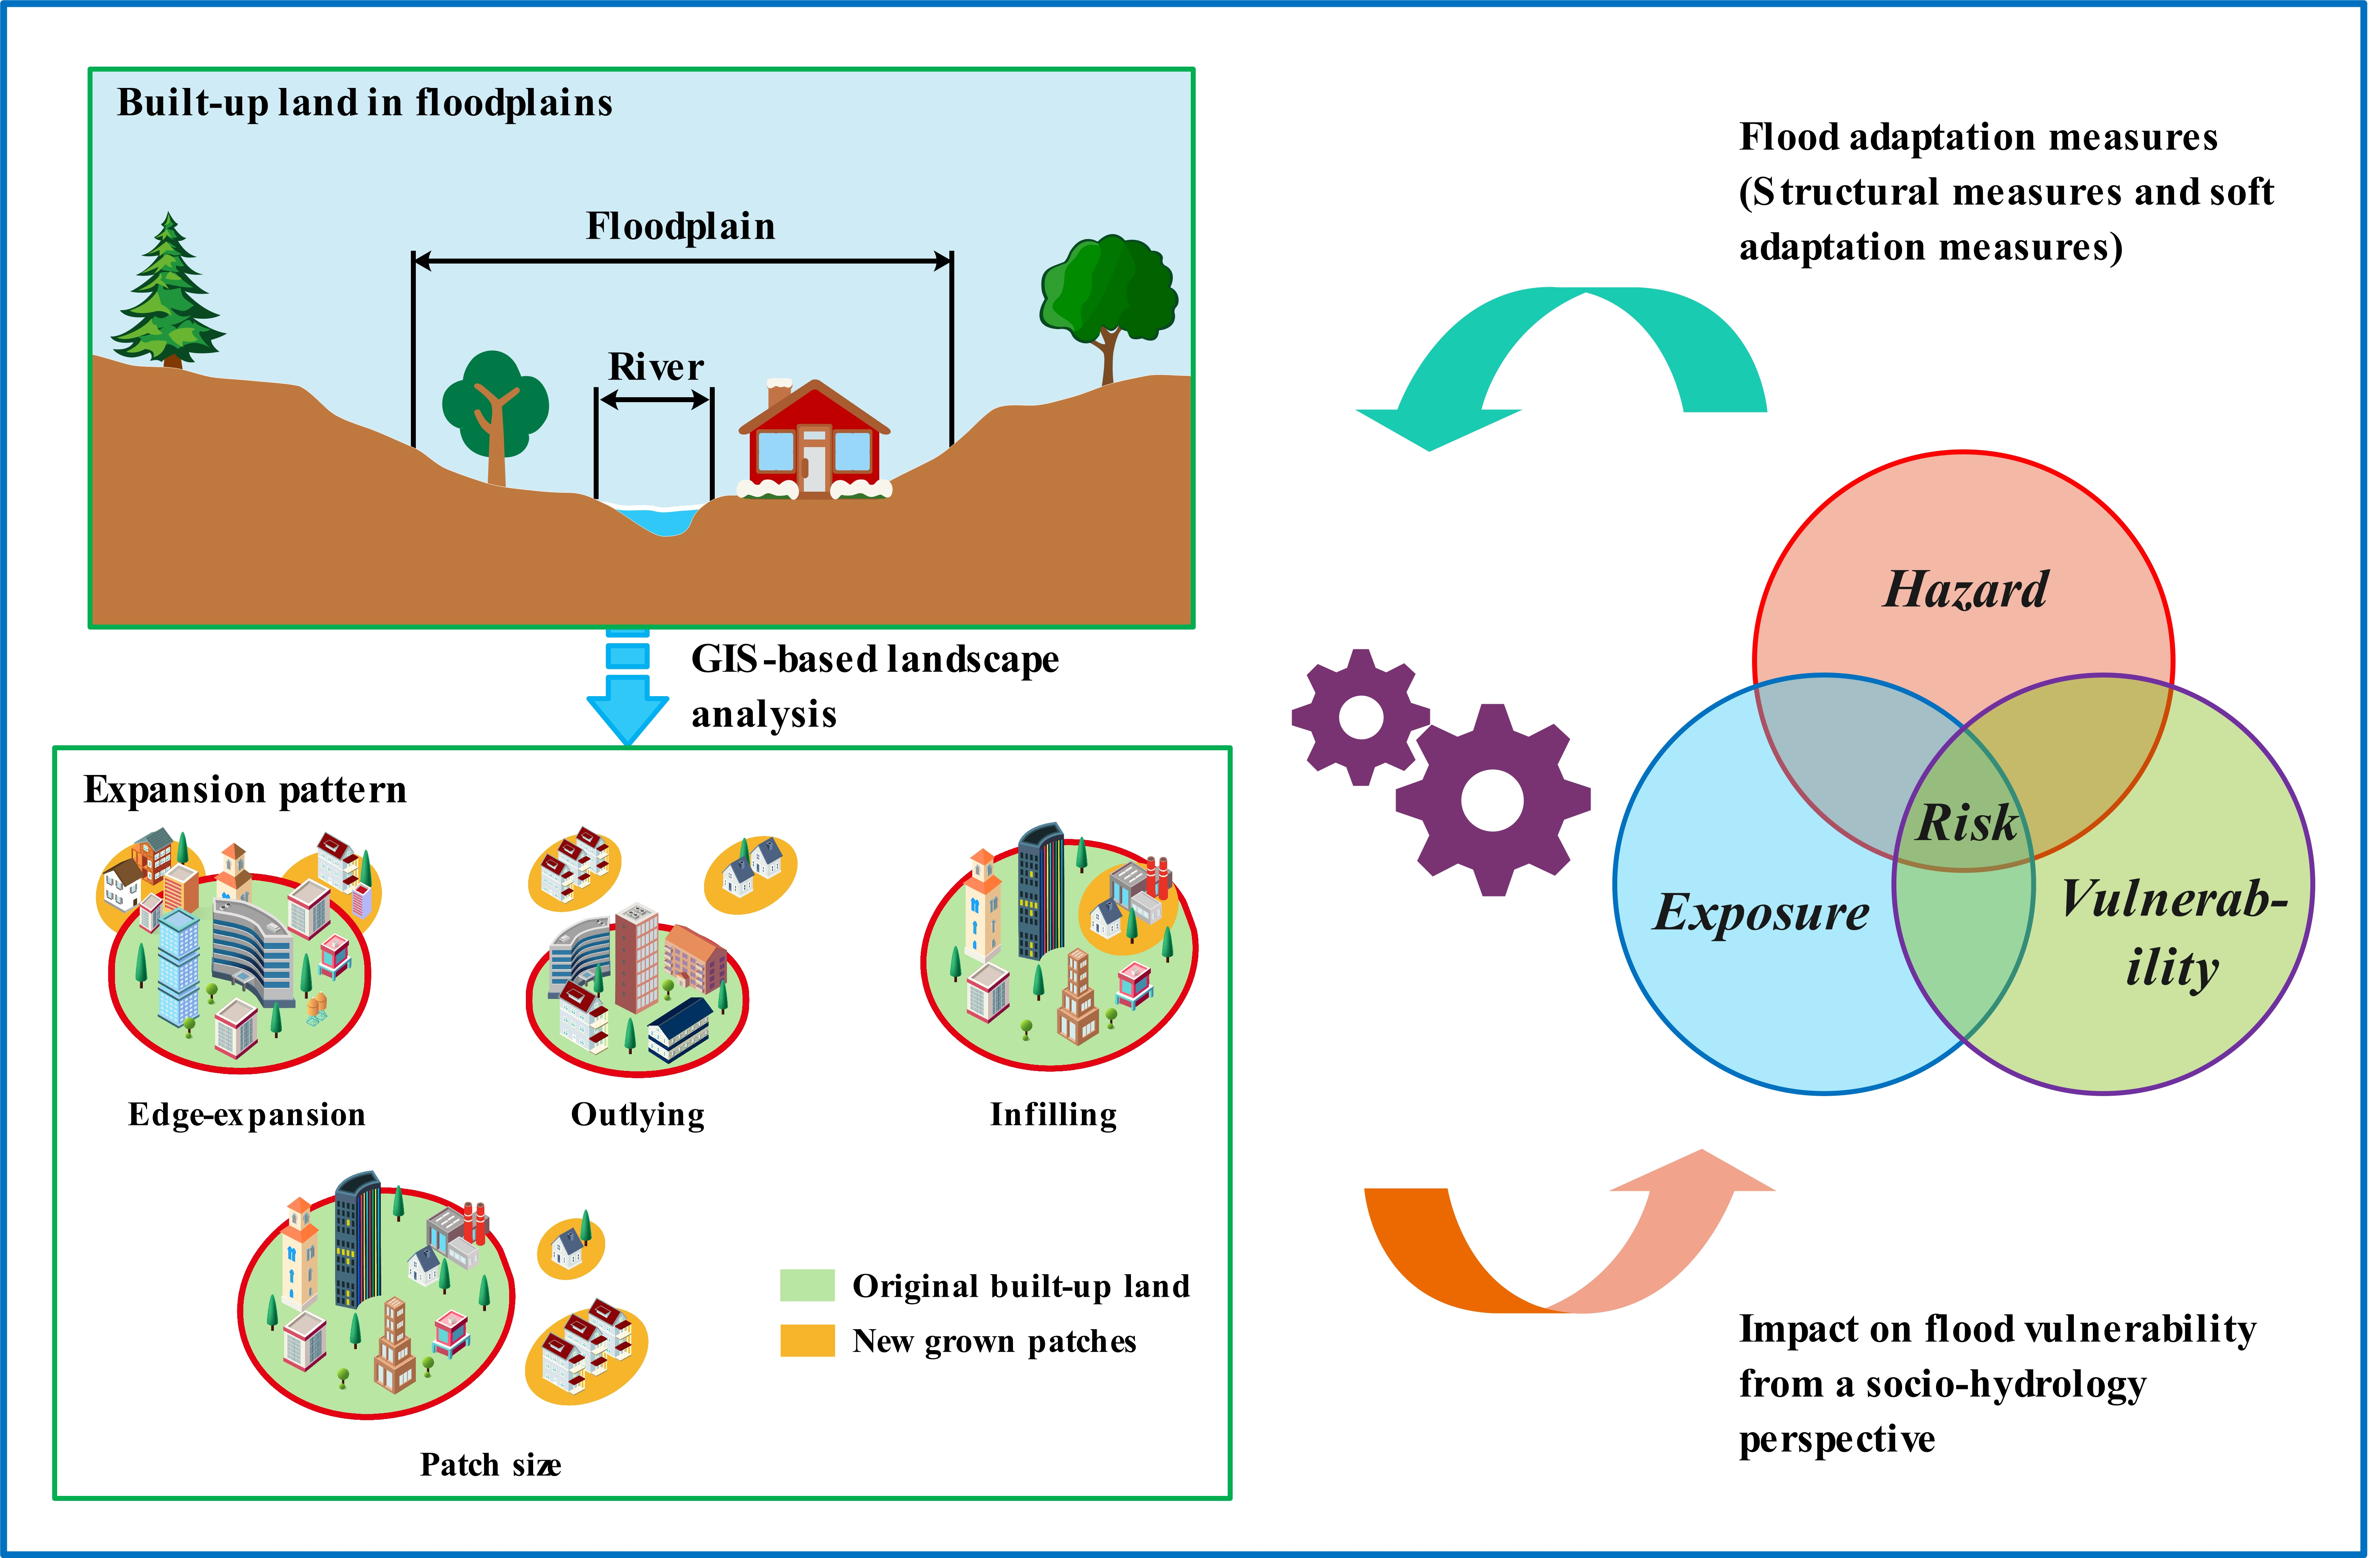
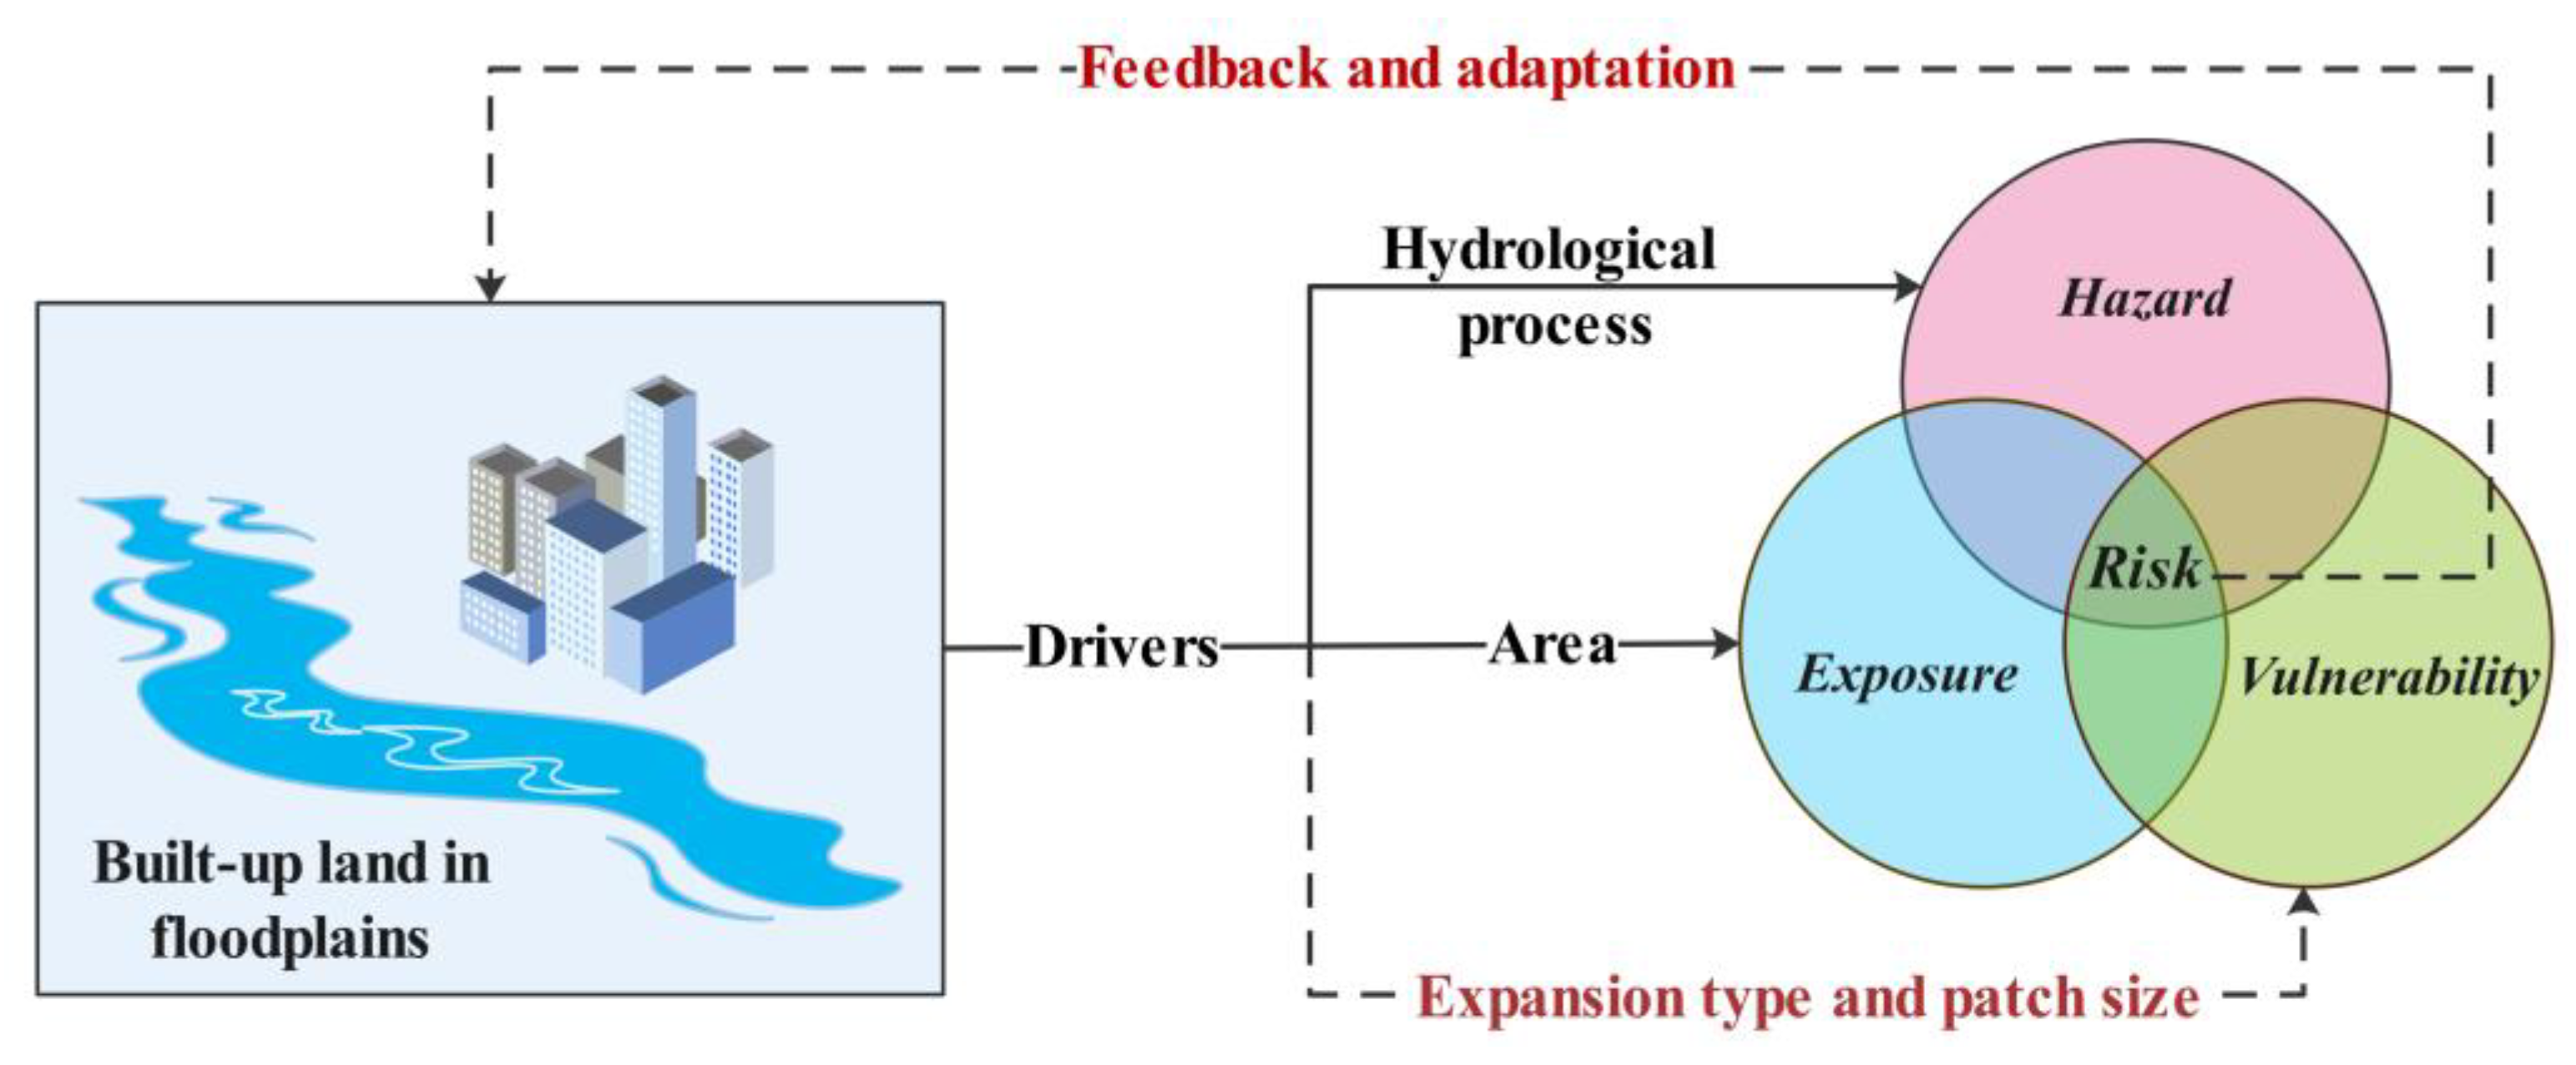
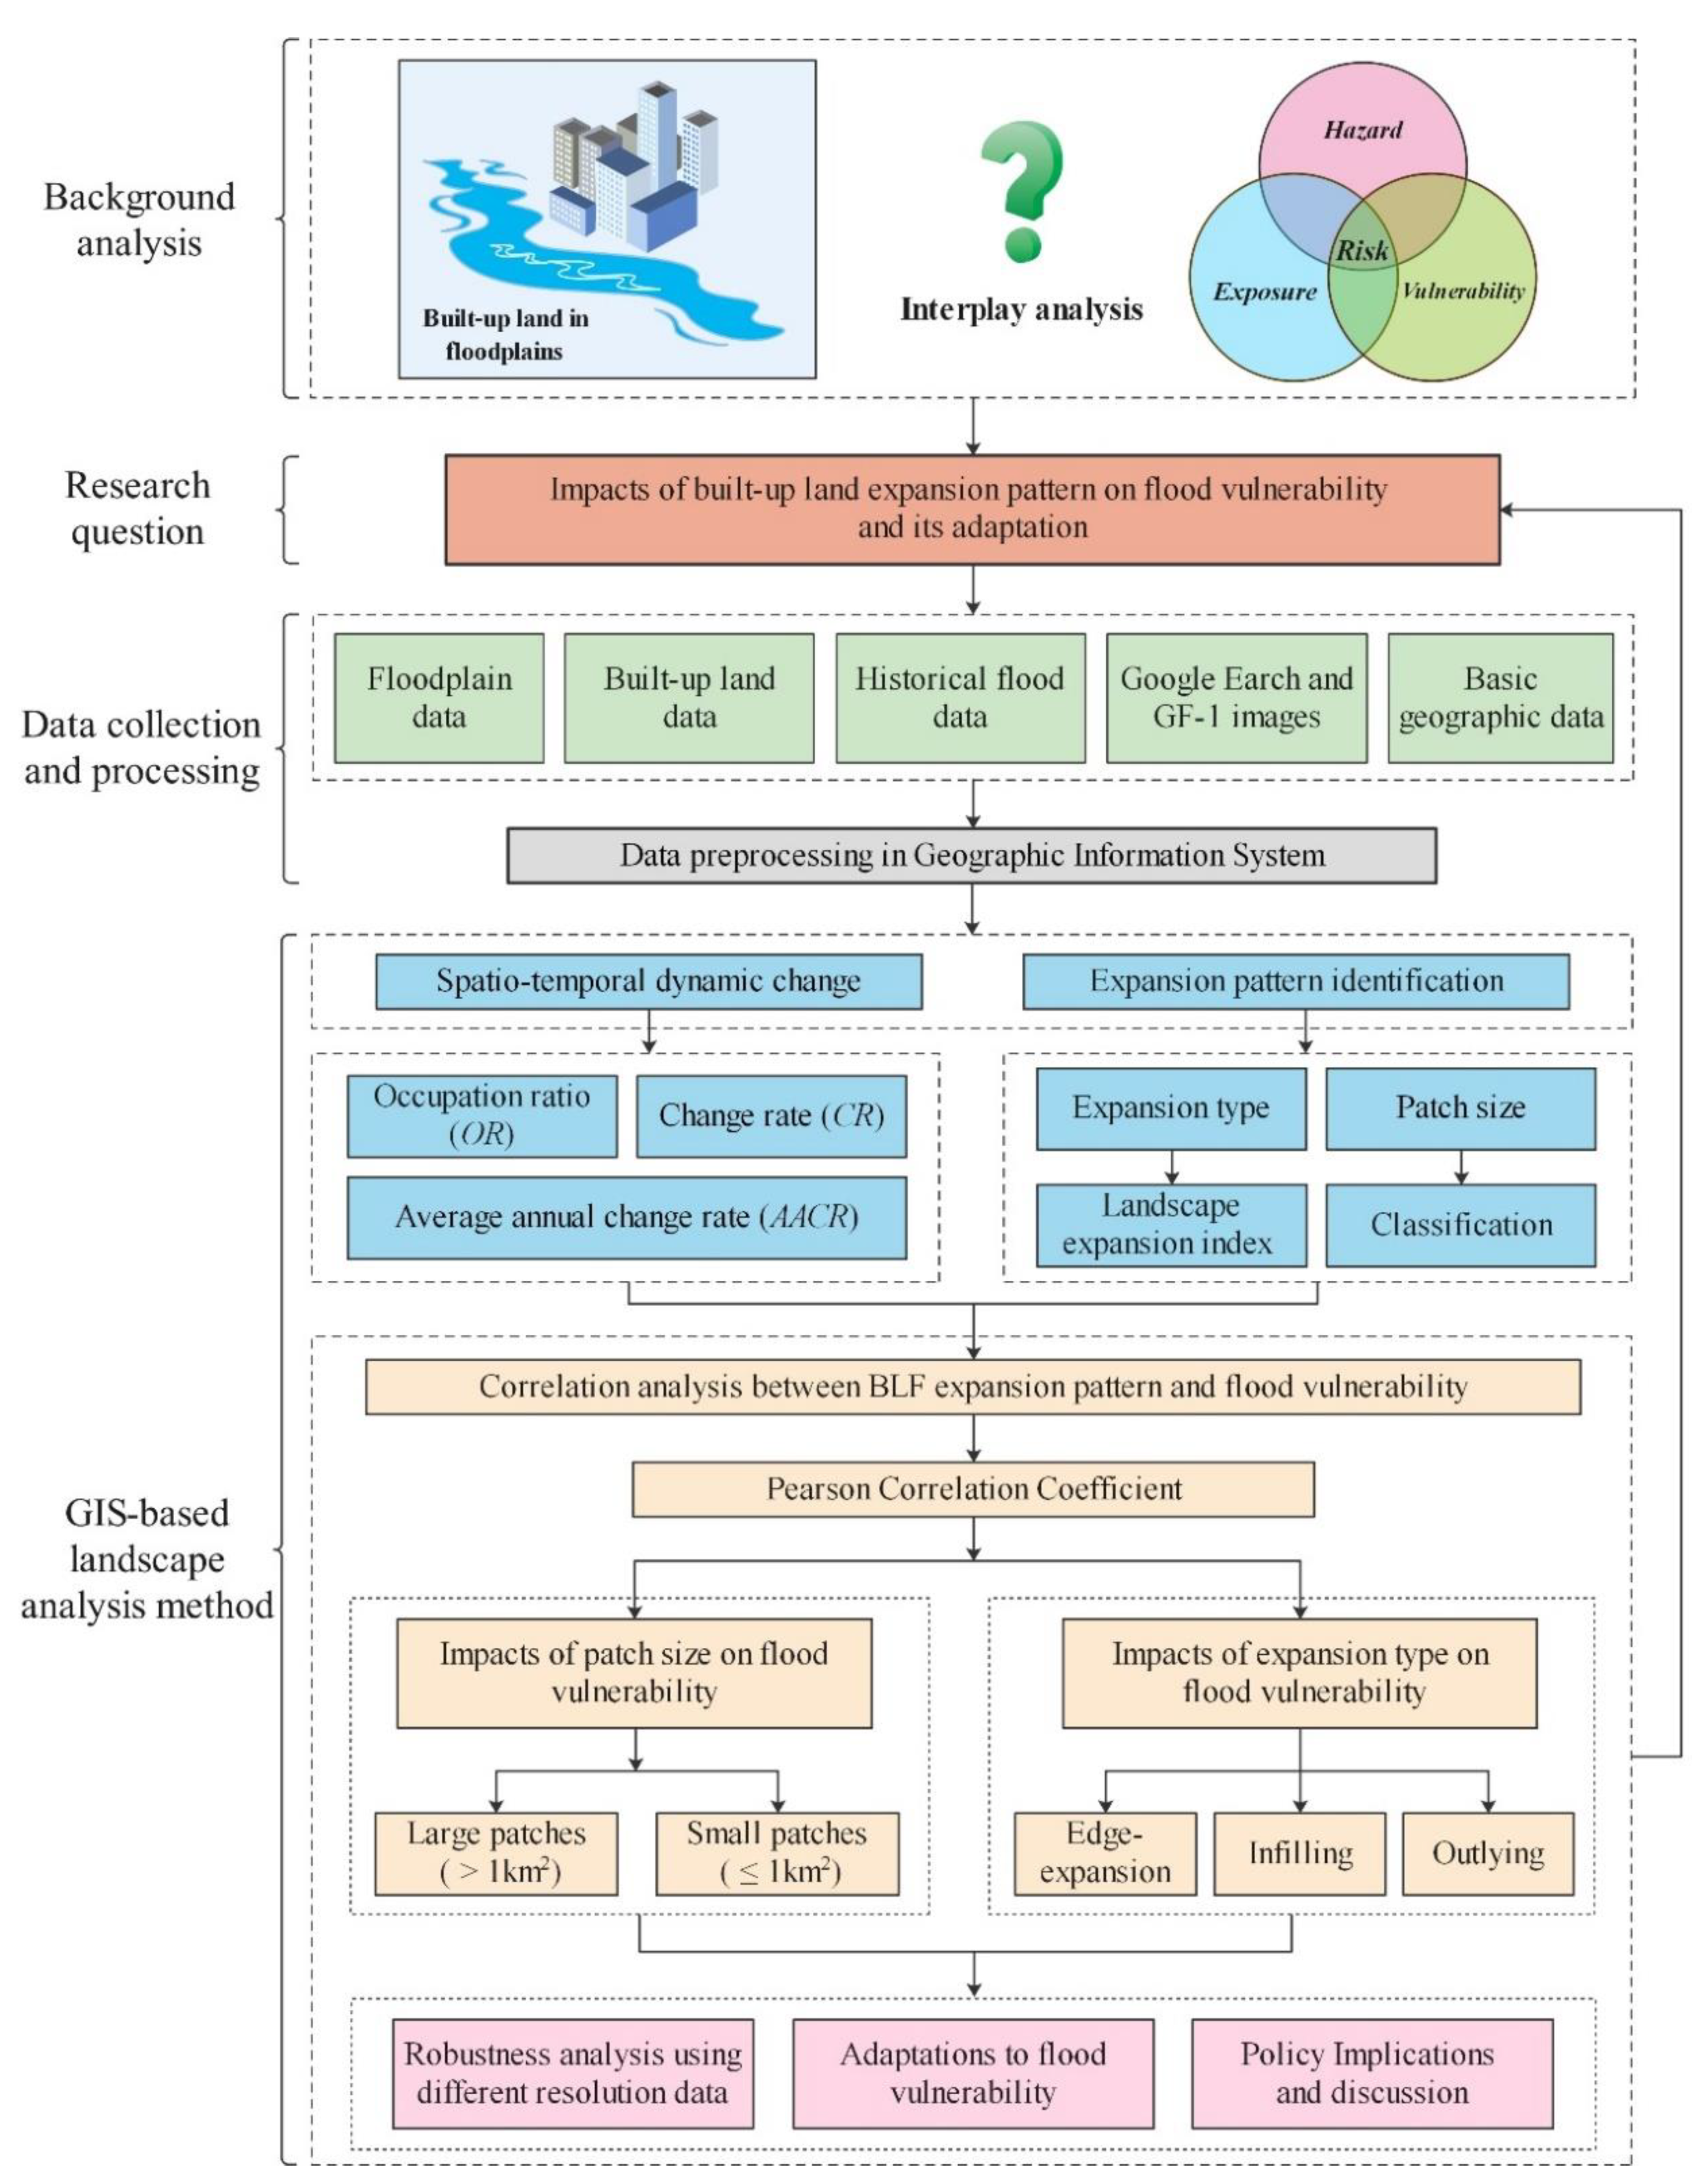
2.3.1. Overall Framework

The overall framework is shown in Figure 4. The research issue was put forward in the interaction analysis between BLF expansion and flood risk systems. In this paper, our study mainly used the GIS (geographic information system) -based landscape analysis method. First, three landscape indices (occupancy ratio, change rate, and average annual change rate) were used to examine the spatial distribution and dynamic change of BLF patches from 1975 to 2014. Second, the landscape expansion index (LEI) was employed to identify the expansion type of BLF growth patches in different periods (1975–1990–2000–2014). Meanwhile, the sensitivity analysis was used to determine the buffer distance in LEI. Then, the Pearson correlation coefficient (PPC) was employed to analyze the relationship of BLF expansion pattern (patch size and expansion type) and flood vulnerability. Subsequently, we discussed the stability of the correlation between the BLF expansion pattern and flood vulnerability using the built-up land data with different resolutions (150 m, 250 m, 500 m, and 1000 m). Eventually, policy suggestions and flood adaptation strategies were proposed to mitigate flood losses and promote sustainable development in the floodplain.

2.3.2. Landscape Metrics of Built-Up Land in Floodplains

Three landscape metrics were used to examine the spatio-temporal variation of BLF in three periods (1975–1990–2000–2014). OR(i) represents the occupation ratio of the BLF area to the floodplain area in zone i. In other words, it indicates the BLF building density of the floodplain in each district and county, and its expression is shown in Equation (1).
O R ( i ) = B L F ( i ) F P ( i ) × 100
where zone i represents the i-th district or county of the research area; BLF(i) and FP(i) are the areas of built-up land and floodplain in the i-th district or county.
To investigate the dynamics of the BLF area in the three periods, the change rate (CR) in the three periods was calculated using the Formula (2) [1].
C R = S T n + 1 S T n S T n × 100 %
where CR is the change rate of the BLF; Tn+1 and Tn represent the BLF areas in years n+1 and n, respectively.
Moreover, the average annual change rate (AACR) of BLF was calculated using the geometric average method [1]. This method calculates the average annual change rate by comparing the level of the last year of the interval with the base period. In addition, the total change rate in the interval is the continuous production of the growth rate of each period.
A A G R = ( V ( T n T 1 ) 1 ) × 100 % A A G R = ( V ( T n T 1 ) 1 ) × 100 %
V ( T n T 1 ) = φ T 2 φ T 1 × φ T 3 φ T 2 × × φ T n φ T n 1 ( T n T 1 ) = φ T n φ T 1 ( T n T 1 )
where AACR is the average annual change rate of the BLF; T1 and Tn represent the base year and the last year of the time interval, respectively. V is the chain ratio product of the BLF area each year during the study period, and its expression is shown in Equation (4). φTn and φT1 are BLF area in years of Tn and T1 (i.e., the base year) in the time interval, respectively.

2.3.3. Patch Size Classification of the Built-Up Land in Floodplains

Patches are the basic components of landscape patterns, which refers to relatively homogeneous non-linear areas that differ from the surrounding background [28]. To detect the impact of different patch sizes on flood vulnerability, we initially needed to classify the patch sizes of newly growing BLF in the study area. Based on previous studies on the composition and frequency distribution of urban patches in the North China Plain, we finally divided BLF patches into four classes: ≤0.1, 0.1–1, 1–10, and >10 km2 [11]. Moreover, we set 1 km as the threshold value for distinguishing large (>1 km2) and small (≤1 km2) BLF patches. Then, we quantified the number and area of the new growth BLF under different patch sizes in each period using the GIS-based landscape analysis method.

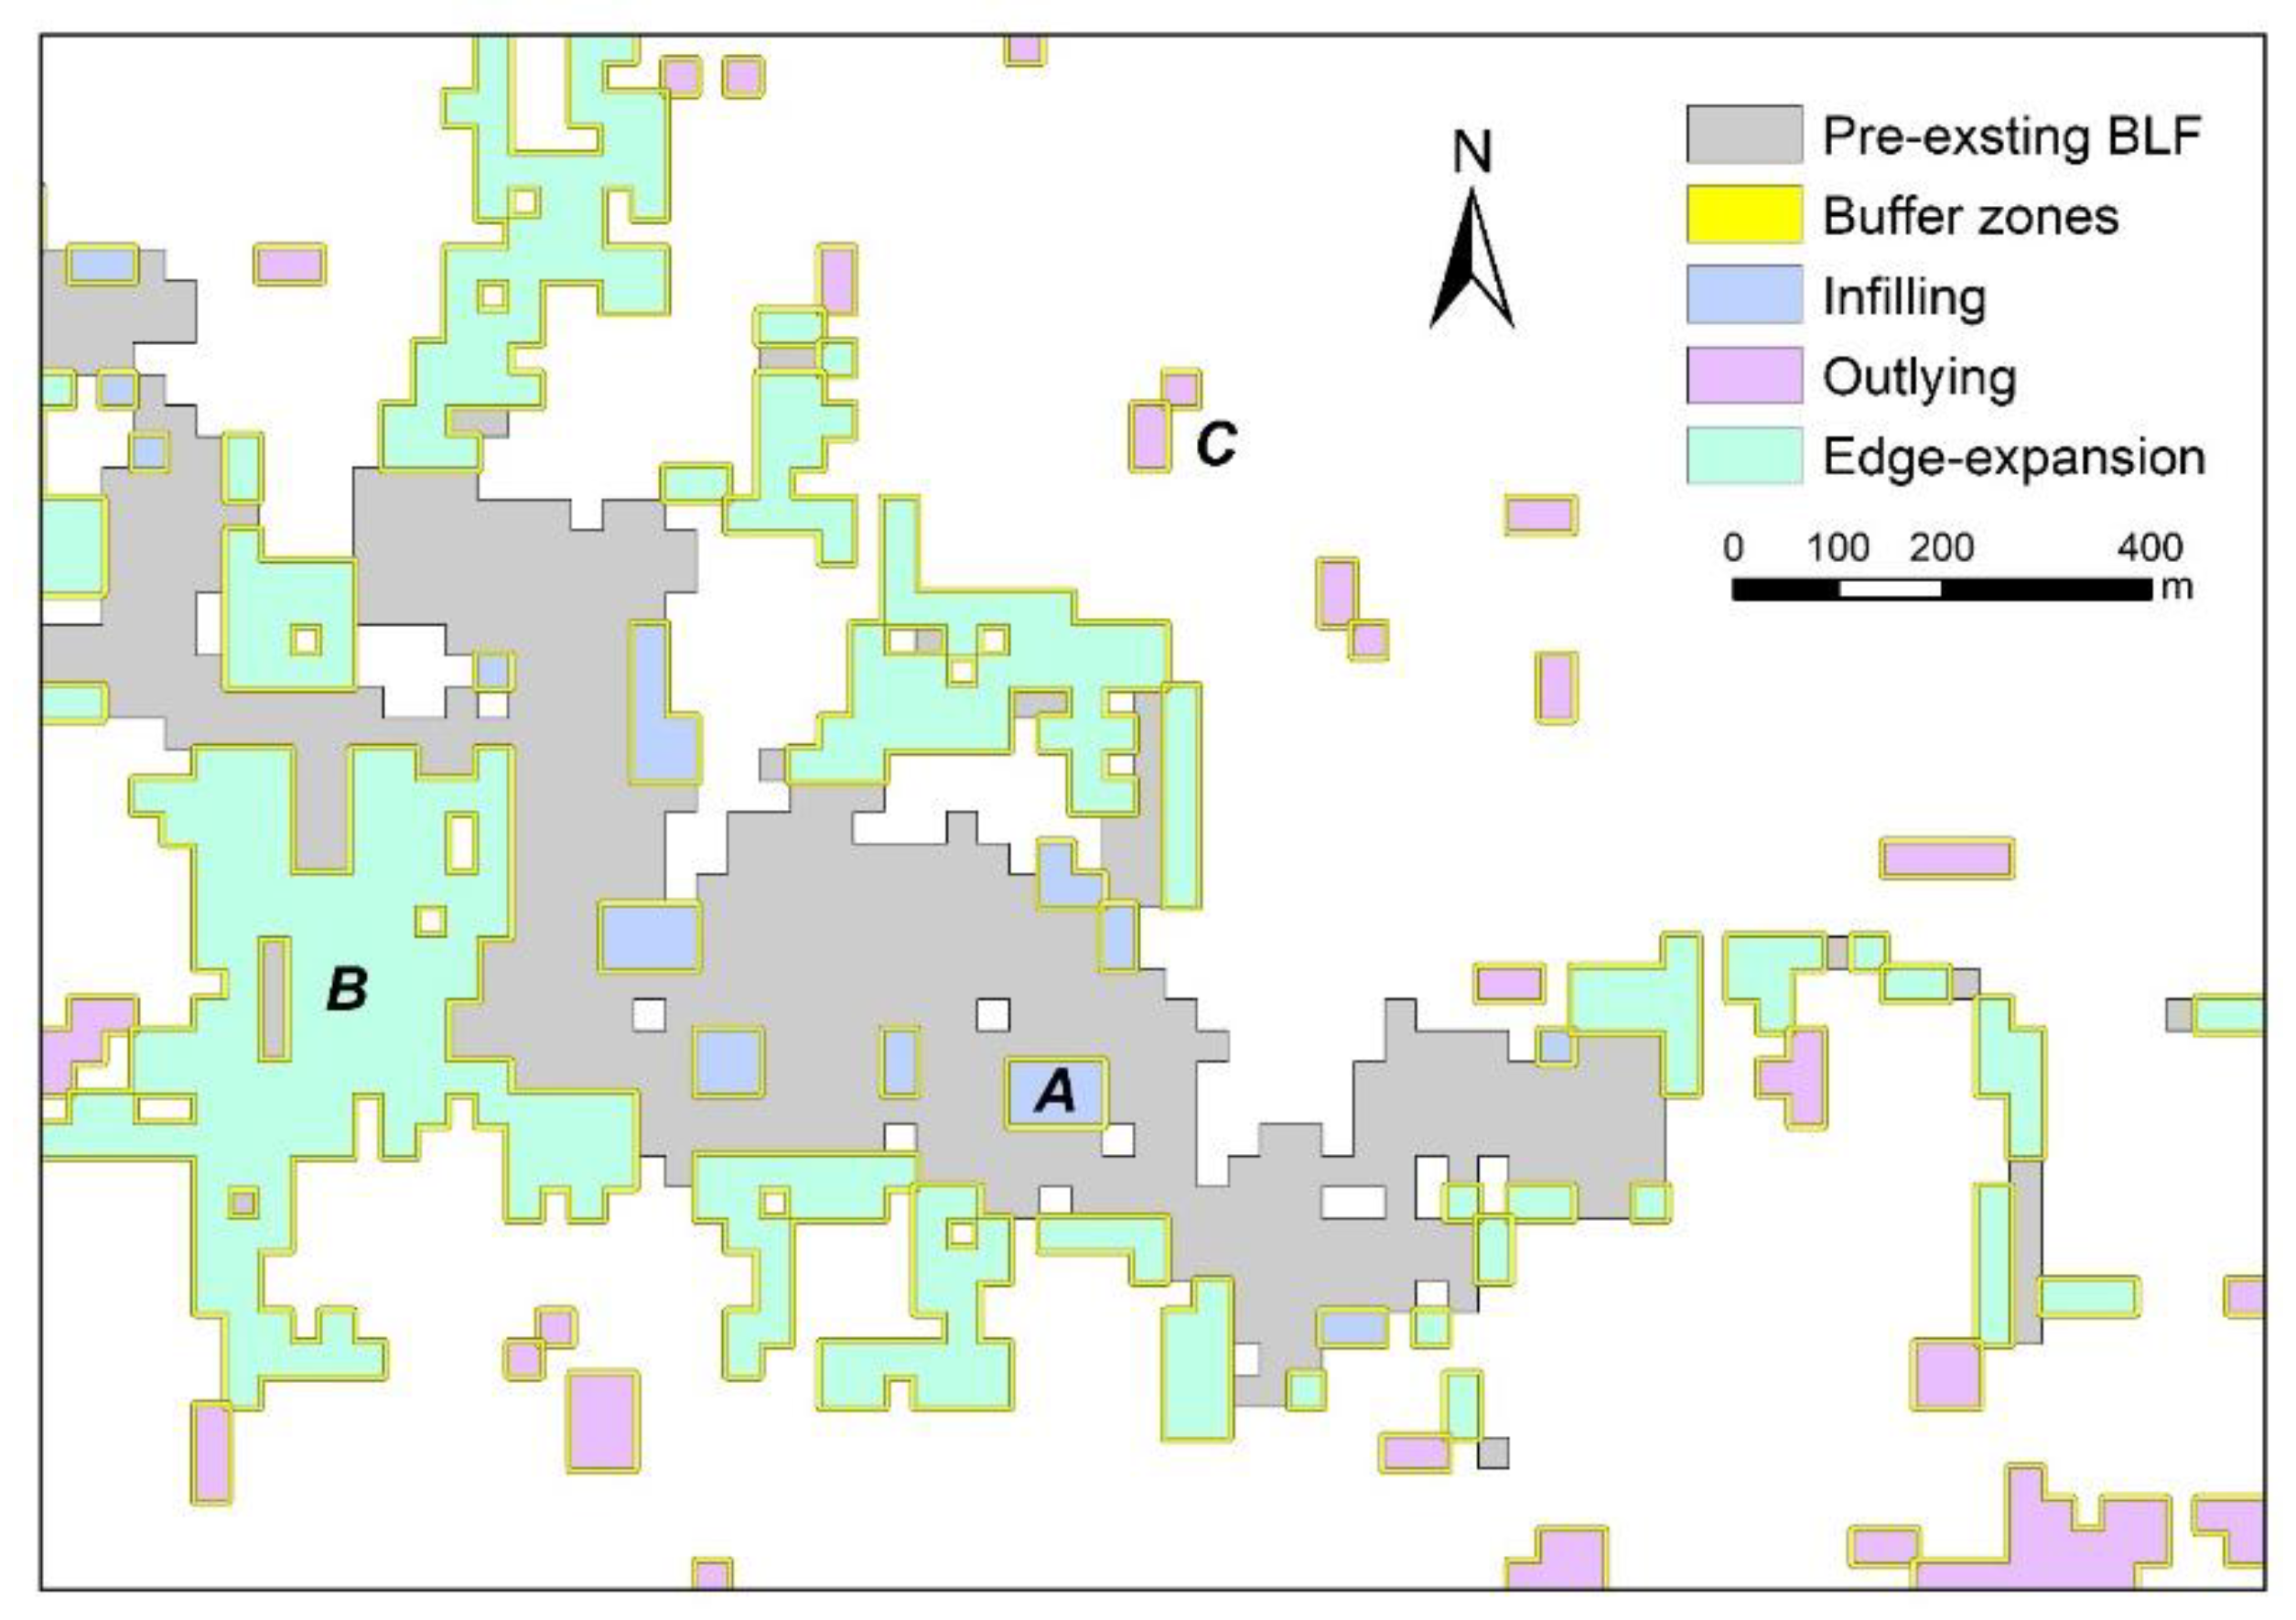
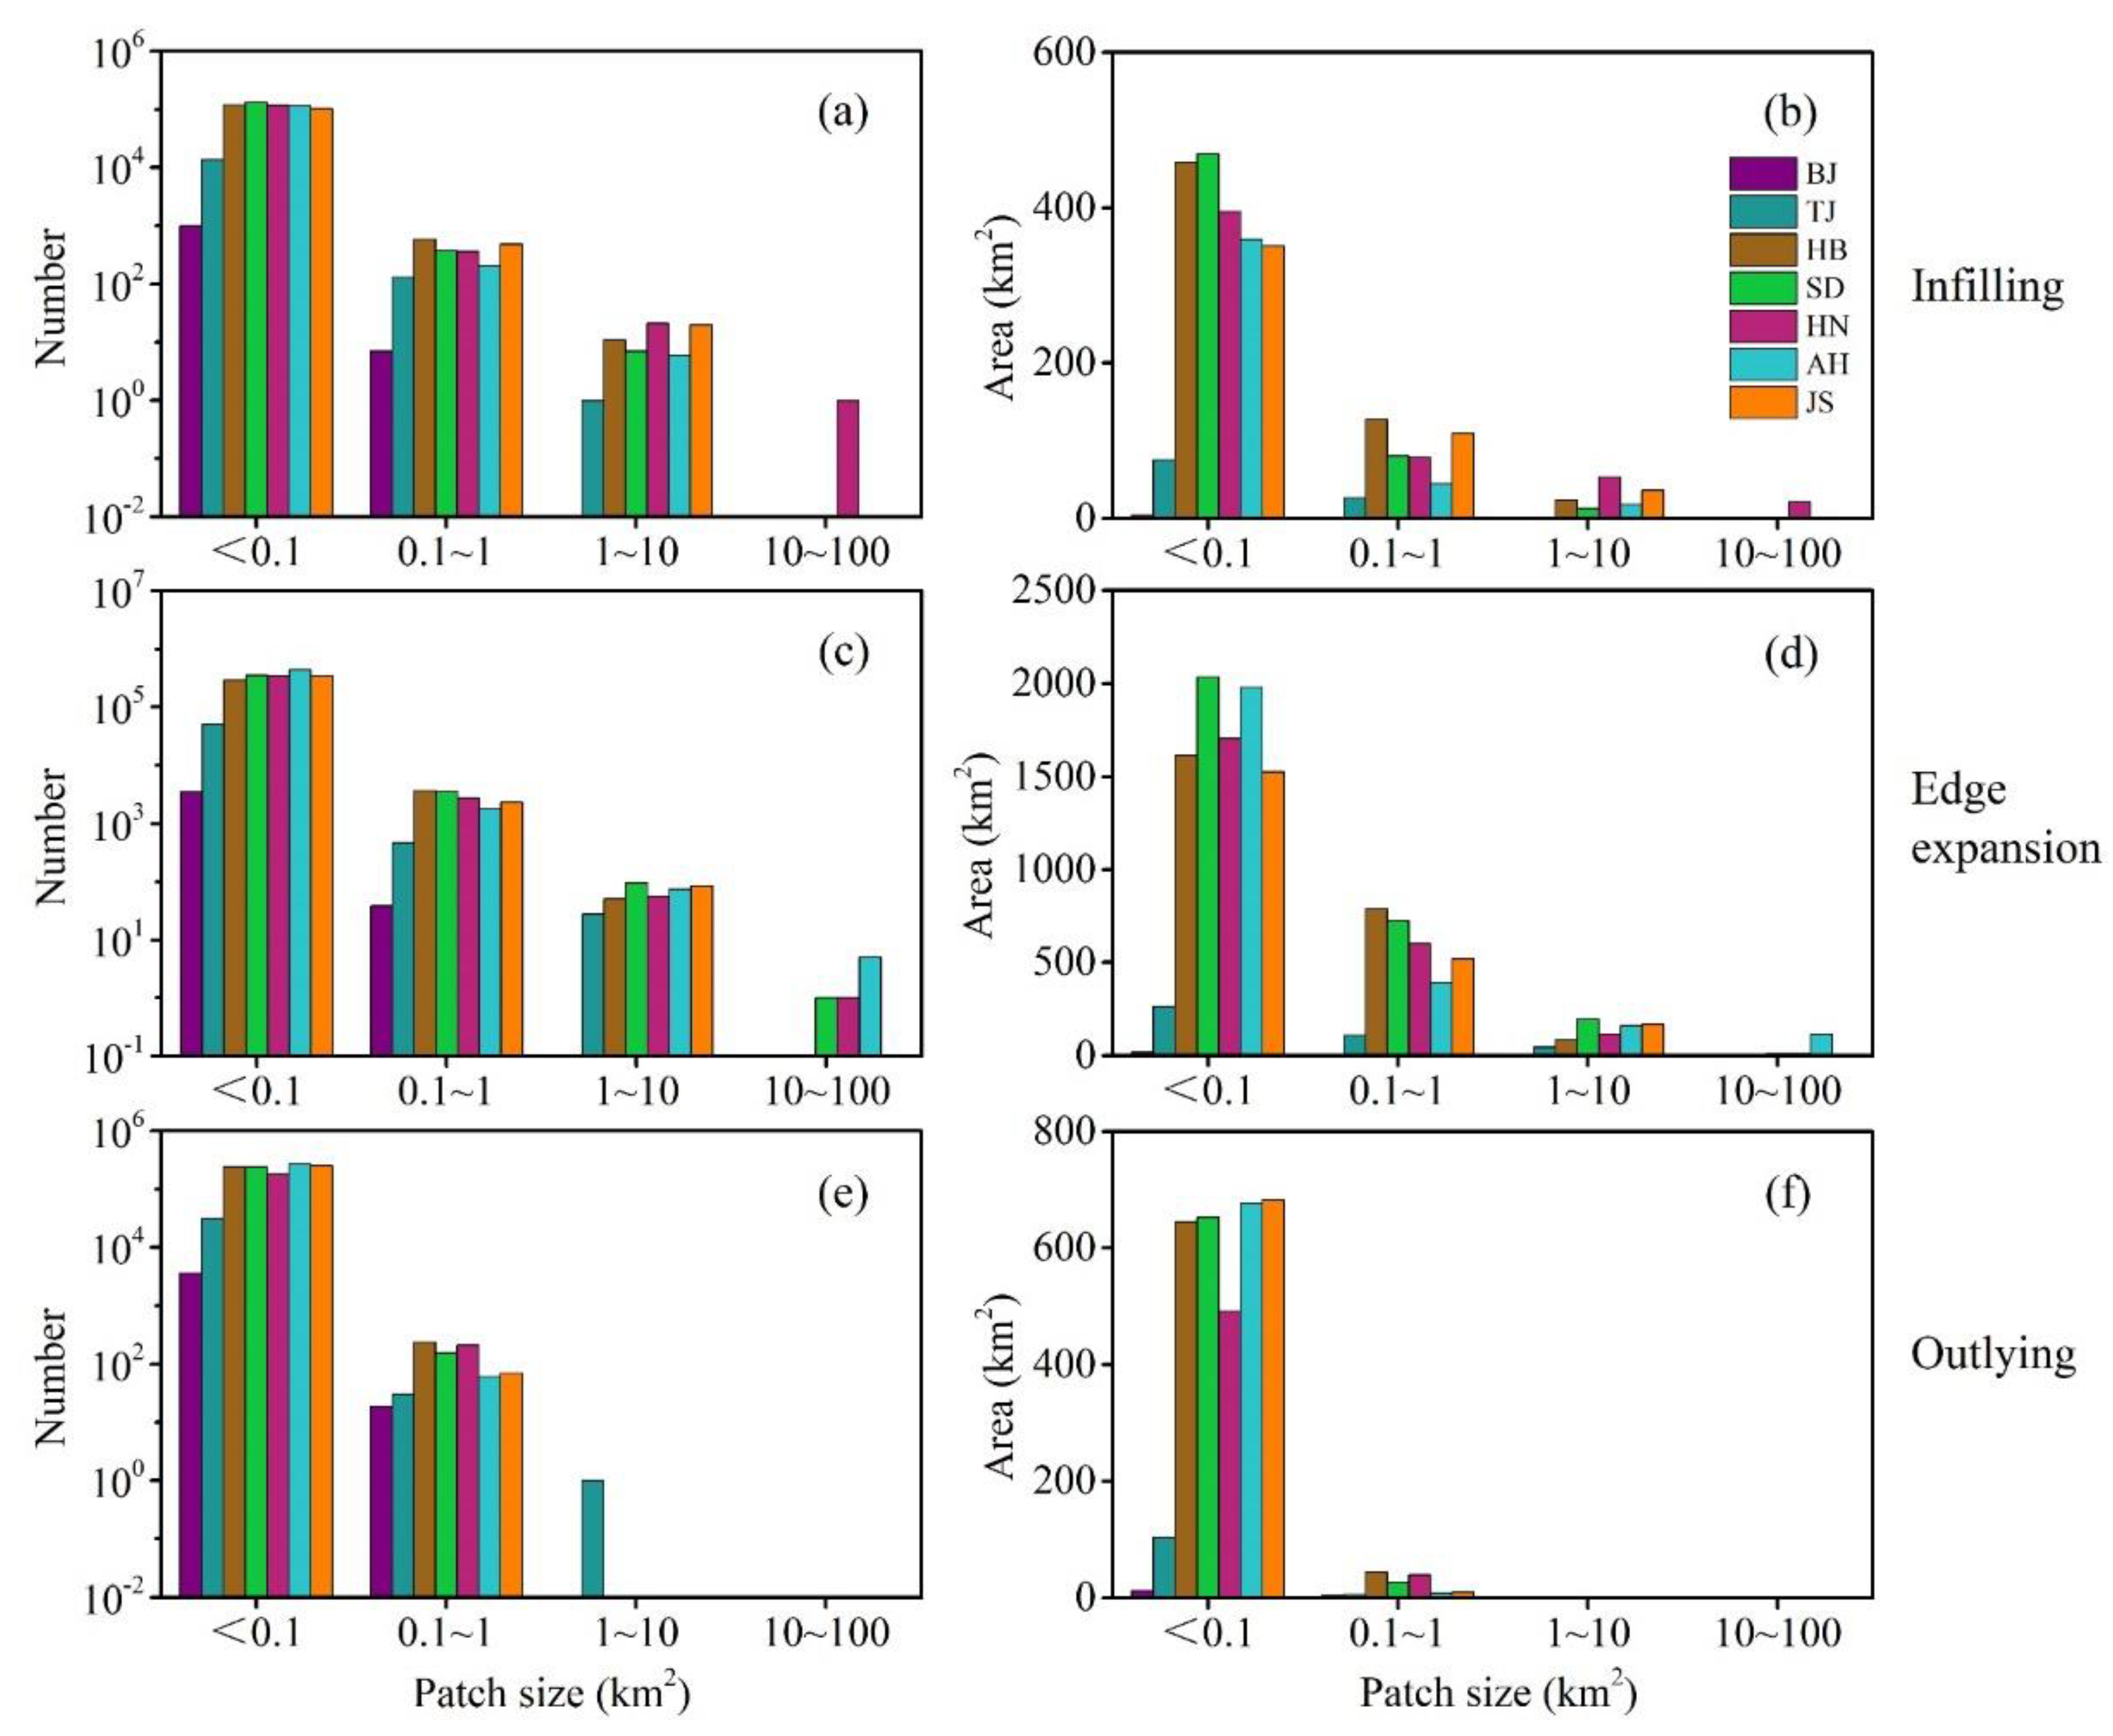
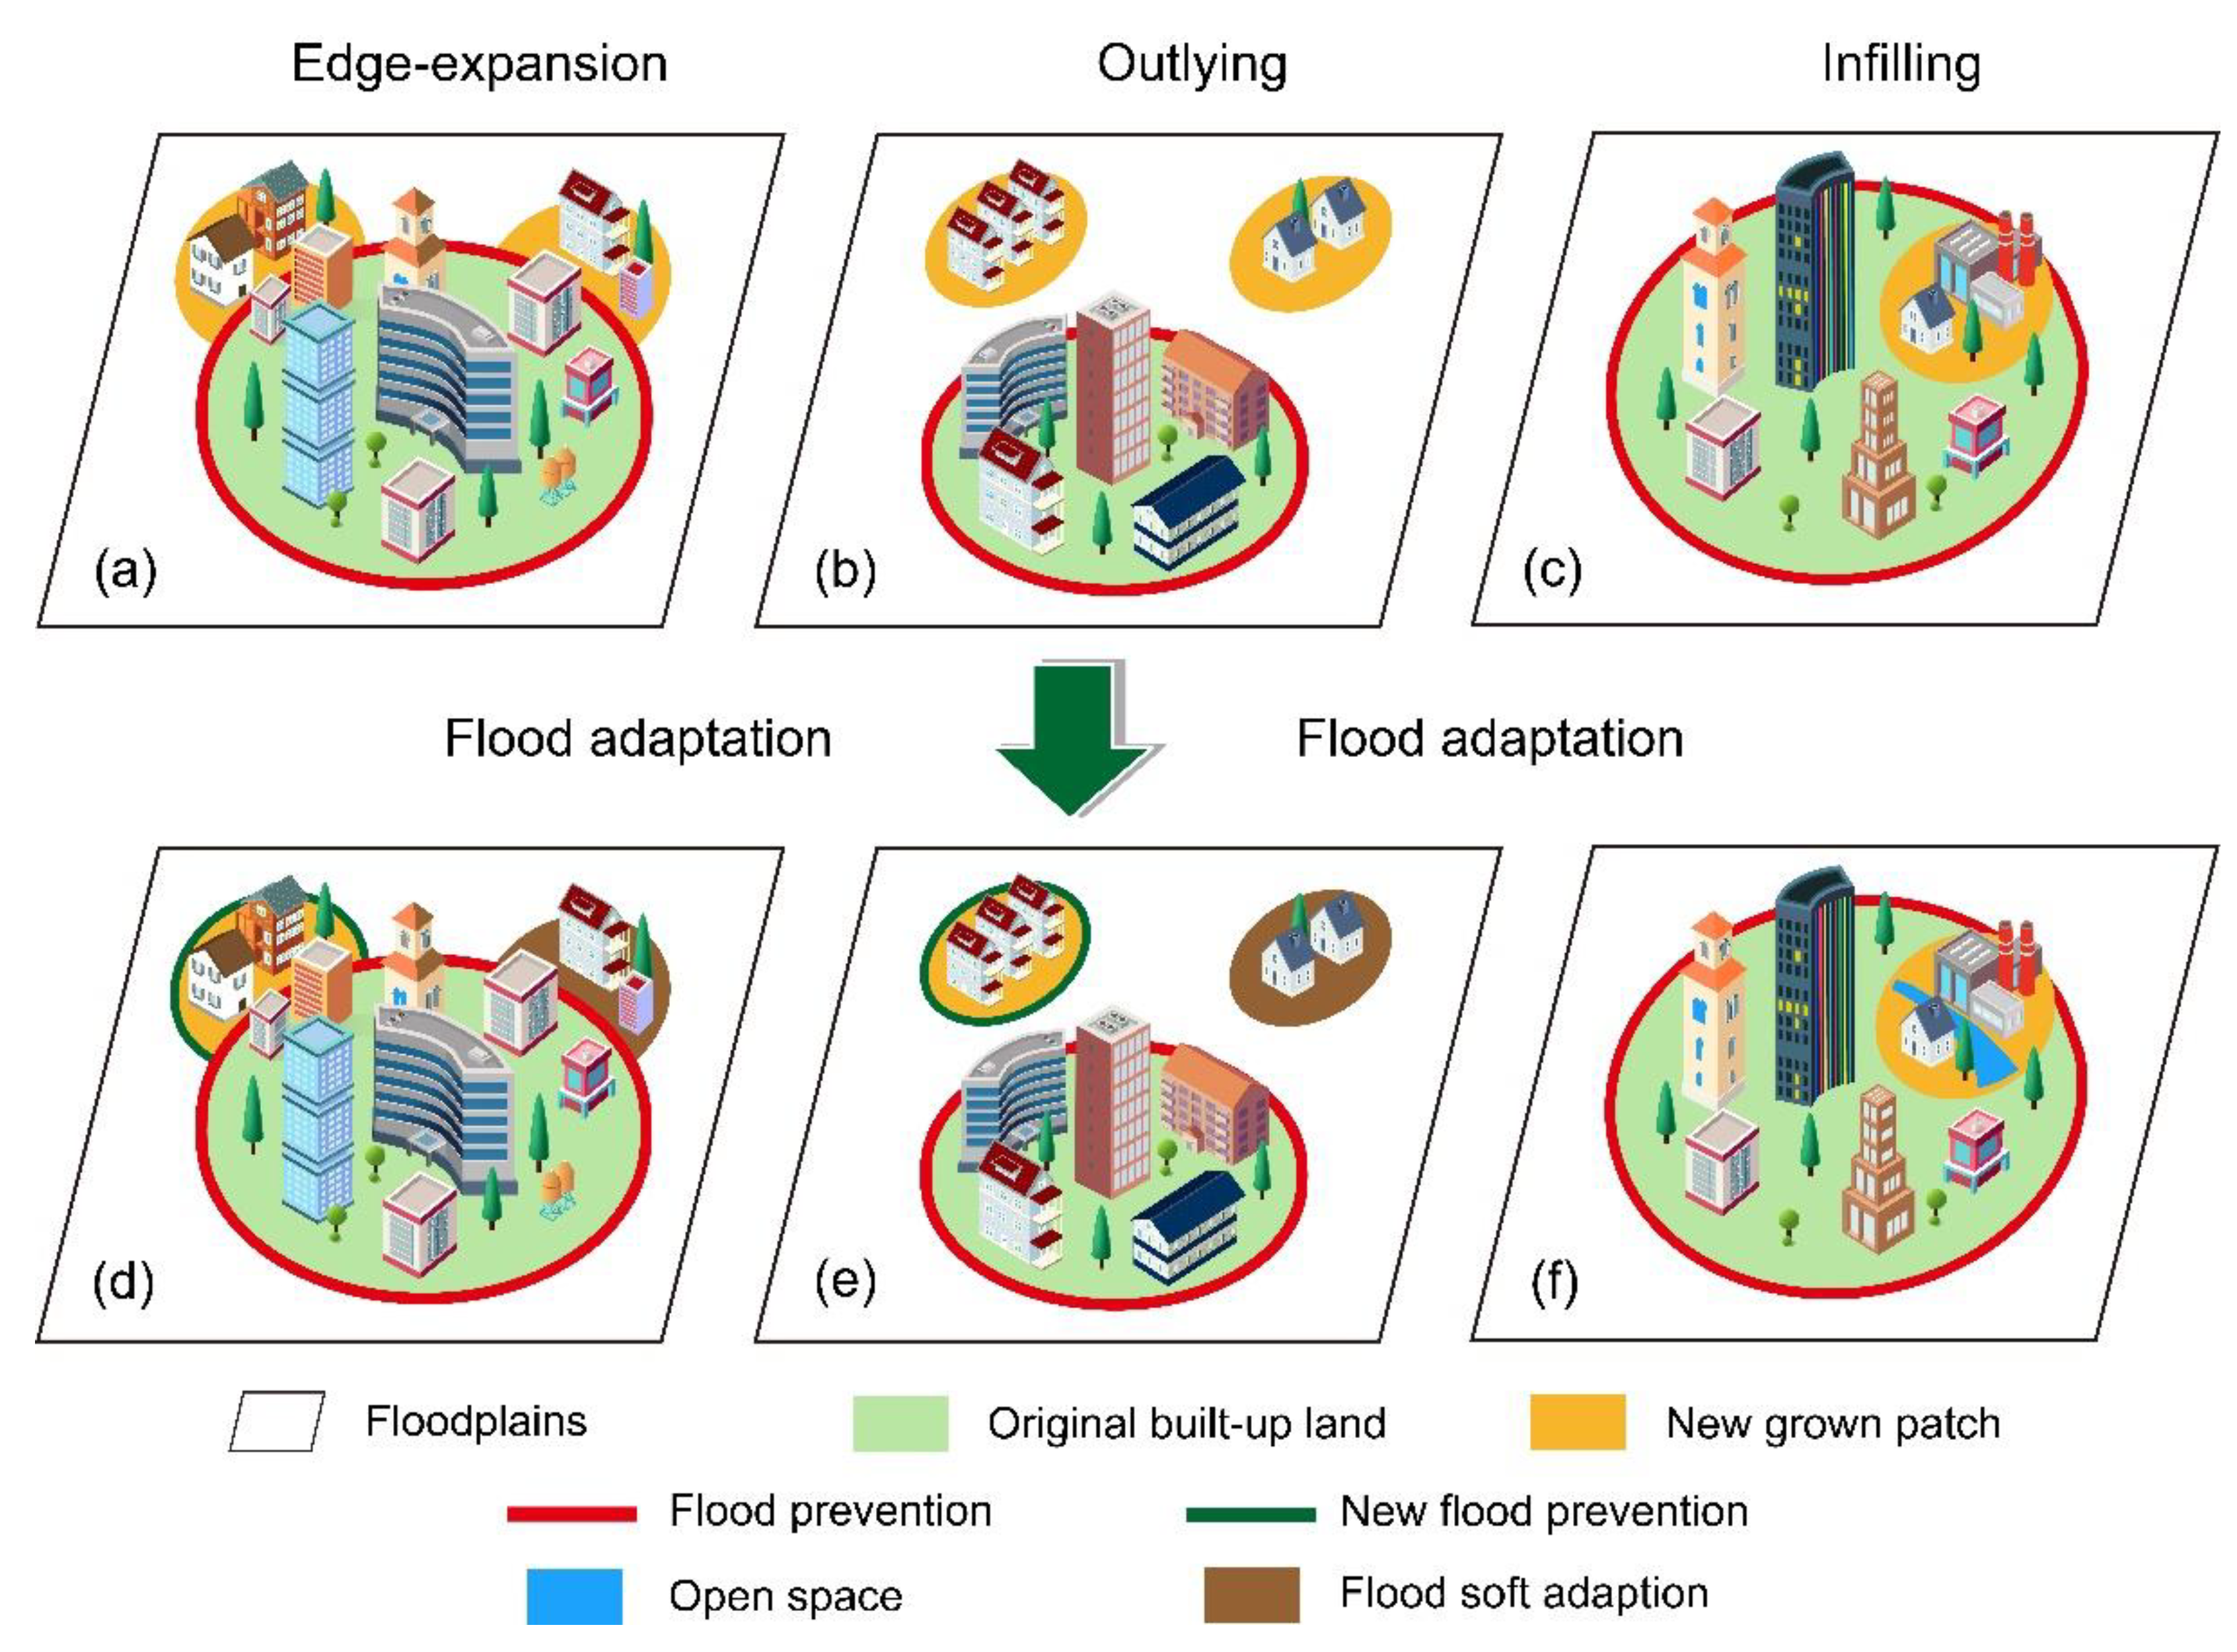
2.3.4. Expansion Type Identification of New Built-Up Land in Floodplains
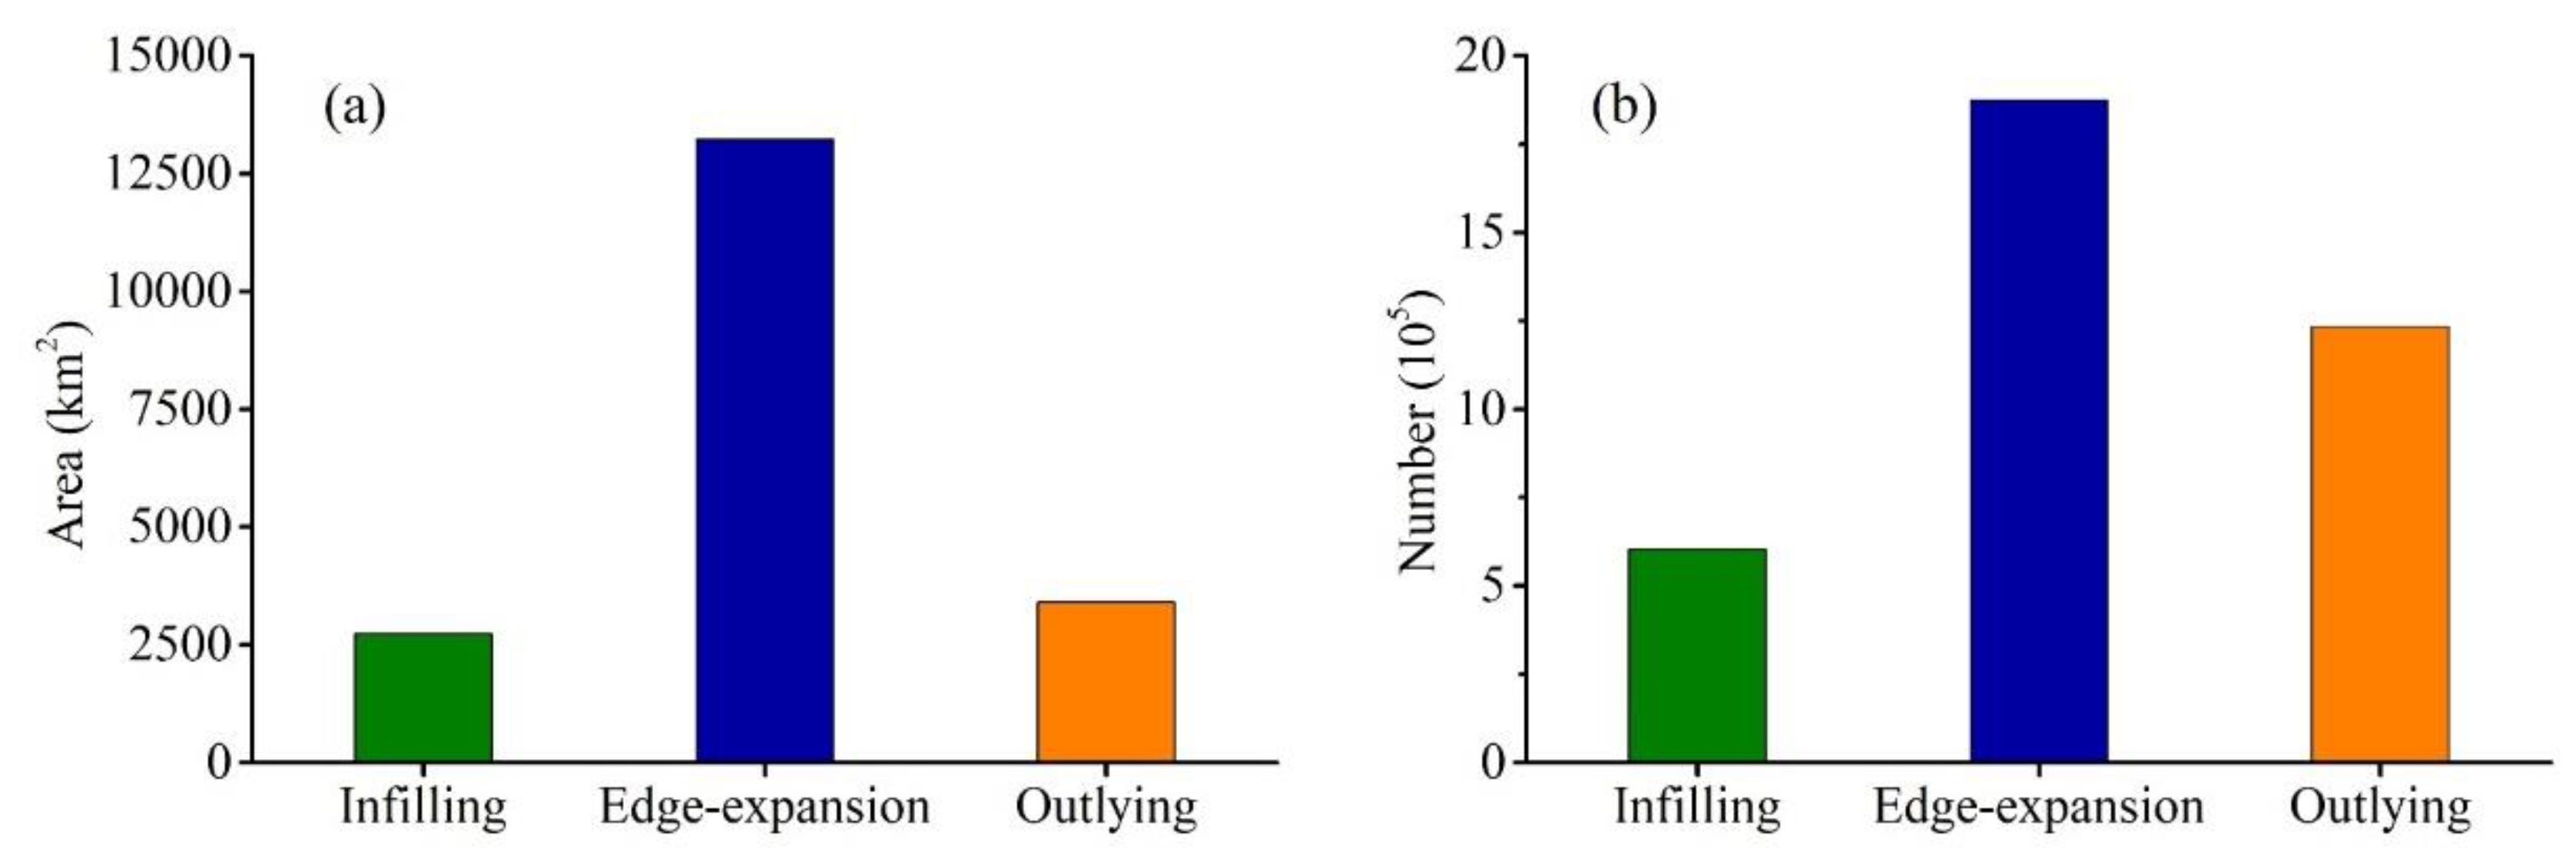
The landscape expansion index (LEI) proposed by Liu et al. was employed to distinguish the BLF expansion types [28]. Figure 5 shows the identification principle of different expansion types of new BLF patches. The LEI determines the expansion types based on the buffer analysis between the pre-existing and new BLF patches (Formula (5)).
L E I = A B L F A B L F + A N B L F × 100
where LEI indicates the landscape expansion index of new BLF patches; ABLF and ANBLF are the areas of the new BLF patches and non-BLF patches in the buffer zones of the original BLF patches, respectively. According to Figure 4, the new BLF patches can be divided into three expansion types [11,28].
(1)
If the new BLF patches belong to the infilling type, most of their buffer areas will be occupied by pre-existing BLF patches (Figure 5A).
(2)
If a newly grown patch is an edge-expansion type, the buffer zone is mixed with the pre-existing BLF patches and vacant land (i.e., non-built-up land) (Figure 5B).
(3)
The buffer zone of outlying patches is composed exclusively of vacant land (Figure 5C).
According to the definition of LEI in Equation (5), the calculated values of LEI range from 0 to 100. They are assigned as an infilling type if the LEI values of new BLF patches are between 50 and 100 (i.e., 50 < LEI ≤ 100). If the calculated LEI values are between 0 and 50 (excluding 0), the patches are classified as edge-expansion type. Moreover, if there is no intersection between new BLF patch buffer zones and old patches (i.e., LEI = 0), new patches are divided into outlying type [28]. The above method was utilized to identify the expansion types of new BLF patches in the NPCA in three periods.

2.3.5. Buffer Distance Setting in the Landscape Expansion Index

The buffer distance setting is essential for distinguishing the expansion types of new BLF patches in the LEI method. In general, the buffer distance should be roughly equal to or less than the spatial resolution of remote sensing data (i.e., the buffer distance ≤30 m) [29]. However, it remains a question whether using different buffer distances significantly affects the value of the LEI. To detect the effect of the buffer distance, ten different buffer distances were selected to perform a sensitivity analysis on LEI. The ten buffer distances were set between 1 m and 30 m, which were 1, 2, 3, 4, 5, 10, 15, 20, 25, and 30 m, respectively. Then, we calculated the standard deviation (SD) of the LEI value of each newly grown patch under ten buffer distance values, which was used to test the sensitivity of the LEI (Formula (6)).
S D i = ( 1 / n ) j = 1 n ( M i j M ¯ i ) 2
where SDi represents the standard deviation of the i-th new LEI patch under different buffer distances; n (n = 10) is the total number of buffer distances; M i j is the LEI value of the i-th newly added patch at the j-th buffer distance; M ¯ i is the mean LEI value of the ith newly grown patch under different buffer distances.
Subsequently, the average standard deviation (ASD) of all newly grown BLF patches were calculated to measure the sensitivity of LEI. Here, a small ASD value indicates that the LEI value is more stable when the buffer distance changes.
A S D = 1 N ( S D i / N )
where ASD is the average standard deviation; N is the number of new BLF patches in each period.
Table 1 shows the sensitivity analysis results of LEI under the change of buffer distance. When the buffer distance varies between 1–5 m, the calculated values of ASD in the three periods are 0.074 (1975–1990), 0.072 (1990–2000), and 0.077 (2000–2014), respectively. However, the ASD values are 0.462 (1975–1990), 0.447 (1990–2000), and 0.471 (2000–2014) when the buffer distances are set between 10 and 30 m. Sensitivity analysis results show that LEI values are relatively robust when the buffer distances are set to 1–5 m. Therefore, the buffer distance of new BLF patches is set equal to 5 m in our research.

2.3.6. The Relationship between the Expansion Pattern and Flood Vulnerability

In terms of flood risk, we are concerned about whether different patch sizes and expansion types of new grown BLF aggravate or mitigate flood vulnerability (i.e., linear relationship). Thus, we used Pearson correlation coefficients (PPC) to investigate the relationship between flood vulnerability and the BLF expansion pattern. The PPC is a measure of the linear correlation degree between two conditioning factors, with values ranging from −1 to 1 (Formula (8)) [30,31]. Coefficient values of 1, −1, and 0 indicate that two variables are positive correlation (linear), negative correlation (linear), and non-linear correlation, respectively.
R X Y = i = 1 n ( X i X ¯ ) ( Y i Y ¯ ) i = 1 n ( X i X ¯ ) 2 i = 1 n ( Y i Y ¯ ) 2
where RXY indicates the relationship between flood occurrence and the BLF expansion pattern, Xi and Yi represent the new BLF area and the cumulative flood-affected area of the i-th prefecture-level city. X ¯ and Y ¯ are the average values of the new BLF area and cumulative flood area of all prefecture-level cities during the corresponding periods of Xi and Yi, respectively.
To detect whether the coarse resolution of built-up land affects the relationship between flood vulnerability and expansion type, we evaluated the correlation between the two at resolutions of 150, 250, 500, and 1000 m [29]. The built-up land with 250 m and 1000 m resolution was derived from the original dataset. The 150 m and 500 m datasets were resampled in the GIS using the majority method based on the 30 m resolution data.

3. Results

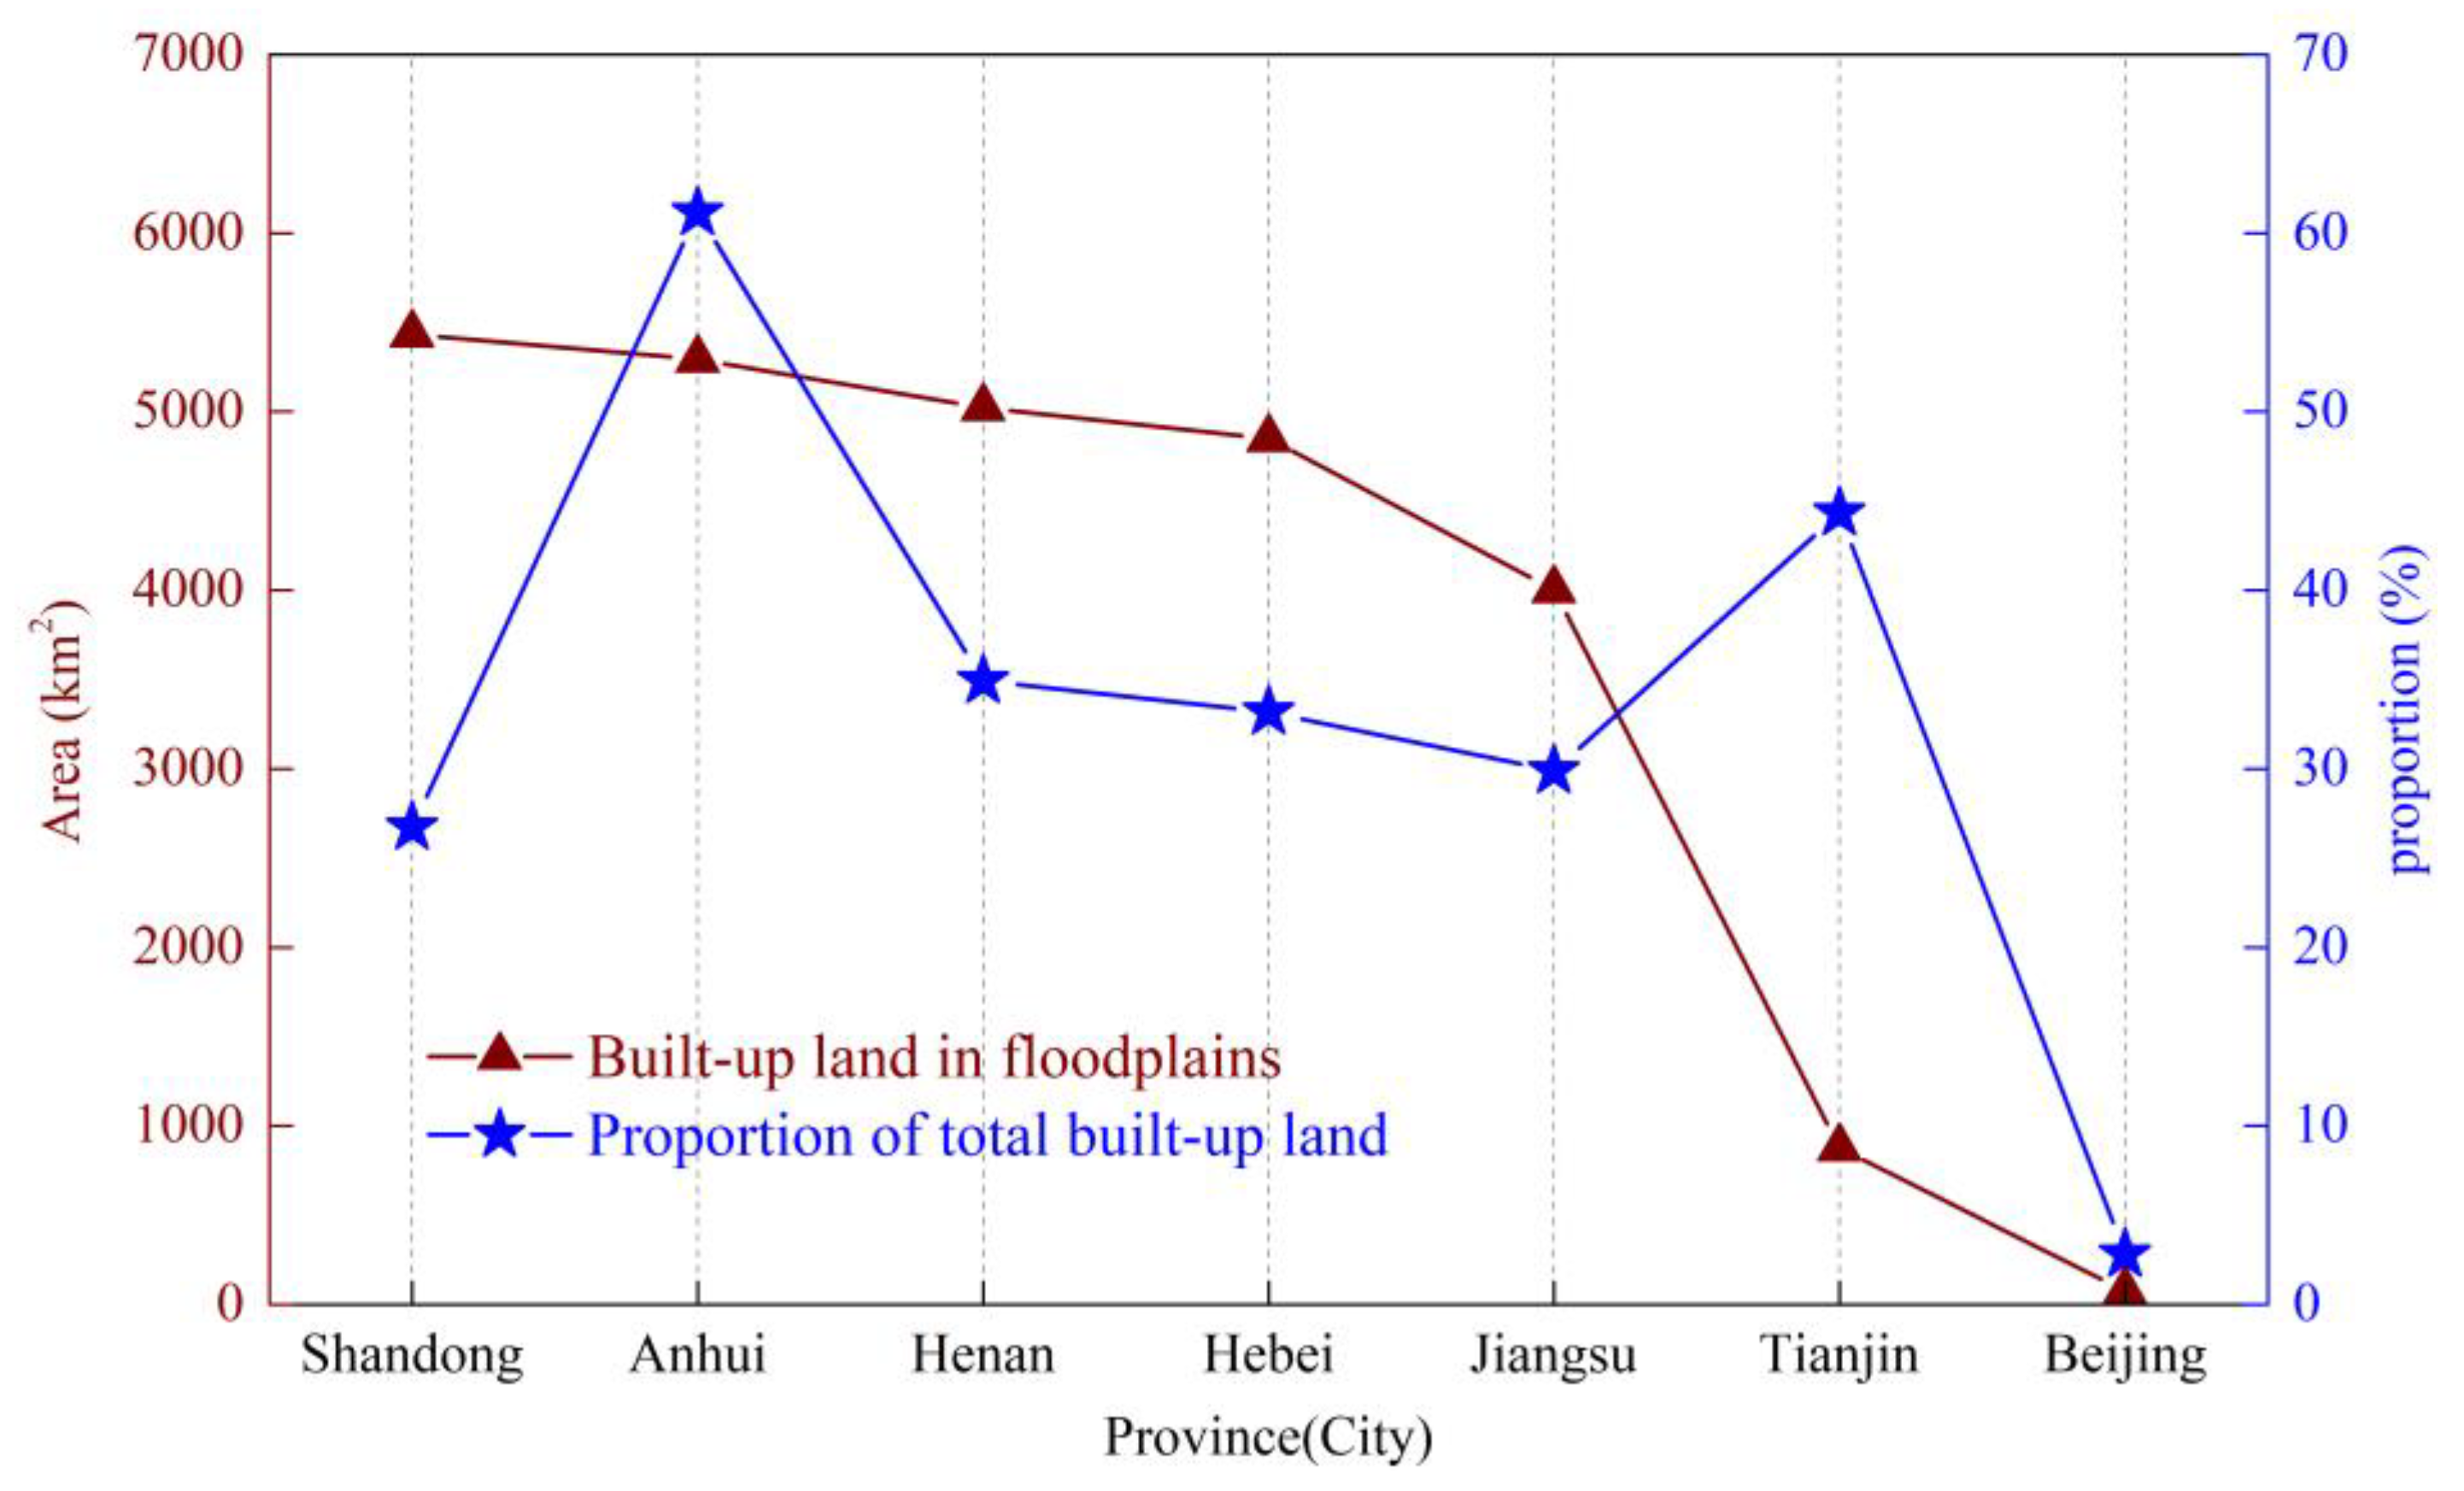
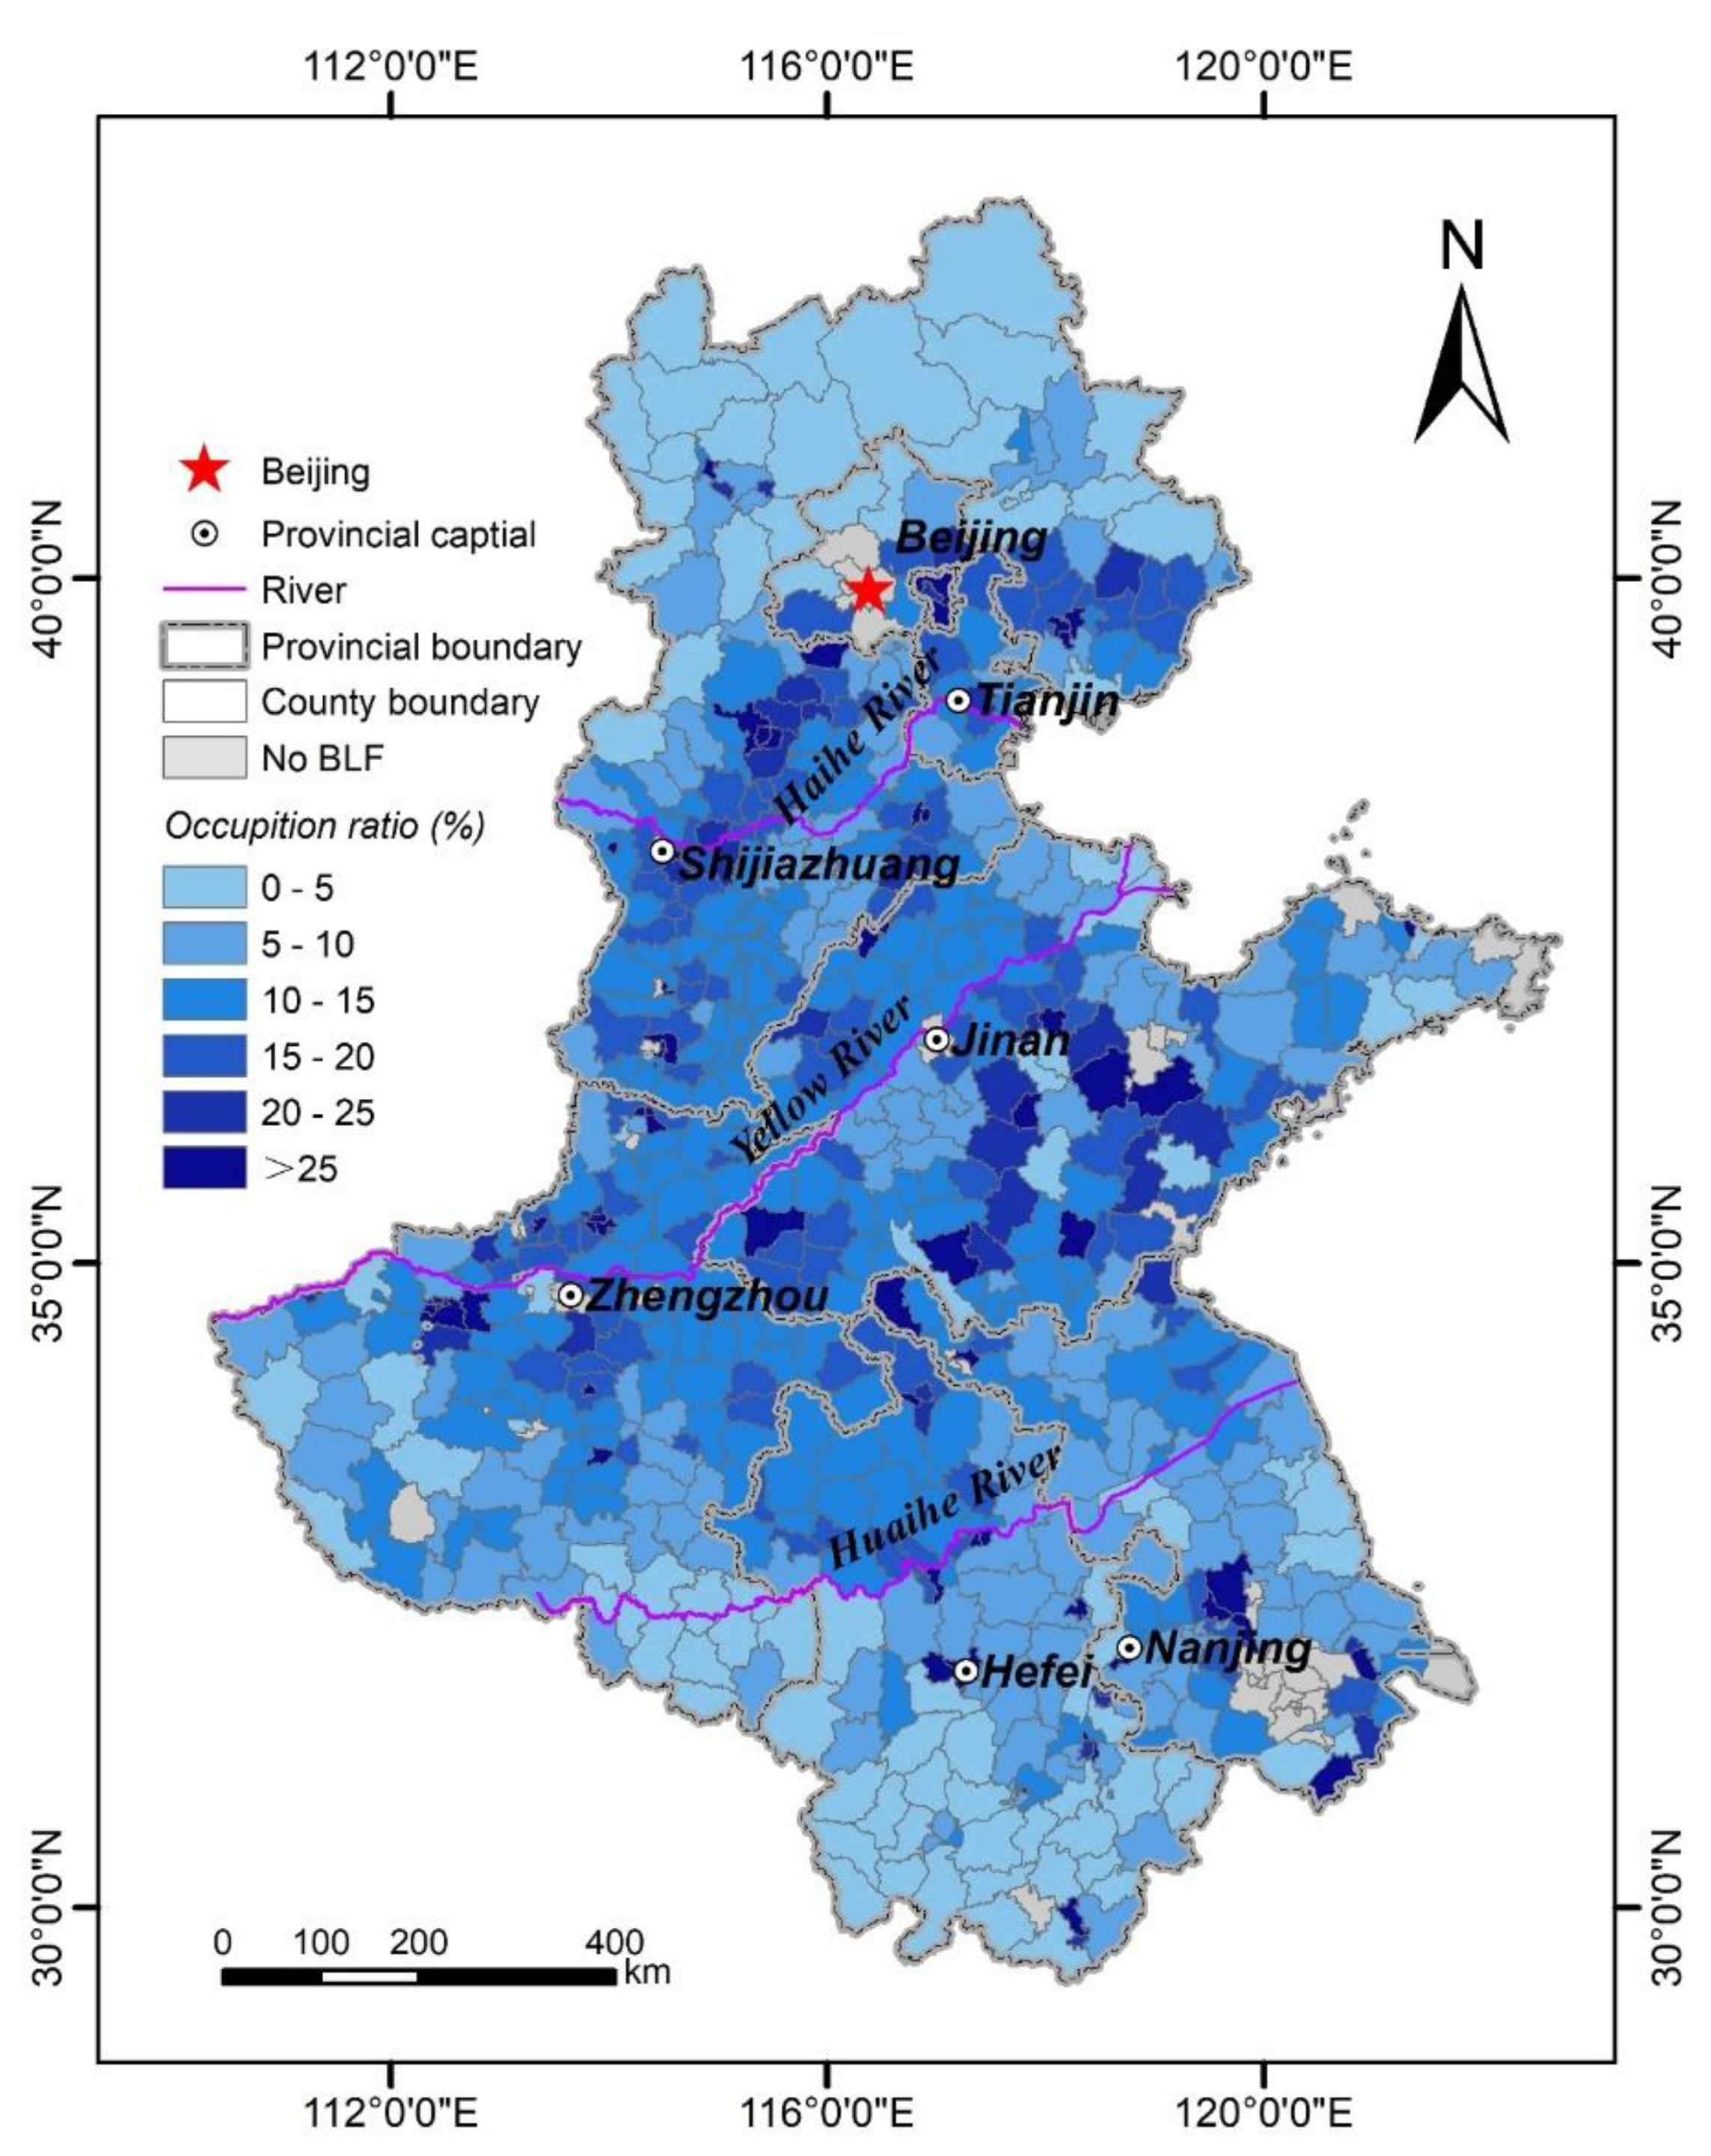
3.1. Spatial Distribution of Built-Up Land in Floodplains

The spatial pattern of floodplains was unbalanced in the NCPA. It was primarily located in the intermediate zone of the Haihe and Yellow Rivers and the northern region of the Huaihe River basin (Figure 3). The floodplain occupied an area of 2.30 × 10⁵ km2, making up about 30% of the total study area. However, affected by the spatial pattern of the floodplains, the BLF is also disproportionally distributed in the NCPA.
In 2014, the BLF covered 25.56 × 10³ km2, which was 11.09% of the total floodplain area. Figure 6 demonstrates the spatial distribution of the BLF from the province level. BLF areas in Shandong, Anhui, and Henan all exceeded 5000 km2, of which the BLF area of Anhui accounted for 61.14% of its total built-up land, whereas the proportion of Shandong and Henan was less than 35%. The BLF areas of Jiangsu and Hebei were 4001.87 and 4849.19 km2, making up 29.88% and 33.18% of their total built-up land. The BLF in Beijing and Tianjin had areas of 74.77 and 877.27 km2, of which the BLF area of Beijing only accounted for 2.8% of the total built-up land. However, the proportion of the BLF area in Anhui and Tianjin was higher than in other provinces and cities, indicating relatively high flood exposure in two regions.
To further examine the spatial pattern of the BLF at the county scale, the occupation ratio of the BLF area to the floodplain area was calculated by using the OR(i) proposed in Formula (1). Figure 7 reveals the spatial distribution of the OR(i) values in each county and district. There were 200 counties and districts with an occupation rate greater than 15%, accounting for 28.57% of the whole counties and districts in the NCPA; among them, there were 41 counties and districts with OR(i) values greater than 15% in Shandong province, which was mainly located in the central region and along the Yellow River. One hundred and three counties and districts (OR(i) ≥ 15%) were distributed in the vicinity of the Zhengzhou-Shijiazhuang-Beijing line, accounting for more than half of the entire counties and districts with OR(i) values exceeding 15%. The remaining districts and counties (OR(i) > 15%) were primarily located along the Grand Canal and Huaihe River in Anhui and Jiangsu Provinces.

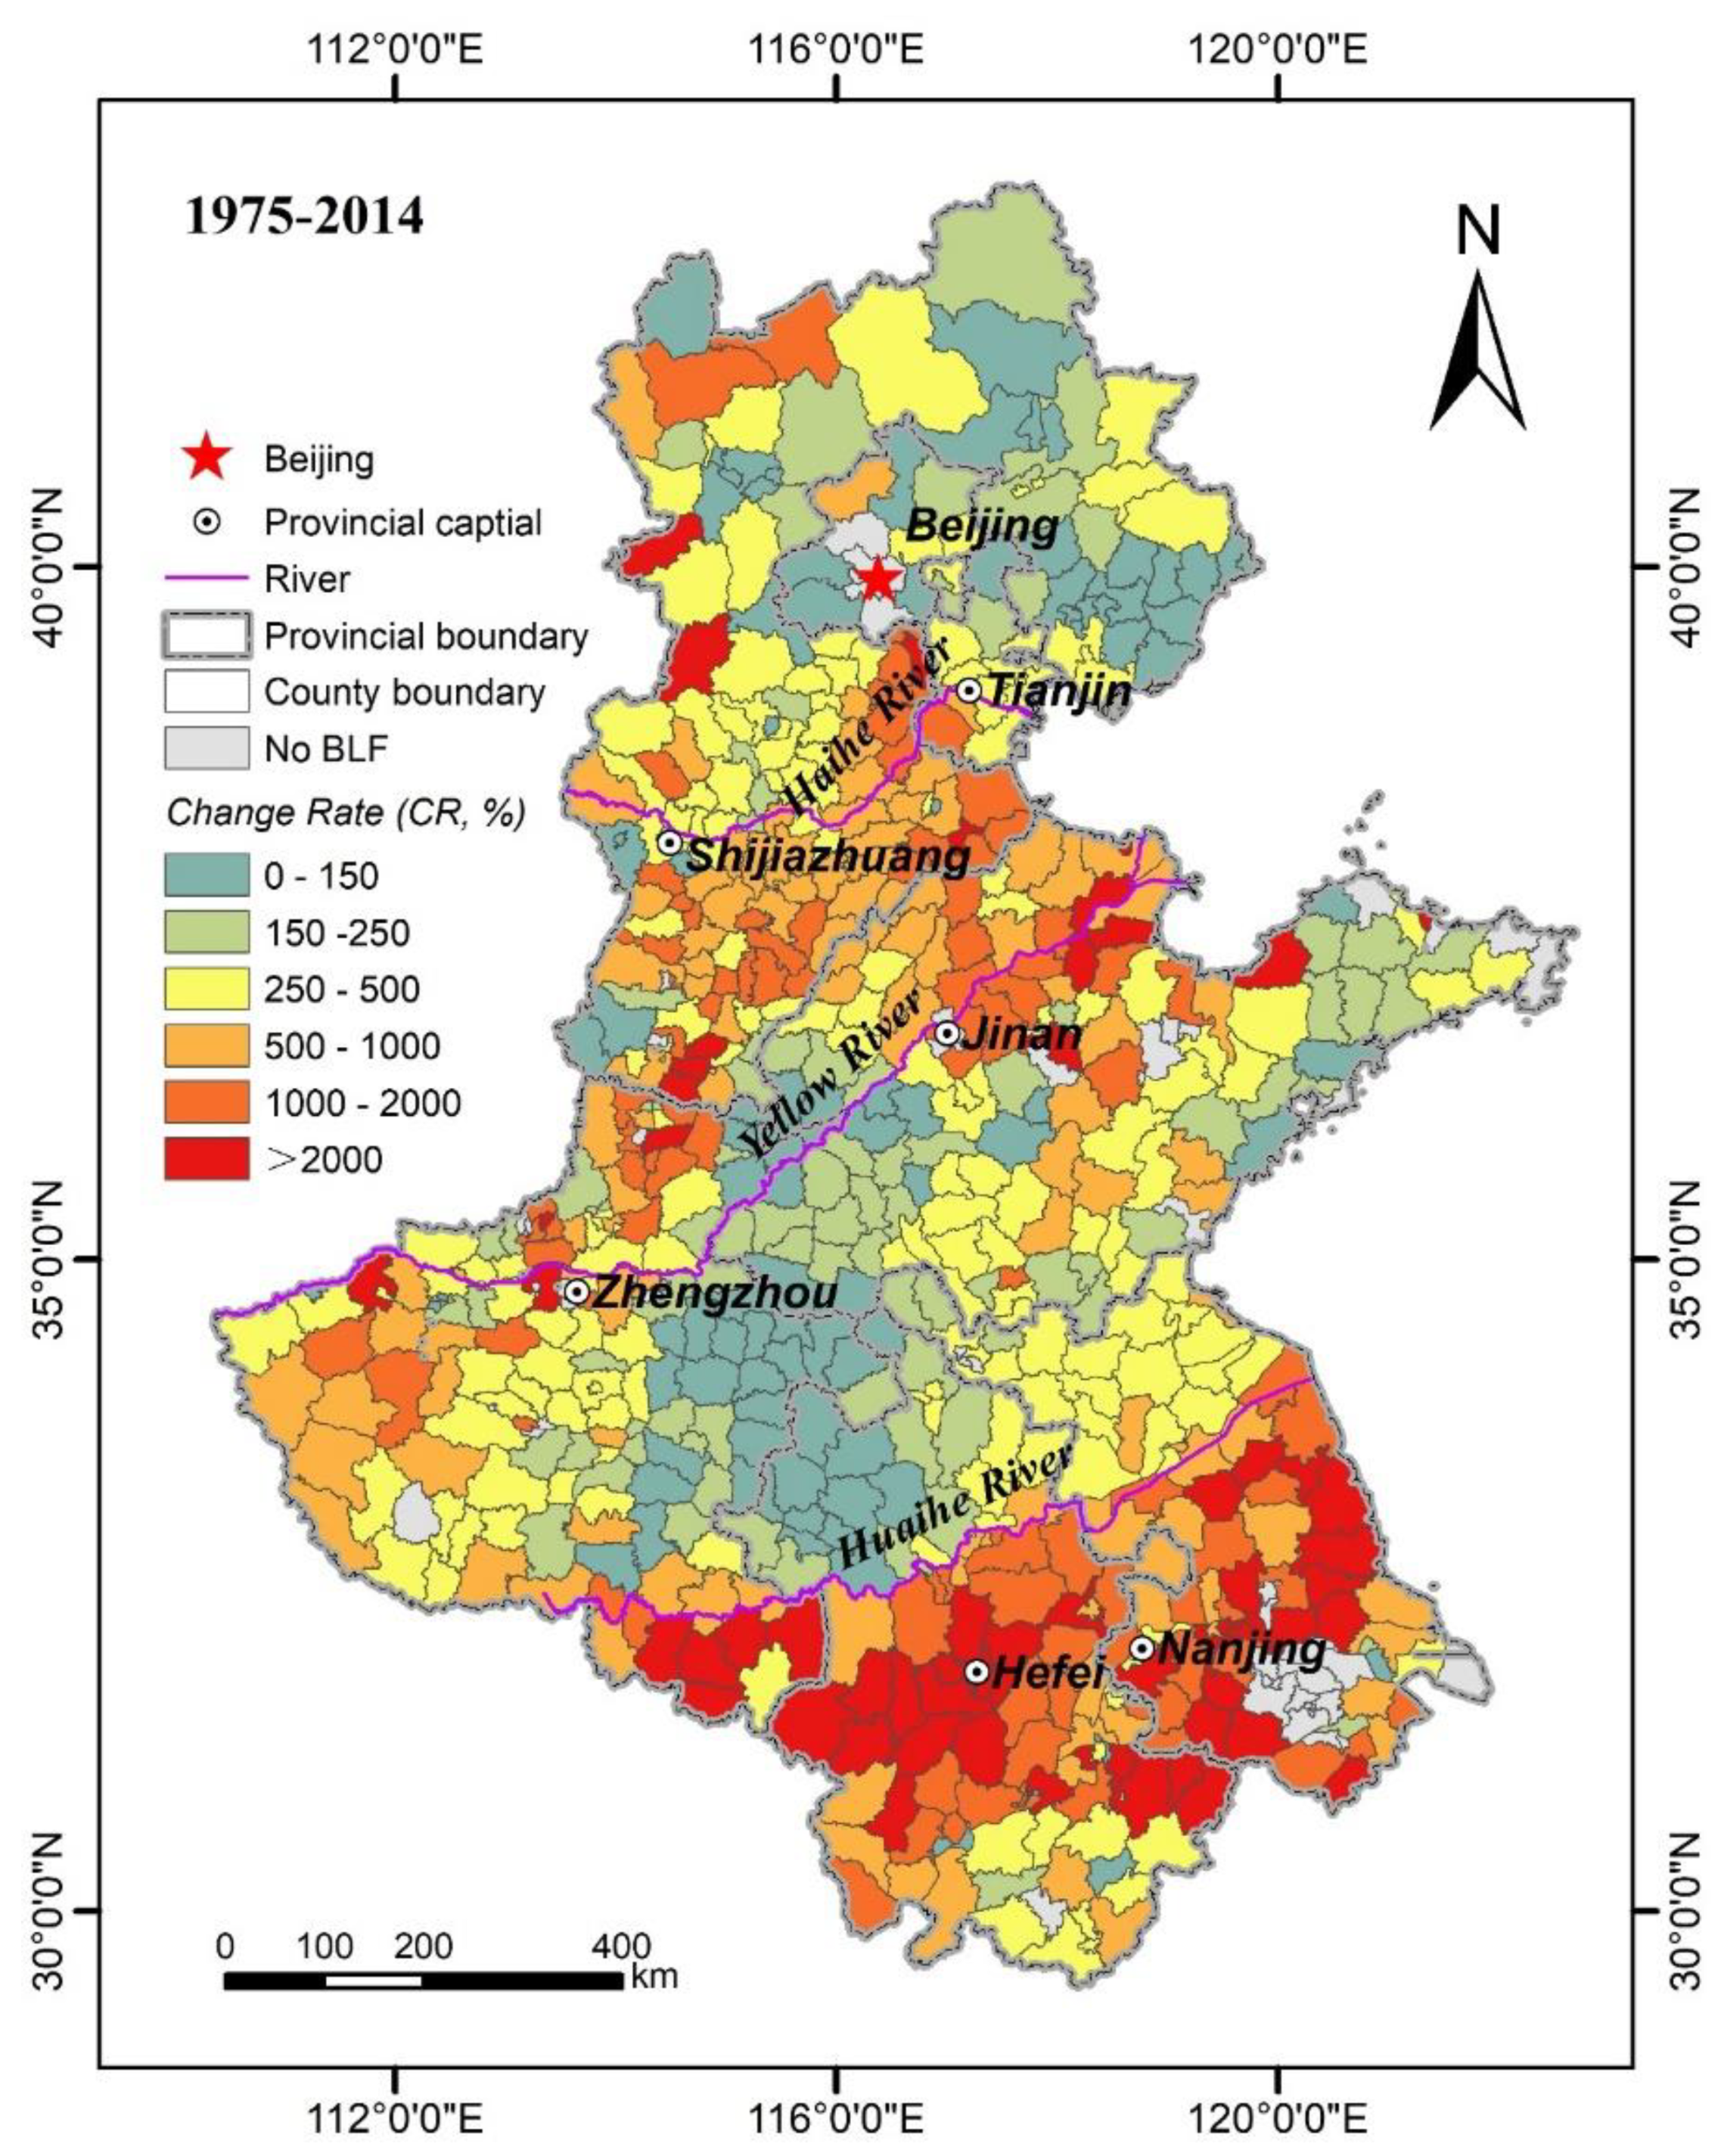
3.2. Rapid Growth and Dynamics of Built-Up Land in Floodplains

3.2.1. Rapid Growth of Built-Up Land in Floodplains

The BLF was increased by 288.26% from 6.58 × 10³ km2 in 1975 to 25.56 × 10³ km2 in 2014, with an average annual change rate of 3.45% (Table 2). Two provinces with the highest increase in the BLF area were Shandong (4212.73 km2) and Hebei (3788.67 km2), which consisted of 42.18% of the total BLF growth. The increased area of Henan, Anhui, and Jiangsu was 3524.79, 3352.21, and 3406.75 km2, respectively, accounting for 54.21% of the total BLF growth area. Beijing and Tianjin had the smallest BLF growth area, accounting for only 3.62% of the BLF growth in the NCPA. The BLF area in Jiangsu has increased by 572.45% at an average annual change rate of 5.01% in the last four decades, making it the most rapidly growing province in the BLF area. However, the BLF area in Anhui increased by 172.67% at an average annual growth rate of 2.61%, making it the province with the slowest growth in the BLF area.
Figure 8 shows the rapid growth of the BLF area in various counties and districts of the NCPA in a more intuitive approach. There were 440 counties and districts with a BLF change rate of more than 250%, accounting for 62.86% of all counties and districts in the research area. Counties and districts with a change rate higher than 500% accounted for 37.86% of the total, which was distributed in C-shaped belt zones around the provincial capitals (Jinan-Shijiazhuang-Zhengzhou-Hefei-Nanjing). Moreover, 61 counties and districts had BLF change rates in excess of 2000%, of which 68.85% were located in Anhui and Jiangsu to the south of the Huaihe River. Hence, the BLF area in the NCPA has experienced rapid and uneven growth over the four decades from 1975 to 2014.

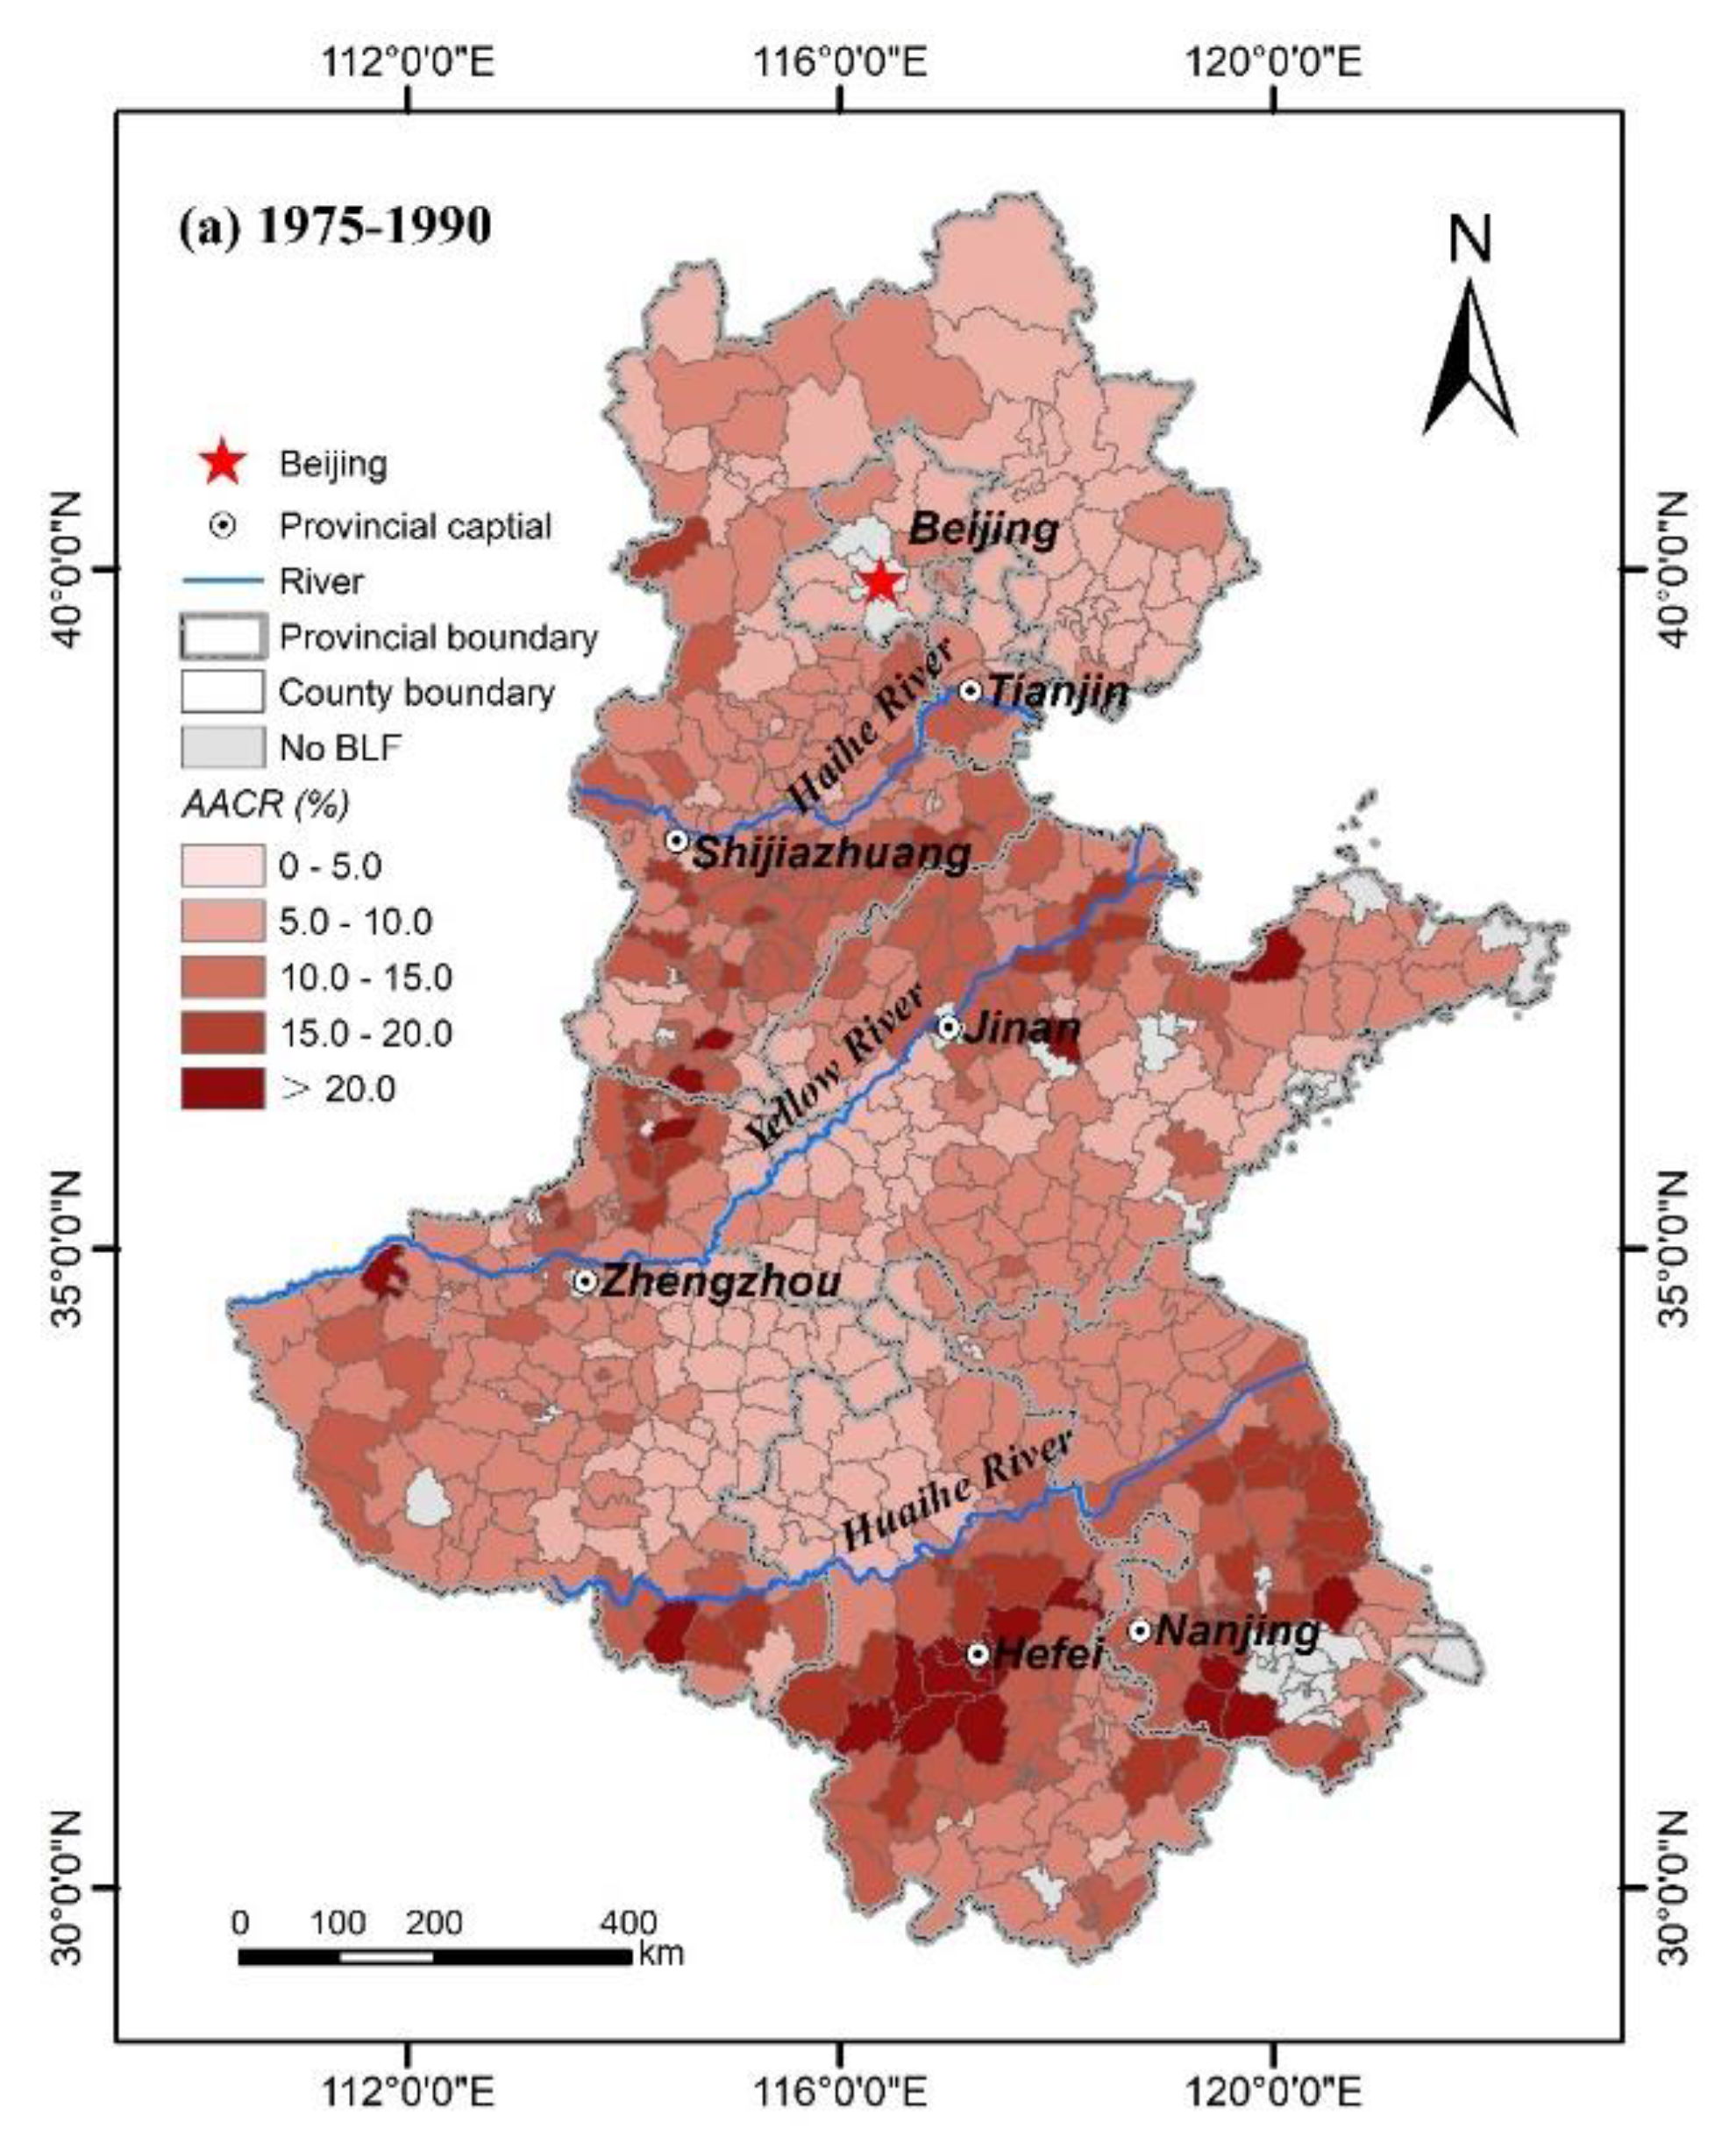
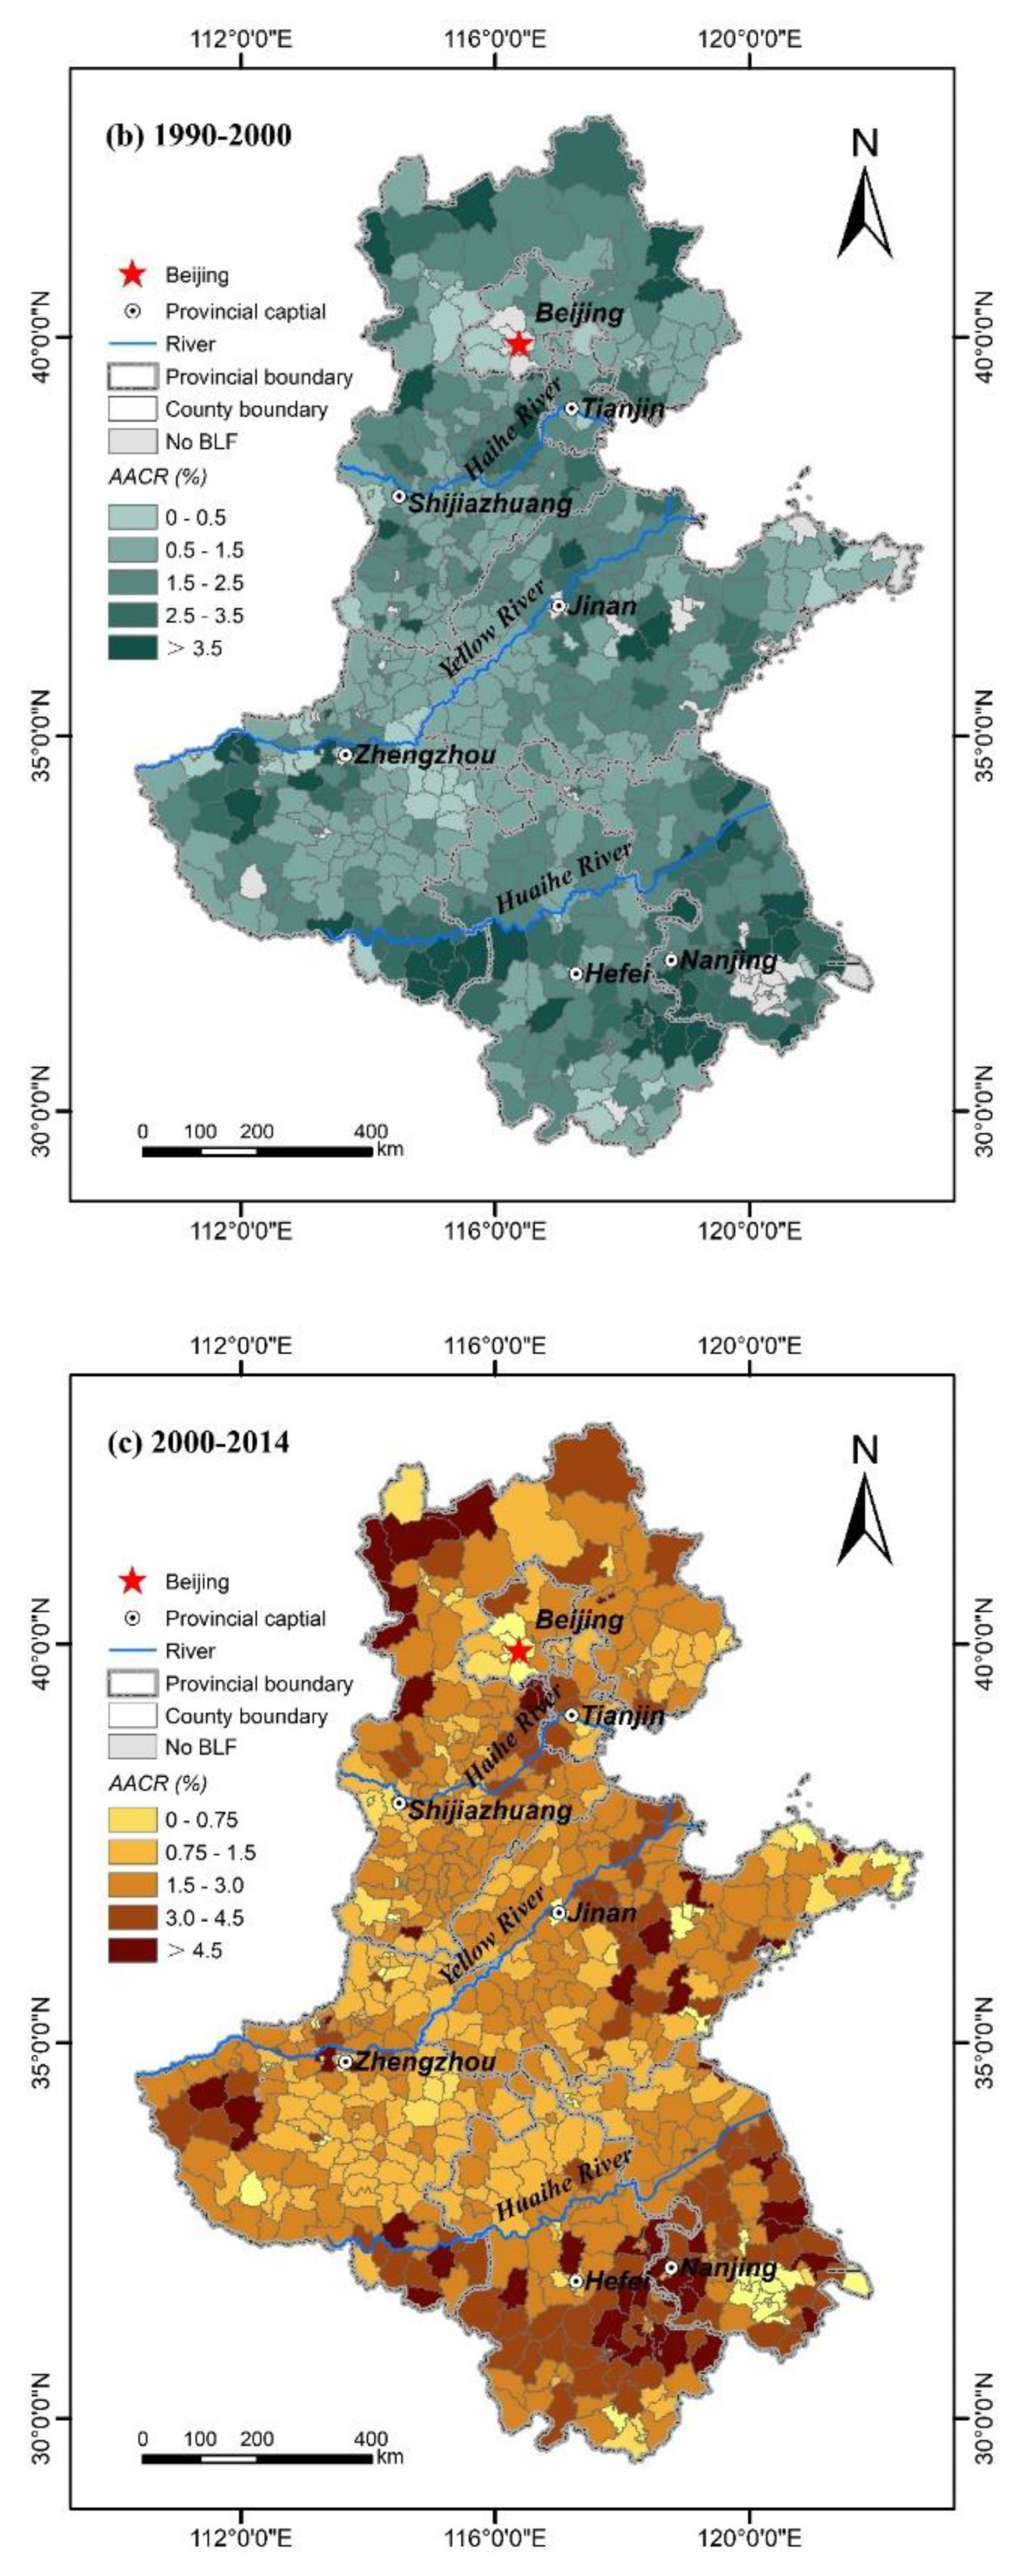
3.2.2. Dynamics of the Built-Up Land in Floodplains

We discovered that the BLF dynamics changed differently over time. As shown in Table 3, the BLF growth rate in the study area has experienced a fast-to-slow process from 1975 to 2014. During 1975–1990, the BLF area of the seven provinces and cities increased by 34.01% at an average annual change rate of 5.98%. Subsequently, the AACR of the BLF decreased to 2.28% in 1990–2000 and then to 2.19% in 2000–2014. Correspondingly, the area change rates of the BLF in the research area increased by 25% and 32% in the above two periods. The AACR of the provinces and cities from 2000 to 2014 was less than half of the period from 1975 to 1990. However, the growth area in 2000–2014 was roughly equivalent in 1975–1990 due to its large BLF area base.
Figure 9 shows the AACR of the BLF area in each county and district in different periods. During 1975–1990, 22 counties and districts had AACRs greater than 20%, of which 64% were located south of the Huaihe River (Figure 9a). Moreover, the number of counties and districts with AACRs exceeding 3.5% and 4.5% in 1990–2000 and 2000–2014 were 54 and 52, respectively. Comparing Figure 9b,c, the spatial distribution of counties and districts with higher AACR values in 1990–2000 (>2.5%) and 2000–2014 (>3.0%) is almost consistent; these counties and districts were primarily distributed south of the Huaihe River, central Shandong, western Henan, and western and northern Hebei.

3.3. Expansion Types and Characteristics of New Growth Built-Up Land in Floodplains

The three expansion types of new BLF patches, edge-expansion, infilling, and outlying, were identified using the LEI in the research area. As shown in Figure 10, the edge-expansion type of BLF patches was dominant in the NCPA from 1975 to 2014. The edge-expansion type of the BLF covered 18.74 × 10⁵ patches, with an area of 13.22 × 10³ km2, making up 50.46% and 68.25% of the total growth patch number and area, respectively. Outlying was the second-largest type of BLF expansion in the NPCA, with the number and area of patches accounting for 33.23% (12.34 × 10⁵) and 17.57% (19.38 × 10³ km2) of the total number and area of expanded patches, respectively. Compared with the above two BLF expansion types, the growth in the number and area of infilling patches was relatively small, accounting for only 16.30% (6.05 × 10⁵) and 14.18% (2.75 × 10³ km2) of the total increased patch number and area, respectively.
The identification of the expansion type can manifest the regularity of BLF growth in the study area [31]. We found that the BLF growth can be characterized by two distinct processes: dispersion and coalescence. During the initial phase, dispersed BLF patches grow by outlying type and eventually form multiple BLF core areas. Then, BLF expands around the original core area with an edge-expansion type. In the process, the patch size of the original BLF core area gradually increased. The above two phases belong to the BLF dispersion process. As the process continues, BLF growth is more likely to gradually fill non-BLF areas between existing patches through an infilling expansion; hence this process is termed coalescence.
The BLF growth in the NPCA has experienced a process of dispersion and coalescence. The growth of BLF outlying patches was the most widely distributed expansion type in 1975–1990. Meanwhile, edge-expansion patches are mainly located in urban areas. During 1990–2000, the growth of edge-expansion patches became more extensive in the NPCA, accompanied by an increase in the patch size of the original BLF core area. With the continued growth of the outlying and edge-expansion patches, infilling patches gradually filled the vacant land between BLF patches. The growth of infilling patches played an increasingly important role during 2000–2014. They continued to fill the non-BLF regions between patches, resulting in a continuous coalescence of BLF patches. This process of dispersion-coalescence continues in a cyclic pattern as the BLF patches proceed to expand. Therefore, BLF growth indicates wave-like properties, which could be described as a general temporal oscillation between dispersion and coalescence phases.

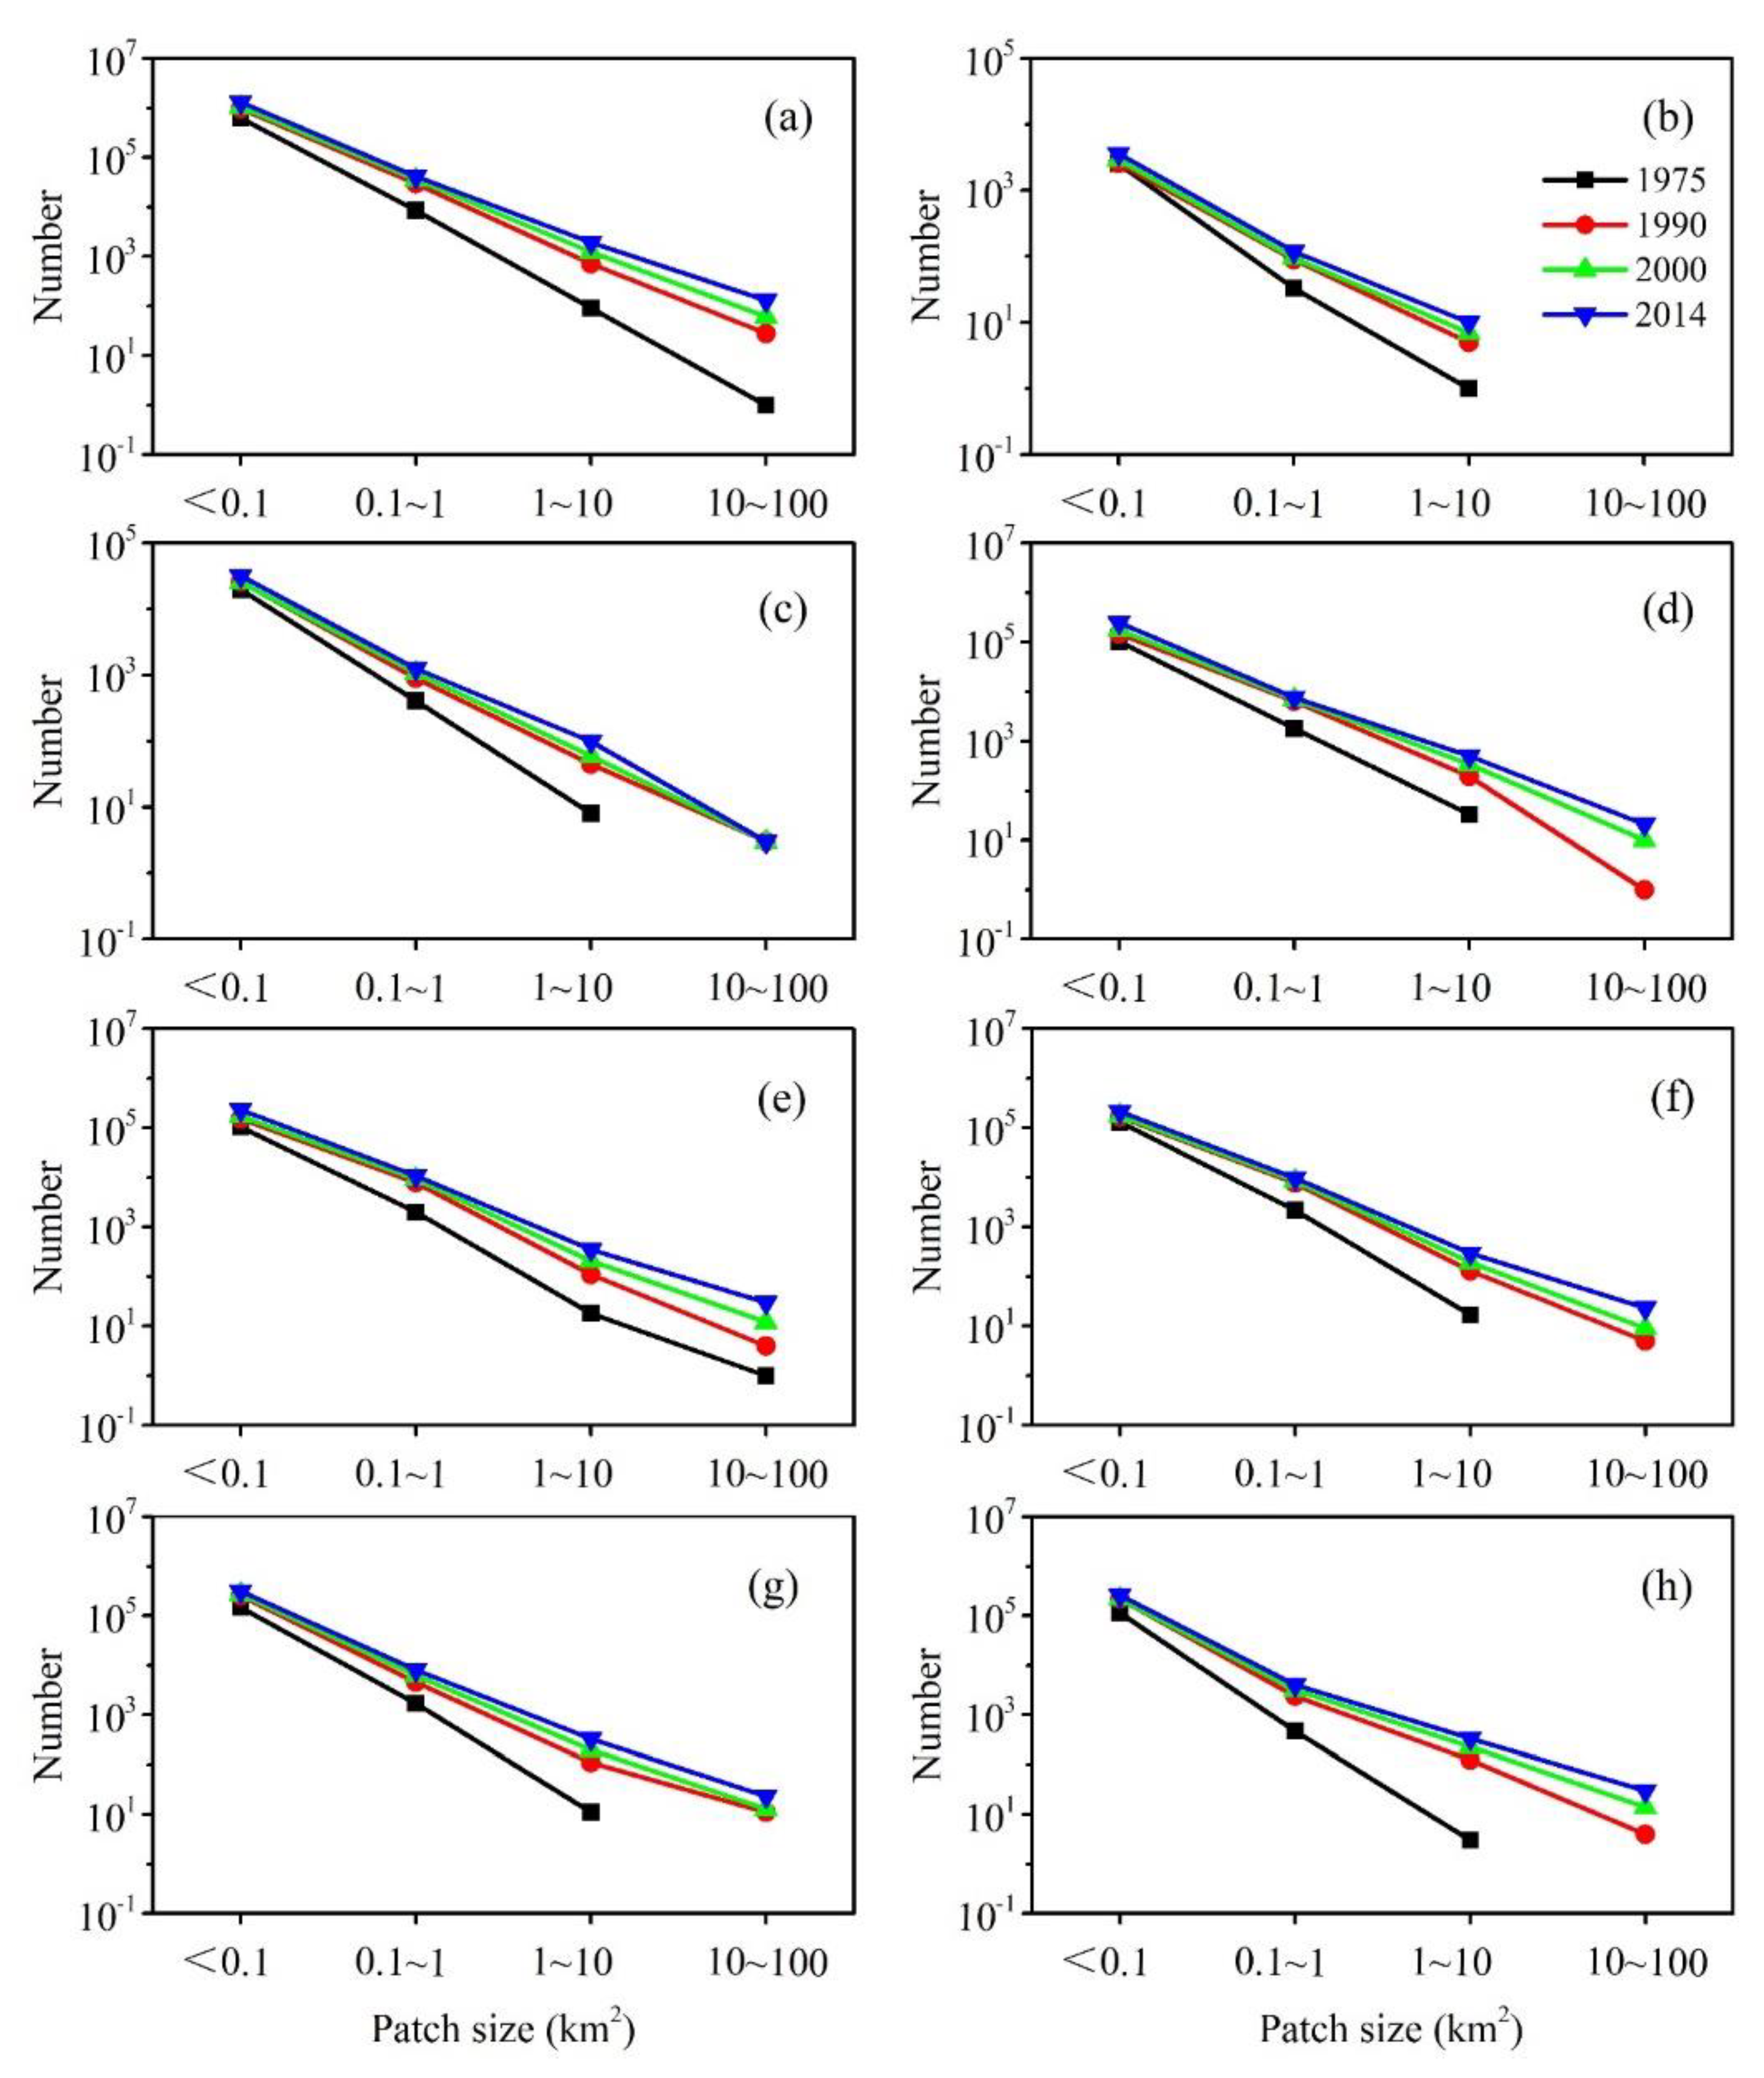
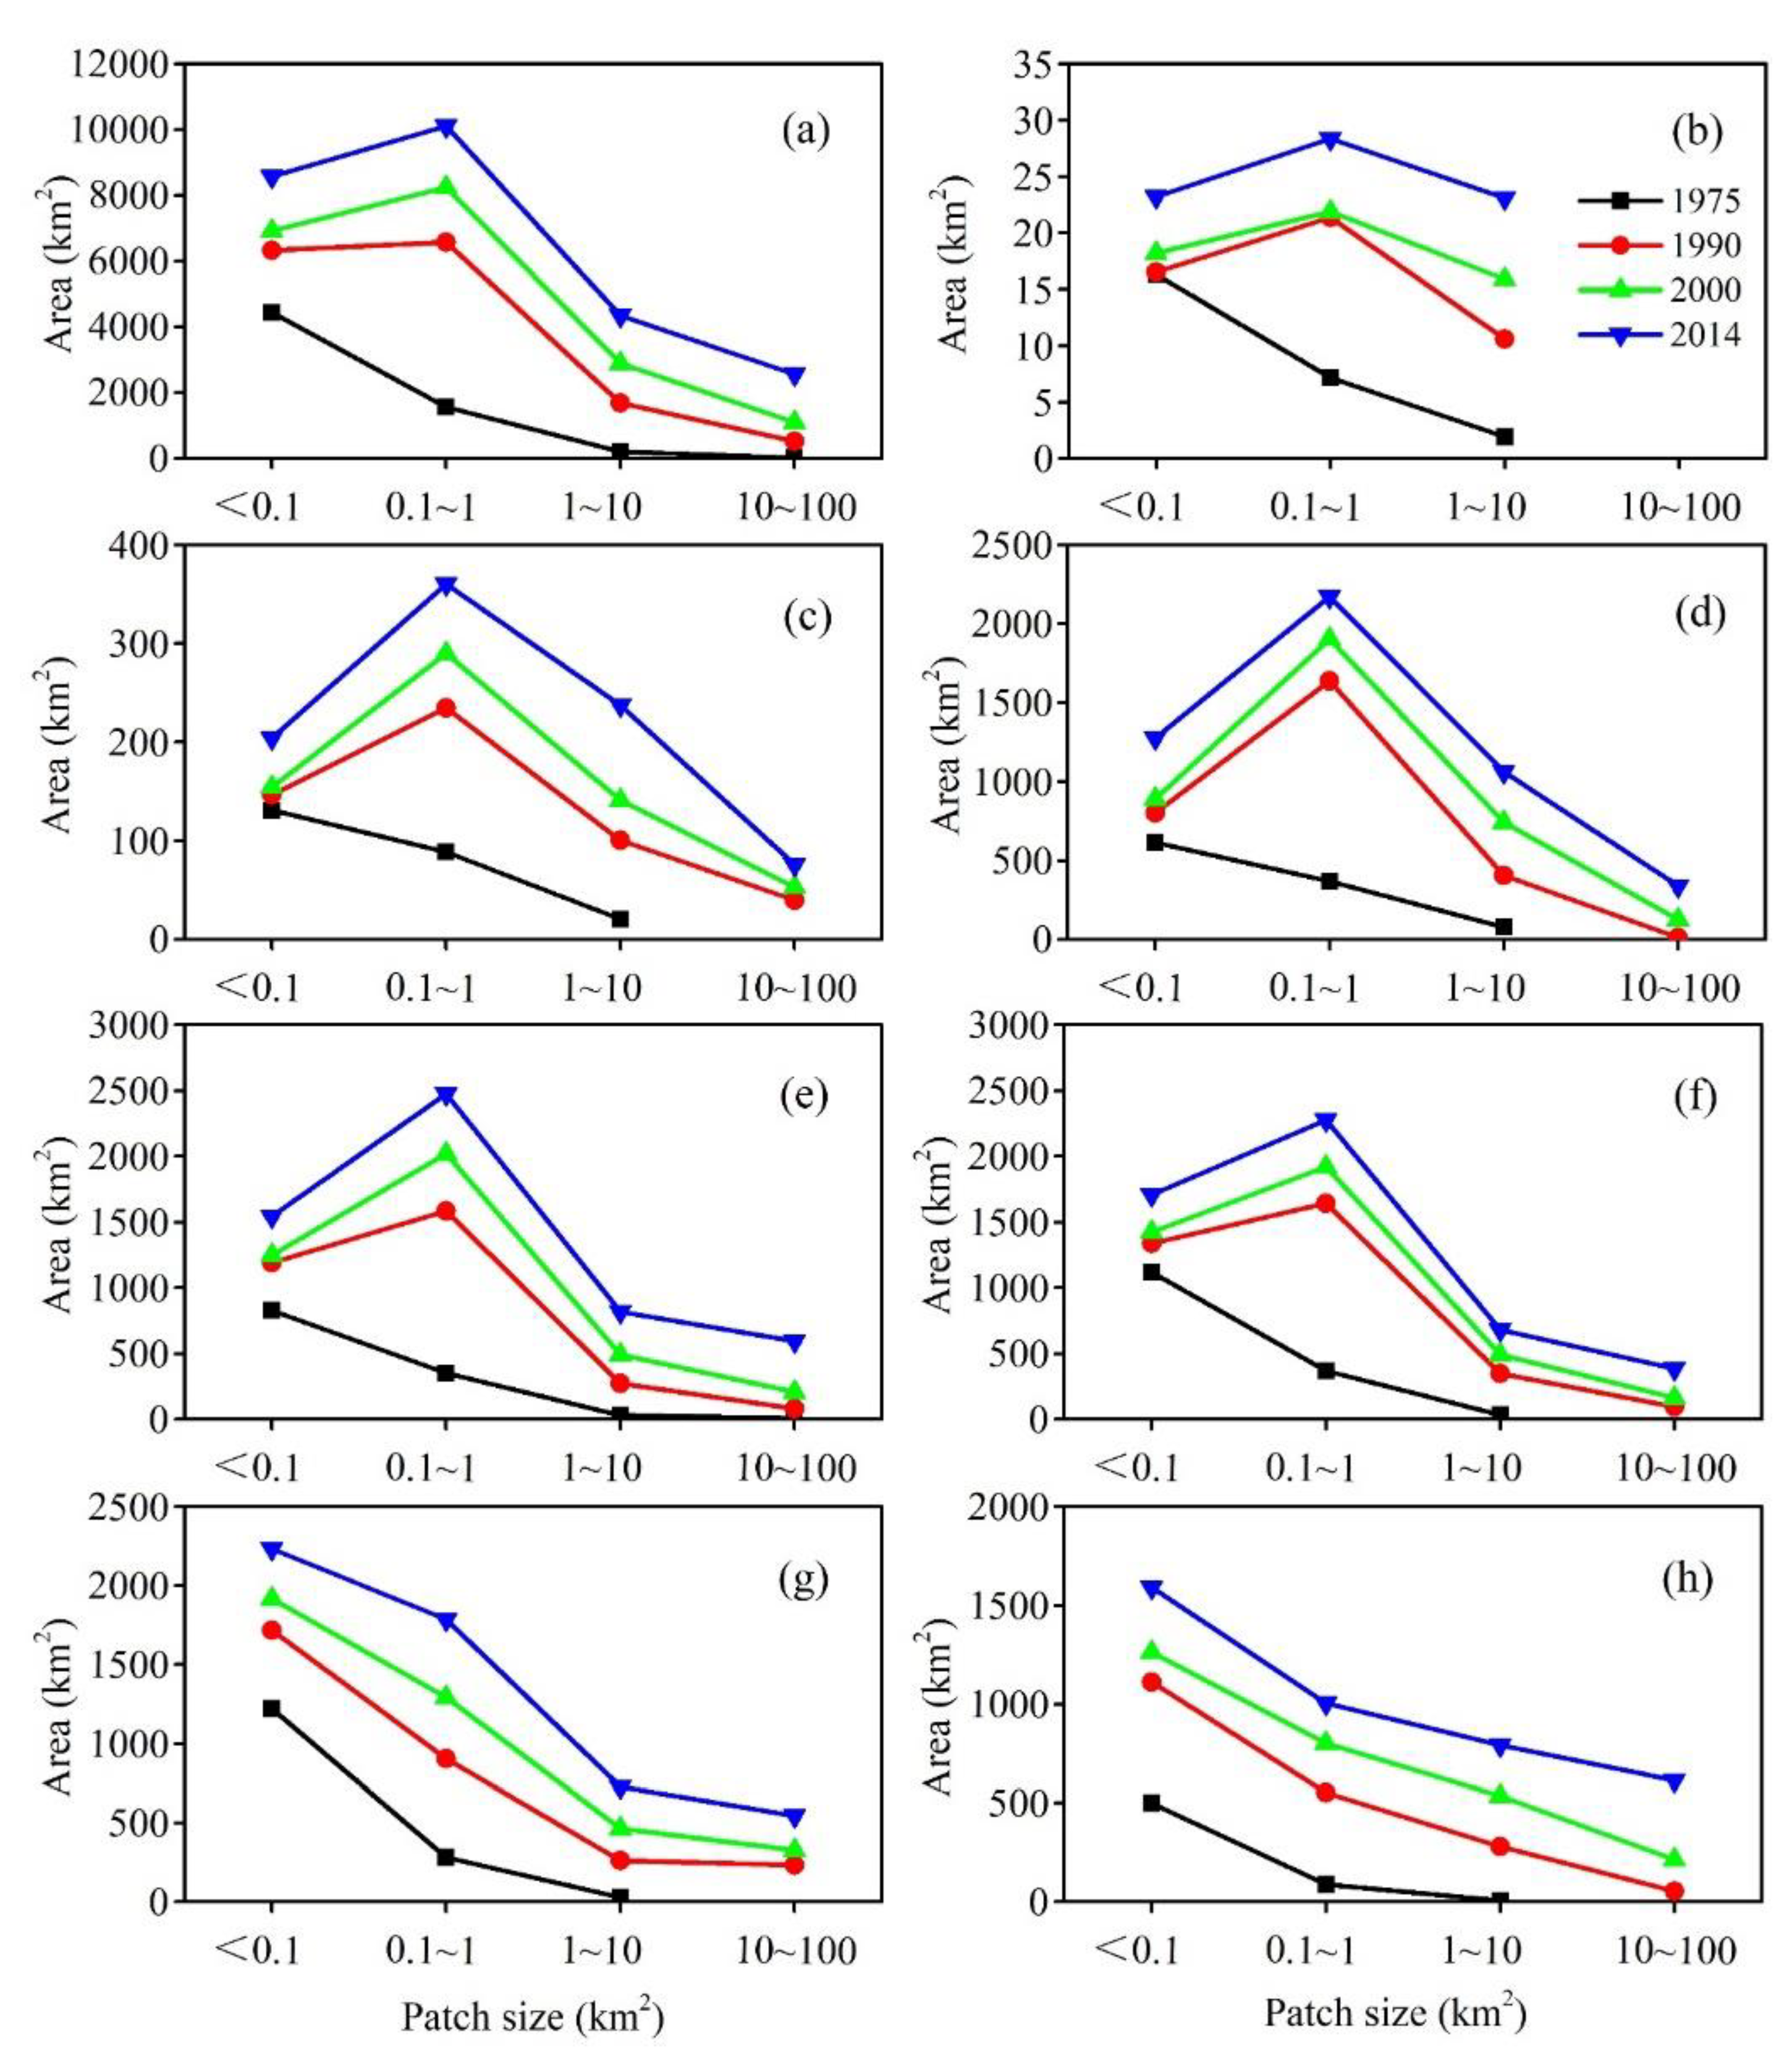
3.4. Patch Size Characteristics of the Growth Built-Up Land in Floodplains

Small patches were overwhelming in the increased numbers of BLF (Figure 11). The number of BLF patches in the NCPA accelerated and increased by 5.43 times in the past four decades (1975–2014). The number of small BLF patches (≤1 km2) increased by 342.86 × 10⁴, accounting for 99.88% of the total growth. Specifically, the increasing number of BLF patches in the three periods of 1975–1990, 1990–2000, and 2000–2014 was 99.85 × 10⁴, 108.65 × 10⁴, and 134.36 × 10⁴. Among them, small BLF patch numbers (≤1 km2) were 99.77 × 10⁴, 108.52 × 10⁴, and 134.15 × 10⁴, consisting of 99.93%, 99.88%, and 99.85% of the total number of increased patches, respectively. As shown in Figure 11, the number of BLF patches decreased from small patches to large patches in 1975–2014. In addition to Henan province, there were no BLF patches larger than 10 km2 in the study area in 1975. As of 2014, although the total number of BLF patches soared since 1975, the number of large BLF patches (>1 km2) increased by 4098, making up only 0.12% of the total.
The growth area of the BLF was dominated by small patches (≤1 km2) in 1975–2014. Notably, 78.14% (4.78 × 10⁴ km2) of the increased BLF area in the NCPA was small patches (≤1 km2) from 1975 to 2014 (Figure 12a). The area of BLF patches decreased from small to large in 1975 (Figure 12). The area distributions of different patch sizes among the provinces and cities also showed distinctions. Concretely, the areas of BLF patches in Anhui and Jiangsu provinces decreased from patches smaller than 0.1 km2 to patches larger than 10 km2 in various periods (Figure 12g,h). As of 1990, BLF patches with an area between 0.1–1 km2 exceeded patches smaller than 0.1 km2 and became the largest patch category in the five provinces and cities of Beijing, Tianjin, Hebei, Shandong, and Henan (Figure 12b–f). With the rapid area growth, BLF patches larger than 10 km2 have occurred in all provinces and cities except Beijing since 1990. The absence of patches larger than 10 km2 in Beijing was due to its floodplain area being much smaller than other provinces and cities (879.29 km2). Moreover, the floodplain in Beijing was primarily located in the outer suburbs, where small outlying patches were widely distributed (Figure 3, Figure 11b, and Figure 12b).
Small patches dominated the growth process of three different expansion types in the study area. The average patch size of the expanded BLF was 0.0047 km2, of which the edge-expansion type was the largest (0.0071 km2), and the outlying type was the smallest (0.0028 km2). Figure 13 reveals that the number of patches and areas of the three expansion types decreased from small to large patches. The number of small patches of the three expansion types was overwhelming, and its proportions were all higher than 99.98%. In terms of the patch size, although the proportions of small patches of the edge-expansion and infilling types were close (93.05% and 93.94%, respectively), the area of the former was 4.77 times of the latter (Figure 13a–d). Compared with edge-expansion and infilling types, the ratio of small BLF patches in the outlying type was the highest (99.96%) among the three expansion types, while the patch area was the smallest (3.40 × 10³ km2) (Figure 13e,f).

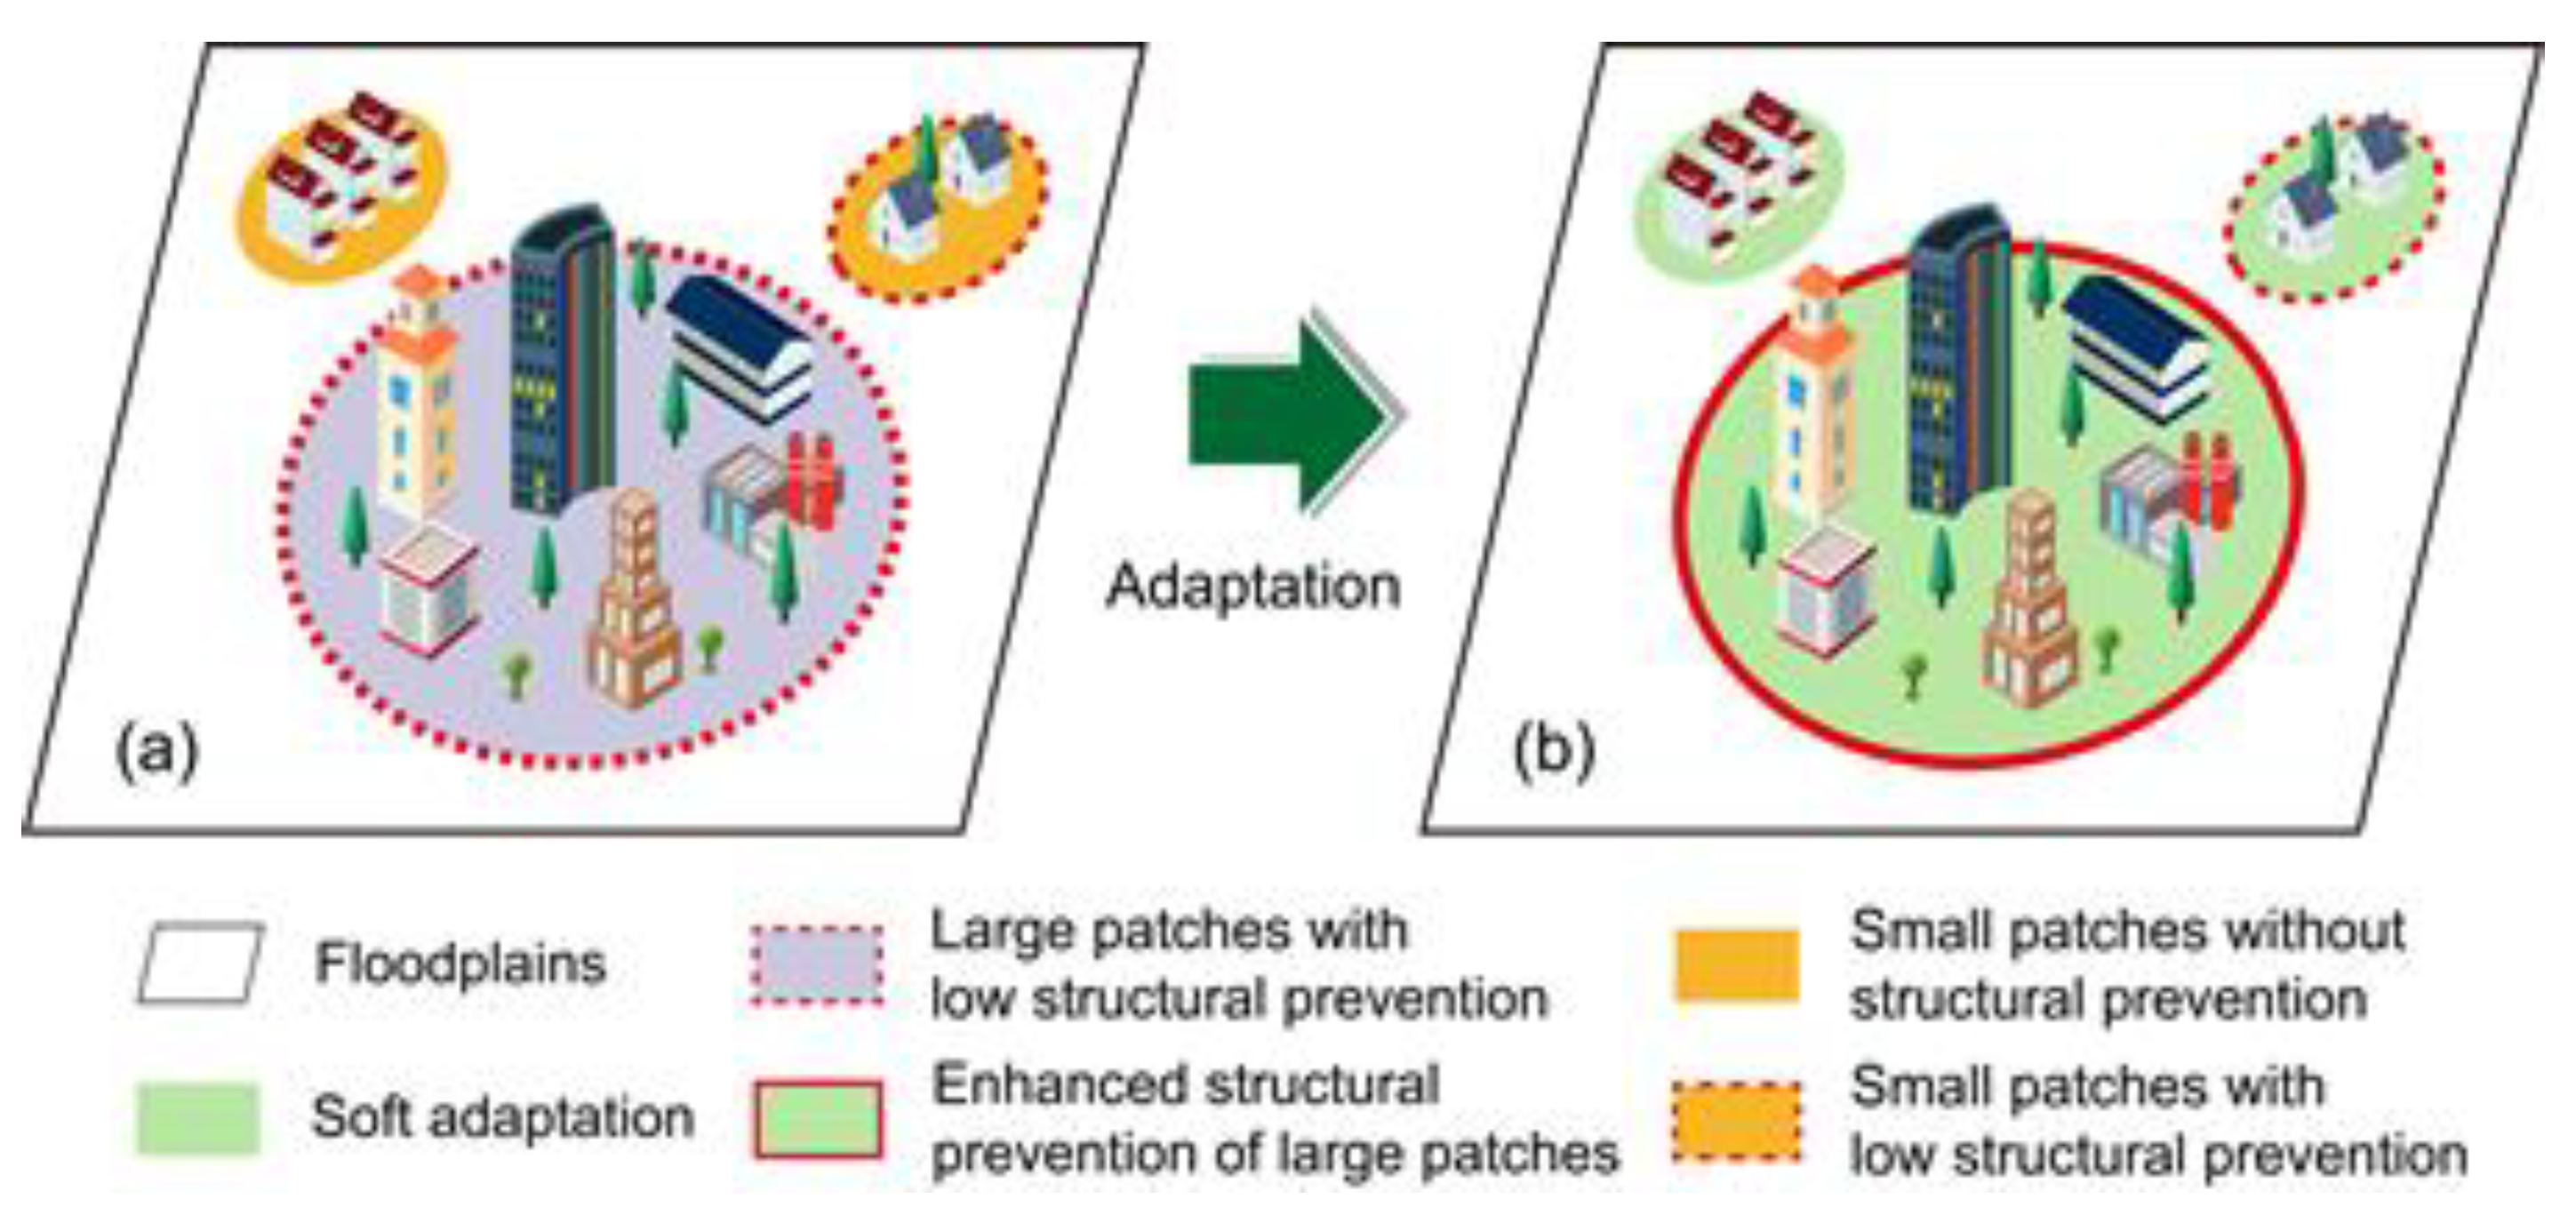
3.5. The BLF Expansion Pattern Impact on Flood Vulnerability and Adaptation Strategy

3.5.1. Impact of Patch Size on Flood Vulnerability and Adaptation Strategy

The total increase of the BLF area was correlated to the flood occurrence in the NCPA. As shown in Table 4, there was a significant correlation coefficient (R = 0.36; p < 0.01) between total BLF growth area and flood occurrence from 1975–2014, which indicated that the total BLF growth area was significantly associated with flood vulnerability. Although the correlation coefficients were disparate in magnitude (R = 0.41, 0.31, and 0.29, respectively) in the three periods of 1975–1990, 1990–2000, and 2000–2014, the correlation coefficients were all significant at p < 0.01 (Table 4).
Correlations between different patch sizes and flood occurrences were distinct in the NCPA. The correlation between the growth of small BLF patches and flood occurrence (R = 0.36, p < 0.01) was more remarkable than that of large patches (R = 0.18, p > 0.1) from 1975 to 2014 (Table 4), which indicated that small growth patches strongly influenced flood vulnerability compared to large growth patches in the NCPA. The correlations between small growth patches and flood occurrences were significant in different periods. For example, when the significance was less than 0.01, the correlation coefficients were 0.40, 0.32, and 0.31 in the periods of 1975–1990, 1990–2000, and 2000–2014, respectively. However, the growth of large patches in the three periods above has no significant correlation with flood occurrence (p > 0.1). Moreover, the growth of large BLF patches and flood occurrence showed an inverse correlation trend between 1990–2000 (R = −0.05, p > 0.1) and 2000–2014 (R = −0.07, p > 0.1). These negative correlation trends suggest that an increase in the number of large patches may reduce flood vulnerability in a particular region.
Based on the above analysis, the growth of small BLF patches strongly correlates with flood vulnerability, which indicates that they are more vulnerable and susceptible to flooding. However, flood prevention standards for small patches are relatively low or even non-existent (Figure 14), which has also been supported by practical experience [32,33]. In China, the BLF patch sizes are closely related to the population size and economic magnitude, which directly determines the flood control standards [34]. For instance, the central districts of Tianjin and the core area of the Binhai New District (a total of 2700 km2) are protected by a 249 km ring-like flood dike that can resist a 200-year return period flood. In the suburbs of Tianjin, flood control standards are degraded to resist floods with a 100-year return period. However, flood control standards for small settlements in the exurbs of Tianjin are for 10–20-year return periods.
Further, foreign flood control planning also proved the above argument. For example, the area surrounding Ho Chi Minh City in Vietnam is susceptible to flooding, whereas its central urban area is protected by ring dikes without being affected [35]. Additionally, a 2011 flood caused flooding in the surrounding area of Bangkok, Thailand, while the central urban of Bangkok was relatively dry [36,37]. According to cost–benefit analyses (CBAs), the initial investments and maintenance costs of structural protection of small patches (such as floodwalls and sea dikes) are economically unviable [18,38]. Therefore, the low protection level of the small patches is because of their scattered distribution and limited flood control and disaster mitigation resources (Figure 14) [34]. All of this suggests that flood prevention levels and the impact on flood vulnerability vary across patch sizes.
In terms of flood adaptation strategies, structural prevention measures complemented by soft adaptation strategies play an essential role in increasing the resilience of large patches to flooding (Figure 15). In contrast, small and dispersed patches are more suitable for soft adaptation strategies based on previous cost–benefit studies (Figure 14) [34]. Herein, soft adaptations refer to the use of available information and low-cost strategies such as behavioral, institutional, and strategic changes to enhance the ability to resist floods [39,40,41]. These measures include flood insurance, building codes, forecasting and early warning systems (EWS), land use planning, capacity building of education and awareness, and other nature-based measures [39,40,41].
In addition, we suggest implementing the village merging to mitigate flood threats in floodplains where flood hazard is relatively high and BLF patches are scattered. Here, village merging refers to the displacement of rural areas distributed in high-risk areas into concentrated settlements within safe regions [42]. Recently, village merging has been widely implemented in Shandong province and achieved certain effectiveness. The integration of villages and settlements not only improves the efficiency of public resources and promotes the intensive use of land resources, but also provides more construction land space for urban development [43,44]. More crucially, village merging enables efficient use of flood control resources to reduce flood damage and contribute to the sustainable development of floodplains.

3.5.2. Impact of Expansion Type on Flood Vulnerability and Adaptation Strategy

The correlation between BLF growth and flood occurrence varied depending on the expansion types. As shown in Table 5, correlations between outlying (R = 0.56, p < 0.01) or edge-expansion types (R = 0.52, p < 0.01) and flood occurrence were more significant than the infilling type (R = 0.27, p < 0.05). Therefore, the outlying and the edge-expansion types of BLF growth patches have a stronger impact on flood vulnerability in the NCPA. Although the correlation coefficients of the outlying and edge-expansion types varied in different periods, their significance level was less than 0.01, indicating that they were significantly correlated with flood vulnerability.
There was no significant correlation between the infilling patches and flood occurrence in the three periods of 1975–1990 (R = 0.05, p > 0.1), 1990–2000 (R = 0.17, p > 0.1), and 2000–2014 (R = 0.19, p > 0.1) (Table 5). However, the infilling patches correlated to flood occurrence when the significance level was less than 0.05 in 1975–2014. The cause is that the infilling growth area contributes to flooding vulnerability that is not apparent in a short period. When the infilling patch area increases to a certain threshold, it will affect the surface runoff’s infiltration rate, thereby changing the socio-hydrological cycle system [45,46]. Thus, the increase in infilling BLF patches on the long-term scale will cause flood vulnerability dynamics.
As shown in Figure 16, the three BLF expansion types pose different impacts on flood vulnerability. The edge-expansion type formed new BLF areas outside the original protected BLF patches and increased the flood vulnerability (Figure 16a). For example, the planned central urban area of Nanjing has increased from 280 to 834 km2. The existing Nanjing urban scope of flood control is small, and the flood control projects in the newly expanded area are relatively weak. The booming economy and dense population have caused severe flood damage in Nanjing [47]. In addition, the edge-expansion type may also damage the existing flood prevention measures in the transition zone of new and old BLF patches. Hence, it is necessary to upgrade the flood control system for edge-expansion patches that tend to stabilize. For the BLF area that is still expanding, soft adaptation measures should be applied to enhance community resilience (Figure 16d).
Outlying patches occupied vacant lands or rural areas in floodplains, and flood control standards in these areas were low or even lacked prevention measures. Therefore, the considerable expansion of small outlying patches balloons flood vulnerability in the NCPA (Figure 16b). To address this issue, we suggest taking necessary structural measures and village merging projects for critical outlying patches, such as cultural facilities and public infrastructure. For a large number of sporadic small outlying patches, natural-based soft adaptation measures should be taken, such as improving flood early warning systems (Figure 16e).
Based on the analysis above, the impact of infilling patches on flood vulnerability is not evident in a short period (Table 5). On a long-term scale, infilling patches influence the socio-hydrological cycle and ultimately lead to dynamics in flood vulnerability by altering surface runoff [45,46,47]. Therefore, designing urban open space within BLF patches can slow down the rapid convergence of surface runoff to mitigate flood vulnerability (Figure 16f). For example, the “Sponge City” plan implemented in China is a useful tool for mitigating floods and waterlogging [37,38]. The plan requires cities to act like sponges that are resilient to natural disasters caused by rainwater, which can not only alleviate flooding but also efficiently using freshwater resources.

4. Discussion

4.1. Stability Analysis of Correlation Coefficient under Different Data Resolution

As shown in Table 6, with the coarsening of the data resolution, the correlations between total BLF increase and flood occurrence from 1975 to 2014 have always been significant (p < 0.01). In terms of BLF patch sizes, the significant correlation between the growth characteristics of small BLF patches (≤1 km2) and flood occurrence is still valid with the coarser data resolution. The correlation coefficients of small BLF patches tend to increase as the data resolution decreases from 150 m to 500 m (Table 6). The relationship is also remarkable even when the resolution reaches 1000 m (R = 0.46, p < 0.01). However, the relationship between the growth of large BLF patches and flood occurrence is insignificant except for the 1000 m resolution (R = 0.29, p < 0.05).
From the perspective of expansion types with different resolutions, the significant correlation between flood occurrence and outlying or edge-expansion patches holds when the BLF resolution changes from 30 m to 1000 m (Table 6). Although the correlation coefficient values fluctuate at different resolutions, they are remarkably correlated at the significance level p < 0.01. Moreover, the linear correlation between the infilling type and flood occurrence changes with the resolution of built-up areas. There is a linear correlation between the infilling patch and flood occurrence under 30 m, 250 m, and 500 m resolution, and the correlation coefficients are 0.27 (p < 0.05), 0.23(p < 0.05), and 0.24 (p < 0.05), respectively. However, there is no significant linear correlation between infilling patches and flood occurrence under 150 m and 1000 m resolution.
Therefore, the above analysis indicates that the spatial resolution of built-up land affects the correlation between expansion pattern (patch size and expansion type) and flood vulnerability [29]. Although the correlation coefficients between small patches, expansion type, infilling type, and flood occurrence varied with the spatial resolution of built-up land, the significant correlation between the three and flood occurrence has not changed (p < 0.01). Our understanding of the correlations between small patches, expansion type, infilling type, and flood vulnerability is relatively stable to spatial resolution.
In this paper, the built-up land data with a resolution of 30 m was mainly utilized to investigate the correlation between BLF expansion pattern and flood vulnerability, and we believe this is reasonable. First, it should be noted that as the data resolution decreases, the BLF becomes coarse and unreliable, which makes the correlation between the BLF expansion pattern and flood occurrence unrepresentative. For example, large BLF patches are remarkably correlated to flooding that occurs when the resolution is reduced to 1000 m (R = 0.29, p < 0.05) (Table 6). Nevertheless, we still cannot conclude that there is a significant correlation between the large patches and flood vulnerability because correlations are unremarkable at accurate resolutions. Moreover, considering that the maximum width of roads and bridges in China is generally 30 m, the built-up land dataset we adopted not only ensures the accuracy of the BLF data but also segments the BLF patches connected by roads and bridges. Therefore, the shape and classification criteria of BLF patches should be considered when using high-resolution data (<30 m) for research.

4.2. Comparison with Previous Studies

Previous studies focused on the impact of spatio-temporal variation in the amount of built-up land on flood exposure [8]. These studies investigated the relationship with flood exposure by quantifying the built-up land area [10,11]. Further, they discussed the possible socio-economic factors that lead to a dramatic increase in flood exposure [9]. Due to the limitation of floodplain and built-up land data, the research on the relationship between BLF expansion and flood vulnerability is less involved. In this paper, we analyzed the interaction between BLF expansion and flood risk based on a conceptual model (Figure 1). We recognized that the BLF expansion pattern (patch size and expansion type) affects flood vulnerability based on the flood control practice. Our study provides a new perspective for a more comprehensive understanding of the relationship between BLF expansion and flood risk systems. Moreover, it provides a theoretical basis for formulating sustainable flood management strategies in floodplains.
In hydrology, human activities (flood control measures and urbanization) are considered to be boundary conditions or an external forcing of river-floodplain systems rather than drivers of interactions with flood risk [5,6]. Until the proposal of socio-hydrology, human activities are regarded as the endogenous factors of water system dynamics [4]. Socio-hydrology reveals the feedback mechanisms and synergistic evolution between human societies and hydrological systems to guide sustainable development in a changing environment [7]. For example, Di Baldassarre et al. implemented socio-hydrology as a flood risk problem using the concept of social memory as a vehicle to link human perceptions to flood damage [4]. In analyzing the interaction between BLF expansion and flood risk systems, we view BLF as a driver of flood risk dynamics. Hence, there remains a need to understand how BLF expansion impacts flood risk and how it feeds back into flood adaptation strategies.
There are several differences between our research and a previous study of Han et al., which examined the impact of BLF growth mode on flood vulnerability in the Yangtze River Economic Belt from 1990 to 2014 (hereafter referred to as the previous case study) [48]. First, our study differs from the resolution of the built-up land data utilized in the previous case study. Built-up land datasets for the two studies were from the Joint Research Centre of the European Commission. We employed the 2018 version while the previous case study used the 2015 version. The 2018 version includes several improvements compared with the 2015 version. (1) The 2018 version of the dataset increases the resolution to 30m, while the 2015 version is 38m. The pixel-based assessment of data precision indicates that the 2015 version has lower data precision than the 2018 version (Table 7) [5]. (2) The generation method and workflow of 2018 version data have been improved. For example, improvements in the accuracy of the learning dataset have reduced omission and commission errors in built-up land (Table 7) [5]. Additionally, accuracy assessment by Leyk et al. indicates that the error of built-up land in rural and scattered areas is larger than in urban areas [49]. Thus, the 2018 version dataset has a major advantage for depicting rural and scattered built-up land patches, which provided more accurate data for illustrating the relationship between BLF expansion and flood vulnerability.
Second, this paper and the previous case study have consistently agreed that small patches dominate the BLF growth and have a significant linear relationship with flood vulnerability [48]. There was no significant correlation between large growth patches and flood vulnerability. However, we found a negative correlation trend between large patches and flood vulnerability as they increased. This trend suggests that an increase in the number and size of large patches in a particular study area has a positive effect on reducing flood vulnerability. Moreover, the differences primarily lie in the impact of expansion type on flood vulnerability. The previous case study in the Yangtze River Economic Belt showed that the correlation between leapfrog type (i.e., outlying type) BLF growths (R = 0.34–0.68, p < 0.01) and flood occurrence was much more reliable than the edge-expanding BLF (R = 0.16–0.46) [48]. However, we discovered that the edge-expansion type BLF (R = 0.53, p < 0.01) rather than the outlying type (R = 0.51, p < 0.01) had a stronger correlation with flood vulnerability in 1975–2014 (Table 5). As shown in Table 5, correlations between outlying type BLF and flood occurrence are not always stronger than edge-expansion type in each period. Therefore, we deduce that there may be more complex relationships between flood vulnerability and either outlying or edge-expanding BLFs. At least, which of the two is more strongly correlated with flood vulnerability needs further study.
In addition, we conducted a more comprehensive analysis of BLF dynamics and growth rates from the reform and opening-up to 2014, which is more reliable in examining linear correlations over a relatively long period. The BLF expansion in the NPCA has experienced a process of dispersion and coalescence. The previous case study has shown no significant correlation between infilling patches and flood vulnerability. However, we found a significant correlation (R = 0.27, p < 0.05) between the growth of infilling patches and flood vulnerability in 1975–2014, although this correlation was weaker than the growth of outlying and infilling patches (Table 5). Many studies have also shown that the growth of infilling patches increases impervious surfaces and thus affects surface runoff [45,46,50]. This effect may not be apparent for short periods. When the impervious surface reaches a certain threshold, it affects the hydrological cycle and exacerbates flood hazards by altering the infiltration of surface runoff. Therefore, the correlation between infilling patch growth and flood vulnerability is significant over relatively long time scales (Table 5).

4.3. Policy Implications and Suggestions

China has experienced unprecedented rapid urbanization since its reform and opening-up policies in 1978 [51]. The climate deterioration and the gathering of people and property have wreaked havoc on the floodplain [52]. Previous studies have revealed that China will suffer the highest direct losses due to fluvial floods in the next two decades [53,54]. To address this challenge, governments have successively issued many policies and decrees to reduce flood damage (Table 8) [1]. According to these historical policies and decrees, the flood control policies in the 1980s and 1990s focused on building structural projects in core cities and areas prone to catastrophic floods. After the 21st century, policies and decrees have placed more emphasis on integrated risks and gradually shifted towards soft adaptation strategies to manage floods. Flood control planning was required to be incorporated into the city’s master plans. These policies have important guiding significance for regional flood control and disaster reduction.
However, rapid BLF growth in China also reflects policy deficiencies in flood risk management. Historical flood risk management policies have ignored the impact of the BLF expansion on flood vulnerability. The relationship between the BLF expansion pattern and flood vulnerability in our study can provide a scientific basis for flood risk management.
First, small BLF patches should be focused on reducing their flood vulnerability. Contrary to large BLF patches, small patches have a higher vulnerability and lower resistance to flooding due to their limited resources (Figure 14). High-grade structural measures may temporarily prevent small patches from flooding. However, it is not cost–effective to use structural measures to strengthen the flood control level of small patches based on cost–benefit analysis [18]. Managing flood risk involves much more than building dikes or levees [38]. Soft adaptation strategies can play a crucial role in reducing the flood vulnerability of small patches (Figure 15) [38]. For example, China has started implementing the national “Sponge Cities” program in 16 pilot cities. A vast amount of green space has been integrated into urban design to increase infiltration and prevent surface flooding [55]. Soft adaptations also include early warning systems (EWS), risk-informed land planning, risk financing instruments, and other nature-based measures [39].
Second, the government should issue decrees to limit the sprawl of BLF patches. Flood prevention measures are generally cost-effective in densely populated and property-intensive areas [18,38]. By contrast, implementing structural measures in small and scattered outlying BLF patches is not sustainable [18]. If the cost-effectiveness of structural measures is not considered, the potential hazard of dam breaks is devastating for outlying and small patches [38]. Given rapid urbanization, we suggest that new urban areas be planned in non-floodplains to minimize the area of outlying BLF patches. At minimum, new outlying BLFs should be built in areas with existing flood control systems. Besides, political and economic instruments are the primary determinants of the BLF expansion pattern. Governments should further amend the Urban-Rural Planning Act and issue explicit decrees to regulate the disorderly expansion of BLF patches. For example, governments should guide or designate areas for BLF expansion or adopt mandatory tax policies for illegal floodplain occupation. In addition, soft adaptation strategies should be implemented to reduce flood vulnerability in outlying patches that have already expansion (Figure 16b,e).
Third, flood control planning is an indispensable part of risk management and a prerequisite for urban to resist floods. However, flood control standards of most cities in China are low and lag behind socio-economic development. According to an urban flood control survey in 2013, about 90% of China’s 642 cities are threatened by flooding of varying degrees. Half of these cities (321) failed to meet the national flood control standards. In addition, 44% of the cities (282) have not completed or updated their flood control plans [56]. Therefore, we suggest that flood control planning should be pervasively incorporated into urban and rural construction planning rather than just in large and medium-sized cities. The impacts of the BLF expansion pattern on flood vulnerability should be fully considered in updated urban and rural planning.
Moreover, a cost-benefit analysis should be a fundamental theory for implementing structural measures or soft adaptation strategies. Many cost–benefit analyses on flood control measures have been carried out in European and American countries [57,58]. However, the development of flood control policies lacks the support of relevant research in China. In a recent study, Du et al. conducted a cost–benefit analysis of flood control measures under different climate change scenarios in Shanghai [59]. An optimal hybrid strategy combining structural measures and soft adaptation strategies was proposed, which provides a reference for the cost–benefit analysis of flood control measures and potential adaptation strategies in other cities.

4.4. Remaining Deficiencies and Future Research Direction

Our research on BLF expansion mode and flood vulnerability has several limitations. Limited by the accuracy of remote sensing data, we only studied the relationship between BLF growth and flood occurrence for resolutions greater than 30 m [29]. Whether there is still a significant correlation between BLF expansion type and flood occurrence when the resolution is less than 30 m remains to be further researched. Therefore, more accurate BLF data from remote sensing images are needed to further analyze the correlation between BLF expansion and flood occurrence.
Moreover, the relationship between BLF expansion pattern and flood occurrence in this paper was examined by quantifying the BLF area and cumulative flood-affected areas. Thus, the relationship between the two needs to be further validated. For example, a study of the relationship between BLF growth and flood magnitude, peak flows, flood frequency, or flood losses could further verify the correlation between BLF expansion and flood vulnerability. In addition to significant linear correlations, there may be a more complicated relationship between flood occurrence and outlying or edge-expansion patches. We have not investigated this possible relationship in this paper. At least, it is not clear which of the outlying and edge-expansion patches have a stronger correlation with flood occurrence, i.e., more significantly associated with flood vulnerability.
Despite a handful of drawbacks, our study has important implications for understanding the relationship between BLF growth and flood risk, as well as for flood prevention and disaster mitigation. In future studies, in addition to addressing the above limitations in this paper, we need to further analyze the relationship between infilling patches and flood occurrence, which is because the previous case study by Han et al. does not support this correlation [48]. In a particular study area, we are trying to find out which threshold the infilling BLF reaches will significantly affect the flood vulnerability.
From the conceptual framework of BLF expansion and flood risk system (Figure 1), the interplay between BLF growth and flood risk is not limited to the impact of expansion pattern on flood vulnerability. Flood risk is an integrated result of flood hazard, exposure, and vulnerability. Therefore, this study is a snapshot of the relationship between BLF growth and flood risk. Our future study will select a typical region to investigate the impact of BLF expansion on flood risk systems (flood hazard, exposure, and vulnerability). Future studies will lead to a more comprehensive understanding of the interaction between BLF expansion and flood risk and propose corresponding disaster prevention and mitigation strategies for the sustainable development of floodplains.

5. Conclusions

Floods are causing increasing havoc in China’s floodplains due to unprecedented urbanization and improper development. Thus, understanding the relationship between BLF expansion and flood risk is of great significance for flood prevention and disaster reduction. Previous studies have focused on the relationship between BLF area and flood exposure while ignoring the relationship between BLF expansion pattern and flood vulnerability as well as its adaption strategies, which plays a crucial role in the sustainable development of floodplains and the formulation of flood control policies.
Using the NCPA as an example, we examined the spatial distribution and dynamics of BLF patches using the GIS-based landscape analysis in 1975–2014. The spatial distribution of BLF was uneven. Districts and counties with high occupancy rates (ORi > 15%) were mainly distributed along the Yellow River, Zhengzhou-Shijiazhuang-Beijing line, the Grand Canal-Huaihe River, and the center of Shandong province. The area of BLF increased by 288.26% from 1975 to 2014, and the most rapid growth of BLF occurred in 1975–1990 (CR = 34.01%, AACR = 5.98%). Besides, the BLF expansion in the NPCA has experienced a dispersion-coalescence process. Small patches dominated the number and area of BLF growth. Edge-expansion patches were the expansion type with the most area growth in the NCPA.
We viewed BLF growth as a driver of flood risk from a socio-hydrological perspective. Our study discovered that flood vulnerability was significantly impacted by small (R = 0.36, p < 0.01), edge-expansion (R = 0.53, p < 0.01), and outlying patches (R = 0.51, p < 0.01). Unlike previous studies, we discovered no significant linear correlation between large patches and flood vulnerability (R = 0.18, p > 0.1) but a negative trend. It was not the outlying patches that had a stronger correlation with flood vulnerability. Furthermore, infilling patch growth was significantly associated with flood vulnerability over long periods, but this correlation was weaker than edge-expansion and outlying patches. Governments should issue decrees to limit the sprawl of BLF patches. Soft adaptation measures and village merging should be taken to reduce flood damage in small and outlying patches.
Future research will improve the resolution of remote sensing data (less than 30 m) and further validate the correlation with flood vulnerability by analyzing the BLF expansion pattern in relation to flood frequency, flood magnitude, peak discharges, and flood losses. Flood risk is an integrated result of flood hazard, exposure, and vulnerability. Therefore, this study is a snapshot of the relationship between BLF growth and flood risk. Future studies will select a representative region to investigate the impacts of BLF expansion on flood hazard, exposure, and vulnerability. These studies provide a more comprehensive understanding of the interplay between BLF growth and the flood risk system and finding a sustainable and integrated development strategy for floodplains.

Author Contributions

Conceptualization, G.W., and L.L.; data curation and investigation, G.W., Z.H., Y.L. (Yong Liu), G.Z., J.L., Y.L. (Jifu Liu), Y.G., X.H., Q.Z., Z.T., C.H., and L.L.; methodology, G.W., and L.L.; writing, G.W., and L.L. All authors have read and agreed to the published version of the manuscript.

Funding

The study was supported by the National Key Research and Development Project (Grant No. 2017YFC1503000).

Acknowledgments

The authors would like to thank the three anonymous reviewers for their valuable comments and the two editors (Cris Wang and Helen Wang) for their help with this article.

Conflicts of Interest

The authors declare no conflict of interest.

References

  1. Du, S.; He, C.; Huang, Q.; Shi, P. How did the urban land in floodplains distribute and expand in China from 19922–015? Environ. Res. Lett. 2018, 13, 034018. [Google Scholar] [CrossRef]
  2. Chen, X.; Chen, L.; Stone, M.C.; Acharya, K. Assessing connectivity between the river channel and floodplains during high flows using hydrodynamic modeling and particle tracking analysis. J. Hydrol. 2020, 583, 124609. [Google Scholar] [CrossRef]
  3. Burke, J.J.; Pricope, N.G.; Blum, J. Thermal imagery-derived surface inundation modeling to assess flood risk in a flood-pulsed savannah watershed in Botswana and Namibia. Remote Sens. 2016, 8, 676. [Google Scholar] [CrossRef] [Green Version]
  4. Di Baldassarre, G.; Viglione, A.; Carr, G.; Kuil, L.; Salinas, J.L.; Blöschl, G. Socio-hydrology: Conceptualising human-flood interactions. Hydrol. Earth Syst. Sci. 2013, 17, 3295. [Google Scholar] [CrossRef] [Green Version]
  5. Wing, O.E.; Pinter, N.; Bates, P.D.; Kousky, C. New insights into US flood vulnerability revealed from flood insurance big data. Nat. Commun. 2020, 11, 1444. [Google Scholar] [CrossRef] [Green Version]
  6. Gober, P.; Wheater, H.S. Debates-Perspectives on socio-hydrology: Modeling flood risk as a public policy problem. Water Resour. Res. 2015, 51, 4782–4788. [Google Scholar] [CrossRef]
  7. Sivapalan, M.; Savenije, H.H.; Blöschl, G. Socio-hydrology: A new science of people and water. Hydrol. Process. 2012, 26, 1270–1276. [Google Scholar] [CrossRef]
  8. Früh-Müller, A.; Wegmann, M.; Koellner, T. Flood exposure and settlement expansion since pre-industrial times in 1850 until 2011 in north Bavaria, Germany. Reg. Environ. Chang. 2015, 15, 183–193. [Google Scholar] [CrossRef] [Green Version]
  9. Wu, K.Y.; Zhang, H. Land use dynamics, built-up land expansion patterns, and driving forces analysis of the fast-growing Hangzhou metropolitan area, eastern China (19782–008). Appl. Geogr. 2012, 34, 137–145. [Google Scholar] [CrossRef]
  10. Luo, J.; Xing, X.; Wu, Y.; Zhang, W.; Chen, R.S. Spatio-temporal analysis on built-up land expansion and population growth in the Yangtze River Delta Region, China: From a coordination perspective. Appl. Geogr. 2018, 96, 98–108. [Google Scholar] [CrossRef]
  11. Sun, Y.; Zhao, S. Spatiotemporal dynamics of urban expansion in 13 cities across the Jing-Jin-Ji urban agglomeration from 1978 to 2015. Ecol. Indic. 2018, 87, 302–313. [Google Scholar] [CrossRef]
  12. Hussein, K.; Alkaabi, K.; Ghebreyesus, D.; Liaqat, M.U.; Sharif, H.O. Land use/land cover change along the Eastern Coast of the UAE and its impact on flooding risk. Geomat. Nat. Haz. Risk 2020, 11, 112–130. [Google Scholar] [CrossRef] [Green Version]
  13. Hemmati, M.; Ellingwood, B.R.; Mahmoud, H.N. The role of urban growth in resilience of communities under flood risk. Earth Future 2020, 8, e2019EF001382. [Google Scholar] [CrossRef] [PubMed] [Green Version]
  14. Tahmina, A.; Philippe, Q.; Eisenreich, S.J.; Guido, V. Impacts of climate and land use changes on flood risk management for the schijn river, belgium. Environ. Sci. Policy 2018, 89, 163–175. [Google Scholar]
  15. Corbane, C.; Pesaresi, M.; Kemper, T.; Politis, P.; Florczyk, A.J.; Syrris, V.; Melchiorri, M.; Sabo, F.; Soille, P. Automated global delineation of human settlements from 40 years of Landsat satellite data archives. Big Earth Data 2019, 3, 140–169. [Google Scholar] [CrossRef]
  16. Pesaresi, M.; Syrris, V.; Julea, A. A new method for earth observation data analytics based on symbolic machine learning. Remote Sens. 2016, 8, 399. [Google Scholar] [CrossRef] [Green Version]
  17. Sun, W.J.; Zhang, K.; Zheng, Y.N.; Zhang, M.H. Research review on the city flood control of China. J. Dalian Univ. 2016, 37, 45–48. [Google Scholar]
  18. Ward, P.; Jongman, B.; Aerts, C.J.H.; Bates, D.P.; Botzen, W.J.W.; Diaz Loaiza, M.; Hallegatte, S.; Kind, J. A global framework for future costs and benefits of river-flood prevention in urban areas. Nat. Clim. Chang. 2017, 7, 642–646. [Google Scholar] [CrossRef]
  19. Bae, S.; Chang, H. Urbanization and floods in the Seoul Metropolitan area of South Korea: What old maps tell us. Int. J. Disaster Risk Reduct. 2019, 37, 101186. [Google Scholar] [CrossRef]
  20. Wang, Y.; Xie, X.; Liang, S.; Zhu, B.; Yao, Y.; Meng, S.; Lu, C. Quantifying the response of potential flooding risk to urban growth in Beijing. Sci. Total Environ. 2020, 705, 135868. [Google Scholar] [CrossRef]
  21. Wei, X.Q.; Ye, Y.; Zhang, Q.; Li, B.B.; Wei, Z.D. Reconstruction of cropland change in North China Plain Area over the past 300 years. Global Planet. Chang. 2019, 176, 60–70. [Google Scholar] [CrossRef]
  22. Yin, W.; Han, S.C.; Zheng, W.; Yeo, I.Y.; Hu, L.; Tangdamrongsub, N.; Ghobadi-Far, K. Improved water storage estimates within the North China Plain by assimilating GRACE data into the CABLE model. J. Hydrol. 2020, 590, 125348. [Google Scholar] [CrossRef]
  23. National Bureau of Statistics. China Statistical Yearbook 2019; China Statistical Press: Beijing, China, 2019. [Google Scholar]
  24. Li, S.; Yang, H.; Lacayo, M.; Liu, J.; Lei, G. Impacts of land-use and land-cover changes on water yield: A case study in Jing-Jin-Ji, China. Sustainability 2018, 10, 960. [Google Scholar] [CrossRef] [Green Version]
  25. Zhang, Y.; Hong, Y.; Wang, X.; Gourley, J.J.; Xue, X.; Saharia, M.; Ni, G.; Wang, G.; Huang, Y.; Chen, S.; et al. Hydrometeorological analysis and remote sensing of extremes: Was the July 2012 Beijing flood event detectable and predictable by global satellite observing and global weather modeling systems? J. hydrometeorol. 2015, 16, 381–395. [Google Scholar] [CrossRef]
  26. Rudari, R.; Silvestro, F.; Campo, L.; Rebora, N.; Boni, G.; Herold, C. Improvement of the Global Food Model for the GAR 2015; United Nations Office for Disaster Risk Reduction (UNDRR): Geneva, Switzerland, 2015; p. 69. [Google Scholar]
  27. Brakenridge, G.R. Global Active Archive of Large Flood Events. 2012. Available online: http://floodobservatory.colorado.edu/Archives/index.html. (accessed on 2 June 2020).
  28. Liu, X.; Li, X.; Chen, Y.; Tan, Z.; Li, S.; Ai, B. A new landscape index for quantifying urban expansion using multi-temporal remotely sensed data. Landsc. Ecol. 2010, 25, 671–682. [Google Scholar] [CrossRef]
  29. Löwe, R.; Arnbjerg-Nielsen, K. Urban pluvial flood risk assessment-data resolution and spatial scale when developing screening approaches on the microscale. Nat. Hazards Earth Syst. Sci. 2020, 20, 981–997. [Google Scholar] [CrossRef] [Green Version]
  30. Tehrany, M.S.; Jones, S.; Shabani, F. Identifying the essential flood conditioning factors for flood prone area mapping using machine learning techniques. Catena 2019, 175, 174–192. [Google Scholar] [CrossRef]
  31. Ceccato, V.; Willems, O. Temporal and spatial dynamics of falls among older pedestrians in Sweden. Appl. Geogr. 2019, 103, 122–133. [Google Scholar] [CrossRef]
  32. Kundzewicz, Z.W.; Su, B.; Wang, Y.; Xia, J.; Huang, J.; Jiang, T. Flood risk and its reduction in China. Adv. Water Resour. 2019, 130, 37–45. [Google Scholar] [CrossRef]
  33. Cheng, X. Flood risk and flood management policies in China. In Annual Report on China’s Response to Climate Change (2017); Springer: Singapore, 2020. [Google Scholar]
  34. Ministry of Housing and Urban-Rural Development of China. Standard for Flood Control (GB50201-2014); Ministry of Housing and Urban-Rural Development of China: Beijing, China, 2014.
  35. Scussolini, P.; Tran, T.T.V.; Koks, E.; Diaz-Loaiza, A.; Ho, P.L.; Lasage, R. Adaptation to sea level rise: A multidisciplinary analysis for ho chi minn city, vietnam. Water Resour Res. 2017, 53, 10841–10857. [Google Scholar] [CrossRef] [Green Version]
  36. Marks, D. The urban political ecology of the 2011 floods in Bangkok: The creation of uneven vulnerabilities. Pac. Aff. 2015, 88, 623–651. [Google Scholar] [CrossRef]
  37. Ziegler, A.D.; She, L.H.; Tantasarin, C.; Jachowski, N.R.; Wasson, R. Floods, false hope, and the future. Hydrol. Process. 2012, 26, 1748–1750. [Google Scholar] [CrossRef]
  38. Jongman, B. Effective adaptation to rising flood risk. Nat. Commun. 2018, 9, 1–3. [Google Scholar] [CrossRef] [Green Version]
  39. Mishra, A.; Siderius, C.; Aberson, K.; Martine, V.D.P.; Froebrich, J. Short-term rainfall forecasts as a soft adaptation to climate change in irrigation management in north-east india. Agr. Water Manag. 2013, 127, 97–106. [Google Scholar] [CrossRef]
  40. Martinez-Juarez, P.; Chiabai, A.; Suárez, C.; Quiroga, S. Insights on urban and periurban adaptation strategies based on stakeholders’ perceptions on hard and soft responses to climate change. Sustainability 2019, 11, 647. [Google Scholar] [CrossRef] [Green Version]
  41. Meng, M.; Dąbrowski, M.; Stead, D. Shifts in Spatial Plans for Flood Resilience and Climate Adaptation: Examining Planning Procedure and Planning Mandates. Sustainability 2020, 12, 105. [Google Scholar] [CrossRef] [Green Version]
  42. Wang, C.; Zhang, Y.; Yang, Y.; Yang, Q.; Hong, J. What is driving the abandonment of villages in the mountains of Southeast China? Land Degrad. Dev. 2019, 30, 1183–1192. [Google Scholar] [CrossRef]
  43. Wang, C.; Gao, B.; Weng, Z.; Tian, Y. Primary causes of total hamlet abandonment for different types of hamlets in remote mountain areas of China: A case study of Shouning County, Fujian Province. Land Use Policy 2020, 95, 104627. [Google Scholar] [CrossRef]
  44. Wang, J.; Li, Y.; Wang, Q.; Cheong, K.C. Urban-Rural Construction Land Replacement for More Sustainable Land Use and Regional Development in China: Policies and Practices. Land 2019, 8, 171. [Google Scholar] [CrossRef] [Green Version]
  45. Sohn, W.; Kim, J.H.; Li, M.H.; Brown, R.D.; Jaber, F.H. How does increasing impervious surfaces affect urban flooding in response to climate variability? Ecol. Indic. 2020, 118, 106774. [Google Scholar] [CrossRef]
  46. De Mello Silva, C.; da Silva, G.B.L. Cumulative effect of the disconnection of impervious areas within residential lots on runoff generation and temporal patterns in a small urban area. J. Environ. Manag. 2020, 253, 109719. [Google Scholar] [CrossRef] [PubMed]
  47. Chen, J.; Ji, J.; Wang, H.; Deng, M.; Yu, C. Risk assessment of urban rainstorm disaster based on multi-layer weighted principal component analysis: A case study of Nanjing, China. Int. J. Environ. Res. Public Health 2020, 17, 5523. [Google Scholar] [CrossRef] [PubMed]
  48. Han, Y.; Huang, Q.; He, C.; Fang, Y.; Wen, J.; Gao, J.; Du, S. The growth mode of built-up land in floodplains and its impacts on flood vulnerability. Sci. Total Environ. 2020, 700, 134462. [Google Scholar] [CrossRef] [PubMed]
  49. Leyk, S.; Uhl, J.H.; Balk, D.; Jones, B. Assessing the accuracy of multi-temporal built-up land layers across rural-urban trajectories in the United States. Remote Sens. Environ. 2018, 204, 898–917. [Google Scholar] [CrossRef]
  50. Du, S.; Shi, P.; Van Rompaey, A.; Wen, J. Quantifying the impact of impervious surface location on flood peak discharge in urban areas. Nat. Hazards 2015, 76, 1457–1471. [Google Scholar] [CrossRef]
  51. Wang, G.; Liu, Y.; Hu, Z.; Lyu, Y.; Zhang, G.; Liu, J.; Liu, Y.; Gu, Y.; Huang, X.; Zheng, H.; et al. Flood Risk Assessment Based on Fuzzy Synthetic Evaluation Method in the Beijing-Tianjin-Hebei Metropolitan Area, China. Sustainability 2020, 12, 1451. [Google Scholar] [CrossRef] [Green Version]
  52. Liao, X.L.; Xu, W.; Zhang, J.L.; Li, Y.; Tian, Y.G. Global exposure to rainstorms and the contribution rates of climate change and population change. Sci. Total Environ. 2019, 663, 644–653. [Google Scholar] [CrossRef]
  53. Willner, S.N.; Otto, C.; Levermann, A. Global economic response to river floods. Nat. Clim. Chang. 2018, 8, 594–598. [Google Scholar] [CrossRef]
  54. Dottori, F.; Szewczyk, W.; Ciscar, J.C.; Zhao, F.; Alfieri, L.; Hirabayashi, Y.; Alessandra Bianchi, A.; Mongelli, I.; Frieler, K.; Betts, R.A.; et al. Increased human and economic losses from river flooding with anthropogenic warming. Nat. Clim. Chang. 2018, 8, 781–786. [Google Scholar] [CrossRef]
  55. Wang, J.; Liu, J.; Wang, H.; Shao, W.; Mei, C.; Ding, X. Matching analysis of investment structure and urban inundation control function of sponge cities in China. J. Clean Prod. 2020, 121850. [Google Scholar] [CrossRef]
  56. Cheng, X.T.; Li, C.C. The evolution trend, key features and countermeasures of urban flood risk. China Flood Drought Manag. 2015, 25, 6–9. [Google Scholar]
  57. De Ruig, L.T.; Haer, T.; De Moel, H.; Botzen, W.W.; Aerts, J.C. A micro-scale cost-benefit analysis of building-level flood risk adaptation measures in Los Angeles. Water Resour. Econ. 2019, 100147, in press. [Google Scholar] [CrossRef]
  58. Vousdoukas, M.I.; Mentaschi, L.; Hinkel, J.; Ward, P.J.; Mongelli, I.; Ciscar, J.C.; Feyen, L. Economic motivation for raising coastal flood defenses in Europe. Nat. Commun. 2020, 11, 1–11. [Google Scholar] [CrossRef] [PubMed]
  59. Du, S.; Scussolini, P.; Ward, P.J.; Zhang, M.; Wen, J.; Wang, L.; Koks, E.; Diaz-Loaizab, A.; Gao, J.; Ke, Q.; et al. Hard or soft flood adaptation? Advantages of a hybrid strategy for Shanghai. Glob. Environ. Chang. 2020, 61, 102037. [Google Scholar] [CrossRef]
Figure 1. Schematic of the interplay between the built-up land in floodplains and the flood risk system from a socio-hydrology perspective.
Remotesensing 12 03172 g001
Figure 2. The geographical location of the North China Plain Area.
Remotesensing 12 03172 g002
Figure 3. Spatial-temporal distribution of floodplains in the North China Plain Area (NCPA).
Remotesensing 12 03172 g003
Figure 4. The overall framework of the impact of the built-up land in floodplains (BLF) expansion pattern on flood vulnerability and its adaptation strategies.
Remotesensing 12 03172 g004
Figure 5. The identification of the different expansion types of BLF patches using landscape expansion index (LEI). (AC) indicate infilling patches, edge-expansion patches, and outlying patches, respectively.
Remotesensing 12 03172 g005
Figure 6. Area of built-up land in floodplains and its proportion of the total built-up land area of each province and city in 2014.
Remotesensing 12 03172 g006
Figure 7. The occupation ratio (OR(i)) of the built-up land in floodplains of each district and county in 2014.
Remotesensing 12 03172 g007
Figure 8. The change rate (CR) of the built-up land in floodplains of each county and district from 1975 to 2015.
Remotesensing 12 03172 g008
Figure 9. Average annual change rates (AACR) of the built-up land in floodplains (BLF) in different periods: (a) 1975–1990; (b) 1990–2000; and (c) 2000–2014.
Remotesensing 12 03172 g009aRemotesensing 12 03172 g009b
Figure 10. Patch number (a) and area (b) of three BLF expansion types in the study area in 1975–2014.
Remotesensing 12 03172 g010
Figure 11. The number distribution of different growth patch sizes in the North China Plain Area: (a) North China Plain Area; (b) Beijing; (c) Tianjin; (d) Hebei; (e) Shandong; (f) Henan; (g) Anhui; and (h) Jiangsu.
Remotesensing 12 03172 g011
Figure 12. Area distributions of the built-up land in floodplains with different patch sizes in the North China Plain Area: (a) North China Plain Area; (b) Beijing; (c) Tianjin; (d) Hebei; (e) Shandong; (f) Henan; (g) Anhui; and (h) Jiangsu.
Remotesensing 12 03172 g012
Figure 13. The number (a,c,e) and area (b,d,f) distributions of BLF patches with different patch sizes under three expansion types in 1975–2014. Legend abbreviations: BJ, Beijing; TJ, Tianjin; HB, Hebei; SD, Shandong; HN, Henan; AH, Anhui; and JS, Jiangsu.
Remotesensing 12 03172 g013
Figure 14. Effects of different patch sizes on flood vulnerability and flood control capacity.
Remotesensing 12 03172 g014
Figure 15. Flood adaptation strategies between different patch sizes in floodplains. (a) indicates the current situation of flood prevention for different patch sizes. (b) shows their corresponding flood adaptation measures.
Remotesensing 12 03172 g015
Figure 16. The impact of different expansion types on the flood vulnerability of BLF patches and the adaptation measures. (ac) represent the current flood prevention in the edge-expansion, outlying, and infilling patches, respectively. (df) indicates flood adaptation measures for the three expansion types of BLF patches.
Remotesensing 12 03172 g016
Table 1. Sensitivity analysis of LEI under different buffer distances in three periods.
Buffer Distances (m)Average Standard Deviation (ASD)
1975–19901990–20002000–2014
1–50.0740.0720.077
10–300.4620.4470.471
Table 2. The rapid growth of built-up land in floodplains from 1975 to 2014.
Provinces
(Cities)
Growth Area (km2)Proportion
(%)
CR
(%)
AACR
(%)
Beijing49.390.26194.572.81
Tianjin636.893.36264.953.38
Hebei3788.6719.97357.253.97
Shandong4212.7322.21344.843.90
Henan3524.7918.58235.473.15
Anhui3352.2117.67172.672.61
Jiangsu3406.7517.96572.455.01
NCPA18971.42100.00288.263.45
Notes: the proportion represents the ratio of the BLF growth area to the total BLF growth area; CR and AACR indicate the change rate and the average annual change rate of the BLF area, respectively.
Table 3. Dynamics of the built-up land in floodplains (BLF) in different periods.
Provinces
(Cities)
1975–19901990–20002000–2014
CR
(%)
AACR
(%)
CR
(%)
AACR
(%)
CR
(%)
AACR
(%)
Beijing30.924.4115.461.4533.522.08
Tianjin32.035.3022.372.0437.492.30
Hebei37.036.8328.312.5232.322.02
Shandong35.136.4826.932.4136.742.66
Henan37.825.5516.861.5626.531.68
Anhui29.994.8525.002.5220.002.02
Jiangsu35.148.4240.653.4742.162.54
Average34.015.9825.082.2832.682.19
Notes: CR and AACR are the change rate and the average annual change rate of the BLF area, respectively.
Table 4. Pearson correlation coefficients between the patch sizes of built-up land in floodplains and flood occurrence in the North China Plain Area.
Patch Sizes1975–2014
(N = 77)
1975–1990
(N = 77)
1990–2000
(N = 77)
2000–2014
(N = 77)
Total BLF increase0.36 **0.41 **0.31 **0.29 **
Large patches
Small patches
0.180.22−0.05−0.07
0.36 **0.40 **0.32 **0.31 **
Notes: Double asterisks (**) indicate a significance level at p < 0.01.
Table 5. Pearson correlation coefficients between the expansion types of built-up land in floodplains and flood occurrence in the North China Plain Area (NPCA).
Expansion Types1975~2014
(N = 77)
1975~1990
(N = 77)
1990~2000
(N = 77)
2000~2014
(N = 77)
Infilling0.27 *0.050.170.19
Edge-expansion0.53 **0.39 **0.35 **0.32 **
Outlying0.51 **0.52 **0.33 **0.45 **
Notes: A single asterisk (*) represents a significance level at p < 0.05; double asterisks (**) indicate a significance level at p < 0.01.
Table 6. Correlation coefficients between BLF expansion patterns and flood occurrence at different spatial resolutions.
Expansion PatternDifferent Resolutions (m)
30 m150 m250 m500 m1000 m
Total BLF increase0.36 **0.49 **0.49 **0.48 **0.48 **
Large patches0.180.140.160.180.29 *
Small patches0.36 **0.39 **0.39 **0.46 **0.46 **
Infilling0.27 *0.170.23 *0.24 *0.20
Edge-expansion0.53 **0.35 **0.42 **0.37 **0.42 **
Outlying0.51 **0.38 **0.39 **0.44 **0.36 **
Notes: A single asterisk (*) represents a significance level at p < 0.05; double asterisks (**) indicate a significance level at p < 0.01.
Table 7. Performance metrics of built-up land data based on pixel accuracy evaluation [49].
Performance Metrics2015 Version2018 Version
Balanced Accuracy0.830.86
Omission Error0.220.18
Commission Error0.460.42
Table 8. Policies and decrees related to BLF in China from the 1980s to 2010s.
YearPolicy/DecreesRelated ContentsDepartments
1989Urban Planning Law of the People’s Republic of ChinaFlood prevention measures should be implemented in areas prone to catastrophic floodingMOHURD
1998Disaster Reduction Planning of the People’s Republic of China (1998–2010)Upgrading of flood prevention standards in core cities and implementing integrated disaster mitigation plansMOHURD, MWR, MCA
2007China’s National Plan of Integrated Disaster Reduction (2006–2010)Compilation of the national integrated disaster risk mapMOHURD, MWR, MCA
2007Urban-Rural Planning Law of the People’s Republic of ChinaDisaster prevention and reduction should be included in the comprehensive plans of cities and townsMOHURD
2011China’s National Plan of Integrated Disaster Prevention and Reduction (2011–2015)Compilation of integrated risk maps at different scales; improving flood prevention in small and medium-sized riversMOHURD, MWR, MCA
Notes: MOHURD, MWR, and MCA denote the Ministry of Housing and Urban-Rural Development, Ministry of Water Resources, and Ministry of Civil Affairs, respectively.

