A Comprehensive Evaluation of Latest GPM IMERG V06 Early, Late and Final Precipitation Products across China


1
Key Laboratory of Water Cycle and Related Land Surface Processes, Institute of Geographic Science and Natural Resources Research, Chinese Academy of Sciences, Beijing 100011, China
2
University of Chinese Academy of Sciences, Beijing 101400, China
3
Big Data Institute, University of Oxford, Oxford OX3 7LF, UK
4
Department of Remote Sensing, Helmholtz Centre for Environmental Research−UFZ, Permoserstrasse 15, 04318 Leipzig, Germany
5
Remote Sensing Centre for Earth System Research, Leipzig University, 04109 Leipzig, Germany
*
Author to whom correspondence should be addressed.
Remote Sens. 2021, 13(6), 1208; https://0-doi-org.brum.beds.ac.uk/10.3390/rs13061208
Submission received: 28 January 2021
/
Revised: 16 March 2021
/
Accepted: 17 March 2021
/
Published: 22 March 2021
Abstract
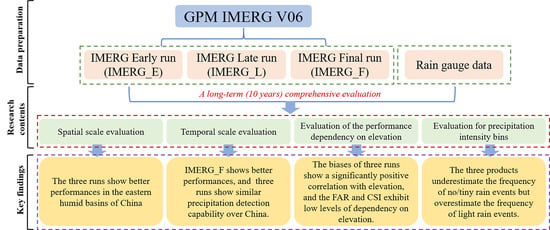
:This study evaluated the performance of the early, late and final runs of IMERG version 06 precipitation products at various spatial and temporal scales in China from 2008 to 2017, against observations from 696 rain gauges. The results suggest that the three IMERG products can well reproduce the spatial patterns of precipitation, but exhibit a gradual decrease in the accuracy from the southeast to the northwest of China. Overall, the three runs show better performances in the eastern humid basins than the western arid basins. Compared to the early and late runs, the final run shows an improvement in the performance of precipitation estimation in terms of correlation coefficient, Kling–Gupta Efficiency and root mean square error at both daily and monthly scales. The three runs show similar daily precipitation detection capability over China. The biases of the three runs show a significantly positive (p < 0.01) correlation with elevation, with higher accuracy observed with an increase in elevation. However, the categorical metrics exhibit low levels of dependency on elevation, except for the probability of detection. Over China and major river basins, the three products underestimate the frequency of no/tiny rain events (P < 0.1 mm/day) but overestimate the frequency of light rain events (0.1 ≤ P < 10 mm/day). The three products converge with ground-based observation with regard to the frequency of rainstorm (P ≥ 50 mm/day) in the southern part of China. The revealed uncertainties associated with the IMERG products suggests that sustaining efforts are needed to improve their retrieval algorithms in the future.
1. Introduction
Precipitation plays a critical role in water cycle and energy balance [1,2,3,4]. Understanding the spatial and temporal variability of precipitation is essential for many applications including hydrological modeling, climatic prediction and water resource management as well as environmental and ecological risk analysis [2,5,6,7]. In general, precipitation estimates can be obtained from three sources: ground-based observations, model simulations and remote sensing observations [8,9]. Ground-based observation is the most accurate method of retrieving precipitation records. However, it is largely limited by the sparse ground networks of rain gauges and the discontinuity of the recording sequences [10,11]. Ground-based radar is an alternative approach for measuring precipitation, but it is affected by surface backscattering, signal attenuation and reflectivity-rain-rate (Z‒R) [12]. Process models, for instance, the European Centre for Medium-Range Weather Forecasts (ECMWF) and Modern-Era Retrospective Analysis for Research and Application (MERRA) [13,14], can well simulate the spatial patterns of precipitation but often show substantial uncertainties [15]. Satellite-based observations provide a unique opportunity to estimate (near) real-time precipitation globally with promising accuracy, especially for remote regions such as mountains, deserts and oceans, where ground-based observations are too sparse [16,17,18]. Consequently, estimating precipitation from remote sensing observations has become a major approach to measuring precipitation over the world [19].
In recent decades, the satellite information technologies have achieved greatly developments especially for precipitation retrieval algorithms [20]. Among them, the main precipitation retrieval algorithms include Visible (VIS), Infrared (IR), Passive Microwave (PMW), Active Microwave (AMW) and Multi-Sensor (MS) [21]. Generally, VIS and IR have high time-space resolution, while they lack the physical basis and have low accuracy [22,23]. PMW has high accuracy in global scale in comparison with VIS and IR, while its drawback is low time-space resolution [24]. Therefore, Multi-sensor Precipitation Estimation (MPE) has become the main way to retrieve high accuracy and resolution precipitation products by combining their complementary strengths [24,25]. For example, Climate Prediction Center Morphing Method (CMORPH) uses geostationary IR data to obtain cloud motion and interpolates the precipitation rate by PMW data [25]. Similarly, the TMPA (Tropical Rainfall Measuring Mission Multi-satellite Precipitation Analysis) algorithm generates the rainfall by combing the PMW data and IR temperature brightness [26].
Over the world, many available satellite-based precipitation products (SPPs) differ in terms of their development purposes, input data sources, retrieval algorithms, spatiotemporal resolutions, coverages and temporal spans. Among them, the Tropical Rainfall Measuring Mission (TRMM) has provided a valuable precipitation dataset over the tropics and subtropics since 27 November 1997 [26,27]. Subsequently, the Global Precipitation Measurement (GPM), as a successor to the TRMM, was launched on 28 February 2014, aims to produce an accurate and reliable global precipitation estimation with all available sensors in TRMM and GPM eras [28,29]. Compared to TRMM products, the GPM precipitation products have a full coverage of the globe with a half-hourly temporal resolution and 0.1° × 0.1° spatial resolution, whereas the TRMM products only cover the latitude range of 50° N‒50° S at much coarser spatial (0.25° × 0.25°) and temporal (three-hourly) resolutions [26]. In terms of precipitation retrieval algorithms, previous SPPs still have some limitations. For example, the Precipitation Estimation from Remotely Sensed Information using Artificial Neural Network (PERSIANN) estimates precipitation values based on infrared brightness temperature image (as input) and artificial neural network (as a model) [30], whereas CMORPH only uses infrared data for transporting the microwave-based rain characteristics during the periods when microwave data are not available at a location [25,31]. However, the Integrated Multi-satellite Retrievals for GPM (IMERG) combine the advantages of CMORPH, PERSAINN and TMPA products [32,33]. Given these improvements, the IMERG products tend to perform better than other SPPs in many regions across the world including China [34], Malaysia [35] and East Asia [36].
Although previous studies have demonstrated that the IMERG products exhibit better accuracy and precipitation detection performance than other satellite dataset such as TRMM 3B42, 3B42RT and PERSIANN-CDR products in many regions [19,37,38,39], the temporal coverage of these studies are limited. Recently, the latest version of IMERG products (IMERG V06) has been released, covering the period beginning from June 2000. The products include significant improvements in the algorithm used to estimate precipitations and provide estimates for precipitation phase [29] using the look-up table method developed by Sim and Liu [40]. Recent studies have highlighted the high performance of the IMERG V06 products in various contexts, which include Iran, Austria and Germany [41,42,43]. To date, however, a comprehensive accuracy evaluation of the long-term retrospective IMERG precipitation estimates for China is lacking, which has largely limited its applications in various fields.
In this study, we aimed to evaluate the long-term (10 years) retrospective IMERG precipitation data across mainland China, including the near-real-time (NRT) “Early” (IMERG_E), “Late” (IMERG_L), Post-Real-Time (PRT) and “Final” (IMERG_F) products. To this end, observed precipitation records from 696 rain gauges and the three runs of IMERG V06 products were obtained for the period between 1 January 2008 and 31 December 2017. The objectives of this study were three-fold: (a) investigate the variations in IMERG V06 performance in multiple time-space scale; (b) evaluate how the performance of IMERG V06 depends on topographic variations; and (c) assess the accuracy and detection performance of IMERG V06 for capturing different precipitation types. The long-term evaluation results could further provide references for the improvement of IMERG product algorithms. More importantly, the outcome of this wok could validate the utility of latest IMERG V06 as a source of precipitation dataset to forecast and early warning against potentially natural hazards such as extreme precipitation and drought in less prepared regions.
2. Study Area and Dataset
2.1. Study Area
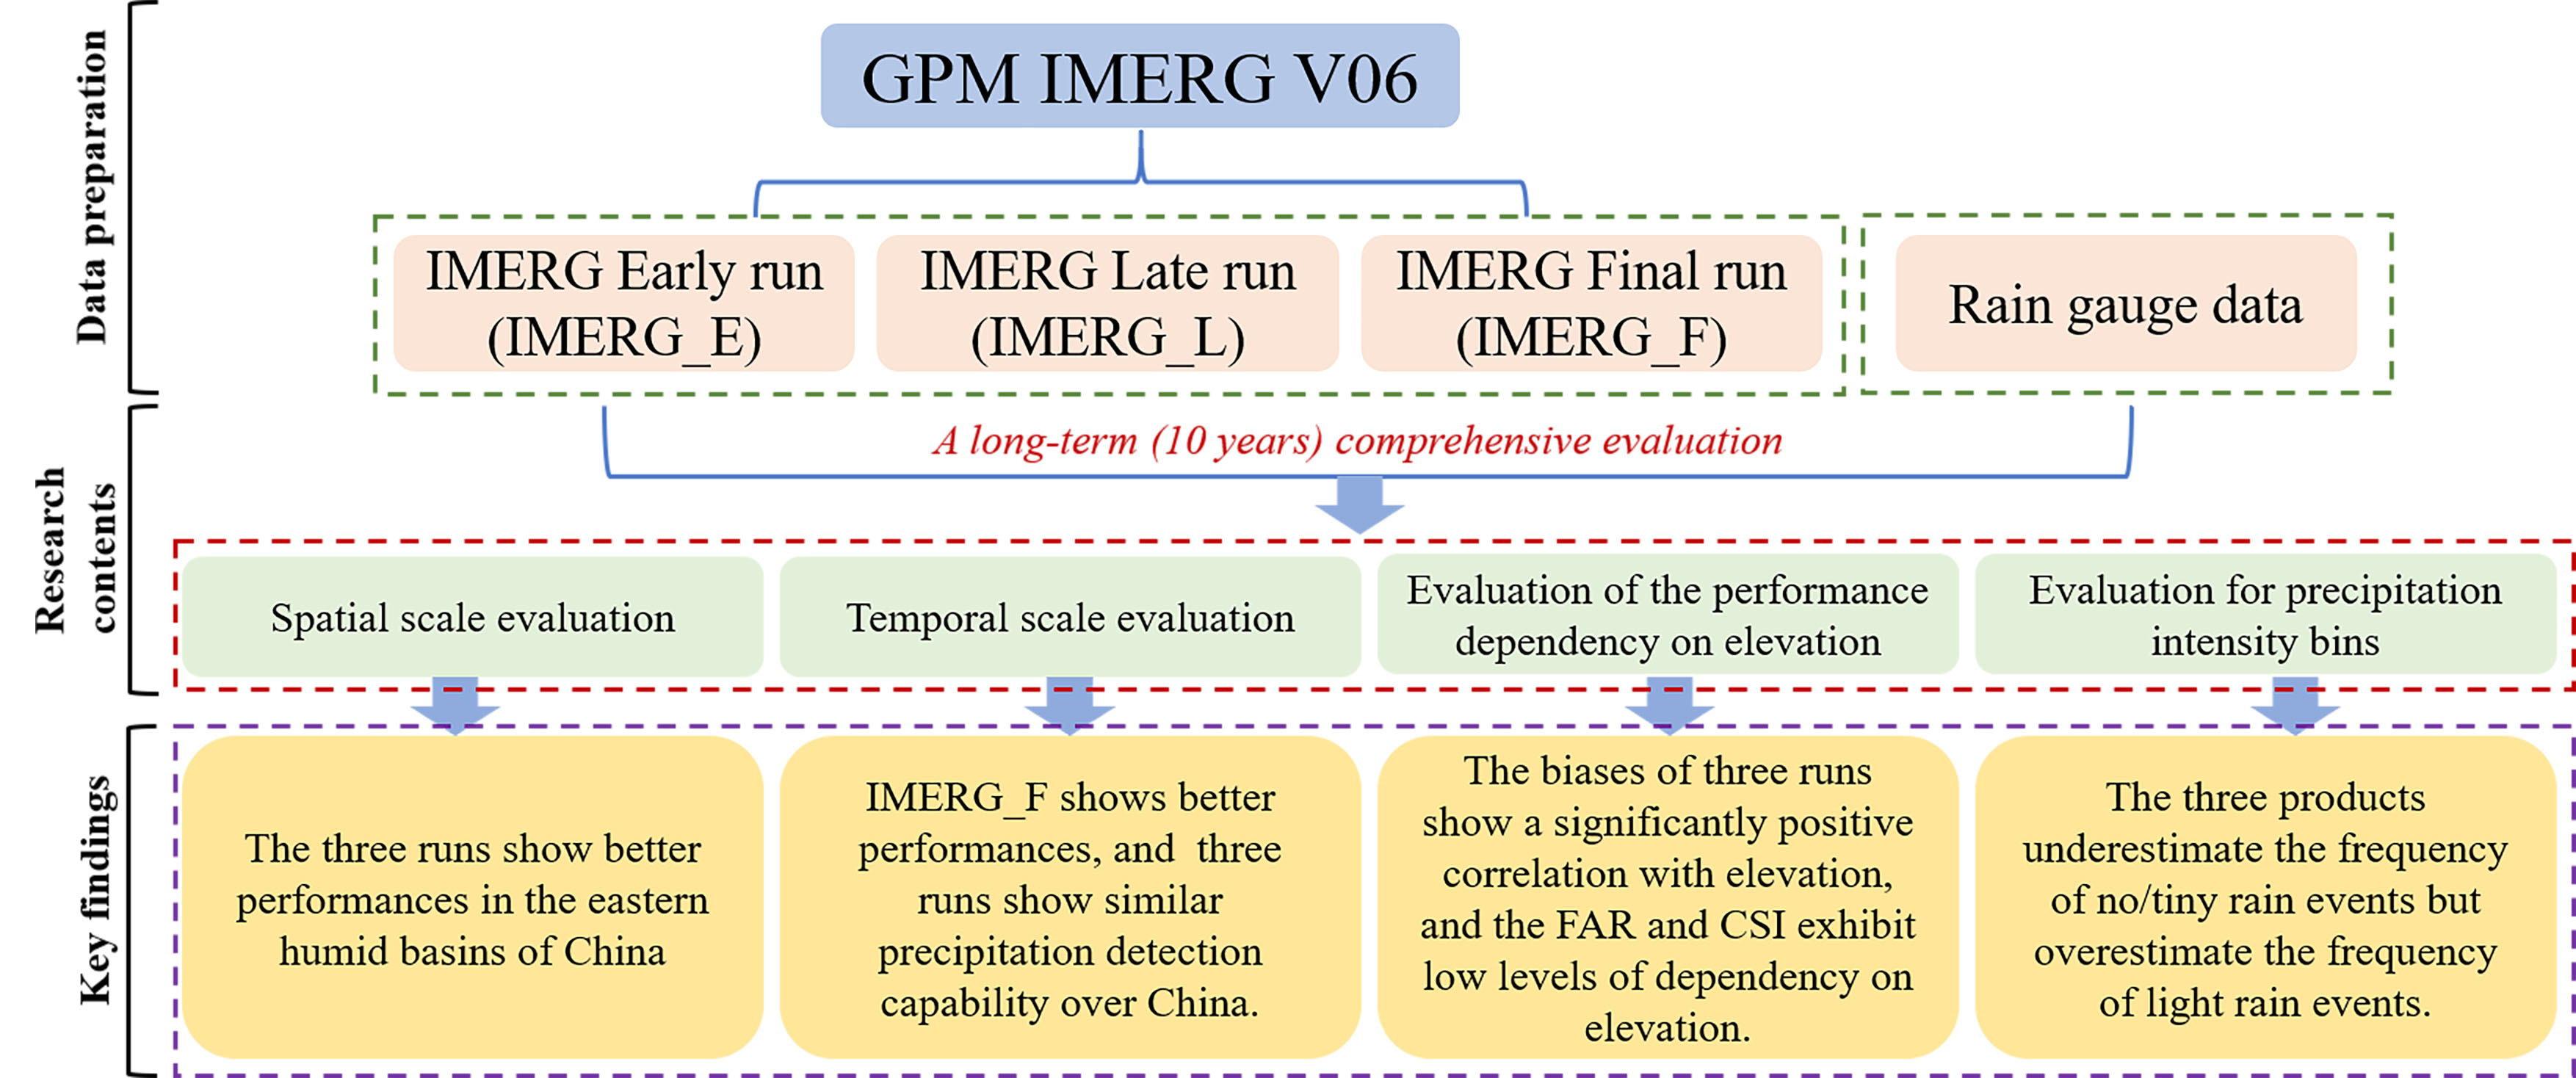
Our study area includes China, which is located within 73‒135° E and 18‒53° N [16]. Globally, the elevation patterns in China decrease from west to east (Figure 1a) [44]. Precipitation in China tends to decrease from the southeast coast to the northwest inland, with higher levels of precipitation usually occurring in summer [34]. Mainland China can be divided into nine major river basins (Figure 1b): Continental Basin (CB), Southwest Basin (SWB), Songliao River Basin (SRB), Southeast Basin (SEB), Pearl River Basin (PRB), Yellow River Basin (YERB), Yangtze River Basin (YARB), Haihe River Basin (HARB) and Huaihe River Basin (HURB) [44]. SRB and HARB have a colder climate, while HURB, PRB, SEB and the lower altitude areas of YARB have a temperate climate. YERB and the low altitude areas of CB have an arid climate. SWB and high-altitude regions of YARB and CB have polar climate. SEB, PRB and the downstream of YARB have annual mean rainfall over 1000 mm (Figure 1b). SWB exhibits complex terrains with annual mean rainfall from 150 to 1000 mm, with a decrease in the amount of precipitation from east to west (Figure 1b). The annual mean rainfall of HURB is about 600‒1300 mm (Figure 1b). For the northern basins, namely SRB, HARB, YERB and CB, annual mean rainfall is below 800 mm (Figure 1b).
2.2. Rain Gauge Data
Daily precipitation data were obtained for the period of 2008‒2017 from meteorological gauge stations maintained by the Chinese Meteorological Administration (http://data.cma.cn/ accessed on 5 August 2020). All data records have undergone a series of quality procedures, developed by Shen and Xiong [45], to ensure the high quality of the ground rain gauge data. Rain gauges with missing value are simply discarded, resulting in a final selection of 696 rain gauges over China (Figure 1b). This ground observation dataset was used as a benchmark for evaluating the three runs of IMERG V06 products (Early, Late and Final).
2.3. Satellite-Based Precipitation Dataset
GPM is a collaboration mission between the National Aeronautics Space Administration (NASA) and the Japan Aerospace Exploration Agency (JAXA). It was released in 2014 and aimed to provide globally a precipitation dataset at high spatiotemporal resolution. GPM was designed to extend the TRMM mission to produce the next generation of Earth’s precipitation estimates, which consists of approximately 10 constellation satellites and a core observatory [27,28]. The two main sensors of GPM satellites are the Dual Frequency Precipitation Radar (DPR) and GPM Microwave Imager (GMI). GMI is used to estimate precipitation type and intensity, while DPR is utilized to explore the internal structure of storms under or within clouds [27,28].
The GPM Level 3 precipitation products were generated by NASA using the IMERG algorithm. Three types of IMERG products are available in each version, namely the early (E), late (L) and final (F) runs with a latency of 4 h, 12–24 h and 3.5 months, respectively [28,29]. In general, the early and late runs of IMERG are utilized for real-time applications such as flood monitoring and irrigation regulation, whereas the final run product is mainly for scientific research. Currently, all runs of IMERG products are available with half-hourly temporal resolution and a global coverage at 0.1° spatial resolution. NASA also provides daily and monthly data products at 0.1° spatial resolution. Three major changes made in the latest version (V06) of IMERG products are as follows: (1) the data of Goddard Earth Observing System model (GEOS) Forward Processing (FP) and the Modern-Era Retrospective Reanalysis 2 (MERRA-2) are used for time interpolation instead of the infrared data in IMERG V05; (2) the Sounder for Atmospheric Profiling of Humidity (SAPHIR) estimates and TMI estimates are used for V06; and (3) passive microwave estimates are morphed at high latitudes to reduce spatial gaps [29]. In this study, we used the early (IMERG_E), late (IMERG_L) and final runs (IMERG_F) of the IMERG V06 products for the period of 1 January 2008‒31 December 2017. The IMERG products are available at https://disc.gsfc.nasa.gov/datasets?keywords=IMERG&page=1 (accessed on 3 August 2020).
3. Methodology
3.1. Data Processing
To assess the performance of latest IMERG V06 product, the grid data (IMERG data) were compared with the rain gauge data based on the point-to-point analysis due to the uncertainty associated with gauge data interpolations [2,46,47,48,49]. In this framework, the corresponding grid data of SPPs is extracted at the locations of the gauge stations.
3.2. Evaluation Metrics
Continuous metrics were used to evaluate the accuracy of the IMERG products. Pearson correlation coefficient (CC) was used to measure the correlation between rain gauge and satellite dataset, while root mean square error (RMSE) was computed to evaluate the error characteristics of satellite datasets. We also used the Kling–Gupta efficiency (KGE) statistic [50,51] to comprehensively explore the accuracy of IMERG products, considering the distance between the mean and variance of gauge-based and satellite-based time series of precipitation as well as their correlation. KGE balances the contributions of correlation, bias and variability term. The corresponding equations are as follows:
where n represents the number of samples, represents satellite precipitation estimate and represents gauge observed precipitation. and are the mean of satellite- and gauge-based precipitation. The variation of precipitation is given by and , which represent the standard deviation of gauge precipitation and satellite precipitation, respectively. The CC (Equation (1)) possible values range between −1 and 1. The RMSE is computed as the average of the square of the differences between and (Equation (2)) and is non-negative by construction, with smaller values indicating a better performance. The estimation of KGE (Equation (3)) includes three terms: β is the bias ratio (), which represents the ratio between the mean satellite precipitation () and the mean gauge (). The variability ratio () is the ratio between the coefficient of variation associated with satellite precipitations and gauge data , with and, similarly, . KGE values range in the interval (, 1] and larger values indicate better performance.
Categorical metrics were utilized to assess the precipitation detection capability of IMERG products. The critical success index (CSI) describes the ability of IMERG products to detect precipitation event, with values between 0 and 1 (the perfect value). It is expressed as a function of probability of detection (POD) ranging from 0 to 1 (the perfect score) and false alarm ratio (FAR) ranging from 0 (the perfect value) to 1, which are calculated as:
where H is the precipitation event detected by both gauge and satellite simultaneously, M is the precipitation event detected by the gauge but not detected by the satellite and F is inverse with M. The calculation of CSI requires a threshold to determine rain/no-rain events. The rain gauges and SPPs have a daily time resolution in this study. We selected 0.1 mm/day as the threshold for defining the precipitation occurrence according to the definition adopted by the Chinese Meteorological Administration.
3.3. Categorizing Elevation, Precipitation Intensity and Season
To evaluate the influence of elevation on the performance of the SPPs, we grouped all studied stations into six elevation categories (<200, 200–500, 500–1000, 1000–1500, 1500–2000 and >2000 m). Moreover, we classified daily precipitation (P) intensity into five categories based on China’s national standard on the intensity of precipitation: no/tiny rain (P < 0.1 mm/day), light rain (0.1 ≤ P < 10 mm/day), moderate rain (10 ≤ P < 25 mm/day), heavy rain (25 ≤ P < 50 mm/day) and rainstorm (P ≥ 50 mm/day). The mean daily precipitation was calculated for winter (December–February), spring (March–May), summer (June–August) and autumn (September–November) for seasonal-scale analysis.
4. Results
4.1. Spatial Patterns of the Continuous and Categorical Evaluation
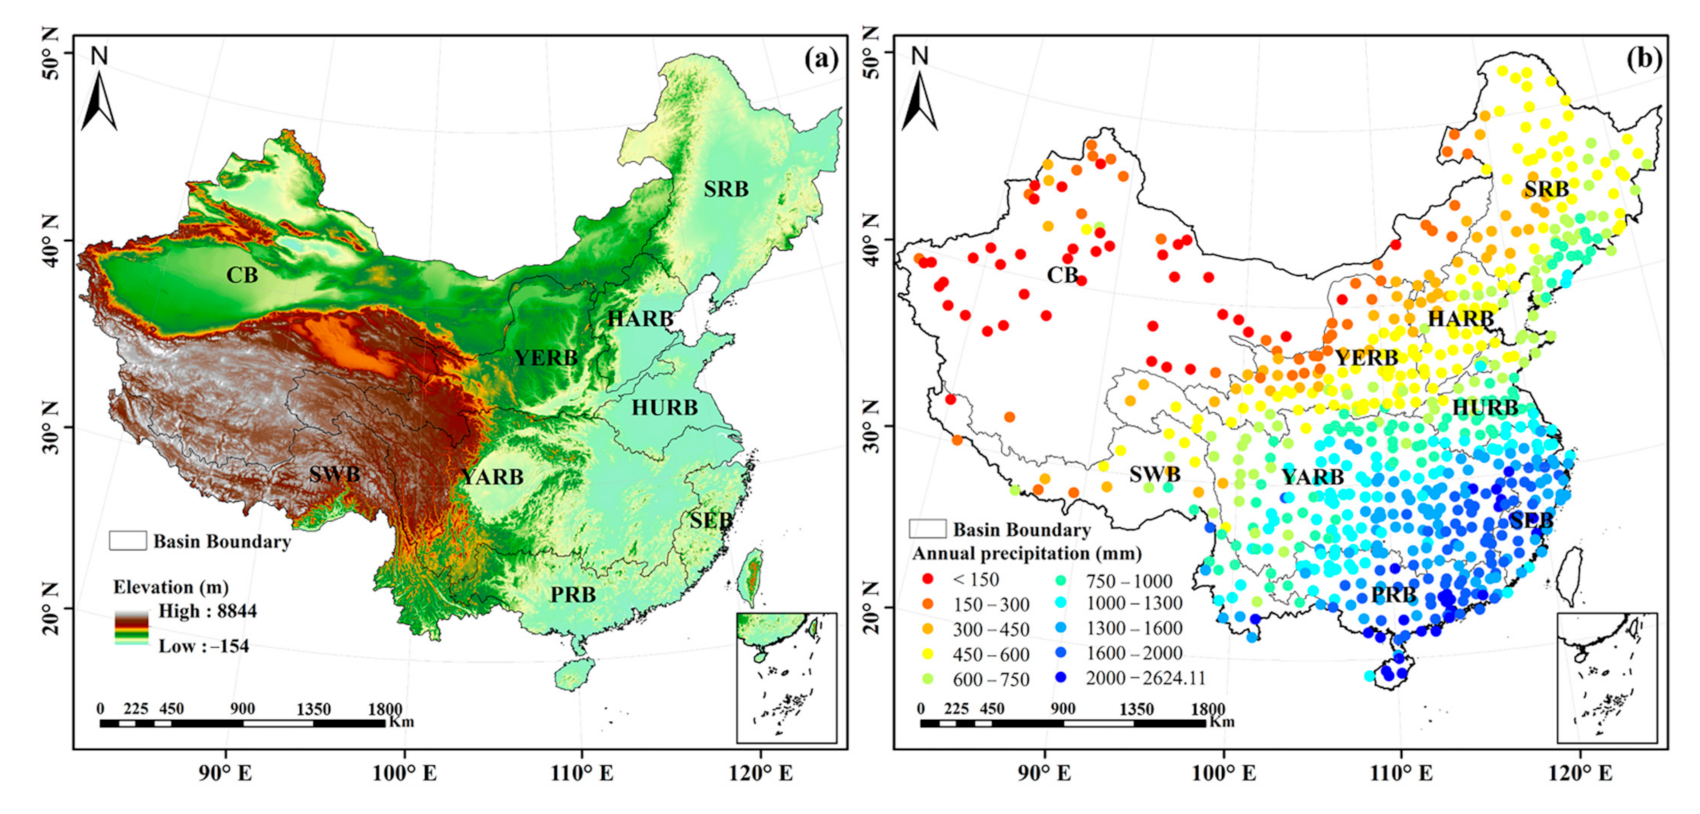
The spatial distribution of the continuous and categorical evaluation metrics for the three runs of IMERG products over China are shown in Figure 2 and Figure 3, respectively. For the three runs, CC and RMSE metrics show distinct spatial pattern across China, which can be seen in Figure 2a–c,m–o, respectively. The CC between the observed gauge data and satellite data ranges from 0.4 to 0.7 in southeast coastal areas, with RMSE values over 13 mm/day. According to the RMSE, IMERG_F performs better than IMERG_E and IMERG_L in southern China (PRB). Moreover, CC and RMSE decrease gradually towards the northwest inland of China. Southeast regions of China belong to sub-tropical monsoon climate zone with large amount of precipitation over the year, thus showing a high correlation and high error. The spatial pattern of β, which ranges from 0.6 to 0.8, suggests that both IMERG_E and IMERG_L underestimate the values of rain gauge rainfall in the southwest of China (SWB) (Figure 2d,e). In contrast, the IMERG_F appears to perform better in this region. The differences in the estimation of the variability ratio (γ) and KGE between the IMERG products across China are not significant. The three runs of IMERG products show a better performance in the southern and southeastern parts of China (PRB and SEB), with KGE value over 0.5. In addition, IMERG_F shows the highest performance in the HARB region (Figure 2l).
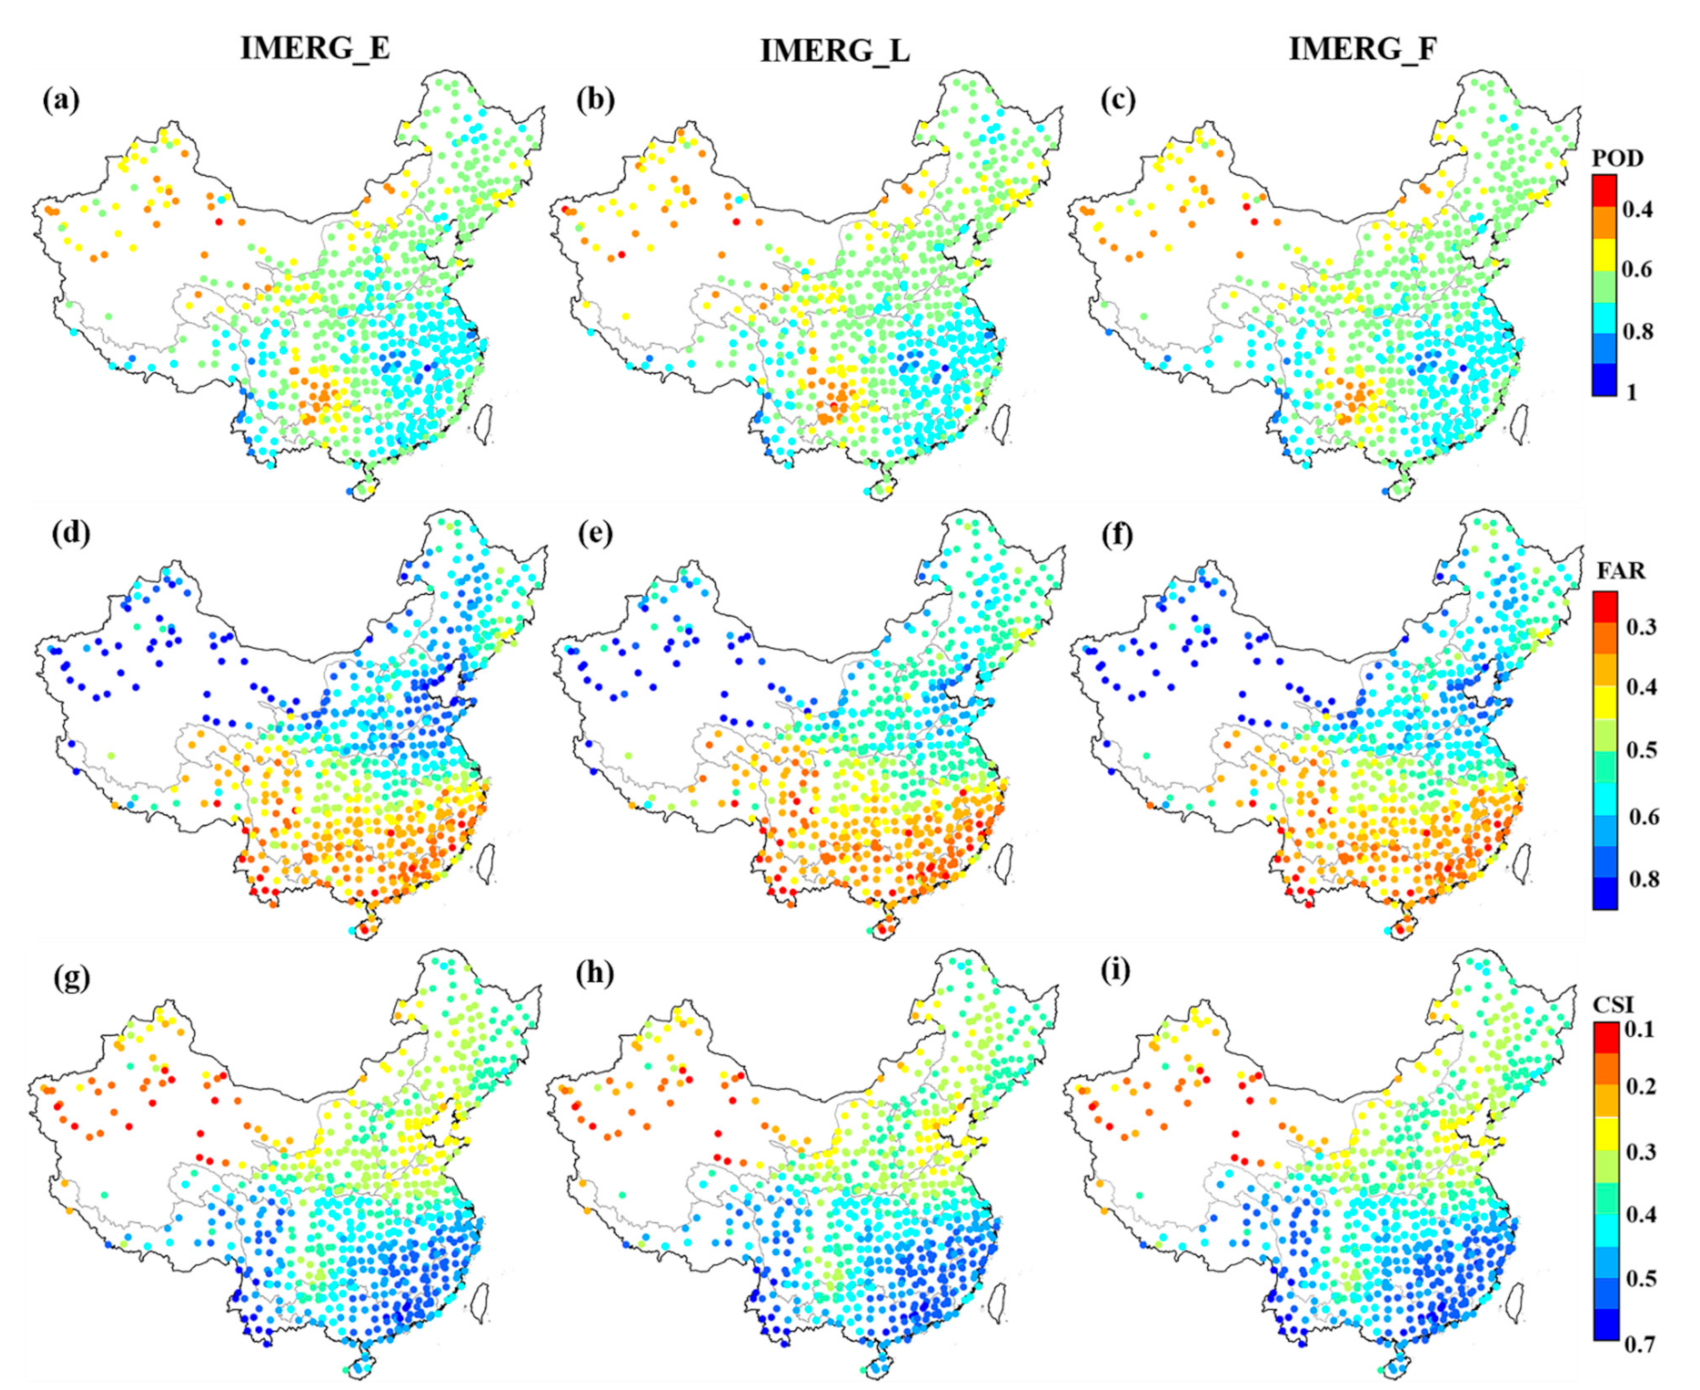
Figure 3 shows the spatial distribution of the categorical evaluation metrics (POD, FAR and CSI) across China. For the three SPPs, the estimation of the precipitation is more accurate in PRB, SEB and SWB, with POD values over 0.7 (Figure 3a–c). In CB, however, all runs have POD less than 0.5, indicating that less than half of rain events can be detected by satellite-based observations. Regarding the FAR analysis, higher accuracy is observed from the late and final runs, especially in the HARB and SRB, when compared with the early run (Figure 3d–f). The CSI shows good performance in the southeast direction, compared with the northwest (Figure 3g–i).
The evaluation results of continuous and categorical metrics of each basin are listed in Table 1. The CC and KGE estimations are higher in YARB, PRB, SEB and SWB for all runs (Table 1). The RMSE values of three SPPs are the lowest in YERB except in CB. The highest values of POD (0.72–0.75) and lowest values of FAR (0.35) are in SWB and PRB, respectively. A better precipitation detection performance of three runs is found for PRB, SEB and SWB, with CSI value ranging 0.48–0.51 (Table 1).
4.2. Temporal Scale Evaluation
4.2.1. Daily Scale
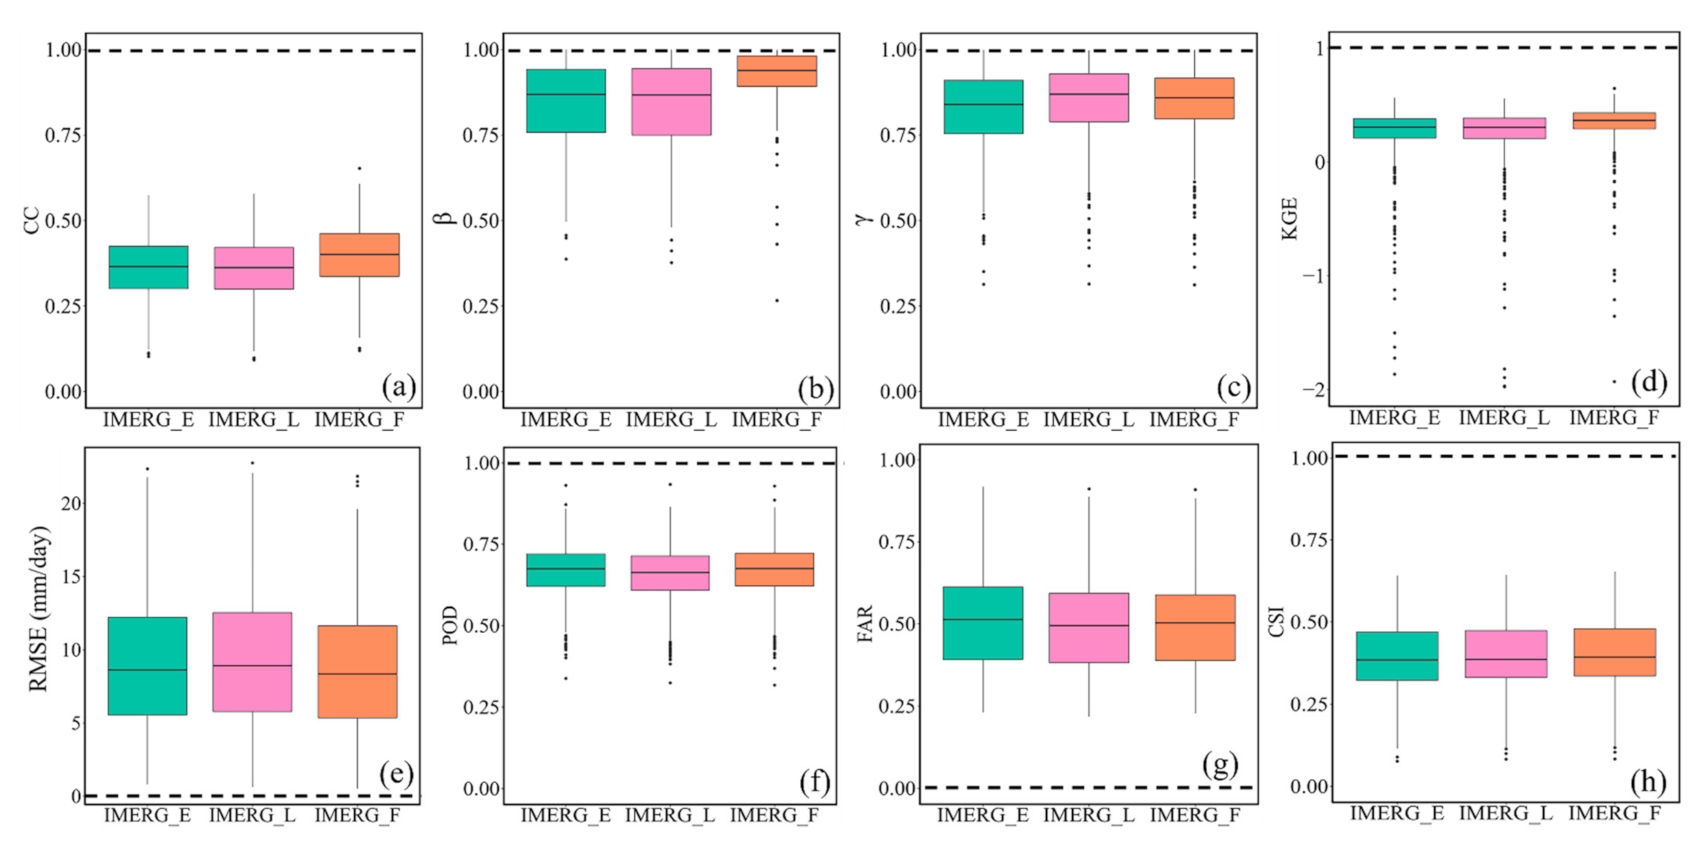
The performances of IMERG_E, IMERG_L and IMERG_F were evaluated on a daily basis, and the evaluation metrics are summarized in Table 2. Overall, the performance of IMERG_F is better than the IMERG_E and IMERG_L, with higher mean CC (0.47) and KGE (0.45) values and lower mean RMSE (9.26 mm/day) (Table 2). Regarding the accuracy in the estimation of precipitation, the three runs of IMERG products show similar patterns across China, with POD value ranging from 0.67 to 0.68. The FAR values of three SPPs are, however, up to 0.5 across China, indicating poor detection performance of the IMERG products. All SPPs overestimate the mean precipitation across China, with β value ranging from 1.07 to 1.08. As shown in Figure 4, the median KGE of IMERG_E, IMERG_L and IMERG_F are 0.31, 0.30 and 0.37, respectively. The improvement is minor for CSI in comparison to KGE, indicating that gauge adjustment is more effective for improving intensity estimation than occurrence detection.
4.2.2. Monthly Scale
At monthly level, IMERG_F exhibits better correlations (0.94) with ground observations than IMERG_E and IMERG_L (Table 3). IMERG_E and IMERG_L show similar accuracy at monthly level. Compared to the other two runs, IMERG_F has the lowest RMSE value (34.31 mm/month). Overall, the final run shows higher accuracy in China, with KGE value up to 0.87 (Table 3).
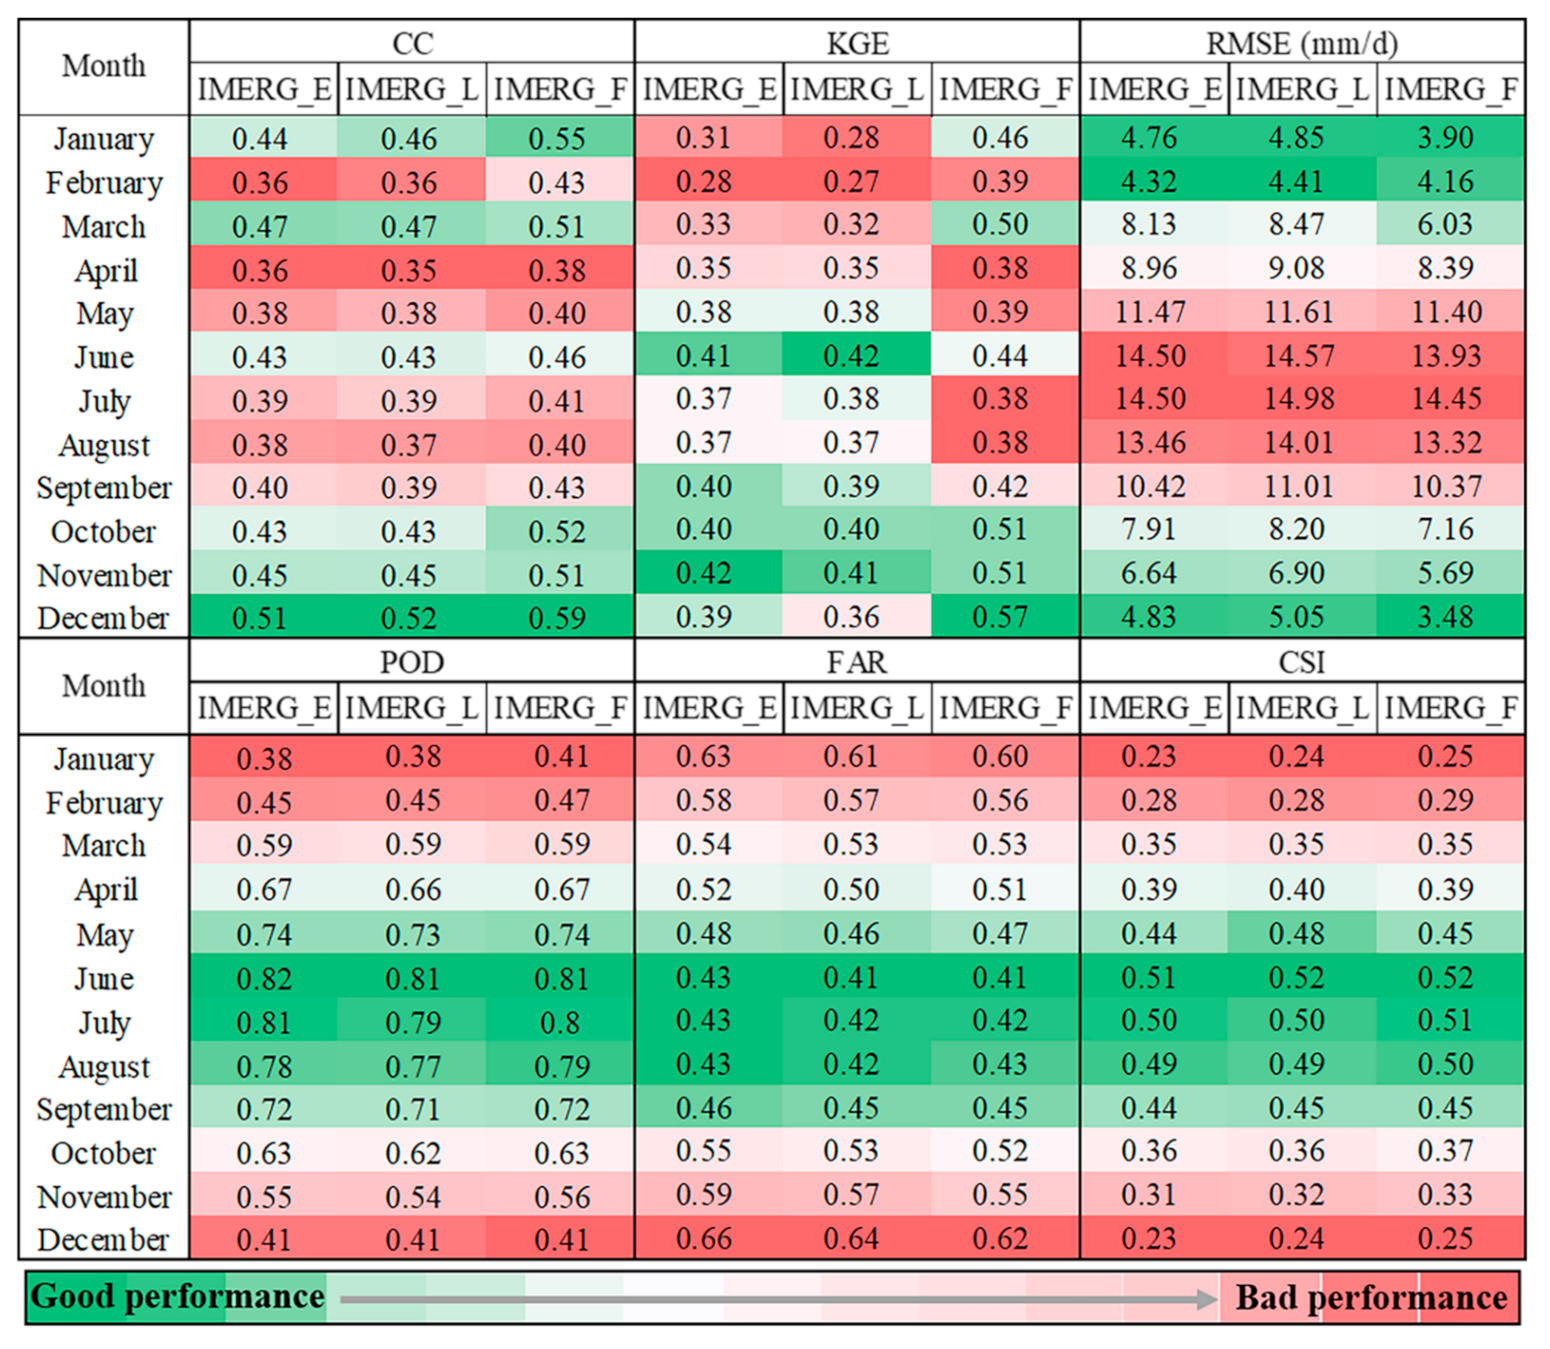
Figure 5 shows the metric characteristics of IMERG products in different months, sorted from “good performance” (green) to “bad performance” (red). As indicated by Figure 5, CC is high from October to December but low from July to September for all runs. This is consistent with the timing of high and low frequency of precipitation in the study area. RMSE is high from May to September, which is related to the intense precipitation that affect various regions in China during these months. At a monthly level, IMERG_F consistently shows better performance than the other products in all months, with the highest KGE in autumn. For the categorical metrics of POD, FAR and CSI, July represents the month where their performance is at the highest level. The beginning of the year shows the lowest POD, while FAR reaches the highest performance level at the end of the year. As for the CSIs, the IMERG products show the best performance between June and August. The results suggest that the overall performances of IMERG_F, IMERG_E and IMERG_L are not statistically significantly different at a monthly level.
4.2.3. Seasonal Scale
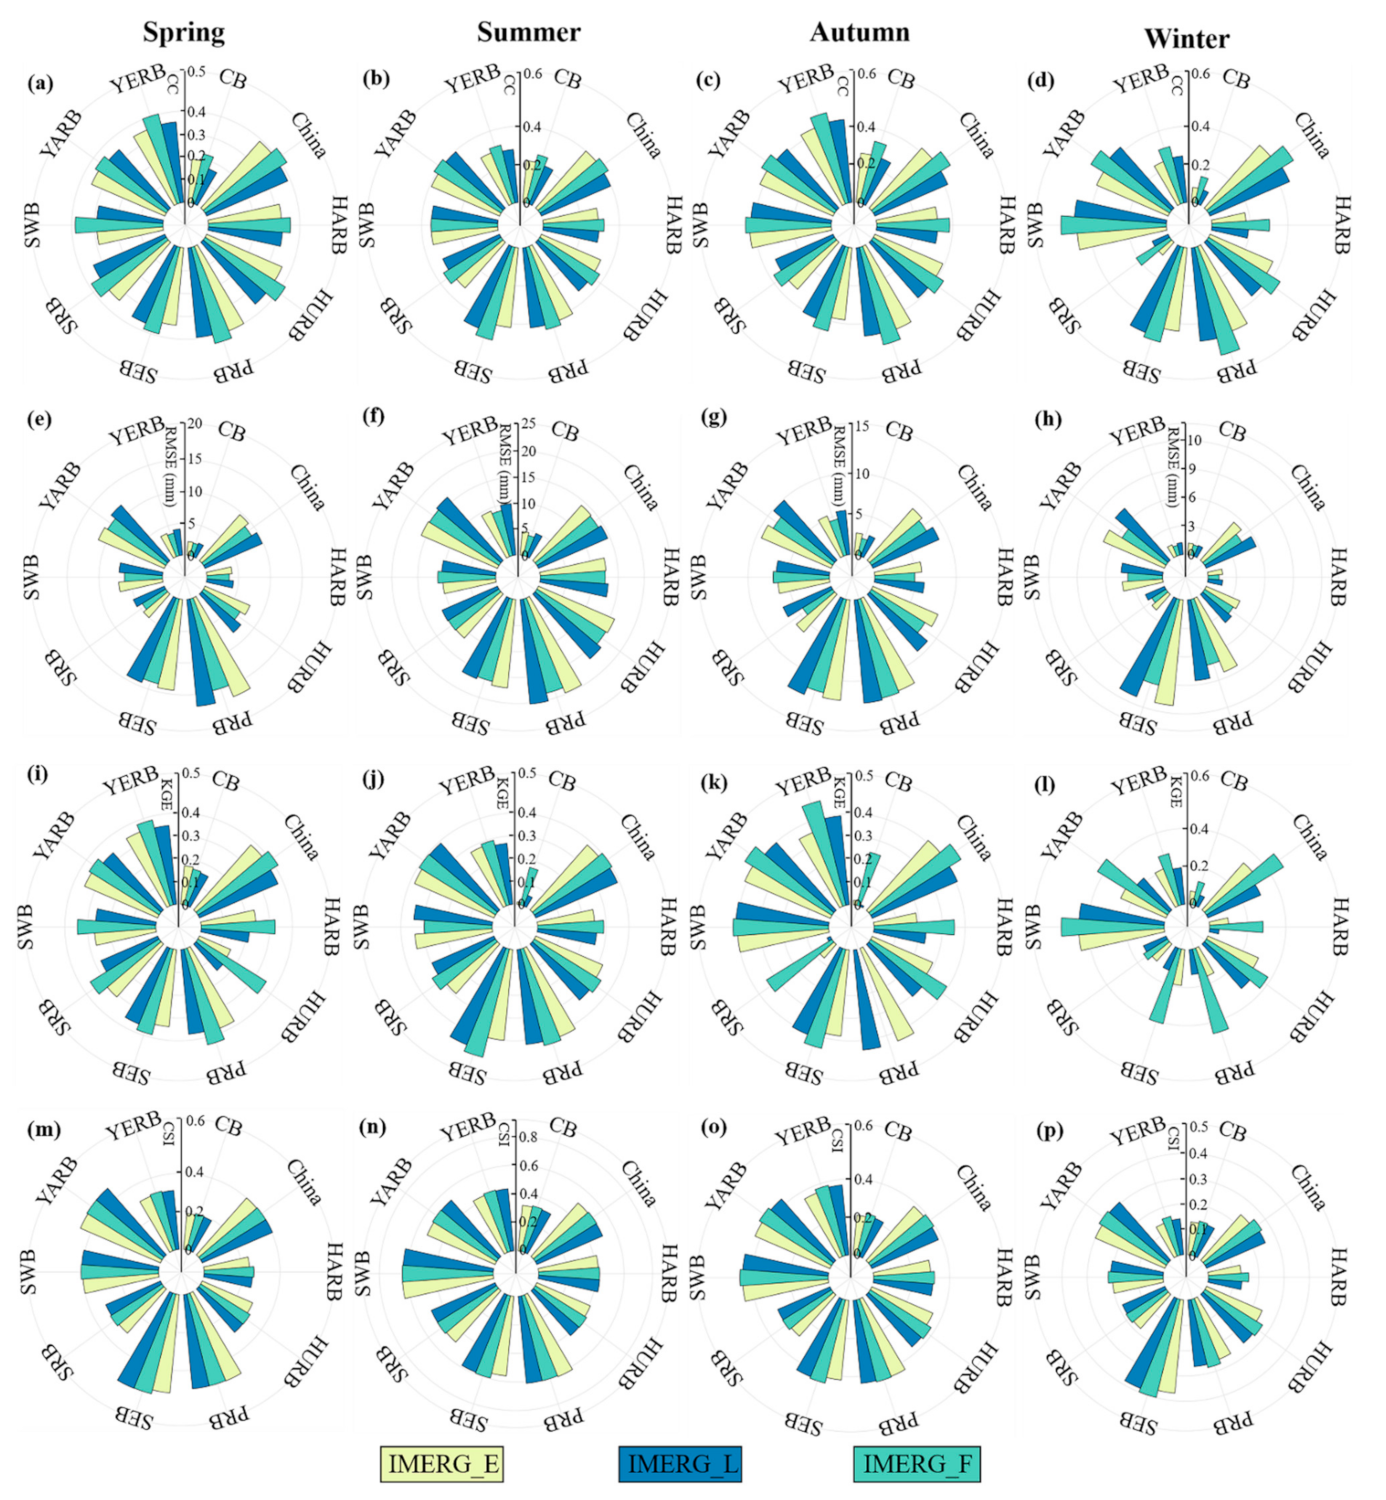
As a complementary work, we assessed the seasonal performances of the three IMERG products at a daily level in each basin and across Mainland China (Figure 6). For each basin, there are great discrepancies in the annual rainfall regime over different basins of China (Figure S1). Based on the rain gauge observations during 2008–2017, the SEB has greatest annual mean rainfall of 1742.77 mm, followed by PRB (1638.60/year), YARB (1200.84 mm/year), HURB (831.23 mm/year), SWB (811.23 mm/year), SRB (576.64 mm/year), HARB (530.30 mm/year), YERB (475.49 mm/year) and CB (165.82 mm/year) (Figure S2). With respect to accuracy performance, the precipitation from IMERG_F is moderately correlated with gauges observations in all seasons and basins, with CC values ranging from 0.14 to 0.58 (Figure 6a–d and Figure S2). Three runs show poor correlation (CC value of 0.08–0.33) with rain gauge observations for all seasons in arid regions (CB). Basically, IMERG_F has lower RMSE value than IMERG_E and IMERG_L in each basin and season (Figure 6e–h). For KGE, IMERG_F performs better in all seasons and over each basin compared to IMERG_E and IMERG_L (Figure 6i–l). For accuracy differences in nine basins, overall, three runs have better performance in humid regions (including SEB, PRB and YARB) with higher KEG values (Figure 6a–l). In regard to detection capability, the performance of the IMERG_F compared to IMERG_E and IMERG_L does not improve significantly in all seasons (Figure 6m–p). Particularly, the higher values of CSI occur in summer for all runs of IMERG, ranging from 0.32 to 0.64 (Figure S3).
4.3. Evaluations of the Performance Dependency on Elevation
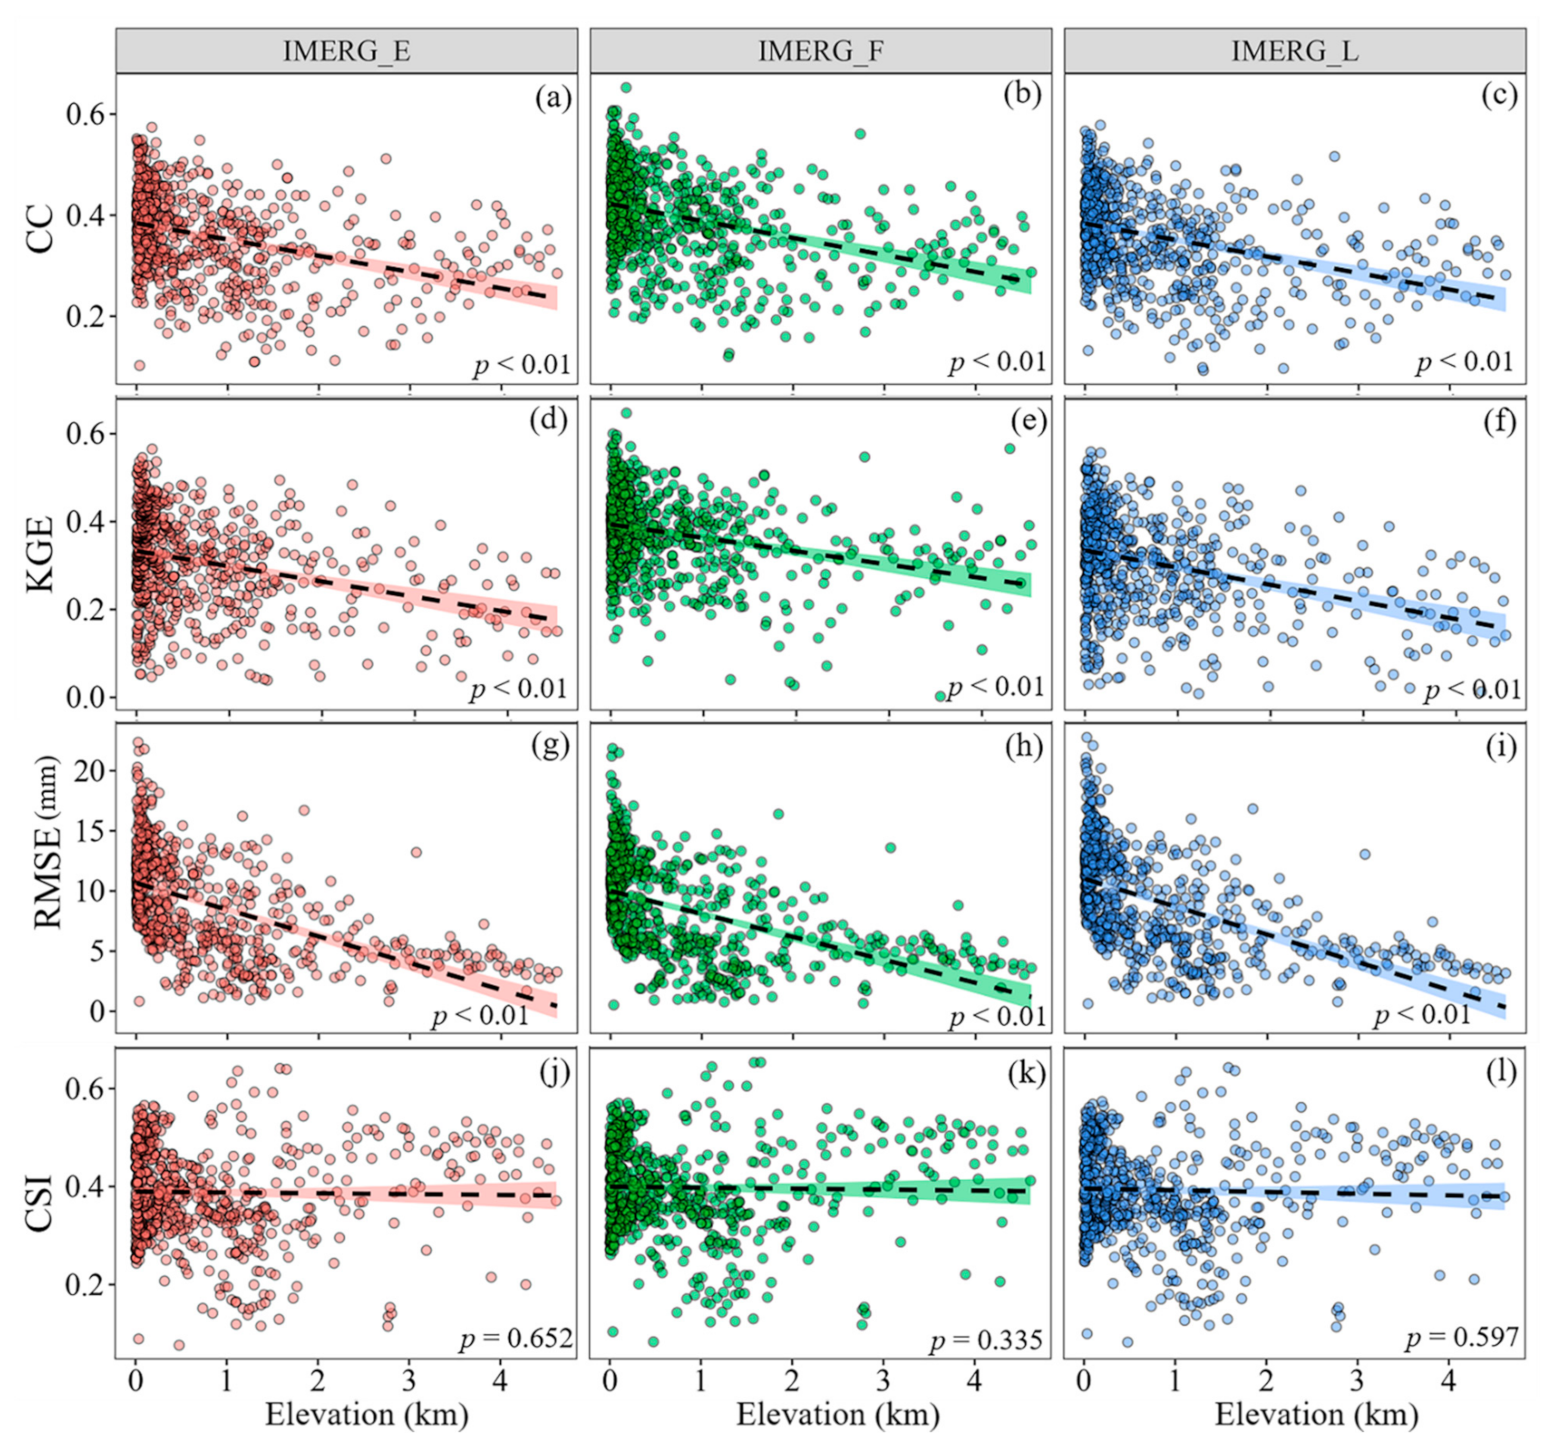
To explore the influence of elevation variations on the performance of IMERG products, we divided all rain gauges into different categories based on the elevation associated with each gauge. As shown in Table 4, the amount of precipitation is higher in low altitude regions (<500 m), with averages over 943.5 mm/year. In addition, the three SPPs exhibit the highest consistency in regions below 200 m, with CC values ranging from 0.43 to 0.47. The three runs of IMERG do not show much discrepancy in β values among these elevation categories, except for regions below 200 m and those over 2000 m. All SPPs have a positive bias in regions below 1500 m, with β value from 1.01 to 1.14 (Table 4). The γ values of the three SPPs generally increase with elevation, indicating a substantial underestimation of precipitation variability in regions of low altitude. In all elevation categories, IMERG_F shows better performance (lower RMSE and higher KGE values ranging from 0.34 to 0.45) than IMERG_E and IMERG_L (Table 4). The highest POD values are observed in regions with elevations below 200 m, while the lowest FAR and highest values CSI are estimated in regions above 2000 m.
The scatterplots of CC, KGE, RMSE and CSI metrics against elevation are presented in Figure 7. The three SPPs show a significantly (p < 0.01) decreasing tendency of CC with elevation variations based on liner regression (Figure 7a–c). Similarly, the KGE and RMSE values of three runs tend to decrease significantly (p < 0.01) with elevation (Figure 7d–f and Figure 7g–i, respectively). There is no significant (p > 0.05) dependency of CSI on elevation (Figure 7j‒l), although POD values significantly (p < 0.05) decreased with variation of altitude (Figure S3g–i). Notably, the slope of trend line for detection evaluation metrics (POD, FAR and CSI) are larger for IMERG_F, indicating an improvement of the IMERG_F product in the capability of detection over high-altitude regions (Figure 7j–l and Figure S3g–l).
4.4. Evaluation for Precipitation Intensity Bins
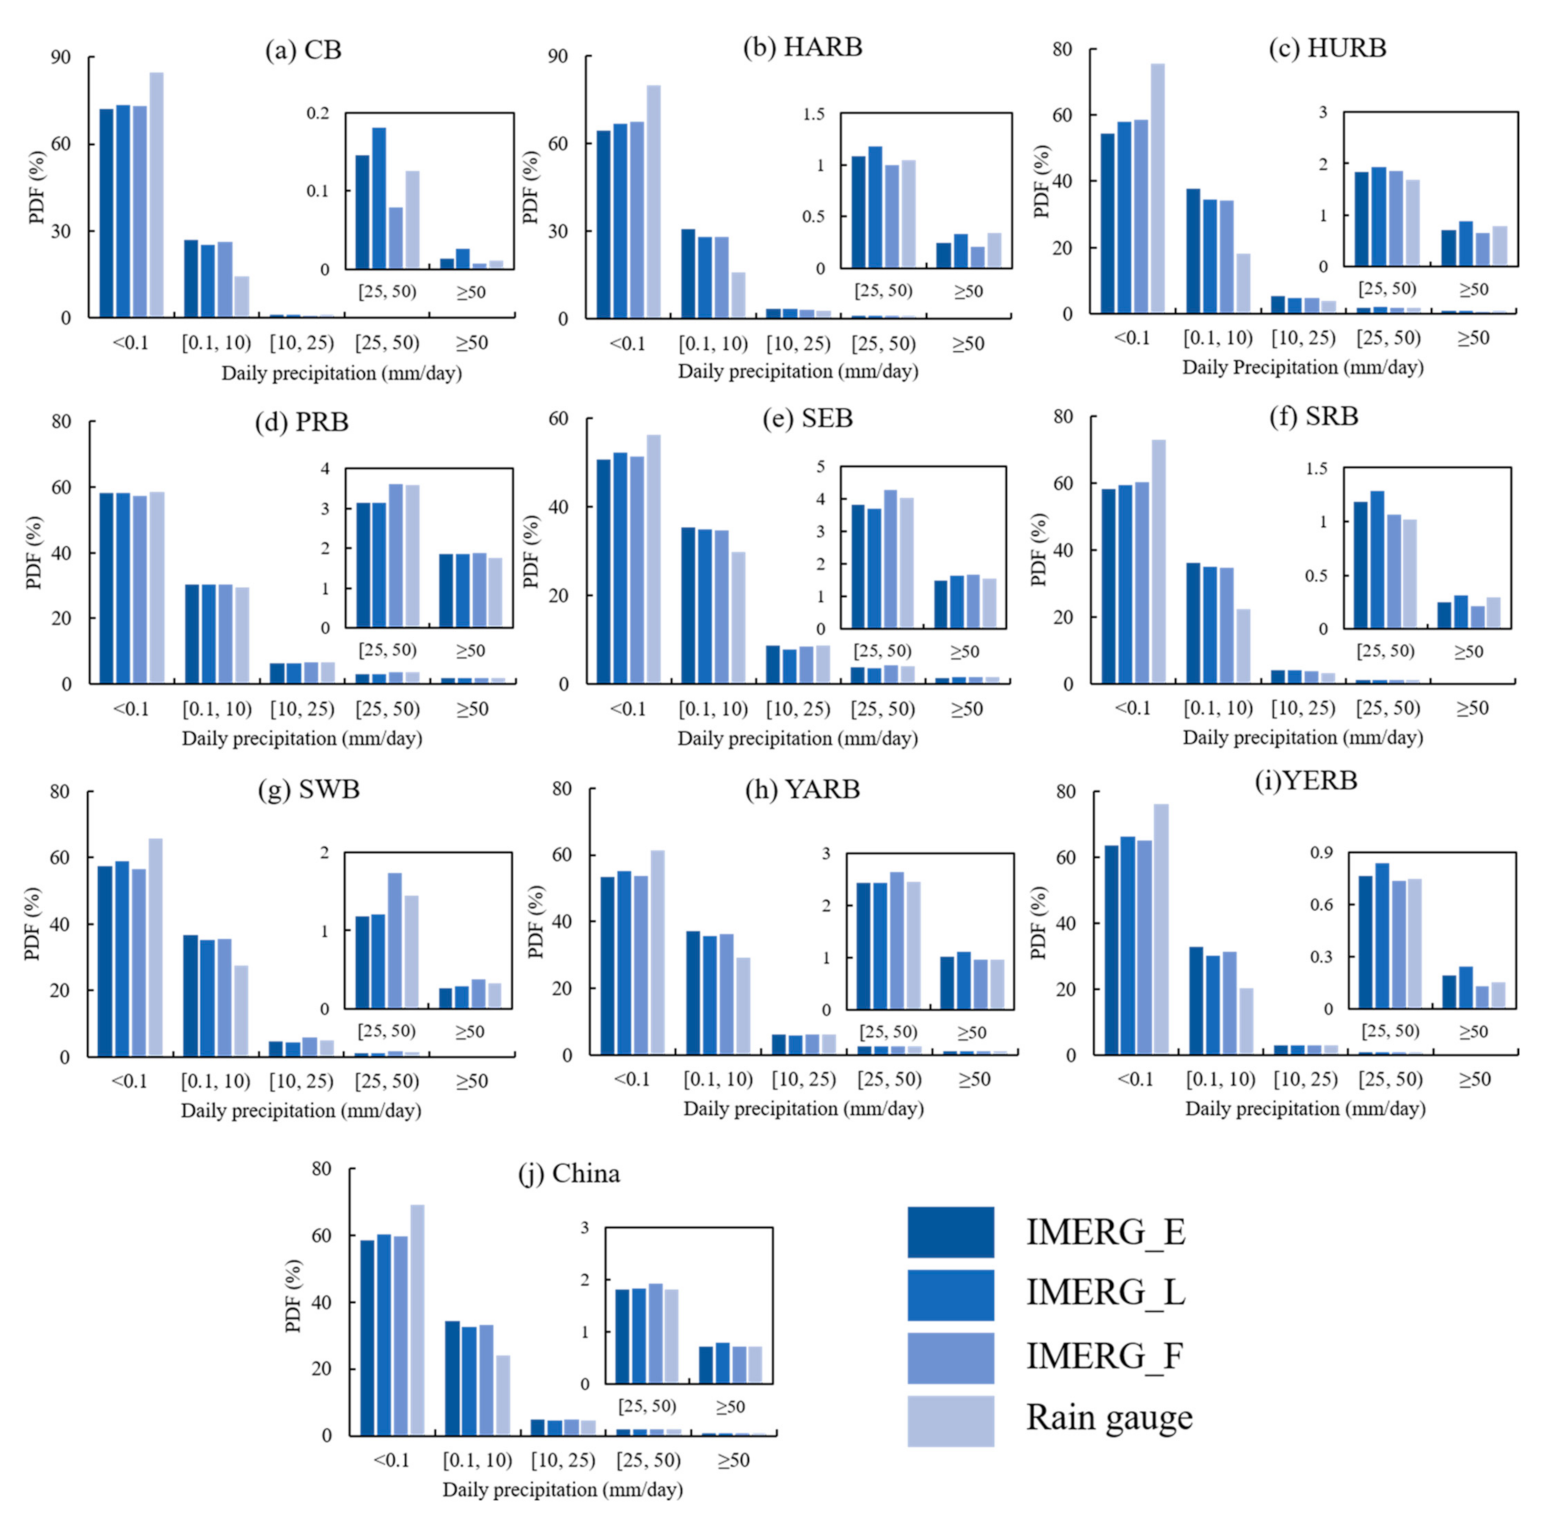
Figure 8 shows the probability distribution function (PDF) of daily precipitation for five precipitation intensity bins across China (Figure 8j) and in nine basins (Figure 8a–i). It is evident that the PDF of days with precipitation intensity below 0.1 mm/day for three SPPs is less than the observed one in China and each basin, whereas the opposite is found for light rain (0.1 ≤ P < 10 mm/day). The precipitation values from the IMERG estimations are closer to ground observations for the PDF of moderate rain (10 ≤ P < 25 mm/day) in all regions (China and each basin), especially for PRB. IMERG_F tends to overestimate the frequency of heavy rain (10 ≤ P < 25 mm/day) in the southern regions of China (PRB, SEB, YARB and SWB). The IMERG products have the highest levels of consistency with ground observations in the context of rainstorm (P ≥ 50 mm/day) in the PRB, YARB and SEB regions.
The evaluation metrics for different precipitation intensity classes are presented in Table 5 (China) and Figure 9 (nine basins). Table 5 does not provide FAR and CSI because, if all days in the observed dataset are rainy (P ≥ 0.1 mm/day), the value of FAR is equal to zero and CSI is equal to POD. In addition, POD is calculated based on different precipitation intensity thresholds instead of a fixed threshold of 0.1 mm/day. Generally, the performance associated with CC, RMSE and KGE tend to decrease when data are split into classes. This suggests that overestimation and underestimation may partially cancel out to when the data are analyzed as a whole. Thus, larger uncertainties are expected when the assessment of SPPs dataset is conducted at the event level. The values of CC and KGE tend to increase in regions that encounter precipitation amount larger than 50 mm/day.
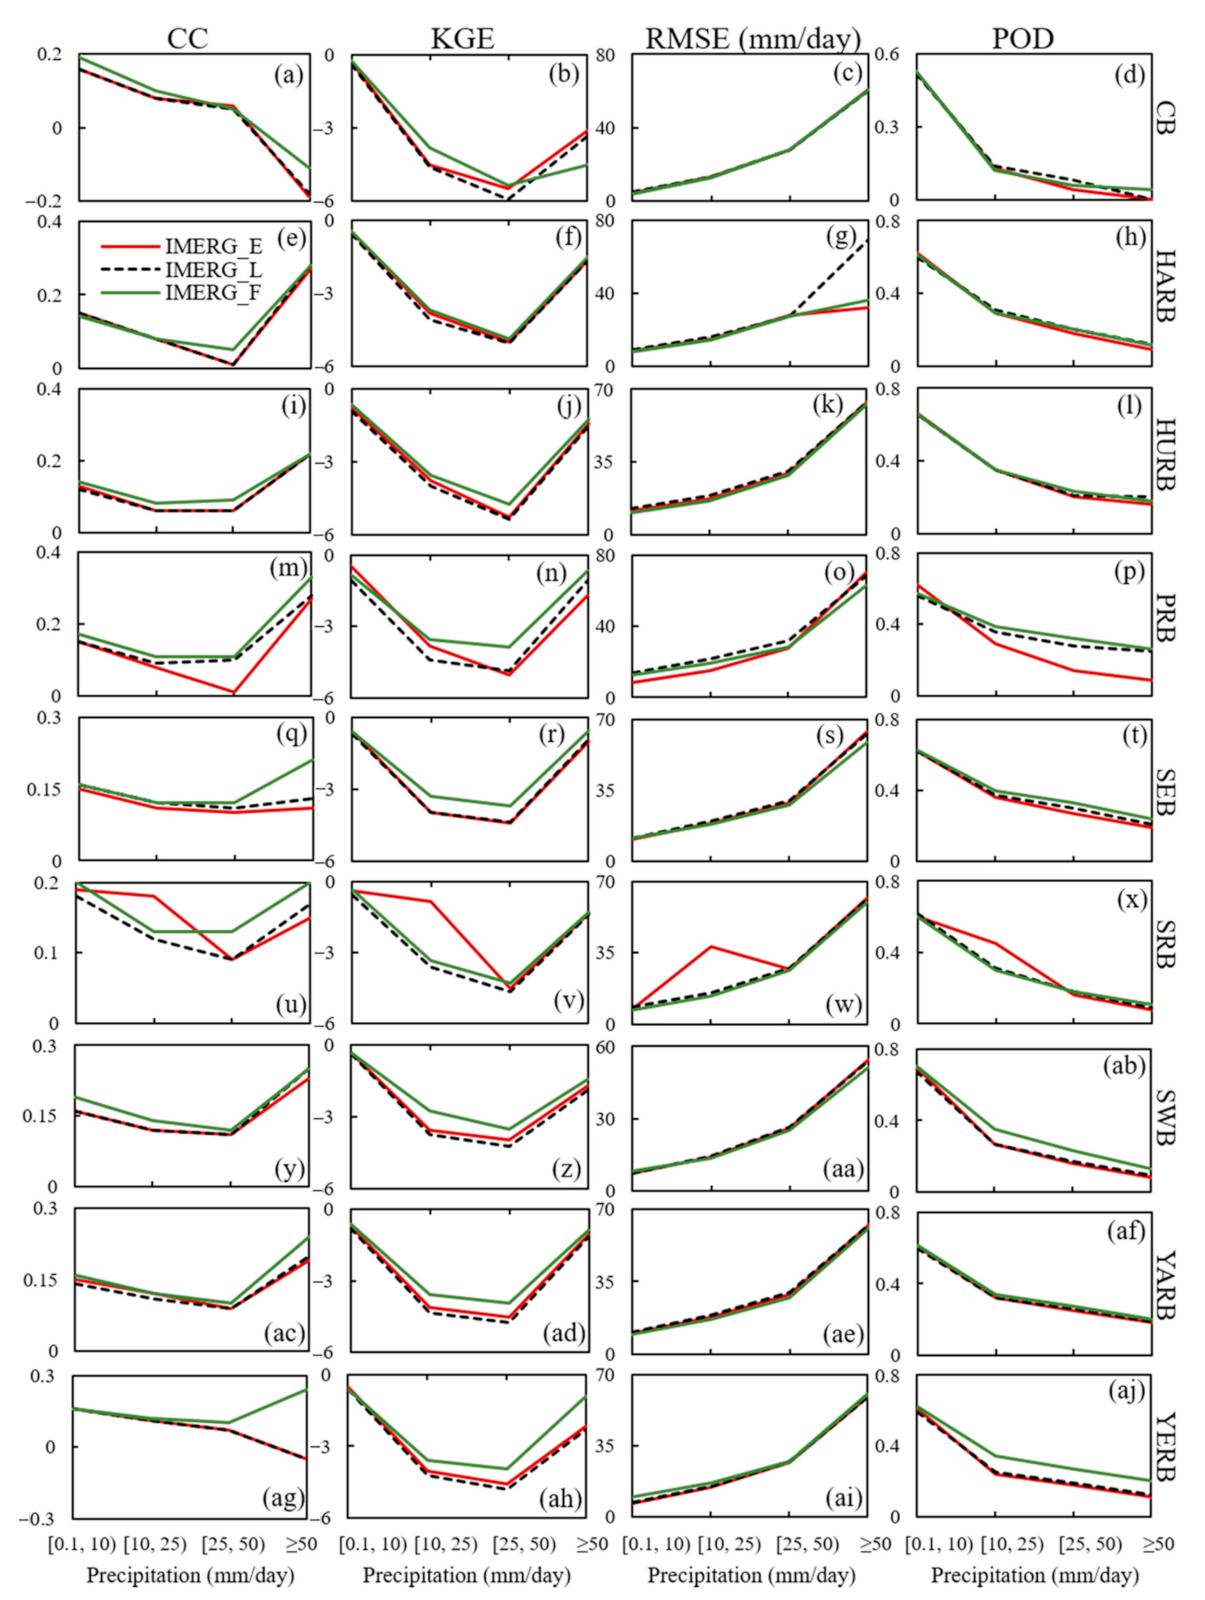
Figure 9 shows the accuracy performances of three SPPs for different precipitation intensity ranges over the nine basins of China. Generally, the three SPPs exhibit a poor correlation with rain gauge data for heavy rain (10 ≤ P < 25 mm/day) in all basins except for CB and YERB (Figure 9b,e,i,m,q,u,y,ac). Additionally, the highest CC between IMERG data and rain gauge data are found in the rainstorm (P ≥ 50 mm/day) over HARB, HURB, PRB, SWB and YARB (Figure 9e,i,m,y,ac, respectively). As indicated by KGE, the three runs consistently have better performance in detecting light rain (0.1 ≤ P < 10 mm/day) and rainstorm across China except for IMERG_E over SRB (Column 2 of Figure 9). Meanwhile, IMERG_F shows better performance for all basins except for SRB compared to IMERG_E and IMERG_L (Column 2 of Figure 9). The RMSE values of three SPPs are positively associated with precipitation intensity (Column 3 of Figure 9), and the final run shows little improvement in comparison to the early and late runs for these precipitation intensity bins over each basin. In particular, the IMERG_F has better performance in SWB and YERB compared to IMERG_E and IMERG_L. For the precipitation detection performance, the POD values of three runs are negatively correlated with precipitation intensity, indicating the IMERG V06 has less skills in detecting high intensity precipitation (Column 4 of Figure 9).
5. Discussion
5.1. Reasons for the Difference in Performance of Three Runs
This work demonstrates that non-significant improvement in late runs compared with their early runs (Table 1). The same results were found in the northeast and southeast of Austria [42,52]. In addition, compared to the early and late runs, the final run of the IMERG products shows a moderate improvement in the overall estimation of precipitation across China (Table 2 and Table 3), probably due to the adjustment against the Global Precipitation Climatology Centre (GPCC) records [43,53]. Figure S4 shows the spatial distribution of rain gauges used for GPCC at its 2.5° spatial resolutions across China. It is evident that limited gauges over China are used in the development of GPCC products. The spatial heterogeneity of GPCC data quality may lead to the diverse performances of the final run of IMERG. For example, Tan and Santo [35] reported a non-significant improvement in the IMERG final run compared to NRT products over Malaysia, which may be due to the fact that only 24 rain gauges are utilized in the development of GPCC dataset and thus cannot well characterize the spatial patterns of precipitation across Malaysia.
In this study, we found an overestimation of precipitation in the IMERG products over China (see Table 2 and Table 3) at both the daily and monthly scales. Xu et al. [46], Anjum et al. [32], Sunilkumar et al. [54] and Islam [55] reported similar results about different version of IMERG products over southern Tibetan Plateau, northern Pakistan, Japan and Nepal and Bangladesh, respectively. According to the results, overestimation is larger for the early and late runs compared to the final runs. There are several possible reasons for these discrepancies: First, the GPCC datasets which are utilized to adjust the final runs of IMERG product have systematic biases in China [56], which may affect the accuracy of the IMERG products. Second, monthly GPCC datasets are used to adjust the IMERG data, and thus improvements of daily precipitation datasets are worse than those of monthly datasets [42]. Third, additional uncertainty can be attributed to the adjustment of spatial resolutions. The IMERG products and GPCC Full Data Reanalysis offer data at 0.1° spatial resolution while the GPCC Monitoring Product offers data at 0.5° spatial resolution [29].
5.2. Reasons for Various Performance of Three Runs in Different Elevation Regions and Precipitation Intensity Bins
Our evaluations reveal a strong dependence of the performance of IMERG products on elevation variations, particularly accentuated with the categorical metrics (POD, FAR and CSI). According to Figure 7, there is a significant relationship between the values of evaluation metrics and elevation (p < 0.01) for CC, KGE, γ, POD and RMSE. The number of rain gauges varies with elevation, which might bias the results. Topographic variations could exert complex controls on satellite-based estimation of precipitation, from IR, AMW and PMW sensors [18,48,49,57]. For example, Xu et al. [46] assessed the effects of elevation on accumulative rainfall over southern Tibetan Plateau and identified a significant relationship between elevation and the performance of GPM IMERG. Zambrano-Bigiarini et al. [18] evaluated seven SPPs in a case study in Chile and found that all, except for PGFv3, performed poorly in areas of high elevation. Beria et al. [58] and Fang et al. [59] indicated a negative relation between IMERG performances and the topographic variation over India and China, respectively. Here, some factors may influence the performance of SPPs in different elevation regions. First, precipitation generally increases with elevation, and therefore the performance of IMERG products may improve with higher precipitation intensity [41]. Second, the number of rain gauges is very limited in high mountains, and the performance of IMERG products may not increase significantly even after adjustment against gauge observations [34,60]. Third, the processes and mechanisms of precipitation formation are complex in high-altitude regions, which makes the estimation of precipitation from satellite sensors difficult [59].
As indicated by the PDF analysis, all runs tend to underestimate the frequency of no/tiny rain events (P < 0.1 mm/day) but overestimate the frequency of light rain events (0.1 ≤ P < 10 mm/day), which is consistent with research works carried out in Malaysia [35], Tibetan Plateau [46], north Pakistan [30] and Bangladesh [55]. Moreover, our evaluation results show that the RMSE values tend to increase with precipitation intensity (Table 5 and Figure 9), which is in line with the findings of Habib et al. [61] and Yu et al. [49]. Theoretically, the satellite sensors infrared and microwave sensors are designed to retrieve facet information based on the brightness and temperature of the top clouds and precipitation particles, respectively [62]. In this study, precipitation intensity is classified based on rain gauge data (point data), which may not well represent precipitation intensity in the surrounding areas of the stations (facet precipitation information), which affects the reliability of the evaluation of satellite products at different precipitation intensity classes.
5.3. Reasons for the Changing Performance of IMERG in a Long-Time Span
For a data product with a long-time span, it is important to examine whether it shows a stable performance over time. Figure S5 shows all evaluation metrics of IMERG products from 2008 to 2017. The results show no statistically significant change in the performance of eight metrics associated with the estimation of precipitation from IMERG V06 products during 2008–2017 (F-test, p > 0.05). However, all runs of IMERG products exhibit poor accuracy from 2009 to 2012 (Figure S5d,h). From 2013, the performance of SPPs has gradually improved. It is well known that the GPM era starts from 2014, and the changing performances between the two eras (TRMM era and GPM era) indicate that IMERG is relatively robust in the transition between the two eras. It is reasonable to conclude that the increasing number of passive microwave samples has contributed to the increasing accuracy of IMERG. In addition, the improving microwave sensors with higher resolutions and more frequency channels are also likely to have contributed to the IMERG’s improvement. Besides, according to the Huffman et al. [29], the IMERG team used two GPCC products, the V8 Full Data Reanalysis data and the V6 Monitoring Product, to correct IMERG products’ systematic bias, whereas the former is only available for the period from 1998 to 2016 and the latter is employed to adjust data after 2016. It should be noted that the GPCC Monitoring Product is developed based on about 7000–8000 stations, while the GPCC Full Data Reanalysis includes 67,200 stations across the world. As a result, the performance of IMERG products is expected to decrease substantially after 2016 (Figure S5). However, the accuracy of IMERG still need to be explored further after 2016.
5.4. Study Limitations and Future Works
In this study, only daily precipitation data were available for rain gauges across China, which could not allow for a more extensive and detailed assessment of satellite products at finer time scale. Therefore, the sub-daily scale evaluation can be carried in the future work. In addition, while this study evaluated the performances of IMERG V06 in nine basins, it did not consider the impact of the discrepancy of rain gauges density in different basins. Finally, IMERG performed better in humid regions (SEB, PRB and YARB downstream) of China, which verifies the utility of IMERG V06 product as a source of precipitation data over humid regions; it can be used to near-real-time application such as flood simulation and monitoring.
6. Conclusions
This study provides a comprehensive evaluation of daily precipitation from different runs (early, late and final) of the latest version (V06) of IMERG against 696 key synoptic stations from 1 January 2008 to 31 December 2017 across China. We analyzed the accuracy of the IMERG products at various spatial and temporal scales through various performance metrics. Furthermore, we identified the effects of elevation on the accuracy of the estimation of precipitation from the IMERG products. The main conclusions of this study are summarized as follows:
- (1)
- All runs of the IMERG products can accurately capture the spatial patterns of daily precipitation from 2008 to 2017. However, the performances of the products vary among the river basins and gradually decrease from the southeast to the northwest of China. Better performance is measured in eastern humid basins compared to western arid basins.
- (2)
- Our analysis does not show significant differences between the early and late runs of IMERG products in China. However, moderate improvement is observed in the final run, as indicated by higher CC and KGE and lower RMSE at both daily and monthly levels of analysis. The three runs of IMERG show similar accuracy in estimating precipitation in China, with CSI values ranging from 0.4 to 0.41.
- (3)
- Our evaluation reveals a significant (p < 0.01) association between the performance of IMERG products and elevation, mainly highlighted by the analysis based on continuous performance metrics. For all runs, the accuracy gradually decreases with an increase in elevation. However, the categorical metrics exhibit lower levels of dependence on elevation except for POD.
- (4)
- In China and in each basin, all SPPs underestimate the frequency of no/tiny rain events (P < 0.1 mm/day) but overestimate the frequency of light rain events (0.1 ≤ P < 10 mm/day). The IMERG products better match the ground observations in areas with frequent moderate rain events (10 ≤ P < 25 mm/day). IMERG_F tends to overestimate the frequency of heavy precipitation (10 ≤ P < 25 mm/day) in southern China. All products align with ground-based observation in areas that frequently encounter rainstorms (P ≥ 50 mm/day) in PRB, YARB and SEB.
Supplementary Materials
The following are available online at https://0-www-mdpi-com.brum.beds.ac.uk/2072-4292/13/6/1208/s1, Figure S1: The annual mean rainfall regime based on rain gauge observations in nine basins during 2008–2017, Figure S2: Correlation Coefficient (CC), Kling–Gupta Efficiency (KGE) and Root Mean Square Error (RMSE) of IMERG_E, IMERG_L and IMERG_F in different seasons and basins, Figure S3: Probability of detection (POD), False Alarm Ratio FAR) and Critical Success Index (CSI) of IMERG_E, IMERG_L and IMERG_F in different seasons and basins, Figure S4: Spatial distribution number of rain gauges of Global Precipitation Climatology Centre (GPCC) Precipitation Climatology in 0.5° (a) and 2.5° (b) spatial resolution across China, Figure S5: Annual evaluation metrics for IMERG_E, IMERG_F and IMERG_F products from 2008 to 2017.
Author Contributions
Conceptualization, G.L. and L.Y.; methodology, L.Y.; software, L.Y.; validation, L.Y.; formal analysis, L.Y.; data curation, L.Y.; writing—original draft preparation, L.Y.; writing—review and editing, L.Y., G.L., J.P. and A.P.; supervision, G.L.; and funding acquisition, G.L. All authors have read and agreed to the published version of the manuscript.
Funding
This research is supported by the National Key Research and Development Program of China (No. 2020YFA0608502) and the National Natural Science Foundation of China (No. 42077420).
Data Availability Statement
The Integrated Multi-Satellite Retrievals for Global Precipitation Version 6 (IMERG V06) datasets used in this study were produced with the Giovanni online data system and developed and maintained by the NASA GES DISC (https://disc.gsfc.nasa.gov/datasets/GPM_3IMERGDF_06/summary?keywords=IMERG, accessed on 3 August 2020)). Daily dataset of China’s surface climate data is available from the China Meteorological Data Service Center (https://data.cam.cn, accessed on 5 August 2020).
Conflicts of Interest
The authors declare no conflict of interest.
References
- Donat, M.G.; Lowry, A.L.; Alexander, L.V.; O’Gorman, P.A.; Maher, N. More extreme precipitation in the world’s dry and wet regions. Nat. Clim. Chang. 2016, 6, 508–513. [Google Scholar] [CrossRef]
- Rivera, J.A.; Marianetti, G.; Hinrichs, S. Validation of CHIRPS precipitation dataset along the Central Andes of Argentina. Atmos. Res. 2018, 213, 437–449. [Google Scholar] [CrossRef]
- Trenberth, K. Changes in precipitation with climate change. Clim. Res. 2011, 47, 123–138. [Google Scholar] [CrossRef] [Green Version]
- Westra, S.; Alexander, L.V.; Zwiers, F.W. Global increasing trends in annual maximum daily precipitation. J. Clim. 2013, 26, 3904–3918. [Google Scholar] [CrossRef] [Green Version]
- AghaKouchak, A.; Farahmand, A.M.; Melton, F.S.; Teixeira, J.P.; Anderson, M.C.; Wardlow, B.D.; Hain, C.R. Remote sensing of drought: Progress, challenges and opportunities. Rev. Geophys. 2015, 53, 452–480. [Google Scholar] [CrossRef] [Green Version]
- Gehne, M.; Hamill, T.M.; Kiladis, G.N.; Trenberth, K.E. Comparison of global precipitation estimates across a range of temporal and spatial scales. J. Clim. 2016, 29, 7773–7795. [Google Scholar] [CrossRef]
- Kidd, C.; Matsui, T.; Chern, J.; Mohr, K.; Kummerow, C.; Randel, D.; Matsui, T. Global precipitation estimates from cross-track passive microwave observations using a physically based retrieval scheme. J. Hydrometeorol. 2015, 17, 383–400. [Google Scholar] [CrossRef] [Green Version]
- Ouyang, L.; Yang, K.; Lu, H.; Chen, Y.; La, Z.; Zhou, X.; Wang, Y. Ground-based observations reveal unique valley precipitation patterns in the central Himalaya. J. Geophys. Res. Atmos. 2020, 125, e2019JD031502. [Google Scholar] [CrossRef]
- Sun, Q.; Miao, C.; Duan, Q.; Ashouri, H.; Sorooshian, S.; Hsu, K.L. A review of global precipitation data sets: Data sources, estimation, and intercomparisons. Rev. Geophys. 2018, 56, 79–107. [Google Scholar] [CrossRef] [Green Version]
- Duan, Z.; Liu, J.; Tuo, Y.; Chiogna, G.; Disse, M. Evaluation of eight high spatial resolution gridded precipitation products in Adige Basin (Italy) at multiple temporal and spatial scales. Sci. Total. Environ. 2016, 573, 1536–1553. [Google Scholar] [CrossRef] [PubMed] [Green Version]
- Rana, S.; McGregor, J.; Renwick, J. Precipitation seasonality over the Indian subcontinent: An evaluation of gauge, reanalyses, and satellite retrievals. J. Hydrometeorol. 2015, 16, 631–651. [Google Scholar] [CrossRef]
- Kumar, L.S.; Lee, Y.H.; Yeo, J.X.; Ong, J.T. Tropical rain classification and estimation of rain from Z-R (reflectivity-rain rate) relationships. Prog. Electromagn. Res. B 2011, 32, 107–127. [Google Scholar] [CrossRef] [Green Version]
- Persson, A.; Grazzini, F. User Guide to ECMWF Forecast Products. Meteorological Bulletin. M3.2, ECMWE, 2007, p. 115. Available online: https://www.researchgate.net/publication/255267254_User_guide_to_ECMWF_forecast_products (accessed on 20 March 2021).
- Rienecker, M.M.; Suarez, M.J.; Gelaro, R.; Todling, R.; Bacmeister, J.; Liu, E.; Bosilovich, M.G.; Schubert, S.D.; Takacs, L.; Kim, G.-K.; et al. MERRA: NASA’s Modern-era retrospective analysis for research and applications. J. Clim. 2011, 24, 3624–3648. [Google Scholar] [CrossRef]
- Bosilovich, M.G. Regional climate and variability of NASA merra and recent reanalyses: U.S. summertime precipitation and temperature. J. Appl. Meteorol. Clim. 2013, 52, 1939–1951. [Google Scholar] [CrossRef]
- Chen, C.; Li, Z.; Song, Y.; Duan, Z.; Mo, K.; Wang, Z.; Chen, Q. Performance of multiple satellite precipitation estimates over a typical arid mountainous area of China: Spatiotemporal patterns and extremes. J. Hydrometeorol. 2020, 21, 533–550. [Google Scholar] [CrossRef]
- Kim, J.; Han, H.; Kim, B.; Chen, H.; Lee, J.-H. Use of a high-resolution-satellite-based precipitation product in mapping continental-scale rainfall erosivity: A case study of the United States. Catena 2020, 193, 104602. [Google Scholar] [CrossRef]
- Zambrano-Bigiarini, M.; Nauditt, A.; Birkel, C.; Verbist, K.; Ribbe, L. Temporal and spatial evaluation of satellite-based rainfall estimates across the complex topographical and climatic gradients of Chile. Hydrol. Earth Syst. Sci. 2017, 21, 1295–1320. [Google Scholar] [CrossRef] [Green Version]
- Tan, J.; Petersen, W.A.; Tokay, A. A novel approach to identify sources of errors in UMERG for GPM ground validation. J. Hydrometeorol. 2016, 17, 2477–2491. [Google Scholar] [CrossRef]
- Mahmoud, M.T.; Mohammed, S.A.; Hamouda, M.A.; Mohamed, M.M. Impact of topography and rainfall intensity on the accuracy of IMERG precipitation estimates in an arid region. Remote Sens. 2020, 13, 13. [Google Scholar] [CrossRef]
- Huang, W.-R.; Liu, P.-Y.; Hsu, J.; Li, X.; Deng, L. Assessment of near-real-time satellite precipitation products from GSMAP in monitoring rainfall variations over Taiwan. Remote Sens. 2021, 13, 202. [Google Scholar] [CrossRef]
- Turk, F.J.; Hristova-Veleva, S.; Giglio, D. Examination of the daily cycle wind vector modes of variability from the constellation of microwave scatterometers and radiometers. Remote Sens. 2021, 13, 141. [Google Scholar] [CrossRef]
- Hobouchian, M.P.; Salio, P.; Skabar, Y.G.; Vila, D.; Garreaud, R. Assessment of satellite precipitation estimates over the slopes of the subtropical Andes. Atmos. Res. 2017, 190, 43–54. [Google Scholar] [CrossRef]
- Ebert, E.E.; Janowiak, J.E.; Kidd, C. Comparison of near-real-time precipitation estimates from satellite observations and numerical models. Bull. Am. Meteorol. Soc. 2007, 88, 47–64. [Google Scholar] [CrossRef] [Green Version]
- Joyce, R.J.; Janowiak, J.E.; Arkin, P.A.; Xie, P. CMORPH: A method that produces global. Precipitation estimates from passive microwave and infrared data at high spatial and temporal resolution. J. Hydrometeor. 2004, 5, 287–296. [Google Scholar] [CrossRef]
- Huffman, G.J.; Adler, R.F.; Bolvin, D.T.; Nelkin, E.J. The TRMM multi-satellite precipitation analysis (TMPA): Qua-si-global, multiyear, combined-sensor precipitation estimate at fine scales. J. Hydrometeor. 2007, 8, 38–55. [Google Scholar] [CrossRef]
- Kidd, C.; Huffman, G.J. Global precipitation measurement. Meteorol. Appl. 2011, 18, 334–353. [Google Scholar] [CrossRef]
- Hou, A.Y.; Kakar, R.K.; Neeck, S.; Azarbarzin, A.A.; Kummerow, C.D.; Kojima, M.; Oki, R.; Nakamura, K.; Iguchi, T. The global precipitation measurement mission. Bull. Am. Meteorol. Soc. 2014, 95, 701–722. [Google Scholar] [CrossRef]
- Huffman, G.J.; Bolvin, D.T.; Braithwaite, D.; Hsu, K.; Joyce, R.; Kidd, C.; Nelkin, E.J.; Sorooshian, S.; Tan, J.; Xie, P. NASA global precipitation measurement (GPM) integrated multi-satellite retrievals for GPM (IMERG). In Algorithm Theoretical Basis Document (ATBD); NASA/GSFC: Greenbelt, MD, USA, 2019. Available online: https://docserver.gesdisc.eosdis.nasa.gov/public/project/GPM/IMERG_ATBD_V06.pdf (accessed on 20 March 2021).
- Ashouri, H.; Hsu, K.-L.; Sorooshian, S.; Braithwaite, D.K.; Knapp, K.R.; Cecil, L.D.; Nelson, B.R.; Prat, O.P. PERSIANN-CDR: Daily precipitation climate data record from multisatellite observations for hydrological and climate studies. Bull. Am. Meteorol. Soc. 2015, 96, 69–83. [Google Scholar] [CrossRef] [Green Version]
- Wei, G.; Lü, H.; Crow, W.T.; Zhu, Y.; Wang, J.; Su, J. Evaluation of Satellite-Based precipitation product from IMERG V04A and V03D, CMORPH and TMPA with gauged rainfall in three climatologic zones in China. Remote Sens. 2018, 10, 30. [Google Scholar] [CrossRef] [Green Version]
- Anjum, M.N.; Ding, Y.; Shangguan, D.; Ahmad, I.; Ijaz, M.W.; Farid, H.U.; Yagoub, Y.E.; Zaman, M.; Adnan, M. Performance evaluation of latest integrated multi-satellite retrievals for Global Precipitation Measurement (IMERG) over the northern highlands of Pakistan. Atmos. Res. 2018, 205, 134–146. [Google Scholar] [CrossRef]
- Prakash, S. Performance assessment of CHIRPS, MSWEP, SM2RAIN-CCI, and TMPA precipitation products across India. J. Hydrol. 2019, 571, 50–59. [Google Scholar] [CrossRef]
- Tang, G.; Clark, M.P.; Papalexiou, S.M.; Ma, Z.; Hong, Y. Have satellite precipitation products improved over last two decades? A comprehensive comparison of GPM IMERG with nine satellite and reanalysis datasets. Remote Sens. Environ. 2020, 240, 111697. [Google Scholar] [CrossRef]
- Tan, M.L.; Santo, H. Comparison of GPM IMERG, TMPA 3B42 and PERSIANN-CDR satellite precipitation products over Malaysia. Atmos. Res. 2018, 202, 63–76. [Google Scholar] [CrossRef]
- Lee, J.; Lee, E.-H.; Seol, K.-H. Validation of Integrated MultisatellitE Retrievals for GPM (IMERG) by using gauge-based analysis products of daily precipitation over East Asia. Theor. Appl. Clim. 2019, 137, 2497–2512. [Google Scholar] [CrossRef]
- Asong, Z.E.; Razavi, S.; Wheater, H.S.; Wong, J.S. Evaluation of integrated multisatellite retrievals for GPM (IMERG) over southern Canada against ground precipitation observations: A preliminary assessment. J. Hydrometeorol. 2017, 18, 1033–1050. [Google Scholar] [CrossRef]
- Dezfuli, A.K.; Ichoku, C.M.; Huffman, G.J.; Mohr, K.I.; Selker, J.S.; Van De Giesen, N.; Hochreutener, R.; Annor, F.O. Validation of IMERG precipitation in Africa. J. Hydrometeorol. 2017, 18, 2817–2825. [Google Scholar] [CrossRef]
- Wang, C.; Tang, G.; Han, Z.; Guo, X.; Hong, Y. Global intercomparison and regional evaluation of GPM IMERG Version-03, Version-04 and its latest Version-05 precipitation products: Similarity, difference and improvements. J. Hydrol. 2018, 564, 342–356. [Google Scholar] [CrossRef]
- Sim, E.M.; Liu, G. A parameterization of probability of snow-rain transition. J. Hydrol. 2015, 16, 1466–1477. [Google Scholar]
- Hosseini-Moghari, S.-M.; Tang, Q. Validation of GPM IMERG V05 and V06 precipitation products over Iran. J. Hydrometeorol. 2020, 21, 1011–1037. [Google Scholar] [CrossRef] [Green Version]
- Foelsche, U.O.S.; Kirchengast, G.; Fuchsberger, J.; Tan, J.; Petersen, W.A. Evaluation of GPM IMERG early, late, and final rainfall estimates using WegenerNet gauge data in southeastern Austria. Hydrol. Earth Syst. Sci. 2017, 21, 6559–6572. [Google Scholar] [CrossRef] [Green Version]
- Ramsauer, T.; Weiß, T.; Marzahn, P. Comparison of the GPM IMERG final precipitation product to radolan weather radar data over the topographically and climatically diverse Germany. Remote Sens. 2018, 10, 2029. [Google Scholar] [CrossRef] [Green Version]
- Yu, C.; Hu, D.; Liu, M.; Wang, S.; Di, Y. Spatio-temporal accuracy evaluation of three high-resolution satellite precipitation products in China area. Atmos. Res. 2020, 241, 104952. [Google Scholar] [CrossRef]
- Shen, Y.; Xiong, A. Validation and comparison of a new gauge-based precipitation analysis over mainland China. Int. J. Climatol. 2016, 36, 252–265. [Google Scholar] [CrossRef]
- Xu, R.; Tian, F.; Yang, L.; Hu, H.; Lu, H.; Hou, A. Ground validation of GPM IMERG and TRMM 3B42V7 rainfall products over southern Tibetan Plateau based on a high-density rain gauge network. J. Geophys. Res. Atmos. 2017, 122, 910–924. [Google Scholar] [CrossRef]
- Wei, G.; Lü, H.; Crow, W.T.; Zhu, Y.; Wang, J.; Su, J. Comprehensive evaluation of GPM-IMERG, CMORPH, and TMPA precipitation products with gauged rainfall over mainland China. Adv. Meteorol. 2018, 2018, 1–18. [Google Scholar] [CrossRef] [Green Version]
- Yu, L.; Ma, L.; Li, H.; Zhang, Y.; Kong, F.; Yang, Y. Assessment of high-resolution satellite rainfall products over a gradually elevating mountainous terrain based on a high-density rain gauge network. Int. J. Remote Sens. 2020, 41, 5620–5644. [Google Scholar] [CrossRef]
- Yu, L.; Zhang, Y.; Yang, Y. Using high-density rain gauges to validate the accuracy of satellite precipitation products over complex terrains. Atmosphere 2020, 11, 633. [Google Scholar] [CrossRef]
- Gupta, H.V.; Kling, H.; Yilmaz, K.K.; Martinez, G.F. Decomposition of the mean squared error and NSE performance criteria: Implications for improving hydrological modelling. J. Hydrol. 2009, 377, 80–91. [Google Scholar] [CrossRef] [Green Version]
- Kling, H.; Fuchs, M.; Paulin, M. Runoff conditions in the upper Danube basin under an ensemble of climate change scenarios. J. Hydrol. 2012, 424, 264–277. [Google Scholar] [CrossRef]
- Sharifi, E.; Steinacker, R.; Saghafian, B. Multi time-scale evaluation of high-resolution satellite-based precipitation products over northeast of Austria. Atmospheric Res. 2018, 206, 46–63. [Google Scholar] [CrossRef]
- Yuan, F.; Wang, B.; Shi, C.; Cui, W.; Zhao, C.; Liu, Y.; Ren, L.; Zhang, L.; Zhu, Y.; Chen, T.; et al. Evaluation of hydrological utility of IMERG Final run V05 and TMPA 3B42V7 satellite precipitation products in the Yellow River source region, China. J. Hydrol. 2018, 567, 696–711. [Google Scholar] [CrossRef]
- Sunilkumar, K.; Yatagai, A.; Masuda, M. Preliminary evaluation of GPM-IMERG rainfall estimates over three distinct climate zones with APHRODITE. Earth Space Sci. 2019, 6, 1321–1335. [Google Scholar] [CrossRef] [Green Version]
- Islam, A. Statistical comparison of satellite-retrieved precipitation products with rain gauge observations over Bangladesh. Int. J. Remote Sens. 2018, 39, 2906–2936. [Google Scholar] [CrossRef] [Green Version]
- Ma, Z.; Xu, J.; Zhu, S.; Yang, J.; Tang, G.; Yang, Y.; Shi, Z.; Hong, Y. AIMERG: A new Asian precipitation dataset (0.1°/half-hourly, 2000–2015) by calibrating the GPM-era IMERG at a daily scale using APHRODITE. Earth Syst. Sci. Data 2020, 12, 1525–1544. [Google Scholar] [CrossRef]
- Mantas, V.; Liu, Z.; Caro, C.; Pereira, A. Validation of TRMM multi-satellite precipitation analysis (TMPA) products in the Peruvian Andes. Atmospheric Res. 2015, 163, 132–145. [Google Scholar] [CrossRef]
- Beria, H.; Nanda, T.; Bisht, D.S.; Chatterjee, C. Does the GPM mission improve the systematic error component in satellite rainfall estimates over TRMM? An evaluation at a pan-India scale. Hydrol. Earth Syst. Sci. 2017, 21, 6117–6134. [Google Scholar] [CrossRef] [Green Version]
- Fang, J.; Yang, W.; Luan, Y.; Du, J.; Lin, A.; Zhao, L. Evaluation of the TRMM 3B42 and GPM IMERG products for extreme precipitation analysis over China. Atmos. Res. 2019, 223, 24–38. [Google Scholar] [CrossRef]
- Chen, F.; Li, X. Evaluation of IMERG and TRMM 3B43 monthly precipitation products over mainland China. Remote Sens. 2016, 8, 472. [Google Scholar] [CrossRef] [Green Version]
- Habib, E.; Henschke, A.; Adler, R.F. Evaluation of TMPA satellite-based research and real-time rainfall estimates during six tropical-related heavy rainfall events over Louisiana, USA. Atmospheric Res. 2009, 94, 373–388. [Google Scholar] [CrossRef]
- Chokngamwong, R.; Chiu, L.S. Thailand daily rainfall and comparison with TRMM products. J. Hydrometeorol. 2008, 9, 256–266. [Google Scholar] [CrossRef]
Figure 1.
(a) Topography map of the China and different basins; and (b) the spatial distribution of 696 daily rain gauges, the division of nine basins and the annual mean precipitation during 2008–2017. CB, Continental Basin; HARB, Haihe River Basin; HURB, Huaihe River Basin; PRB, Pearl River Basin; SEB, Southeast Basin; SRB, Songliao River Basin; SWB, Southwest Basin; YARB, Yangtze River Basin; YERB, Yellow River Basin. Each point represents a rain gauge in (b).

Figure 2.
Spatial distribution of statistical metrics (CC (a–c); β (d–f); γ (g–i); KGE (j–l); and RMSE (m–o)) from IMERG_E (Column 1), IMERG_L (Column 2) and IMERG_F (Column 3) at daily level from 2008 to 2017.
Figure 2.
Spatial distribution of statistical metrics (CC (a–c); β (d–f); γ (g–i); KGE (j–l); and RMSE (m–o)) from IMERG_E (Column 1), IMERG_L (Column 2) and IMERG_F (Column 3) at daily level from 2008 to 2017.

Figure 3.
Spatial distribution of categorical metrics (POD (a–c); FAR (d–f); and CSI (g–i)) for IMERG_E (Column 1), IMERG_L (Column 2) and IMERG_F (Column 3) at daily level from 2008 to 2017.
Figure 3.
Spatial distribution of categorical metrics (POD (a–c); FAR (d–f); and CSI (g–i)) for IMERG_E (Column 1), IMERG_L (Column 2) and IMERG_F (Column 3) at daily level from 2008 to 2017.

Figure 4.
Boxplots of CC (a), β (b), γ (c), KGE (d), RMSE (e), POD (f), FAR (g) and CSI (h) at daily scale from 2008 to 2017. The bottom and top edges of the boxes indicate the 25th and 75th percentiles, respectively. The central black line indicates the median. The black dash line is the optimal value.

Figure 5.
Accuracy comparison of IMERG_E, IMERG_L and IMERG_F products in each month during 2008–2017 across China.
Figure 5.
Accuracy comparison of IMERG_E, IMERG_L and IMERG_F products in each month during 2008–2017 across China.

Figure 6.
Radial column chart of CC (a–d), RMSE (e–h), KGE (i–l) and CSI (m–p) from IMERG_E, IMERG_L and IMERG_ F at the daily scale from 2008 to 2017 for different seasons over mainland China and nine basins (CB, Continental Basin; HARB, Haihe River Basin; HURB, Huaihe River Basin; PRB, Pearl River Basin; SEB, Southwest Basin; SRB, Songliao River Basin; SWB, Southwest Basin; YARB, Yangtze River Basin; YERB, Yellow River Basin).

Figure 7.
Relationship between calculated CC (a–c), KGE (d–f), RMSE (g–i) and CSI (j–l) for IMERG_E (Column 1), IMERG_F (Column 2) and IMERG_L (Column 3) products and elevation at the daily scale during 2008–2017.
Figure 7.
Relationship between calculated CC (a–c), KGE (d–f), RMSE (g–i) and CSI (j–l) for IMERG_E (Column 1), IMERG_F (Column 2) and IMERG_L (Column 3) products and elevation at the daily scale during 2008–2017.

Figure 8.
Probability distribution function (PDF) of IMERG_E, IMERG_L and IMERG_F products and rain gauge in different precipitation intensity classes across nine basins (a–i) (CB, Continental Basin; HARB, Haihe River Basin; HURB, Huaihe River Basin; PRB, Pearl River Basin; SEB, Southwest Basin; SRB, Songliao River Basin; SWB, Southwest Basin; YARB, Yangtze River Basin; YERB, Yellow River Basin) and China (j) during 2008 to 2017.

Figure 9.
CC (a,e,i,m,q,u,y,ac,ag), KGE (b,f,j,n,r,v,z,ad,ah), RMSE (c,g,k,o,s,w,aa,ae,ai) and POD (d,h,l,p,t,x,ab,af,aj) from IMERG_E (red line), IMERG_L (dashed line) and IMERG_F (green line) products in different precipitation intensity across nine basins (CB, Continental Basin; HARB, Haihe River Basin; HURB, Huaihe River Basin; PRB, Pearl River Basin; SEB, Southwest Basin; SRB, Songliao River Basin; SWB, Southwest Basin; YARB, Yangtze River Basin; YERB, Yellow River Basin) during 2008 to 2017.


Table 1.
Performance metrics associated with IMERG products in each basin from 2008 to 2017.
| Metrics | SPPs | Basin | ||||||||
|---|---|---|---|---|---|---|---|---|---|---|
| SRB | HARB | HURB | YERB | YARB | PRB | SEB | SWB | CB | ||
| CC | IMERG_E | 0.35 | 0.33 | 0.37 | 0.35 | 0.40 | 0.44 | 0.40 | 0.40 | 0.24 |
| IMERG_L | 0.35 | 0.33 | 0.37 | 0.35 | 0.40 | 0.44 | 0.43 | 0.40 | 0.23 | |
| IMERG_F | 0.40 | 0.36 | 0.41 | 0.39 | 0.43 | 0.48 | 0.47 | 0.43 | 0.28 | |
| β | IMERG_E | 1.23 | 1.19 | 1.23 | 1.12 | 1.04 | 1.01 | 1.01 | 0.96 | 1.45 |
| IMERG_L | 1.25 | 1.22 | 1.24 | 1.14 | 1.04 | 0.99 | 0.99 | 0.95 | 1.48 | |
| IMERG_F | 1.12 | 1.08 | 1.12 | 1.09 | 1.05 | 1.03 | 1.04 | 1.19 | 1.21 | |
| γ | IMERG_E | 0.80 | 0.76 | 0.80 | 0.93 | 0.96 | 1.06 | 0.98 | 0.97 | 0.76 |
| IMERG_L | 0.84 | 0.81 | 0.87 | 0.99 | 1.01 | 1.11 | 1.05 | 1.01 | 0.81 | |
| IMERG_F | 0.83 | 0.81 | 0.83 | 0.88 | 0.91 | 0.98 | 0.96 | 0.87 | 0.75 | |
| KGE | IMERG_E | 0.30 | 0.26 | 0.31 | 0.34 | 0.40 | 0.44 | 0.40 | 0.39 | 0.09 |
| IMERG_L | 0.28 | 0.27 | 0.31 | 0.33 | 0.40 | 0.43 | 0.43 | 0.39 | 0.08 | |
| IMERG_F | 0.36 | 0.33 | 0.37 | 0.37 | 0.42 | 0.48 | 0.47 | 0.39 | 0.21 | |
| RMSE (mm/day) | IMERG_E | 6.99 | 7.31 | 10.03 | 5.81 | 11.26 | 14.80 | 13.62 | 7.17 | 2.90 |
| IMERG_L | 7.24 | 7.53 | 10.52 | 6.06 | 11.57 | 15.09 | 13.06 | 7.29 | 3.06 | |
| IMERG_F | 6.57 | 7.00 | 9.50 | 5.37 | 10.74 | 13.83 | 12.83 | 7.39 | 2.55 | |
| POD | IMERG_E | 0.65 | 0.66 | 0.71 | 0.65 | 0.68 | 0.66 | 0.69 | 0.74 | 0.55 |
| IMERG_L | 0.64 | 0.65 | 0.70 | 0.63 | 0.67 | 0.66 | 0.70 | 0.72 | 0.53 | |
| IMERG_F | 0.64 | 0.65 | 0.70 | 0.65 | 0.69 | 0.67 | 0.71 | 0.75 | 0.55 | |
| FAR | IMERG_E | 0.58 | 0.63 | 0.61 | 0.57 | 0.44 | 0.35 | 0.38 | 0.40 | 0.70 |
| IMERG_L | 0.57 | 0.61 | 0.59 | 0.55 | 0.42 | 0.35 | 0.36 | 0.39 | 0.69 | |
| IMERG_F | 0.56 | 0.60 | 0.58 | 0.55 | 0.43 | 0.35 | 0.36 | 0.40 | 0.69 | |
| CSI | IMERG_E | 0.34 | 0.31 | 0.33 | 0.35 | 0.44 | 0.49 | 0.48 | 0.49 | 0.24 |
| IMERG_L | 0.35 | 0.32 | 0.35 | 0.35 | 0.45 | 0.49 | 0.50 | 0.49 | 0.24 | |
| IMERG_F | 0.35 | 0.33 | 0.35 | 0.36 | 0.45 | 0.49 | 0.51 | 0.50 | 0.25 | |
Table 2.
Overall performance associated with IMERG products from 2008 to 2017 at daily level across China.
Table 2.
Overall performance associated with IMERG products from 2008 to 2017 at daily level across China.
| SPPs | CC | β | γ | KGE | RMSE (mm/day) | POD | FAR | CSI |
|---|---|---|---|---|---|---|---|---|
| IMERG_E | 0.42 | 1.07 | 0.93 | 0.41 | 9.67 | 0.68 | 0.50 | 0.40 |
| IMERG_L | 0.41 | 1.08 | 0.97 | 0.41 | 9.86 | 0.67 | 0.49 | 0.41 |
| IMERG_F | 0.47 | 1.07 | 0.90 | 0.45 | 9.26 | 0.68 | 0.48 | 0.42 |
Table 3.
Overall performance metrics associated with IMERG products from 2008 to 2017 at monthly level across China.
Table 3.
Overall performance metrics associated with IMERG products from 2008 to 2017 at monthly level across China.
| SPPs | CC | β | γ | KGE | RMSE (mm/month) |
|---|---|---|---|---|---|
| IMERG_E | 0.83 | 1.08 | 0.97 | 0.81 | 56.57 |
| IMERG_L | 0.83 | 1.08 | 0.98 | 0.81 | 57.62 |
| IMERG_F | 0.94 | 1.07 | 0.92 | 0.87 | 34.31 |
Table 4.
Performance metrics associated with IMERG products in 6 classes of elevation.
| Elevation (m) | Mean Rain (mm) | SPPs | Metrics | |||||||
|---|---|---|---|---|---|---|---|---|---|---|
| CC | β | γ | KGE | RMSM (mm/day) | POD | FAR | CSI | |||
| <200 | 1197.19 | IMERG_E | 0.44 | 1.14 | 0.90 | 0.41 | 12.15 | 0.71 | 0.50 | 0.42 |
| IMERG_L | 0.43 | 1.14 | 0.95 | 0.41 | 12.54 | 0.71 | 0.48 | 0.43 | ||
| IMERG_F | 0.47 | 1.09 | 0.89 | 0.45 | 11.42 | 0.72 | 0.48 | 0.43 | ||
| 200–500 | 943.52 | IMERG_E | 0.39 | 1.05 | 0.95 | 0.38 | 9.80 | 0.65 | 0.50 | 0.40 |
| IMERG_L | 0.38 | 1.05 | 0.99 | 0.38 | 10.02 | 0.64 | 0.49 | 0.40 | ||
| IMERG_F | 0.43 | 1.06 | 0.93 | 0.42 | 9.42 | 0.65 | 0.48 | 0.41 | ||
| 500–1000 | 729.58 | IMERG_E | 0.37 | 1.00 | 0.92 | 0.36 | 8.04 | 0.62 | 0.52 | 0.37 |
| IMERG_L | 0.36 | 1.01 | 0.96 | 0.36 | 8.25 | 0.61 | 0.50 | 0.38 | ||
| IMERG_F | 0.40 | 1.02 | 0.91 | 0.40 | 7.84 | 0.62 | 0.50 | 0.38 | ||
| 1000–1500 | 523.17 | IMERG_E | 0.34 | 1.07 | 0.92 | 0.33 | 6.87 | 0.61 | 0.56 | 0.34 |
| IMERG_L | 0.34 | 1.08 | 0.95 | 0.33 | 7.05 | 0.59 | 0.54 | 0.35 | ||
| IMERG_F | 0.39 | 1.04 | 0.90 | 0.38 | 6.50 | 0.61 | 0.54 | 0.35 | ||
| 1500–2000 | 766.16 | IMERG_E | 0.38 | 0.92 | 0.97 | 0.37 | 7.63 | 0.63 | 0.47 | 0.40 |
| IMERG_L | 0.38 | 0.92 | 1.00 | 0.38 | 7.75 | 0.62 | 0.46 | 0.40 | ||
| IMERG_F | 0.42 | 1.00 | 0.95 | 0.42 | 7.61 | 0.63 | 0.47 | 0.41 | ||
| >2000 | 554.98 | IMERG_E | 0.32 | 0.84 | 1.13 | 0.29 | 5.13 | 0.66 | 0.44 | 0.43 |
| IMERG_L | 0.32 | 0.82 | 1.18 | 0.27 | 5.20 | 0.64 | 0.43 | 0.43 | ||
| IMERG_F | 0.35 | 1.11 | 1.01 | 0.34 | 5.48 | 0.68 | 0.44 | 0.44 | ||
Note: The second column (Mean rain) represents the annual mean precipitation of rain gauge in different elevation classes.
Table 5.
Performance metrics associated with IMERG products in four precipitation bins on a daily scale across China.
Table 5.
Performance metrics associated with IMERG products in four precipitation bins on a daily scale across China.
| Precipitation Bin (mm/day) | SPPs | CC | β | γ | KGE | RMSE (mm/day) | POD |
|---|---|---|---|---|---|---|---|
| [0.1, 10) | IMERG_E | 0.15 | 1.61 | 2.31 | −0.68 | 9.72 | 0.61 |
| IMERG_L | 0.15 | 1.63 | 2.40 | −0.75 | 10.19 | 0.60 | |
| IMERG_F | 0.17 | 1.65 | 2.18 | −0.58 | 9.38 | 0.61 | |
| [10, 25) | IMERG_E | 0.11 | 0.66 | 6.04 | −4.13 | 17.56 | 0.32 |
| IMERG_L | 0.11 | 0.69 | 6.23 | −4.31 | 18.48 | 0.32 | |
| IMERG_F | 0.12 | 0.69 | 5.55 | −3.65 | 16.67 | 0.34 | |
| [25, 50) | IMERG_E | 0.10 | 0.52 | 6.63 | −4.72 | 29.04 | 0.24 |
| IMERG_L | 0.09 | 0.53 | 6.85 | −4.94 | 29.99 | 0.25 | |
| IMERG_F | 0.11 | 0.53 | 6.08 | −4.17 | 27.59 | 0.26 | |
| ≥50 | IMERG_E | 0.24 | 0.39 | 2.83 | −1.07 | 65.01 | 0.19 |
| IMERG_L | 0.24 | 0.40 | 2.92 | −1.15 | 65.46 | 0.20 | |
| IMERG_F | 0.28 | 0.40 | 2.61 | −0.86 | 62.66 | 0.21 |
Publisher’s Note: MDPI stays neutral with regard to jurisdictional claims in published maps and institutional affiliations. |
© 2021 by the authors. Licensee MDPI, Basel, Switzerland. This article is an open access article distributed under the terms and conditions of the Creative Commons Attribution (CC BY) license (http://creativecommons.org/licenses/by/4.0/).
Share and Cite
MDPI and ACS Style
Yu, L.; Leng, G.; Python, A.; Peng, J. A Comprehensive Evaluation of Latest GPM IMERG V06 Early, Late and Final Precipitation Products across China. Remote Sens. 2021, 13, 1208. https://0-doi-org.brum.beds.ac.uk/10.3390/rs13061208
AMA Style
Yu L, Leng G, Python A, Peng J. A Comprehensive Evaluation of Latest GPM IMERG V06 Early, Late and Final Precipitation Products across China. Remote Sensing. 2021; 13(6):1208. https://0-doi-org.brum.beds.ac.uk/10.3390/rs13061208
Chicago/Turabian StyleYu, Linfei, Guoyong Leng, Andre Python, and Jian Peng. 2021. "A Comprehensive Evaluation of Latest GPM IMERG V06 Early, Late and Final Precipitation Products across China" Remote Sensing 13, no. 6: 1208. https://0-doi-org.brum.beds.ac.uk/10.3390/rs13061208
Note that from the first issue of 2016, this journal uses article numbers instead of page numbers. See further details here.