Technical Note

Integration of Satellite Interferometric Data in Civil Protection Strategies for Landslide Studies at a Regional Scale

1
Earth Sciences Department, University of Firenze, Via La Pira 4, 50121 Firenze, Italy
2
Centre Tecnològic de Telecomunicacions de Catalunya (CTTC/CERCA), Geomatics Division, Av. Gauss, 7, E-08860 Castelldefels, Barcelona, Spain
3
Regione Autonoma Valle D’Aosta, Assessorato Opere Pubbliche, Difesa del Suolo e Edilizia Residenziale Pubblica. Loc. Amérique, 11020 Quart, Italy
4
Geosciences Department, University of Padova, Via G. Gradenigo n.6, 35131 Padova, Italy
*
Author to whom correspondence should be addressed.
Remote Sens. 2021, 13(10), 1881; https://0-doi-org.brum.beds.ac.uk/10.3390/rs13101881
Submission received: 22 March 2021 / Revised: 7 May 2021 / Accepted: 10 May 2021 / Published: 11 May 2021
(This article belongs to the Special Issue Remote Sensing for Landslide Monitoring, Mapping and Modeling)

Abstract

:
Multi-Temporal Satellite Interferometry (MTInSAR) is gradually evolving from being a tool developed by the scientific community exclusively for research purposes to a real operational technique that can meet the needs of different users involved in geohazard mitigation. This work aims at showing the innovative operational use of satellite radar interferometric products in Civil Protection Authority (CPA) practices for monitoring slow-moving landslides. We present the example of the successful ongoing monitoring system in the Valle D’Aosta Region (VAR-Northern Italy). This system exploits well-combined MTInSAR products and ground-based instruments for landslide management and mitigation strategies over the whole regional territory. Due to the critical intrinsic constraints of MTInSAR data, a robust regional satellite monitoring integrated into CPA practices requires the support of both in situ measurements and remotely sensed systems to guarantee the completeness and reliability of information. The monitoring network comprises three levels of analysis: Knowledge monitoring, Control monitoring, and Emergency monitoring. At the first monitoring level, MTInSAR data are used for the preliminary evaluation of the deformation scenario at a regional scale. At the second monitoring level, MTInSAR products support the prompt detection of trend variations of radar benchmarks displacements with bi-weekly temporal frequency to identify active critical situations where follow-up studies must be carried out. In the third monitoring level, MTInSAR data integrated with ground-based data are exploited to confirm active slow-moving deformations detected by on-site instruments. At this level, MTInSAR data are also used to carry out back analysis that cannot be performed by any other tool. From the example of the Valle D’Aosta Region integrated monitoring network, which is one of the few examples of this kind around Europe, it is evident that MTInSAR provides a great opportunity to improve monitoring capabilities within CPA activities.

Graphical Abstract

1. Introduction

Since the last decade of the twentieth century, the use of satellite remote sensing techniques for geohazard prevention, mapping, and monitoring has grown significantly, contributing to landslide risk reduction, impact assessments, and disaster responses in urban areas. Many applications have revealed the usefulness of images captured by space-borne SAR (Synthetic Aperture Radar) sensors for slope instability investigations [1,2]. InSAR (SAR Interferometry) is currently one of the most exploited techniques for assessing ground displacements, and it is now becoming a more consolidated tool used by several institutions and authorities in charge of landslide risk management [3]. In particular, Multi-Temporal Satellite Interferometry (MTInSAR) techniques are advanced multi-temporal interferometric elaborations widely used to exploit multiple satellite SAR images acquired over the same area at different times for measuring millimetric displacements of the Earth’s surface [4]. MTInSAR techniques can be split into two macro-classes depending on the measurement point targets derived from SAR imagery processing: PSI (Persistent Scatterer Interferometry) and DSI (Distributed Scatterer Interferometry). PSI relies on deriving temporally stable and highly reflective ground elements (PS, Persistent Scatterer), whereas DSI relies on computing collectively pixels with a similar weak response to the microwaves (DS, Distributed Scatterers). The joint analysis of PS and DS allows detecting measurement points in urban and non-urban areas [4].
Due to satellite intrinsic acquisition features, the maximum measurable displacement between two consecutive acquisitions is limited to a quarter of the employed radar wavelength. In Sentinel-1 sensors, this value corresponds to a maximum measurable rate of ~85 cm/year. Therefore, the applicability of MTInSAR techniques to landslide phenomena can be mainly assessed in relation to their velocity and movement type, as classified by Cruden and Varnes [5]. In particular, MTInSAR techniques can observe and measure Cruden and Varnes [5] classes named “extremely slow” and “very slow” in terms of movement velocity. Some typologies of landslides characterized by very fast rates or instantaneous collapses, e.g., falls and topples, cannot be detected, or they are often underestimated due to phase unwrapping errors. Usually, MTInSAR is successfully applied to analyze slides, either rotational and translational phenomena or complex phenomena, to which we refer in this work.
The increased technological capability of SAR satellites in terms of new constellations, higher computational capacity, and more finely tuned MTInSAR processing algorithms has improved space-borne radar remote sensing potentials as a tool for geohazards analysis [6].
Civil Protection Authorities (CPAs) need a robust monitoring approach that uses reliable data frequently acquired over wide areas (i.e., at a regional scale) for forecasting, prevention, and emergency activities. It is also important that the monitoring system and data analyses should not produce unmanageable numbers of “false positives”. MTInSAR data fit these requirements well after accurate radar interpretation and comparison with all the other available information sources over a study area [3,7,8].
In the literature, some studies have dealt with satellite-based observations and derived geospatial products specifically and successfully applied to Civil Protection practices in landslide-related events [9,10,11,12]. Within the “prevention and preparedness phase”, EO (Earth Observation) MTInSAR data have been proved to be useful for hazard, vulnerability, and risk mapping, bearing in mind the applicability of the MTInSAR techniques on, exclusively, some typologies of land cover (primarily urbanized/built-up areas) since the presence of vegetation causes temporal decorrelation [13,14,15,16,17,18,19,20]. Within the “emergency and response phase”, satellite interferometric radar data can support activities related to rapid mapping of ground motions [21,22,23,24]. Within the “recovery phase”, satellite EO-based products can be potentially used to plan interventions, assure the security of reconstruction work, and identify landslide residual hazards [25,26,27,28].
Satellite multi-temporal interferometric radar data are now ready to be used as operational tools, not only as one-shot scientific research applications. Considering this, it is important to create approaches and products that could be integrated into urban planning and Civil Protection procedures. Nevertheless, Mateos et al. [29] showed that many European countries still have no tools with which to assess the impact of ground deformation phenomena in urban planning practices or lack landslide inventory maps.
In recent years, three Italian regions (Tuscany, Valle d’Aosta, and Veneto) implemented a satellite-based service that exploits PSI data to monitor whole regional territories, fostering the shift from research to enhanced operational capability in landslide risk management over wide areas [30,31,32].
This technical note offers an overview of MTInSAR products’ operational use within one of the monitoring services mentioned above for slow-moving landslides, i.e., the Valle d’Aosta Region (VAR) (northwestern Italy) system. The strategy implemented in this territory is a rare example of the full integration of interferometric data and ground measurements within the Civil Protection cycle.

2. Background

In CPA practices, the need for intervention criteria based on quantifying risk is rising and becoming decisive for implementing effective disaster risk reduction strategies.
Geohazard management and mitigation practices involve the correct choice of the monitoring system (remotely sensed or in situ), the selection of the geohazards to be prioritized (in terms of allocated resources), and the development of a real-time or near-real-time monitoring service with ad hoc alerts based on thresholds. The monitoring results must be delivered in a format understandable by the different stakeholders, CPA actors, and local authorities and potentially involving the citizens.
At a regional scale, it is crucial to have a tool enabling the CPA to investigate the largest possible extension of the territory and to detect new deformation phenomena or accelerations of the existing ones as early as possible.
This screening capability provides the CPA with the opportunity to perform a full-scale regional assessment of the landslide phenomena, with a proper allocation of human and financial resources. In addition, from an operational point of view, MTInSAR allows the investigation of uninhabited areas (in the case of VAR, the high mountainous environment) in any climatic condition, with an appreciable and positive impact on the safety of the personnel.
Therefore, it is worth highlighting that a robust regional monitoring system integrated into the CPA cycle requires multi-source techniques to retrieve the most reliable and complete information possible.
For civil protection purposes, an integrated monitoring system needs to assign a specific role to the various instruments in each monitoring phase. Efficient active surveillance involves three different levels of monitoring:
1.
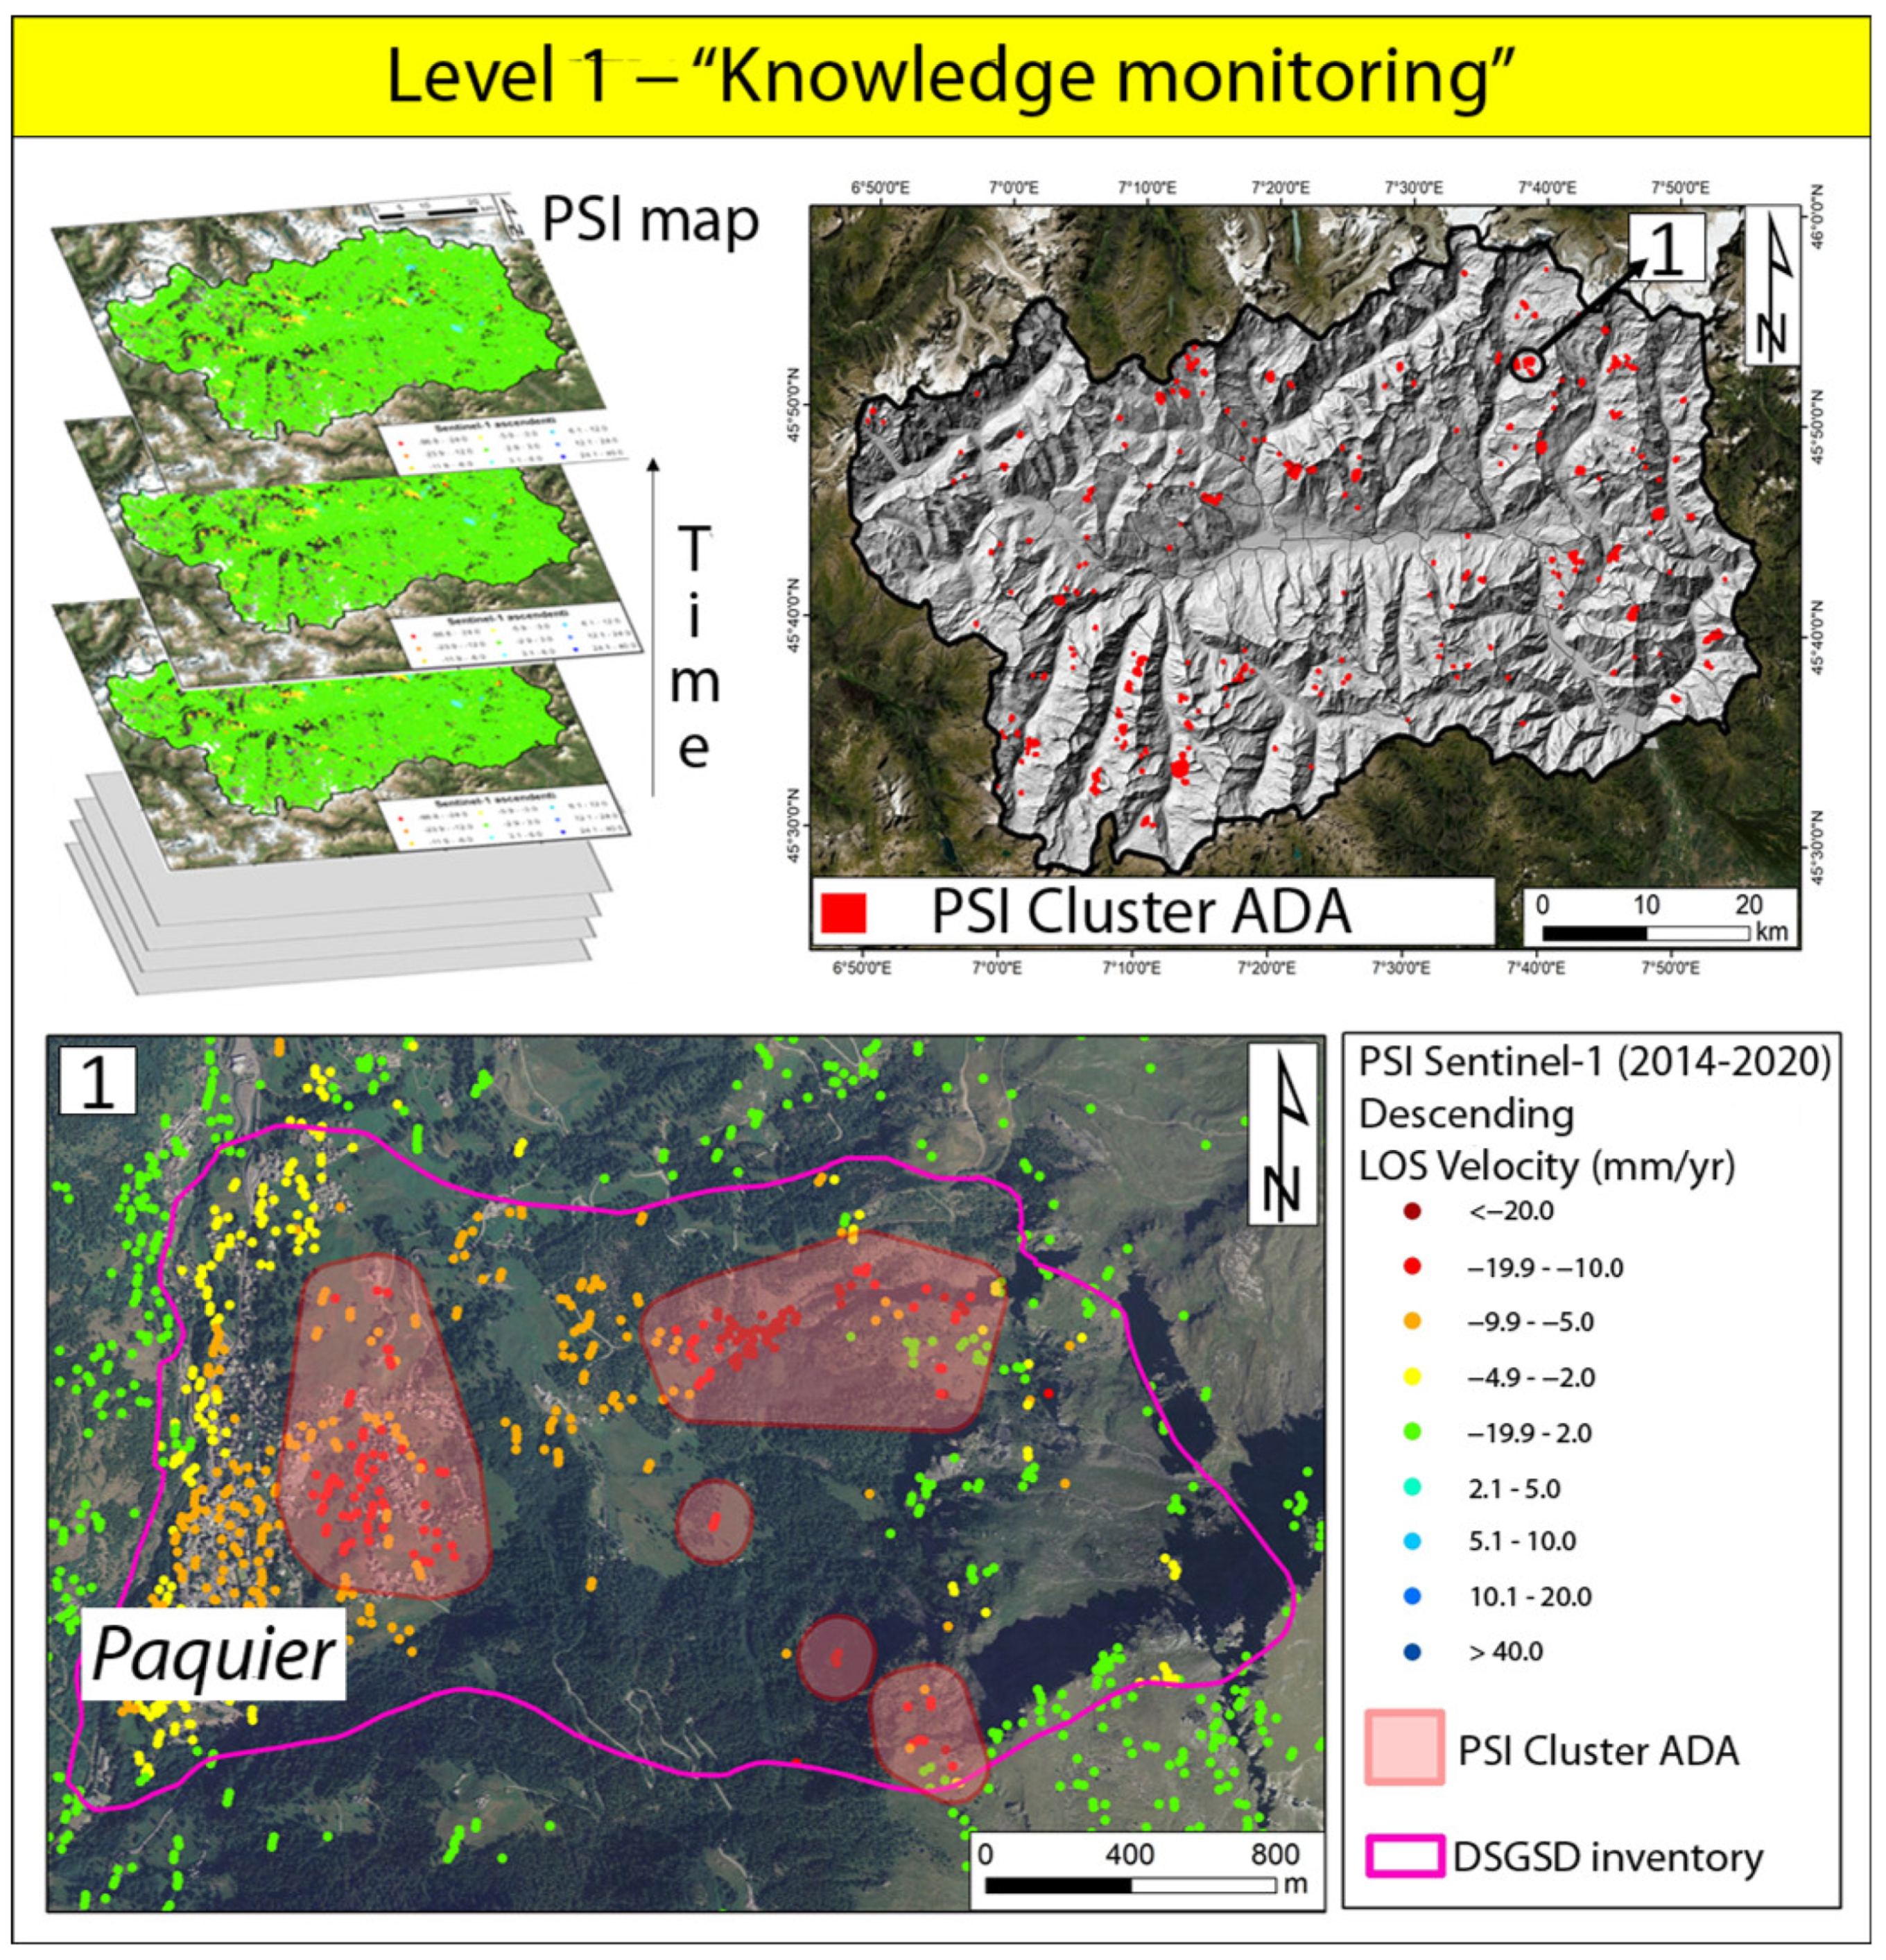
Level 1—“Knowledge monitoring”, for early detection and preliminary evaluation:
Knowledge monitoring allows for the detection and preliminary evaluation of the deformation scenario to highlight the areas characterized by the highest ground motion rates and/or accelerations, where further CPA efforts should be focused;
2.
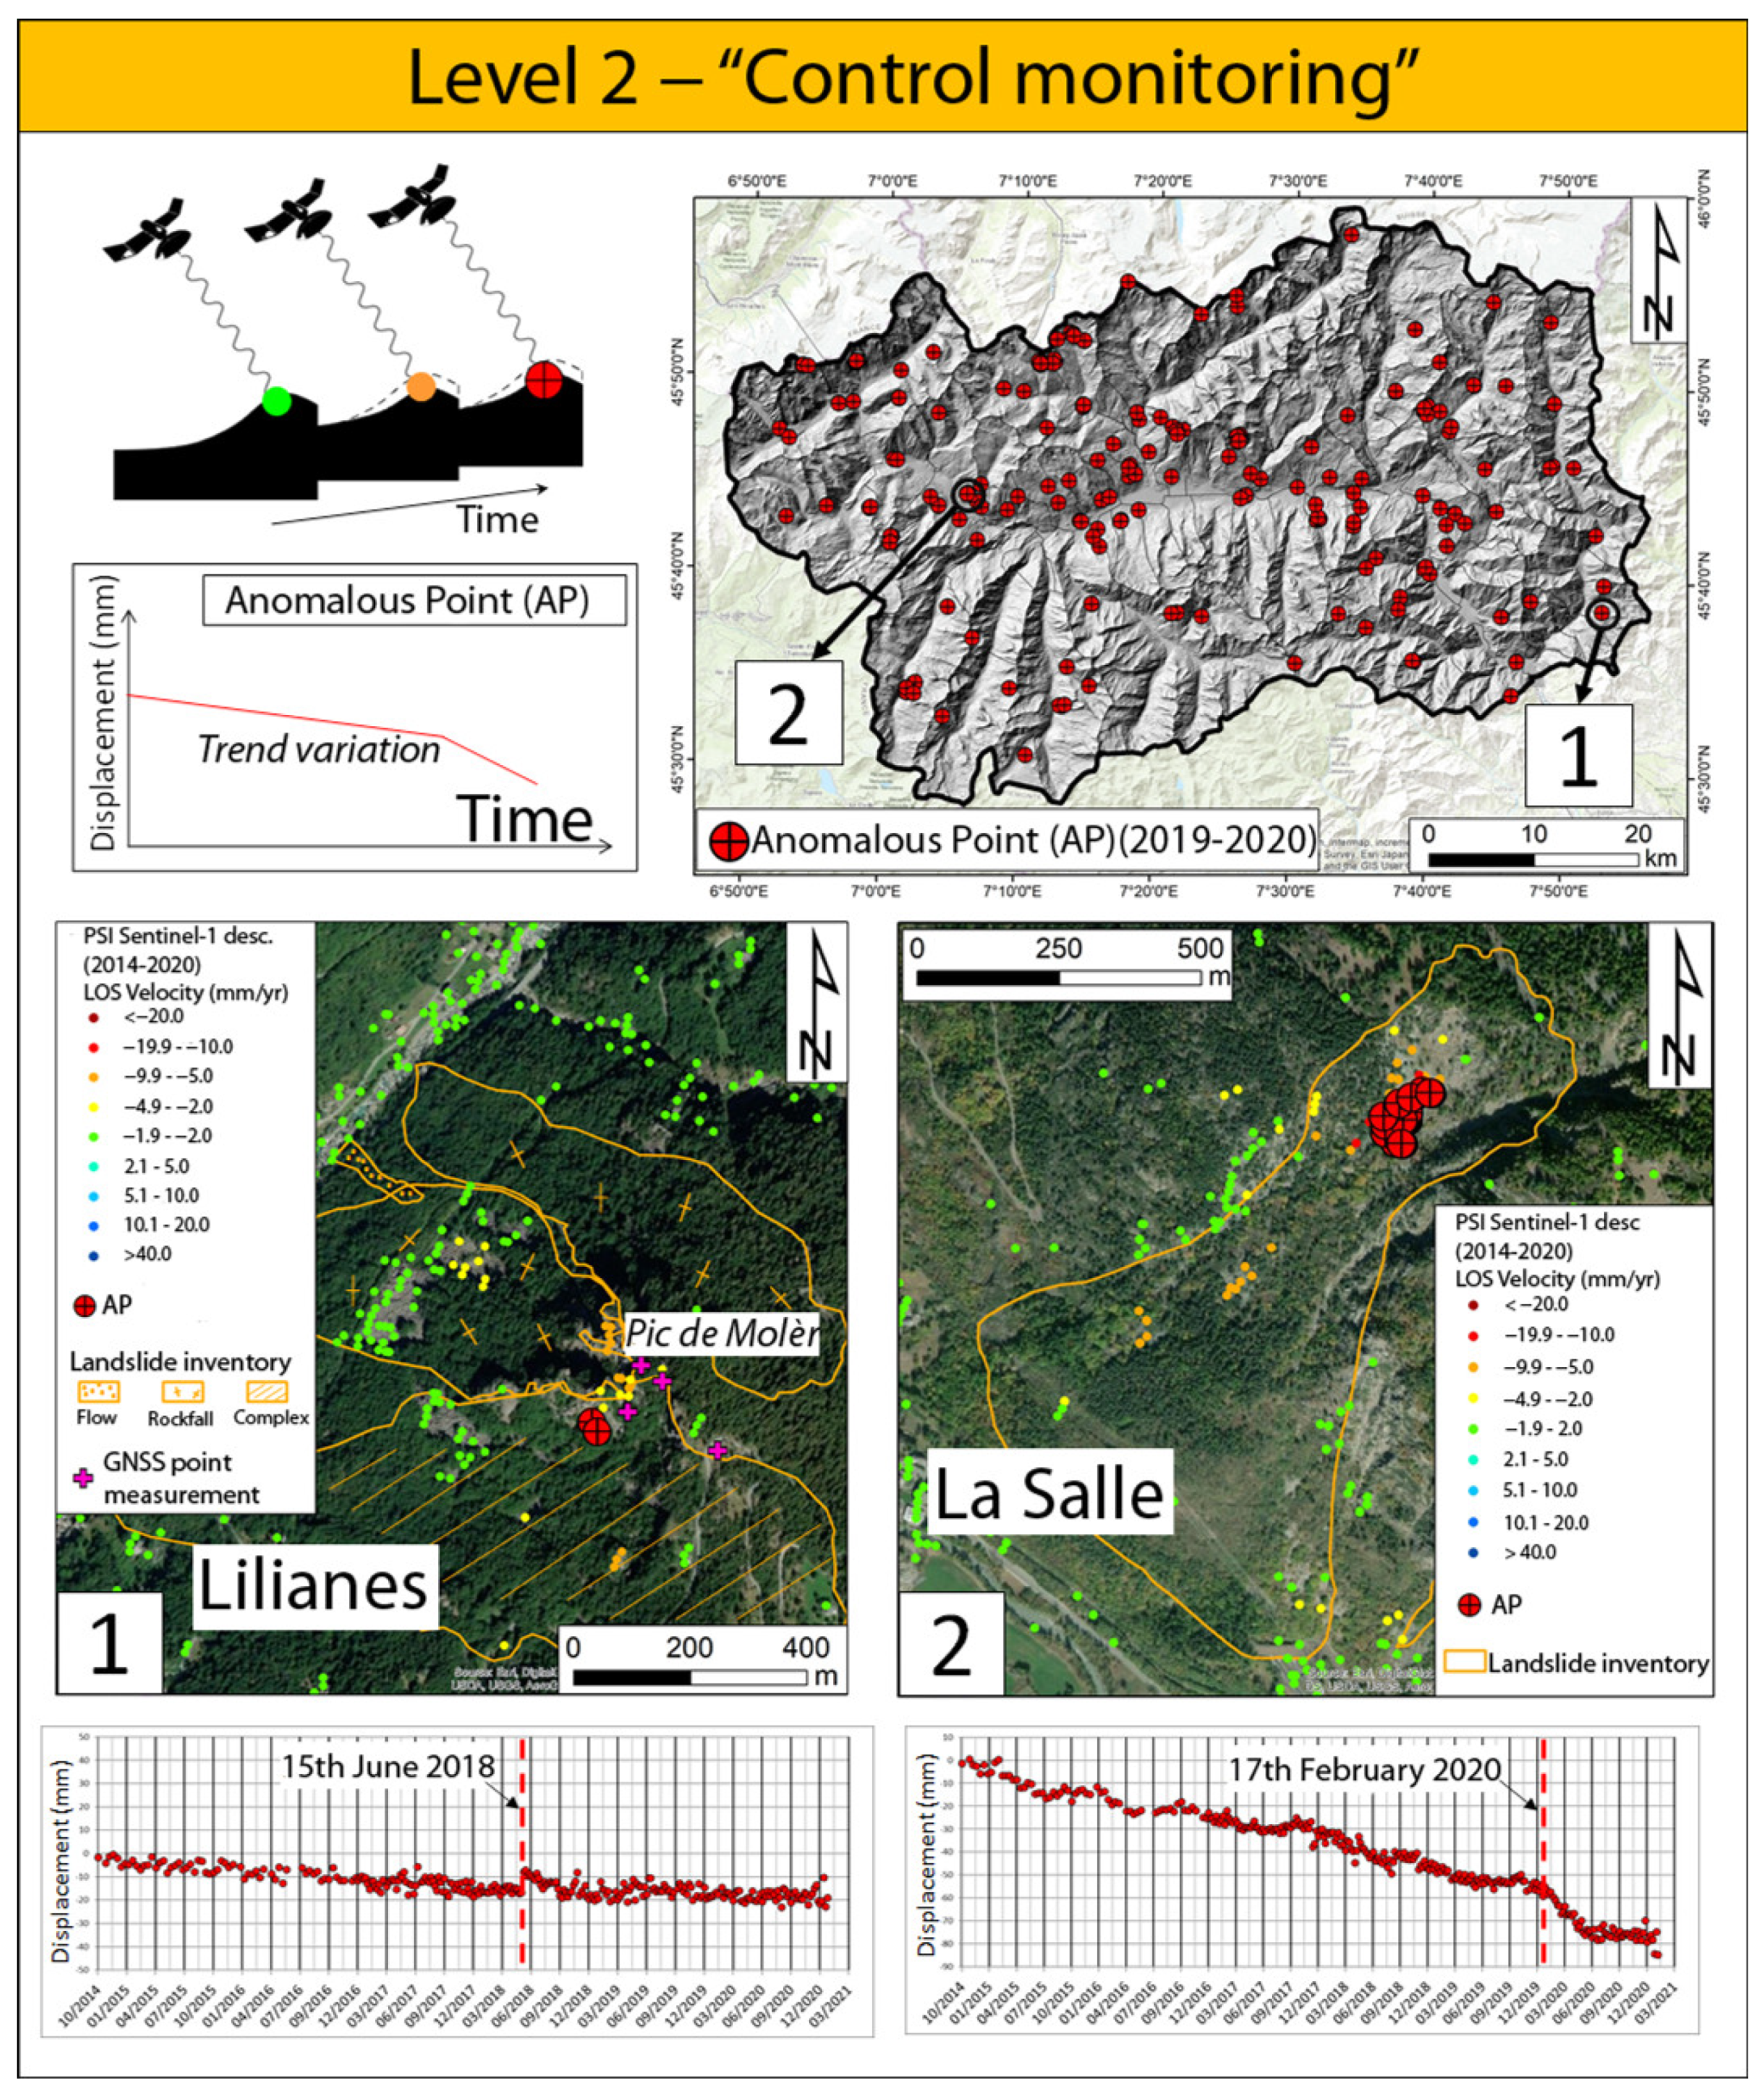
Level 2—“Control Monitoring”, for the analysis of the temporal evolution of critical situations:
Control monitoring permits further investigation of the criticalities evidenced in the previous level and the development of follow-up studies, e.g., activities aimed to quantify the vulnerability of buildings and the potential loss expected in an area;
3.
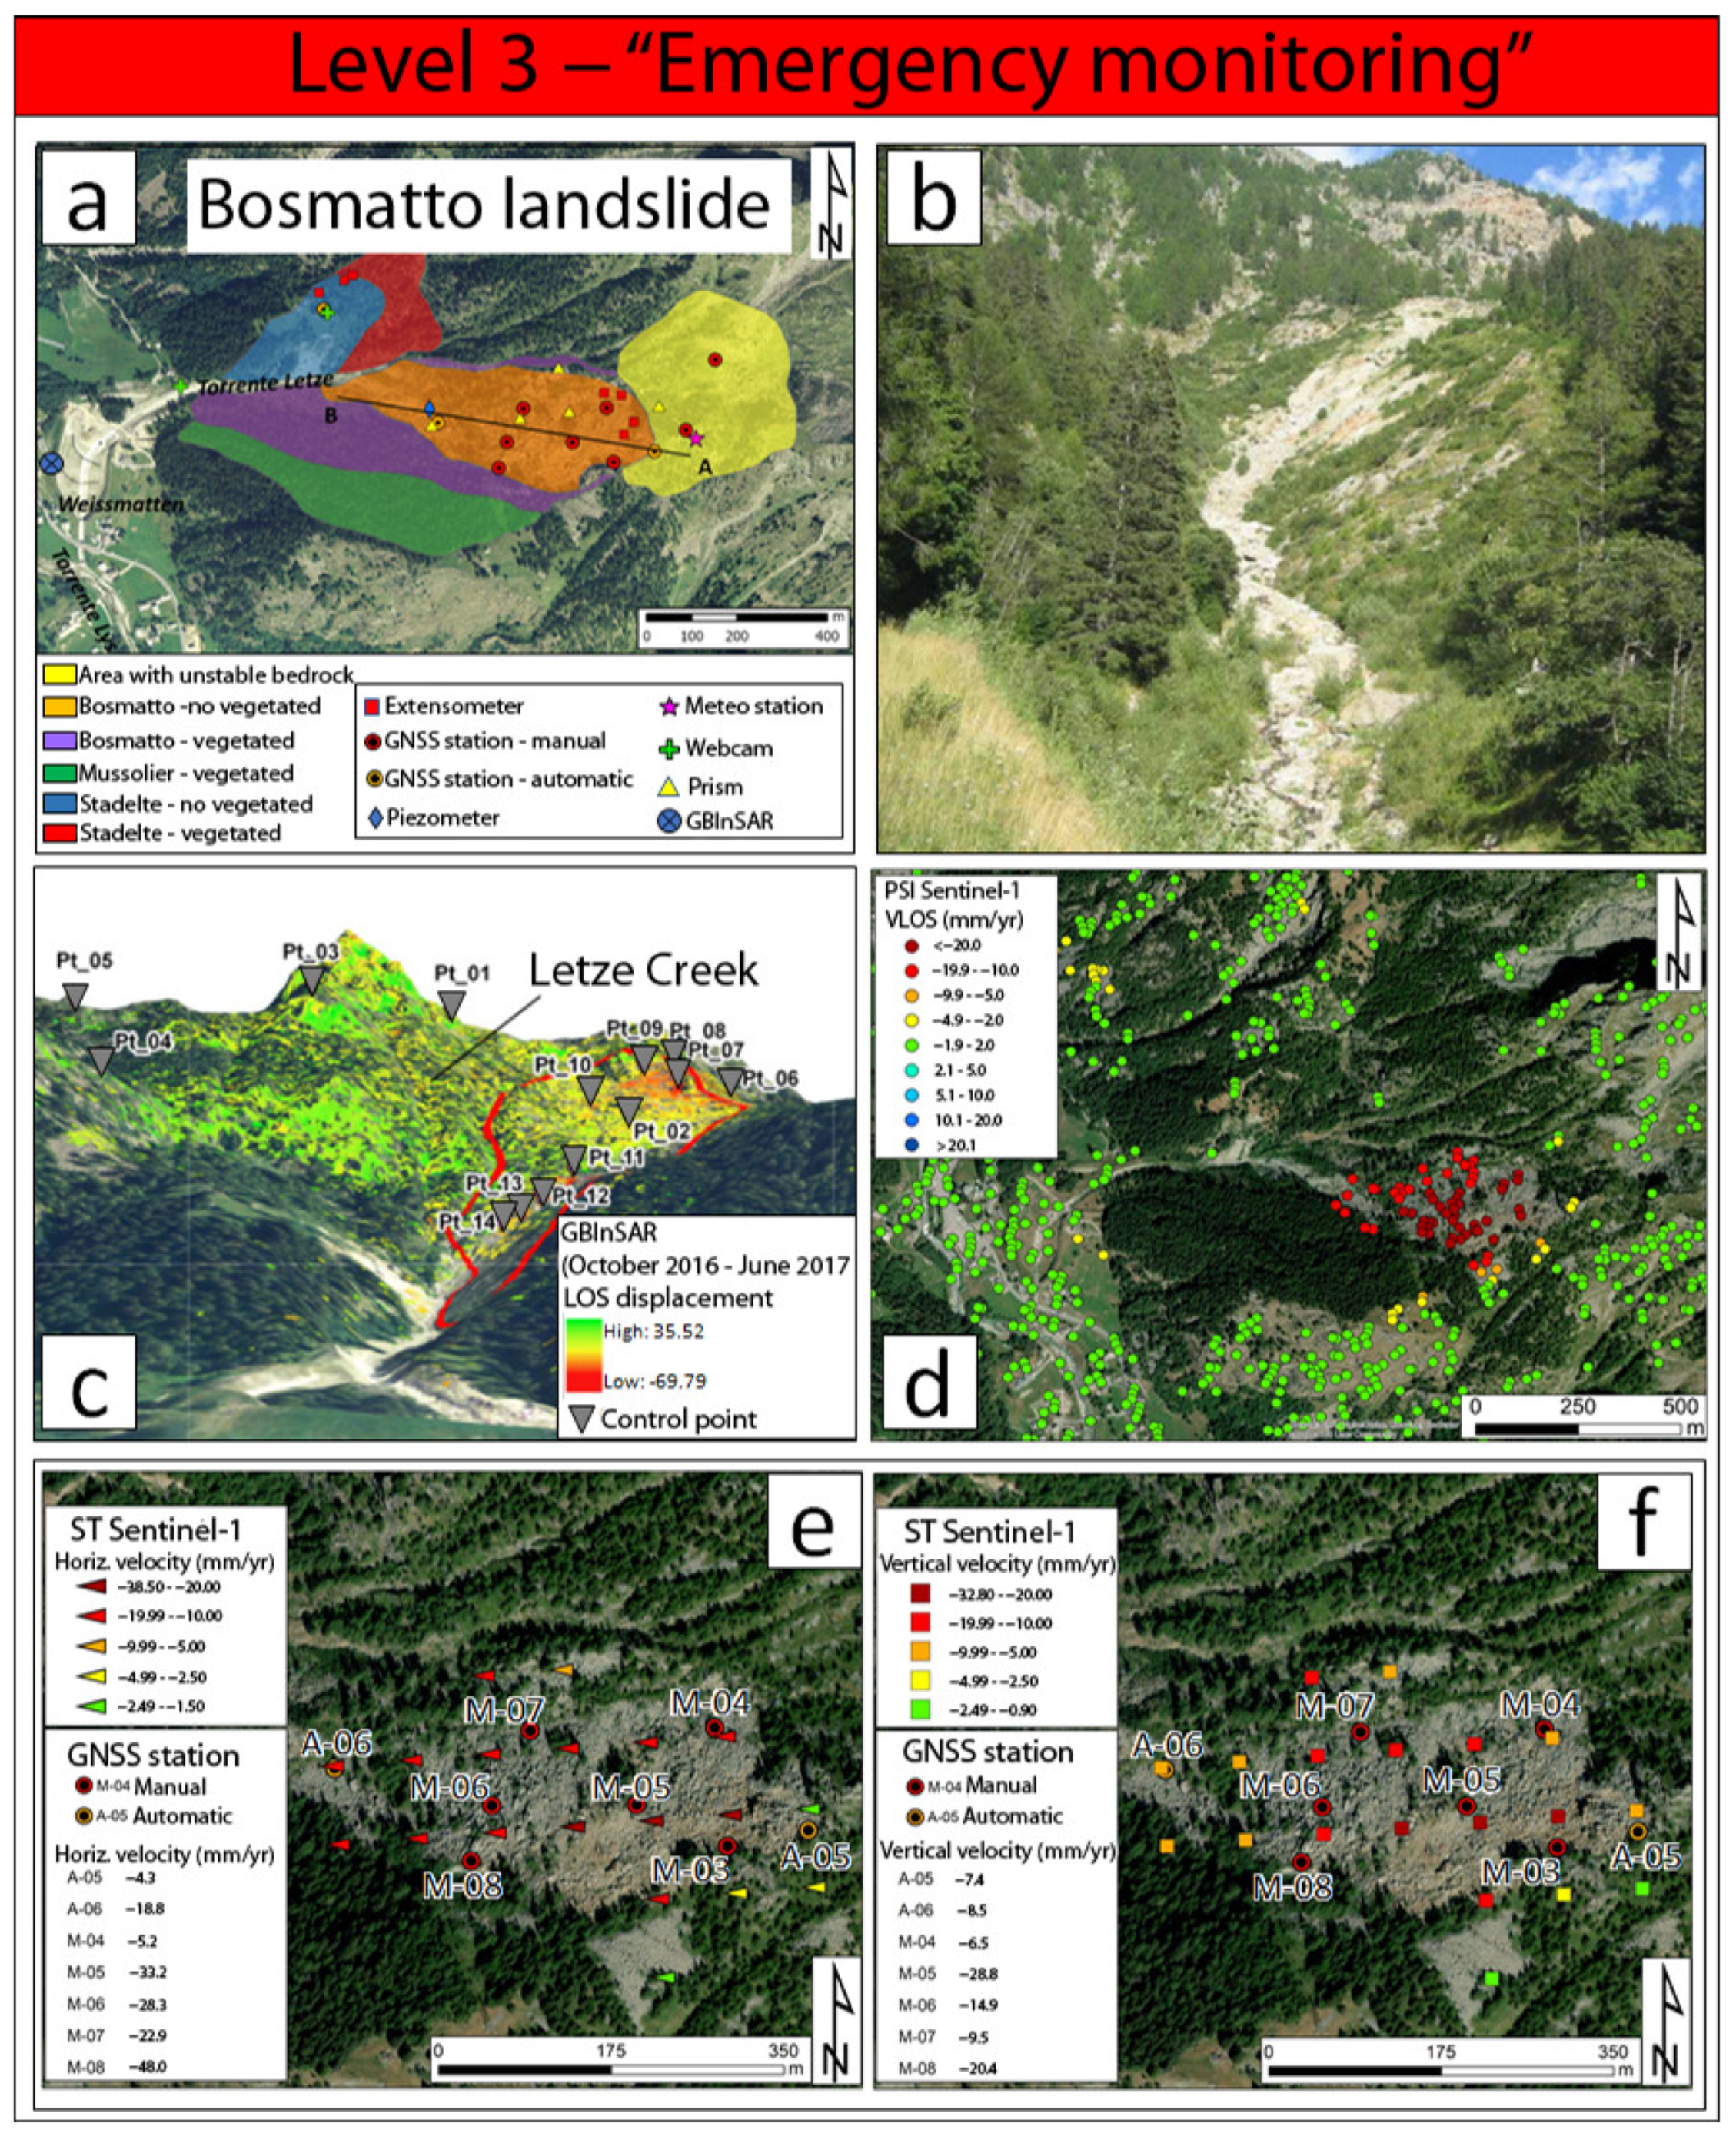
Level 3—“Emergency monitoring”, for early warning of the most hazardous situations:
Emergency monitoring is activated based on the results of the activities carried out at Level 1 and Level 2 when the combination of the unfavorable evolution of the phenomenon and the relevance of the potential losses requires alert and early warning procedures and planning. At this monitoring level, the CPA can undertake further in situ analyses or the planning of “structural” interventions aimed at risk mitigation.
Concerning the monitoring of slope instability, many remote sensing techniques and in situ instruments can be used to this aim, depending on the monitoring level. The exploitation of a given method or technique is, of course, related to the final purposes, the needs, and the expected results of each of the three monitoring levels. Satellite MTInSAR data have demonstrated their best effect in the first level of monitoring (knowledge monitoring), as they allow the screening of the territory at a regional scale [14]. This activity can identify potential landslides, ground motion accelerations, and generate a “priority list” of the most critical situations.
The main gap in exploiting MTInSAR in this phase is the so-called “false positives”. Further validation steps are needed to confirm the satellite information with in situ investigations or other measurements equally accurate. Other tools, i.e., ground-based interferometric radar system (GBInSAR), robotized total stations (RTS), GNSS (Global Navigation Satellite System) stations, or inclinometer (manual or automatic) instruments are useful in level 2 (control monitoring), as they can provide precise and systematic in situ measurements for controlling the temporal evolution of specific ground deformations. At this level, satellite interferometric analysis may still be useful for periodic semi-automated monitoring of the slope kinematics and to detect changes in the ground deformation patterns, as demonstrated by the most recent satellite monitoring services [31]. Moreover, corner reflectors can be regularly employed to extract precise time series of deformation over a single area associated with leveling or GPS measurements [33]. Conversely, the temporal and accuracy requirements make MTInSAR data unsuitable for level 3 (emergency monitoring). In this case, continuous in situ measurements, very frequent remote sensing acquisitions (e.g., GBInSAR), or, in general, real-time data are certainly preferred over satellite-based results.

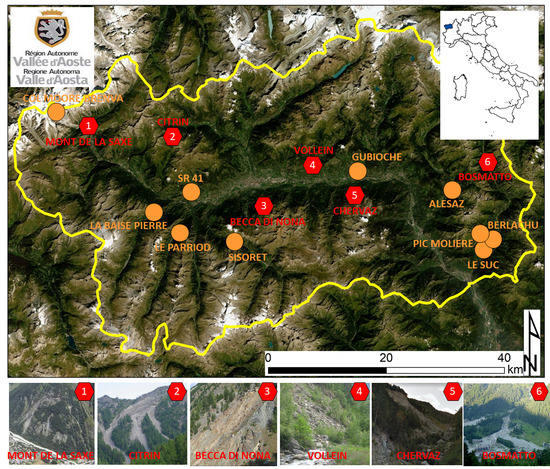
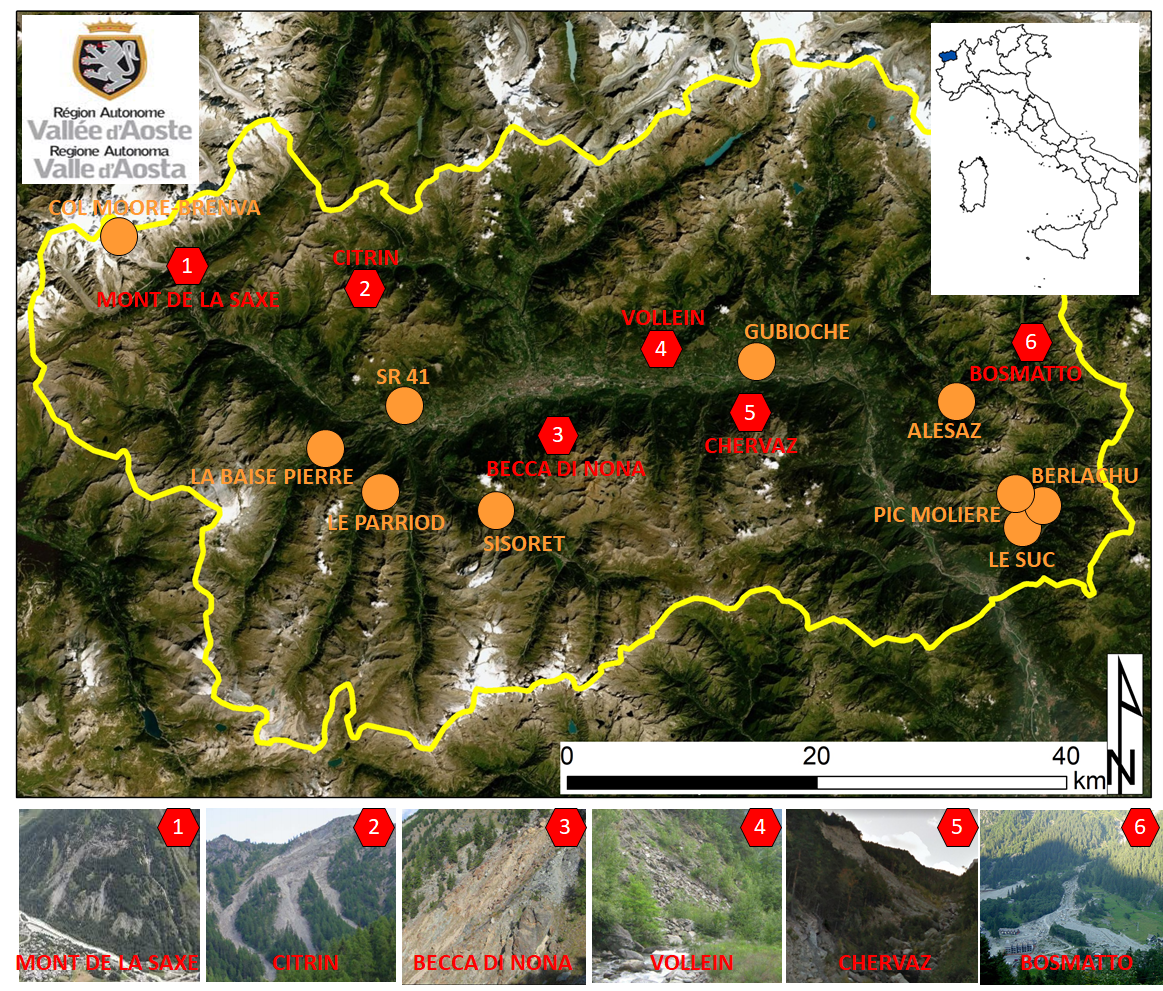
3. The Example from the Valle D’Aosta Region, Italy

Here we introduce a successful example of integrating MTInSAR data in Civil Protection strategies for landslide studies within the Valle D’Aosta monitoring system.
The Valle D’Aosta Region (VAR) is located in the northwestern Italian Alps and extends about 3200 km2. The territory is characterized by a mountainous setting, with high and complex morphology and human settlements located at the bottom of valleys [34]. The VAR is very prone to landslides, mainly due to its high relief energy, mean annual precipitation, and deglaciation [35,36]. Landslides vary in type and size, ranging from slow-moving shallow planar and rotational landslides to fast-moving landslides, such as debris flows, rockfalls, and complex phenomena [28]. Deep-seated gravitational slope deformations (DSGSD) are also well-represented [35].
The Valle D’Aosta regional Civil Protection (VARCP) system is structured according to the Italian laws, and it is based on the first response to emergencies by the municipalities. The regional administration coordinates the response either when the municipalities cannot manage local emergencies or during complex and extended events. In addition, the regional administration oversees the forecast and prevention activities, issuing civil protection warnings (e.g., in the case of meteorological or avalanche hazards).
Geohazard management is a particularly well-developed activity managed by the distributed regional civil protection system. Regarding landslide hazard management, the civil protection system relies on the support provided by the Regional Geological Survey, one of the administrative and technical structures of the VAR. The Regional Geological Survey oversees all the monitoring activities related to active landslides. The other fundamental support is provided by the meteorological and rainfall forecasts issued by the Regional Functional Center, which collects landslide and rockfall inventories. The early warning procedures are codified and approved by the decision of the regional committee n. 26/2014, according to the Directive of the Prime Minister 27 February 2004.
If a new landslide occurs, the VARCP operative center dispatches an alert to the Regional Geological Survey, usually activating a survey whose goal is to estimate the residual risk level. If the residual risk is high, immediate civil protection measures are undertaken, e.g., evacuation procedures or road closing. In some cases, landslides are instrumented. If acceleration is registered, the Regional Geological Survey issues a warning bulletin to the VARCP operative center, simultaneously alerting the municipalities involved who can activate the municipal civil protection procedures.

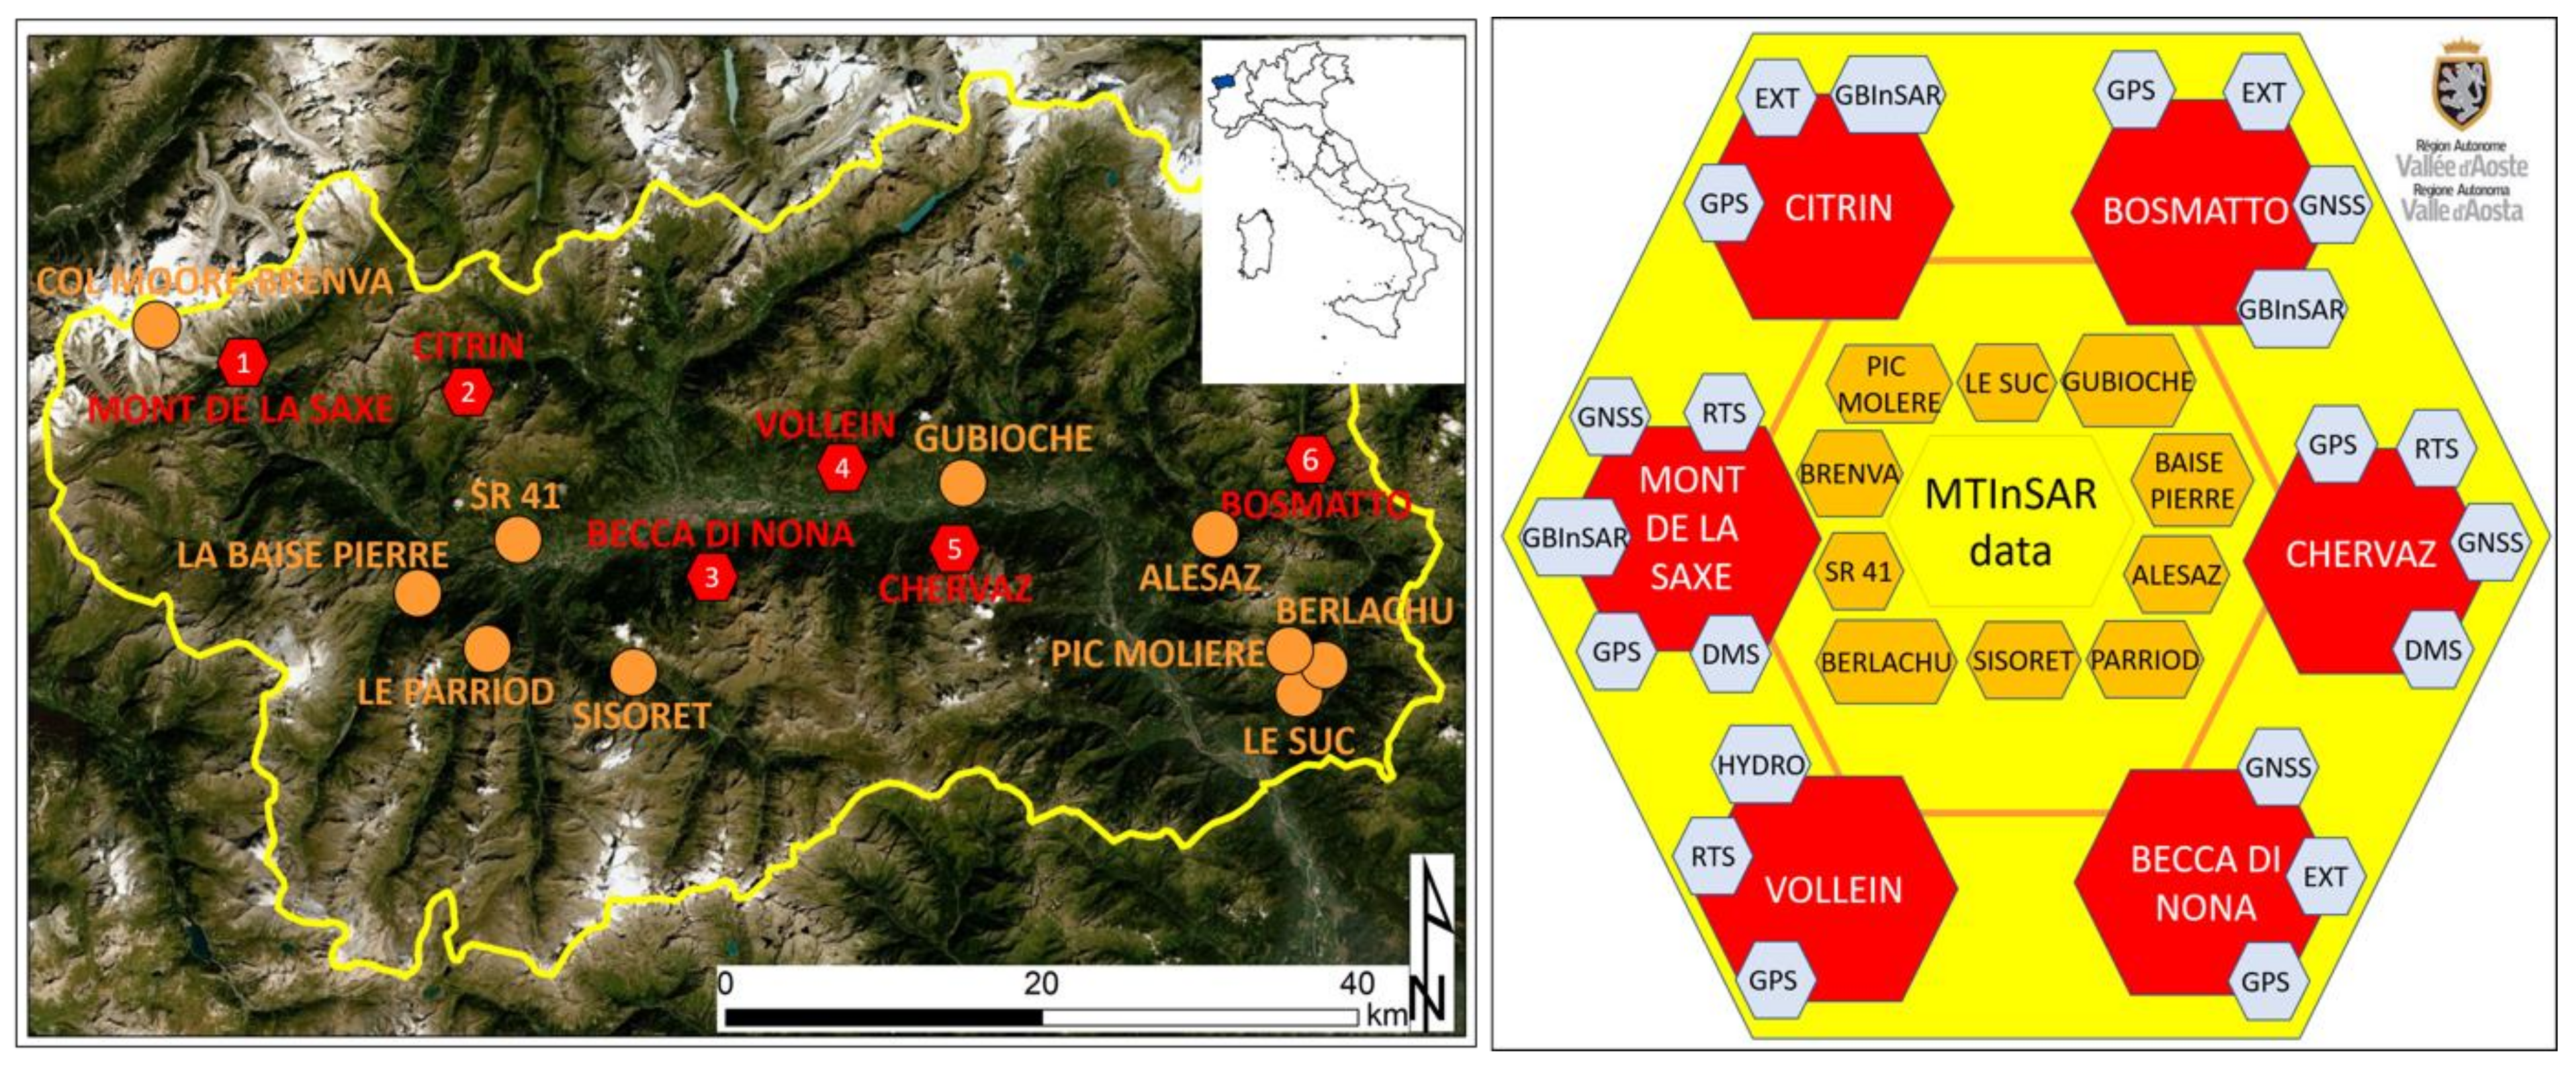
3.1. The Use of MTInSAR Data in VARCP

Due to the number and density of active landslides, VAR has been the target of mapping activities based on InSAR data processed over the entire region. One example can be found in [35]. These authors used ERS and ENIVSAT SAR images processed using the Small Baseline Subset technique (SBAS) to study the surface deformations of the regional territory, focusing on periglacial processes and deep-seated landslides.
The work of [37,38] focused on Sentinel-1-based interferometric results for a semi-automatic hotspot analysis on the whole regional territory. Solari et al. [28] recently exploited MTInSAR Sentinel-1 data for deriving landslide intensity evaluation and assessment of potential damages on the elements at risk.
Nowadays, MTInSAR data derived from the systematic acquisition and processing of Sentinel-1 SAR images in the VAR are implemented in a satellite-based service at a regional scale and are thus completely integrated into the VARCP monitoring network.
The satellite-based service is a continuous regional monitoring service that benefits from Sentinel-1 data, and it has been fully operational since January 2018. This service relies on MTInSAR data and consists of two activities: “PS mapping” and “PS monitoring”. Both PS Mapping and PS monitoring rely on periodically updated deformation maps in ascending and descending orbits generated from the timely processing of Sentinel-1 images using a parallelized SqueeSAR approach [39]. The difference relies on the way data are analyzed in post-processing and are distributed to the end-users.
The “PS mapping” is performed once or twice per year; its goal is to extract a snapshot of the slope movements with the highest velocities. PSI data (PS and DS data) are resampled at a regional scale to select only the measurement points with the highest velocity measured along the satellite Line Of Sight (LOS) by applying a proper threshold. Then, a hotspot methodology is applied to extract the clusters of deformation following a well-established semi-automatic procedure [37]. The PSI clusters, also called ADA (Active Deformation Areas) according to [37,38], can be easily updated with higher temporal frequency. The detection of ADA clusters allows the highlighting of the most relevant long-term active deformational processes on the whole regional territory. The results of this activity are conceived to be useful for landslide mapping, recording new active landslides, and evaluating the motion of the already known ones.
PS monitoring can be considered a near-real-time activity with the main goal of promptly detect “anomalies of ground motion” [31]. In other words, the anomalies of movement correspond to Anomalous Point targets (APs), i.e., PSI radar benchmarks (PS and DS data) that show trend variations in the time series of displacement or abrupt velocity changes in a predefined temporal span (150 days). The APs can evidence the change of the status of a landslide. It is worth noting that there is no automatic alerting system based on the satellite evidence; the AP is always double-checked by MTInSAR experts who decide whether or not the AP is consistent with the geomorphological context and interpret the result. Areas with coherent, spatially significant, and temporally persistent APs potentially related to landslides are reported and notified to the regional authority for on-site validation.
The final stage of on-site investigation requires the regional authority (i.e., the Geological Survey) to assign priorities to the sites according to the products generated by the monitoring service in terms of deformation maps and APs. The products are delivered to the Geological Survey almost twice a month. Hence, the Regional Geological Survey has developed a semi-automated GIS-workflow that uses a cross-analysis of the available local-scale geological, geomorphological hazard, and landslide risk dataset assigns to the AP sites three different priority scores for field investigations: Low, Medium, and High. High-priority of on-site investigations have to be carried out within 7 days, Medium priority within 15 days, while AP sites with Low priority are placed under surveillance and, in the case of AP are detected again within one month; AP is being upgraded to Medium risk priority.
Low-priority requires observational actions, which for instance, can include: (i) data acquisition from geotechnical databases (data from on-site surveys); (ii) inspections with a helicopter; (iii) surveys with drones; (iv) risk scenarios with runout modeling. Medium-priority includes instrumentational actions and alerting strategies: (v) the installation and control of GNSS and other on-site instruments with discontinuous campaigns; (vi) warnings to other involved authorities on the territory if the phenomenon impacts some structures or infrastructure (buildings, railways, highways, etc.). High-priority is assigned if, after the previous actions, real-time monitoring is needed.

3.2. The VARCP Monitoring Network

The VARCP monitoring network structured in the three monitoring levels is shown in Table 1.
Level 1 (knowledge monitoring) of the monitoring system includes remote sensing investigations carried out in deferred time at a regional scale. Level 1 relies on the products generated by the Valle D’Aosta satellite monitoring system and, in particular, on the PS mapping and PS monitoring results [38]. The availability of frequently updated deformation maps and hotspots of deformation over the region is useful for producing a preliminary screening over the regional territory and identifying any potential major threat to undertake the appropriate civil protection activities. In particular, level 1 consists of two phases: phase 1 involves the complete coverage of the territory through PSI data updated every 12 days and the consequent fast detection of new deformation phenomena or increases of the displacement rates in already known areas (PS Monitoring). In addition, this phase allows the detection of the areas characterized by the highest ground motions rates using PS Mapping activity performed once/twice a year. Phase 2 requires a comparison of PSI data from other remote sensed sources, such as (i) photo- and radar-interpretation of the point-wise information derived from PSI benchmarks and from PSI clusters (e.g., to confirm the presence of a landslide [11,14]); (ii) control of possible alterations of the topographic surface (e.g., due to snow presence) by comparison with optical satellite images (e.g., Sentinel-2 data) or webcams; (iii) comparison and integration of PSI data with databases and thematic data such as geological information, landslide databases, susceptibility studies; (iv) the acquisition of InSAR data acquired from other satellites, if available (e.g., very high-resolution X-band SAR products). This activity is remotely performed to validate the AP dataset by the Regional Geological Survey for further local-scale filtering based on assessing the risk level associated with each AP to organize the field investigations.
Level 2 monitoring (control monitoring) is activated once the field investigations have validated the consistency of each AP. This level of monitoring requires a more detailed analysis of the most hazardous situations identified in level 1 (Medium and High priorities, see Section 3.1). At this level, the monitoring system is based on a combination of on-site instruments with discontinuous measurements such as GNSS, ground-based interferometric radar system (GB-InSAR), inclinometers, and robotic total station (RTS) integrated with the results of PS monitoring. The aim of this monitoring level is twofold. On the one side, level 2 acts to validate the results derived from level 1; on the other side, it is fundamental to effectively search for and detect anomalies of movement that suggest landslide accelerations that have to be verified could lead to the activation of the level 3.
Level 3 is dedicated to the real-time monitoring of the single phenomenon and consists of a continuous and real-time in-situ monitoring of the most hazardous and dangerous sites on the territory, e.g., accelerating landslides that could potentially impact inhabited areas, for alert, forecast, and CP purposes to prevent catastrophic natural events. Real-time monitoring is assured using specific instruments, i.e., RTS and GB-InSAR systems, continuous GNSS stations, and Differential Monitoring of Stability (DMS) column systems (Figure 1). At the moment, level 3 is operative for six specific hazardous sites characterized by a high risk for the population; these landslide sites are a priority for the regional CPA and the monitoring systems, which are appropriately designed to ensure full-time reliability and support early warning procedures for dedicated civil protection plans.
This monitoring network is currently applied in Valle D’Aosta Region, and it is graphically represented in Figure 1.
The 12-day delivery assures the screening at the regional scale (level 1—yellow color in Figure 1) of updated deformation maps (including APs) over the whole region.
At the moment, level 2 (orange color in Figure 1) refers to ten situations where hazardous events occurred, and on-site discontinuous monitoring is ongoing. It also refers to new situations progressively pointed out by PS monitoring, i.e., where significant and persistent APs are detected.
Level 3 (red color in Figure 1) includes six active complex landslides (Bosmatto, Chervaz, Vollein, Becca di Nona, Citrin, and Mont de La Saxe landslides) that have led to emergencies in the past and have been the target of the regional entities for a relatively long time. These complex landslides are well-studied from the geological, hydrogeological, and geomorphological points of view. Remote near-real-time systems currently monitor the landslides with continuous measurements and using temporary systems with periodical measures [34]. On these six sites, meteorological and surface deformation data derived from in-situ control instruments are permanently processed and analyzed; there are dedicated Civil Protection plans, which comprise monitoring bulletin and specific early warning strategies. In particular, the used near real-time monitoring instruments include RTS, GNSS stations, extensometers, GBInSAR systems, and DMS. Moreover, for all the six sites, the surface displacement is measured using GPS (Global Positioning System) periodical campaigns. The active movement of these landslides is confirmed by the interferometric products regularly delivered to the regional authorities.
Figure 2 shows the use of MTInSAR data in the first monitoring level: the deformation map is updated every 12 days following the revisiting time of Sentinel-1 constellation. and, once/twice a year, semi-automatic procedures lead to the detection of ADA clusters on the whole regional territory. A velocity threshold of 10 mm/yr was set to resample MTInSAR data and extract the fast-moving ones; at least 3 PS within a buffer area of 100 m were chosen for clustering the moving targets.
Using Sentinel-1 SAR images acquired in the spanning time October 2014–August 2020, a total of 252 ADA, 95 in ascending orbit, and 157 in descending orbit, were retrieved using resampling and clustering analysis (Figure 3). Figure 3 only shows data acquired in descending orbit since they best represented an approximation of the real displacement vector, which is west-oriented and nearly parallel to the satellite descending LOS direction.
From a geographical point of view, the ADA clusters are distributed relatively homogeneous throughout the region. Some areas displayed a density higher than other ones, such as the municipality of Valsavarenche, located in the northeastern part of the region, as shown in Figure 3. In this area, several clusters of PS points, i.e., five ADA in descending geometry, were identified with average velocities between −10 and −60 mm/yr on the slope nearby the Paquier hamlet. These moving areas fall into the boundaries of a mapped DSGSD (Deep-seated Gravitational Slope Deformation), highlighting the fastest areas within this slope phenomenon. The clusters could be related to the motion of shallow landslides (mainly rotational) in addition to the motion of deep-seated complex landslide.
Figure 3 shows the use of PSI data in the second monitoring level in the framework of PS monitoring. In the last one-year satellite monitoring of the region, between September 2019 and August 2020, a total of 431 PSI movement anomalies termed APs were detected (on average, 14 anomalies detected for system update), mainly related to the motion of complex and rotational landslides.
In Figure 3, two examples are presented. The results are shown only for the descending geometry; however, data are also available for the ascending orbit. The descending orbit was the most favorable for the observation of the along-slope component of motion.
The first example is Pic de Molèr, a site uphill of a town in the municipality of Lilianes. The slope of the Pic de Molèr extends up some hundred meters and it is characterized by huge unstable rocky blocks. Nowadays, the area is monitored by periodic photogrammetric and GNSS campaigns and a webcam. On this site, some APs were recorded and notified to the Regional Authority in September 2018. Two rockfalls and one complex landslide were mapped in the regional inventory, and the PSI descending data showed mean annual velocities up to 10 mm/yr. Within the boundaries of the mapped complex phenomenon, some PS/DS benchmarks showed a trend of variation in the displacement of the time series characterized by a velocity change of 30 mm/yr since July 2018. The analysis of the time series of these APs showed a shift in the measurements corresponding to the satellite acquisition on 15 June 2018; this shift in time series could be referred to as a rapid movement that cannot be efficiently measured due to aliasing effects related to the ambiguous nature of satellite observations, i.e., the wrapped interferometric phases [4]. After that event, satellite data did not highlight any other significant movement and recorded negligible displacement variations. GNSS periodic measurements have been carried out on-site (Figure 3) after the occurrence of the detected APs as they cover the period 2019–2021, and they confirmed sub-millimetric displacements.
The second example is the municipality of La Salle, where 34 APs were recognized in the monitoring period. These anomalous targets fall within the upper portion of a rock slope where a rockfall was mapped in the regional landslide inventory. All the anomalies were highlighted in eight consecutive data processing. The last alert was in July 2020. The time series of detected APs presented linear motion with a relevant acceleration event between February and July 2020. Under the geomorphological setting, the temporal and spatial coherence of the measurements suggests that the APs highlighted true acceleration, probably related to snow melting during the spring of 2020. In this case, the motion was not previously known and not monitored but solely highlighted by systematic PS monitoring activity in the territory.
Figure 4 shows an example of the third monitoring level, the use case of the Bosmatto landslide, located in the Gressoney Saint Jean municipality. The landslide was classified as complex and was composed of two sub-bodies that involved both debris and bedrock. Some sectors of the landslide were almost completely vegetated and inactive, whereas the upper part, about 500 m long with 300 m maximum width, was still active and presented a heterogeneous debris cover [40] (Figure 4a,b). In October 2000, a debris flow originated from the blocky sector of the Bosmatto landslide, which occurred after an intense and prolonged rainfall event, running down the slope and causing widespread damage to properties and infrastructure [40].
The Bosmatto landslide monitoring system was set by the VAR authority in 2001. Data were acquired with a variable frequency depending on the monitoring instrument. The monitoring system currently includes (i) GNSS stations for campaign measurements (i.e., manually operated), where readings were undertaken only once or twice a year (from October 2002 to October 2015) due to difficult site accessibility; (ii) two GNSS permanent automatic stations located on the main landslide body: data are acquired four times per day and span from 1 July 2010 to 31 December 2013; (iii) five prisms as topographic benchmarks for yearly measurement of displacement; (iv) three extensometers on the main perimetral fractures on the western part of the landslide and the active upper part of the landslide; (v) a piezometer on the lower part of the moving landslide; (vi) a GBInSAR, installed in 2016 for one year in Weissmatten, on the hydrographic right of the Lys river, with a data acquisition frequency of 2 min. During the monitoring campaign, control points inside and outside the boundaries of the landslide were selected to monitor, in near real-time, the displacement time series of selected sectors of the deformation map (Figure 4c). A webcam and a meteorological station are also present on the site. Ground-based, satellite-based, and GNSS data revealed that the moving area involved the upper portion of the landslide, where the debris deposit was found, and it was registering very high deformation rates, up to 40–50 mm/year in the crown area of the landslide [42].
Even if not directly involved in level 3 on-site monitoring, the results of PS mapping and PS monitoring provide information about the landslide movement. Within the main landslide body, a total number of about 50 radar benchmarks in descending geometry were retrieved in each SAR processing (Figure 4d). Given the west-facing orientation of the slope, movements measured by the satellite in descending orbit were a good approximation of the real displacement, as the ground motion direction was nearly parallel to the LOS direction. By contrast, the data of the ascending geometry strongly underestimated the downslope movement, as they were minimized by the combination of slope topography and recorded LOS movements. PSI descending data confirm that the upper part of the landslide body is still active [42], recording ground motion rates up to 40 mm/yr, in agreement with data from the other monitoring systems.
Moreover, using the interpolation of ascending and descending data, the LOS velocity was computed on Synthetic Targets (ST) and decomposed into its East-West horizontal and vertical components. Considering that the orbit of SAR satellites is polar, it is impossible to estimate the velocity component along the N-S direction on the horizontal plane. These velocity components were compared with horizontal and vertical components of motion recorded by GNSS stations, even if the InSAR data and GNSS measurements cover different temporal spans. GNSS stations and STs were located in nearly the same position (Figure 4e,f), and the general time series trend was comparable since satellite and GNSS targets present minimal discrepancies in displacement rates (<4 mm/y), especially along the vertical component [42].

4. Discussion

An efficient regional monitoring network should include a scaling-up deformation monitoring system. In particular, the monitoring approach currently applied in Valle D’Aosta Region involves three different levels of monitoring (Level 1: knowledge monitoring, Level 2: control monitoring, and Level 3: emergency monitoring), including an interdisciplinary combination of both traditional in-situ data and long-time advanced remotely sensed techniques [35,43].
Multi-temporal InSAR techniques can be extremely useful for CPAs since they provide frequent millimetric ground velocity measurements over wide areas and the density of measurements that cannot be reached with any other remote sensed monitoring tool. Moreover, MTInSAR is nowadays a technique validated by a high number of successful applications, and in many cases, it has been testified as accurate as other sources of ground displacement measurements (e.g., GNSS). For these reasons, the agencies in charge of the hydrogeological risk management in Valle d’Aosta implemented Sentinel-1-derived interferometric products as part of operational tools within regional CPA procedures.
In particular, MTInSAR data are used in the knowledge monitoring stage to preliminary evaluate the deformation scenario at the regional level. From the CPA perspective, this screening activity has the advantage of providing regularly updated estimates of terrain deformation at relatively low cost on large areas where in situ data cannot be acquired for different reasons, which implies a reduction in human efforts in terms of ground surveys and can allow the a priori detection of the most moving areas where to allocate additional resources. Moreover, PSI data can provide ground motion velocity measurements with great accuracy in all climatic conditions and good temporal sampling. Good temporal data frequencies are now possible owing to the short revisiting time of Sentinel-1.
Nevertheless, MTInSAR techniques show up some constraints to be considered and appropriately weighted by the users for Civil protection purposes. An important limit of satellite InSAR is related to it having LOS measurement capability solely. Space-borne InSAR only measures displacement in the slant range (i.e., the displacement in the direction of the radar illumination). The component of the velocity vector in the flight direction (i.e., N–S direction since the satellite has a near-polar orbit and a side-looking acquisition) cannot be measured. Moreover, a significant drawback of the MTInSAR technique in effectively monitoring displacements is the limitation in measuring “fast” deformations due to the satellite acquisition parameters so that only slow-moving phenomena can be detected (e.g., it is not applicable to rock avalanches or debris flow). Considering 6 days of Sentinel-1 data, this limit was set to ~2 mm/day.
In addition, all the limitations related to the land cover and to the geometrical distortions due to the viewing geometry have to be considered in this mountain environment. Densely vegetated zones prevent coherent radar scatterers from being identified. The impact of the seasonal snow cover also influences the reliability of the interferometric acquisitions over such a high alpine environment. Radar signal backscattering and interferometric processing can be substantially modified due to snow surface melt, snowfall, and snowdrift since these features can lead to SAR temporal decorrelations [44]. For these reasons, the VAR satellite monitoring system is not entirely automated, and data interpretation and validation represent an important part of the workflow. Local ground displacement patterns and their variability recorded by moving PSI targets can be related not only to landslide processes but also to other local phenomena (e.g., settlement of distressed buildings and structures, local subsidence, soil erosion, etc.) so that a comprehensive radar interpretation and comparison with other data sources (phase 2 of Level 1) are necessary.
It is worth highlighting that radar scatterers detected on the ground provided point-like data seldom distributed homogeneously over the whole mass movement to be studied. For instance, over the rock slope within the municipality of La Salle presented in Figure 4, PSI data provided information just on the upper portion of the mapped phenomenon. Then, efficient integration and combination with all the available thematic data and other information sources are needed to extend the point-wise information provided by the radar benchmarks.
Moreover, robust data validation must be accomplished in the control monitoring phase, which is dedicated to identifying ongoing critical situations where follow-up studies must be carried out. Surveys and in situ data are usually needed to discriminate the exact cause of slow-moving ground deformations identified by InSAR products. Throughout the continuous PS monitoring service, PSI data are useful for identifying trend variations of terrain motion; however, they can also reveal the presence of “false positives”, due to, for example, residual atmospheric artifacts or phase unwrapping errors, that need to be filtered out before the distribution of the data to the final users (in this case, the regional geological survey). In order to minimize uncertainties and false alarms, the validity of InSAR analyses must be supervised by an accurate radar interpretation [11] and by an integrated monitoring network implemented with other remote sensing and background datasets. The knowledge of the territory is fundamental, so the support of local authorities is essential for validating the interferometric results and better understanding the triggering factors of ground movements. Field surveys should be carried out to confirm and improve the information obtained by radar interpretation, e.g., to check the geomorphological features induced by ground instability or verify cracks on roads or buildings. When the satellite radar data are confirmed by other or more independent measurements or by some kind of field evidence, the management authority has the confirmation that something is happening, and further actions can be undertaken. Thus, the MTInSAR technique is certainly not a stand-alone tool, but it must be considered an added value for studying slope instability over wide areas into a holistic approach to the landslide hazard management activities.
At the emergency monitoring level, the most hazardous sites were selected, and continuous in-situ monitoring is being put in place. In this phase, the PSI data cannot contribute to real-time analysis due to too low data frequency and accuracy. However, if the radar visibility of the slope is suitable, they can be exploited to confirm the areas characterized by active slow-moving deformations, detected by different tools (e.g., GNSS, GBInSAR data), as seen in the Bosmatto landslide. An advantage in exploring MTInSAR at this level is the availability of contactless data that permits the analysis of recent and also past displacement, dating back many years. As a result, interferometric data within the “emergency monitoring” level mainly work as ancillary and supporting products useful for an overall comparison and confirmation with other data derived from in situ instruments.
An overview of the pro and cons mentioned above of MTInSAR applicability in the different levels of the optimal monitoring network is synthesized in Table 2.

5. Conclusions

This work presents an overview of best practices for landslide monitoring and early warning systems employing satellite remote sensing techniques. This procedural integration of the MTInSAR products in CPA strategies is still quite novel. It allows supporting disaster risk management, moving these products from tools for the scientific community to operational tools to meet the needs of local and regional organizations. Three different monitoring levels were proposed—knowledge monitoring, control monitoring, and emergency monitoring—to provide a well-organized framework and set the effective role of MTInSAR data at each level.
For compensating the technical constraints, MTInSAR-based monitoring has to be integrated with other networks to be structured in different levels of detail and analysis, giving the various instruments and tools a specific role in a given data monitoring phase. The Valle D’Aosta regional monitoring system presented in this paper is a very good example of integrating different ground motion measurement tools working at different scales. To our knowledge, the Valle D’Aosta integrated procedure is one of the few examples of this kind around Europe. From the shown VARCP example, it is evident that MTInSAR provides a great opportunity to improve the monitoring capabilities in CPA activities.

Author Contributions

Conceptualization, S.B. and L.S.; methodology, S.B.; data curation, L.S., D.B., and P.T.; writing—original draft preparation, S.B.; writing—review and editing, L.S., D.B., P.T., and F.C.; supervision, F.C. All authors have read and agreed to the published version of the manuscript.

Funding

This work has been funded by the European Commission Directorate-General Humanitarian Aid and Civil Protection (ECHO) through the U-GEOHAZ–Geohazard Impact Assessment for Urban Areas project, grant agreement No. 783169.

Institutional Review Board Statement

Not applicable.

Informed Consent Statement

Not applicable.

Data Availability Statement

The statemnet could be excluded.

Acknowledgments

All of the Sentinel-1 SAR images were processed by TRE ALTAMIRA srl, using the SqueeSAR technique. The Valle D’Aosta Regional Authority provided the landslide inventory map.

Conflicts of Interest

The authors declare no conflict of interest.

References

  1. Solari, L.; Del Soldato, M.; Raspini, F.; Barra, A.; Bianchini, S.; Confuorto, P.; Casagli, N.; Crosetto, M. Review of satellite interferometry for landslide detection in Italy. Remote Sens. 2020, 12, 1351. [Google Scholar] [CrossRef]
  2. Wasowski, J.; Bovenga, F. Investigating landslides and unstable slopes with satellite Multi Temporal Interferometry: Current issues and future perspectives. Eng. Geol. 2014, 174, 103–138. [Google Scholar] [CrossRef]
  3. Raspini, F.; Bardi, F.; Bianchini, S.; Ciampalini, A.; Del Ventisette, C.; Farina, P.; Ferrigno, F.; Solari, L.; Casagli, N. The contribution of satellite SAR-derived displacement measurements in landslide risk management practices. Nat. Hazards 2017, 86, 327–351. [Google Scholar] [CrossRef]
  4. Crosetto, M.; Monserrat, O.; Cuevas-González, M.; Devanthéry, N.; Crippa, B. 2016. Persistent scatterer interferometry: A review. ISPRS J. Photogramm. Remote Sens. 2016, 115, 78–89. [Google Scholar] [CrossRef] [Green Version]
  5. Cruden, D.M.; Varnes, D.J. Landslide types and processes. In Landslides: Investigation and Mitigation, Special Report 247, Transportation Research Board; Turner, A.K., Schuster, R.L., Eds.; National Research Council; National Academy Press: Washington, DC, USA, 1996; pp. 36–75. [Google Scholar]
  6. Crosetto, M.; Solari, L.; Mróz, M.; Balasis-Levinsen, J.; Casagli, N.; Frei, M.; Oyen, A.; Moldestad, D.A.; Bateson, L.; Guerrieri, L.; et al. The Evolution of Wide-Area DInSAR: From Regional and National Services to the European Ground Motion Service. Remote Sens. 2020, 12, 2043. [Google Scholar] [CrossRef]
  7. Ciampalini, A.; Raspini, F.; Lagomarsino, D.; Catani, F.; Casagli, N. Landslide susceptibility map refinement using PSInSAR data. Remote Sens. Environ. 2016, 184, 302–315. [Google Scholar] [CrossRef]
  8. Del Soldato, M.; Solari, L.; Raspini, F.; Bianchini, S.; Ciampalini, A.; Montalti, R.; Ferretti, A.; Pellegrineschi, V.; Casagli, N. Monitoring ground instabilities using SAR satellite data: A practical approach. ISPRS Int. J. Geoinf. 2019, 8, 307. [Google Scholar] [CrossRef] [Green Version]
  9. Canuti, P.; Casagli, N.; Catani, F.; Falorni, G.; Farina, P. Integration of remote sensing techniques in different stages of landslide response. In Progress in Landslide Science; Sassa, K., Fukuoka, H., Wang, F., Wang, G., Eds.; Springer: Berlin/Heidelberg, Germany, 2007; pp. 251–260. [Google Scholar]
  10. Corsini, A.; Farina, P.; Antonello, G.; Barbieri, M.; Casagli, N.; Coren, F.; Guerri, L.; Ronchetti, F.; Sterzai, P.; Tarchi, D. Space-borne and ground-based SAR interferometry as tools for landslide hazard management in civil protection. Int. J. Remote Sens. 2006, 27, 2351–2369. [Google Scholar] [CrossRef]
  11. Farina, P.; Colombo, D.; Fumagalli, A.; Marks, F.; Moretti, S. Permanent Scatterers for landslide investigations outcomes from the ESA-SLAM project. Eng. Geol. 2006, 88, 200–217. [Google Scholar] [CrossRef]
  12. Pagliara, P.; Basile, G.; Cara, P.; Corazza, A.; Duro, A.; Manfrè, B.; Onori, R.; Proietti, C.; Sansone, V. Integration of earth observation and ground-based HR data in the civil protection emergency cycle: The case of the DORIS project. In Mathematics of Planet Earth, Lecture Notes in Earth System Science; Pardo-Igúzquiza, E., Guardiola-Albert, C., Heredia, J., Moreno-Merino, L., Durán, J.J., Vargas-Guzmán, J.A., Eds.; Springer: Berlin/Heidelberg, Germany, 2014; pp. 263–266. [Google Scholar]
  13. Antonielli, B.; Mazzanti, P.; Rocca, A.; Bozzano, F.; Dei Cas, L. A-DInSAR Performance for Updating Landslide Inventory in Mountain Areas: An Example from Lombardy Region (Italy). Geosciences 2019, 9, 364. [Google Scholar] [CrossRef] [Green Version]
  14. Bianchini, S.; Cigna, F.; Righini, G.; Proietti, C.; Casagli, N. Landslide hotspot mapping by means of persistent scatterer interferometry. Environ. Earth Sci. 2012, 67, 1155–1172. [Google Scholar] [CrossRef]
  15. Bozzano, F.; Mazzanti, P.; Perissin, D.; Rocca, A.; De Pari, P.; Discenza, M.E. Basin scale assessment of landslides geomorphological setting by advanced InSAR analysis. Remote Sens. 2017, 9, 267. [Google Scholar] [CrossRef] [Green Version]
  16. Cigna, F.; Bianchini, S.; Casagli, N. How to assess landslide activity and intensity with Persistent Scatterer Interferometry (PSI): The PSI-based matrix approach. Landslides 2013, 10, 267–283. [Google Scholar] [CrossRef] [Green Version]
  17. Meisina, C.; Notti, D.; Zucca, F.; Ceriani, M.; Colombo, A.; Poggi, F.; Roccati, A.; Zaccone, A. The use of PSInSAR™ and SqueeSAR™ techniques for updating landslide inventories. In Landslide Science and Practice; Margottini, C., Sassa, K., Canuti, P., Eds.; Springer: Berlin/Heidelberg, Germany, 2017; pp. 81–87. [Google Scholar]
  18. Oommen, T.; Escobar-Wolf, R. Mapping of slow landslides on the Palos Verdes Peninsula using the California landslide inventory and persistent scatterer interferometry. Landslides 2018, 15, 439–452. [Google Scholar]
  19. Strozzi, T.; Klimeš, J.; Frey, H.; Caduff, R.; Huggel, C.; Wegmüller, U.; Rapre, A.C. Satellite SAR interferometry for the improved assessment of the state of activity of landslides: A case study from the Cordilleras of Peru. Remote Sens. Environ. 2018, 217, 111–125. [Google Scholar] [CrossRef] [Green Version]
  20. Zhang, Y.; Meng, X.; Jordan, C.; Novellino, A.; Dijkstra, T.; Chen, G. Investigating slow-moving landslides in the Zhouqu region of China using InSAR time series. Landslides 2018, 15, 1299–1315. [Google Scholar] [CrossRef]
  21. Confuorto, P.; Di Martire, D.; Centolanza, G.; Iglesias, R.; Mallorqui, J.J.; Novellino, A.; Plank, S.; Ramondini, M.; Thuro, K.; Calcaterra, D. Post-failure evolution analysis of a rainfall-triggered landslide by multi-temporal interferometry SAR approaches integrated with geotechnical analysis. Remote Sens. Environ. 2017, 188, 51–72. [Google Scholar] [CrossRef]
  22. Greif, V.; Vlcko, J. Monitoring of post-failure landslide deformation by the PS-InSAR technique at Lubietova in Central Slovakia. Environ. Earth Sci. 2012, 66, 1585–1595. [Google Scholar] [CrossRef]
  23. Liu, P.; Li, Z.; Hoey, T.; Kincal, C.; Zhang, J.; Zeng, Q.; Muller, J.P. Using advanced InSAR time series techniques to monitor landslide movements in Badong of the Three Gorges region, China. Int. Appl. Earth Obs. Geoinf. 2013, 21, 253–264. [Google Scholar] [CrossRef]
  24. Oliveira, S.C.; Zêzere, J.L.; Catalão, J.; Nico, G. The contribution of PSInSAR interferometry to landslide hazard in weak rock-dominated areas. Landslides 2015, 12, 703–719. [Google Scholar] [CrossRef]
  25. Bardi, F.; Frodella, W.; Ciampalini, A.; Bianchini, S.; Del Ventisette, C.; Gigli, G.; Fanti, R.; Moretti, S.; Basile, G.; Casagli, N. Integration between ground based and satellite SAR data in landslide mapping: The San Fratello case study. Geomorphology 2014, 223, 45–60. [Google Scholar] [CrossRef]
  26. Bovenga, F.; Pasquariello, G.; Pellicani, R.; Refice, A.; Spilotro, G. Landslide monitoring for risk mitigation by using corner reflector and satellite SAR interferometry: The large landslide of Carlantino (Italy). Catena 2017, 151, 49–62. [Google Scholar] [CrossRef]
  27. Ciampalini, A.; Bardi, F.; Bianchini, S.; Frodella, W.; Del Ventisette, C.; Moretti, S.; Casagli, N. Analysis of building deformation in landslide area using multisensor PSInSAR™ technique. Int. J. Appl. Earth Obs. Geoinf. 2014, 33, 166–180. [Google Scholar] [CrossRef] [PubMed]
  28. Solari, L.; Bianchini, S.; Franceschini, R.; Barra, A.; Monserrat, O.; Thuegaz, P.; Bertolo, D.; Crosetto, M.; Catani, F. Satellite interferometric data for landslide intensity evaluation in mountainous regions. Int. J. Appl. Earth Obs. Geoinf. 2020, 87, 102028. [Google Scholar] [CrossRef]
  29. Mateos, R.M.; López-Vinielles, J.; Poyiadji, E.; Tsagkas, D.; Sheehy, M.; Hadjicharalambous, K.; Liscák, P.; Podolski, L.; Laskowicz, I.; Iadanza, C.; et al. Integration of landslide hazard into urban planning across Europe. Landsc. Urban Plan. 2020, 196, 103740. [Google Scholar] [CrossRef]
  30. Bianchini, S.; Raspini, F.; Solari, L.; Del Soldato, M.; Ciampalini, A.; Rosi, A.; Casagli, N. From picture to movie: Twenty years of ground deformation recording over Tuscany region (Italy) with satellite InSAR. Front. Earth Sci. 2018, 6, 177. [Google Scholar] [CrossRef] [Green Version]
  31. Raspini, F.; Bianchini, S.; Ciampalini, A.; Del Soldato, M.; Solari, L.; Novali, F.; Del Conte, S.; Rucci, A.; Ferretti, A.; Casagli, N. Continuous, semi-automatic monitoring of ground deformation using Sentinel-1 satellites. Sci. Rep. 2018, 8, 1–11. [Google Scholar] [CrossRef] [Green Version]
  32. Tomás, R.; Pagán, J.I.; Navarro, J.A.; Cano, M.; Pastor, J.L.; Riquelme, A.; Cuevas-González, M.; Crosetto, M.; Barra, A.; Monserrat, O.; et al. Semi-Automatic Identification and Pre-Screening of Geological–Geotechnical Deformational Processes Using Persistent Scatterer Interferometry Datasets. Remote Sens. 2019, 11, 1675. [Google Scholar] [CrossRef] [Green Version]
  33. Dehls, J.F.; Lauknes, T.R.; Larsen, Y.; Hermanns, R.L. Operational Use of InSAR Corner Reflectors (CR) for Landslide Hazard and Risk Assessment in Norway Using Sentinel-1 and Radarsat-2. In Proceedings of the American Geophysical Union Fall Meeting, Washington, DC, USA, 10–14 December 2018. [Google Scholar]
  34. Giordan, D.; Cignetti, M.; Wrzesniak, A.; Allasia, P.; Bertolo, D. Operative Monographies: Development of a New Tool for the Effective Management of Landslide Risks. Geosciences 2018, 8, 485. [Google Scholar] [CrossRef] [Green Version]
  35. Cignetti, M.; Manconi, A.; Manunta, M.; Giordan, D.; De Luca, C.; Allasia, P.; Ardizzone, F. Taking Advantage of the Esa G-Pod Service to Study Ground Deformation Processes in High Mountain Areas: A Valle d’Aosta Case Study, Northern Italy. Remote Sens. 2016, 8, 852. [Google Scholar] [CrossRef] [Green Version]
  36. Salvatici, T.; Tofani, V.; Rossi, G.; D’Ambrosio, M.; Tacconi Stefanelli, C.; Masi, E.B.; Rosi, A.; Pazzi, V.; Vannocci, P.; Petrolo, M.; et al. Application of a physically based model to forecast shallow landslides at a regional scale. Nat. Hazards Earth Syst. Sci. 2018, 18, 1919–1935. [Google Scholar] [CrossRef] [Green Version]
  37. Barra, A.; Solari, L.; Béjar-Pizarro, M.; Monserrat, O.; Bianchini, S.; Herrera, G.; Crosetto, M.; Sarro, R.; González-Alonso, E.; Mateos, R.M.; et al. A methodology to detect and update active deformation areas based on sentinel-1 SAR images. Remote Sens. 2017, 9, 1002. [Google Scholar] [CrossRef] [Green Version]
  38. Solari, L.; Barra, A.; Herrera, G.; Bianchini, S.; Monserrat, O.; Béjar-Pizarro, M.; Crosetto, M.; Sarro, R.; Moretti, S. Fast detection of ground motions on vulnerable elements using Sentinel-1 InSAR data. Geomat. Nat. Hazards Risk 2018, 9, 152–174. [Google Scholar] [CrossRef] [Green Version]
  39. Ferretti, A.; Fumagalli, A.; Novali, F.; Prati, C.; Rocca, F.; Rucci, A. A new algorithm for processing interferometric data-stacks: SqueeSAR. IEEE Trans Geosci. Remote Sens. 2011, 49, 3460–3470. [Google Scholar] [CrossRef]
  40. Luino, F. Sequence of instability processes triggered by heavy rainfall in the northern Italy. Geomorphology 2005, 66, 13–39. [Google Scholar] [CrossRef]
  41. Valle D’Aosta Regional Authority. Relazione di Commento ai Dati di Monitoraggio Della Frana di Bosmatto in Comune di Gressoney-Saint-Jean. Periodo: 01 January 2011–31 December 2011. Available online: www.regione.vda.it (accessed on 23 February 2021).
  42. Carlà, T.; Tofani, V.; Lombardi, L.; Raspini, F.; Bianchini, S.; Bertolo, D.; Thuegaz, P.; Casagli, N. Combination of GNSS, satellite InSAR, and GBInSAR remote sensing monitoring to improve the understanding of a large landslide in high alpine environment. Geomorphology 2019, 335, 62–75. [Google Scholar] [CrossRef]
  43. Barla, G.B.; Antolini, F.; Barla, M.; Mensi, E.; Piovano, G. Monitoring of the Beauregard landslide (Aosta Valley, Italy) using advanced and conventional techniques. Eng. Geol. 2010, 116, 218–235. [Google Scholar]
  44. Rott, H.; Nagler, T.; Scheiber, R. Snow mass retrieval by means of SAR interferometry. In Proceedings of the FRINGE 2003 Workshop, Frascati, Italy, 1–5 December 2003; pp. 1–6. [Google Scholar]
Figure 1. Locations of the landslide cases currently monitored in the Valle D’Aosta Region (VAR), colored according to the levels shown in Figure 1 (Left).Setting of the monitoring network in VARCP according to levels shown in Figure 1 (Right).
Remotesensing 13 01881 g001
Figure 2. Level 1—“Knowledge monitoring”: Concept of “PS mapping” activity (top-left box); distribution of Persistent Scatterer Interferometry (PSI) clusters named as Active Deformation Areas (ADA) for October 2014–August 2020 over the VAR (top-right box); example of PSI ADA clusters whose location is shown in the up-right box (lower box).
Remotesensing 13 01881 g002
Figure 3. Level 2—“Control monitoring”: Concept of ”PS monitoring” (top-left box); Distribution of Anomalous Point targets (APs) in 2019–2020 within PS monitoring activity over the VAR (top-right box); two examples of APs, locations labeled (1) and (2), are shown in the top-right box (lower boxes).
Remotesensing 13 01881 g003
Figure 4. Level 3—“Emergency monitoring”: Bosmatto landslide: (a) geological map and location of instruments on the landslide; (b) photo of the Landslide from [41]; (c) ground-based interferometric radar system (GBInSAR) displacement data on the landslide; (d) Sentinel-1 PSI descending data on the landslide; (e) horizontal component of velocity of Synthetic Targets derived from PSI data and horizontal velocity recorded by global navigation satellite (GNSS) stations; (f) vertical component of velocity of Synthetic Targets derived from PSI data and vertical velocity recorded by GNSS stations.
Remotesensing 13 01881 g004
Table 1. Scheme of the three monitoring levels and related actions in the monitoring network in the Valle D’Aosta regional Civil Protection (VARCP).
Level 1Level 2Level 3
RegionalLocalLocal
Near-real time
+ Deferred time
Near-real timeReal Time
Remote sensingRemote sensing
+ on site discontinuous
on site continuous
12 days + twice/year12 days + periodic updatecontinuous
  • PSI
(«PS mapping» + «PS monitoring»)
  • PSI anomalies («PS monitoring»)
  • GNSS discontinuous
  • GBInSAR discontinuos
  • Inclinometers
  • RTS
  • GNSS continuous
  • GBInSAR continuous
  • GPS
  • DMS
  • RTS
  • Preliminary screening (new deformations and acceleration of existing phenomena)
  • Environmental planning
  • Investigation of potentially critical situations
  • Validation of data from Level 1
  • Potential upgrade to level 3
  • Alert and monitoring
  • Civil Protection
Remotesensing 13 01881 i001 Remotesensing 13 01881 i001 Remotesensing 13 01881 i001
Phase 1: Identification of PSI clustersPhase 2: Remote double check + On-site control validationDefinition of further monitoring and/or remediation activitiesSpecific hazardous sites under continuous early warning monitoring
Table 2. Scheme of the pro and cons of Multi-Temporal Satellite Interferometry (MTInSAR) applicability at each monitoring level.
Monitoring LevelPSI ApplicationPro/UsefulnessCons/Limitations
1. Knowledge Large area coverageLand cover
Deferred time
Mapping
Low costViewing angle
2. Control Frequent updateMagnitude of motion
Near real-time
Monitoring
Trend variation alertNeed of validation
3. Emergency Contactless dataLow data frequency
Comparison with
other data
Back analysisLow local precision
Publisher’s Note: MDPI stays neutral with regard to jurisdictional claims in published maps and institutional affiliations.

