1. Introduction
Rockfalls are mass wasting phenomena, commonly characterized by very/extremely rapid velocities. They are commonly triggered by severe rainfalls or earthquakes on steep slopes [
1,
2]. In the case of “fragmental” rockfall [
3], only a limited number of blocks, with volumes up to few hundreds of thousands of cubic meters, move downslope with little mutual interactions [
3,
4]. In these events, weathering may play a relevant role as a causal factor. Due to their peculiar characteristics, fragmental rockfalls are quite unpredictable and pose a notable risk, especially to communication routes, villages and dwellings, engineering structures (e.g., open pit mines, dams), and other sites of interest (e.g., archaeological, historical, or religious sites) [
5]. These types of events can be very dangerous even when involving small blocks, and usually show a combination of elementary types of movement (free fall, bounce, roll, slide). Although most historical events have involved only small volumes of material, rockfalls represent the main cause of landslide-related fatalities in Spain and Italy [
6].
One of the most important tools to evaluate rockfall-prone areas is numerical modelling. Models are based mainly on survey data and evidence from field observations [
7]. Several empirical or semi-empirical approaches to rockfall risk mitigation can be found in the literature, focusing either on geomorphological evaluations of source and talus areas and on distribution of outlier blocks, or on probabilistic analyses of failures, or on statistical analyses of block trajectories [
8,
9,
10,
11,
12,
13]. Among the approaches assessing the probability of rock failure, the Rockfall Hazard Rating System (RHRS) [
14], the Rockfall risk Management method [
15], and the Evolving Rockfall Hazard Assessment procedure [
16] are commonly employed. Moreover, rockfall trajectories are generally simulated by a number of 3D models, such as STONE [
8], HY-STONE [
17], Rockyfor3D [
18], and RocPro3D [
19]. These models make use of prefixed distributions of source areas, and allow them to run simulations over high-resolution digital elevation models (DEM) [
20].
In other studies [
21,
22,
23,
24,
25], the rebound heights of rock blocks and related kinetic energies were determined through simulations of the trajectories, followed by the boulders, for designing protective measures. In these studies, which are aimed at quantitatively assessing rockfall hazard, the size of the fragments is among the most crucial parameters to be considered [
4,
26]. Many authors have emphasized the role of fragmentation in such types of slope movements [
27,
28,
29]. In particular, Macciotta et al. [
30] validated a method for estimating rockfall block volumes based on structural mapping and on photogrammetric techniques, whereas Ruiz-Carulla et al. [
4] built up a rockfall fractal fragmentation model by considering pre-existing discontinuities of the rock mass. The measurement of the geometric properties of rock discontinuities is fundamental in performing stability analysis for rock masses [
31]. In these regards, many research works have developed methods to identify rock mass joints from 3D point clouds (3DPCs). Terrestrial laser scanners are used significantly in the literature in order to assess discontinuity sets with the aim of monitoring and characterizing landslides [
32]. As a matter of fact, Corsini et al. [
33] mapped and monitored a rock slide through the integration of Airborne Laser Scanning (ALS), multi-temporal long-range Terrestrial Laser Scanning, and Automated Total Station measurements. In Abellan et al. [
34], advances in terrestrial laser scanning of rock slope processes during the last decade (2003–2013) are described, providing an overview of current research and future perspectives. On the other hand, Ge et al. [
35] developed an automatic procedure to detect discontinuities and measured associated geometric parameters from a point cloud acquired by LiDAR, creating new grid data and using a modified region growing algorithm to promote the efficiency of discontinuity identification.
Based on recent technological developments, an easy, low-cost, accurate and simple procedure to determine discontinuity orientation was proposed by Ozturk et al. [
36] by using smartphone images, photogrammetric techniques and Cloud Compare software [
37] for manual measurements on segments. An automatic approach was developed by Battulwar et al. [
38], which aimed at developing a fast and automatic joint orientation computation algorithm from 3DPC of rock mass, collecting data through UAV and photogrammetry techniques. However, many important parameters like spacing, persistence and block size were not investigated.
In addition to rockfall simulations, new techniques have recently been developed for collecting input data for modelling purposes. Such techniques mostly focus on recognition of the source areas that strongly affect the block trajectories, and hence the overall results of simulations [
39]. In literature, many works focus on rockfall source identification by using photogrammetry or laser scanning at local [
40,
41,
42] or regional scales [
43,
44]. Starting from airborne LiDAR data at regional scales, Fanos et al. [
39] proposed a hybrid model to accurately identify rockfall sources among other type of landslides (such as shallow, translational, rotational, rotational-translational, and debris flow) using two algorithms: the Gaussian mixture model and the random forest (RF) model. However, the accuracy and the computing performance of these needed to be improved. As precedent studies neglected the optimization of the algorithm hyper-parameters and used a limited number of conditioning factors, with neither optimization nor examining multicollinearity, Fanos et al. [
45] proposed an ensemble model based on high-resolution LiDAR data that may be generalized and replicated in different regions, with application to various types of landslides. In further studies [
46], in the same hybrid model, an RF algorithm was coupled with Naive Bayes to produce probability maps of different landslide types using an inventory dataset and optimized conditioning factors. In recent years, the Structure from Motion (SfM) automated photogrammetric method for rock-mass characterization and monitoring was proposed by Tomás et al. [
47] and by Sarro et al. [
48]. In areas threatened by rockfall events, protection elements (e.g., bolt fixing, cable netting or shotcrete) could be installed for risk mitigation. In areas where protection of critical elements (such as roads or buildings) is required, the use of barriers is also common. Rockfall barriers are deformable elements, and are designed by considering boulder characteristics such as energy, bounce height, and runout. Their function is to stop the falling blocks along the slopes by transmitting boulders’ energy to the slope through cables, anchors and energy dissipators [
49,
50,
51]. In these regards, Fanos et al. [
40] proposed a multi-scenario rockfall hazard using ALS and Rockfall Analyst, demonstrating that mechanical parameters highly affect the results of rockfall modelling, and providing suggestions for developing barriers based on the worst hazard conditions. However, they evidenced the difficulty of deriving mechanical parameters representative of in situ conditions. Another example of rockfall hazard assessment was proposed in 2019 by Fanos et al. [
52], developing a hybrid model for detecting potential rockfall source areas (using ALS data) and 3D trajectory modelling. They highlighted the importance of impact location and provided a comprehensive understanding of rockfall hazards that can assist authorities in developing proper management of risk. However, fragmentation was not considered in such studies and mitigation measures were not evaluated. Another study [
53] optimized a hybrid machine learning model, based on various classifiers, to produce a rockfall probability map and thus identify rockfall sources at regional scale, based on results of a 3D rockfall kinematic model to assess rockfall trajectories and their characteristics at a local scale. The authors also developed a spatial model based on fuzzy analytical hierarchy process, integrated into a GIS, to generate the final rockfall hazard maps, aiming at suggesting and assessing mitigation actions.
In this work, an example of assessment of fragmental rockfall hazard at local scale is presented. The study is based on the analysis of an event that occurred on 17 November 2018 at Cárcavos (Albacete, Spain), through UAV-based detailed photogrammetric point cloud and 3D-trajectory simulations. At source, the Cárcavos rockfall involved a single block of 260 m
3 which subsequently impacted at the base of the rocky scarp and fragmented into several boulders that travelled 130 m, damaging the access route to the Cárcavos village and some rustic buildings. High-resolution terrain elevation data were acquired through an Unmanned Aerial Vehicles system (UAVs), and processed by SfM to generate a 3DPC. The high-resolution of the point cloud allowed for the detection of potential source areas on the slope in addition to the sector affected by the 2018 event, including distribution and size of rock fragments. Three-dimensional trajectory simulations were carried out by applying the model RocPro3D [
19] to simulate the 2018 event and to assess the risk from fragmental rockfall at Cárcavos. Accordingly, the elements exposed to risk could finally be identified, and the efficacy of corrective measures evaluated, by also considering fragmentation data. The results of this study may provide useful information to develop more effective strategies of risk mitigation, especially because of the fragmentation analysis representing key data that enabled the simulation of rockfall simulations and, consequently, to avoid an oversizing of the protection infrastructures.
2. Study Area
Cárcavos is located in the south of the Albacete province, in the Castilla-La Mancha region of Spain. From a geological point of view (
Figure 1), the area belongs to the domain of the Sierra de Alcaraz, in the external zone of the Betic Cordillera [
54]. The tectonic regional framework is dominated by NE-SW trending structures, such as thrusts verging towards NE, normal faults and right/lateral strike-slip faults. Minor fault segments were found, represented by NW-SE trending right-lateral strike-slip faults.
Jurassic rocks outcrop over the study area, and are mainly constituted by intraclastic and sparite limestones (Dogger), generally recrystallized and dolomitized, frequently containing oolite and oncolite levels. At a local scale (
Figure 2a), limestone is mantled by alluvial and colluvial deposits generated by fluvial and slope-wash/weathering processes, respectively. The landscape is dominated by structurally-controlled scarps and valleys. The mountainous sectors show the oldest geomorphological features, consisting of hanging relics of a low-relief landscape (ranging between 500 m and 1200 m a.s.l.), produced by ancient relief-smoothing phases and caused by fluvio-denudational processes. Mountainous, rounded topography contrasts with the narrow and steep reaches to be found downstream. In fact, the Mundo river valley (where Cárcavos is located) is deeply incised into the Meso-Cenozoic bedrock, with an overall asymmetric shape due to greater development of left-side tributaries. In the area, strong dissection led to a degraded stepped slope composed of low relief areas dominated by debris outcrops, whereas rock outcrops prevail in high relief sectors. In addition, an 80 m high limestone escarpment marks the transition between the aforementioned morphological sectors, characterized by rocks with different erodibility. As a result, alternating steep slopes (ranging from 50° to 90°) covered by a patchy veneer of debris and anthropic terraced areas (at ca. 30°), were found (
Figure 2b).
In the study area, a rough topography therefore combines to outcrops of tectonized rocks, affected by prolonged physical and chemical weathering. Steep and high scarps (up to 60 m), modelled by rockfall events, are cut into fractured rocks characterized by a number of families of structural discontinuities. Such rocky scarps are very prone to landslide processes, particularly where geological discontinuities intersect slopes with unfavourable orientation. As a whole, such characteristics determine widespread predisposing conditions for development of slope movements in the municipality of Ayna (
Figure 3).
The study area has a typical Mediterranean climate, characterized by mean annual temperature and precipitation of 14.1 °C and 406 mm, respectively. Mean monthly rainfall ranges between 54 mm (in April) and 9 mm (in July). Despite high seasonal variation in temperature, mean monthly temperatures range from 5.9 °C (in January) to 24 °C (in July) (
Table 1). As a consequence, physical weathering (thermoclasticism and cryoclastism) and karst processes are frequent.
The 2018 Rockfall Event at Cárcavos
In the afternoon of 17 November 2018, a rockfall occurred at Cárcavos on a high rocky scarp near the Mundo river dam, damaging the underlying road and a terraced crop area [
57]. Some blocks reached a garage (
Figure 4) but, fortunately, no casualties were reported. Slope instability is significant in the study area, as testified by geomorphic evidence and existing protection measures on slopes (retaining walls, flattering of slopes, rockfall protection barriers, etc.). Similar rockfalls occurred in the area in December 2016 (with rock volumes even greater than in 2018) [
58], and in March 2020 (involving smaller blocks) [
59].
The 2018 event originated at the uppermost portion of a sub-vertical limestone scarp about 80 m high, NE-striking and facing SE (J2: 147/83). In the rock mass, three main families of discontinuity (J1: 086/84; J3: 118/81; J4:100/90) were found. The slope movement started as a wedge-shaped translational rock slide [
60,
61] involving a single block 260 m
3 in volume (700 tons). After a limited displacement, the slide evolved into a free fall, and then reached the 30° slope at the base of the scarp, creating an impact crater 11.5 m long, 7.7 m wide and 1 m deep. Due to impact, the block broke into more than 600 boulders of various sizes that kept travelling downslope, rolling and jumping down to the road and through the olive-tree plantation, finally reaching a building and a garage.
The day prior to the triggering of the rockfall, severe rainfall (61.3 mm) had been recorded at the closest rain gauge (Liétor, 15 km east of Cárcavos, at 642 m a.s.l.) (
Figure 5). The event followed an antecedent period of moderate rains, cumulating in 50.3 mm in 46 days. As no evidence of seismic shocks nor other potential triggering factors could be identified, the rainfall event recorded on 16 November is assumed to be the triggering factor of the 2018 Cárcavos rockfall.
3. Data and Methods
In this study, pre-existing topographic [
63] and geological information were combined with in situ data obtained through field surveys and automated techniques such as UAV photogrammetry, surveying, and 3D modelling. In particular, a DEM and a high-resolution 3DPC were obtained by processing data acquired during the UAV photogrammetric survey. Detailed lithological and land use maps (in scale 1:2.500) were created by integrating the Geological Map of Spain (at scale 1:50.000, [
64]) with a land use map of the country (at scale 1:50.000, [
65]), field surveys, and orthophotos derived from high-resolution UAV imagery, in order to generate input data for the three-dimensional simulation of trajectories. Meteorological data were directly obtained from the Automatic Hydrological Information System of the Segura Hydraulic Confederation [
62]. In addition, interviews with the affected population were conducted to collect information on the 2018 rockfall occurrence and related damage.
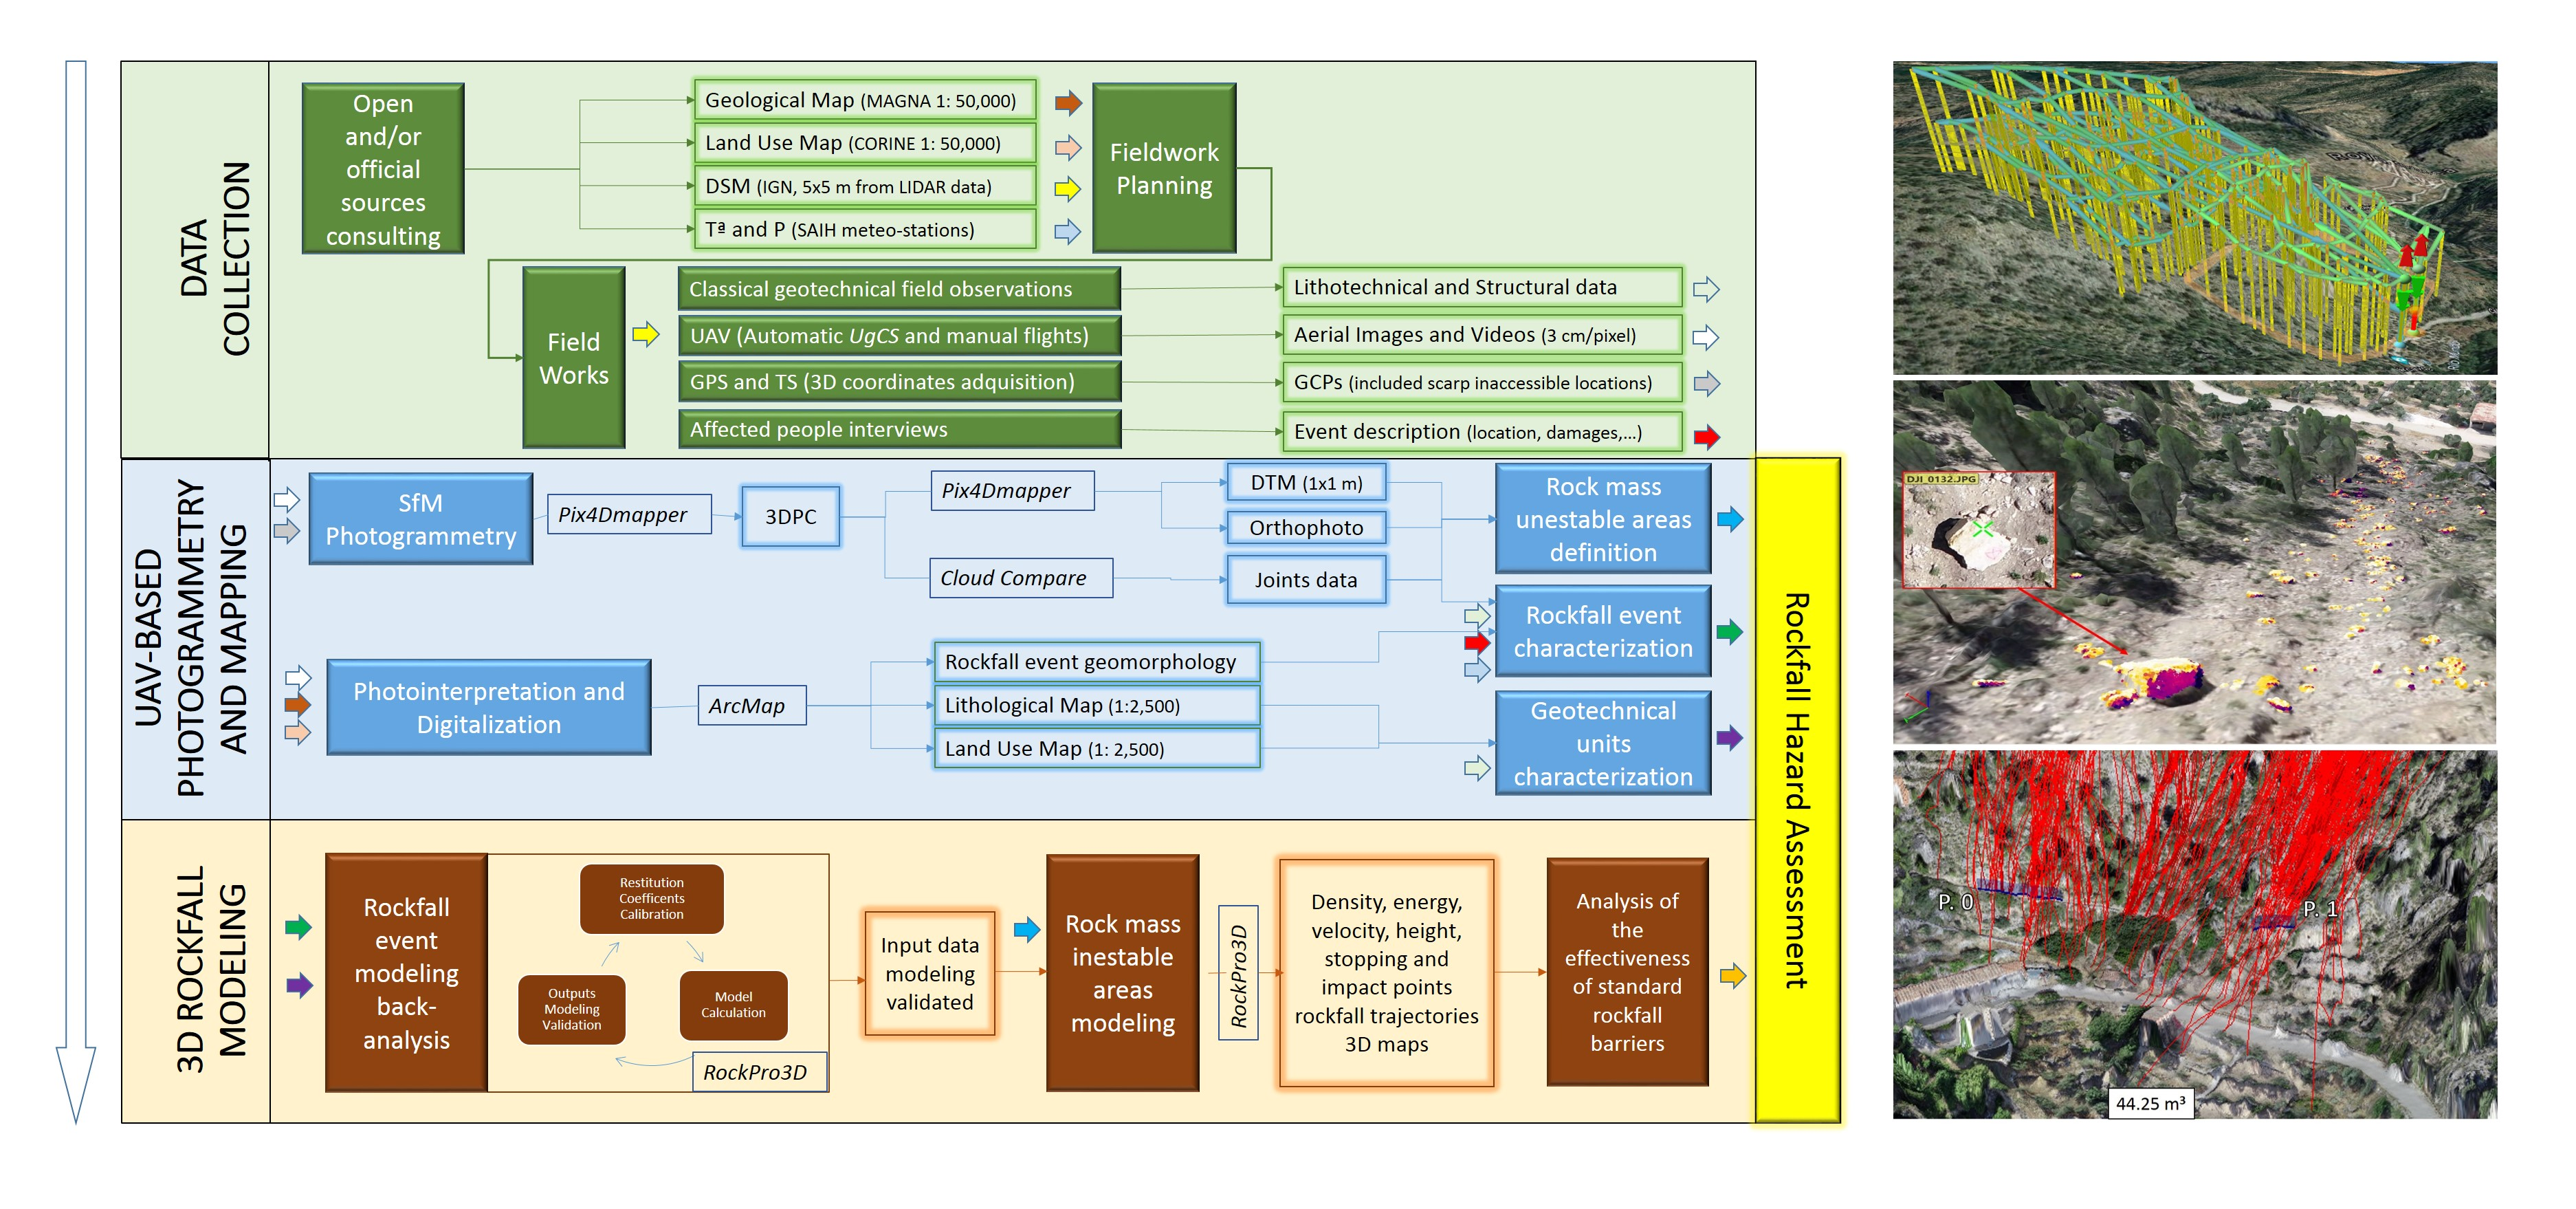
Figure 6 shows the major steps of the adopted approach. Each step is discussed in detail below.
3.1. UAV and GNSS Field Data Acquisition
A fieldwork campaign was conducted to characterize the event. In addition, manual and automatic UAV flights were conducted by using a DJI PHANTOM 4 and a DJI MAVIC PRO.
First, a UAV survey was carried out employing automatic flights in order to acquire a dataset of 396 optical aerial images. These were used to generate a 3DPC of the area by applying SfM techniques, which allowed for the creation of a high-resolution terrain model. Ground control points (GCPs) with known ground coordinates in the Spanish national reference system (ETRS89) were obtained by means of a GPS Leica 1200, and by marking fragmented rocks, rock outcrops and roads sites. GPS data were complemented by data collected by means of a total station Leica TS11 to acquire control points on the scarp, thus developing a complete 3D digital model. In total, 15 points, with a 3D positioning error of less than 2 cm were used to georeference and improve the accuracy of the 3D digital model. The automatic flights were conducted using a DJI Phantom 4 Pro. This drone has 20–25 min of flying time, and a 20 MP camera (5472 × 3648 pixels) with an RGB sensor and 8.8 mm focal length. Four 120 m high flights were planned which would use UgCS software [
66] and would cover an area of 17 hectares, getting a ground sampling distance (GSD) of 3.0 cm (GSD = Object distance × sensor pixel size/focal length). The UgCS software [
66] allowed for the realization of automatic UAV photogrammetric flights, defining trajectories with adaptive flight height with respect to the ground, as GSD can be fixed. In this case, a 5 m resolution DSM [
67] was incorporated into the fly trajectories calculation. The obtained photographs maintained the ratio pixel size/ground area covered in order to minimize possible correlation errors in the photogrammetric calculations (
Figure 7). The flight paths were calculated to obtain a longitudinal and transverse image overlap of 80% and 70%, respectively.
Manual flights were then carried out to collect high-resolution videos and photos in order to enable a more detailed analysis of the rockfall affected area (including frontal and zenithal photos of control points on the scarp) and to minimize errors in the point cloud processing step. Based on such high-resolution photographs and videos, the geomechanical characteristics of the rock could be evaluated in terms of main discontinuity sets, and maps of land use and exposed elements in the study area could be refined.
3.2. 3D Point Cloud for Rockfall Assessment
The 396 UAV images were processed by using the Pix4Dmapper software [
68] and applying SfM techniques. SfM uses a series of overlapping and offset 2D images to reconstruct the 3D structure of a given scene or object [
69]. A high-resolution 3DPC of the rockfall area could then be obtained. This cloud reached 38.08 million points, with an average density of 92 points per m
3. All the images were calibrated and geolocated, reaching a 0.54% relative difference between initial and optimized internal camera parameters, and a median of 33.21 matches per calibrated image. To achieve precise georeferencing, the 15 GPCs measured during the fieldwork were used, obtaining a mean 3D root-mean-square error (RMSE) of 0.09 m. Once the georeferenced 3DPC was obtained, a detailed orthomosaic (3 cm/pixel) and high-resolution Digital Surface Model (DSM) of 0.1 × 0.1 m cell size was produced.
The 3DPC was employed to characterize the rock-mass main discontinuities (location, orientation, spacing and continuity) that represent key data to describe the 2018 Cárcavos-event kinematics and to assess the rockfall susceptibility in the rest of the escarpment (
Table 2). In the literature, different methods are suggested to identify rock mass joints from 3DPCs. Some make use of 3DPCs obtained from terrestrial LiDAR sensors [
33,
34]. When accessibility and visibility conditions are limited (as in this study), UAV-based photogrammetry is employed [
38,
48,
70]. Additionally, several automated or semi-automated approaches have been presented for estimating joint orientations from 3DPCs [
35,
71,
72]. In this regard, the plugins Facets [
73] and Compass [
37], implemented in the Cloud Compare free software [
74], were used. In particular, Facets is a plugin that performs planar facet extraction in order to calculate dip and dip direction, and to report the extracted data in interactive stereograms. Two algorithms created the segmentation: Kd-Tree and Fast Marching. Both divide the point cloud into sub-cells, then compute elementary planar objects and aggregate them progressively into polygons, according to a planarity threshold. The boundaries of the polygons are adjusted around segmented points with a tension parameter. By means of this semi-automatic method, location and orientation of six of the main families of discontinuities of the rocky massif could be obtained (
Table 2). To characterize the remaining two joint families recognised in UAV images and videos, four tools included in the Compass plugin were used. The Plane tool enabled the measuring of the orientations of the fully exposed planar structures, such as joint or bedding surfaces. Once it was activated, a plane was fitted to all points sitting within a defined circle (using least squares), giving an orientation estimate (dip/dip direction). Additionally, the Trace Tool enabled the estimation of a structure or contact’s orientation based on its intersection with a non-flat surface. It used a least-cost path algorithm to ‘follow’ such intersection traces along the surface between user defined start and end points, and then calculated the best fit plane to estimate the orientation. Finally, the Measure One-Point Thickness and Measure Two-Point Thickness tools were used to measure the true-thickness of discontinuity spacing by selecting a plane representing the orientation of a unit plus one to two points on its boundary.
A high-quality DEM is fundamental for realizing 3D simulations of trajectories. Nevertheless, elevation includes vegetation as protrusions of the ground that may affect the trajectories of the simulated blocks. For this reason, the original DSM was edited to obtain a Digital Terrain Model (DTM) for the area of interest. To this end, the 3DPC was filtered by removing points below the scarp (i.e., where simulation had to be run) corresponding to high and dense vegetation. This operation was carried out manually by means of Pix4Dmapper software [
68] in order to minimize any error that might derive from an automatic procedure. By combining the high-resolution 3DPC with photos and videos (collected through the UAV survey), a detailed geomorphic analysis and characterization of the 2018 event was carried out. In this way, it was possible to map and identify relevant geomorphic features, including the 2018 rockfall scar and its associated deposit. More than 600 blocks were identified and measured through ArcMap [
75] (
Figure 8), and other blocks were recognised as being in precarious equilibrium conditions, including loose blocks by the main scarp with signs of alteration and instability. The identification of all these elements was crucial to develop the 3D simulation of rockfall trajectories, and then to carry out the hazard assessment.
3.3. 3D Rockfall Modelling Data
In this work, rockfall simulation included two stages: (1) a back-analysis, using rockfall modelling, to determine the input data required by the model; and (2) simulations of rockfalls from potential unstable areas, as identified by 3D cloud point analysis. Through back-analysis of the rockfall event, rockfall simulation parameters could be calibrated based on the real trajectories followed by the boulders. In this way, energy levels and velocities were also evaluated. Validation was carried out by considering impact and stopping points.
In a following stage, areas of the whole rock massif at Cárcavos that might be affected by rockfalls were evaluated. Potential source areas were identified by combining field surveys and 3DPC analyses. This phase is of enormous relevance for the design of mitigation measures in the study area. Rockfall modelling was performed by using a probabilistic software, RocPro3D [
19]. Most models for rockfall simulation do not allow for the proper consideration of uncertainties and of the variability of parameters by means of probabilistic functions [
76].
RocPro3D includes a probabilistic component that allows for the defining of block parameters (starting position, mass, and starting condition) and soil parameters in terms of probabilistic variables. Soil parameters can be represented by probabilistic uniform and Gaussian variables, and are defined by dynamic friction coefficients, normal and tangential restitution coefficients, lateral (horizontal) deviation, and flattening (vertical) of the rebound angle. The model requires a high-resolution DTM in a raster format and the location of the potential source areas as input data, as well as the geometric features of the unstable blocks and the lithological characteristics.
As mentioned above, the input DTM was derived from the 3DPC of the study area after filtering the points corresponding to high and dense vegetation. Potential source areas were identified through field surveys, aerial-photo interpretation and photogrammetric analyses, considering the presence of rock discontinuities, weathering evidence along joints, and loose blocks in precarious equilibrium along the slope.
Concerning the geometric features of the “launched” blocks, spherical blocks were considered by adopting a lumped-mass approach, therefore assuming that mass and shape of the blocks do not affect the dynamic of the rockfall events [
76]. In other words, the blocks were considered as mere points characterized by specific mass and velocity [
5].
The last step was to assign values of the restitution coefficients to quantify the loss of energy caused by impacts of the blocks on the slope [
77]. To this end, lithology and land-use units were combined to determine different terrain classes. In the area, a total of 11 terrain classes were defined by combining lithology and land use units (
Figure 9).
Uncertainty and variability in the selection of restitution parameters was introduced by means of probabilistic functions. In turn, these functions were defined by considering literature [
78,
79,
80,
81] and studies carried out in areas with similar geological, structural and geomorphological characteristics [
6,
48]. To obtain better quality, the software applied an algorithm adapted from Marsaglia [
82].
Subsequently, simulation results were compared to real trajectories followed by the blocks by considering polygons that delimit the boulders. Heuristic analyses were carried out iteratively until satisfactory results were obtained (i.e., run-out and extension of the simulation well matched the mapped elements). The calibrated values were then assigned to parameters and to terrain classes.
A total of 11 terrain classes could be defined (characterized by parameters listed in
Table 3), expressed in terms of probabilistic variables (uniform or Gaussian): restitution coefficients; lateral deviation (during the rebound of the block); flattening tendency of the rebound angle; the dynamic friction coefficient; and transition parameters (transition angles between the free-fall and sliding phases, which are characteristic in this type of movement) [
83,
84].
For calibration purposes, the 2018 event was simulated by selecting appropriate restitution coefficients through a trial and error approach. In such a way, trajectories similar to those that actually occurred could finally be replicated. The model was then validated by considering stop and impact points of simulated blocks with respect to blocks of the real event, and a good correlation between simulation and real data was obtained.
Finally, the validated model was applied by considering six additional prone source areas along the same scarp in order to assess the residual risk. Due to the fragmentation analysis, the efficacy of corrective measures was evaluated by simulating trajectories with rock volumes of the deposit calculated beforehand.
4. Results
The 3D simulation of rockfall trajectories was carried out by using RocPro3D [
19] with a probabilistic approach, considering surface irregularities, block-related parameters, and the characteristics of the soil [
48]. RocPro3D [
19] allowed not only the simulation and validation of the trajectories of the rockfall that occurred in November 2018, but also the assessment of the probability of further rockfall occurrence from the same scarp in terms of residual risk for buildings and people living there. The inventory of the blocks of the study event was extremely important in the evaluation of the performance of dynamic barriers, based on estimated volumes.
First, through a back-analysis technique, the model was calibrated to simulate the 2018 event by selecting appropriate coefficient values of ground parameters to obtain trajectories similar to the actual ones. This step was extremely important for the evaluation of the risk, as it affects the accuracy of successive simulations from potential sources. In fact, after calibration, 300 spherical rock blocks with diameters of 3 m (ca. 15 m
3) and densities of 2700 kg/m
3 were launched from the potential detachment areas, thus calculating energy, density, height, velocity, and stop and impact points of each simulated trajectory (
Figure 10).
The block size to be simulated was chosen base on dimensions of the fragmented boulders from the 2018 event. To this end, the distribution of sizes of the 668 boulders of the 2018 event, as recognized thanks to the high resolution of the 3DPC, was analysed in high-resolution DTM, and their areas, diameters and volumes were evaluated. Based on such results, the blocks were classified in five orders of volume magnitude [
26].
The results obtained by simulating the largest blocks (fifth order) showed energy peaks ranging from 20,000 KJ to 30,000 KJ, and velocity peaks of ca. 47.5 m/s at the base of the scarp, i.e., where an impact crater was actually originated by the event. The preferential direction of the blocks is evidenced in the density map, where the higher trajectory densities are concentrated in a well-defined chute.
The model was then validated by comparing simulated and actual distribution of the boulders and their impact and stop points (
Figure 11). In particular, a good agreement among simulated and real data could be verified, with simulated stopping points mostly concentrated in the same sector where higher density of boulders was actually recognized.
In more detail, among the simulated cases, trajectory n. 162 was found to be the most similar to the one followed by the block that hit the garage (
Figure 12). The analysis of this trajectory showed that a block of ca. 15 m
3 hit the garage with an energy between 3000 KJ and 5000 KJ, a velocity of ca. 10 m/s, and a height between 1 m and 2 m.
After calibration, further rockfall events were simulated by considering potential source areas in the surrounding area of the 2018 source. A total of six source areas were selected based on the kinematic analysis of possible breaks in the three escarpments, and by analysing orientation, spacing and the continuity of the joints (
Figure 13,
Table 2).
In addition, using photographs and UAV videos, the degree of opening and alteration of the joints could be characterised. The presence of loose and/or overhanging rock masses are shown in
Figure 14a. In particular, based on kinematic analysis, the upper part of the SE facing escarpment, represented by the J2 family, is the one that presents the greatest stability problems. In fact, wedge-type breaks (J7^S5, J7^S0, J1^J5) may still originate on such portions of the rocky scarp-like the one that occurred in the 2018 event. In addition, the sub-vertical and continuous J4 and J6 families delimit parallelepiped blocks that may fall from cantilevers produced by the previous rockfall, according to S0 (
Figure 14b).
A set of 100 rock blocks (with identical characteristics to those of the calibration model) were run from each of the six potential sources, and energy, density, height, velocity and impact information for each trajectory were calculated (
Figure 15). The results revealed two main preferential chutes, as evidenced by the density map, in which the percentage of trajectories that cross each cell of the grid are shown [
6]. In particular, one of the chutes coincides with the sector affected by the 2018 event, whereas the other one is located further west. The energy map reveals a maximum energy of the blocks of ca. 65000 KJ and a maximum speed exceeding 72.4 m/s.
In the maps, the impact and stopping points of several blocks reached the buildings and the local road below the scarp. Within this context, the effect of the implementation of dynamic barriers to protect the hamlet was evaluated, using information obtained by fragmentation analysis on the deposits of the 2018 event. In particular, the performance of two 3.5 m high dynamic barriers with energy absorption capacities of 4500 KJ was analysed by considering volume sizes that could affect the infrastructure. Two dynamic barriers were located based on highest density of trajectories reaching the buildings, and these were labelled as 0 and 1. The volumes of the blocks selected for this phase of evaluation were: 1 m
3 (3th order of magnitude), 15 m
3 and 44.25 m
3 (5th order of magnitude)–cf.
Figure 16.
The 98.5% of the 1 m3 simulated blocks were retained by barrier n. 0, with a maximum energy of 782.4 KJ and a maximum velocity of 24 m/s. Only 1.5% of the blocks managed to pass above the same barrier (probably, thanks to minor protuberances on the ground), with 3.7 m of height of rebound, and none passed through the protection. On the other hand, barrier n.1 retained 88% of the 1 m3 blocks, with a maximum energy of 966.5 KJ and a maximum velocity of 27 m/s. About 12% of the blocks passed above the same barrier, with 6.5 m of height of rebound, whereas no blocks passed through the protection.
The 90.8% of the 15 m3 blocks were retained by barrier n.0 with a maximum energy of 11,081 KJ and a maximum velocity of 24 m/s. About 6.2% of the blocks passed through the protection, and only 3.1% of them passed above, with a height of rebound of 4.5 m. On the other hand, barrier n.1 retained 64% of the blocks, with a maximum energy of 13,689 KJ and a maximum velocity of 26.7 m/s. About 20% of the remaining blocks passed through the protection, whereas 16% passed above, with 7.4 m of height of rebound.
Finally, when simulating the biggest volume class, barrier n.0 retained 69.2% of 44.25 m3 blocks, with a maximum energy reached of 34,487 KJ and a maximum velocity of 24 m/s. As for the remaining cases, 4.6% passed above the barrier, with a maximum height of rebound of 5.3 m, and 26.2% passed through the protection. Barrier n.1 retained 36% of blocks, with a maximum energy of 42,603 KJ; about 24% of the blocks passed above, with a maximum height of 8 m, whereas 40% passed through the protection.
5. Discussion
The 2018 Cárcavos fragmental rockfall was analysed by means of a heuristic approach to highlight the potential of new technological resources for evaluating and mitigating risk. The rockfall started as a wedge-shaped translational slide of a single limestone block of 260 m3. After a limited displacement, the rock slide evolved into a rockfall. At the base of the scarp, the block fragmented into hundreds of blocks that kept travelling downslope, eventually reaching a building and a garage.
Among remote acquisition techniques, one of the most used is Light Detection and Ranging (LiDAR), which provides a 3DPC of the scanned surface. This type of technique is widely used, both for characterization of rockfalls and for related risk assessment, as well as for monitoring and modelling purposes [
45,
46,
53]. In this regard, despite the LiDAR technique allowing for the obtaining of greater accuracy, UAV photogrammetry was used for detailed investigations of rockfalls in remote areas characterized by difficult access—as in the case of Cárcavos 80 m vertical scarp. UAVs also have several advantages over satellites and/or piloted aircraft: real-time applicability, flexible survey planning (they can be deployed quickly and repeatedly), high resolution (sub-decimeter), low cost and high security. The high cost and scale of the LiDAR instrumentation itself also motivated the scientific community to show interest in alternative techniques such as SfM to develop surface models. In addition, the SfM technique demonstrated its usefulness by generateing 3DPC to identify, delimit and georeference the families of discontinuities in rock outcrops [
85,
86], and to allow the performance of high-accuracy rockfall simulations [
20,
87,
88]. The contribution of UAVs to rockfalls can have various applications, including recognition, mapping and monitoring.
In the present study, a UAV-based photogrammetry was applied to recognition and mapping by developing a DTM based on SfM techniques, with resolution of 1 × 1 m that allowed for the considerable improvement of the official DTM of 5 × 5 m [
67]. The photogrammetry-based 3DPC was employed for the escarpment recognition, the characterization of the rock mass discontinuities, and the mapping of the distribution and size of the fragmented rocks (>600 boulders). A significant advantage of using UAV consisted in the ability to identify rockfall trajectories from aerial views, crucial information for successive numerical simulations.
In the Cárvacos case study, UAV photogrammetry allowed for the rapid obtaining of accurate qualitative and quantitative results. At some places, access to the outcrops was difficult or impossible, and spatial data on discontinuities could not be directly collected in the field. In such cases, the use of algorithms for semi-automatic extraction of discontinuities using UAV-based photogrammetry 3DPC can be a valuable solution. However, the application of similar extraction techniques requires that the discontinuity planes must crop out with an adequate areal extent to be recognized. Unfortunately, in many cases (e.g., recrystallized and dolomitized limestone outcrops in the study area), this requirement is not satisfied. Another point to be taken into account concerns the orientation of the joints. The cluster of statistical distribution in the stereographs shows maxima in direction of planes coinciding with the escarpments, and may mask relevant discontinuity planes for slope stability (
Figure 17c,e). Accordingly, in this study, UAV photographs and videos were employed to allow for an expert geological interpretation of the results. As a consequence, two discontinuity families (J7 and S0) that had not been identified by the extraction algorithms could be recognized. Thanks to the Cloud Compare trace tool (which allows for the estimation of the orientation of a structure based on its intersection with a non-flat surface), two main families were characterized (
Figure 17a,b).
As can be seen in
Figure 14b, aerial photographs were crucial for the characterization of the 2018 event and for the definition of potentially unstable areas. To this end, kinematic analyses of possible breaks for each of the slopes was carried out. Thus, the use of tools for the extraction of orientations from point clouds, supported by interpretation of UAV images and videos, were relevant steps for the defining of the most unstable areas of the rocky massif. Such areas were chosen for successive 3D rockfall modelling.
The ground parameters and the size of the blocks are considered key factors to properly develop 3D rockfall simulations, as they influence the trajectories of the blocks [
48]. To this regard, the combination of photo-interpretation, field work and scientific literature allowed for the collection of detailed geological and land-use data (fundamental for calibration purposes), and for the identification and approximate measurement of the 668 boulders that originated after impact of the fallen block at the base of the escarpment. Even though RocPro3D [
19] does not take into account fragmentation processes, simulations were carried out by considering “realistic” block volumes, as previously determined.
The 2018 Cárcavos event was simulated first. The resulting 3D trajectories showed a good agreement with the real event. The model was then validated through fragmentation analysis, carried out thanks to the high-resolution 3DPC. In this way, the validation was carried out by considering the impact points and the distribution of the boulders. According to the results, the blocks reached the maximum energy (30,000 KJ) and velocity peaks (47.5 m/s) at the base of the scarp, where an impact crater actually originated. This gave further confirmation to the correctness of the model’s performance. Using RocPro3D [
19], it was possible to obtain a quantitative analysis in terms of impact energy, speed and rebound height for a specific trajectory that was identified as being the most similar to the one that actually hit the garage.
The possibility of calibrating and validating a three-dimensional model by means of a real event that occurred in a given study area allows for an accurate hazard assessment, even in areas where landslide data are not quite abundant—such as in the municipality of Ayna (Albacete, Spain). Furthermore, simulations of similar fragmental rockfalls, carried out starting with six potential source areas as identified in the surrounding of the 2018 source, allowed for the evaluation of the potential damage to existing elements. Each rockfall trajectory was analysed in terms of energy of impact, density, velocity, height of rebound, impact, and stopping points. The results of the model revealed two preferential chutes in which the density of the trajectories was significantly higher than outside. Based on such information, the best place to locate protection elements could be selected. The estimated energy of the impact underlined how violent such events can be in terms of destructive capability. Such information is a fundamental parameter to design appropriate corrective measures by defining suitable values of energy absorption capacity. The height of rebound is another relevant parameter; in fact, depending on height of barriers, obstacles can be missed or hit by the falling blocks. Such a parameter is correlated to the impact points, but is also strongly influenced by the DTM. In the simulations, several trajectories showed high rebound heights, allowing the blocks to reach the road. However, most rebounds may be correlated with irregularities of the ground, as described by the high resolution DTM. Based on this parameter, the height of the dynamic barriers could be selected in order to better protect the elements exposed to the risk.
In particular, the location of the impact and the stopping points was fundamental to assessing the hazard and the vulnerability of the exposed elements. Trajectory characteristics contributed to the assessment of the rockfall hazard and the susceptibility in the study area, and were therefore relevant to the designing of appropriate mitigation measures. Combining trajectory characteristics and the results of fragmentation analyses allowed for the designing of two dynamic barriers whose performance was evaluated by means of RocPro3D [
19]. The results showed that the blocks simulated from the NE-sources reached barrier n.1 with higher values of energy, velocity, and height of rebound. As a consequence, such barriers retained fewer blocks. Most simulations showed excellent barrier performance. In only one case (i.e., considering the largest blocks) was the percentage of retained blocks below 50% (36% retained blocks of 44 m
3 at barrier n.1).
The numerical simulations discussed above were not intended to suggest any particular corrective measure, but rather to exemplify the potential support of new technologies in 3D modelling. As a matter of fact, aiming at designing mitigation measures for the rockfall at Cárcavos, the role of terraced crop areas in dissipating the energy of blocks should also be properly considered. Moreover, blocks in worst equilibrium conditions should be removed, and most critical areas should be stabilized by means of protection nets. Any modelling approach, in fact, should be considered as just one step in an overall analysis that includes the estimation of energy absorption capacity and better designing of location heights and protection measures.
6. Conclusions
In this study, UAV surveying proved to be quite effective and versatile for data collection in remote areas with difficult access. As a matter of fact, the use of UAV provides high added value to rockfall hazard assessment thanks to a significant decrease in data acquisition times (20–25 min of flying time), high accuracy of the results (optical aerial images of 5472 × 3648 pixels, an orthomosaic of 3 cm/pixel, a DSM of 0.1 × 0.1m and a DTM 1 × 1m), easier accessibility, and lower costs. The use of the Cloud Compare tools applied on the 3DPC and supported by interpretation of UAV images and videos, proved to be a key factor for identifying the most unstable areas of the rocky massif, as well as for the characterizing of the families of structural discontinuities needed to assess slope stability. In addition, the application of the SfM made it possible to define the morphometric characteristics and fragmentation of the detached block in a quick and objective way.
Model calibration and validation was performed by considering data related to the 2018 event. Simulations may be further improved by optimizing the rest of the input parameters, such as DTM, the location of the potential source areas, and the geometric features of the unstable blocks. In other words, by delimiting the potential source areas in greater detail, the accuracy of the simulations would increase, in addition to employing a higher resolution terrain model.
The design of the rockfall barriers usually considers the results of rockfall simulation such as energy, bounce height or runout, and the consideration of boulder characteristics. To make this design reliable, it is necessary to take into account not only the amount of material that could be detached from the cliff, but also the size of the blocks that will reach on the barriers. For this reason, a more detailed characterization of the 2018 fragmented material would help to carry out even more accurate rockfall simulations, and, consequently, to avoid the oversizing of the protection infrastructures.
Based on the kinematic analysis and the 3D numerical simulations, the upper part of the SE-facing escarpment would be the most hazardous zone affected by the worst stability problems. Here, wedge-type slope movements may still activate (like the one that occurred in the 2018 event). The results of the trajectory simulations with barriers showed that the blocks released from such sources would reach barrier n.1 with higher values of energy, velocity, and height of rebound. As a consequence, barrier n.1 is expected to have retained fewer blocks.
In this study, RocPro3D proved to be accurate and versatile in the assessment of rockfall hazard, even if it neglected fragmentation. Simulation results fit well with the mapped evidence of the 2018 study case, especially when considering the results of the fragmentation analysis carried out on the real boulders. The obtained results provided valuable insights into the evaluation of appropriate risk-mitigation measures for rockfalls.


 ,
, 


