Technical Note

A New Hybrid Algorithm to Image Lightning Channels Combining the Time Difference of Arrival Technique and Electromagnetic Time Reversal Technique

1
Key Laboratory of Middle Atmosphere and Global Environment Observation, Institute of Atmospheric Physics, Chinese Academy of Sciences, Beijing 100029, China
2
College of Earth and Planetary Sciences, University of Chinese Academy of Sciences, Beijing 100049, China
3
Institute of Arid Meteorology, China Meteorological Administration, Lanzhou 730020, China
*
Author to whom correspondence should be addressed.
Remote Sens. 2021, 13(22), 4658; https://0-doi-org.brum.beds.ac.uk/10.3390/rs13224658
Submission received: 13 October 2021 / Revised: 11 November 2021 / Accepted: 16 November 2021 / Published: 18 November 2021

Abstract

:
Very-high-frequency (VHF) electromagnetic signals have been well used to image lightning channels with high temporal and spatial resolution due to their capability to penetrate clouds. A lightning broadband VHF interferometer with three VHF antennas configured in a scalene-triangle shape has been installed in Lhasa since 2019, to detect the lightning VHF signals. Using the signals from the VHF interferometer, a new hybrid algorithm, called the TDOA-EMTR technique, combining the time difference of arrival (TDOA) and the electromagnetic time reversal (EMTR) technique is introduced to image the two-dimensional lightning channels. The TDOA technique is firstly applied to calculate the initial solutions for the whole lightning flash. According to the results by the TDOA method, the domain used for the EMTR technique is predetermined, and then the EMTR technique is operated to obtain the final positioning result. Unlike the original EMTR technique, the low-power frequency points for each time window are removed based on the FFT spectrum. Metrics used to filter noise events are adjusted. Detailed imaging results of a negative cloud-to-ground (CG) lightning flash and an intra-cloud (IC) lightning flash by the TDOA method and the TDOA-EMTR are presented. Compared with the original EMTR method, the positioning efficiency can be improved by more than a factor of 3 to 4, depending on the scope of the pre-determined domain. Results show that the new algorithm can obtain much weaker radiation sources and simultaneously occurring sources, compared with the TDOA method.

1. Introduction

Lightning discharge can emit wide-frequency-range electromagnetic waves [1]. Using these electromagnetic signals, which can penetrate clouds, many methods have been developed to locate the lightning sources. For example, for very-low-frequency (VLF) or low-frequency (LF) band signals, time of arrival (TOA) or time difference of arrival (TDOA) method (e.g., [2,3,4,5,6,7,8,9]) or artificial intelligence technology [10] have been applied. For electromagnetic signals in a very-high-frequency (VHF) band, lightning location methods are commonly carried out using the interferometry (INTF) or TDOA technique (e.g., [11,12,13,14,15]). Recently, Mora et al. [16] and Lugrin et al. [17] introduced the electromagnetic time reversal (EMTR) method to locate lightning strikes. Wang et al. [18] extended the application of the EMTR method to broadband VHF signals for the whole process of the lightning flash using an L-shape array. Unlike the above studies in which the EMTR method was operated in the time domain, Wang et al. [19] applied this method in the frequency domain. The advantage of operating the EMTR method in the frequency domain is that noise bands in the signal can be conveniently removed, and hence it can produce a more accurate positioning result [6].
The classical TDOA method locates lightning radiation sources by estimating the time (or phase) difference of the arrival of signals. Though the TDOA method has an advantage in computation efficiency, it relies on the time accuracy of pulse peaks and fails to image many weak radiation sources [20]. In contrast, the EMTR method uses the original full signal waveform and is less sensitive to the accuracy of estimated time difference [21]. Further, after the signal is time-reversed and back-propagated, the phase can be automatically added up in the direction of the radiation source. Thus, the EMTR method is expected to locate more weak sources and it can produce a more accurate location result by suppressing the noise [21]. Although the EMTR method operated in the frequency domain can image more radiation sources, it is computationally expensive for two reasons. Firstly, when the frequency range of the radiation signal is broadband, the EMTR method has to deal with multiple frequency points. In the study of Wang et al. [19], the frequency points used for the EMTR method were set to be in a fixed frequency range (25~90 MHz and 110~150 MHz). Using a fixed frequency range might include some low-power frequency points into the calculation, which have few contributions to the power spectrum but cause spending more computation time. Secondly, the procedure must traverse the full azimuth-elevation space in each positioning window. According to Mora et al. [16] and Rubinstein et al. [22], the calculation efficiency of the EMTR method can be improved by using other methods (e.g., TDOA method) to pre-determine the initial domain. Therefore, combining the TDOA and the EMTR method to produce a new algorithm that can image weak radiation sources with less computation time is necessary.
In previous studies using the classical TDOA method or EMTR method, VHF antennas were configured as two orthogonal baselines [23,24,25,26]. The EMTR method is theoretically applicable to arbitrary-shape antennas, which is more convenient to place antennas in a field experiment. However, to the best of our knowledge, no previous studies have used arbitrary-shape VHF antennas to image a lightning flash with the EMTR method.
Considering the above problems in the positioning methods and configuration of antennas, the ability of using arbitrary-shape antennas to image lightning flashes with a new method is examined in this study. Three VHF antennas configured as a scalene-triangle array are adopted. The TDOA technique and EMTR technique are combined to produce a new algorithm called the TDOA-EMTR method. This study shows that the TDOA-EMTR method is less computationally expensive and can yield a fine positioning result, while demonstrating that using a flexible configuration of VHF antennas to locate lightning radiation sources is feasible.

2. Data and Methods

2.1. Instruments and Data

Since 2019, field experiments of natural lightning flashes have been conducted in Lhasa ( 91.04 ° E, 29.64 ° N, 3640 meters above sea level) on the Tibetan Plateau, China. Instruments including a VHF interferometer, fast and slow antennas and a high-speed-video camera were installed. The prototype of lightning broadband VHF interferometer used in the observation was introduced in previous studies [13,27,28,29]. However, in the Lhasa experiment, three VHF cone antennas were configured in a scalene-triangle shape in the horizontal plane. The VHF interferometer was tuned to a frequency range of 28–70 MHz using a band-pass filter.
The three VHF antennas connected to a mass-memory waveform digitizer and the VHF data was acquired at a sampling rate of 500 MHz with 14-bit vertical resolution in a continuous mode. VHF signal acquisition was externally triggered when the electric field change signal from fast or slow antenna crossed a preset threshold, with a pre-trigger time of 200 ms and a sampling duration of 1 s. These VHF data were used to locate the two-dimensional location (azimuth and elevation) of lightning radiation sources. A high-speed video camera with a spatial resolution of 3200 × 800 pixels and a sampling rate of 3200 frames/second was also deployed to obtain the optical image of the lightning flash. Signals recorded by different instruments were synchronized with a GPS receiver. The calculations in this study were performed on a Dell PC with an Intel (R) Core (TM) i9-9820X 3.30GHz CPU and 128GB RAM. Two lightning flashes, including a negative cloud-to-ground (CG) lightning flash and an intra-cloud (IC) lightning flash were used to compare the new proposed TDOA-EMTR algorithm with the TDOA technique and the EMTR technique in this study.

2.2. Procedure of TDOA-EMTR Method

In this section, the basic procedure of EMTR technique operated in the frequency domain is described first. Then, the combination of the TDOA method and the EMTR method is introduced, focusing on how to use the TDOA result to predetermine the initial domain used for the EMTR method. Finally, we show how to remove the low-power frequency points in the EMTR technique.
The basic idea of the EMTR technique is to reverse the signal and virtually retransmit it back into the space of sky. Then the time-reversed signal can automatically focus on the direction of the signal source (Figure 1). The basic procedure of the EMTR method used in this study is similar to that in Wang et al. [19], and a simple description is given as follows:
(1)
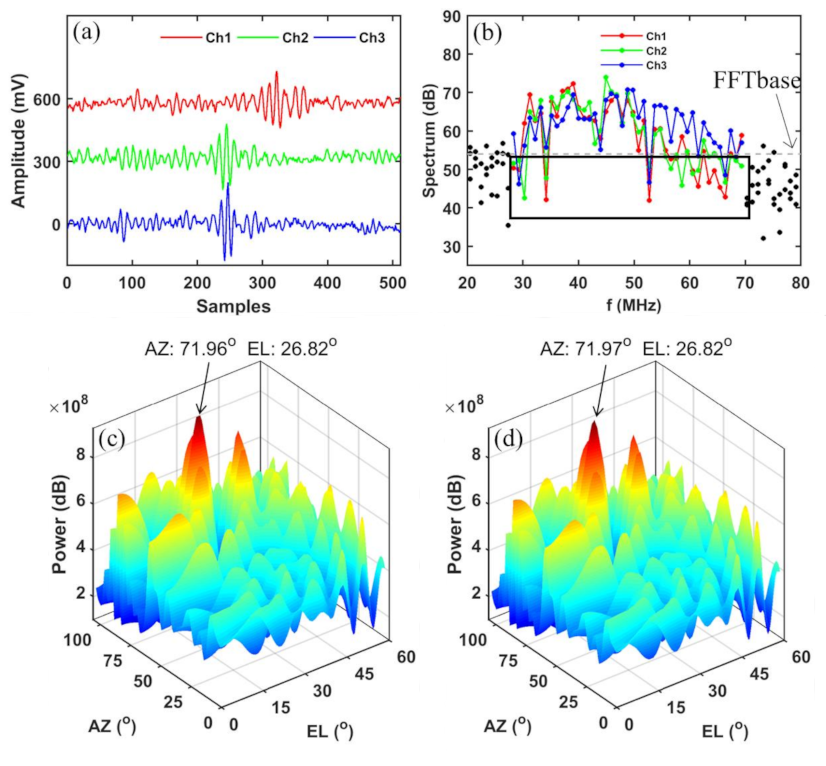
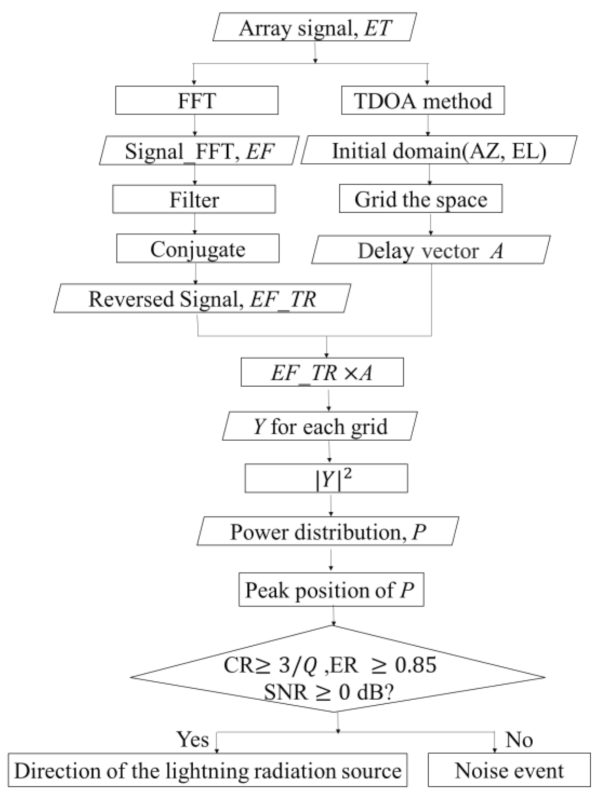
For one positioning window, select the VHF electromagnetic signals in the time domain (denoted by ET) and perform a fast Fourier transform (FFT) on them. The obtained signals in the frequency domain are denoted by EF. In this study, the length of one positioning window is set to be 512 sample points (1024 n s ) and the sliding step for neighboring windows is 128 sample points (256 n s ).
(2)
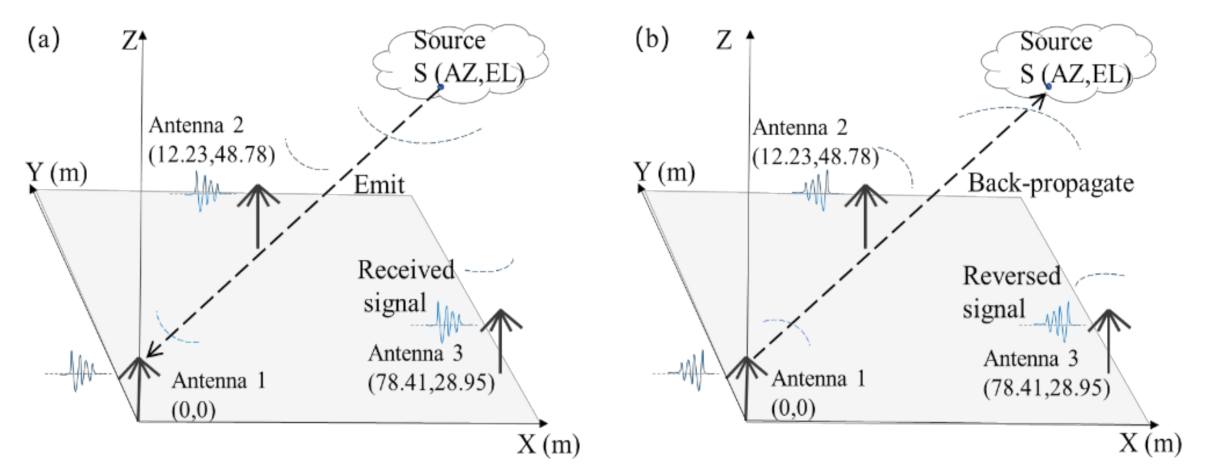
Conjugate EF (equal to reversing ET in the time domain) and obtain the reversed signal (EF_TR).
(3)
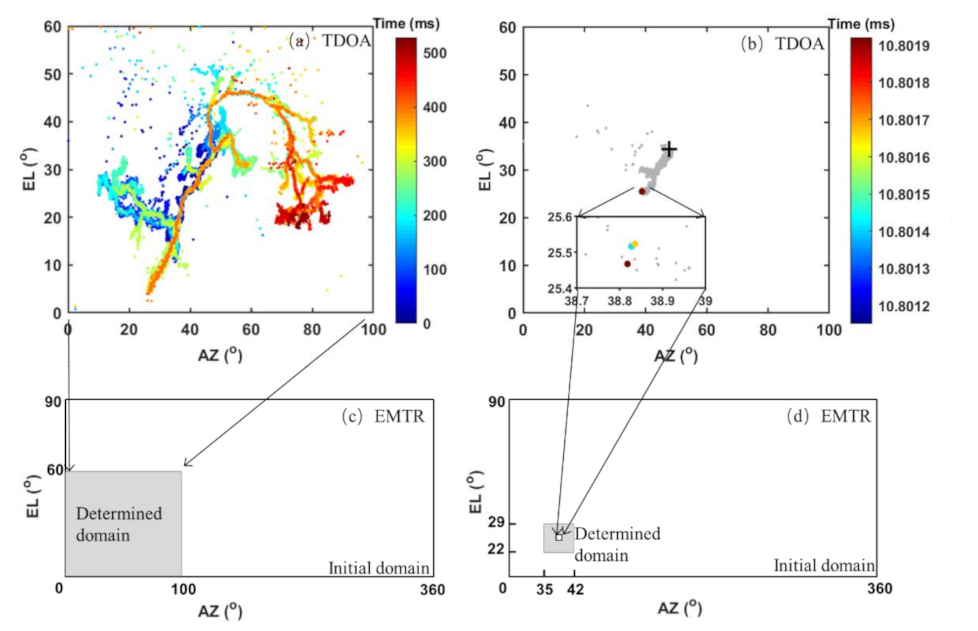
Grid the two-dimensional space domain (azimuth and elevation) and calculate the delay vector (A).
(4)
Multiply EF_TR by A (EF_TR × A ) and obtain the refocused signal (Y) on each grid point in the space.
(5)
Calculate the signal power (P) on each grid point using Y. Then the location of the radiation source is determined by searching the grid point with a maximum power P. For a given positioning window, if the location result can pass the thresholds of some filtering metrics, this location result is deemed to be a radiation source on a lightning channel.
In the positioning procedures of the TDOA-EMTR method, two steps including the TDOA and EMTR method are carried out. In the first step, the TDOA method [15] is used to obtain the initial location result for the whole lightning flash (as shown in Figure 2a for a negative CG). In the second step, the EMTR method is applied with an initial space domain (azimuth and elevation) determined according to the location results of TDOA method. Specifically, for one given positioning window (denoted by ith window) in the EMTR method, the initial space domain is determined according to the spatial range of the positioning result by the TDOA method from the i − 1th to i + 1th window. One window before and after the given positioning window is selected due to the length of sliding step (128 sample points) being one fourth of the positioning window (512 sample points), and thus a given event should be detected in at least three consecutive positioning windows. Two cases might occur when determining the initial spatial domain of the EMTR method according to the location result of the TDOA method. For one case, the positioning result by the TDOA method from the i − 1th to i + 1th window does not exist, and these windows may correspond to noise events, or may correspond to weak lightning radiation signals that are not solved by the TDOA method. In this case, the initial space domain is set to be a spatial range containing the whole lightning flash imaged by the TDOA method. For example, the spatial range of azimuth and elevation angles for the negative CG in Figure 2a fell in the range of 0 ° –100 ° , and 0 ° –60 ° , respectively (Figure 2a). Then the initial space domain is predetermined as such a range in Figure 2c. For another case, if the TDOA method can solve at least one source from the i − 1th to i + 1th windows, the domain is determined as a range that centers on the TDOA result for the i − 1th to i + 1th windows and extends outward by a certain degree. Through manually checking the angle difference between the imaging results by the TDOA and TDOA-EMTR methods, an angle of 3 ° is selected in this study. For example, as shown in Figure 2b, for one given positioning window (ith) and its two neighboring windows (i − 1th and i + 1th), the TDOA method can locate three sources as shown in the inset. The azimuth and elevation angles of these three sources fell in the range of 38 ° to 39 ° , and 25 ° to 26 ° , respectively. Then the domain used for the EMTR method for the ith window is selected to be 35 ° to 42 ° , and 22 ° to 29 ° for azimuth and elevation, respectively (Figure 2d).
For each positioning window, after the spatial domain is predetermined, the new domain is gridded with a resolution of 1 ° and then the EMTR method is applied to obtain the rough estimation of the source location. To obtain a finer location result, the EMTR method is applied again with a new domain surrounding the range given by the rough estimation result and using a resolution of 0.01 ° .
During the EMTR procedure, a variable frequency range is applied. By checking the FFT result, the signals in the frequency domain concentrate in the range of 28–70 MHz. Therefore, the signals outside this frequency range consisted of noise events. In practice, the signal spectrums in the 20–28 MHz and 70–80 MHz ranges are selected to represent the spectrum of noise events and are called NoiseSpectrum. A metric called FFTbase is calculated as the summation of the median of NoiseSpectrum and 1.5 times of the standard deviation of NoiseSpectrum, namely:
FFTbase = median (NoiseSpectrum) + 1.5std (NoiseSpectrum)
For frequency points in the frequency range of 28–70 MHz, those frequency points with a power less than the FFTbase will not be included in the calculation of the source location.
Figure 3 shows an example of removing the low-power frequency points and its effect on the imaging result. A segment of VHF signals lasting for 1024 nanoseconds (512 sample points) is presented in Figure 3a. The corresponding signals in the frequency domain are shown in Figure 3b. The spectrums of FFT points in the frequency range of 28–70 MHz are drawn as red, green and blue solid lines with circular markers, while other frequency points out of the range are drawn as solid black circles. It can be seen that the power of some frequency points in the range of 28–70 MHz are lower than the FFTbase (marked by a black rectangle). Using all of the frequency signals in the range of 28–70 MHz (including those frequency points whose spectrum amplitudes are lower than FFTbase), the corresponding power in the space domain is calculated and shown in Figure 3c. The azimuth and elevation of the solution are 71.96 ° and 26.82 ° , respectively. For comparison, the frequency points whose spectrum amplitudes are lower than the FFTbase (marked by a black rectangle in Figure 3b) are omitted and used to calculate the power distribution (shown in Figure 3d). It can be seen that the two power spectrums in Figure 3c,d show a similar pattern. The azimuth and elevation results in Figure 3d are 71.97 ° and 26.82 ° , respectively. It shows that the azimuth and elevation angles derived from the frequency signals including or excluding the low-power frequency points are nearly the same. It is hard to determine which result is more accurate. By checking other positioning windows for the whole lightning flash, the overall differences between the results calculated from the FFT signals including and excluding the low-spectrum frequency points are smaller than 0.05 ° (figures not shown).
The positioning efficiency of the EMTR method can be improved by predefining the spatial domain and by removing low-power frequency points. Compared with using the whole initial domain (0 ° –360 ° for azimuth and 0 ° –90 ° for elevation), it yields a speedup by a factor of 2.5 in terms of GPU time by predefining the spatial domain using the TDOA method (i.e., 0.3 s for the whole initial domain, and 0.12 s for a determined domain in Figure 2c) or by a factor of 3.75 (i.e., 0.3 s for the whole initial domain, and 0.08 s for a determined domain like that in Figure 2d). By removing the low-power frequency points, the overall computation time for the positioning window shown in Figure 3a reduces by a factor of 1.33 (i.e., about 0.12 s for the FFT signals including the low-power frequency points, and about 0.09 s for the FFT signals excluding the low-power frequency points with the computation time of removing low-power frequency points considered). For other positioning windows that are significantly contributed by noise events, more frequency points in the range of 28–70 MHz would be removed as compared with that in Figure 3d, and hence the speedup should be larger. In summary, the computation time can be reduced by a factor of at least 3 to 4 by predetermining the spatial domain and removing the low-power frequency points.

2.3. Filtering Noise Events

After the positioning results for the whole lightning flash are obtained, two metrics, called coherent ratio (CR) and energy ratio (ER) defined by Wang et al. [19], and another metric called signal-to-noise ratio (SNR) are used to filter noise events. CR for the solution at the ith window is calculated as:
CR   =   Number   o f   w   with   D   <   Δ Q
where Q represents the number of windows centered on the ith window, D represents a sphere distance between the wth (w = i   ±   1, 2, 3, …, Q/2) window and the ith window, and Δ represents a distance threshold that can be subjectively determined by evaluating the imaging result of the whole lightning flash. CR can reflect the concentration degree of the solutions within Q adjacent solutions. Filtering those solutions with CR values smaller than 3/Q will remove all the solutions contributed by two or fewer adjacent windows. ER is defined as a logarithmic ratio of the maximum and the mean value of the power P on each grid point. Solutions with ER values lower than 0.85 are removed. The SNR is defined as 20 l o g 10 (Vs/Vn), where Vs and Vn represent the mean magnitude of signals and mean magnitude of noise, respectively. It is calculated using data signals and noise signals which are selected as a combination of some segments (5000 sample points in this study) of signal before the onset of the lightning flash and after the termination of the lightning flash. Those solutions with SNR lower than 0 dB are filtered. After filtering, those solutions which drift over a small region in a short time duration and have high concentration of power as well as high SNR are retained and called “radiation sources” occurring from various types of lightning breakdown processes.
As the initial spatial domain of the EMTR technique is predetermined according to the solution of the TDOA method, this hybrid technique is called the TDOA-EMTR method hereafter in this study. In summary, a block diagram of the TDOA-EMTR method is given in Figure 4.

3. Imaging Capacity and Improvement of TDOA and TDOA-EMTR Method

In this section, in order to demonstrate the imaging capacity of the TDOA-EMTR method, the imaging results for the whole processes of a negative CG and an IC lightning flash mapped by the TDOA method and the TDOA-EMTR method, respectively, are shown and compared. Following Wang et al. [16], the imaging results from the TDOA-EMTR method are firstly filtered using CR with the number of windows Q set to be 10 and then filtered using ER. Then a comparison of the filtered results with the TDOA method is performed. Further, the filtering effectiveness using CR with different values of Q and another metric SNR are examined.
Figure 5 shows the imaging result of a negative CG by the TDOA method and the TDOA-EMTR method. Also shown is the composite high-speed video image of the flash. In Figure 5c, the EMTR location result is filtered using only CR with a window number Q = 10, and a CR threshold of 0.3. In Figure 5d, the EMTR result is further filtered using the metric ER with a threshold of 0.85. From the high-speed video image, only lightning channels that were outside of the cloud can be seen (Figure 5a). The location results of these channels are consistent with those imaged by the TDOA and the TDOA-EMTR methods (Figure 5b,d). Overall, the TDOA method gives 110,698 solutions (Figure 5b), while the TDOA-EMTR method can give 474,633 solutions (Figure 5d). It shows that more than about three times the number of solutions can be obtained by the TDOA-EMTR method than by the TDOA method. However, it can be seen that some scattered noise events across the sky are still retained in the result by the TDOA-EMTR method (Figure 5d), and there are more noise events in Figure 5d than in Figure 5b. It shows that the filtering metrics should be further developed.
Figure 6 shows the imaging result of an IC lightning flash by the TDOA method and the TDOA-EMTR method. The location result is firstly filtered using CR with Q set to 10 and a CR threshold of 0.3 (refer to Figure 6b). Then the remaining noisy events are removed using ER with a threshold of 0.85. The TDOA-EMTR method obtained more than eight times the number of solutions than the TDOA method (221,677 versus 27,044). It can be clearly seen that the channels are more continuous for the TDOA-EMTR method than the TDOA method (as shown by the green dots marked by a black rectangle in Figure 6a,c). These green dots depict the radiation sources occurring simultaneously on the tip of negative leader branches. Similar to the result for the negative CG, some scattered noise events, which should be further filtered, still remained in the result by the TDOA-EMTR method (refer to Figure 6c).
The above results in Figure 5 and Figure 6 show that using a threshold of 0.3 for CR (Q = 10) and a threshold of 0.85 for ER is not enough to filter the noise events. In order to further reduce the false solutions, the filtering metrics are adjusted to some extent. Firstly, the window number Q is modified. Secondly, the SNR is introduced into the filtering procedure. The effect of these two metrics on the final imaging result is examined. Figure 7 shows the imaging results which are filtered with different thresholds for CR without using SNR (Figure 7a–c) and using SNR (Figure 7d–f). With the decrease of window number Q, more solutions are filtered, but the ratio of retained solutions are close to 1 (474633:463135:422856). Comparing the lower panels with their corresponding upper panels, the scattered events across the sky are well removed after filtering with SNR.
The adjustment of the window number Q and adding SNR to the filtering procedure are also applied to the IC lightning flash (refer to Figure 8). It shows that noise events can be further removed by using a small Q and adding SNR as a filtering metric. Compared with the TDOA result in Figure 6a, the TDOA-EMTR result which is filtered by the combination of CR, ER and SNR obtains more solutions and the negative-leader channels are still more continuous.
Statistics of the received signal amplitude solved by the TDOA method and the TDOA-EMTR method for the negative CG and IC lightning flash are shown in Figure 9a,b, respectively. The TDOA-EMTR method can image more low-amplitude signals than the TDOA method for both of the lightning flashes. From Figure 9a, it can be seen that the ratio of solutions obtained by the TDOA-EMTR method to that by the TDOA method ranges from about 1 (for large-amplitude signals) to 9 (for small-amplitude signals). For solutions in the negative CG with a signal amplitude lower than 4 mV, the TDOA method can only give 12,387 solutions, while the TDOA-EMTR method can give 104,659 solutions (Figure 9a). Meanwhile, for the case of IC, the ratio of solutions obtained by the TDOA-EMTR method to that by the TDOA method ranges from about 1 (for large-amplitude signals) to 7 (for small-amplitude signals). The number of solutions with a signal amplitude lower than 4 mV solved by the TDOA method and the TDOA-EMTR method is 17,067 and 69,099 (Figure 9b), respectively.

4. Detailed Imaging Result of the Natural CG Lightning Flash

The lightning channels shown in Section 3 are for the whole lightning flash, and the overall channel structures from the TDOA technique and the TDOA-EMTR technique seems to be generally the same. In this section, detailed results of three leader processes, including a positive leader, a negative leader and a K leader, during the negative CG mapped by the TDOA-EMTR and the TDOA method are further compared to show the superior capacity of the TDOA-EMTR method.
Figure 10 shows the mapping result of breakdown processes on the tip of a negative leader. It can be seen that the TDOA method solved 138 points of radiation sources. In comparison, the TDOA-EMTR method for Q = 10, 6, and 4, solved 619, 610 and 545 points, respectively. Since the radiation sources concentrated on the tip of the negative leader, both the TDOA method and the TDOA-EMTR method could well depict the geometry of the negative leader. Other breakdown processes on the tip of a negative leader also show similar geometry between the TDOA and the TDOA-EMTR method. Although the sources imaged by the TDOA method are more convergent, the TDOA method might miss some minor branches of the leader. It was found that there are streamers and space leaders ahead of a negative leader tip [30]. The TDOA method might only image the strong radiation sources on the trunk channel, while it is hard to capture the weak radiation sources like the streamer and space leaders. In contrast, the more abundant imaged sources from the TDOA-EMTR method results might correspond to the process of streamer and space leaders.
Generally, radiation signals emitted by positive lightning breakdown processes are weak and positive lightning channels are hard to be imaged. Figure 11 shows the mapping result of some positive scattered discharges in a duration of about 0.2 ms on a positive leader channel. For signals whose amplitudes are lower than 4 mV, the TDOA method cannot produce a radiation source while the TDOA-EMTR method can well image the process (as marked by a red rectangle in Figure 11, left panel). Overall, the TDOA method can solve only 11 points of sources while the TDOA-EMTR method can produce more than 28 points (Figure 11, right panel). Correspondingly, the lightning channel by the TDOA method for this positive leader is interrupted (Figure 9b). However, this positive leader channel is more continuous for the TDOA-EMTR method. Combining the gray dots which depict the scattered positive breakdown processes occurring before this time window, the overall structures are more detailed for the TDOA-EMTR method than that for the TDOA method. This result is consistent with the statistics result of received signal amplitude in Figure 9 that more weak sources can be imaged by the TDOA-EMTR method than by the TDOA method.
In Figure 12, a leader process and a K leader process occurring on a previous positive leader is shown. At first, a leader (labeled as A) propagated towards the lower-right. During the development of leader A, the K leader initiated and propagated towards the lower-left. At about 331.68 ms, a branch (labeled as B1) initiated on the K leader and propagated towards the upper-right continuously. About 0.05 ms later (at 331.73 ms), another branch (labeled as B2) initiated and propagated towards the upper-right. At the same time, the leader continued to propagate downward (denoted as branch B3). Then the three branches developed simultaneously. The above development processes of leader A and three branches B1, B2 and B3 can be clearly reflected in Figure 12c–h by the TDOA-EMTR method. However, in Figure 12a,b by the TDOA method, the tail end of leader A cannot be imaged. In addition, branches B1 and B3 are less continuous and the two branches seem to be disconnected from the main leader in Figure 12a,b. The reason might be that when two or more radiation sources arrive at the VHF antenna system simultaneously, the TDOA method cannot distinguish the multiple sources [31].
Combining the statistics result of the received signal amplitude and the detailed mapping result of the lightning leaders in Figure 9, Figure 10, Figure 11 and Figure 12, it can be seen that the TDOA-EMTR method can solve more faint radiations sources as well as simultaneously-occurring sources than the TDOA method. It suggests that the TDOA-EMTR method might be more applicable for the investigation of the development and characteristics of positive leaders, since positive leaders are usually weaker than negative leaders [32] and might be masked by negative leaders.

5. Summary

In this study, a hybrid method called the TDOA-EMTR method, which combines the time difference of arrival (TDOA) technique and the electromagnetic time reversal (EMTR) technique, is developed and used for the 2D lightning VHF location mapping, based on a scalene-triangle configuration of three VHF antennas. The spatial domain for the EMTR method is predetermined according to the location results by the TDOA method. The signal in the frequency domain with low power is removed. The positioning efficiency of the TDOA-EMTR method is substantially improved compared with the EMTR method.
In addition, by adjusting a filtering metric called coherent ratio and adding another filtering metric called signal-to-noise ratio, the noise events are further removed. Comparison of the imaging results by the TDOA method and the TDOA-EMTR method for a natural negative CG lightning flash and an IC lightning flash is performed. The capacity of the TDOA-EMTR method to solve weak sources as well as simultaneously occurring sources is better than the TDOA method. It should be noted that the capacity of the low-frequency (LF) location system (e.g., [33,34]) to show detailed structures of various lightning discharge processes was substantially improved. However, LF system around the observation site is not available in this study. In the future, the LF system will be installed and used to compare with the VHF interferometer in the aspect of performances in imaging detailed lightning structures.

Author Contributions

Conceptualization, Z.S. and F.L.; methodology, F.L. and Z.S.; software, F.L. and Z.S.; validation, F.L. and Z.S.; formal analysis, F.L., Z.S. and S.Y.; investigation, F.L., Z.S., L.W., C.S., H.L., K.Z. and G.T.; resources, M.L.; data curation, Z.S.; writing—original draft preparation, F.L.; writing—review and editing, Z.S. and S.Y.; visualization, F.L.; supervision, F.L.; project administration, Z.S. All authors have read and agreed to the published version of the manuscript.

Funding

The research was supported by the Second Tibetan Plateau Scientific Expedition and Research (STEP) program (2019QZKK0104), National Natural Science Foundation of China (41875008 and 42027803).

Data Availability Statement

Data sharing is not applicable to this article.

Acknowledgments

The authors would like to thank the members of the Institute of Tibetan Plateau Research (ITP), Chinese Academy of Sciences (CAS) for their support during the field experiments for this article.

Conflicts of Interest

The authors declare no conflict of interest.

References

  1. Nag, A.; Murphy, M.J.; Schulz, W.; Cummins, K.L. Lightning locating systems: Insights on characteristics and validation tech-niques. Earth Space Sci. 2015, 2, 65–93. [Google Scholar] [CrossRef]
  2. Wang, Y.; Min, Y.; Liu, Y.; Zhao, G. A New Approach of 3D Lightning Location Based on Pearson Correlation Combined with Empirical Mode Decomposition. Remote. Sens. 2021, 13, 3883. [Google Scholar] [CrossRef]
  3. Wu, T.; Wang, D.; Takagi, N. Lightning Mapping with an Array of Fast Antennas. Geophys. Res. Lett. 2018, 45, 3698–3705. [Google Scholar] [CrossRef]
  4. Qie, X.; Yuan, S.; Chen, Z.; Wang, D.; Liu, D.; Sun, M.; Sun, Z.; Srivastava, A.; Zhang, H.; Lu, J. Understanding the dynam-ical-microphysical-electrical processes associated with severe thunderstorms over the Beijing metropolitan region. Sci. China Earth Sci. 2021, 64, 10–26. [Google Scholar] [CrossRef]
  5. Xiao, X.; Qie, X.; Chen, Z.; Lu, J.; Ji, L.; Wang, D.; Zhang, L.; Chen, M.; Chen, M. Evaluating the Performance of Lightning Data Assimilation from BLNET Observations in a 4DVAR-Based Weather Nowcasting Model for a High-Impact Weather over Beijing. Remote. Sens. 2021, 13, 2084. [Google Scholar] [CrossRef]
  6. Ma, Z.; Jiang, R.; Qie, X.; Xing, H.; Liu, M.; Sun, Z.; Qin, Z.; Zhang, H.; Li, X. A low frequency 3D lightning mapping network in north China. Atmos. Res. 2021, 249, 105314. [Google Scholar] [CrossRef]
  7. Zhu, Y.; Bitzer, P.; Stewart, M.; Podgorny, S.; Corredor, D.; Burchfield, J.; Carey, L.; Medina, B.; Stock, M. Huntsville Alabama Marx Meter Array 2: Upgrade and Capability. Earth Space Sci. 2020, 7, e2020EA001111. [Google Scholar] [CrossRef] [Green Version]
  8. Yuan, S.; Jiang, R.; Qie, X.; Wang, D. Side Discharges from the Active Negative Leaders in a Positive Cloud-To-Ground Lightning Flash. Geophys. Res. Lett. 2021, 48, e2021GL094127. [Google Scholar] [CrossRef]
  9. Zhang, H.; Lu, G.; Lyu, F.; Ahmad, M.R.; Qie, X.; Cummer, S.A.; Xiong, S.; Briggs, M.S. First Measurements of Low-Frequency Sferics Associated with Terrestrial Gamma-Ray Flashes Produced by Equatorial Thunderstorms. Geophys. Res. Lett. 2020, 47, e2020GL089005. [Google Scholar] [CrossRef]
  10. Wang, J.; Zhang, Y.; Tan, Y.; Chen, Z.; Zheng, D.; Zhang, Y.; Fan, Y. Fast and Fine Location of Total Lightning from Low Fre-quency Signals Based on Deep-Learning Encoding Features. Remote Sens. 2021, 13, 2212. [Google Scholar] [CrossRef]
  11. Puričer, P.; Kovář, P.; Mikeš, J. New accuracy testing of the lightning VHF interferometer by an artificial intercloud pulse gener-ator. IEEE Trans. Electromagn. Compat. 2019, 62, 2128–2136. [Google Scholar] [CrossRef]
  12. Urbani, M.; Montanyá, J.; Van der Velde, O.; López, J.; Arcanjo, M.; Fontanes, P.; Romero, D.; Roncancio, J. High-energy radiation from natural lightning observed in coincidence with a VHF broadband interferometer. J. Geophys. Res. Atmos. 2021, 126, e2020JD033745. [Google Scholar] [CrossRef]
  13. Sun, Z.; Qie, X.; Liu, M.; Cao, D.; Wang, D. Lightning VHF radiation location system based on short-baseline TDOA technique—Validation in rocket-triggered lightning. Atmos. Res. 2013, 129, 58–66. [Google Scholar] [CrossRef]
  14. Stock, M.G.; Akita, M.; Krehbiel, P.R.; Rison, W.; Edens, H.E.; Kawasaki, Z.; Stanley, M.A. Continuous broadband digital interferometry of lightning using a generalized cross-correlation algorithm. J. Geophys. Res. Atmos. 2014, 119, 3134–3165. [Google Scholar] [CrossRef]
  15. Sun, Z.; Qie, X.; Jiang, R.; Liu, M.; Wu, X.; Wang, Z.; Lu, G.; Zhang, H. Characteristics of a rocket-triggered lightning flash with large stroke number and the associated leader propagation. J. Geophys. Res. Atmos. 2014, 119, 13–388. [Google Scholar] [CrossRef]
  16. Mora, N.; Rachidi, F.; Rubinstein, M. Application of the time reversal of electromagnetic fields to locate lightning discharges. Atmospheric Res. 2012, 117, 78–85. [Google Scholar] [CrossRef]
  17. Lugrin, G.; Parra, N.M.; Rachidi, F.; Rubinstein, M.; Diendorfer, G. On the Location of Lightning Discharges Using Time Reversal of Electromagnetic Fields. IEEE Trans. Electromagn. Compat. 2013, 56, 149–158. [Google Scholar] [CrossRef]
  18. Wang, T.; Qiu, S.; Shi, L.-H.; Li, Y. Broadband VHF Localization of Lightning Radiation Sources by EMTR. IEEE Trans. Electromagn. Compat. 2017, 59, 1949–1957. [Google Scholar] [CrossRef]
  19. Wang, T.; Shi, L.-H.; Qiu, S.; Sun, Z.; Zhang, Q.; Duan, Y.-T.; Liu, B. Multiple-Antennae Observation and EMTR Processing of Lightning VHF Radiations. IEEE Access 2018, 6, 26558–26566. [Google Scholar] [CrossRef]
  20. Chouragade, J.; Muthu, R.K. Continuous Mapping of Broadband VHF Lightning Sources by Real-Valued MUSIC. IEEE Trans. Geosci. Remote. Sens. 2021, 1–7. [Google Scholar] [CrossRef]
  21. Chen, Z.; Zhang, Y.; Zheng, D.; Zhang, Y.; Fan, X.; Fan, Y.; Xu, L.; Lyu, W. A Method of Three-Dimensional Location for LFEDA Combining the Time of Arrival Method and the Time Reversal Technique. J. Geophys. Res. Atmos. 2019, 124, 6484–6500. [Google Scholar] [CrossRef]
  22. Rubinstein, M.; Rachidi, F.; Stojilovic, M. Development of a lightning location system based on electromagnetic time reversal: Technical challenges and expected gain. In Proceedings of the International Lightning Detection Conference, Fort Lauderdale, FL, USA, 12–15 March 2018. [Google Scholar]
  23. Rison, W.; Krehbiel, P.R.; Stock, M.G.; Edens, H.E.; Shao, X.-M.; Thomas, R.J.; Stanley, M.A.; Zhang, Y. Observations of narrow bipolar events reveal how lightning is initiated in thunderstorms. Nat. Commun. 2016, 7, 10721. [Google Scholar] [CrossRef] [PubMed] [Green Version]
  24. Liu, H.; Qiu, S.; Dong, W. The Three-Dimensional Locating of VHF Broadband Lightning Interferometers. Atmosphere 2018, 9, 317. [Google Scholar] [CrossRef] [Green Version]
  25. Li, S.; Qiu, S.; Shi, L.; Li, Y. Broadband VHF observations of two natural positive cloud-to-ground lightning flashes. Geophys. Res. Lett. 2020, 47, e2019GL086915. [Google Scholar] [CrossRef]
  26. Jensen, D.P.; Sonnenfeld, R.G.; Stanley, M.A.; Edens, H.E.; da Silva, C.L.; Krehbiel, P.R. Dart-Leader and K-Leader Velocity From Initiation Site to Termination Time-Resolved with 3D Interferometry. J. Geophys. Res. Atmos. 2021, 126, e2020JD034309. [Google Scholar] [CrossRef]
  27. Sun, Z.; Qie, X.; Liu, M.; Jiang, R.; Wang, Z.; Zhang, H. Characteristics of a negative lightning with multiple-ground terminations observed by a VHF lightning location system. J. Geophys. Res. Atmos. 2016, 121, 413–426. [Google Scholar] [CrossRef] [Green Version]
  28. Pu, Y.; Qie, X.; Jiang, R.; Sun, Z.; Liu, M.; Zhang, H. Broadband Characteristics of Chaotic Pulse Trains Associated with Sequential Dart Leaders in a Rocket-Triggered Lightning Flash. J. Geophys. Res. Atmos. 2019, 124, 4074–4085. [Google Scholar] [CrossRef]
  29. Li, F.; Sun, Z.; Jiang, R.; Tang, G.; Liu, M.; Li, X.; Zhang, H.; Yuan, S.; Tian, Y.; Qie, X. A Rocket-Triggered Lightning Flash Con-taining Negative-Positive-Negative Current Polarity Reversal During Its Initial Stage. J. Geophys. Res. Atmos. 2021, 126, e2020JD033187. [Google Scholar]
  30. Petersen, D.A.; Beasley, W.H. High-speed video observations of a natural negative stepped leader and subsequent dart-stepped leader. J. Geophys. Res. Atmos. 2013, 118, 12–110. [Google Scholar] [CrossRef]
  31. Wang, T.; Shi, L.; Qiu, S.; Sun, Z.; Duan, Y. Continuous broadband lightning VHF mapping array using MUSIC algorithm. Atmospheric Res. 2019, 231, 104647. [Google Scholar] [CrossRef]
  32. Pu, Y.; Cummer, S.A.; Liu, N. VHF Radio Spectrum of a Positive Leader and Implications for Electric Fields. Geophys. Res. Lett. 2021, 48, e2021GL093145. [Google Scholar] [CrossRef]
  33. Lyu, F.; Cummer, S.A.; Solanki, R.; Weinert, J.; McTague, L.; Katko, A.; Barrett, J.; Zigoneanu, L.; Xie, Y.; Wang, W. A low-frequency near-field interferometric-TOA 3-D Lightning Mapping Array. Geophys. Res. Lett. 2014, 41, 7777–7784. [Google Scholar] [CrossRef]
  34. Wu, T.; Wang, D.; Takagi, N. Velocities of positive leaders in intracloud and negative cloud-to-ground lightning flashes. J. Geophys. Res. Atmos. 2019, 124, 9983–9995. [Google Scholar] [CrossRef]
Figure 1. Schematic diagram of the VHF interferometer configuration and the EMTR method. (a) The three VHF interferometer antennas during the field experiment for this study were configured as a scalene-triangle shape in a horizontal plane, and their locations in Cartesian coordinates are shown in the bracket. A schematic of the received signal waveforms emitted by radiation sources are shown as blue wavy lines on the left side of the antennas. (b) By using the EMTR technique, the signal is reversed and then back-propagated in the space. The reversed signal would focus on the location of the radiation source.
Remotesensing 13 04658 g001
Figure 2. An example showing how the domain of the EMTR method for each positioning window can be determined by the result of the TDOA method. (a) The mapping result for the whole negative CG flash provided by the TDOA method. (b) Imaging result of three radiation sources from three consecutive positioning windows. The inset shows the expanded view. Gray dots depict previous lightning radiation sources. (c) For a positioning window that the TDOA method cannot locate any radiation sources, the domain used for the TDOA-EMTR method is determined according to the mapping result of the whole lightning flash by the TDOA method, and is marked by a gray rectangle (0 ° –100 ° for azimuth and 0 ° –60 ° for elevation). (d) For a positioning window where the TDOA method can locate at least one source, the domain used for the EMTR method is determined as a spatial range that centers on the TDOA result and extends outward 3°. The initial domain in (c) and (d) ranges from 0 ° –360 ° for azimuth and 0 ° –90 ° for elevation, respectively.
Remotesensing 13 04658 g002
Figure 3. An example showing the removing of low-power frequency points and its effect on the EMTR imaging result. (a) One segment of recorded VHF signals lasting for 1024 nanoseconds (512 sampling points). (b) The FFT result of the VHF signals. (c) The power P calculated using all of the FFT signals ranging from 28–70 MHz. (d) Same with (c) but the FFT signals ranging from 28–70 MHz with power lower than FFTbase are not included in the calculation. In (b), the frequency points from 20–28 MHz and 70–80 MHz (NoiseSpectrum) are marked by solid black circles and the FFTbase is shown by a dashed gray line. Frequency points with a power smaller than the FFTbase are marked by a black rectangle.
Remotesensing 13 04658 g003
Figure 4. Block diagram of the TDOA-EMTR method.
Remotesensing 13 04658 g004
Figure 5. Composite high-speed video image (a), imaging result of a negative CG by the TDOA method (b) and the EMTR method with CR and ER as filtering metrics (c,d), where Q is selected to be 10. The numbers of solutions are labeled at the bottom-right corner in panels (bd).
Remotesensing 13 04658 g005
Figure 6. Same as Figure 5bd, but for the IC lightning flash without the composite high-speed video image. The black rectangle in the left-bottom corner in (a,c) marks the region of the negative leader branches.
Remotesensing 13 04658 g006
Figure 7. Imaging results by the TDOA-EMTR method, which are filtered with different thresholds of CR (ac), and further filtered with SNR (df). Note that the imaging result in (a) is the same as that in Figure 5d. The window number Q for CR is 10, 6, and 4 for the left panel, middle panel and right panel, respectively. In all panels, ER is larger than 0.85.
Remotesensing 13 04658 g007
Figure 8. Same as Figure 7, but for the IC lightning flash.
Remotesensing 13 04658 g008
Figure 9. Statistical result of the received signal amplitude by the TDOA method and the TDOA-EMTR method (with Q = 4 and CR 0.75) for the negative CG (a) and the IC lightning flash (b). In the left y axis, counts of solutions for each signal amplitude are shown; in the right y axis, the ratio of the counts of solutions by the TDOA-EMTR method to that by the TDOA method is shown.
Remotesensing 13 04658 g009
Figure 10. The VHF signal and the imaging result by the TDOA method (ab) and by the EMTR method with different window number Q (ch) for a breakdown process on the tip of a negative leader. The VHF signal and the variation of elevation with time are shown in the left panel. The azimuth-elevation of the process is shown in the right panel, with the number of radiation sources shown in the upper-right corner. The gray dots depict the sources occurring before this time. Black arrows show the direction of the negative leader.
Remotesensing 13 04658 g010
Figure 11. Same as Figure 10, but for scattered discharges on a positive leader channel. In the left panel, the red rectangle marks the weak positive discharge processes imaged by different methods. The gray dots depict the scattered sources from positive discharge processes occurring before this time.
Remotesensing 13 04658 g011
Figure 12. Same as Figure 10 but for a leader process (labeled as A) and a K leader on a previous positive leader channel. The three branches of the K leader which occurred simultaneously are labeled as B1, B2 and B3, respectively.
Remotesensing 13 04658 g012
Publisher’s Note: MDPI stays neutral with regard to jurisdictional claims in published maps and institutional affiliations.

