Technical Note

Crop Detection Using Time Series of Sentinel-2 and Sentinel-1 and Existing Land Parcel Information Systems

1
Wirelessinfo, Cholinska 1048/19, 784 01 Litovel, Czech Republic
2
Plan4all z.s., K Rybníčku 557, 330 12 Horní Bříza, Czech Republic
3
Lesprojekt, Martinov 197, 277 13 Záryby, Czech Republic
*
Author to whom correspondence should be addressed.
Submission received: 22 December 2021 / Revised: 15 February 2022 / Accepted: 16 February 2022 / Published: 23 February 2022

Abstract

:
Satellite crop detection technologies are focused on the detection of different types of crops in fields. The information of crop-type area is more useful for food security than the earlier phenology stage is. Currently, data obtained from remote sensing (RS) are used to solve tasks related to the identification of the type of agricultural crops; additionally, modern technologies using AI methods are desired in the postprocessing stage. In this paper, we develop a methodology for the supervised classification of time series of Sentinel-2 and Sentinel-1 data, compare the accuracies based on different input datasets and find how the accuracy of classification develops during the season. In the EU, a unified Land Parcel Identification System (LPIS) is available to provide essential field borders. To increase usability, we also provide a classification of the entire field. This field classification also improves overall accuracy.

1. Introduction

Satellite crop detection technology is focused on the detection of different types of crops in the field in the early stage before harvesting. There exists a large area of domains where such technologies can be used [1,2,3,4,5]. As examples, we can mention:
  • The public sector and organizations dealing with food security, e.g., the Common Agriculture Policy [6] in Europe, GEOGLAM/GEO monitoring [7] and FAO agriculture production monitoring [8];
  • The food industry, investors and business owners for their strategic decisions, investment making and sustainability forecasts [9];
  • Insurance brokers (risk assessment, data collection, client claim verification, etc.) [10];
  • Agriculture machinery producers (information about crops are important for combinations with other information and management) [11].
Multispectral satellite images are used in remote-sensing crop detection. Remote sensing has the advantage of providing information over a large area in a relatively short time. After processing, the images can be used to produce thematic maps. The act of processing the data into maps is called image classification [12]. Two types of classification exist: supervised and unsupervised classification [13].

1.1. Classification

In supervised classification, the analyst selects pixels from the input image based on knowledge of the land cover, also called “training sites” [14]. Each training site is placed in the spectral space based on its values of input layers. The analyst then chooses a statistical rule (an algorithm) that assigns every pixel of the input layers to one of the predefined classes.
Unsupervised classification does not require any prior information about the area of interest [12]. A large number of pixels are analyzed and then classified into several classes based on statistical groupings of pixels in this type of categorization [14].
The first technique, supervised classification, is the most commonly used for quantitative analysis of remote-sensing image data [13]. Generally, supervised classification includes the following practical steps [13]:
  • Output classes—the supervisor determines the number and meaning of the desired classes.
  • Training sites—the supervisor chooses known pixels which represent each of the output classes defined in step 1. Training data can be acquired using site visits, additional measurements, maps, imagery of different origins or photo interpretation of the input layers. When a set of training pixels lies in a region enclosed by a border, we call it a training field;
  • Spectral signature—irrespective of the chosen algorithm, the positions of the training pixels in the spectral space are calculated by the classification software.
  • Classification—each pixel in the image is assigned to one of the classes defined in step 1, whereas in step 2 the supervisor labels only a small portion of the pixels, and all pixels are assigned to a predefined class based on the chosen statistical rule (algorithm);
  • Thematic map production—classification is visualized, the number of pixels in each class may be summarized and from that class, the area can be derived.
  • Accuracy—an important step is to assess the accuracy of the final product.
Supervised classification has the potential to be more accurate than unsupervised classification. However, it is highly dependent on the training sites as well as the skill of the image analyst and the spectral distinction of the classes [14]. If several classes are very similar in terms of spectral reflectance (e.g., annual versus perennial grasslands), classification errors will tend to be high. Supervised classification requires more care in processing the training data. If the training data is poor or unrepresentative, the classification results will also be poor. In general, supervised classification requires more time and money than unsupervised classification, so both methods have advantages and disadvantages.
Most land-cover types are usually classified using a single-date image. This is because land cover does not change rapidly. Crops cultivated on fields, however, undergo fast changes in several months. During the vegetation season, the crop is planted, grows and is harvested. The difference among phenology stages of individual crop types can be used to distinguish crop types from each other. The substitution of single-image classification by time-series classification has a great positive impact on classification accuracy [15,16,17,18].

1.2. Overview of Relations of Phenology and Earth Observation

Phenology is a branch of science that studies the periodic events of biological life cycles that depend on many external environmental influences, such as weather and climate changes and other ecological factors. Over time, species have evolved in response to their environment and adapted specifically to biotic and abiotic factors. Because of these interconnections, the study of phenology is useful in many ways. For example, the study of a plant can provide information about the environment in which it evolves, and conversely, the study of biotic and abiotic factors can help to understand how a plant responds to environmental factors [19]. Moreover, phenological events are easy to observe. Therefore, this science is used in many disciplines such as ecology, climatology, forestry and agriculture.
In agriculture and horticulture, phenology has been used for a very long time. These observations are essential for many practical purposes. They allow, among other things, the careful selection of crops and varieties adapted to the environment and the organization of rotations. They also play an important role in the choice of irrigation, fertilization and protection against pests and diseases. These observations can also be useful in preventing the risk of frost damage and in predicting harvest dates. By studying the phenophases of different crops and taking the right measures at the right time, it is therefore possible to improve management, increase yields, achieve greater stability in production and have better-quality food [20].
Today, climate change impacts all ecosystems and threatens the balance of global food production. In addition, the world population continues to grow (9.7 billion people estimated in 2050 according to the United Nations) [21]. The scientific community must analyze the impacts of climate change and anticipate their consequences in order to propose concrete solutions in terms of the management of living resources. Phenological traits are key characteristics of climate adaptation and are of particular interest to the scientific community [19,22].
Efforts have been made worldwide to enlarge the phenology databases. Data collection and observations have been facilitated by technological advances, progress in computing and satellite remote sensing, which has allowed the development of research methods and models on phenology [19].
Nevertheless, in situ phenological data are only available over limited areas [19]. Since 1970, technical advances in ground-based satellite observations have made it possible to observe phenology on a larger scale. Several satellites can be used for such observations, such as AVHRR (since 1980), MODIS (since 2000) and more recently VIIRS (since 2012) [19,23,24]. The phenology observed at the landscape scale by earth-observation satellites is called land-surface phenology (LSP) [25]. To study phenology at this scale, vegetation indices (VI) are created from land-surface reflectance acquired by satellite optical sensors. The phenology observations obtained by LSP are different from in situ phenology observations. Because they are based on a regional and global scale, these observations can be compared with regional climate information. This makes LSP remote sensing an important biological indicator for detecting the response of terrestrial ecosystems to climate variation.
It is now possible to use the time series of vegetation index response curves to track crops over a growing season. Based on results presented in [26], the development of a vegetation index during the vegetation season was visualized (Figure 1).

1.3. Vegetation Indices

Vegetation indices have been widely used in agriculture for decades. They serve as a tool for monitoring crop health and supporting farmers’ decisions. Vegetation indices are, along with soil and water indices, part of spectral indices which come from satellite multispectral sensors. Mathematically, spectral indices are combinations of surface reflectivity of two or more wavelengths, converting values of multiple spectral bands into a single value [27]. The normalized difference vegetation index (NDVI) and enhanced vegetation index (EVI) are among the most widely used indices [19]. The spectral response of green leaves on which these two indices are based is characterized by strong chlorophyll absorption in the red band and strong reflectance of the leaf structure in the near-infrared band of optical sensors [19]. Nevertheless, in dense vegetation NDVI suffers from saturation [28] which makes the index less suitable for time-series monitoring. Other widely used VI are the (modified) soil-adjusted vegetation indices (SAVI and MSAVI) [29]. They are used most commonly in medium- and low-resolution imagery and low-density vegetation cover due to their ability to minimize soil brightness influences [30]. An appropriate well-established index not suffering from mentioned limits is the enhanced vegetation index (EVI) [31].
VI   = NIR     RED NIR   + 6   RED   7.5   BLUE   + 1
This index was originally developed over NDVI by optimizing the vegetation signal in areas of high leaf area index (LAI). It is most useful in high LAI regions where NDVI may saturate. It uses the blue reflectance region to correct for soil background signals and to reduce atmospheric influences, including aerosol scattering [32]. Interpretation of the EVI values is not important in this study because classification takes into account only the index values.
The radar vegetation index RVI (RVI4S1 for using Sentinel-1 radar data) has been proposed as a method for monitoring the level of vegetation growth, particularly when time series of data are available. RVI is a measure of the randomness of the scattering and is sensitive to biomass; vegetation water content also has low sensitivity to environmental condition effects.
The RVI is the measure of randomness of scattering and can be written as
RVI   = 8 σ HV σ HH +   σ VV   + 2 σ HV
where σ HH and   σ VV   are polarized backscattering coefficients and σ HV is the cross-polarization coefficient in power units. RVI generally ranges from 0 to 1 mostly, similar to how NDVI may exceed 1 in some cases when double-bounce scattering is encountered. The RVI is near zero for a smooth bare surface and increases as the crop grows (up to a point in the growth cycle) [33].

1.4. Land Parcel Information System

The Common Agricultural Policy (CAP) finances, via the European Agricultural Guarantee Fund, direct payments to farmers and measures to face environmental challenges. To guarantee payments are well-distributed, the CAP depends on the Integrated Administration and Control System (IACS). This system comprises solid administrative and on-the-spot checks of subsidy applications and is managed by the member states. The Land Parcel Information System (LPIS) is a key component of the IACS. It contains imagery (aerial or satellite photographs) of all agricultural parcels in the EU. LPIS aims to locate all eligible agricultural land and calculate their maximum eligible area. The area is key information for the calculation of the subsidy amount. Contrariwise, LPIS serves as a basis for cross checking during the administrative control procedures and on-the-spot checks by the paying agency. Member states usually use their LPIS for other environmental rules and restriction applications [34].

1.5. Objectives of Research

The main objectives of our research are:
  • To determine which input dataset gives the best crop classification accuracy;
  • To answer the questions, “What is the development of crop classification accuracy during the vegetation season?” and “When is the classification sufficient for serious yield prediction?”;
  • To determine how to ensure data availability for crop classification—what is the accuracy of classification based on Sentinel-1 data?

2. Materials and Methods

2.1. Pilot Areas

The first experiments with supervised classification were carried out on the Rostenice farm, South Moravia, Czech Republic (Figure 2). In the study year of 2020, the temperature was significantly higher (+2.5 °C) and the year was extraordinarily rich in precipitation (+144 mm) compared to the long-term averages (10.8 °C and 517 mm, respectively). It was the second-rainiest year since the beginning of the weather records (1961). Despite the cloudy and rainy weather, it was possible to find useful satellite images for crop analyses. The terrain is flat, sometimes slightly undulating. The altitude ranges from 194 to 376 m above sea level.

2.2. Used data

2.2.1. Field data

LPIS is regularly used by the farmers, as subsidies need to be updated yearly. It is therefore a valuable source of field data. The availability of LPIS data is dependent on the member state which manages it. In the Czech Republic, field borders from LPIS are publicly available through public export. This dataset does not contain crop data. Each farmer, however, can export their data through private export which also contains crop-type attributes.
This study uses data from Rostenice farm. The farm granted the crop data together with field borders. The Rostenice farm company manages 870 fields, with a total area of 10,094 ha. In this study, we used crops that occupy more than 1.5% of the overall area listed in Table 1.

2.2.2. Satellite Data

In the study, satellite data from Sentinel-1 and Sentinel-2 satellites were used. These data have an optimal combination of spatial resolution (10 m), time resolution (2–3 days) and cost (free). The Sentinel satellites are part of ESA’s space program, Copernicus. The data from all Sentinel satellites are freely available on the Copernicus Open Access Hub maintained by ESA [35].
Sentinel-2 Level 1C images are downloaded from ESA Open Access Hub [35]. Atmospheric corrections are being calculated utilizing Sen2Cor software resulting in Level 2A images that are used for further image processing and vegetation index calculation (NDVI, EVI and others).
Sentinel-1 data request quite extensive preprocessing in several steps, using Sentinel-1 toolbox functions placed in the SNAP Graph Builder process. These include calibration, speckle filtering, terrain correction and others (see Figure 3).
After finalizing the preprocessing steps, the Radar Vegetation Index for Sentinel-1 (RVI4S1) was calculated.
All the satellite-data processing was carried out on our own built cloud environment based on open-source software (OpenStack, CentOS Linux, etc.). Image- and spatial-data-processing software is also open-source (SNAP, QGIS, JupyterHub, GDAL, OrfeoToolbox, etc.)
Sentinel-2 is a state-of-the-art satellite delivering optical data of the studied locality every two or three days with band resolutions 10, 20 and 60 m. Based on the phenology of the crops planted on the area of interest, the period of interest was determined and named “vegetation season”. For the studied crops (Table 1), it runs from the start of March to the end of August. Following the survey of data availability, processing and infrastructure preparation, the methodology was prepared in 2019. The main research was carried out in the vegetation season of 2020. In 2021 it was impossible to use a meaningful amount of Sentinel-2 images due to lingering cloud cover over the studied area.
There were 74 Sentinel-2 images of the studied locality in the vegetation season 2020. However, it was impossible to use 44 of them due to clouds covering most of the image (Figure 4). The remaining 30 images could be hypothetically used for the analysis of part of the farm or individual fields; however, to carry out crop classification, it was essential to use cloud-free images as input layers. Satellite images downloaded from the ESA hub contained metadata about the approximate cloud cover of the scene. There were 19 images that had cloud cover under 10% of the scene area and 9 images with less than 1% of the area under the cloud cover. To have the images equally distributed, one image per month (from March to August) was selected to enter the classification calculation. The dates were 18 March 2020, 22 April 2020, 22 May 2020, 4 June 2020, 1 July 2020 and 28 August 2020, making six EVI layers in total.
Filtering Sentinel-1 images was significantly easier. Sentinel-1 satellites make images of Rostenice farm every 1 or 2 days. To make the calculations less computationally expensive and retain classification quality at the same time, the number of input images was reduced to one image every 6 days starting 16 March 2020 and ending 31 August 2020. There were 26 RVI4S1 layers in total.

2.3. Used Tools and Algorithms

The preprocessed data were loaded into QGIS version 3.16 and classified using Semi-Automatic Classification Plugin version 7 (SCP). The plugin is intensively developed by Luca Congedo [36] and enables many earth-observation operations, including the downloading of satellite images of various sources, preprocessing, clustering, classification and accuracy calculation.
Supervised classification is a common tool to determine land cover. The quality of the output product is strongly dependent on the quality of the defined training areas [37]. The process of definition of output classes is work-intensive, as the supervisor must select a representation of all the desired classes. The training samples for each class should be distributed throughout the layer.
The SCP plugin offers three classification algorithms:
  • Minimum Distance firstly calculates the mean vector for each output class [14]. Each pixel is then assigned to a class based on the shortest distance in the multidimensional space. The minimal distance means maximum similarity [12]. The Minimum Distance algorithm is widely used for classification using remote-sensing data [38]. Theoretically, the algorithm can use one of the following distances: (a) Euclidean Distance, (b) Normalized Euclidean Distance and (c) Mahalanobis Distance. The SCP Minimum Distance algorithm uses Euclidean Distance [36]. This algorithm was chosen to perform the supervised classification because it gives good results in good time.
  • Maximum Likelihood is based on the probability of each belonging to a predefined class [39]. It assumes normal distribution for each class in each band. Each pixel is put in the class that has the highest probability [14]. Maximum likelihood is a computationally expensive and accurate classifier [40]. It is an optimal classifier when the probability distribution functions of classes are Gaussian [12].
  • Spectral Angle Mapping uses the n-dimension angle to match unclassified pixels to training data. The spectral similarity between unclassified pixels and training data is calculated as the spectral angle. Mathematically it is a vector with dimensionality equal to the number of bands [14]. Spectral angle goes from 0, when signatures are identical, to 90 when signatures are completely different. Therefore, a pixel belongs to the class with the lowest angle [36]. It is usually used with data of high spectral dimensionality—a high number of bands or spectrometers recorded [13].

2.4. Experiments Provided

The SCP plugin enables the user to create band sets which are then used as an input to further analyses. The bands in the band sets can be of different origins. The innovative approach of this experiment was to put index layers from different dates and satellites into one band set. By making a vegetation index from a multispectral image, we preserve the important information while making a single-band raster from a multiband image. Thanks to this, we can put more layers from different dates in one band set. Index layers come from both Sentinel-1 and Sentinel-2, radar vegetation index for Sentinel-1 (RVI4S1) and enhanced vegetation index (EVI), respectively.

2.4.1. Supervised Classification for Agricultural Land

As mentioned above, there are two steps when performing supervised classification of a satellite image(s). First is the learning step, in which the supervisor (human) manually identifies the desired categories in the image. The database of the polygons which contains attribute information about the output class is called the “seed sample” or an SCP “training input”. In our experiment, there were altogether 43 training inputs (polygons) for seven categories of the crop (Table 2). For these vector layers, their place in the spectral space—the so-called signature—was calculated. Second is the prediction step, where the algorithm predicts the class for all the pixels of the input layers based on the signature calculated in the first step. In pixel-based classification, the algorithm takes each pixel individually, and using specific decision rules, puts the pixel in one of the predefined classes. In our study, the minimum distance algorithm was applied. It assigned each pixel to one of the seven predefined classes. This process was repeated for all the band sets. As there are many isolated pixels, the performance of the classification was improved by a sieve filter, making the result more compact. The described process is illustrated in Figure 5.

2.4.2. Majority Classification for Field

Although the number of isolated pixels was reduced by the sieve filter, there were usually more classes in one field. When the desired output information should be clear and not a probability of the present categories, the whole polygon must be assigned to the dominant class. Each field was assigned to the most frequent class using the Zonal Statistics tool. The accuracy of this product differs from pixel-by-pixel accuracy and can also be measured. With label rules, the results can be visualized to be suitable for visual interpretation.

2.4.3. Individual Crop Classification

For further improvements and a more detailed understanding of crop types, the classification and accuracy development of individual crops was desired. The accuracy was assessed for all seven classified crops and months of interest. The calculations were realized only for a combination of Sentinel-1 and Sentinel-2 data. The accuracies of individual crop classification are parts of the overall accuracy calculation for a combination of EVI and RVI4S1.

3. Results

3.1. Statistical Evaluation of Results

3.1.1. Supervised Classification of Agricultural Land

Several layers of supervised classification were created in order to compare the results from three aspects (see also Figure 6):
  • The input band sets—Sentinel-1 vs. Sentinel-2. Three types of input were compared. The input layers come from the indices EVI, RVI4S1 or a combination of both. RVI4S1 layers had the lowest accuracy. When the classification was made based on 26 RVI4S1 layers from March till August and was improved by the sieve filter, the overall accuracy came to 67%. When the input was made of seven EVI layers, the overall accuracy reached up to 91% without sieve improvement. The third set of inputs consisted of the combination of EVI and RVI4S1 layers. The overall accuracy of the classification coming from the band set reached 89% without the sieve filter.
  • Number of layers. As expected, the overall accuracy of the supervised classification roses when more data came into the input band set. If we want to identify the crop in March, there is 51% overall accuracy with March satellite images from both Sentinel-1 and Sentinel-2. When we add April data, the accuracy jumps to 68%. By further adding index layers from later months, we can obtain up to 93% overall accuracy.
  • Sieve filtering. The resulting layers, which were postprocessed by the sieve filter, show higher accuracy than without it in all classifications. The effect of the sieve filter is stronger on classification with RVI4S1 because these classifications contain more isolated pixels and small islands of pixels than classifications coming from EVI. The sieve filter applied on EVI+RVI4S1 classifications has a higher effect, with fewer data (early months) and lower accuracy than with high-accuracy classifications.
From the example of the confusion matrix of individual classes (Table 3) it is possible to explore how many pixels of a specific crop were misclassified as other crop types. This shows how similar the crops are during the vegetation season. The rest of the confusion matrices are appended in Appendix A.

3.1.2. Majority Classification for Field

In order to make the results easy to understand and practical to use, every field was assigned one prevalent class based on the highest representation of a class within the field. The real and classified attributes were visualized with multilabels (Figure 7).
The accuracy of the majority classification is summarized in Table 4. The accuracy values are mostly slightly higher compared to the pixel classification. The highest value is 96.3%. When processing Sentinel-1 data, the area of the field had an influence over the accuracy. When small fields (less than 10 ha) were filtered out, the accuracy of the majority classification increased in all months. On average, the accuracy improved by 9.6%. On the contrary, if only small fields were kept in the dataset, the classification accuracy decreased significantly; the mean fall was 10.7%.

3.1.3. Individual Crop Accuracy

Individual crop classification shows more details than the overall accuracy of the whole classified layer. The accuracy development is not equal for all the crop types. While Poppy starts with 0% accuracy in March and ends with 97.5% accuracy in August, the accuracy of Winter wheat rises from 62.0% to 80.1%, which makes only an 18.1% increase. We see that Spring barley already has 91.4% classification accuracy in May and Corn is recognized with 96.2% accuracy in June (Table 5).

3.2. Visual Interpretation

Chosen classification outputs were published using the HSLayers-NG web mapping framework [41] and are available on the Agrihub web portal (Figure 8).
This application allows to visualize time series of data during the season by using date selection control, applying data transparency and combining data with field data and data from ground measurement. The map window can also be split and multiple layers can be compared at one moment using the swipe control. Any other relevant data can be also added to the map from other resources (WMS, files, etc.) to find possible correlations.

4. Discussion

The agriculture of developed countries is strongly dependent on subsidies and there is no sign that this should change in the future. More likely, subsidies will become even higher and more important for landscape management. A potential utilization of this method is checking agriculture subsidies.
Public availability of field borders (LPIS) supports necessary innovation in the agricultural sector, especially in combination with open and quality satellite data of sufficient space and time resolution, such as the Sentinel mission.
Sentinel-2 satellites produce excellent data but also have a serious limitation that cannot be ignored. Due to the physical principle of the limit, Sentinel-2′s optical sensor cannot be improved to overcome clouds. The ambition of satellite earth observation is to be an essential part of the food industry in many ways. To make this possible, the data need to be reliable and regularly available even if it is cloudy for a long period. In this study, we investigated possible Sentinel-1 alternatives in case of scarcity of Sentinel-2 data. The radar data are not degraded by clouds, so a usable Sentinel-1 image is ready on a regular basis. Further preprocessing steps are needed to obtain the correct radar signal values. Even after these adjustments, the radar vegetation index values for Sentinel-1 vary significantly within a field.
In this study, EVI was identified as the most suitable vegetation index to be used as input for the classification. However, not only one single index needs to be used. Similarly, as EVI was combined with RVI4S1, it can be combined with any other optical vegetation index. Ninety-one vegetation indices coming from the Sentinel-2 image were used as an input for crop classification in [42]. Single-image classification used in that study was upgraded to multi-image classification in our study. The available computational sources together with an increasing number of Earth-observing satellites have led to increased attention to the potential of multi-source satellite imagery, as is reviewed in [43]. There are plenty of other satellites that could be added to crop-classification development efforts, especially Landsat missions. Potential improvements of classification accuracy development during the vegetation season can be achieved by comparison of the classification algorithms, development of improved classification algorithms or application of machine learning algorithms [44]. Further investigation in this field of study with emphasis on development during the season would be beneficial as most of the studies care only about the highest accuracies at the end of the season [17,18,42,43,44].
Another modern alternative coming into question is Unmanned Aerial Vehicles (UAVs) [45]. They are ready to collect data whenever the user needs it and can go high enough for even cloud cover to not be an obstacle. On the other hand, wind can make it impossible to fly a UAV. Moreover, the time consumption of a UAV flight is disproportionately high compared with the satellite data download. The key decision element of choosing the data acquisition platform is spatial resolution. If the purpose of the application is crop detection on a regional or national scale, there is no point in thinking about UAVs. A resolution of 10 m which Sentinel satellites offer is just enough for most applications concerning most common crops such as cereals, corn and oilseed rape (in Europe). It is more profitable to grow these crops on large fields, as big machines are used to handle them. It is not an exception when the fields are tens of hectares. On the other hand, there are a lot of niche crops that are typically grown on a few acres. UAV’s spatial resolution of several centimeters per pixel is fine for these high-value crops (grapevines, vegetables, various kinds of berries, herbs, etc.). A promising idea worthy of further research is the combination of satellite and drone data. The drone data can be used to increase the spatial resolution and to calibrate the satellite data.
Crop-phenology dynamics inspired us to use time series of vegetation indices for crop detection during different stages of vegetation growth. If the experiment will be reproduced at another site, it is important to determine the specific period of interest based on the phenology of the crops to be detected. Our work shows that the use of time series can significantly improve the accuracy of the classification of individual crops compared to single-image classification. Surprisingly, it is possible to have good estimates already in April (72%) and very accurate results in May (84%). This could be important for many purposes, especially for food security strategies but also for the food market. The earlier reliable predictions are available, the more effective the reaction can be. Remote-sensing crop detection is the key to global yield estimates. If we know how big an area is sown by which crop, we only need an average yield per hectare to predict the yield and we do not have to be surprised with the yields after harvest.
This study was intended as an experiment to learn how reliable satellite-data-based crop classification is. We classified only fields where classification could be verified, i.e., where we have crop data from the farmer. This did not bring any added value to the farmer, but we confirmed that it is possible to use this method in unknown fields and expect similar accuracy. Supervised classification always needs some training data so the area cannot be unknown. Nevertheless, when the field borders are available (for example LPIS), it is possible to classify all the fields in the Sentinel tile using data from only a farmer or a few farms. It is important to train all the classes which are desired as the outcome.

5. Conclusions

The main contribution of this study is the accuracy development of crop detection during the vegetation season.
The results reveal a higher classification accuracy based on Sentinel-2 data than the Sentinel-1-based classification. However, this does not mean that Sentinel-1 data are useless. When there are enough Sentinel-2 data, it is better to use them. Nevertheless, a lack of Sentinel-2 data can occur, and in this case, we are ready to use the Sentinel-1 alternative.
Based on the experiments, further research will continue. We assume that there is still some space for improvement of crop-classification accuracy. Individual crop-detection accuracy assessments showed that there are significant differences among crops. From the confusion matrices, appended in Appendix A, we can learn which crop types were hard for the classifier to distinguish between. These crop types can be better trained by adding some training data. We will also deal with the utilization of unsupervised classification. It is much less time-demanding, as there is no training stage and we do not need any other data besides satellite data. Extensive cloud cover for most of the 2021 vegetation season demonstrated that further research of a Sentinel-2 alternative is needed, as there is no guarantee of the availability of these data.

Author Contributions

Conceptualization, K.C. and H.S.; methodology, H.S.; software, J.K.; validation, J.K. and F.Z.; formal analysis, H.S.; investigation, H.S., V.O.; resources, H.K.; data curation, J.K.; writing—original draft preparation, H.S., V.O., J.S. and I.B.; writing—review and editing, K.C.; visualization, F.Z.; supervision, K.C.; project administration, H.K.; funding acquisition, H.K. All authors have read and agreed to the published version of the manuscript.

Funding

This research was funded by EU Research and Innovation Programme H2020, EO4Agri, Grant number 821940; and SmartAgriHubs, Grant number 818182.

Institutional Review Board Statement

Not applicable.

Informed Consent Statement

Not applicable.

Data Availability Statement

Not applicable.

Conflicts of Interest

The authors declare no conflict of interest.

Appendix A. Confusion matrices of the supervised classification

Explanatory notes:
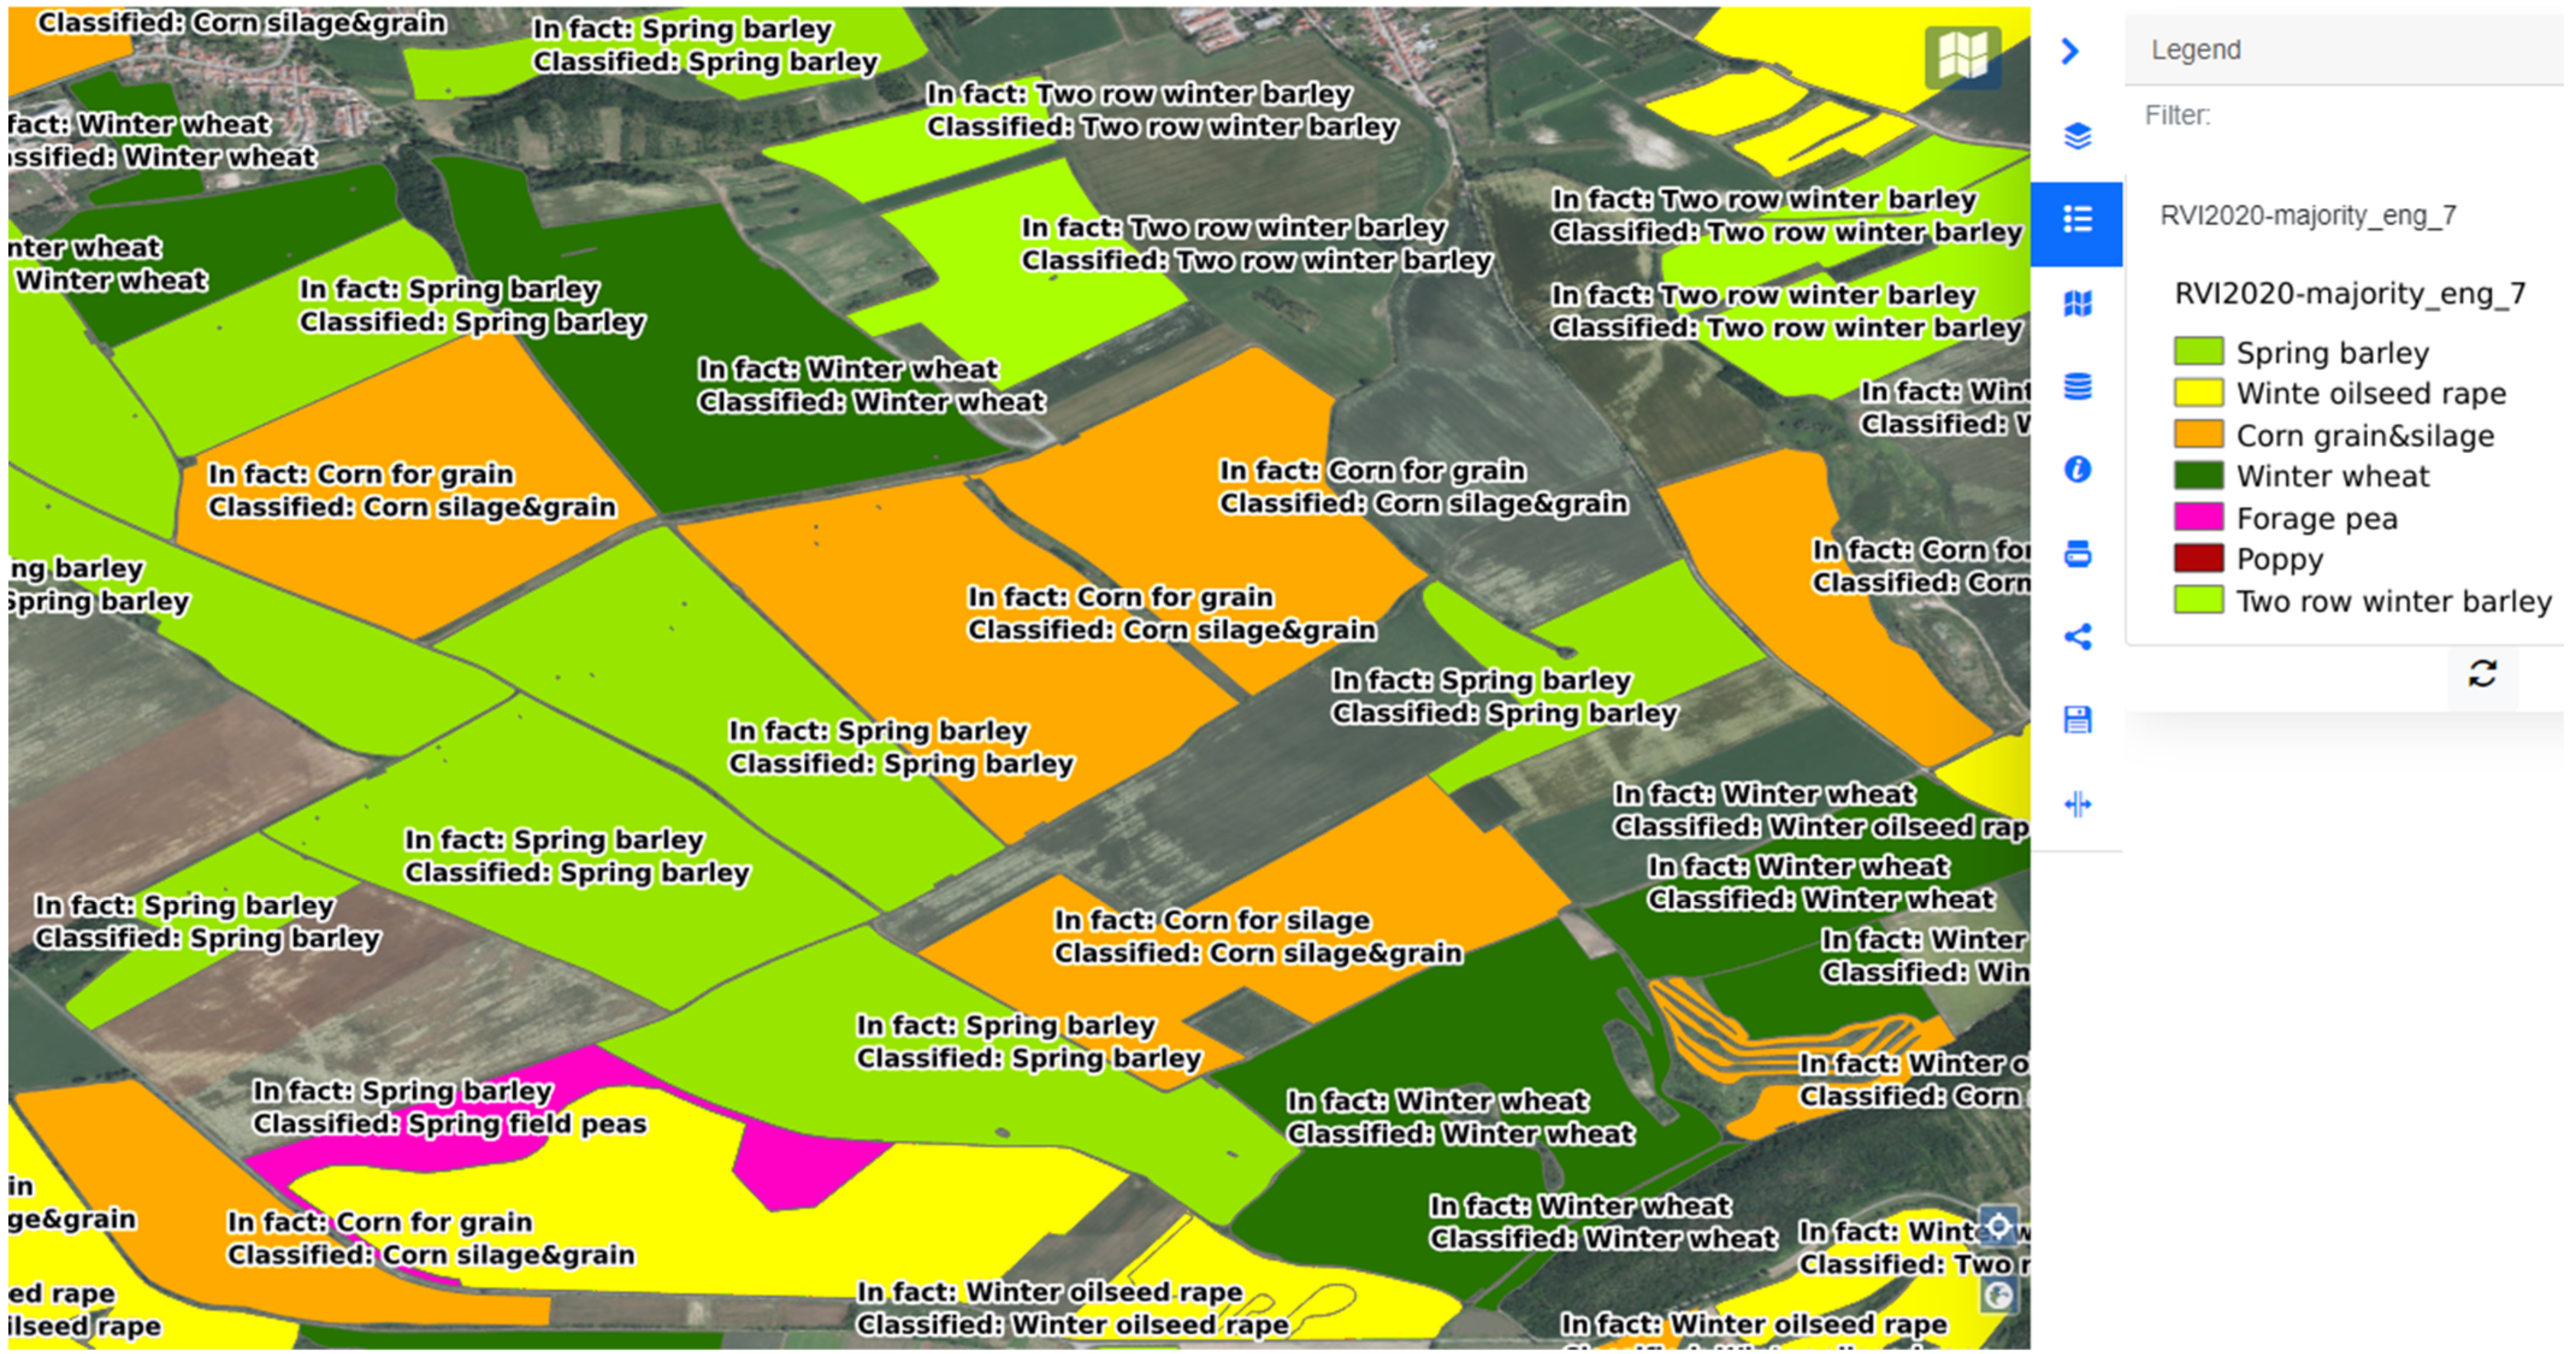
Reference—from the farmer’s dataset, true
Classified—classification layer, prediction
1—Spring barley
2—Winter oilseed rape
3—Corn for grain and silage
4—Winter wheat
5—Spring field peas
6—Poppy
7—Two-row winter barley
RVI4S1+EVI-based classification before sieve filtering
Table A1. Error matrix for RVI4S1 + EVI-based classification before sieve filtering in March.
>ERROR MATRIX (Pixel Count)
>Reference
V_Classified1234567Total
1214,78533755,3601416493717214284,302
2607695258814,683229078926,044
3154,3903907117,16677258961822419300,392
487359,6473979102,92148309831177,734
5124948783251582203550013,728
612860323034101644
78246,61625838,87620023,372109,224
Total372,725118,689187,999165,92818,25515,44734,025913,068
Table A2. Error matrix for RVI4S1 + EVI-based classification before sieve filtering in March + April.
> ERROR MATRIX (Pixel Count)
>Reference
V_Classified1234567Total
1262,2681473389722403622141270,455
21307101,18144638,0242101597142,576
341,8571015114,9486839752507521733,32
495310,2429997,2341508708117,251
512,09810719,71710140098891836,939
645,1372343,807453616846810101,106
7993163024,1790022,93350,374
Total363,719117,204182,914162,50617,77514,64633,269892,033
Table A3. Error matrix for RVI4S1 + EVI-based classification before sieve filtering in March + April + May.
>ERROR MATRIX (Pixel Count)
>Reference
V_Classified1234567Total
1333,95117204881514631403338,347
21446108,18622725,887360626136,408
32870801144,7812456179927583155,468
42334391721108,388004969119,629
519,33428411,59947512,889371044,952
651891128,962200241811,8264048,646
71852412122,1130027,66152,372
Total365,309117,331186,079161,03317,77314,99533,302895,822
Table A4. Error matrix for RVI4S1 + EVI-based classification before sieve filtering in March + April + May + June.
>ERROR MATRIX (Pixel Count)
>Reference
V_Classified1234567Total
1326,51216941981553470451330,473
23617108,9058922,164300400135,205
31208269180,91830604716792186,607
44794323130114,820003986126,861
524,870596288136514,404423243,541
63268124034220247013,9724124,017
71422377018,4690028,81449,802
Total364,411117,084188,150160,65117,84515,11933,246896,506
Table A5. Error matrix for RVI4S1 + EVI-based classification before sieve filtering in March + April + May + June + July.
>ERROR MATRIX (Pixel Count)
>Reference
V_Classified1234567Total
1337,60013611231263266100340,623
22062108,9628825,092220186136,412
3927351188,07927751441075192,388
43441169126127,00600560132,724
520,70030437242915,260397137,463
6184511804249224614,7424019,937
7744667050070032,77942,527
Total366,649117,347189,492161,82117,93815,25633,571902,074
Table A6. Error matrix for RVI4S1 + EVI-based classification before sieve filtering in March + April + May + June + July + August.
>ERROR MATRIX (Pixel Count)
>Reference
V_Classified1234567Total
1338,1751044731285176274340,784
22219113,2668022,979300154138,728
3945137187,908217555360191,256
421158144128,84000550132,323
519,23758418490115,073315036,294
6192635594259251114,8483820,211
7931657043460032,87338,969
Total364,710117,537188,843160,78517,84515,22633,619898,565
EVI-based classification before sieve filtering
Table A7. Error matrix for EVI-based classification before sieve filtering in March.
>ERROR MATRIX (Pixel Count)
>Reference
V_Classified1234567Total
1162,062328,3210240353390198,128
290441,327555660,418586257573116,389
3133,646776498,80312,82610,2537150219270,661
442941,638130862,42710237787113,694
515,36179115,81175918238371135,393
678,7737546,93423342730170132,249
75434,70619539,1200020,33794,412
Total391,229126,304196,928175,57318,59416,37135,927960,926
Table A8. Error matrix for EVI-based classification before sieve filtering in March + April.
>ERROR MATRIX (Pixel Count)
>Reference
V_Classified1234567Total
1330,55822285357263313667244341,628
283035,9883260,706008140105,696
345012594141,11110159629262810161,488
479669,61468690,89214175232167,251
548,3724717,207355502009073,188
661022332,5350326511,045052,970
77015,810020,3240022,50158,705
Total391,229126,304196,928175,57318,59416,37135,927960,926
Table A9. Error matrix for EVI-based classification before sieve filtering in March + April + May.
>ERROR MATRIX (Pixel Count)
>Reference
V_Classified1234567Total
1345,035235427514701435714349,348
2105091,7251530,592001286124,668
330292151173,6932140132886738183,246
468427,658344120,18813157250156,152
538,08316855948111,0601178356,167
632945517,00548605014,254440,710
7542193021,0540027,33250,633
Total391,229126,304196,926175,57318,59416,37135,927960,924
Table A10. Error matrix for EVI-based classification before sieve filtering in March + April + May + June.
>ERROR MATRIX (Pixel Count)
>Reference
V_Classified1234567Total
1361,6553231530174120612117367,501
298797,3801325,553121467125,403
32239638190,355162046785244196,215
480021,993351122,58128318343154,127
522,41028915956813,396915038,673
629844340828449614,450026,063
71542730024,0020026,05652,942
Total391,229126,304196,926175,57318,59416,37135,927960,924
Table A11. Error matrix for EVI-based classification before sieve filtering in March + April + May + June + July.
>ERROR MATRIX (Pixel Count)
>Reference
V_Classified1234567Total
1365,477352227228331396712372,322
249082,003418,85402665102,018
3997772193,35311541889165196,620
4108712,931244146,7773130665161,765
516,8571192688414,300483332,114
662842992785159393615,698129,162
73726,658057120034,51666,923
Total391,229126,304196,926175,57318,59416,37135,927960,924
Table A12. Error matrix for EVI-based classification before sieve filtering in March + April + May + June + July + August.
>ERROR MATRIX (Pixel Count)
>Reference
V_Classified1234567Total
1366,17428721002788173807372,194
2571100,6343411,669141756113,679
3787716193,8577251184743196,293
410919197201153,7111331652164,896
515,45911325510214,180553230,664
671134552479417409615,659630,225
73412,317061610034,46152,973
Total391,229126,304196,926175,57318,59416,37135,927960,924
RVI4S1-based classification after sieve filtering
Table A13. Error matrix for RVI4S1-based classification after sieve filtering in March.
>ERROR MATRIX (Pixel Count)
>Reference
V_Classified1234567Total
156,92714,03525,21712,393265020401761115,023
2980896572122746291773927
3240,95125,295129,25018,807976111,5571617437,238
447,26967,41619,699119,811486274828,381288,186
57778347014332071512
6112215863536441112007
7390438351763521535281117716,327
Total351,930111,718177,606157,63217,74714,46633,121864,220
Table A14. Error matrix for RVI4S1-based classification after sieve filtering in March + April.
>ERROR MATRIX (Pixel Count)
>Reference
V_Classified1234567Total
11634277734129486302885
243,68848,94617,21025,93636215111841141,753
3174,56632,18074,51814,56463343025611305,798
4710411,807397962,900357016,299102,446
511,948162563782542389018,760
6108,901496475,4431527635410,60141207,831
7478113,232207753,7572991014,30488,460
Total352,622111,568179,598158,89517,55514,59933,096867,933
Table A15. Error matrix for RVI4S1-based classification after sieve filtering in March + April + May.
>ERROR MATRIX (Pixel Count)
>Reference
V_Classified1234567Total
1235,96535,46510,25412,009587384645300,457
217,38228,637197913,44818061260363,867
340,32010,121117,2288278591566762046190,584
419,81428,292215198,327636416,034165,258
528,866191426496351513131035,708
689159844,609198142171823162,454
714725772329324,3362763814,19249,379
Total352,734110,299182,163157,23117,44014,88932,951867,707
Table A16. Error matrix for RVI4S1-based classification after sieve filtering in March + April + May + June.
>ERROR MATRIX (Pixel Count)
>Reference
V_Classified1234567Total
1272,98244,66110,11415,1896367700171350,184
213,98324,03295211,2301077050951,783
322,1134849135,3947476625384051274185,764
418,55025,548136791,581486312,569150,104
518,863177237458042059307227,552
640501528,3338278653063338,605
725918212212429,5173753617,98560,840
Total353,132109,089182,029155,87917,40314,75732,543864,832
Table A17. Error matrix for RVI4S1-based classification after sieve filtering in March + April + May + June + July.
>ERROR MATRIX (Pixel Count)
>Reference
V_Classified1234567Total
1277,67334,312705510,341573733969335,526
218,77729,751132514,49610631430865,734
319,7217003142,8958559641798771373195,845
413,32824,074128490,56146157926137,639
521,13025994348102727052603032,099
61364023,376665614346029,713
7144711,125231330,3183792923,06868,679
Total353,440108,864182,596155,36817,32314,87032,774865,235
Table A18. Error matrix for RVI4S1-based classification after sieve filtering in March + April + May + June + July + August.
>ERROR MATRIX (Pixel Count)
>Reference
V_Classified1234567Total
1270,77732,095579210,465537641386325,004
229,80633,524112615,3981141130081,296
315,9987213142,761640270288561780188,743
410,51422,76860693,82434348941137,000
519,95130852923125124242562129,911
629331127,4471747195360036,644
71056901098326,3002012022,22659,796
Total351,035107,706181,638153,81417,23214,61532,354858,394
RVI4S1 + EVI-based classification after sieve filtering
Table A19. Error matrix for RVI4S1 + EVI-based classification after sieve filtering in March.
>ERROR MATRIX (Pixel Count)
>Reference
V_Classified1234567Total
1189,7954231,59258258460540230,125
253131,036527051,4315914432993,192
3156,8726812113,73511,33711,692937038309,856
450440,61569261,3584815409108,627
5350122717353986948697
643,06712238,331572677933985,196
711047,55513551,27916026,138125,233
Total391,229126,304196,928175,57318,59416,37135,927960,926
Table A20. Error matrix for RVI4S1 + EVI-based classification after sieve filtering in March + April.
>ERROR MATRIX (Pixel Count)
>Reference
V_Classified1234567Total
1262,2681473389722403622141270,455
21307101,18144638,0242101597142,576
341,8571015114,948683975250752173,332
495310,2429997,2341508708117,251
512,09810719,71710140098891836,939
645,1372343,807453616846810101,106
7993163024,1790022,93350,374
Total363,719117,204182,914162,50617,77514,64633,269892,033
Table A21. Error matrix for RVI4S1 + EVI-based classification after sieve filtering in March + April + May.
>ERROR MATRIX (Pixel Count)
>Reference
V_Classified1234567Total
1333,95117204881514631403338,347
21446108,18622725,887360626136,408
32870801144,7812456179927583155,468
42334391721108,388004969119,629
519,33428411,59947512,889371044,952
651891128,962200241811,8264048,646
71852412122,1130027,66152,372
Total365,309117,331186,079161,03317,77314,99533,302895,822
Table A22. Error matrix for RVI4S1 + EVI-based classification after sieve filtering in March + April + May + June.
>ERROR MATRIX (Pixel Count)
>Reference
V_Classified1234567Total
1326,51216941981553470451330,473
23617108,9058922,164300400135,205
31208269180,91830604716792186,607
44794323130114,820003986126,861
524,870596288136514,404423243,541
63268124034220247013,9724124,017
71422377018,4690028,81449,802
Total364,411117,084188,150160,65117,84515,11933,246896,506
Table A23. Error matrix for RVI4S1 + EVI-based classification after sieve filtering in March + April + May + June + July.
>ERROR MATRIX (Pixel Count)
>Reference
V_Classified1234567Total
1337,60013611231263266100340,623
22062108,9628825,092220186136,412
3927351188,07927751441075192,388
43441169126127,00600560132,724
520,70030437242915,260397137,463
6184511804249224614,7424019,937
7744667050070032,77942,527
Total366,649117,3471894,92161,82117,93815,25633,571902,074
Table A24. Error matrix for RVI4S1 + EVI-based classification after sieve filtering in March + April + May + June + July + August.
>ERROR MATRIX (Pixel Count)
>Reference
V_Classified1234567Total
1338,1751044731285176274340,784
22219113,2668022,979300154138,728
3945137187,908217555360191,256
421158144128,84000550132,323
519,23758418490115,073315036,294
6192635594259251114,8483820,211
7931657043460032,87338,969
Total364,710117,537188,843160,78517,84515,22633,619898,565
EVI-based classification after sieve filtering
Table A25. Error matrix for EVI-based classification after sieve filtering in March.
>ERROR MATRIX (Pixel Count)
>Reference
V_Classified1234567Total
1189,7954231,59258258460540230,125
253131,036527051,4315914432993,192
3156,8726812113,73511,33711,692937038309,856
450440,61569261,3584815409108,627
5350122717353986948697
643,06712238,331572677933985,196
711047,55513551,27916026,138125,233
Total391,229126,304196,928175,57318,59416,37135,927960,926
Table A26. Error matrix for EVI-based classification after sieve filtering in March + April.
>ERROR MATRIX (Pixel Count)
>Reference
V_Classified1234567Total
1333,9271878488516264450936342,905
253530,22086358,20800666896,494
317711371151,48481810,1318610166,436
459978,64746096,4377203776179,991
548,9112310,195175362725065,233
653931829,04023297914,276051,729
79314,147118,4446025,44758,138
Total391,229126,304196,928175,57318,59416,37135,927960,926
Table A27. Error matrix for EVI-based classification after sieve filtering in March + April + May.
>ERROR MATRIX (Pixel Count)
>Reference
V_Classified1234567Total
1350,6421675127963716611042354,551
2763101,5085827,068220379129,798
3961953182,07815719175760187,056
434320,9251017127,477905935155,706
535,52922117133311,537587049,620
629231110,7814594315,098034,760
7681011018,7830029,57149,433
Total391,229126,304196,926175,57318,59416,37135,927960,924
Table A28. Error matrix for EVI-based classification after sieve filtering in March + April + May + June.
>ERROR MATRIX (Pixel Count)
>Reference
V_Classified1234567Total
1363,046216556081312612732366,869
2603100,2812221,91060837123,659
31281341191,95117853747250196,457
437816,645278125,1111606681149,109
518,880167133813,413157032,758
6251919730399414,520022,007
718223041220,7420026,80050,040
Total386,889121,904193,929170,36917,92915,52934,350940,899
Table A29. Error matrix for EVI-based classification after sieve filtering in March + April + May + June + July.
>ERROR MATRIX (Pixel Count)
>Reference
V_Classified1234567Total
1366,94423694421238756915371,152
222584,0481516,19613066100,563
3854329194,6431495894513197,468
46597709216147,61500100156,299
513,6561531014,465127028,402
642309926811314115,803023,552
74826,572057496034,67667,051
Total386,616121,279195,585172,30417,78916,04434,870944,487
Table A30. Error matrix for EVI-based classification after sieve filtering in March + April + May + June + July + August.
>ERROR MATRIX (Pixel Count)
>Reference
V_Classified1234567Total
1371,66320523351356707314375,563
2348104,1387747590049112,107
3961207195,936159146330198,774
47047018242158,7907090166,851
512,326933315,055267027,747
6518027040374332615,998025,251
74712,526062840035,77454,631
Total391,229126,304196,926175,57318,59416,37135,927960,924

References

  1. Šafář, V.; Charvát, K.; Horáková, Š.; Orlickas, T.; Rimgaila, M.; Kolitzus, D.; Bye, B.L. D2.2 Initial Workshop—User Requirements and Gap Analysis in Different Sectors Report; EO4AGRI Consortium: Madrid, Spain, 2019. [Google Scholar] [CrossRef]
  2. Šafář, V.; Charvát, K.; Horáková, Š; Orlickas, T. D2. 3 Mid-Term Workshop-User Requirements and Gap Analysis in Different Sectors. EO4AGRI Consortium. 2020. Available online: https://zenodo.org/record/4247303/files/EO4AGRI_D2.3-Mid-Term-Workshop---User-Requirements-and-Gap-Analysis-in-Different-Sectors-Report_v2.0.pdf (accessed on 21 December 2021).
  3. Kubíčková, H.; Šafář, V.; Kozel, J.; Král, M.; Křivánek, K.; Řezník, T.; Šmejkal, J.; Vrobel, J.; Zadražil, F.; Charvát, K.; et al. D2.4 Final Workshop—User Requirements and Gap Analysis in Different Sectors Report, EO4AGRI Consortium. Available online: https://ec.europa.eu/research/participants/documents/downloadPublic?documentIds=080166e5d0f69ec0&appId=PPGMS (accessed on 21 December 2021).
  4. Budde, M.E.; Rowland, J.; Funk, C.C. Agriculture and food availability—Remote sensing of agriculture for food security monitoring in the developing world. In Earthzine; IEEE: Washington, DC, USA, 2010. [Google Scholar]
  5. Young, O.R.; Onoda, M. Satellite Earth Observations in Environmental Problem-Solving. In Satellite Earth Observations and Their Impact on Society and Policy; Springer: Singapore, 2017; pp. 3–27. [Google Scholar]
  6. Schmedtmann, J.; Campagnolo, M.L. Reliable Crop Identification with Satellite Imagery in the Context of Common Agriculture Policy Subsidy Control. Remote Sens. 2015, 7, 9325–9346. [Google Scholar] [CrossRef] [Green Version]
  7. Whitcraft, A.K.; Becker-Reshef, I.; Justice, C.O. A Framework for Defining Spatially Explicit Earth Observation Requirements for a Global Agricultural Monitoring Initiative (GEOGLAM). Remote Sens. 2015, 7, 1461–1481. [Google Scholar] [CrossRef] [Green Version]
  8. Reynolds, C.A.; Yitayew, M.; Slack, D.C.; Hutchinson, C.F.; Huete, A.; Petersen, M.S. Estimating crop yields and production by integrating the FAO Crop Specific Water Balance model with real-time satellite data and ground-based ancillary data. Int. J. Remote Sens. 2000, 21, 3487–3508. [Google Scholar] [CrossRef]
  9. Rembold, F.; Atzberger, C.; Savin, I.; Rojas, O. Using Low Resolution Satellite Imagery for Yield Prediction and Yield Anomaly Detection. Remote Sens. 2013, 5, 1704–1733. [Google Scholar] [CrossRef] [Green Version]
  10. Benami, E.; Jin, Z.; Carter, M.R.; Ghosh, A.; Hijmans, R.J.; Hobbs, A.; Kenduiywo, B.; Lobell, D.B. Uniting remote sensing, crop modelling and economics for agricultural risk management. Nat. Rev. Earth Environ. 2021, 2, 140–159. [Google Scholar] [CrossRef]
  11. Vlasova, A. Digitalization of agriculture. In Digital Agriculture-Development Strategy, Proceedings of International Scientific and Practical Conference (ISPC 2019), 21-22 March 2019, Ekaterinburg, Russia; Atlantis Press: Paris, France, 2019; pp. 405–409. [Google Scholar]
  12. Jog, S.; Dixit, M. Supervised classification of satellite images. In Proceedings of the 2016 Conference on Advances in Signal Processing (CASP) IEEE, Pune, India, 9–11 June 2016; pp. 93–98. [Google Scholar]
  13. Richards, J.A. Supervised Classification Techniques. In Remote Sensing Digital Image Analysis: An Introduction; Richards, J.A., Ed.; Springer: Berlin/Heidelberg, Germany, 2013; pp. 247–318. [Google Scholar]
  14. Boori, M.; Paringer, R.; Choudhary, K.; Kupriyanov, A.; Ras, M. Comparison of hyperspectral and multi-spectral imagery to building a spectral library and land cover classification performance. Comput. Opt. 2018, 42, 1035–1045. [Google Scholar] [CrossRef]
  15. Bargiel, D. A new method for crop classification combining time series of radar images and crop phenology information. Remote Sens. Environ. 2017, 198, 369–383. [Google Scholar] [CrossRef]
  16. Simonneaux, V.; Duchemin, B.; Helson, D.; Er-Raki, S.; Olioso, A.; Chehbouni, A.G. The use of high--resolution image time series for crop classification and evapotranspiration estimate over an irrigated area in central Morocco. Int. J. Remote Sens. 2008, 29, 95–116. [Google Scholar] [CrossRef] [Green Version]
  17. Zhong, L.; Hu, L.; Zhou, H. Deep learning based multi-temporal crop classification. Remote Sens. Environ. 2018, 221, 430–443. [Google Scholar] [CrossRef]
  18. Xu, L.; Zhang, H.; Wang, C.; Zhang, B.; Liu, M. Crop Classification Based on Temporal Information Using Sentinel-1 SAR Time-Series Data. Remote Sens. 2018, 11, 53. [Google Scholar] [CrossRef] [Green Version]
  19. Liang, L. Phenology. In Reference Module in Earth Systems and Environmental Sciences; Elsevier: Amsterdam, The Netherlands, 2019; ISBN 9780124095489. [Google Scholar] [CrossRef]
  20. Schwartz, M.D. (Ed.) Phenology: An Integrative Environmental Science; Kluwer Academic Publishers: Dordrecht, The Netherlands, 2003; p. 564. [Google Scholar]
  21. United Nations. World Population Prospects 2019 Highlights, Department of Economic and Social Affairs. Available online: https://www.ined.fr/fichier/s_rubrique/29368/wpp2019.highlights_embargoed.version_07june2019_vf.fr.pdf (accessed on 21 December 2021).
  22. Donnelly, A.; Yu, R. The rise of phenology with climate change: An evaluation of IJB publications. Int. J. Biometeorol. 2017, 61, 29–50. [Google Scholar] [CrossRef]
  23. Moon, M.; Zhang, X.; Henebry, G.M.; Liu, L.; Gray, J.; Melaas, E.K.; Friedl, M.A. Long-term continuity in land surface phenology measurements: A comparative assessment of the MODIS land cover dynamics and VIIRS land surface phenology products. Remote Sens. Environ. 2019, 226, 74–92. [Google Scholar] [CrossRef]
  24. Zhang, X.; Liu, L.; Yan, D. Comparisons of global land surface seasonality and phenology derived from AVHRR, MODIS, and VIIRS data. J. Geophys. Res. Biogeosciences 2017, 122, 1506–1525. [Google Scholar] [CrossRef]
  25. Wu, C.; Gonsamo, A.; Chen, J.M.; Kurz, W.; Price, D.T.; Lafleur, P.M.; Jassal, R.S.; Dragoni, D.; Bohrer, G.; Gough, C.M.; et al. Interannual and spatial impacts of phenological transitions, growing season length, and spring and autumn temperatures on carbon sequestration: A North America flux data synthesis. Glob. Planet. Chang. 2012, 92-93, 179–190. [Google Scholar] [CrossRef] [Green Version]
  26. Masialeti, I.; Egbert, S.; Wardlow, B. A Comparative Analysis of Phenological Curves for Major Crops in Kansas. GIScience Remote Sens. 2010, 47, 241–259. [Google Scholar] [CrossRef]
  27. Gu, Z.; Shi, X.; Li, L.; Yu, D.; Liu, L.; Zhang, W. Using multiple radiometric correction images to estimate leaf area index. Int. J. Remote Sens. 2011, 32, 9441–9454. [Google Scholar] [CrossRef]
  28. Garonna, I.; Fazey, I.; Brown, M.E.; Pettorelli, N. Rapid primary productivity changes in one of the last coastal rainforests: The case of Kahua, Solomon Islands. Environ. Conserv. 2009, 36, 253–260. [Google Scholar] [CrossRef] [Green Version]
  29. Giovos, R.; Tassopoulos, D.; Kalivas, D.; Lougkos, N.; Priovolou, A. Remote Sensing Vegetation Indices in Viticulture: A Critical Review. Agriculture 2021, 11, 457. [Google Scholar] [CrossRef]
  30. Huete, A.R. A soil-adjusted vegetation index (SAVI). Remote Sens. Environ. 1988, 25, 295–309. [Google Scholar] [CrossRef]
  31. Huete, A.R.; Liu, H.Q.; Batchily, K.V.; Van Leeuwen, W.J.D.A. A comparison of vegetation indices over a global set of TM images for EOS-MODIS. Remote Sens. Environ. 1997, 59, 440–451. [Google Scholar] [CrossRef]
  32. Huete, A.; Didan, K.; Miura, T.; Rodriguez, E.P.; Gao, X.; Ferreira, L.G. Overview of the radiometric and biophysical performance of the MODIS vegetation indices. Remote Sens. Environ. 2002, 83, 195–213. [Google Scholar] [CrossRef]
  33. Kim, Y.; Jackson, T.; Bindlish, R.; Lee, H.; Hong, S. Radar Vegetation Index for Estimating the Vegetation Water Content of Rice and Soybean. IEEE Geosci. Remote Sens. Lett. 2011, 9, 564–568. [Google Scholar]
  34. European Union. The Land Parcel Identification System: A Useful Tool to Determine the Eligibility of Agricultural Land—But Its Management Could Be Further Improved. European Court of Auditors. Available online: https://www.eca.europa.eu/Lists/News/NEWS1610_25/SR_LPIS_EN.pdf (accessed on 21 December 2021).
  35. Copernicus Open Access Hub. Available online: https://scihub.copernicus.eu/dhus/#/home (accessed on 21 December 2021).
  36. Ongedo, L. Semi-Automatic Classification Plugin: A Python tool for the download and processing of remote sensing images in QGIS. J. Open Source Softw. 2021, 6, 3172. [Google Scholar] [CrossRef]
  37. Chuvieco, E.; Congalton, R.G. Using cluster analysis to improve the selection of training statistics in classifying remotely sensed data. Photogrammetric. Eng. Remote Sens. 1988, 54, 1275–1281. [Google Scholar]
  38. Kar, S.A.; Kelkar, V.V. Classification of multispectral satellite images. In Proceedings of the 2013 International Conference on Advances in Technology and Engineering (ICATE) IEEE, Mumbai, India, 23–25 January 2013; pp. 1–6. [Google Scholar]
  39. Morgan, R.S.; Rahim, I.S.; Abd El-Hady, M.A. comparison of classification techniques for the land use/land cover classification. Glob. Adv. Res. J. Agric. Sci. 2015, 4, 810–818. [Google Scholar]
  40. Mahmon, N.A.; Ya’acob, N.; Yusof, A.L. Differences of image classification techniques for land use and land cover classification. In Proceedings of the 2015 IEEE 11th International Colloquium on Signal Processing & Its Applications (CSPA), IEEE. Kuala Lumpur, Malaysia, 6–8 March 2015; pp. 90–94. [Google Scholar]
  41. HSLayers-NG. Available online: https://ng.hslayers.org (accessed on 24 November 2021).
  42. Kobayashi, N.; Tani, H.; Wang, X.; Sonobe, R. Crop classification using spectral indices derived from Sentinel-2A imagery. J. Inf. Telecommun. 2020, 4, 67–90. [Google Scholar] [CrossRef]
  43. Orynbaikyzy, A.; Gessner, U.; Conrad, C. Crop type classification using a combination of optical and radar remote sensing data: A review. Int. J. Remote Sens. 2019, 40, 6553–6595. [Google Scholar] [CrossRef]
  44. Maxwell, A.E.; Warner, T.A.; Fang, F. Implementation of machine-learning classification in remote sensing: An applied review. Int. J. Remote Sens. 2018, 39, 2784–2817. [Google Scholar] [CrossRef] [Green Version]
  45. Messina, G.; Praticò, S.; Badagliacca, G.; Di Fazio, S.; Monti, M.; Modica, G. Monitoring Onion Crop “Cipolla Rossa di Tropea Calabria IGP” Growth and Yield Response to Varying Nitrogen Fertilizer Application Rates Using UAV Imagery. Drones 2021, 5, 61. [Google Scholar] [CrossRef]
Figure 1. Time-series of Enhanced Vegetation Index profiles of field averages for chosen crops in Rostenice farm in 2018.
Remotesensing 14 01095 g001
Figure 2. Overview of the experiment site.
Remotesensing 14 01095 g002
Figure 3. Sentinel-1 processing steps.
Remotesensing 14 01095 g003
Figure 4. Cloud coverage of the images available across the whole vegetation season 2020.
Remotesensing 14 01095 g004
Figure 5. Flowchart of methodological process.
Remotesensing 14 01095 g005
Figure 6. Comparison of all classification products.
Remotesensing 14 01095 g006
Figure 7. Visualization of the majority classification of Sentinel-1’s whole vegetation season classification (26 layers) [41].
Remotesensing 14 01095 g007
Figure 8. Comparison of crop classification development in the season. Sentinel-1 and Sentinel-2 data-based pixel classification with input data from March + April on the left side and input data from March to August on the right side [41].
Remotesensing 14 01095 g008
Table 1. Crops whose area is greater than 1.5% of the total.
Crop TypeArea [ha]Portion of the Crop [%]
Spring barley391439
Winter wheat175617
Winter oilseed rape126313
Corn for grain105910
Corn for silage9109
Two-row winter barley3594
Spring field peas1862
Poppy1642
Total944796
Table 2. Training inputs.
Class NameCount of Training InputsArea Summary [ha]
Spring barley388.2
Winter wheat7215.5
Winter oilseed rape10270.9
Corn for grain and silage10330.0
Two-row winter barley5139.4
Spring field peas375.7
Poppy555.6
Total431175.3
Table 3. Pixel-count confusion matrix of RVI4S1+EVI May classification after sieve filtering. Classified rows contain classified classes and the number of pixels that were assigned to a reference class. In the reference columns, there are true crops from the farmer’s data.
Reference/Classified1—Spring Barley2—Winter Oilseed Rape3—Corn for Grain and Silage4—Winter Wheat5—Spring Field Peas6—Poppy7—Two-Row Winter BarleyTotal
1—Spring barley333,95117204881514631403338,347
2—Winter oilseed rape1446108,18622725,887360626136,408
3—Corn for grain and silage2870801144,7812456179927583155,468
4—Winter wheat2334391721108,388004969119,629
5—Spring field peas19,33428411,59947512,889371044,952
6—Poppy51891128,962200241811,8264048,646
7—Two-row winter barley1852412122,1130027,66152,372
Total365,309117,331186,079161,03317,77314,99533,302895,822
Table 4. Overall accuracy for majority field classification.
Input Data Months\IndexRVI4S1 + EVIEVIRVI4S1_allRVI4S1 ≥ 10 haRVI4S1 < 10 ha
march48.3%44.4%32.6%36.2%29.3%
march+april71.6%64.0%27.9%32.1%24.1%
march+april+may82.5%84.4%65.5%80.9%51.5%
march+april+may+june85.7%89.8%68.4%81.6%56.5%
march+april+may+june+july88.2%92.2%70.3%84.3%57.7%
march+april+may+june+july+august88.0%96.3%71.3%85.0%59.0%
Table 5. Classification accuracy development for individual crop types of combination of RVI4S1 + EVI layers after sieve filtering.
Month/
Crop Type
MarchMarch + AprilMarch + April + MayMarch + April + May + JuneMarch + April + May + June + JulyMarch + April + May + June + July + August
Spring barley57.6%72.1%91.4%89.6%92.1%92.7%
Winter wheat62.0%59.8%67.3%71.5%78.5%80.1%
Winter oilseed rape6.5%86.3%92.2%93.0%92.9%96.4%
Corn for grain and silage62.3%62.8%77.8%96.2%99.3%99.5%
Two-row winter barley68.7%68.9%83.1%86.7%97.6%97.8%
Spring field peas11.1%22.6%72.5%80.7%85.1%84.5%
Poppy0.0%57.8%78.9%92.4%96.6%97.5%
Overall accuracy51.0%67.7%83.0%87.5%91.1%92.3%
Publisher’s Note: MDPI stays neutral with regard to jurisdictional claims in published maps and institutional affiliations.

