
Remote Sensing Vegetation Indices in Viticulture: A Critical Review
by
Rigas Giovos
, 
Dimitrios Tassopoulos
,
Dionissios Kalivas
*, 
Nestor Lougkos
and
Anastasia Priovolou
GIS Research Unit, Laboratory of Soils and Agricultural Chemistry, Department of Natural Resources and Agricultural Engineering, Agricultural University of Athens, 118 55 Athens, Greece
*
Author to whom correspondence should be addressed.
Agriculture 2021, 11(5), 457; https://0-doi-org.brum.beds.ac.uk/10.3390/agriculture11050457
Submission received: 15 March 2021
/
Revised: 6 May 2021
/
Accepted: 14 May 2021
/
Published: 18 May 2021
(This article belongs to the Special Issue New Technologies and Spatiotemporal Approaches in Precision Agriculture)
Abstract
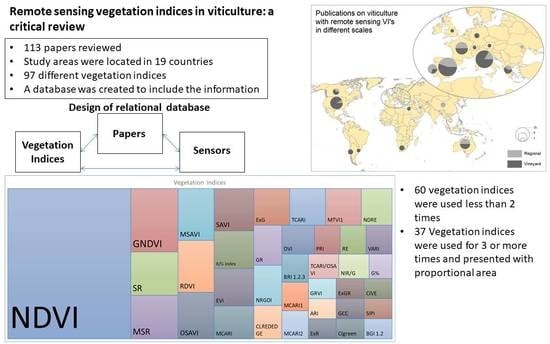
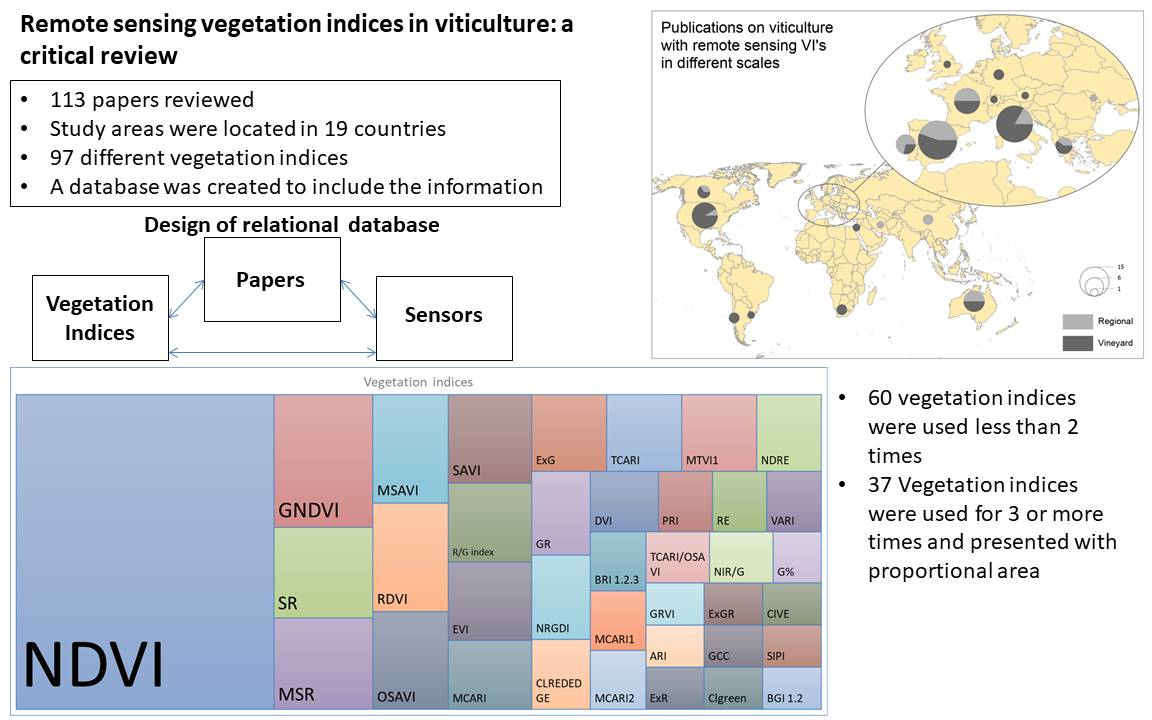
:One factor of precision agriculture is remote sensing, through which we can monitor vegetation health and condition. Much research has been conducted in the field of remote sensing and agriculture analyzing the applications, while the reviews gather the research on this field and examine different scientific methodologies. This work aims to gather the existing vegetation indices used in viticulture, which were calculated from imagery acquired by remote sensing platforms such as satellites, airplanes and UAVs. In this review we present the vegetation indices, the applications of these and the spatial distribution of the research on viticulture from the early 2000s. A total of 143 publications on viticulture were reviewed; 113 of them had used remote sensing methods to calculate vegetation indices, while the rejected ones have used proximal sensing methods. The findings show that the most used vegetation index is NDVI, while the most frequently appearing applications are monitoring and estimating vines water stress and delineation of management zones. More than half of the publications use multitemporal analysis and UAVs as the most used among remote sensing platforms. Spain and Italy are the countries with the most publications on viticulture with one-third of the publications referring to regional scale whereas the others to site-specific/vineyard scale. This paper reviews more than 90 vegetation indices that are used in viticulture in various applications and research topics, and categorized them depending on their application and the spectral bands that they are using. To summarize, this review is a guide for the applications of remote sensing and vegetation indices in precision viticulture and vineyard assessment.
1. Introduction
Viticulture has existed for more than 5000 years in ancient Egypt [1]; many cultures use wine as a main factor in their food culture. To increase production in agriculture, technologies were introduced in the 1990s to convert agriculture to “precision agriculture” [2]. The first results and applications of precision agriculture were published in 1999. In the same year precision viticulture (PV), which is a sector of precision agriculture focusing on the vineyard, started to be introduced. The main objective is to manage the variability on yield and development dividing the vineyard into management zones. With this management the yield is increased and the environmental impact is reduced, which translates into an increase in economy [3].
With remote sensing, PV has an extra added tool for the study of spatial variability in the vineyard. Vegetation indices are mainly used to monitor the vine conditions and to correlate them with yield and other parameters such as chlorophyll concentration on leaves [4], nitrogen content [5] and water content [6] regarding the canopy [4]. Additionally, correlations of vegetation indices (VIs) with parameters of the grape such as Brix and pH have been studied [7]. Furthermore, remote sensing offers data in many temporal and spatial resolutions to study a vineyard or a viticulture region. Platforms such as Landsat with 30 m pixel resolution or more were used mostly on a regional scale while unmanned aerial vehicle (UAVs) and aircrafts offer high resolution imagery which is widely used on a vineyard scale. The evolution of technology has brought the application of hyperspectral remote sensing along with multispectral to be more specific and to produce specialized vegetation indices [5]. Primarily though, hyperspectral vegetation indices are applied in proximal sensing by spectroradiometers on field campaigns rather than remote sensing methods in viticulture [8].
Through the years, many reviews have been conducted in the viticulture sector, analyzing technologies and applications. Research has been instigated on the topic of precision viticulture combining vegetation indices from remote sensing platforms with ground data such as soil electrical conductivity [9], vine vigor parameters and yield [10]. A review of Xie et al. [11] reviews all the UAV-mounted sensors applied on the estimation of yield, biomass, height, and leaf area index. Reviews on the production of spatial data for precision viticulture [12], on remote sensing and GIS applications have been conducted. Additionally, the sensors used in viticulture have been gathered and analyzed [13] and the different resolutions in combination with applications [14]. All these reviews captured the methodologies and technologies applied in PV, in order to manage the spatial variability in variables (grape yield, pH, phenolics) within a vineyard [14], highlighting the importance of remote sensing and spatial data.
Vegetation indices are an important tool to monitor vineyards, vine growth cycle, yield estimation and water stress, they can be used for better management of the vineyard combined with precision agriculture techniques. For analyzing the reviews of vegetation indices our main concept was to gather the VIs in terms of agricultural applications. An attempt was made to categorize them according to their relationship with the characteristics of the vegetation [15], additionally examined the usage and the applications of VIs in precision agriculture [16]. The reviews demonstrate the usage and the general applications of vegetation indices in agriculture, without focusing on specific cultivation, e.g., viticulture. There is a lack of references on viticulture and vegetation indices applications.
The purpose of this review is to collect those vegetation indices that have been used specifically on vine and viticulture with remote sensing imagery, to comment and analyze on applications and classify accordingly the wavelengths used in the calculation. Additionally, a critical review has been conducted on the effectiveness of each method and whether the objectives have been adequately addressed.
2. Publications and Research
2.1. Review Methodology
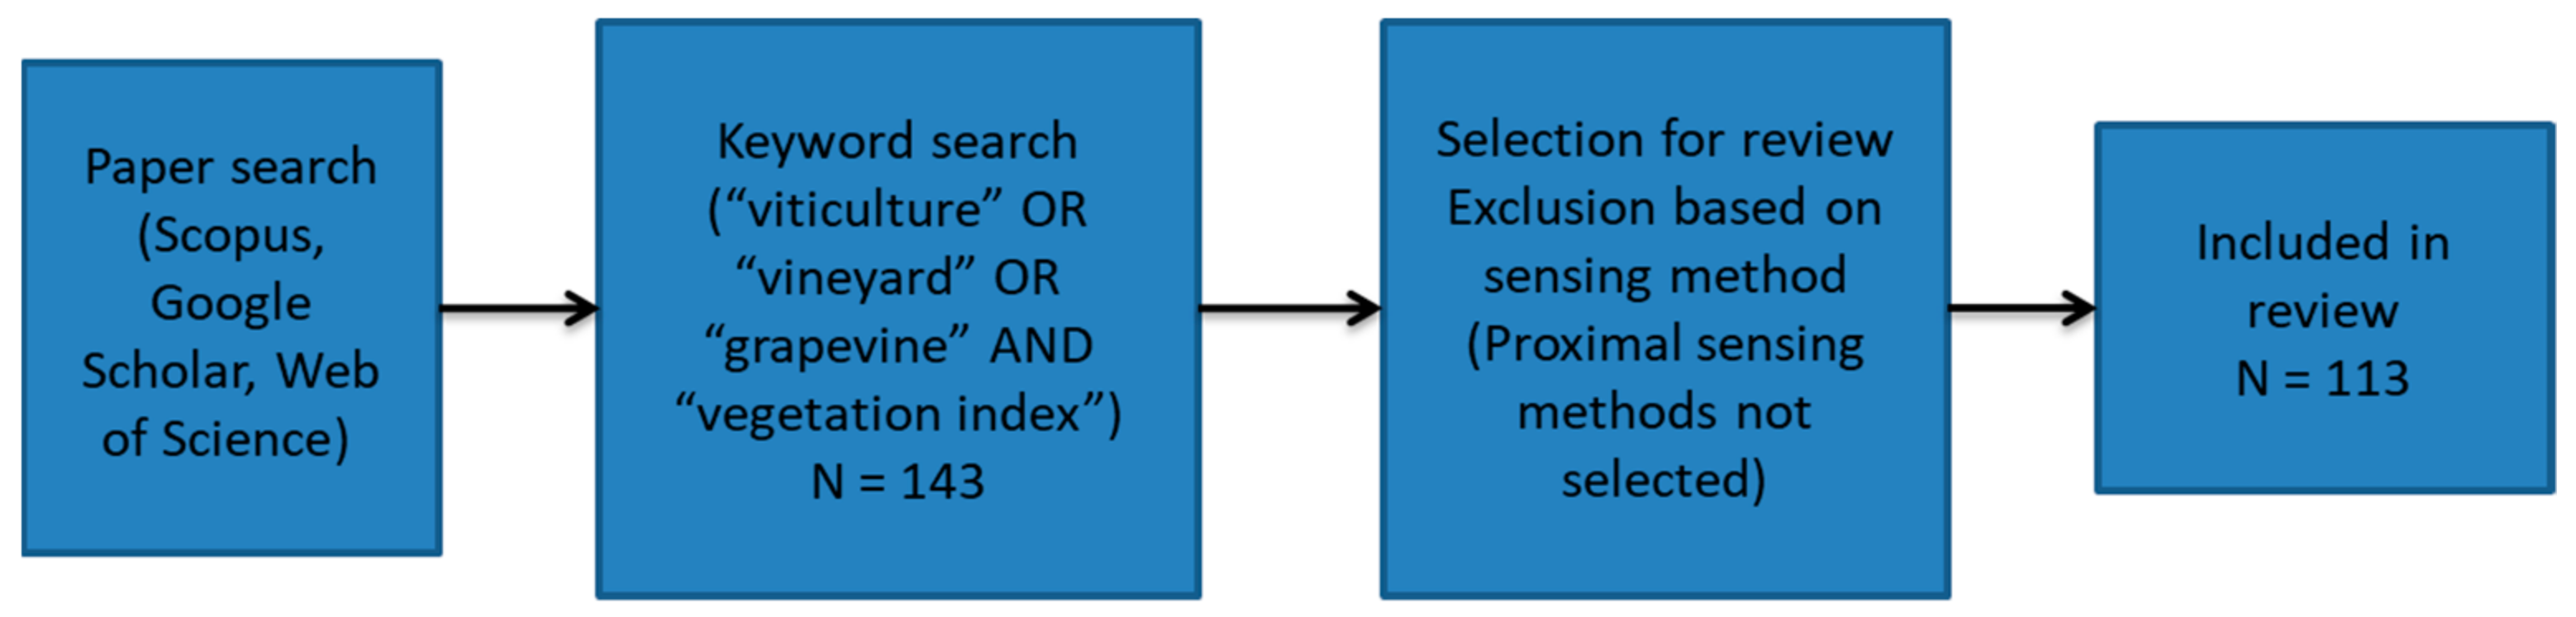
Holistic research of papers has been conducted in Scopus, Google Scholar and Web of Science. The review method is separated into three phases (Figure 1): the review planning, execution and review reporting which follows in the results, while a relational database model was created for the management of the research papers evolving the methodology of Adamides (2020) [17]. The research of publications focused on “viticulture” or “vineyard” or “grapevine” and “vegetation index” keywords. 143 research papers were downloaded and after the removal of duplicates and publications with proximal sensing methods 113 papers were finally taken in consideration. A total of 97 different vegetation indices were gathered from multispectral and hyperspectral imagery. In addition, information was collected just like the year of the publication, the journal, the application and the sensor.
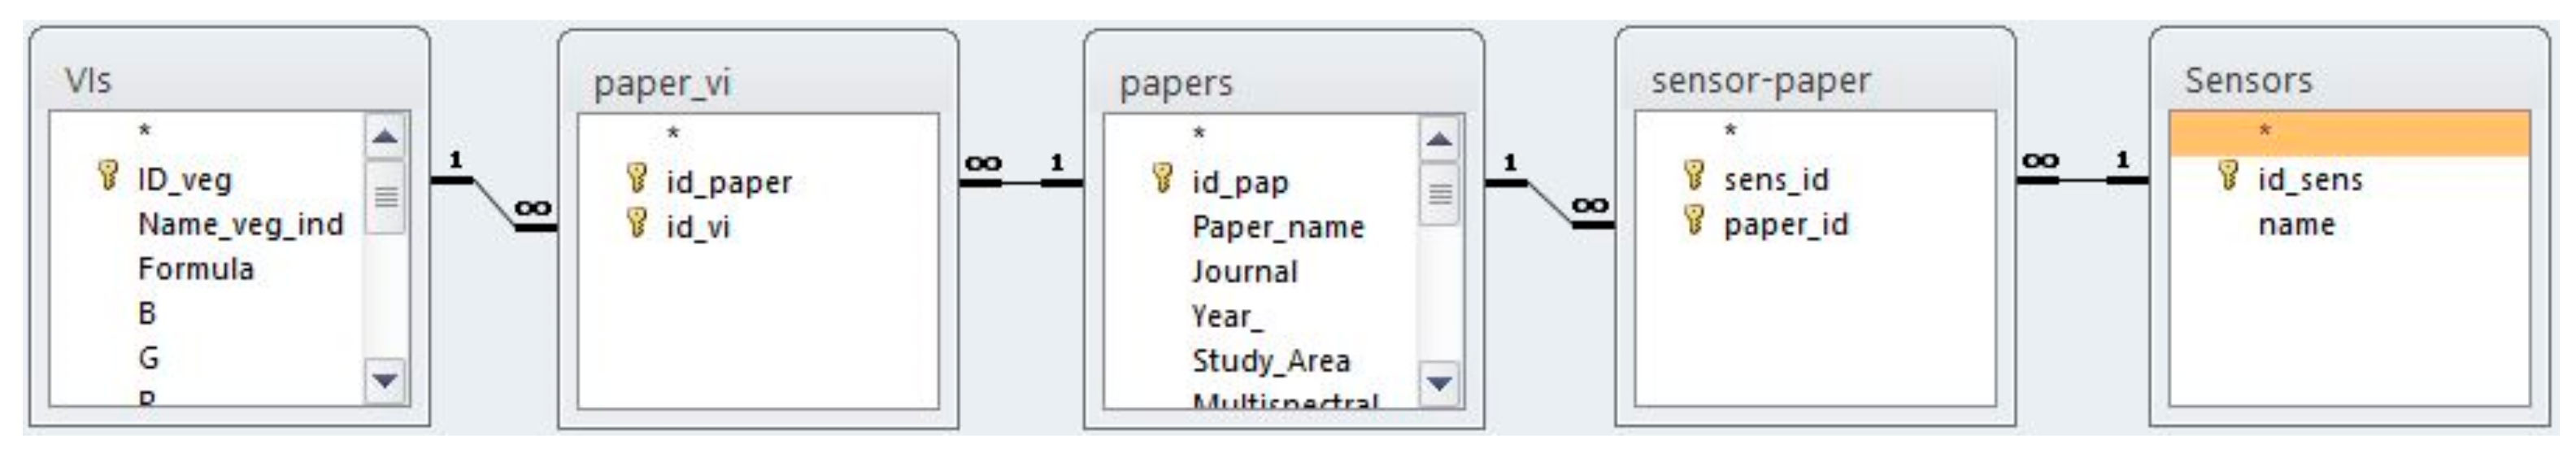
Due to the quantity of papers, a relational database was created including the information descriptively, as a database management system offers the ability to capture and analyze the data. Its design helps to include information such as the year, the remote sensing platforms, the main purpose of the research and the different vegetation indices that have been used on each publication. The tables are connected with primary and foreign keys, while for the connection “many-to-many” linking tables were created; e.g., one vegetation index is used in many research papers and one paper uses many vegetation indices. Due to this design, it becomes easier to extract results for comment and interpretation by using structured query language (SQL) queries with the structure demonstrated in Figure 2.
The categorization is based on the scale of the study area. Two categories are created, “field scale” and “regional scale”. The first category includes publications whose study area was a vineyard and focuses on site-specific research. The second category refers to publications whose study area was a group of vineyards or a viticultural region.
2.2. Study Areas Spatial Distribution
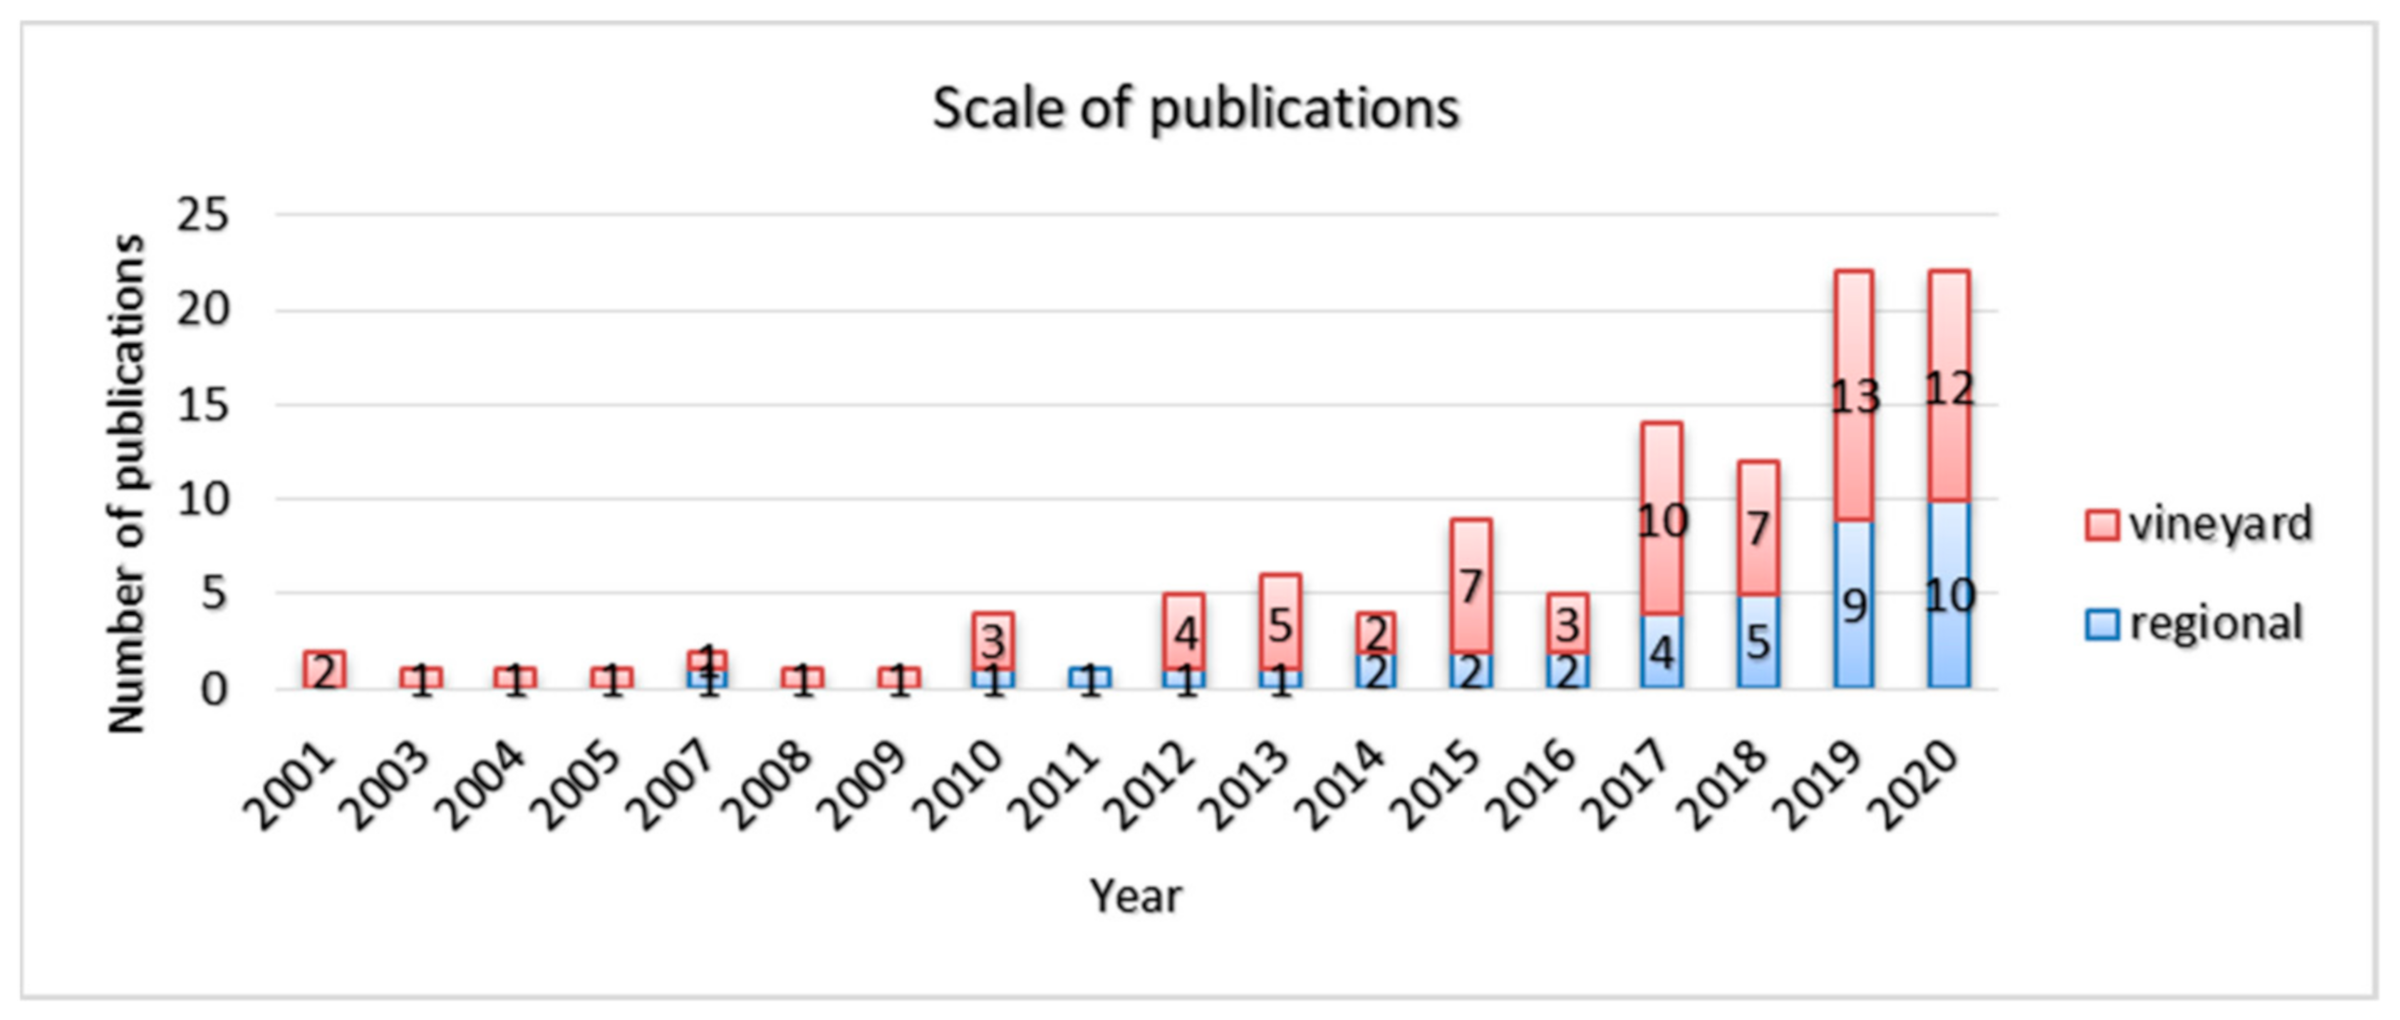
The publications occur in a variety of countries and landscapes. Ιn general they are concentrated in countries with tradition on viticulture and wine. The study areas of research were located in 19 countries all over the globe; more than 20 publications had a study area in Spain and Italy, more than 10 in France and the USA, followed by Australia, Portugal and Greece with more than 5. In most publications, the study area was on site-specific scale, but in the last years, research on regional scale is developing as it seems on histogram (Figure 3). Research on a regional scale has benefits, such as reducing heterogeneity in yield of a viticultural region [6] or monitoring how different topographic conditions affect vegetation development [18].
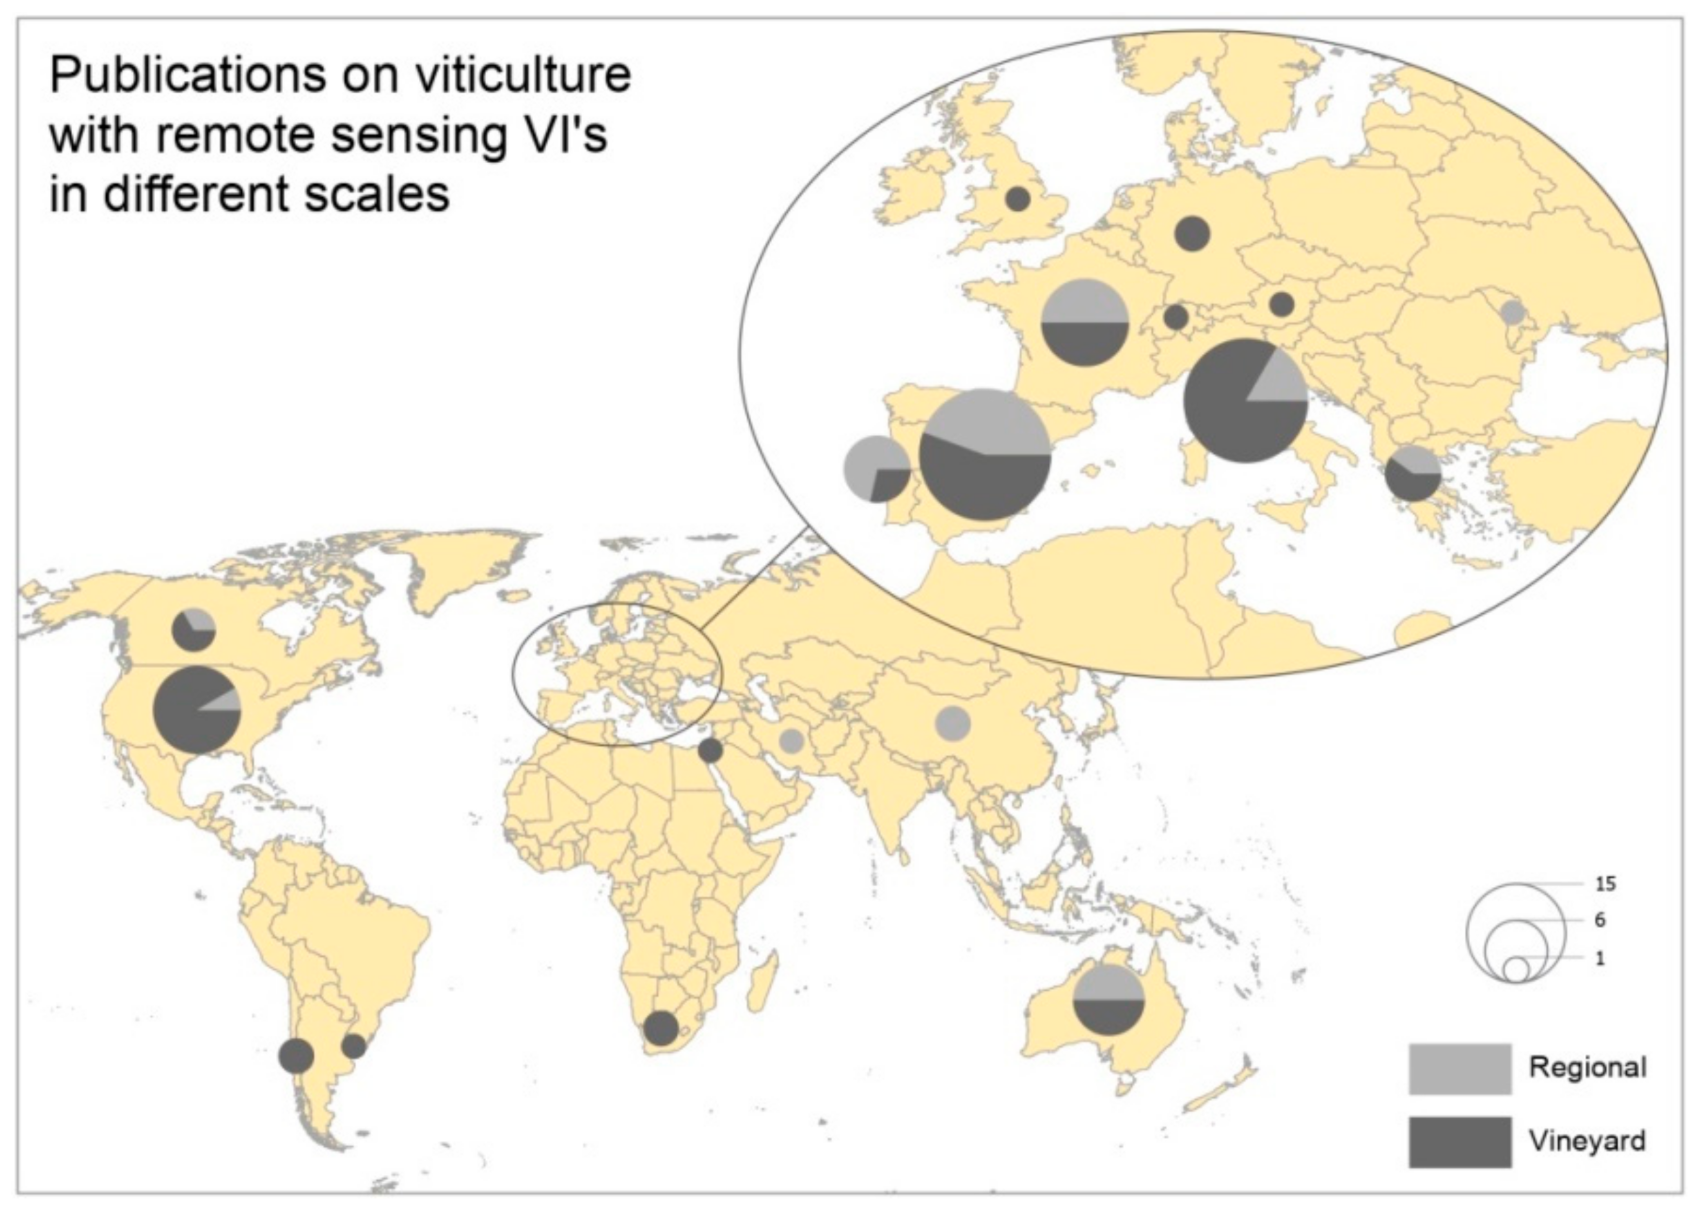
Spatially the research is on 19 countries (Figure 4), in countries that have more than 5 publications there are both scales, regional and site-specific (vineyard). The only country where more research has been conducted on the regional scale is Portugal, while 50–50 was on France and Australia. It is observed that the USA and Italy tend to do more research on the scale of the site-specific, while in the group of the other countries (Portugal, Spain, France, Greece, Australia) they research both on the site-specific and regional scale. It is worth to mention that the study areas are concentrated in latitude ±40 degrees due to the suitable climatic conditions for the development of the vineyards.
2.3. The Remote Sensing Platforms
The plethora of options for remote sensing platforms, such as satellites, aircrafts and unmanned aerial vehicles are summarized in Table 1. UAVs are used in 45 publications due to the extended use in the last years. 27 research papers based on aircraft imagery for the calculation of the vegetation indices, while 19 times the research had based on Sentinel-2 satellite. Additionally, Rapideye satellite, Landsat 8, MODIS, Quickbird and Landsat 7 were used from 5 up to 10 research papers.
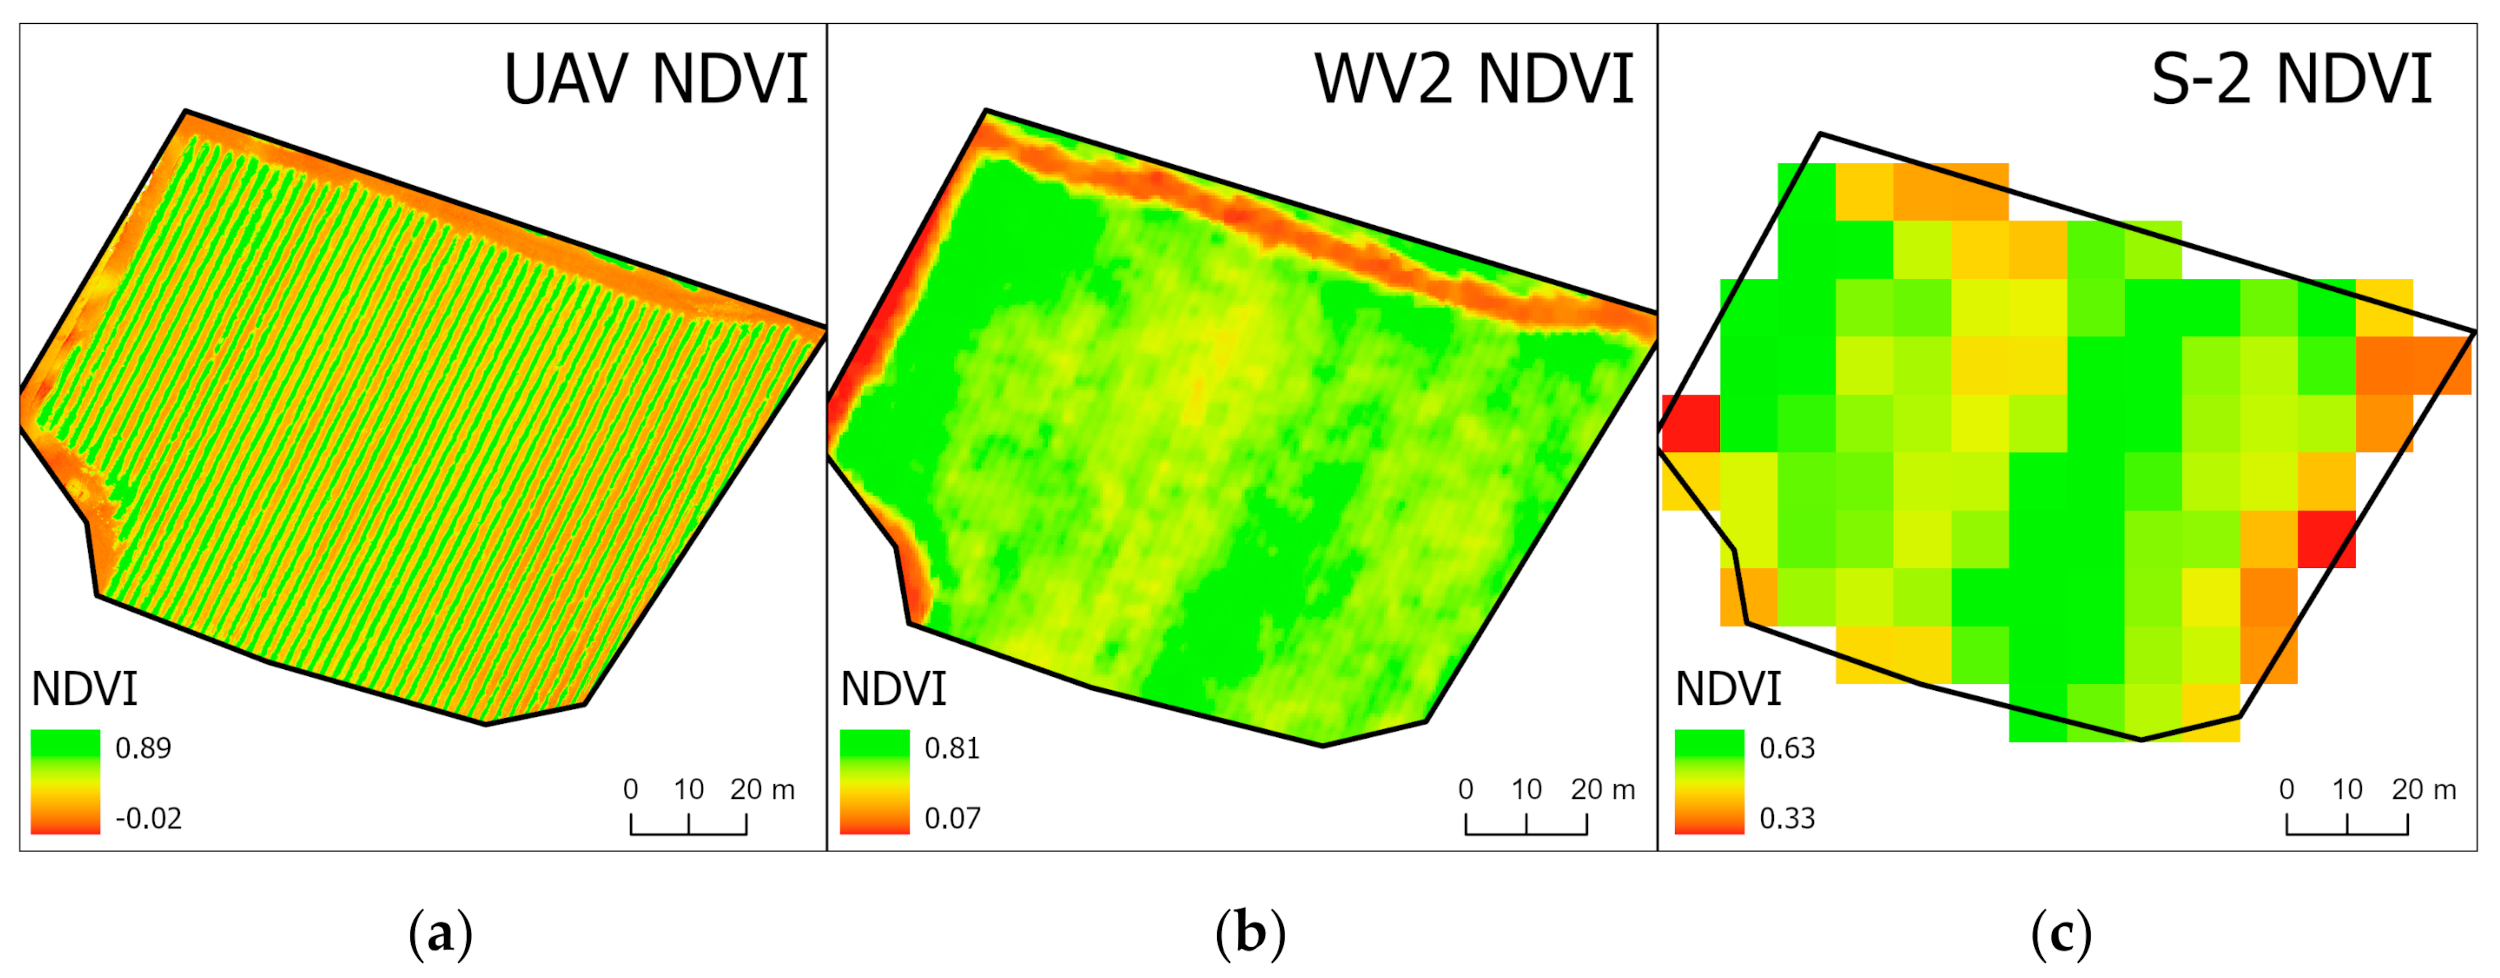
The usage for each platform depends on the price and the resolution of the imagery it offers. Satellites with high-resolution imagery offer detailed information for analyzing vineyards, but their price is a limiting factor mainly for multitemporal monitoring. In this case, medium-resolution free access satellites are used such as Sentinel-2 where with the resolution of 10 m × 10 m can reveal the spatial variability in the vineyard. Τhe Figure 5 shows the same vineyard from three different remote sensing data sources, (a) from UAV mounted multispectral camera with 3 cm pixel size, (b) from Worldview-2 with 0.5 m pixel size and (c) from Sentinel-2 with 10 m pixel size. In the first case we must have in our possession a UAV, to process the data and produce this NDVI map. In the second case of WV2 we have to purchase the satellite imagery, while when it comes for Sentinel-2 we can download it for free.
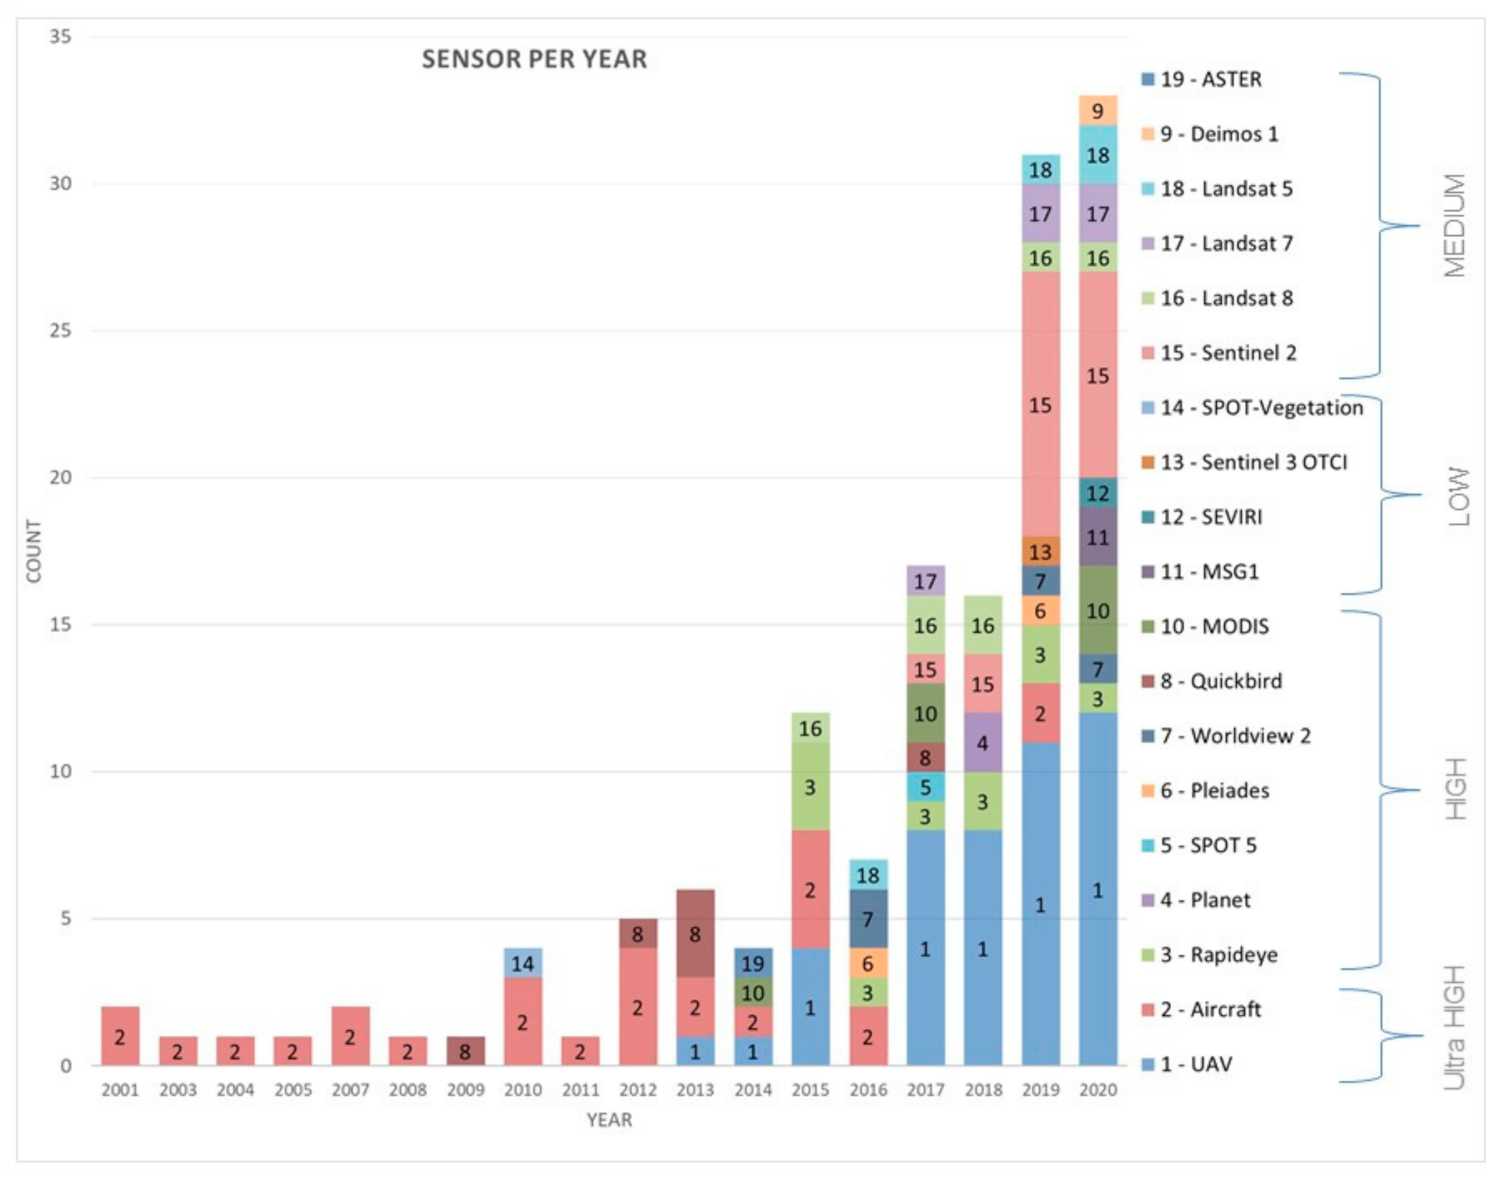
The examination of uses has two perspectives: firstly, the appearance of each technology and satellite, for example, UAVs, which have come to the fore after 2010, and secondly, the purpose of the research and the extent of the study area, viticulture region or field scale. Figure 6 demonstrates the usage of each platform per year. It is obvious that the numbers in the last years are greater due to the many publications, and also that aircrafts are replaced by UAVs. The need to extract the vine rows is captured in the high usage of ultra-high-resolution sensors (aircraft, UAV). Sentinel-2 and other medium resolution give an extra solution because of the free access and their spatial resolution which can display the variability in a vineyard [19]. The high-resolution satellites constitute a minor percentage in the research, due to restrictions such as the price and the controversial usage for vineyard row extraction.
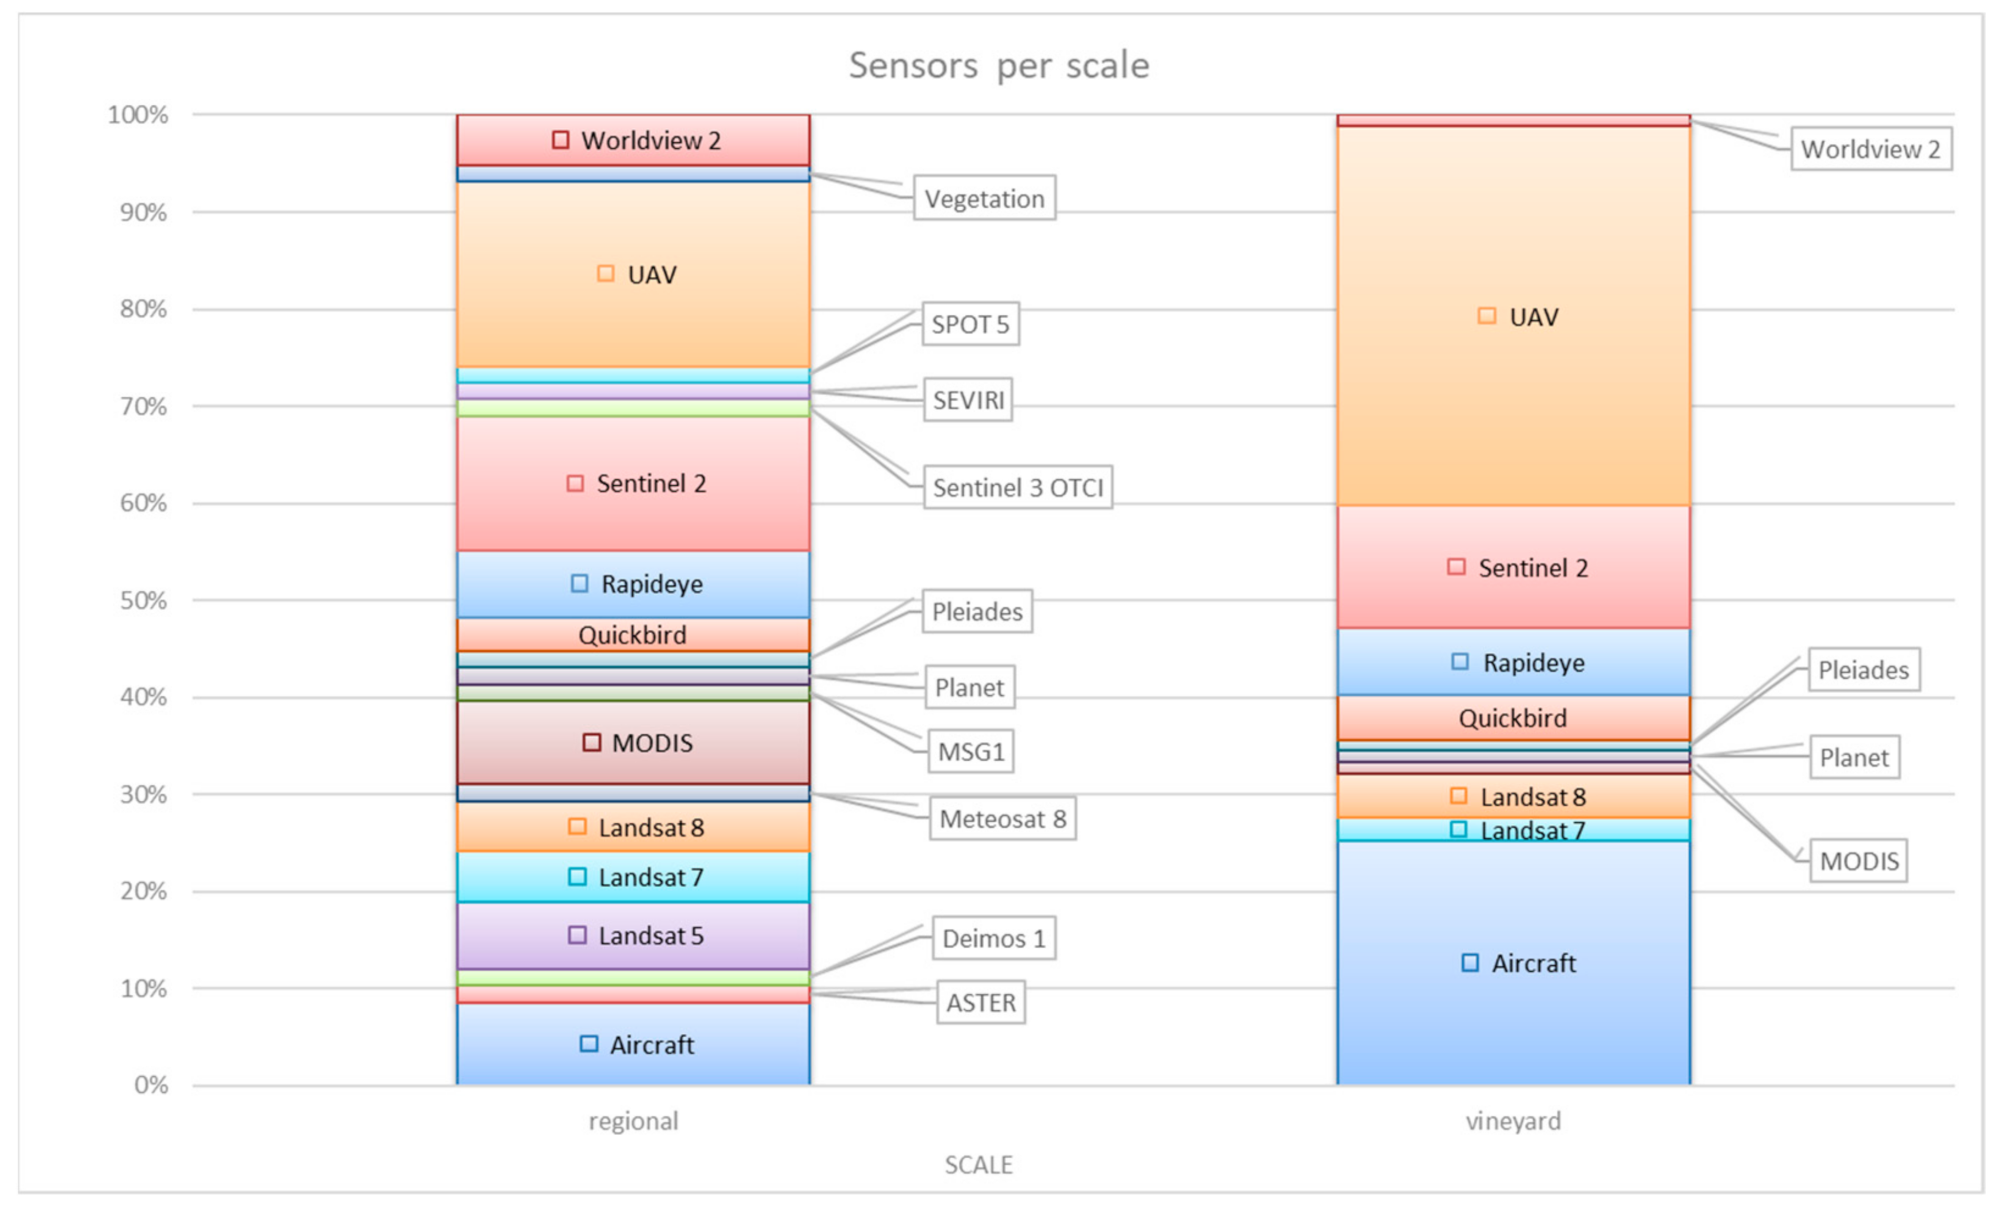
Because of the two categories on the scale of the study area, some satellites were suitable to be used only on regional scale due to their spatial resolution. For example, in order to perform an analysis on a viticulture region a Landsat series satellite is ideal concerning the spatial resolution it offers. Figure 7 demonstrates the percentage of usage for each platform in both scales. When the research is based on regional scale the usage of UAVs and aircraft reduced and their place is taken by Landsat satellites, MODIS and Worldview 2.
3. Vegetation Indices
3.1. Vegetation Indices and Electromagnetic Spectrum
The need to acquire information about vegetation from remote sensing adopted the concept of vegetation indices (VI). Two or more spectral bands need to be combined in mathematical formulas for vegetation index calculation, while the usage of VIs is increasing due to the rising availability of platforms both in terms of resolution and available spectral bands [6].
The vegetation indices are based on different wavelength reflectance in the electromagnetic spectrum of each target, and they are using active and passive sensors to achieve it [15]. The electromagnetic spectrum which is used in remote sensing is divided into blue (450 nm), green (550 nm), red (650 nm), red-edge (700), near-infrared (800–900 nm) and short-wave infrared (1300–2200 nm) bands. Most remote sensing platforms have sensors with bands on these sections of the electromagnetic spectrum, while their categorization is divided into two categories, multispectral with up to 10–15 spectral bands and hyperspectral with a total of more than 50 bands. With multispectral sensors we get the reflectance of the object in a few areas of the electromagnetic spectrum in a bandwidth of 30 nm in visible and more than 100 in SWIR. While with hyperspectral sensors we get more detailed reflectance data in many more subsections of the electromagnetic spectrum and with a narrow bandwidth less than 10 nm. The different reflectance of each band captures the properties of vegetation and with combinations of bands these differences becomes more intense. The higher difference in the reflectance of vegetation occurs in RGB and NIR. Because of this, more VIs use combinations of RGB bands and infrared such as red-edge or near-infrared.
The vegetation indices are formed to focus on different properties of the vegetation [16] and provide information about biomass, leaf area and health of the plant, based on calculations of different bands of the electromagnetic spectrum [16]. RVI (Ratio Vegetation Index) or SR (Simple Ratio) [20] is the oldest one and is based on the ratio between NIR and red. The normalized difference vegetation index [21], presented in 1973, uses the ratio of the NIR and red difference divided by their sum, while it stays the most popular VI until today. The applications of VIs in viticulture expand in many fields for estimating the parameters of the vine. Many of them used to predict chlorophyll absorption of leaves (e.g., CLREDEDGE [7], MCARI [7], MTVI1 [5]), as an indicator of health and phenology [22,23,24,25], some others are sensitive on the pigments of leaves (PRI [24], ExB [26], ExG [26], ExR [26]) and demonstrate mainly diseases [26,27,28,29]. The most frequently used VIs that are sensitive on biomass and vegetation density (NDVI [4], EVI [25], SAVI [25], MSAVI [5]), the usage of them is to identify the crop rows [30], to monitor leaf area [31] and other applications. VIs that are more sensitive on the water content of leaves (NDWI [32], SIWSI [23], GVMI [32], MSI [32]) were used to predict and monitor the water stress [32,33,34].
Five categories emerged considering the difference in reflectance of chlorophyll, pigments, biophysical parameters, biomass and water content of leaves taking into consideration the literature review and the categorization of vegetation indices [7,26,35,36]. Examining the application of indices based on their sensitivity (Table 2) we conclude that, 97 times there have been used VIs focusing on leaves chlorophyll concentration, more than 100 times for the estimation of pigments, 150 times VIs that have been correlated with biophysical parameters and more than 200 VIs those that serve to predict biomass and vegetation density. In addition, VIs were used nine times to estimate the water content on vine leaves. Mainly, VIs have been used to estimate and monitor the biomass of vineyards and also to detect and extract the vine rows [30]. Likewise, there are VIs that have been used for prediction of biophysical parameters correlated with yield or in situ data [25,26,37].
Each band compilation used to calculate vegetation indices is sensitive to specific parameters of vegetation. Mainly RGB is used to estimate pigment [38] (carotenoids, anthocyanins); the compilation of RGB and red-edge performs better for the estimation of chlorophyll concentration [39]. Green, red and NIR included in vegetation indices to predict biophysical parameters [40], while biomass and vegetation density estimated with red and NIR [41] due to the difference of vegetation reflectance on red and NIR. For the estimation of water content on leaves, NIR and SWIR bands are the most common. Table 3 shows all the band combinations of VIs studied in this review. In this cross-table, the inputs are the categories depending on which parameters the VI is sensitive to and the band combination on VIs calculation. This table is a resume of the review and shows the potentiality of each band for the prediction of vine plant parameters. It is obvious that only RGB bands are not able to predict biophysical parameters and they have to be combined with NIR band, while they are useless to estimate water content. The main usage of VIs from RGB bands is to estimate pigments; in addition, when the red-edge is combined, the prediction of leaves chlorophyll content performs better. Red and NIR are the most common band combination to estimate biomass and vegetation density, these VIs are often used for vine detection and row extraction. For estimating water content on vine leaves, the combination of NIR and SWIR is the one that can predict and demonstrate better the water stress of the vineyard. Table 4 shows all the vegetation indices used in vineyards and precision viticulture, and collected in this review.
3.2. Review of VI’s in Viticulture Publications
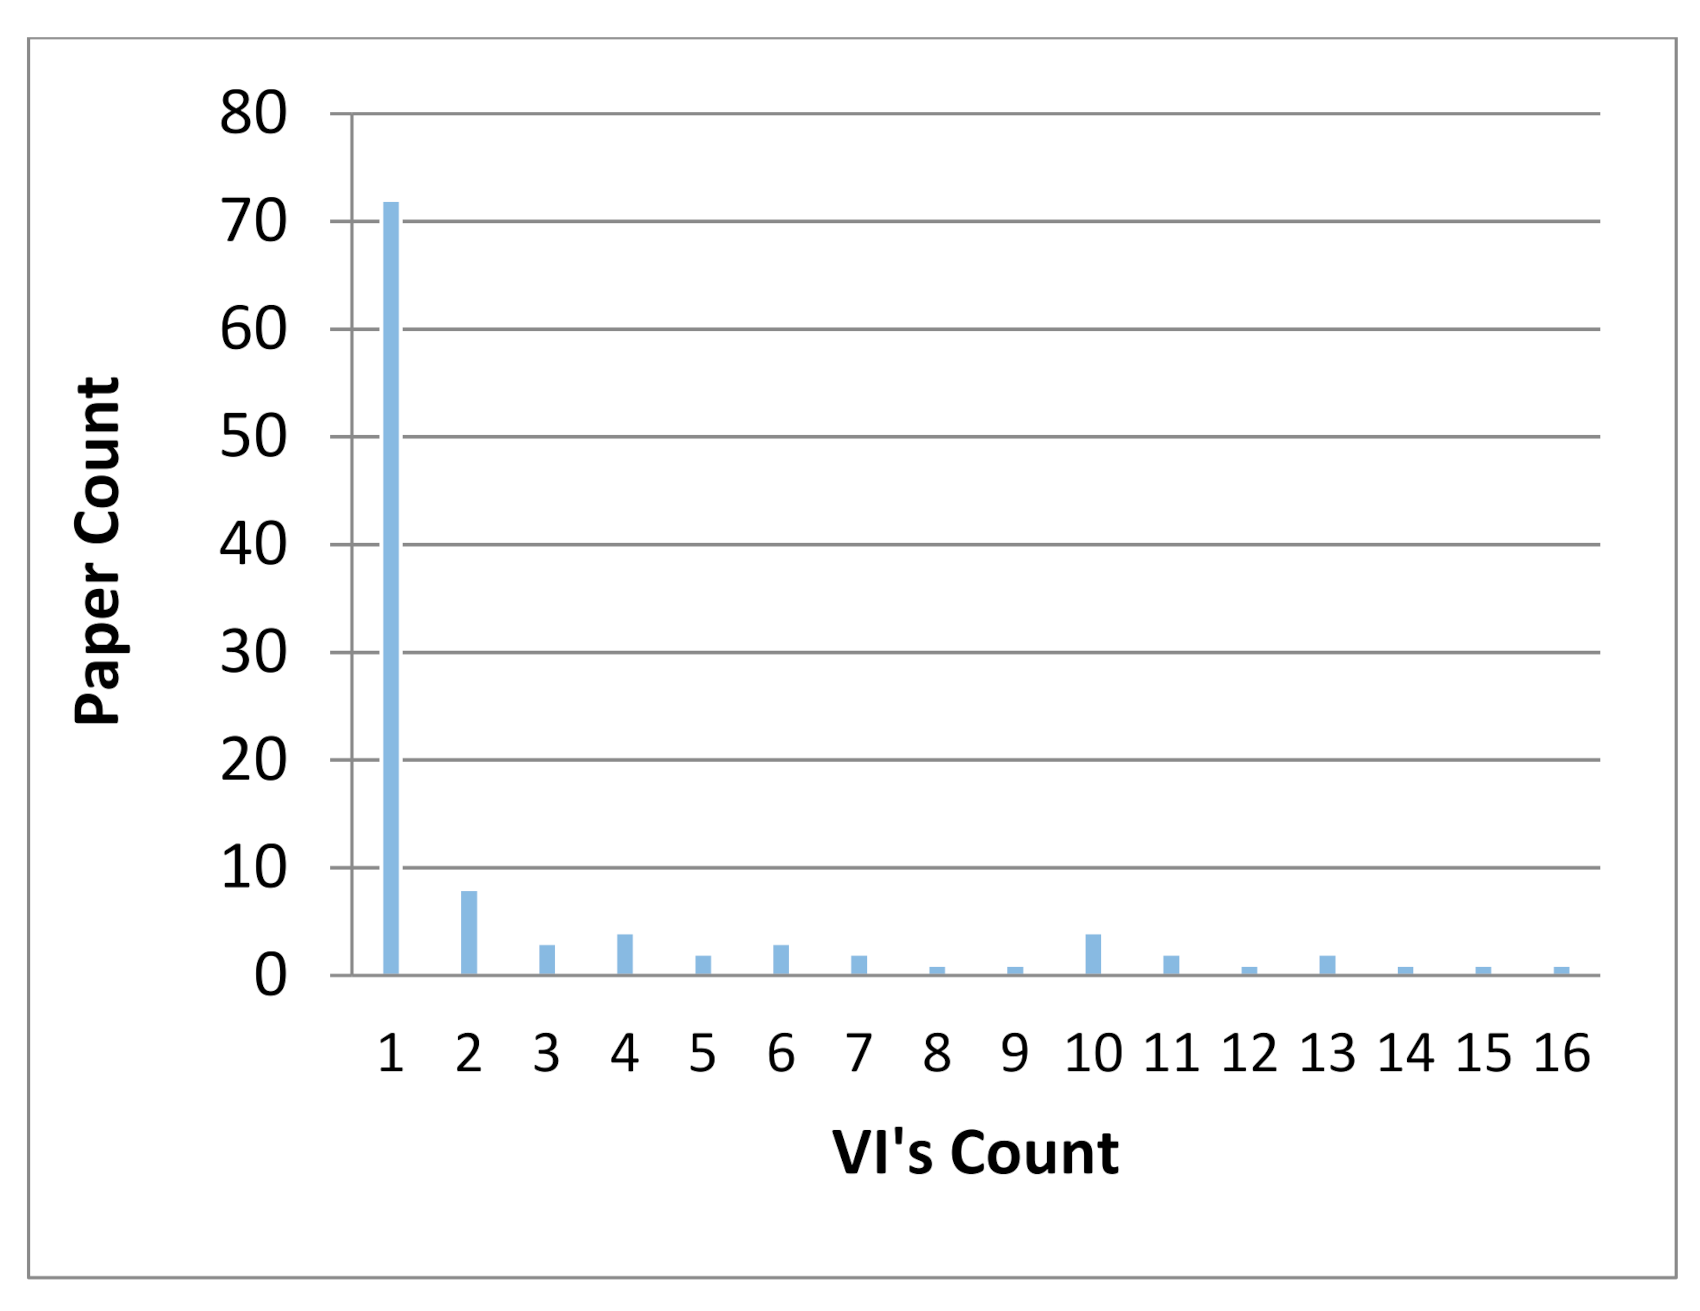
One to 16 different VIs have been used in each of the 113 reviewed papers (Figure 8). The usage of one or more VIs depends on the requirements of the research. 72 out of 113 have used only one vegetation index while NDVI appeared in 99 different papers. It is one of the oldest vegetation indices and the most widely used because of the simplicity of calculation, and this is the reason why all sensors have bands on red and NIR. The explanation of results is easy, and most publications have used it in a supportive way in the research, e.g., to extract the vine rows [71].
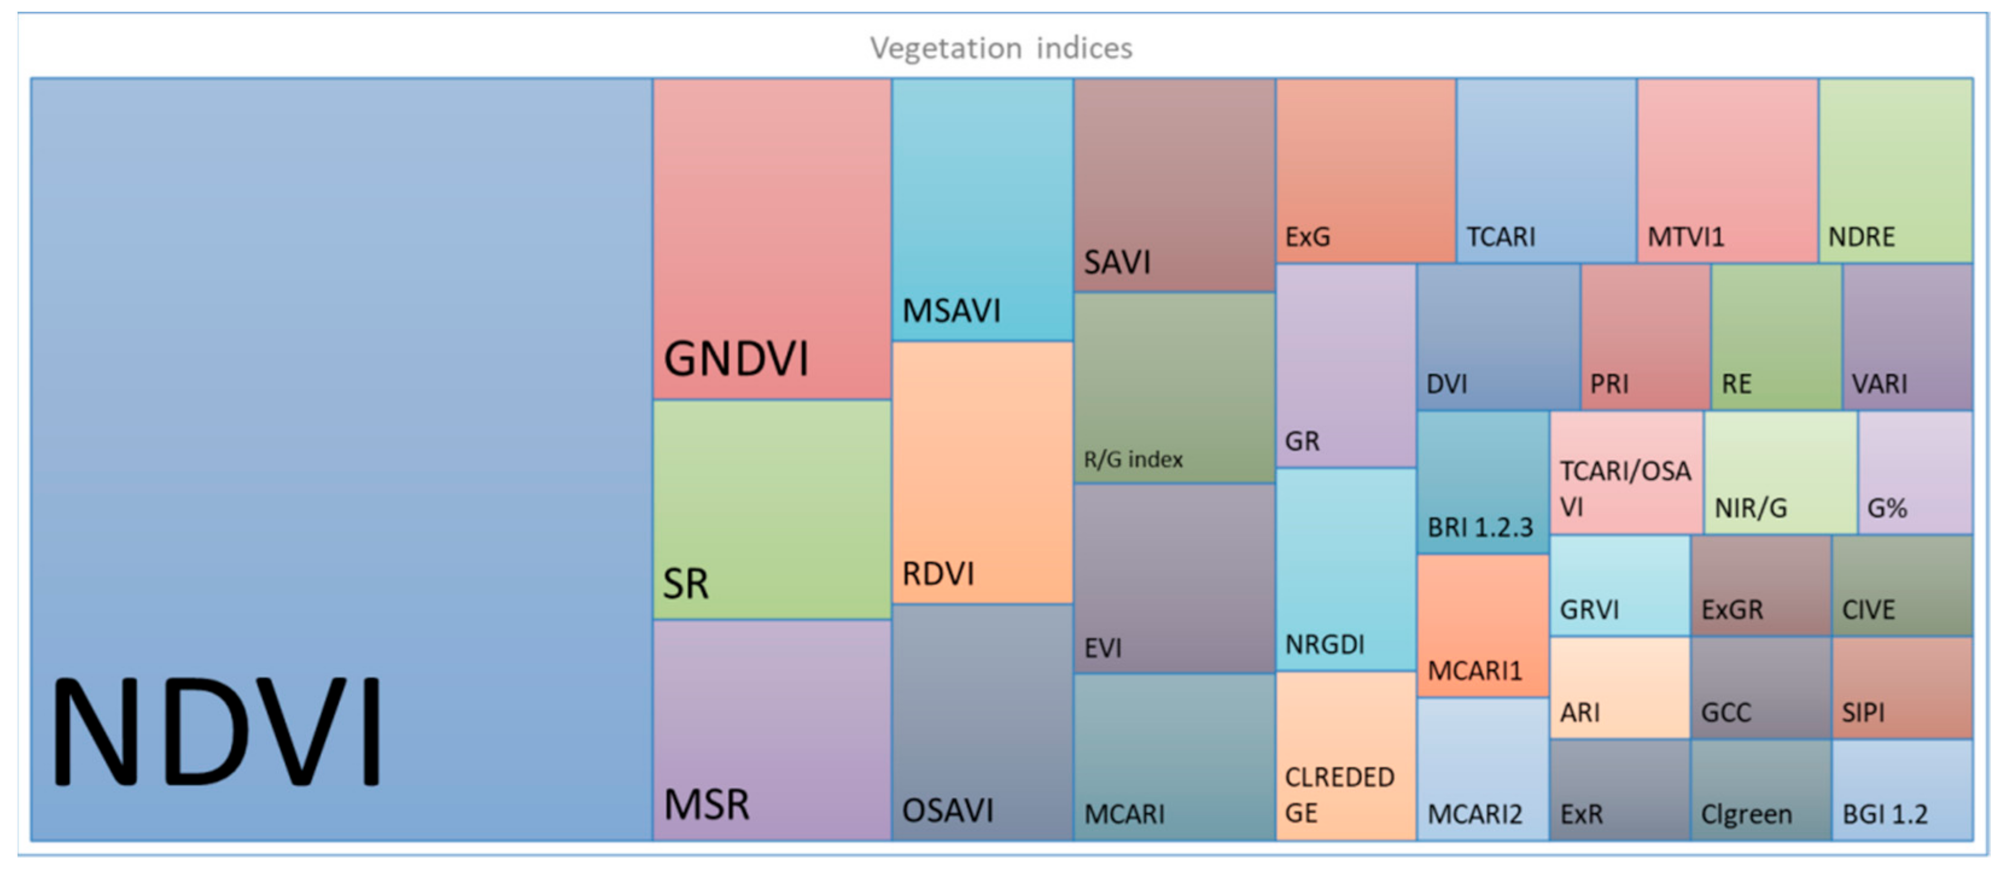
GNDVI was used 16 times, followed by SR and MSR with 11 references. Soil adjusted vegetation indices (SAVI, MSAVI, OSAVI) had about 10 references each on this review. SAVI and MSAVI are used most in medium and low-resolution imagery due to the ability to minimize soil brightness influences [127]. Figure 9 displays the usage of each vegetation index with 3 or more references. The area of the rectangle is proportional to the references of each VI.
4. Applications in Viticulture
4.1. Methodologies in Vine Research
The main methodologies which are used in viticulture research are analyzed in the present review. Out of 113 papers, 34 have extracted the vine rows (Table 5) in order to be more accurate by removing the inner row area and focusing only on the vine canopy [18,49]. This method provides results that are not affected by the cultivation practices in the inner row vegetation. This method is used only in high-resolution imagery, with a threshold of 50 cm pixel size; nevertheless, the main usage is on UAV imagery which have a few cm pixel size [29]. It is important to mention that about 76% of publications that apply row extraction methods are on site-specific scale. With vine row extraction the results are more accurate, due to zero interference from inner row pixels [128] and helpful to apply canopy management [121]. The main algorithms used in row extraction apply machine learning techniques [47,49], others apply OBIA to identify vine rows and inner row vegetation [26,28] with high accuracy. Classification methods (supervised [18] and unsupervised [44]) achieve high quality results, beyond that a threshold method is used [121] with vegetation indices and digital surface model (DSM).
Vegetation indices are the tools for predicting the vine status and estimate various parameters of the plant, VIs provide information about vegetation without the need for in situ samplings. This approach in viticulture research using remote sensing techniques is a key factor for management. The main research on estimation is focused on grape yield and biophysical parameters of grape [85,118]. A total of 40 papers use methodologies to estimate/predict variables such as yield [72], water status [24], biophysical parameters of the canopy [4] and grape phenolics [74], while 21 out of 40 use UAV imagery and 8 aircraft imagery to calculate the VIs. Estimation and prediction methodologies with UAV or airborne platform imagery are used in order to apply selective harvesting according to the desired type of wine [10], while early growth stage yield [49] and water stress [93] predictions support decision-making in cultivation practices and irrigation management. The high-resolution imagery of UAVs or airborne platforms, offers the ability to remove the inner-row area and focus only on the vine canopy, removing the interference in the vegetation indices from the inside of the lines and obtain VIs from pure vine vegetation pixels [129]. The estimation accuracy is a major factor, the water status or water stress estimation of vine canopy is the one with the best accuracy with high values of r2 up to 0.93 [105]. Other parameters such as chlorophyll concentration on vine leaves, nutrients uptake and leaf area, are estimated with acceptable accuracy [4,5,120]. The yield is the more important factor for estimation, in this case linear regressions perform moderately, while the more accurate results are obtained with artificial neural networks [49].
In recent years, there are studies that have been using machine learning algorithms in order to achieve more accurate results. They perform better in estimation than older methods such as regression, applied for binary classification and became a useful and powerful tool in precision viticulture [6]. A total of 12 papers [29] used machine learning methodologies in order to identify vine canopy, estimate yield, predict vine water status and disease detection. One limitative parameter is the lack of data to execute the training of the algorithm [29,85]. Machine learning is used mainly of several vine parameters such as water status estimation [6] and for vine row extraction [126], for yield estimation machine learning provides better results from regressions [49], furthermore, machine learning and artificial neural networks are used to estimate and locate diseases [26,29,47] more than other classification methods.
Of the 113 papers, 108 have used multispectral and 5 hyperspectral imagery capturing the wide use of multispectral platforms. Multispectral platforms constitute a large part of satellites, in addition multispectral sensors are widely mounted in UAV or aircraft as well as vegetation health is captured in visible and near-infrared area of the electromagnetic spectrum. The hyperspectral sensors are used mainly for accurate estimation of chlorophyll a and b, carotenoids and nutrients [5,38,120]. The narrow bands offer unlimited combinations and formulas in order to be more specific on the absorption of these. Moreover, hyperspectral vegetation indices are used to estimate grape composition and grapevine physiology [33,120].
4.2. Research Focus and Applications in Viticulture
The research based on remote sensing imagery and vegetation indices revolves around three categories (Table 6); these are multitemporal monitoring, management zones and terroirs analysis. Three research papers only focus on terroirs analysis with vegetation indices in order to evaluate differences on vineyards vegetation and crop cycle [60,63,122]. Management zones delineation is referred to in 29 publications, which proves the importance to manage the spatial variability in the vineyard [50,86]. Furthermore, 68 publications have monitored the vineyard on multitemporal scale in order to capture the phenology, growth stages and crop cycle [77,108].
This review also gathered the main applications on vines based on vegetation indices (Table 7) such as estimation of water stress [7] on vines, combining it sometimes with different irrigation strategies [97], or monitor water stress to change the irrigation [6]. Primarily, the water content of vine leaves was estimated with indices based on SWIR (GVMI [103], NDWI [32,34], SIWSI [32], SWIRR [32]) showing great accuracy. In other cases, the water content can be estimated with commonplace vegetation indices, such as NDVI, despite the absence of short-wave infrared [62], and correlate them with it. With these methods for estimating water stress, vine growers can manage irrigation and reduce water waste.
An important application of vegetation indices is to estimate and predict the yield, which is referred to in 10 publications. Eight out of 10 use high-resolution imagery for yield estimation provided by sensors on UAVs and Aircrafts [35,37,49,72,74,85,118,130]. The accuracy of yield estimation varies from r2 = 0.6 up to 0.9, which is achieved with artificial neural networks [49].
Weeds and diseases which affect the vine and specifically the vine canopy, including Cynodon dactylon [26] and Flavescence dorée [27] can be detected and reduce their spread [29]. Methodologies to detect vine diseases are referred to in 10 papers, as shown in Table 7, and mainly these are diseases detected from RGB generated vegetation indices.
5. Discussion and Future Perspectives
The findings of our review reveal the increasing use of UAVs and Sentinel-2 in viticulture. This dipole of free satellite data (Sentinel-2 and UAV) imagery has been reported and analyzed also in [129,131,132]. The results of the review agree with [129,131,132], as in the last 2 years the use of UAV and Sentinel-2 data in papers constitute more than 65%. In 2019 UAVs were used in 35% of papers and Sentinel-2 30%, while in 2020 UAVs 37% and Sentinel-2 23%, capturing the tendency to study on site-specific and regional scale. The usage of RGB (Red, Green, Blue) and NIR (near-infrared) from UAVs is a powerful tool for researchers to monitor vineyard development with VIs and apply crop management in the vineyard [129]. With 10 m pixel size vegetation indices from Sentinel-2 imagery can demonstrate the spatial variability in the vineyard [19] but do not remain unaffected by inner row vegetation and different cultivation practices between vineyards. This shows that it is possible to study vineyards with some limitations, which relate to cloud cover and assumptions, e.g., the presence of different types of land cover in an area of 10 m × 10 m, while the positive is that the cost is negligible and as a satellite it offers 3–5 days revisit. Remote sensing platforms such as Sentinel-2, used for the assessment of spatial variability [19] and detect changes in LAI (leaf area index) of vineyards [56]. As reported [131,132], medium resolution satellite data are successfully used in the observation of crops with vegetation indices. UAVs offer VIs data for vineyard analysis with high accuracy and high-resolution for vine row extraction [126] in a low cost [72]. Furthermore, it is also possible to study a vineyard area on regional scale with free access imagery such as Sentinel-2.
The long course of VIs begins in 1968 with RVI [20], and in 1973 with NDVI [21]. The combinations for the creation of VIs are almost unlimited, in this case the VIs used in viticulture almost reach 100. VIs have been created to study various parameters of vegetation; nevertheless, NDVI is the most often appearing with a total of 99 times, and was used 27 times to extract vine rows, and 29 times to delineate management zones in the vineyard. Despite the large number (97) of vegetation indices collected in this review, more than 10 times only 6 were used (NDVI, GNDVI, MSR, SR, MSAVI, RDVI). Τhe emergence of new VIs showed a repletion in the early 2000s, later, hyperspectral remote sensing helped to calculate new VIs. Initially, the VIs identified healthy vegetation relative to other land cover and then evolved to identify specific parameters of vegetation. We conclude that in viticulture VIs are a field that can evolve by increasing the use of different VIs, rather than the basic ones that use bands in red and near-infrared. The development of the sector nowadays is based on the software part and the processing of the data for the better performance of the VIs, e.g., machine learning [6,49,126] and artificial neural networks [26,29,47].
Τhe future perspectives of the research focus on VIs Big Data analytics [131] and technologies such as cloud computing, machine learning, IoT (Internet of Things) and artificial intelligence [13] to manage and analyze VIs data. An important contribution to research has the combination of sensors such as Sentinel-2 and Sentinel-3, for evapotranspiration estimations, and Sentinel-2 with Sentinel-1 (Synthetic Aperture Radar) for soil moisture assessment and irrigation management [132]. Research is now focused on the implementation of decision support systems (DSS) with VIs for real economic development [129].
The design of the relational database played an important role in conducting the review. The three main tables (Papers, VIs and Sensors) are interconnected, and results can be extracted from all directions. After assigning the data to the database, it was possible to find out which platforms imagery each index have used, for example, which papers used NDVI from Sentinel-2 data, or which platform GNDVI have used for calculation and how many times. In conclusion, with the relational database we were able to access and answer every question that concerned us, during the design and writing.
6. Conclusions
The aim of this review was to gather all the vegetation indices and applications which have been used in viticulture with remote sensing methods. These include low-resolution satellite platforms such as MODIS, medium-resolution (Landsat, ASTER, Sentinel-2) and high-resolution satellite platforms (Worldview2, IKONOS, Quickbird). In addition, remote sensing methods are the non-orbit sensors such as aircrafts and UAVs equipped with multispectral and RGB cameras. Methodologies based on spectroradiometer-produced vegetation indices are not included in this review due to proximal sensing which requires the presence of a human in the field.
The wide usage of UAV demonstrates the utilities of this technology in viticulture, the high-resolution it offers is ideal to extract the vine rows and be more accurate by removing the inner row pixels. Before UAVs, aircrafts that were used instead for the production of high-resolution imagery. High-resolution imagery that comes from UAV is a value for money option as a remote sensing sensor in the vine research and precision viticulture, due to the ability to extract the vine rows. In medium-resolution imagery, Sentinel-2 excels in use over others, due to the ability to reveal spatial variability that can be used on a regional scale.
From a geographical point of view, these different methodologies are applied in study areas that occur in countries with traditions of viticulture and beneficial climate conditions for the development of viticulture. In high latitudes however, vineyards research with remote sensing methods are not used. In contrast, they use proximal sensing or focus on other parameters, such as soil and precipitation. In conclusion, as the geographical exploration and the spatial distribution of the study areas are concerned, it seems that the research is located in mid-latitudes mainly in around ±40 degrees from the equator.
In this review, we have presented 97 different vegetation indices with applications on different scales, such as regional or site-specific. The keywords “precision viticulture”, “remote sensing”, “UAV” and “NDVI” were recorded more times, which shows that the research trend of the present is to study the spatial variability on the vineyard with vegetation indices and UAV’s imagery. Additionally, the aim of research on the regional scale mainly focuses on evaluating methodologies in different vineyards and rarely to categorize or study differences in the regional scale.
The use of vegetation indices on viticulture aims to analyze and estimate the condition of the vine canopy. Vegetation indices are sensitive to different characteristics of the plant such as chlorophyll, pigments, biomass or water content on the leaves. The applications of these in vineyards are an extra tool for modernization viticulture with new technologies and application of precision viticulture. The large amount of spatial data from remote sensing in recent years has led to the era of big data. The evolution and implementation of hyperspectral imagery and hyperspectral VIs are of interest for the future in the field of PV. The evolution of research on the remote sensing vegetation indices, their management with artificial intelligence, neural networks, and smart technologies provides producers with more efficient decision support systems and the ability to apply technologies in order to increase yield and quality.
Author Contributions
Conceptualization, D.K., R.G. and D.T.; methodology, R.G. and D.T.; software, R.G. and N.L.; data review and monitoring results, R.G.; information analysis and data curation, R.G. and N.L.; writing—original draft preparation, R.G.; writing—review and editing, D.K.; visualization, R.G. and A.P.; supervision and project administration D.K. All authors have read and agreed to the published version of the manuscript.
Funding
This research has been co-financed by the European Regional Development Fund of the European Union and Greek national funds through the Operational Program Competitiveness, Entrepreneurship and Innovation, under the call RESEARCH–CREATE–INNOVATE (project code: T1EDK-04202).
Institutional Review Board Statement
Not applicable.
Informed Consent Statement
Not applicable.
Conflicts of Interest
The authors declare no conflict of interest.
References
- Lutz, H.F. Viticulture and Brewing in the Ancient Orient; G.E. Stechert: Leipzig, Germany, 1922. [Google Scholar] [CrossRef] [Green Version]
- Zhang, Q. Precision Agriculture Technology for Crop Farming; CRC Press: Washington, DC, USA, 2016; ISBN 13: 978-1-4822-5108-1. [Google Scholar]
- Arnó, J.; Martínez-Casasnovas, J.A.; Ribes-Dasi, M.; Rosell, J.R. Review. Precision Viticulture. Research topics, challenges and opportunities in site-specific vineyard management. Span. J. Agric. Res. 2009, 7, 779–790. [Google Scholar] [CrossRef] [Green Version]
- Caruso, G.; Tozzini, L.; Rall, G.; Primicerio, J.; Moriondo, M.; Palai, G.; Gucci, R. Estimating biophysical and geometrical parameters of grapevine canopies(‘Sangiovese’) by an unmanned aerial vehicle (UAV) and VIS-NIR cameras. Pisa. Vitis 2017, 56, 63–70. [Google Scholar] [CrossRef]
- Gil-Perez, B.; Zarco-Tejada, P.J.; Correa-Guimaraes, A.; Relea-Gangas, E.; Navas-Gracia, L.M.; Hernadez-Navarro, S.; Sans-Requena, J.F.; Berjon, A.; Martin-Gil, J. Remote sensing detection of nutrient uptake in vineyards using narrow-band hyperspectral imagery. Valladolid. Vitis 2010, 49, 167–173. [Google Scholar]
- Romero, M.; Luo, Y.; Su, B.; Fuentes, S. Vineyard water status estimation using multispectral imagery from an UAV platform and machine learning algorithms for irrigation scheduling management. Comput. Electron. Agric. 2018, 147, 109–117. [Google Scholar] [CrossRef]
- Soubry, I.; Patias, P.; Tsioukas, V. Monitoring vineyards with UAV and multi-sensors for the assessment of water stress and grape maturity. J. Unmanned Veh. Syst. 2017, 5, 37–50. [Google Scholar] [CrossRef] [Green Version]
- Pôças, I.; Rodrigues, A.; Gonçalves, S.; Costa, M.P.; Gonçalves, I.; Pereira, S.L.; Cunha, M. Predicting Grapevine Water Status Based on Hyperspectral Reflectance Vegetation Indices. Remote Sens. 2015, 7, 16460–16479. [Google Scholar] [CrossRef] [Green Version]
- Santesteban, L.G.; Guillaume, S.; Royo, J.B.; Tisseyre, B. Are precision agriculture tools and methods relevant at the whole-vineyard scale? Precis. Agric. 2013, 14, 2–17. [Google Scholar] [CrossRef] [Green Version]
- Ferrer, M.; Echeverría, G.; Pereyra, G.; Gonzalez-Neves, G.; Pan, D.; Manuel Mirás-Avalos, J. Mapping vineyard vigor using airborne remote sensing: Relations with yield, berry composition and sanitary status under humid climate conditions. Precis. Agric. 2020, 21, 178–197. [Google Scholar] [CrossRef]
- Xie, C.; Yang, C. A review on plant high-throughput phenotyping traits using UAV-based sensors. Comput. Electron. Agric. 2020, 178, 105731. [Google Scholar] [CrossRef]
- Hall, A. Remote sensing applications in viticulture: Recent advances and new opportunities. In Proceedings of the XI International Terroir Congress, McMinnville, OR, USA, 10–14 July 2016; pp. 358–363. [Google Scholar]
- Shafi, U.; Mumtaz, R.; García-Nieto, J.; Ali Hassan, S.; Ali Raza Zaidi, S.; Iqbal, N. Precision Agriculture Techniques and Practices: From Considerations to Applications. Sensors 2019, 19, 3796. [Google Scholar] [CrossRef] [Green Version]
- Hall, A.; Lamb, D.W.; Holzapfel, B.; Louis, J. Optical remote sensing applications in viticulture—A review. Aust. J. Grape Wine Res. 2002, 8, 36–47. [Google Scholar] [CrossRef]
- Xue, J.; Su, B. Significant Remote Sensing Vegetation Indices: A Review of Developments and Applications. J. Sens. 2017. [Google Scholar] [CrossRef] [Green Version]
- Hatfield, L.J.; Prueger, H.J.; Sauer, J.T.; Dold, C.; O’Brien, P.; Wacha, K. Applications of Vegetative Indices from Remote Sensing to Agriculture: Past and Future. Inventions 2019, 4, 71. [Google Scholar] [CrossRef] [Green Version]
- Adamides, G. A Review of Climate-Smart Agriculture Applications in Cyprus. Atmosphere 2020, 11, 898. [Google Scholar] [CrossRef]
- Sozzi, M.; Kayad, A.; Marinello, F.; Taylor, A.J.; Tisseyre, B. Comparing vineyard imagery acquired from Sentinel-2 and Unmanned Aerial Vehicle (UAV) platform. OENO One 2020, 189–197. [Google Scholar] [CrossRef] [Green Version]
- Di Gennaro, S.F.; Dainelli, R.; Palliotti, A.; Toscano, P.; Matese, A. Sentinel-2 Validation for Spatial Variability Assessment in Overhead Trellis System Viticulture Versus UAV and Agronomic Data. Remote Sens. 2019, 11, 2573. [Google Scholar] [CrossRef] [Green Version]
- Birth, S.G.; McVey, R.G. Measuring the Color of Growing Turf with a Reflectance Spectrophotometer. Agron. J. 1968, 60, 640–643. [Google Scholar] [CrossRef]
- Rouse, W.J.; Haas, H.R.; Schell, A.J.; Deering, W.D. Monitoring vegetation systems in the Great Plains with ERTS. In Third ERTS Symposium; NASA SP-351; NASA: Washington, DC, USA, 1973; Volume 1, pp. 309–317. [Google Scholar]
- Vanegas, F.; Bratanov, D.; Powell, K.; Weiss, J.; Gonzalez, F. A Novel Methodology for Improving Plant Pest Surveillance in Vineyards and Crops Using UAV-Based Hyperspectral and Spatial Data. Sensors 2018, 18, 260. [Google Scholar] [CrossRef] [Green Version]
- Brook, A.; de Micco, V.; Battipaglia, G.; Erbaggio, A.; Ludeno, G.; Catapano, I.; Bonfante, A. A smart multiple spatial and temporal resolution system to support precision agriculture from satellite images: Proof of concept on Aglianico vineyard. Remote Sens. Environ. 2020, 240, 111679. [Google Scholar] [CrossRef]
- Poblete, T.; Ortega-Farías, S.; Moreno, M.A.; Bardeen, M. Artificial Neural Network to Predict Vine Water Status Spatial Variability Using Multispectral Information Obtained from an Unmanned Aerial Vehicle (UAV). Sensors 2017, 17, 2488. [Google Scholar] [CrossRef] [Green Version]
- Cogato, A.; Pagay, V.; Marinello, F.; Meggio, F.; Grace, P.; de Antoni Migliorati, M. Assessing the Feasibility of Using Sentinel-2 Imagery to Quantify the Impact of Heatwaves on Irrigated Vineyards. Remote Sens. 2019, 11, 2869. [Google Scholar] [CrossRef] [Green Version]
- Jimenez-Brenes, F.M.; Lopez-Granados, F.; Torres-Sanchez, J.; Peña, J.M.; Ramırez, P.; Isabel Castillejo-Gonzalez, L.; de Castro, A. Automatic UAV-based detection of Cynodon dactylon for site-specific vineyard management. PLoS ONE 2019, 14, e218132. [Google Scholar] [CrossRef] [PubMed]
- Albetis, J.; Duthoit, S.; Guttler, F.; Jacquin, A.; Goulard, M.; Poilvé, H.; Féret, J.-B.; Dedieu, G. Detection of Flavescence dorée Grapevine Disease Using Unmanned Aerial Vehicle (UAV)Multispectral Imagery. Remote Sens. 2017, 9, 308. [Google Scholar] [CrossRef] [Green Version]
- Brunori, E.; Maesano, M.; Moresi, F.V.; Antolini, A.; Bellincontro, A.; Forniti, R.; Biasi, R.; Mencarelli, F. Using UAV-based remote sensing to assess grapevine canopy damage due to fire smoke. J. Sci. Food Agric. 2020, 100, 4531–4539. [Google Scholar] [CrossRef] [PubMed]
- Kerkech, M.; Hafiane, A.; Canals, R. Deep leaning approach with colorimetric spaces and vegetation indices for vine diseases detection in UAV images. Comput. Electron. Agric. 2018, 155, 237–243. [Google Scholar] [CrossRef]
- Ronchetti, G.; Mayer, A.; Facchi, A.; Ortuani, B.; Sona, G. Crop Row Detection through UAV Surveys to Optimize On-Farm Irrigation Management. Remote Sens. 2020, 12, 1967. [Google Scholar] [CrossRef]
- Sun, L.; Gao, F.; Anderson, C.M.; Kustas, P.W.; Alsina, M.M.; Sanchez, L.; Sams, B.; McKee, L.; Dulaney, W.; White, A.W.; et al. Daily Mapping of 30 m LAI and NDVI for Grape Yield Prediction in California Vineyards. Remote Sens. 2017, 9, 317. [Google Scholar] [CrossRef] [Green Version]
- Arango, R.B.; Camposy, A.M.; Combarro, E.F. Identification of Agricultural Management Zones Through Clustering Algorithms with Thermal and Multispectral Satellite Imagery. Int. J. Uncertain. Fuzziness Knowl. Based Syst. 2017, 25, 121–140. [Google Scholar] [CrossRef]
- Maimaitiyiming, M.; Sagan, V.; Sidike, P.; Maimaitijiang, M.; Miller, J.A.; Kwasniewski, M. Leveraging Very-High Spatial Resolution Hyperspectral and Thermal UAV Imageries for Characterizing Diurnal Indicators of Grapevine Physiology. Remote Sens. 2020, 12, 3216. [Google Scholar] [CrossRef]
- Borgogno-Mondino, E.; Novello, V.; Lessio, A.; de Palma, L. Describing the spatio-temporal variability of vines and soil by satellite-based spectral indices: A case study in Apulia (South Italy). Int. J. Appl. Earth Obs. Geoinform. 2018, 68, 42–50. [Google Scholar] [CrossRef]
- Kandylakis, Z.; Karantzalos, K. Precision Viticulture from Multitemporal, Multispectral Very High Resolution Satellite Data. In Proceedings of the XXIII ISPRS Congress, Prague, Czech Republic, 12–19 July 2016. [Google Scholar] [CrossRef]
- Albetis, J.; Jacquin, A.; Goulard, M.; Poilvé, H.; Rousseau, J.; Clenet, H.; Dedieu, G.; Duthoit, S. On the Potentiality of UAV Multispectral Imagery to Detect Flavescence dorée and Grapevine Trunk Diseases. Remote Sens. 2019, 11, 23. [Google Scholar] [CrossRef] [Green Version]
- Rey-Caramés, C.; Diago, P.M.; Pilar, M.M.; Lobo, A.; Tardaguila, J. Using RPAS Multi-Spectral Imagery to Characterise Vigour, Leaf Development, Yield Components and Berry Composition Variability within a Vineyard. Remote Sens. 2015, 7, 14458–14481. [Google Scholar] [CrossRef] [Green Version]
- Zarco-Tejada, P.J.; Berjón, A.; López-Lozano, R.; Miller, J.R.; Martín, P.; Cachorro, V.; González, M.R.; de Frutos, A. Assessing vineyard condition with hyperspectral indices: Leaf and canopy reflectance simulation in a row-structured discontinuous canopy. Remote Sens. Environ. 2005, 99, 271–287. [Google Scholar] [CrossRef]
- Munden, R.; Curran, P.J.; Catt, J.A. The relationship between red edge and chlorophyll concentration in the Broadbalk winter wheat experiment at Rothamsted. Int. J. Remote Sens. 1994, 15, 705–709. [Google Scholar] [CrossRef]
- Weiser, R.L.; Asrar, G.; Millere, G.P.; Kanemasu, T. Assessing grassland biophysical characteristics from spectral measurements. Remote Sens. Environ. 1986, 20, 141–152. [Google Scholar] [CrossRef]
- Baret, F.; Guyot, G.; Major, D.J. Crop biomass evaluation using radiometric measurements. Photogrammetria 1989, 43, 241–256. [Google Scholar] [CrossRef]
- Vallentin, C.; Dobers, E.S.; Itzerott, S.; Kleinschmit, B.; Spengler, D. Delineation of management zones with spatial data fusion and belief theory. Precis. Agric. 2020, 21, 802–830. [Google Scholar] [CrossRef] [Green Version]
- Hadizadeh, M.; Rahnama, M.; Poor, H.A.; Hesari, B.; Kazemi, M. The comparison between remotely-sensed vegetation indicesof Meteosat second generation satellite and temperature-based agrometeorological indices for monitoring of main cropsin the northeast of Iran. Arab. J. Geosci. 2020, 13, 509. [Google Scholar] [CrossRef]
- Khaliq, A.; Comba, L.; Biglia, A.; Aimonino, D.R.; Chiaberge, M.; Gay, P. Comparison of Satellite and UAV-Based Multispectral Imagery for Vineyard Variability Assessment. Remote Sens. 2019, 11, 436. [Google Scholar] [CrossRef] [Green Version]
- Matese, A.; Toscano, P.; Di Gennaro, S.F.; Genesio, L.; Vaccari, F.P.; Primicerio, J.; Belli, C.; Zaldei, A.; Bianconi, R.; Gioli, B. Intercomparison of UAV, Aircraft and Satellite Remote Sensing Platforms for Precision Viticulture. Remote Sens. 2015, 7, 2971–2990. [Google Scholar] [CrossRef] [Green Version]
- Sozzi, M.; Kayad, A.G.; Pezzuolo, A.; Sartori, L.; Dubbini, M.; Marinello, F. Comparison Between Different Spatial Resolution Satellites Images for Viticulture. In Proceedings of the European Conference on Agricultural Engineering AgEng2018, Wageningen, The Netherlands, 8–11 July 2018. [Google Scholar] [CrossRef]
- Kerkech, M.; Hafiane, A.; Canals, R. VddNet: Vine Disease Detection Network Based on Multispectral Images and Depth Map. Remote Sens. 2020, 12, 3305. [Google Scholar] [CrossRef]
- Mazzia, V.; Comba, L.; Khaliq, A.; Chiaberge, M.; Gay, P. UAV and Machine Learning Based Refinement of a Satellite-Driven Vegetation Index for Precision Agriculture. Sensors 2020, 20, 2530. [Google Scholar] [CrossRef] [PubMed]
- Ballesteros, R.; Intrigliolo, D.S.; Ortega, J.F.; Ramírez-Cuesta, J.M.; Buesa, I.; Moreno, M.A. Vineyard yield estimation by combining remote sensing, computer vision and artificial neural network techniques. Precis. Agric. 2020, 21, 1242–1262. [Google Scholar] [CrossRef]
- Johnson, L.F.; Bosch, D.F.; Williams, D.C.; Lobitz, B.M. Remote sensing of vineyard management zones: Implications for wine quality. Appl. Eng. Agric. 2001, 17, 557–560. [Google Scholar] [CrossRef]
- Bonilla, I.; Martínez de Toda, F.; Martínez-Casasnovas, J.A. Vineyard zonal management for grape quality assessment by combining airborne remote sensed imagery and soil sensors. Remote Sens. Agric. Ecosyst. Hydrol. 2014. [Google Scholar] [CrossRef]
- Filippetti, I.; Allegro, G.; Valentini, G.; Pastore, C.; Colucci, E.; Intrieri, C. Influence of vigour on vine performance and berry composition of cv. Sangiovese (Vitis vinifera L.). J. Int. Sci. Vigne Vin 2013, 47, 21–33. [Google Scholar] [CrossRef] [Green Version]
- Pádua, L.; Adão, T.; Sousa, A.; Peres, E.; Sousa, J.J. Individual Grapevine Analysis in a Multi-Temporal Context Using UAV-Based Multi-Sensor Imagery. Remote Sens. 2020, 12, 139. [Google Scholar] [CrossRef] [Green Version]
- Helman, D.; Bahat, I.; Netzer, Y.; Ben-Gal, A.; Alchanatis, V.; Peeters, A.; Cohen, Y. Using Time Series of High-Resolution Planet Satellite Images to Monitor Grapevine Stem Water Potential in Commercial Vineyards. Remote Sens. 2018, 10, 1615. [Google Scholar] [CrossRef] [Green Version]
- Devaux, N.; Crestey, T.; Leroux, C.; Bruno, T. Potential of Sentinel-2 satellite images to monitor vine fields grown at a territorial scale. OENO One 2019, 1, 51–58. [Google Scholar] [CrossRef]
- Vélez, S.; Barajas, E.; Rubio, J.A.; Vacas, R.; Poblete-Echeverría, C. Effect of Missing Vines on Total Leaf Area Determined by NDVI Calculated from Sentinel Satellite Data: Progressive Vine Removal Experiments. Appl. Sci. 2020, 10, 3612. [Google Scholar] [CrossRef]
- Priori, S.; Martini, E.; Andrenelli, M.C.; Magini, S.; Agnelli, A.E.; Bucelli, P.; Biagi, M.; Pellegrini, S.; Costantini, E.A.C. Improving Wine Quality through Harvest Zoning and Combined Use of Remote and Soil Proximal Sensing. Soil Sci. Soc. Am. J. 2013, 77, 1338–1348. [Google Scholar] [CrossRef]
- Novara, A.; Pisciotta, A.; Minacapilli, M.; Maltese, A.; Capodici, F.; Cerdà, A.; Gristina, L. The impact of soil erosion on soil fertility and vine vigor. A multidisciplinary approach based on field, laboratory and remote sensing approaches. Sci. Total Environ. 2018, 622, 474–480. [Google Scholar] [CrossRef] [PubMed] [Green Version]
- Marciniak, M.; Brown, R.; Reynolds, A.; Jollineau, M. Use of remote sensing to understand the terroir of the Niagara Peninsula. Applications in a Riesling vineyard. J. Int. Sci. Vigne Vin 2015, 49, 1–26. [Google Scholar] [CrossRef] [Green Version]
- Martínez, Á.; Gómez-Miguel, V.D. Vegetation index cartography as a methodology complement to terroir zoning for use in precision viticulture. OENO One 2017, 51, 289–301. [Google Scholar] [CrossRef] [Green Version]
- Vélez, S.; Rubio, J.A.; Andrés, M.I.; Barajas, E. Agronomic classification between vineyards (‘Verdejo’) using NDVI and Sentinel-2 and evaluation of their wines. Vitis 2019, 58, 33–38. [Google Scholar] [CrossRef]
- Pagay, V.; Kidman, C.M. Evaluating Remotely-Sensed Grapevine (Vitis vinifera L.) Water Stress Responses Across a Viticultural Region. Agronomy 2019, 9, 682. [Google Scholar] [CrossRef] [Green Version]
- Fraga, H.; Costa, R.; Santos, J.A. Multivariate clustering of viticultural terroirs in the Douro winemaking region. Ciência Técnica Vitiviníc. 2017, 32, 142–153. [Google Scholar] [CrossRef] [Green Version]
- Zhao, L.; Li, Q.; Zhang, Y.; Wang, H.; Du, X. Integrating the Continuous Wavelet Transform and a Convolutional Neural Network to Identify Vineyard Using Time Series Satellite Images. Remote Sens. 2019, 11, 2641. [Google Scholar] [CrossRef] [Green Version]
- Sozzi, M.; Kayad, A.; Taylor, J.A.; Tisseyre, B.; Sartori, L.; Marinello, F. Evaluation of shadow effects in satellite images of vineyards with different row orientation. In Proceedings of the 2019 IEEE International Workshop on Metrology for Agriculture and Forestry (MetroAgriFor), Portici, Italy, 24–26 October 2019; pp. 350–354. [Google Scholar] [CrossRef]
- Smit, J.L.; Sithole, G.; Strever, A.E. Vine Signal Extraction—An Application of Remote Sensing in Precision Viticulture. S. Afr. J. Enol. Vitic. 2020, 31. [Google Scholar] [CrossRef] [Green Version]
- Hall, A.; Louis, J.; Lamb, D. A Method for Extracting Detailed Information from High Resolution Multispectral Images of Vineyards. In Proceedings of the 6th International Conference on Geocomputation, Brisbane, Australia, 24–26 September 2001. [Google Scholar]
- Cinat, P.; Di Gennaro, S.F.; Berton, A.; Matese, A. Comparison of Unsupervised Algorithms for Vineyard Canopy Segmentation from UAV Multispectral Images. Remote Sens. 2019, 11, 1023. [Google Scholar] [CrossRef] [Green Version]
- Karakizi, C.; Oikonomou, M.; Karantzalos, K. Vineyard Detection and Vine Variety Discrimination from Very High Resolution Satellite Data. Remote Sens. 2016, 8, 235. [Google Scholar] [CrossRef] [Green Version]
- Mathews, A.J. Object-based spatiotemporal analysis of vine canopy vigor using an inexpensive unmanned aerial vehicle remote sensing system. J. Appl. Remote Sens. 2014, 8, 085199. [Google Scholar] [CrossRef]
- Comba, L.; Gay, P.; Primicerio, J.; Aimonino, D.R. Vineyard detection from unmanned aerial systems images. Comput. Electron. Agric. 2015, 114, 78–87. [Google Scholar] [CrossRef]
- Di Gennaro, S.F.; Toscano, P.; Cinat, P.; Berton, A.; Matese, A. A low-cost and unsupervised image recognition methodology for yield estimation in a vineyard. Front. Plant Sci. 2019, 10, 559. [Google Scholar] [CrossRef] [Green Version]
- Urretavizcaya, I.; Santesteban, L.G.; Tisseyre, B.; Guillaume, S.; Miranda, C.; Royo, J.B. Oenological significance of vineyard management zones delineated using early grape sampling. Precis. Agric. 2014, 15, 111–129. [Google Scholar] [CrossRef] [Green Version]
- Lamb, D.W.; Weedon, M.M.; Bramley, R.G.V. Using remote sensing to predict grape phenolics and colour at harvest in a Cabernet Sauvignon vineyard: Timing observations against vine phenology and optimising image resolution. Aust. J. Grape Wine Res. 2004, 10, 46–54. [Google Scholar] [CrossRef] [Green Version]
- Cunha, M.; Marçal, A.R.S.; Silva, L. Very early prediction of wine yield based on satellite data from VEGETATION. Int. J. Remote Sens. 2010, 31, 3125–3142. [Google Scholar] [CrossRef]
- Reynolds, A.G.; Lee, H.-S.; Dorin, B.; Brown, R.; Jollineau, M.; Shemrock, A.; Crombleholme, M.; Poirier, E.J.; Zheng, W.; Gasnier, M.; et al. Mapping Cabernet Franc vineyards by unmanned aerial vehicles (UAVs) for variability in vegetation indices, water status, and virus titer. E3S Web Conf. 2018, 50, 02010. [Google Scholar] [CrossRef]
- Ledderhof, D.; Brown, R.; Reynolds, A.; Jollineau, M. Using remote sensing to understand Pinot noir vineyard variability in Ontario. Can. J. Plant Sci. 2016, 96, 89–108. [Google Scholar] [CrossRef]
- Matese, A.; Di Gennaro, S.F.; Miranda, C.; Berton, A.; Santesteban, L.G. Evaluation of spectral-based and canopy-based vegetation indices from UAV and Sentinel 2 images to assess spatial variability and ground vine parameters. Adv. Anim. Biosci. 2017, 8, 817–822. [Google Scholar] [CrossRef]
- Arnó, J.; Martínez-Casasnovas, J.A. Assessing opportunities for selective winery vintage with a market-driven composite index. Cogent Food Agric. 2017, 3, 1386438. [Google Scholar] [CrossRef]
- Meyers, J.M.; Dokoozlian, N.; Ryan, C.; Bioni, C.; Heuvel, J.E.V. A New, Satellite NDVI-Based Sampling Protocol for Grape Maturation Monitoring. Remote Sens. 2020, 12, 1159. [Google Scholar] [CrossRef] [Green Version]
- Anastasiou, E.; Balafoutis, A.; Darra, N.; Psiroukis, V.; Biniari, A.; Xanthopoulos, G.; Fountas, S. Satellite and Proximal Sensing to Estimate the Yield and Quality of Table Grapes. Agriculture 2018, 8, 94. [Google Scholar] [CrossRef] [Green Version]
- Tanda, G.; Chiarabini, V. Use of multispectral and thermal imagery in precision viticulture. J. Phys. Conf. Ser. 2019, 1224, 012034. [Google Scholar] [CrossRef]
- Candiago, S.; Remondino, F.; de Giglio, M.; Dubbini, M.; Gattelli, M. Evaluating Multispectral Images and Vegetation Indices for Precision Farming Applications from UAV Images. Remote Sens. 2015, 7, 4026–4047. [Google Scholar] [CrossRef] [Green Version]
- Jorge, J.; Vallbé, M.; Soler, J.A. Detection of irrigation inhomogeneities in an olivegrove using the NDRE vegetation index obtained from UAV images. Eur. J. Remote Sens. 2019, 52, 169–177. [Google Scholar] [CrossRef] [Green Version]
- Bonilla, I.; de Toda, F.M.; Martínez-Casasnovas, J.A. Vine vigor, yield and grape quality assessment by airborne remote sensing over three years: Analysis of unexpected relationships in cv. Tempranillo. Span. J. Agric. Res. 2015, 13. [Google Scholar] [CrossRef]
- Martinez-Casasnovas, J.A.; Agelet-Fernandez, J.; Arno, J.; Ramos, M.C. Analysis of vineyard differential management zones and relation to vine development, grape maturity and quality. Span. J. Agric. Res. 2012, 10, 326–337. [Google Scholar] [CrossRef] [Green Version]
- Bonilla, I.; de Toda, F.M.; Martínez-Casasnovas, J.A. Grape quality assessment by airborne remote sensing over three years. In Precision Agriculture ’13; Springer: Berlin, Germany, 2013; pp. 611–615. [Google Scholar] [CrossRef]
- Martínez-Casasnovas, J.A.; Ramos, M.C.; Espinal-Utgés, S. Hillslope terracing effects on the spatial variability of plant development as assessed by NDVI in vineyards of the Priorat region (NE Spain). Environ. Monit. Assess. 2010, 163, 379–396. [Google Scholar] [CrossRef]
- Di Gennaro, S.F.; Matese, A.; Gioli, B.; Toscano, P.; Zaldei, A.; Palliotti, A.; Genesio, L. Multisensor approach to assess vineyard thermal dynamics combining high-resolution unmanned aerial vehicle (UAV) remote sensing and wireless sensor network (WSN) proximal sensing. Sci. Hortic. 2017, 221, 83–87. [Google Scholar] [CrossRef]
- Primicerio, J.; Gay, P.; Ricauda Aimonino, D.; Comba, L.; Matese, A.; di Gennaro, S.F. NDVI-based vigour maps production using automatic detection of vine rows in ultra-high resolution aerial images. In Precision Agriculture ’15; Springer: Berlin, Germany, 2015; pp. 465–470. [Google Scholar] [CrossRef]
- Matese, A.; Di Gennaro, S.F. Practical Applications of a Multisensor UAV Platform Based on Multispectral, Thermal and RGB High Resolution Images in Precision Viticulture. Agriculture 2018, 8, 116. [Google Scholar] [CrossRef] [Green Version]
- Monsó, A.; Arnó, J.; Martínez-Casasnovas, J.A. A simplified index to assess the opportunity for selective wine grape harvesting from vigour maps. In Precision Agriculture ’13; Springer: Berlin, Germany, 2013. [Google Scholar] [CrossRef]
- Acevedo-Opazo, C.; Tisseyre, B.; Ojeda, H.; Guillaume, S. Spatial extrapolation of the vine (Vitis vinifera L.) water status: A first step towards a spatial prediction model. Irrig. Sci. 2010, 28, 143–155. [Google Scholar] [CrossRef]
- Pádua, L.; Marques, P.; Adão, T.; Guimarães, N.; Sousa, A.; Peres, E.; Sousa, J.J. Vineyard Variability Analysis through UAV-Based Vigour Maps to Assess Climate Change Impacts. Agronomy 2019, 9, 581. [Google Scholar] [CrossRef] [Green Version]
- Fiorillo, E.; Crisci, A.; de Filippis, T.; Di Gennaro, S.F.; Di Blasi, S.; Matese, A.; Primicerio, J.; Vaccari, F.P.; Genesio, L. Airborne high-resolution images for grape classification: Changes in correlation between technological and late maturity in a Sangiovese vineyard in Central Italy. Aust. J. Grape Wine Res. 2012, 18, 80–90. [Google Scholar] [CrossRef]
- Kazmierski, M.; Glémas, P.; Rousseau, J.; Tisseyre, B. Temporal stability of within-field patterns of NDVI in non irrigated Mediterranean vineyards. J. Int. Sci. Vigne Vin 2011, 45, 61–73. [Google Scholar] [CrossRef]
- Ortuani, B.; Facchi, A.; Mayer, A.; Bianchi, D.; Bianchi, A.; Brancadoro, L. Assessing the Effectiveness of Variable-Rate Drip Irrigation on Water Use Effciency in a Vineyard in Northern Italy. Water 2019, 11, 1964. [Google Scholar] [CrossRef] [Green Version]
- Campos, I.; Balbontín, C.; González-Piqueras, J.; González-Dugo, M.P.; Neale, C.M.U.; Calera, A. Combining a water balance model with evapotranspiration measurements to estimate total available soil water in irrigated and rainfed vineyards. Agric. Water Manag. 2016, 165, 141–152. [Google Scholar] [CrossRef]
- McClymont, L.; Goodwin, I.; Mazza, M.; Baker, N.; Lanyon, D.M.; Zerihun, A.; Chandra, S.; Downey, M.O. Effect of site-specific irrigation management on grapevine yield and fruit quality attributes. Irrig. Sci. 2012, 30, 461–470. [Google Scholar] [CrossRef]
- Geli, H.M.E.; González-Piqueras, J.; Neale, C.M.U.; Balbontín, C.; Campos, I.; Calera, A. Effects of Surface Heterogeneity Due to Drip Irrigation on Scintillometer Estimates of Sensible, Latent Heat Fluxes and Evapotranspiration over Vineyards. Water 2020, 12, 81. [Google Scholar] [CrossRef] [Green Version]
- Zúñiga Espinoza, C.; Khot, L.R.; Sankaran, S.; Jacoby, P.W. High Resolution Multispectral and Thermal Remote Sensing-Based Water Stress Assessment in Subsurface Irrigated Grapevines. Remote Sens. 2017, 9, 961. [Google Scholar] [CrossRef] [Green Version]
- Xia, T.; Kustas, W.P.; Anderson, M.C.; Alfieri, J.G.; Gao, F.; McKee, L.; Prueger, J.H.; Geli, H.M.E.; Neale, C.M.U.; Sanchez, L.; et al. Mapping evapotranspiration with high-resolution aircraft imagery over vineyards using one- and two-source modeling schemes. Hydrol. Earth Syst. Sci. 2016, 20, 1523–1545. [Google Scholar] [CrossRef] [Green Version]
- Bretreger, D.; Yeo, I.Y.; Quijano, J.; Awad, J.; Hancock, G.; Willgoose, G. Monitoring irrigation water use over paddock scales using climate data and landsat observations. Agric. Water Manag. 2019, 221, 175–191. [Google Scholar] [CrossRef]
- Garrido-Rubio, J.; González-Piqueras, J.; Campos, I.; Osann, A.; González-Gómez, L.; Calera, A. Remote sensing–based soil water balance for irrigation water accounting at plot and water user association management scale. Agric. Water Manag. 2020, 238, 106236. [Google Scholar] [CrossRef]
- Kandylakis, Z.; Falagas, A.; Karakizi, C.; Karantzalos, K. Water Stress Estimation in Vineyards from Aerial SWIR and Multispectral UAV Data. Remote Sens. 2020, 12, 2499. [Google Scholar] [CrossRef]
- Acevedo-Opazo, C.; Tisseyre, B.; Guillaume, S. The potential of high spatial resolution information to define within-vineyard zones related to vine water status. Precis. Agric. 2008, 9, 285–302. [Google Scholar] [CrossRef] [Green Version]
- Gong, C.; Buddenbaum, H.; Retzlaff, R.; Udelhoven, T. An Empirical Assessment of Angular Dependency for RedEdge-M in Sloped Terrain Viticulture. Remote Sens. 2019, 11, 2561. [Google Scholar] [CrossRef] [Green Version]
- Cogato, A.; Meggio, F.; Collins, C.; Marinello, F. Medium-Resolution Multispectral Data from Sentinel-2 to Assess the Damage and the Recovery Time of Late Frost on Vineyards. Remote Sens. 2020, 12, 1896. [Google Scholar] [CrossRef]
- Jones, E.G.; Wong, S.; Milton, A.; Sclauzero, J.; Whittenbury, H.; McDonnell, M.D. The Impact of Pan-Sharpening and Spectral Resolution on Vineyard Segmentation through Machine Learning. Remote Sens. 2020, 12, 934. [Google Scholar] [CrossRef] [Green Version]
- Rey, C.; Martín, M.P.; Lobo, A.; Luna, I.; Diago, M.P.; Millan, B.; Tardáguila, J. Multispectral imagery acquired from a UAV to assess the spatial variability of a Tempranillo vineyard. In Precision Agriculture ’13; Springer: Berlin, Germany, 2013. [Google Scholar] [CrossRef] [Green Version]
- Carrillo, E.; Matese, A.; Rousseau, J.; Tisseyre, B. Use of multi-spectral airborne imagery to improve yield sampling in viticulture. Precis. Agric. 2015, 17, 74–92. [Google Scholar] [CrossRef]
- Ducati, J.R.; Sarate, R.E.; Fachel, J.M.G. Application of remote sensing techniques to discriminate between conventional and organic vineyards in the Loire Valley, France. J. Int. Sci. Vigne Vin 2014, 48, 135–144. [Google Scholar] [CrossRef]
- Kalua, M.; Rallings, A.M.; Booth, L.; Medellín-Azuara, J.; Carpin, S.; Viers, J.H. sUAS Remote Sensing of Vineyard Evapotranspiration Quantifies Spatiotemporal Uncertainty in Satellite-Borne ET Estimates. Remote Sens. 2020, 12, 3251. [Google Scholar] [CrossRef]
- Nassar, A.; Torres-Rua, A.; Kustas, W.; Nieto, H.; McKee, M.; Hipps, L.; Stevens, D.; Alfieri, J.; Prueger, J.; Alsina, M.M.; et al. Influence of Model Grid Size on the Estimation of Surface Fluxes Using the Two Source Energy Balance Model and sUAS Imagery in Vineyards. Remote Sens. 2020, 12, 342. [Google Scholar] [CrossRef] [Green Version]
- Vanino, S.; Pulighe, G.; Nino, P.; de Michele, C.; Bolognesi, S.F.; D’Urso, G. Estimation of Evapotranspiration and Crop Coefficients of Tendone Vineyards Using Multi-Sensor Remote Sensing Data in a Mediterranean Environment. Remote Sens. 2015, 14708–14730. [Google Scholar] [CrossRef] [Green Version]
- Bramley, R.G.V.; Hamilton, R.P. Terroir and Precision Viticulture: Are they compatible? J. Int. Sci. Vigne Vin 2007, 41, 1–8. [Google Scholar] [CrossRef]
- Mesas-Carrascosa, F.-J.; de Castro, A.I.; Torres-Sánchez, J.; Triviño-Tarradas, P.; Jiménez-Brenes, F.M.; García-Ferrer, A.; López-Granados, F. Classification of 3D Point Clouds Using Color Vegetation Indices for Precision Viticulture and Digitizing Applications. Remote Sens. 2020, 12, 317. [Google Scholar] [CrossRef] [Green Version]
- Dobrowski, S.Z.; Ustin, S.L.; Wolpert, J.A. Grapevine dormant pruning weight prediction using remotely sensed data. Aust. J. Grape Wine Res. 2003, 9, 177–182. [Google Scholar] [CrossRef]
- Pádua, L.; Marques, P.; Hruška, J.; Adão, T.; Bessa, J.; Sousa, A.; Peres, E.; Morais, R.; Sousa, J.J. Vineyard properties extraction combining UAS based RGB imagery with elevation data. Int. J. Remote Sens. 2018, 39, 5377–5401. [Google Scholar] [CrossRef]
- Martin, P.; Zarco-Tejada, P.J.; Gonzalez, M.R.; Berjon, A. Using hyperspectral remote sensing to map grape quality in ‘Tempranillo’ vineyards affected by iron deficiency chlorosis. Vitis 2007, 46, 7–14. [Google Scholar]
- Pádua, L.; Marques, P.; Hruška, J.; Adão, T.; Peres, E.; Morais, R.; Sousa, J.J. Multi-Temporal Vineyard Monitoring through UAV-Based RGB Imagery. Remote Sens. 2018, 10, 1907. [Google Scholar] [CrossRef] [Green Version]
- Fraga, H.; Malheiro, A.C.; Moutinho-Pereira, J.; Cardoso, R.M.; Soares, P.M.M.; Cancela, J.J.; Pinto, J.G.; Santos, J.A. Integrated Analysis of Climate, Soil, Topography and Vegetative Growth in Iberian Viticultural Regions. PLoS ONE 2014, 9, e108078. [Google Scholar] [CrossRef]
- Dold, C.; Heitman, J.; Giese, G.; Howard, A.; Havlin, J.; Sauer, T. Upscaling Evapotranspiration with Parsimonious Models in a North Carolina Vineyard Upscaling Evapotranspiration with Parsimonious Models in a North Carolina Vineyard. Agronomy 2019, 9, 152. [Google Scholar] [CrossRef] [Green Version]
- Potopová, V.; Trnka, M.; Hamouz, P.; Soukup, J.; Castravet, T. Statistical modelling of drought-related yield losses using soil moisture vegetation remote sensing and multiscalar indices in the south-eastern Europe. Agric. Water Manag. 2020, 236. [Google Scholar] [CrossRef]
- Brown, L.A.; Dash, J.; Lidon, A.L.; Lopez-Baeza, E.; Dransfeld, S. Synergetic Exploitation of the Sentinel-2 Missions for Validating the Sentinel-3 Ocean and Land Color Instrument Terrestrial Chlorophyll Index Over a Vineyard Dominated Mediterranean Environment. IEEE J. Sel. Top. Appl. Earth Obs. Remote Sens. 2019, 12, 2244–2251. [Google Scholar] [CrossRef]
- Poblete-Echeverría, C.; Olmedo, G.F.; Ingram, B.; Bardeen, M. Detection and Segmentation of Vine Canopy in Ultra-High Spatial Resolution RGB Imagery Obtained from Unmanned Aerial Vehicle (UAV): A Case Study in a Commercial Vineyard. Remote Sens. 2017, 9, 268. [Google Scholar] [CrossRef] [Green Version]
- Huete, A.R. A soil-adjusted vegetation index (SAVI). Remote Sens. Environ. 1988, 25, 295–309. [Google Scholar] [CrossRef]
- Pádua, L.; Adão, T.; Hruška, J.; Sousaa, J.J.; Peresa, E.; Moraisa, R.; Sousa, A. Very high resolution aerial data to support multi-temporal precision agriculture information management. Proced. Comp. Sci. 2017, 121, 407–414. [Google Scholar] [CrossRef]
- Sassu, A.; Gambella, F.; Ghiani, L.; Mercenaro, L.; Caria, M.; Pazzona, A.L. Advances in Unmanned Aerial System Remote Sensing for Precision Viticulture. Sensors 2021, 21, 956. [Google Scholar] [CrossRef]
- Campos, J.; García-Ruíz, F.; Gil, E. Assessment of Vineyard Canopy Characteristics from Vigour Maps Obtained Using UAV and Satellite Imagery. Sensors 2021, 21, 2363. [Google Scholar] [CrossRef]
- Chaves, E.D.; Picoli, M.C.A.; Sanches, I.D. Recent Applications of Landsat 8/OLI and Sentinel-2/MSI for Land Use and Land Cover Mapping: A Systematic Review. Remote Sens. 2020, 12, 3062. [Google Scholar] [CrossRef]
- Segarra, J.; Buchaillot, M.L.; Araus, J.L.; Kefauver, S.C. Remote Sensing for Precision Agriculture: Sentinel-2 Improved Features and Applications. Agronomy 2020, 10, 641. [Google Scholar] [CrossRef]
Figure 1.
Phases of review method.

Figure 2.
Relational Database structure.

Figure 3.
Number of publications in each scale (Vineyard and Regional).

Figure 4.
Spatial distribution of publications (study area).

Figure 5.
NDVI map from different resolution imagery (UAV, Worldview-2, Sentinel-2), source: Unpublished research results from project code: T1EDK-04202 (under the call RESEARCH–CREATE–INNOVATE), GIS Research Unit, Laboratory of Soils and Agricultural Chemistry, Department of Natural Resources and Agricultural Engineering, Agricultural University of Athens.

Figure 6.
Usage of each platform per year, grouped by resolution (ultra-high, 1–20 cm; high, 0.5–5 m; medium, 10–30 m; low >100 m).
Figure 6.
Usage of each platform per year, grouped by resolution (ultra-high, 1–20 cm; high, 0.5–5 m; medium, 10–30 m; low >100 m).

Figure 7.
Percentage of sensors usage in different scales.

Figure 8.
The number of vegetation indices applied per paper.

Figure 9.
Vegetation indices usage with 3 or more references represented with proportional area.


Table 1.
Count of platforms used in publications.
| Platform | Count |
|---|---|
| UAV | 45 |
| Aircraft | 27 |
| Sentinel 2 | 19 |
| Rapideye | 10 |
| Landsat 8 | 7 |
| MODIS | 6 |
| Quickbird | 6 |
| Landsat 7 | 5 |
| Landsat 5 | 4 |
| Worldview 2 | 4 |
| Pleiades | 2 |
| Planet | 2 |
| Sentinel 3 OTCI | 1 |
| MSG1 | 2 |
| SEVIRI | 1 |
| SPOT 5 | 1 |
| SPOT-Vegetation | 1 |
| Deimos 1 | 1 |
| ASTER | 1 |
Table 2.
Usage of vegetation indices in each category.
| VIs Categories | Count |
|---|---|
| Chlorophyll | 97 |
| Pigment | 101 |
| Biophysical parameters | 150 |
| Biomass/Vegetation dens | 216 |
| water content | 9 |
Table 3.
ID of Vegetation indices cross-table of categories and spectral bands (B = blue, G = green, R = red, RE = red-edge, NIR = near infrared, SWIR = short wave infrared).
Table 3.
ID of Vegetation indices cross-table of categories and spectral bands (B = blue, G = green, R = red, RE = red-edge, NIR = near infrared, SWIR = short wave infrared).
| Pigment | Chlorophyll | Biomass/Vegetation Density | Biophysical Parameters | Water Content | |
|---|---|---|---|---|---|
| B, G | 18, 49, 77 | ||||
| B, G, R | 16, 17,19, 21, 22, 34, 37, 78, 79, 80, 81 | 34 | 34 | ||
| B, R | 12, 15, 50, 88, 89 | 15, 88, 89 | |||
| B, R, NIR | 54 | 69, 90, 91 | |||
| B, RE | 51, 53 | 51, 95 | |||
| B, NIR | 84 | ||||
| G, R | 13, 14, 20, 35, 36 | ||||
| G, R, RE | 47, 48, 92, 93 | ||||
| G, R, NIR | 33 | 45, 46, 61, 62 | 33 | 33, 45, 46 | |
| G, RE | 38, 57, 96 | 57, 96 | |||
| G, NIR | 86, 94 | 26, 82 | 86 | 26, 29, 30 | |
| R, RE | 65, 67, 97 | 59, 65, 67, 76, 97 | |||
| R, NIR | 1, 2, 3, 4, 5, 6, 7, 8, 9, 10, 11, 25, 27, 28, 31, 32, 75 | 1, 9 | |||
| RE, NIR | 40, 60, 83 | 60 | |||
| NIR, SWIR | 70, 72, 73, 74 |
Table 4.
Vegetation indices table (in hyperspectral VI’s the nominal reference has been replaced by arithmetic in nanometers).
Table 4.
Vegetation indices table (in hyperspectral VI’s the nominal reference has been replaced by arithmetic in nanometers).
| ID | Vegetation Index | Equation | Reference |
|---|---|---|---|
| 1 | NDVI | [4,5,6,7,9,10,18,19,22,23,24,25,26,27,30,31,32,33,34,37,38,42,43,44,45,46,47,48,49,50,51,52,53,54,55,56,57,58,59,60,61,62,63,64,65,66,67,68,69,70,71,72,73,74,75,76,77,78,79,80,81,82,83,84,85,86,87,88,89,90,91,92,93,94,95,96,97,98,99,100,101,102,103,104,105,106,107,108,109,110,111,112,113,114,115] | |
| 2 | PVI | [43] | |
| 3 | SAVI | [25,27,30,37,43,54,83,84,108] | |
| 4 | MSAVI | [5,6,24,26,37,38,43,60,69,110] | |
| 5 | SR | [5,6,26,30,33,37,39,43,60,66,116] | |
| 6 | DVI | [6,27,35,36,43] | |
| 7 | RDVI | [5,7,24,25,26,37,38,43,60,108,110] | |
| 8 | NLI | [26,43] | |
| 9 | MSR | [5,7,24,25,26,37,38,43,60,108,110] | |
| 10 | GEMI | [43] | |
| 11 | MNLI | [43] | |
| 12 | R/B index | [26] | |
| 13 | R/G index | [6,26,27,28,29,35,36,38] | |
| 14 | NGRDI | [26,27,28,29,117,118] | |
| 15 | NPCI | [26,38] | |
| 16 | VARI | [23,27,28,117] | |
| 17 | Woebbecke index | [26,119] | |
| 18 | ExB | [26,117] | |
| 19 | ExG | [23,26,28,29,30,117,119] | |
| 20 | ExR | [26,29,117] | |
| 21 | ExGR | [26,29,117] | |
| 22 | CIVE | [26,28,117] | |
| 23 | VEG | [26,28] | |
| 24 | Clgreen | [25,26,64] | |
| 25 | VIF | [26] | |
| 26 | GNDVI | [6,7,22,23,24,25,26,27,36,54,59,81,83,84,101,108] | |
| 27 | RVI | [26,118] | |
| 28 | MRVI | [26] | |
| 29 | NIR–G | [26] | |
| 30 | NIR/G | [24,26,36,59] | |
| 31 | OSAVI | [5,6,7,22,26,37,38,110,120] | |
| 32 | TVI1 | [5,26] | |
| 33 | TVI2 | [23,38] | |
| 34 | GLI | [28,119] | |
| 35 | MGRVI | [28,119] | |
| 36 | GR | [6,24,28,37,38,110] | |
| 37 | GCC | [28,53,121] | |
| 38 | ARI | [27,36,37] | |
| 39 | MARI | [27,36] | |
| 40 | CLREDEDGE | [7,23,25,27,36] | |
| 41 | GRVI | [22,29,36] | |
| 42 | PRI | [24,33,38,110] | |
| 43 | RE | [5,33,38,120] | |
| 44 | WI | [33] | |
| 45 | MTVI2 | [5,38] | |
| 46 | MTVI1 | [5,7,24,37,38,108,110] | |
| 47 | MCARI | [7,22,24,25,35,38,110] | |
| 48 | TCARI | [7,22,25,35,38,110,120] | |
| 49 | BGI 1.2 | [22,38,119] | |
| 50 | BRI 1.2.3 | [22,35,38,119] | |
| 51 | CTR1 | [35,38] | |
| 52 | CTR2 | [38] | |
| 53 | LIC | [38] | |
| 54 | SIPI | [23,35,38] | |
| 55 | VOG1 | [38] | |
| 56 | VOG2 | [38,120] | |
| 57 | GM1 | [5,38] | |
| 58 | GM2 | [5,38] | |
| 59 | CUR | [38] | |
| 60 | NDRE | [6,7,22,23,36,84] | |
| 61 | MCARI1 | [5,22,24,35] | |
| 62 | MCARI2 | [5,22,24,35] | |
| 63 | PI1 | [22] | |
| 64 | PI2 | [22] | |
| 65 | PI3 | [22] | |
| 66 | PI4 | [22] | |
| 67 | PI5 | [22] | |
| 68 | TCARI/OSAVI | [24,37,110,120] | |
| 69 | EVI | [25,32,54,64,103,108,122,123] | |
| 70 | NDWI | [32,34] | |
| 71 | SWIRR | [32] | |
| 72 | SIWSI | [23,32] | |
| 73 | MSI | [32] | |
| 74 | GVMI | [32,103] | |
| 75 | EVI2 | [124] | |
| 76 | S2TCI | [125] | |
| 77 | NGBDI | [119] | |
| 78 | RGBVI | [119] | |
| 79 | TGI | [119] | |
| 80 | 2GRGi | [119,126] | |
| 81 | G% | [30,119,126] | |
| 82 | Gitelson cl1 | [35] | |
| 83 | Gitelson cl2 | [35] | |
| 84 | Blackburn Car1 | [35] | |
| 85 | Blackburn Car2 | [35] | |
| 86 | Gitelson Car1 | [35] | |
| 87 | Gitelson Car2 | [35] | |
| 88 | CTR1 | [35,38] | |
| 89 | NPCI2 | [35] | |
| 90 | ARVI | [30] | |
| 91 | EVIr | [103] | |
| 92 | CARI | [25,108] | |
| 93 | CARI2 | [25] | |
| 94 | ACI | [36] | |
| 95 | NPCI3 | ) | [36] |
| 96 | REGI | [36] | |
| 97 | RERI | [36] |
Table 5.
Methodologies applied in publications.
| Methodologies | Count of Papers |
|---|---|
| Row extraction | 34 |
| Estimation/prediction | 40 |
| Machine learning | 12 |
| Hyperspectral | 5 |
| Multispectral | 108 |
Table 6.
Categories of vegetation indices applications.
| Applications Categories | Count of Papers |
|---|---|
| Terroirs | 3 |
| Management Zones | 29 |
| Multitemporal Monitoring | 68 |
Table 7.
Vegetation indices applications on vine.
| VIs Applications | Count of Papers |
|---|---|
| Water stress/Irrigation | 36 |
| Yield | 10 |
| Vine Disease | 10 |
Publisher’s Note: MDPI stays neutral with regard to jurisdictional claims in published maps and institutional affiliations. |
© 2021 by the authors. Licensee MDPI, Basel, Switzerland. This article is an open access article distributed under the terms and conditions of the Creative Commons Attribution (CC BY) license (https://creativecommons.org/licenses/by/4.0/).
Share and Cite
MDPI and ACS Style
Giovos, R.; Tassopoulos, D.; Kalivas, D.; Lougkos, N.; Priovolou, A. Remote Sensing Vegetation Indices in Viticulture: A Critical Review. Agriculture 2021, 11, 457. https://0-doi-org.brum.beds.ac.uk/10.3390/agriculture11050457
AMA Style
Giovos R, Tassopoulos D, Kalivas D, Lougkos N, Priovolou A. Remote Sensing Vegetation Indices in Viticulture: A Critical Review. Agriculture. 2021; 11(5):457. https://0-doi-org.brum.beds.ac.uk/10.3390/agriculture11050457
Chicago/Turabian StyleGiovos, Rigas, Dimitrios Tassopoulos, Dionissios Kalivas, Nestor Lougkos, and Anastasia Priovolou. 2021. "Remote Sensing Vegetation Indices in Viticulture: A Critical Review" Agriculture 11, no. 5: 457. https://0-doi-org.brum.beds.ac.uk/10.3390/agriculture11050457
Note that from the first issue of 2016, this journal uses article numbers instead of page numbers. See further details here.