Article

Comprehensive Precipitable Water Vapor Retrieval and Application Platform Based on Various Water Vapor Detection Techniques

1
College of Geomatics, Xi’an University of Science and Technology, Xi’an 710054, China
2
School of Aerospace Medicine, Key Laboratory of Aerospace Medicine of Ministry of Education, Air Force Medical University, Xi’an 710032, China
3
School of Geodesy and Geomatics, Wuhan University, Wuhan 430079, China
4
Powerchina Northwest Engineering Corporation Limited, Xi’an 710000, China
*
Author to whom correspondence should be addressed.
Remote Sens. 2022, 14(10), 2507; https://0-doi-org.brum.beds.ac.uk/10.3390/rs14102507
Submission received: 22 April 2022 / Revised: 13 May 2022 / Accepted: 18 May 2022 / Published: 23 May 2022

Abstract

:
Atmospheric water vapor is one of the important parameters for weather and climate studies. Generally, atmospheric water vapor can be monitored by some techniques, such as the Global Navigation Satellite System (GNSS), radiosonde (RS), remote sensing and numerical weather forecast (NWF). However, the comprehensive retrieval and application of precipitable water vapor (PWV) using multi techniques has been hardly performed before, which becomes the focus of this study. A comprehensive PWV retrieval and application platform (CPRAP) is first established by combing the ground-based (GNSS), space-based (Fengyun-3A, Sentinel-3A) and reanalysis-based (the fifth-generation reanalysis dataset of the European Centre for Medium-Range Weather Forecasting, ERA5) techniques. Additionally, its applications are then extended to drought and rainfall monitoring using the CPRAP-derived PWV. The statistical result shows that PWV derived from ground-based GNSS has high accuracy in China, with the root mean square (RMS), Bias and mean absolute error (MAE) of 2.15, 0.05 and 1.65 mm, respectively, when the RS-derived PWV is regarded as the reference. In addition, the accuracy of PWV derived from the space-based (FY-3A and Sentinel-3A) techniques technique is also validated and the RMS, Bias and MAE of a Medium Resolution Spectral Imager (MERSI) onboard Fengyun-3A (FY-3A) and an Ocean and Land Color Instrument (OLCI) onboard Sentinel-3A are 4.46/0.56/3.61 mm and 2.95/0.01/1.37 mm, respectively. Then, the performance of ERA5-derived PWV is evaluated based on GNSS-derived and RS-derived PWV. The result also shows good accuracy of ERA5-provided PWV with the averaged RMS, Bias and MAE of 1.86/0.11/1.48 mm and 0.90/−0.05/1.51 mm, respectively. Finally, the PWV data derived from the established CPRAP are further used for drought and rainfall monitoring. The applied results reveal that the calculated the standardized precipitation evapotranspiration index (SPEI) using the CPRAP-derived PWV can monitor the drought and the correlation coefficient ranges from 0.83 to 0.9 when compared with the SPEI. Furthermore, in this paper correlation analysis between PWV derived from the CPRAP and rainfall, and its potential for rainfall monitoring was also validated. Such results verify the significance of the established CPRAP for weather and climate studies.

Graphical Abstract

1. Introduction

Atmospheric water vapor is a key parameter for the Earth’s climate system, which affects the hydrological cycle, weather forecasting and climate change [1,2]. Therefore, understanding the spatio-temporal variations of atmospheric water vapor plays a vital role in analyzing regional and global climate change and short-term rainfall [3]. Precipitable water vapor (PWV) is the indictor used to reflect the variation of atmospheric water vapor content, which is defined as the water vapor content per unit cross-sectional area from the surface to the top of the atmosphere [4].
Several conventional techniques have been used to retrieve PWV, which includes radiosonde (RS), water vapor radiometer (WVR), and numerical weather prediction (NWP). However, these techniques have their disadvantages and limitations, and cannot simultaneously obtain PWV with high precision and high spatio-temporal resolutions. For example, RS could provide PWV products with 30 m vertical resolution, but its spatio-temporal resolutions are low because the distance among stations is 200–300 km and the RS balloon are launched twice or four times a day; thus, the PWV derived from RS is usually used for data calibration [5]. WVR can provide PWV products with a high temporal resolution, but it is too expensive to apply widely and vulnerable to cloud and rainfall [6]. Remote sensing techniques could obtain PWV with high spatial resolution; however, temporal resolution and accuracy are relatively poor for polar-orbiting satellites [7]. Furthermore, the performance of satellites is also affected by bad weather in deriving PWV [8,9]. Although PWV can also be obtained based on global model NWP with a temporal resolution of one hour, the spatial resolution and accuracy are relatively low [10,11].
Apart from the above techniques, the emerging techniques, Global Navigation Satellite System (GNSS), the fifth-generation reanalysis dataset of the European Centre for Medium-Range Weather Forecasting (ECMWF-ERA5) and FY-3A and Sentinel-3A satellite have more potential for deriving PWV products. Since the conception of GNSS meteorology is first proposed and the PWV is calculated by Bevis et al. [12], the GNSS-derived PWV has been widely validated and used globally. It has the advantages of high-precision, real-time, low-cost and all-weather conditions [10]. Zhang et al. [13] generated a six-hourly PWV dataset over the period from 1999 to 2015 at more than 260 GNSS stations in China. Zhao et al. [14] updated this dataset and generated the hourly PWV dataset over the period of 2011 to 2017 at 249 stations in China, which improved the temporal resolution compared with that from Zhang et al. [13]. To obtain the PWV value, the zenith total delay (ZTD) and the zenith hydrostatic delay (ZHD) should be calculated, and then the zenith wet delay (ZWD). Therefore, the PWV can be calculated by multiplying the conversion factor by the ZWD, which plays a very important role in the progress of retrieving PWV from the ZWD of the GNSS [15]. Current researchers often use empirical models to obtain them quickly [16]. ERA5 is the latest generation of reanalysis data released by ECMWF at 14 June 2018, which enhances the horizontal spatio-temporal resolutions when compared with its previous version (ERA-Interim) and adopts the latest integrated forecast system (IFS) to reprocess a large number of assimilation datasets [17]. ERA5-provided PWV values were also validated at 268 GNSS stations worldwide over the period of 2016 to 2018 and the statistical result shows that the PWV derived from ERA5 agrees well with that from the GNSS, whereas the root mean square (RMS) and Bias are 1.84 and 0.67 mm, respectively [17]. FengYun-3A (FY-3A) and Sentinel-3A, have high spatial-temporal resolution in deriving PWV. The Medium Resolution Spectral Imager (MERSI) and Ocean and Land Color Instrument (OLCI) onboard the FY-3A and Sentinel-3A, respectively, contain some channels covering the spectral range from visible light to long-wave infrared [18]. The near-infrared channels can be used to derive PWV [19]. Gong et al. [20] found that the RMS and Bias of PWV derived from FY-3A/MERSI in China are 2.2–17 mm and 0.8–12.7 mm, respectively. Xu and Liu [21] showed that the PWV derived from Sentinel-3A/OLCI has a good agreement with that from the GNSS. In addition, the RMS of PWV difference between Sentinel-3A and GNSS are 3.03 mm under clear weather conditions.
Based on a variety of current PWV-derived technologies, the PWV products with high spatio-temporal resolutions cannot be obtained using a single technique while guaranteeing high accuracy. Therefore, this study establishes a comprehensive PWV retrieval and application platform (CPRAP) to solve the above issues by combining the ground-based (GNSS, RS), space-based (FY-3A, Sentinel-3A) and reanalysis-based (ERA5) techniques. Accordingly, the accuracy of PWV derived from some techniques is firstly validated and statistical results show that the proposed CPRAP has good performance in deriving PWV. Then, CPRAP-derived PWV is applied for drought and rainfall monitoring, which also indicates the potential of the proposed CPRAP for corresponding weather and climate studies.

2. Data and Theory Description

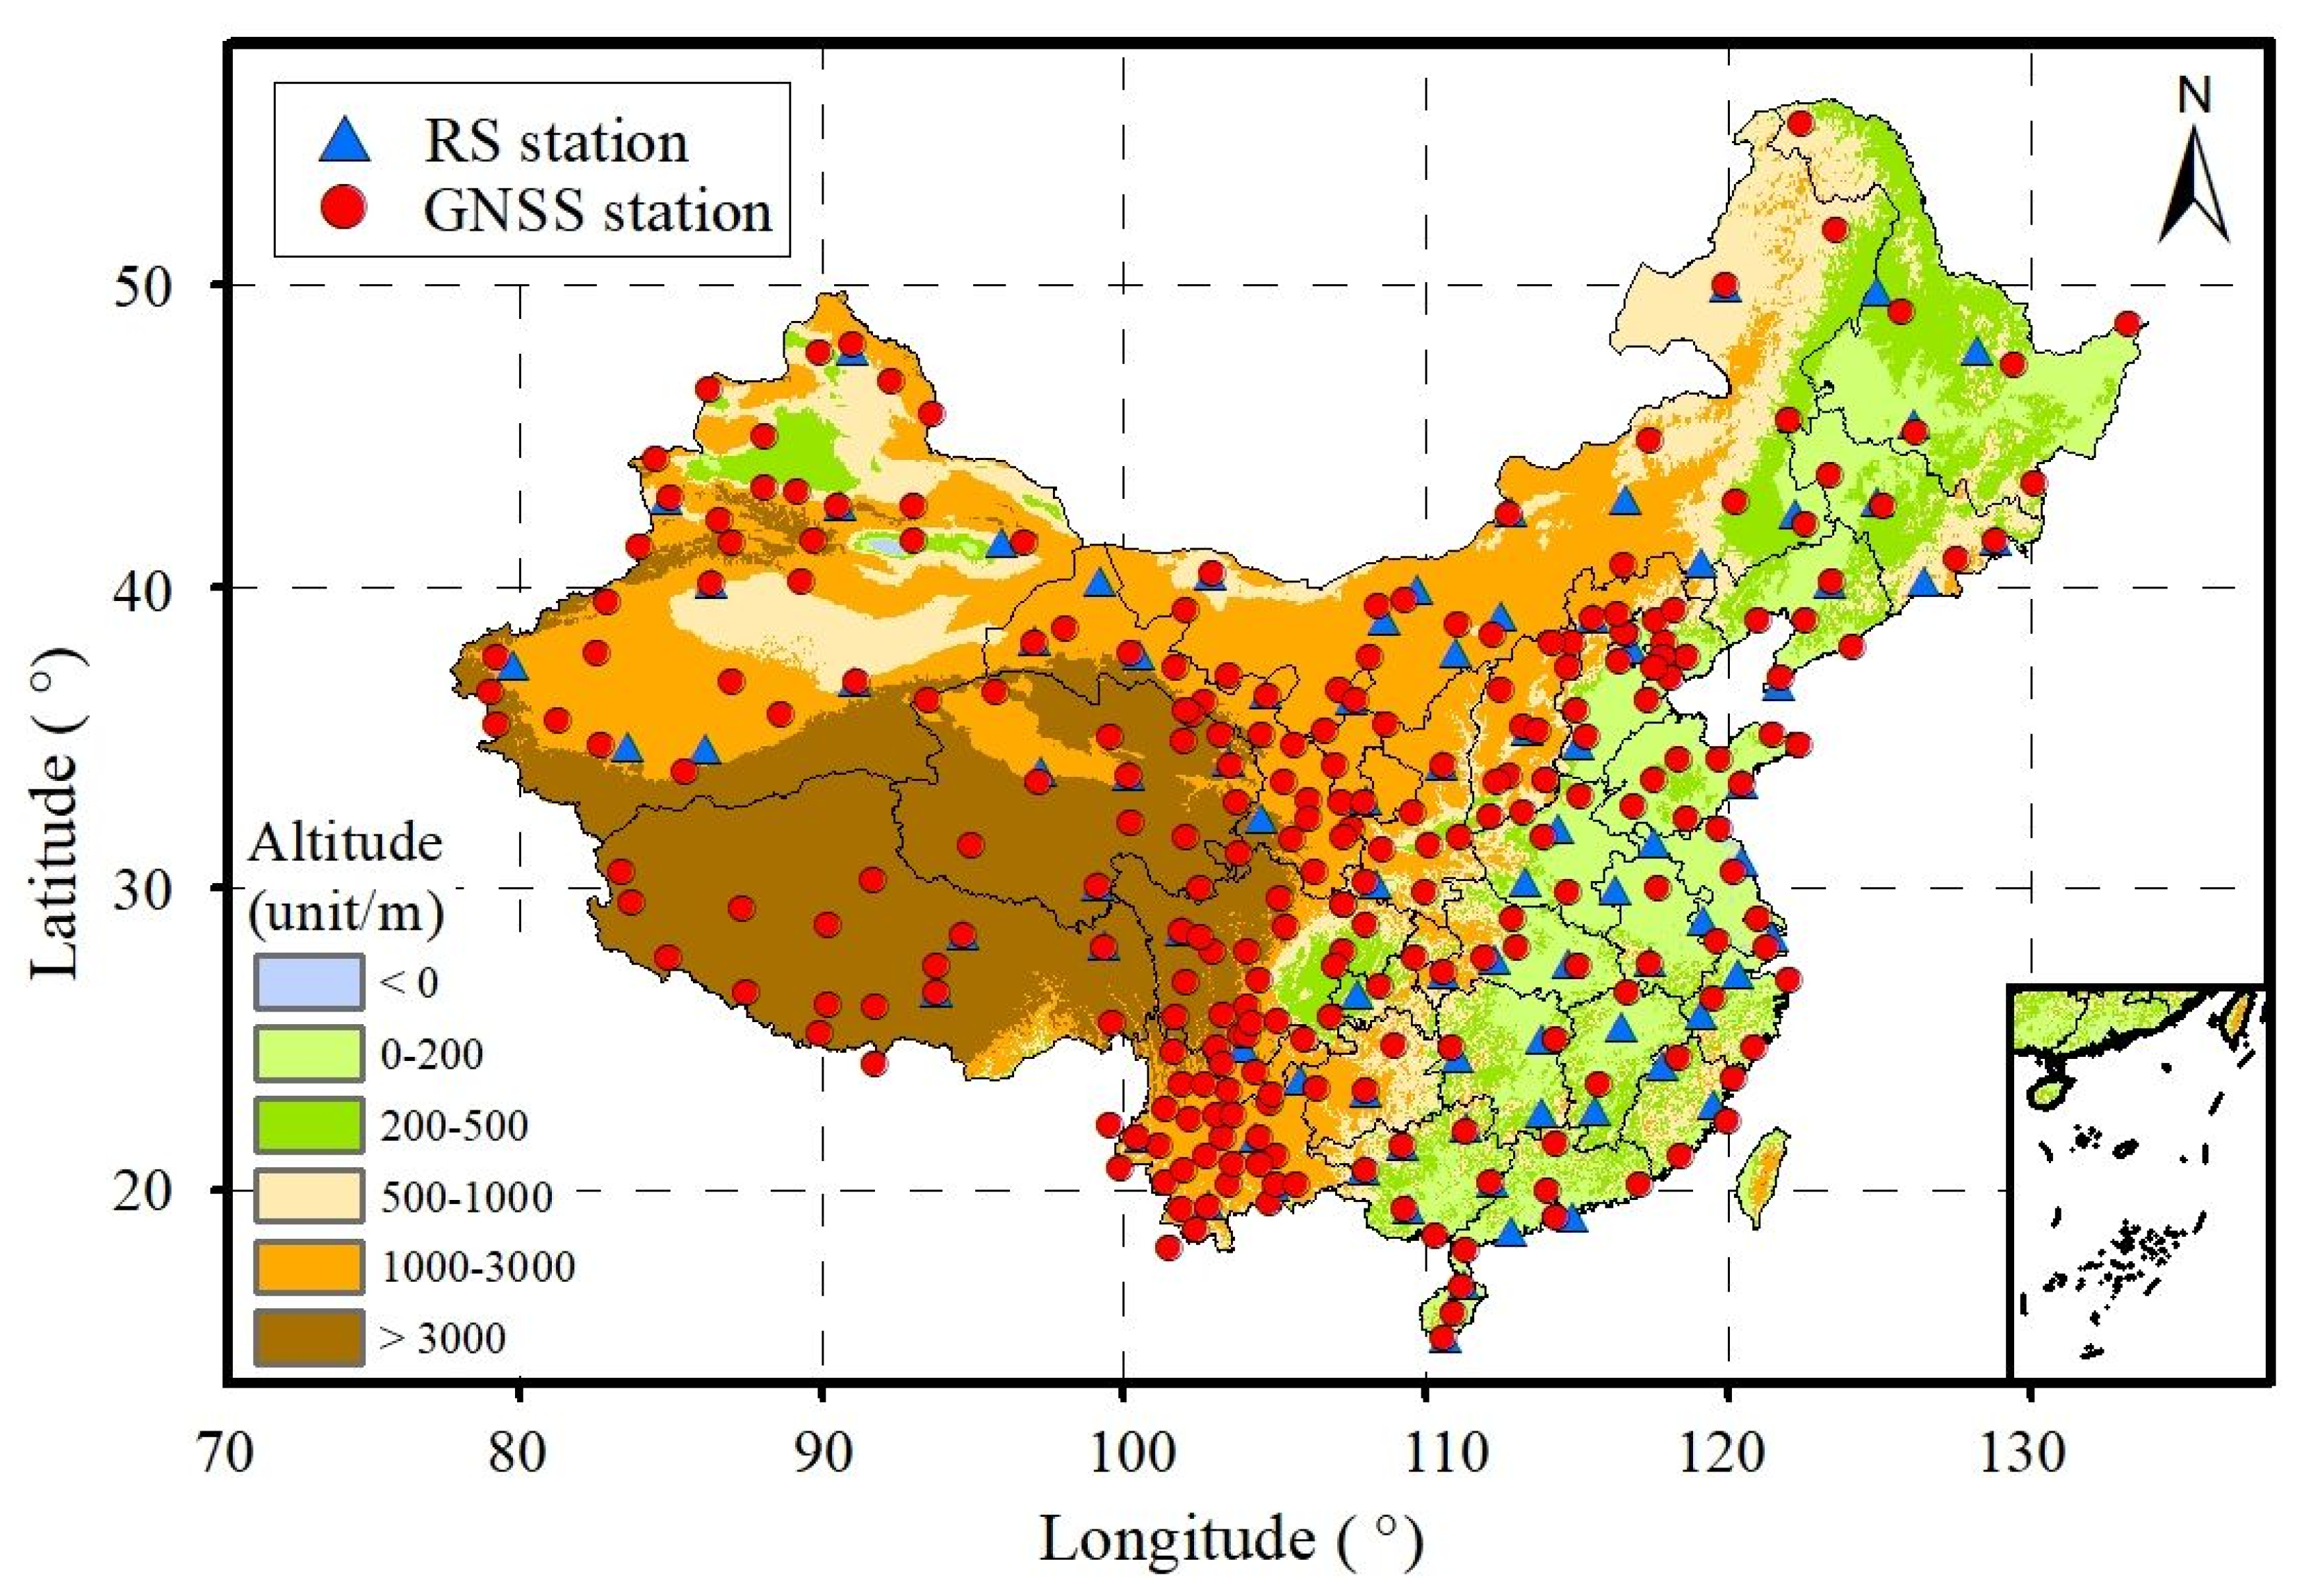
2.1. The CPRAP Usage Data Description

In this paper, the CPRAP was established by combining the ground-based (GNSS, RS), space-based (FY-3A, Sentinel-3A) and reanalysis-based (ERA5) techniques to guarantee high accuracy and spatio-temporal resolution in deriving PWV simultaneously. The performance of the established CPRAP is first validated and the applicability was then performed in drought and rainfall monitoring. Figure 1 shows the flowchart of the established CPRAP and its applications.
In this paper, five kinds of datasets, which are GNSS, RS, ERA5, FY-3A and Sentinel-3A, were selected to perform the experiment. Table 1 provides the specific information of the data used for the experiment.

2.1.1. GNSS and RS PWV Data

GNSS observations are derived from the Crustal Movement Observation Network of China (CMONOC), and the CMONOC was built starting 1997 and operated in 2001. CMONOC consists of more than 260 continuous operated GNSS stations and 2000 discontinuous regional observation stations [22]. In this paper, the corresponding observations of 260 continuous GNSS stations were selected over the period of 2012 to 2020 in China. GNSS observations are processed by the precise point positioning (PPP) technique and the specific processing procedures can be referred to our previous work [23]. Finally, the hourly ZTD was estimated at those selected stations. Due to lack of meteorological sensors at GNSS stations, use the temperature (T) and pressure (P) data provided by ERA5 the vertical interpolation of T and P data of ERA5 performed before bilinear interpolation [24].
Integrated Global Radiosonde Archive (IGRA) includes more than 2000 stations all over the world [20] and the RS balloon are launched twice (UTC 00:00 and 12:00) or four times (UTC 00:00, 06:00, 12:00 and 18:00) a day [25]. The corresponding meteorological parameters, such as T, P and relative humidity, can be observed at different heights from the surface to the height of approximately 30 km [26]. In this study, the data of 87 RS stations were selected over the period of 2012 to 2020 in China. Figure 2 gives the geographical distributions of the selected GNSS and RS stations in China.

2.1.2. ERA5 PWV Data

ECMWF was formally established in 1975 and ERA5 is the fifth-generation reanalysis dataset of ECMWF. Compared with the fourth-generation reanalysis dataset, ERA5 has a higher temporal resolution with a value of 1 h. Two- and three-dimensional specific humidity, T, P and other 16 types of hierarchical meteorological data information are provided by ERA5. The advanced data assimilation and model systems were used to integrate large amounts of historical observation data into global estimates [27]. In this study, the corresponding meteorological data provided by ERA5 was selected over the period of 2012 to 2020.

2.1.3. FY-3A/MERSI and Sentinel-3A/OLCI PWV Data

The FY series of satellites has formed an all-weather, three-dimensional and continuous satellite observation network of the Earth’s atmosphere, ocean and surface environment in response to climate change. Its designed purpose is used for disaster monitoring research. The MERSI onboard FY-3A can provide 5-min, 10-day and monthly PWV products with spatial resolutions of 1 km, 5 km and 5 km, respectively [28,29]. The statistical result shows that the accuracy of MERSI-derived water vapor products is relatively lower than that derived from GNSS, RS or ERA5 [30]. In this study, the PWV data derived from FY-3A was selected over the period of 2012 to 2013 in China.
The Copernicus project was launched in 2003 to provide global satellite remote sensing data services mainly through the coordinated management and integration of existing and future launches of satellite data and field observation data in European and non-European countries [31]. One of the main objectives of Sentinel-3A mission was to measure the Earth’s weather and climate on land and sea [32]. Three levels of processed products, including Level 0 (L0), Level 1 (L1) and Level 2 (L2), has been provided by OLCI onboard Sentinle-3A. In addition, the L2 PWV product provided by OLCI has a spatial resolution of 300 m. However, the validation of this product was merely performed before. Therefore, the data of Sentinel-3A L2 were selected and validated in this paper over the period from 1 March 2019 to 4 March 2020 in China.

2.2. Theory and Method of Retrieving PWV

2.2.1. PWV Derived from GNSS

GNSS signals are refracted and bent when passing through the troposphere [33]. Given that this delay is mainly concentrated in the troposphere, this delay is called tropospheric delay and its delay in the zenith direction is called ZTD. ZTD consists of ZHD and ZWD. ZTD can be estimated by the PPP technique or relative positioning technique using non-differenced or double-differenced GNSS observations, respectively [34]. The retrieval of PWV can be divided into three main steps.
(1) ZHD is mainly affected by the surface pressure and can be precisely calculated by the Saastamoinen model [35]:
ZHD = 0.002277 × P 1 0.00266 × cos ( 2 φ ) 0.00028 × H
where P is the surface pressure at GNSS station (unit: hPa), φ is the latitude of the GNSS station (unit: rad) and H is the ellipsoid height of GNSS stations (unit: km).
(2) After the ZHD is obtained, ZWD can be calculated by subtracting ZHD from ZTD.
Z W D = Z T D Z H D
(3) Thus, the ZWD can be further converted to the PWV by multiplying the conversion factor [12]:
P W V = Π × Z W D = 10 6 ( K 2 + K 3 / T m ) × R v × ρ × Z W D
where ρ is the liquid water density (1000 kg/m3); R v denotes the specific gas constant of water vapor (461.51 J × K−1 × kg−1); K 2 and K 3 are atmospheric refractivity constants with values of 16.48 K/hPa and 3.776×10⁵ K2/hPa, respectively. The term T m was the atmospheric-weighted mean temperature. The T m used in this paper was calculated based on the improved T m model (IGPT2w) and the PWV error caused by the error of T m is approximately 0.29 mm [36,37].
Given the missing meteorological sensors for some GNSS stations, the meteorological data cannot be obtained at those stations. Thus, the corresponding data (P and T) provided by ERA5 were used and the bilinear interpolation method was introduced to interpolate the gridded meteorological data to the GNSS station [38]. Vertical adjustment is extremely important in establishing tropospheric delay [39]. The empirical formulas for converting P and T at different heights are as follows [40]:
P h 1 = P h 2 ( 1 0.0000226 ( h 1 h 2 ) ) 5.225
Δ T / Δ h = 0.0065 ° C / m
where h was the ellipsoid height of the GNSS/RS stations (unit: m); h 1 and h 2 be unified to the same elevation systems, P h 1 and P h 2 were the pressure values of h 1 and h 2 , respectively (unit: hPa), and T is the temperature (unit: °C).

2.2.2. PWV Derived from Radiosonde

The RS data derived from IGRA includes a variety of meteorological parameters, such as P, T and specific humidity, which are widely used in various studies, including model establishment [41], atmospheric process and climate research [42]. However, the PWV value cannot be detected from the RS data directly and the corresponding calculation is required to obtain PWV. Previous study has given a specific procedure to calculate the PWV [43] and the main process can be divided into three steps as follows:
(1) According to the layered water vapor pressure and temperature provided by RS, ZWD is calculated by layered superposition. In the present study, PWV was calculated from the height layered superposition of the surface pressure to the top layer pressure of 300 hPa [43,44]:
N w = 1 n 3.73 × 10 5 × p v T 2 × d h 1000 Z W D = p 0 p N w d p
where p v is the water vapor pressure (unit: hPa); N w is the wet refraction and d h is the layer height difference (unit: m); T is the temperature (unit: k); p 0 is the surface pressure, p is the top layer pressure.
(2) According to the water vapor pressure and temperature provided by RS, T m was calculated by layered superposition [19]:
T m = 1 n p v × d h T 1 n p v × d h T 2
(3) PWV was finally retrieved by multiplying the conversion factor as presented in Equation (3).

2.2.3. PWV Derived from ERA5

ERA5 directly provides the PWV value. However, only the PWV at a fixed height and grid points can be obtained. The following three steps were performed to obtain the corresponding PWV at the height of the GNSS station.
(1) The geopotential height of the ERA5 grid point to the ellipsoid height was first converted as follows [44]:
G P H = G P / g H = R ( φ ) × Y 45 × G P H Y S ( φ ) × R ( φ ) - Y 45 × G P H
where H is the orthometric height, GP refers to geopotential, GPH refers to geopotential height, g refers to gravitational acceleration with a value of 9.80665 g/m2, Y S ( φ ) is the normal gravity value on the surface of rotating ellipsoids, represents the Earth’s effective radius at latitude, Y 45 refers to the normal gravity value of the ellipsoid at latitude 45°, R ( φ ) refers to the radius of the Earth at the latitude φ .
(2) PWV value at the grid point height provided by ERA5 should be first adjusted to the corresponding height of GNSS/RS [45]. An empirical correction formula of PWV was used to convert PWV from the height of h 1 to h 2 [16]:
PWV h 1 = PWV h 2 exp ( - ( h 1 - h 2 ) / 2000 )
where PWV h 1 and PWV h 2 are the PWV corresponding to the heights of h 1 and h 2 , respectively (unit: m). The empirical value of 2000 was referred from Yang et al. [46].
(3) The bilinear interpolation method was used to obtain PWV values of GNSS stations from corresponding data of grid points surrounding the GNSS stations [38].

2.2.4. PWV Derived from Remote Sensing Satellite
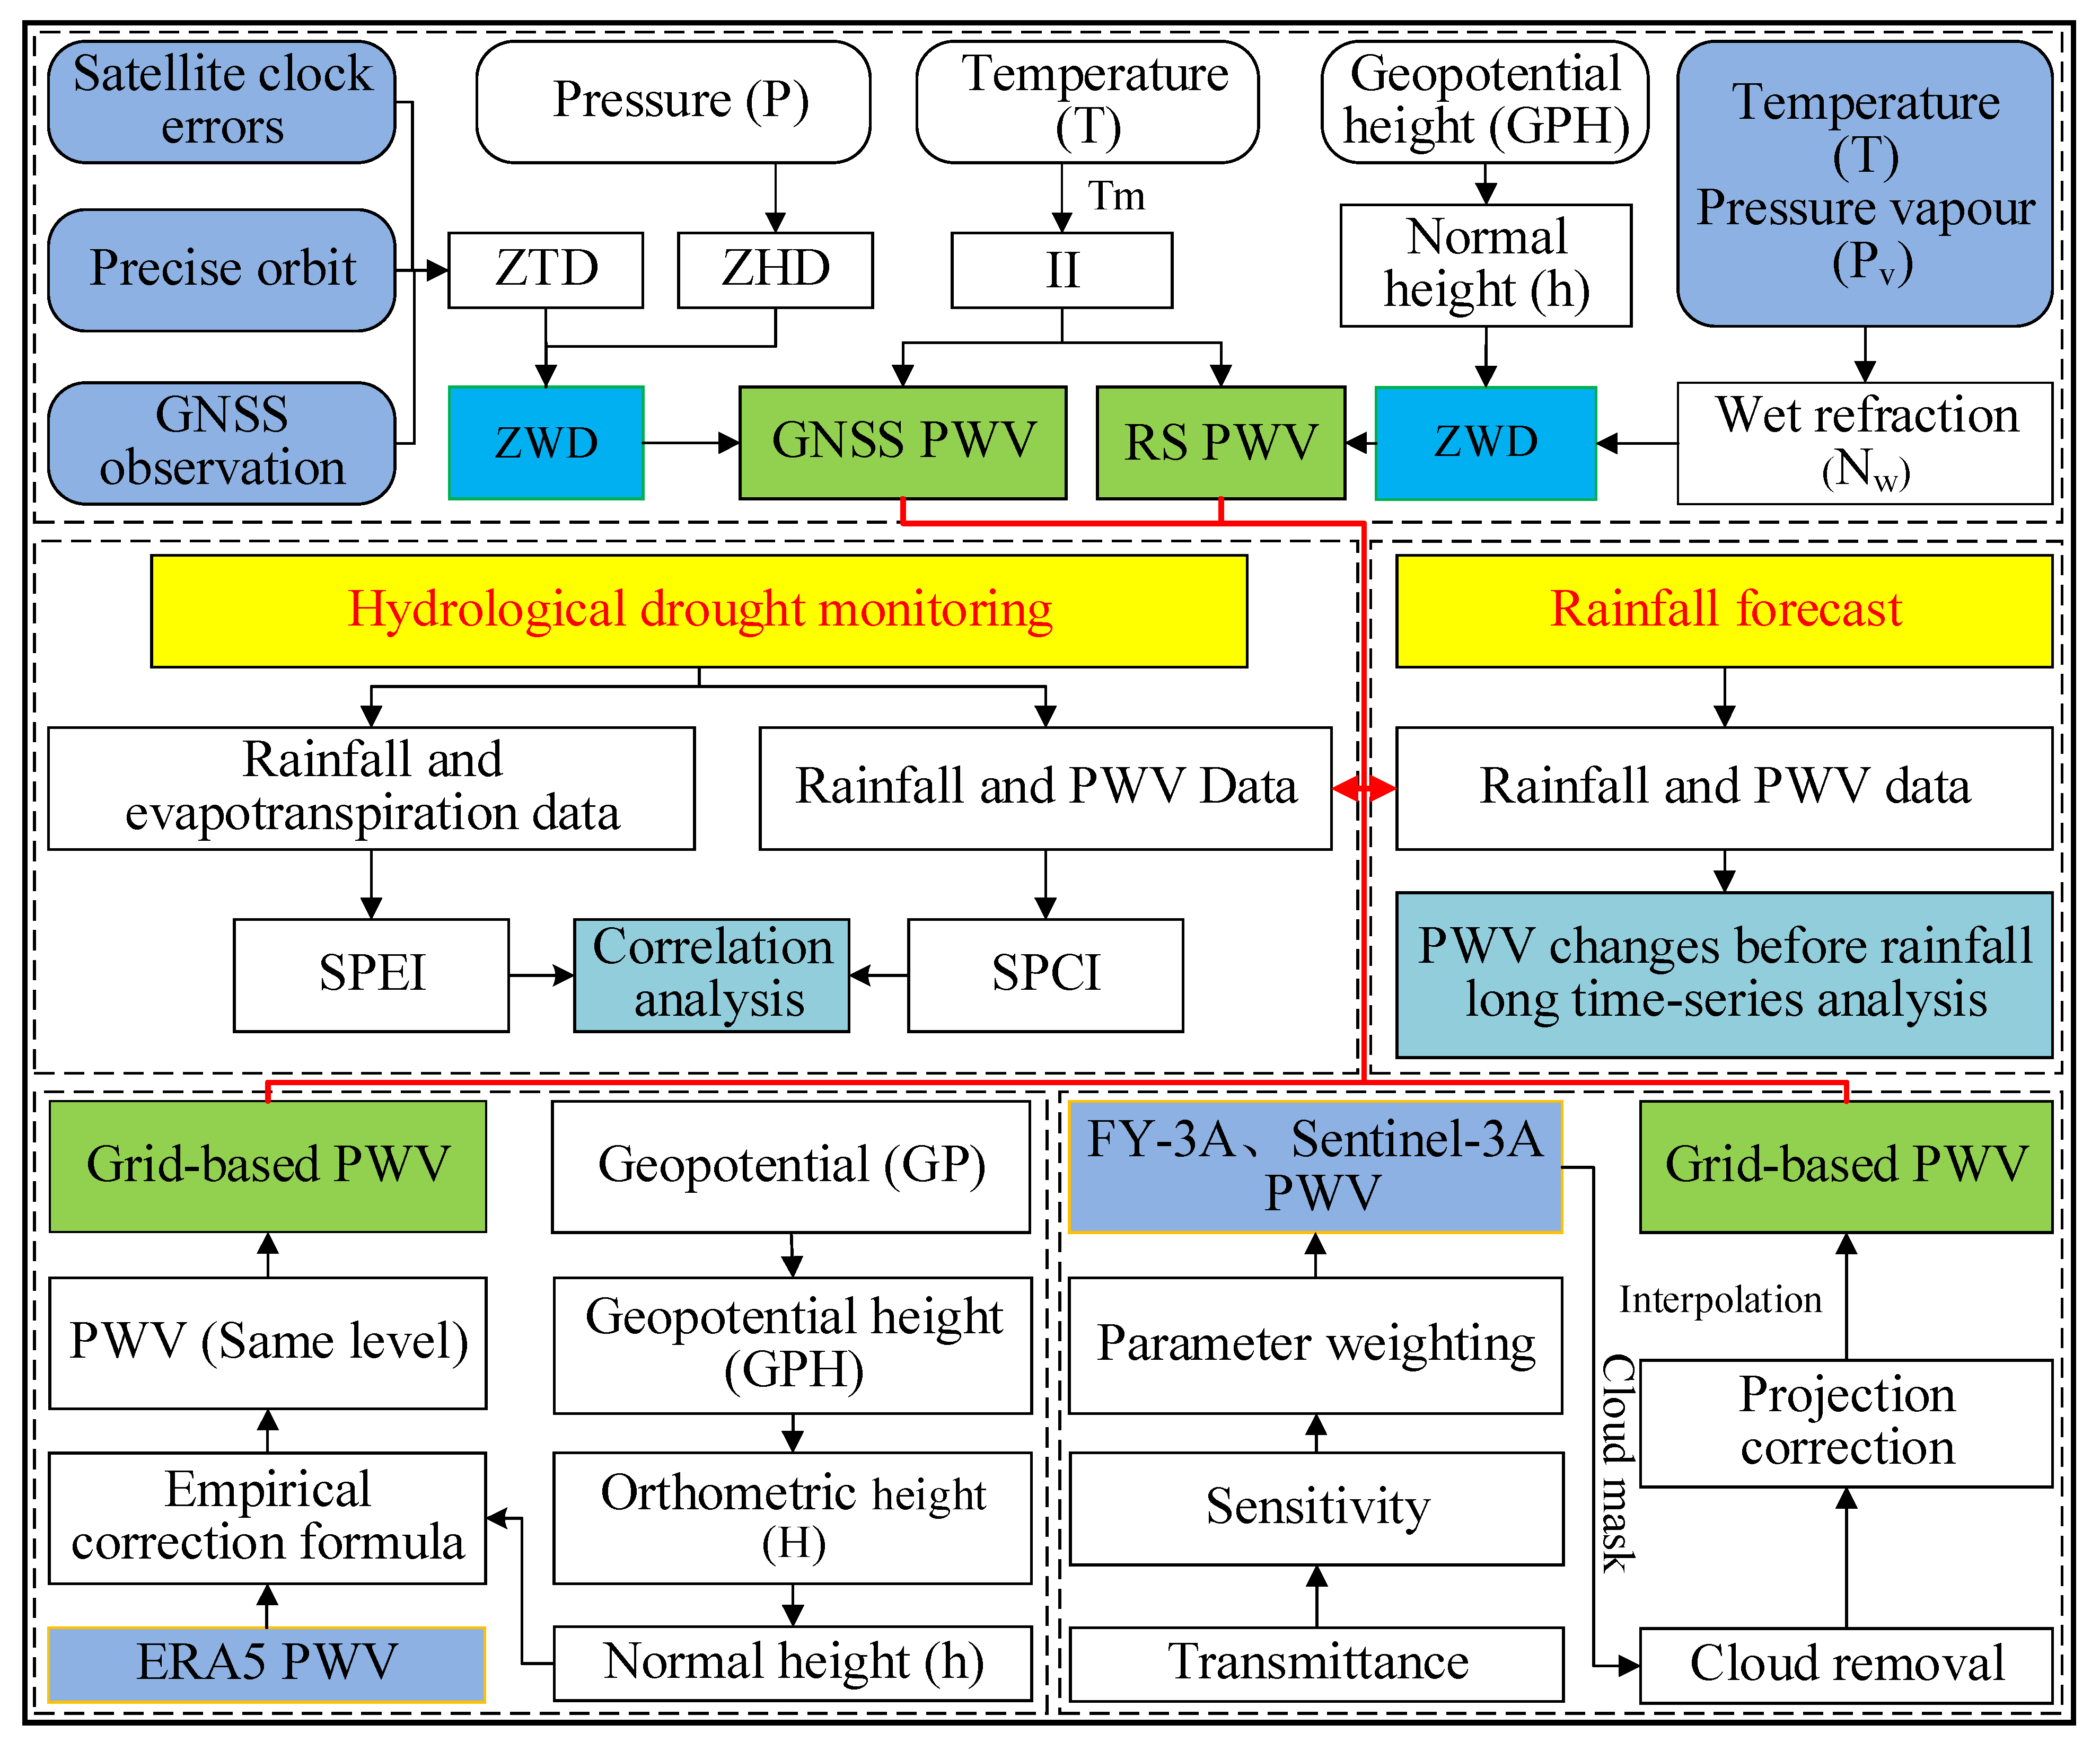
The MERSI water vapor 5 min product is generated with in three near-infrared channels centered at 0.905, 0.940 and 0.980 μm and the two window channels centered at 0.865 and 1.030 μm according to the differential absorption method. The three near-infrared channels centered have different water vapor sensitivities under the same atmospheric condition. Under a given atmospheric condition, the derived water vapor values from the three channels can be different. Thus, a mean PWV value of three channels can be calculated according to the following steps.
(1)
The weighted mean value of the three water vapor absorption channels is combined based on the sensitivity and the PWV is obtained according to the equation [47]:
P W V = f i ω i
where ω i is the PWV values derived from each water vapor absorption channel; f i is the normalized weighting parameters correspond to each band and subscription i refers to the channel.
(2)
The weighting parameter of each band is calculated based on the sensitivity of the transmission in each of the channels to the PWV.
f i = η i / η i η = | Δ τ Δ w |
where Δ τ is the transmittance variation in one unit length; Δ w is the PWV variation in one unit length. It is computed numerically from simulated curves of transmittance versus precipitable water vapor; η i is sensitivity.
In Sentinel-3A/OLCI, the retrieval algorithm mainly relies on the differential absorption algorithm to link the radiation ratio of the Sentinel-3A two NIR water vapor absorption channels [48]. According to Fischer and Bennartz [49], neural networks trained with the Matrix Operator Model (MOMO) can measure atmospheric water vapor on the land and ocean. Thus, the total calculation in this study was performed as follows [50]:
P W V = k 0 + k 1 log ( R ) + k 2 log 2 ( R )
where k 0 , k 1 and k 2 indicate the regression coefficients and R is the ratio of the radiation from channel 17 of the OLCI instrument to the radiation of channel 18. In this study, the secondary terrestrial full-resolution product derived from Sentinel-3A is selected to perform the experiment.

3. Evaluation and Application of PWV Derived from CPRAP

In this section, the PWV with the different spatio-temporal resolutions was first derived from the CPRAP and the accuracy of corresponding PWV values derived from GNSS, satellite remote sensing (FY-3A/MERSI and Sentinel-3A/OLCI) and reanalysis dataset (ERA5) was further evaluated. Finally, the CPRAP-derived PWV was applied in drought and rainfall monitoring in Yunnan and Zhejiang provinces, China, respectively. Given that the high-precision PWV can be retrieved from RS data [51], the corresponding PWV calculated by RS data was also obtained from the CPRAP and regarded as the reference to evaluate the performance of PWV derived from other techniques.

3.1. Performance of CPRAP-Derived PWV

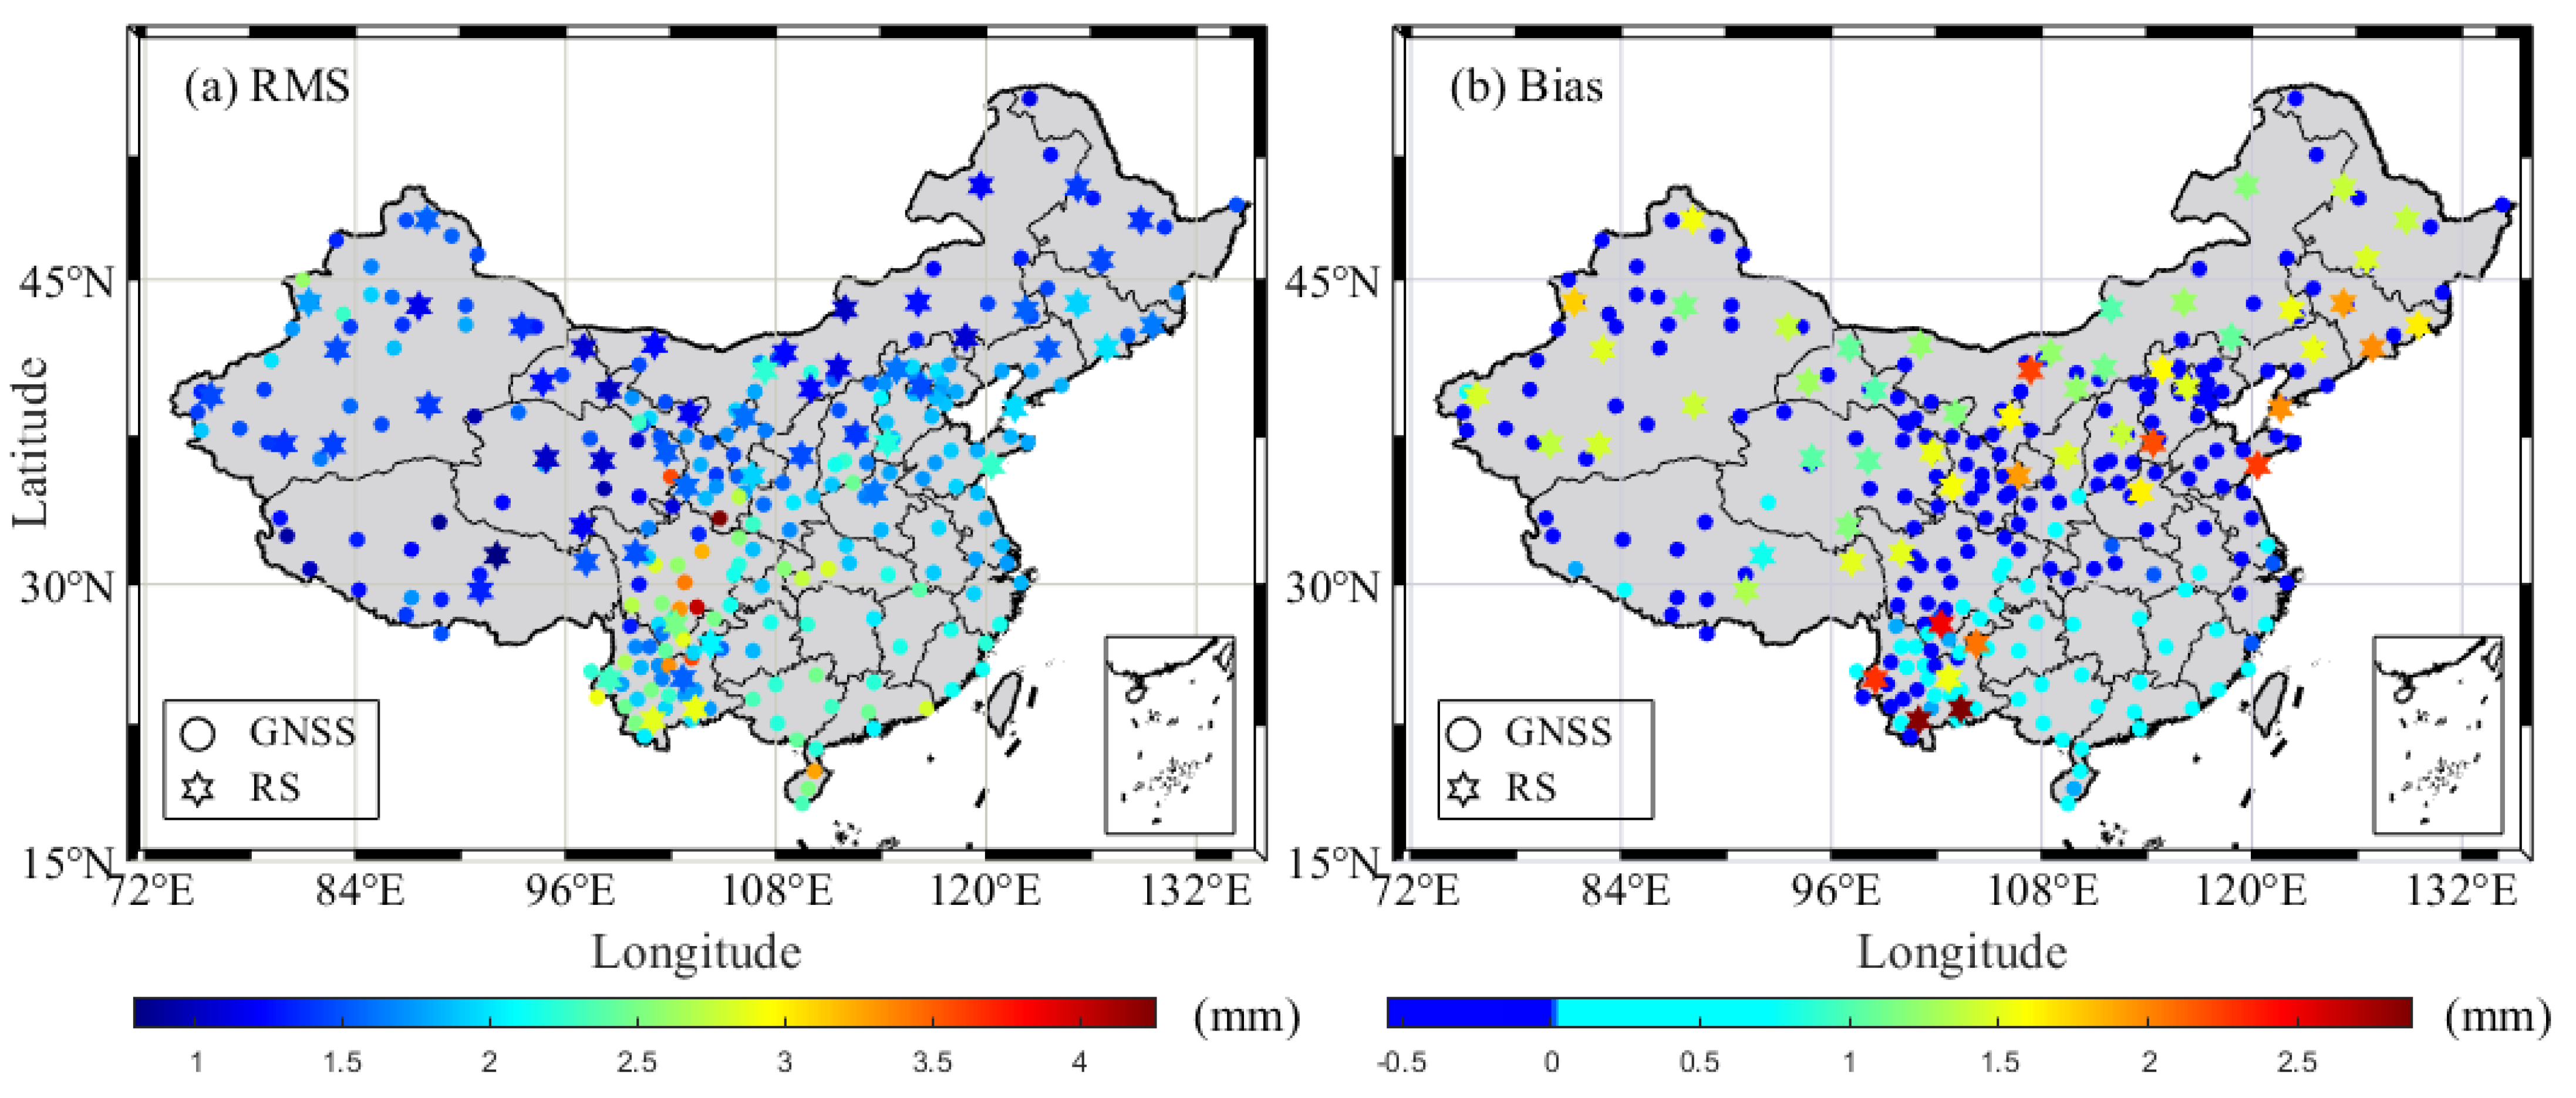
3.1.1. Accuracy Analysis of GNSS-Derived PWV

Fifty-six collocated stations between GNSS and RS were selected in China over the period of 2012 to 2020 to evaluate the performance of GNSS-derived PWV based on CPRAP. The collocated principle is that the horizontal differences between GNSS and RS is less than 0.4° [13] and the altitude difference is less than 500 m. Furthermore, the empirical PWV correction model at collocated stations was used to reduce the PWV residual caused by the height difference [16]. RS-derived PWV can only be obtained at UTC 00:00 and 12:00; therefore, the corresponding comparison at collocated stations was only performed at those epochs over the selected period. RMS, Bias, MAE and R2, in Equation (13) were chosen to evaluate the accuracy of GNSS-derived PWV.
R M S = 1 n i = 1 n ( X i X ¯ ) 2 M A E = 1 n i = 1 n | ( X i X ¯ ) | B i a s = 1 n i = 1 n ( X i X ¯ ) R 2 ( X , Y ) = cov ( X , Y ) σ X σ Y
where X i is the PWV derived from the GNSS, whereas X ¯ is the PWV mean value derived from the RS and used as the reference value. Y is the PWV derived from the RS. σ X and σ Y are the standard deviation of X and Y, respectively.
PWV was derived from four collocated stations (URU2, NMEL, LNJZ and GXNN) and those stations are randomly selected and evenly distributed in China with different climate conditions. Figure 3 gives the scatter density diagram of those stations over the period of 2012 to 2020. It can be observed that the RMS values of those stations generally increased from subfigures (a) to (d) and an excess of 3 mm was observed at the GXNN station, which are acceptable because the averaged PWV value is 42.68 mm at the GXNN station. The corresponding values of the other three stations are 9.58, 8.49 and 17.44 mm. Furthermore, an error in the empirical formula of PWV correction at different heights also exists between collocated RS and GNSS stations. Figure 4 presents the RMS and Bias distributions of PWV difference between GNSS and RS over the period of 2012 to 2020. It can be observed that the RMS generally increased as latitude decreased. Furthermore, Bias is positive in the north of China and negative in the south of China. The GNSS-derived PWV inversion has poor accuracy at low latitudes in China, and the PWV values in low latitudes are larger, resulting in larger errors. Statistical result (Table 2) reveals that the averaged RMS, Bias and MAE are 2.15, 0.05 and 1.65 mm, respectively, which shows the good performance of the established CPRAP for retrieving PWV data using the GNSS technique.

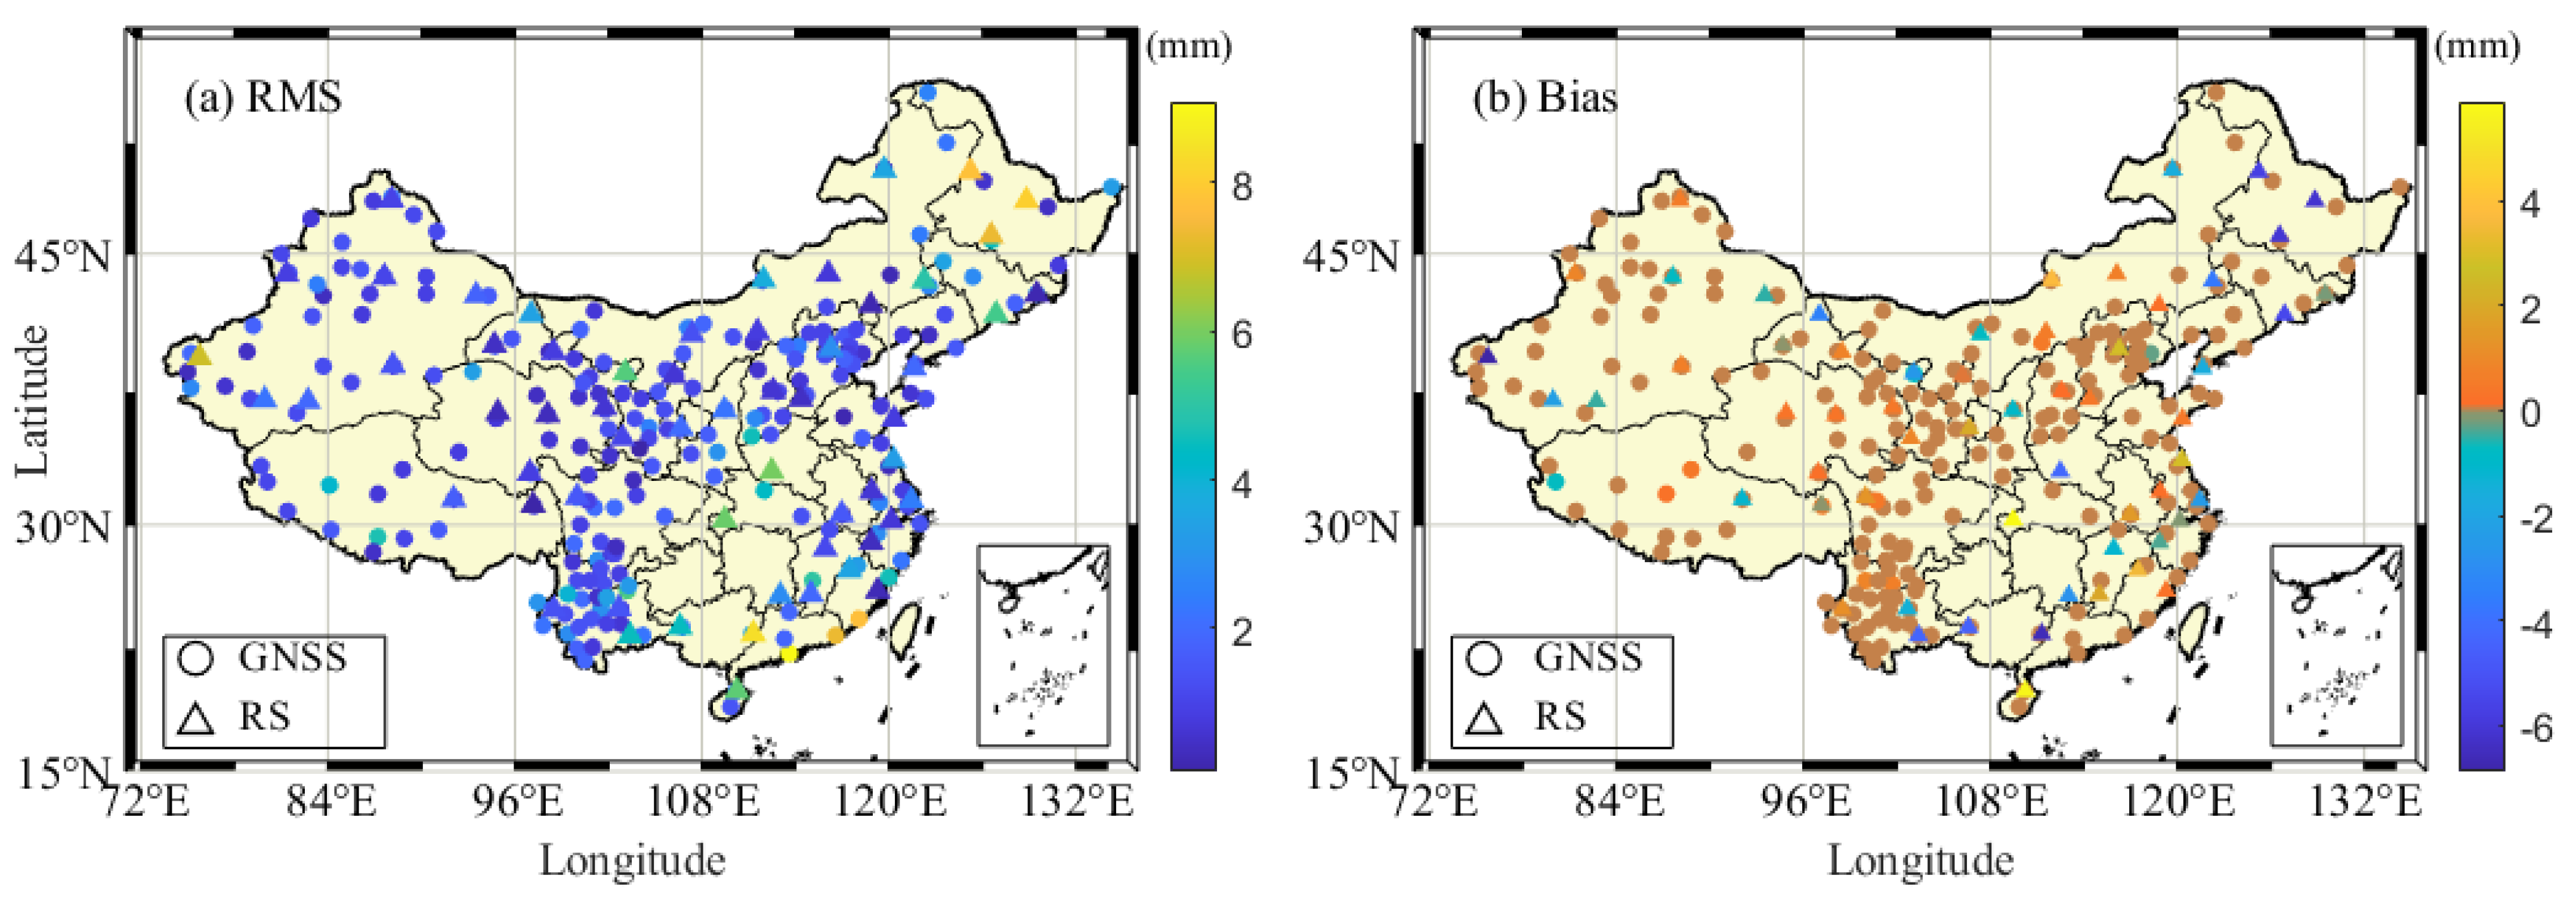
3.1.2. Accuracy Analysis of ERA5-Derived PWV Product

The comparison was performed using the corresponding GNSS and RS stations in China over the period of 2012 to 2020 to evaluate the performance of ERA5-derived PWV based on the CPRAP. The gridded point was first interpolated into the location of GNSS or RS stations following the steps proposed in Section 2.2. Figure 5 gives the time series of PWV between RS and ERA5 and their differences at two stations (CH20 and CH41) over the period of 2012 to 2020. Those two stations were selected because they were distributed in the south and north of China, respectively. It can be observed that the PWV time series derived from ERA5 showed good consistency with that of RS and their difference approximately follows a normal distribution. In addition, the RMS and Bias distributions of PWV differences between ERA5 and GNSS/RS are also presented in Figure 6. It can be found that the RMS of ERA5-derived PWV is evidently higher in south China than that in north China, whereas Bias does not show evident regional differences. Table 3 gives the statistical results of RMS, Bias and MAE between ERA5 and GNSS/RS over the period of 2012 to 2020 in China. It can be found that the averaged RMS, Bias and MAE between ERA5 and GNSS/RS are 1.86/0.11/1.48 mm and 0.90/−0.05/1.51 mm, respectively. The above results show the good performance of ERA5-derived PWV in China.

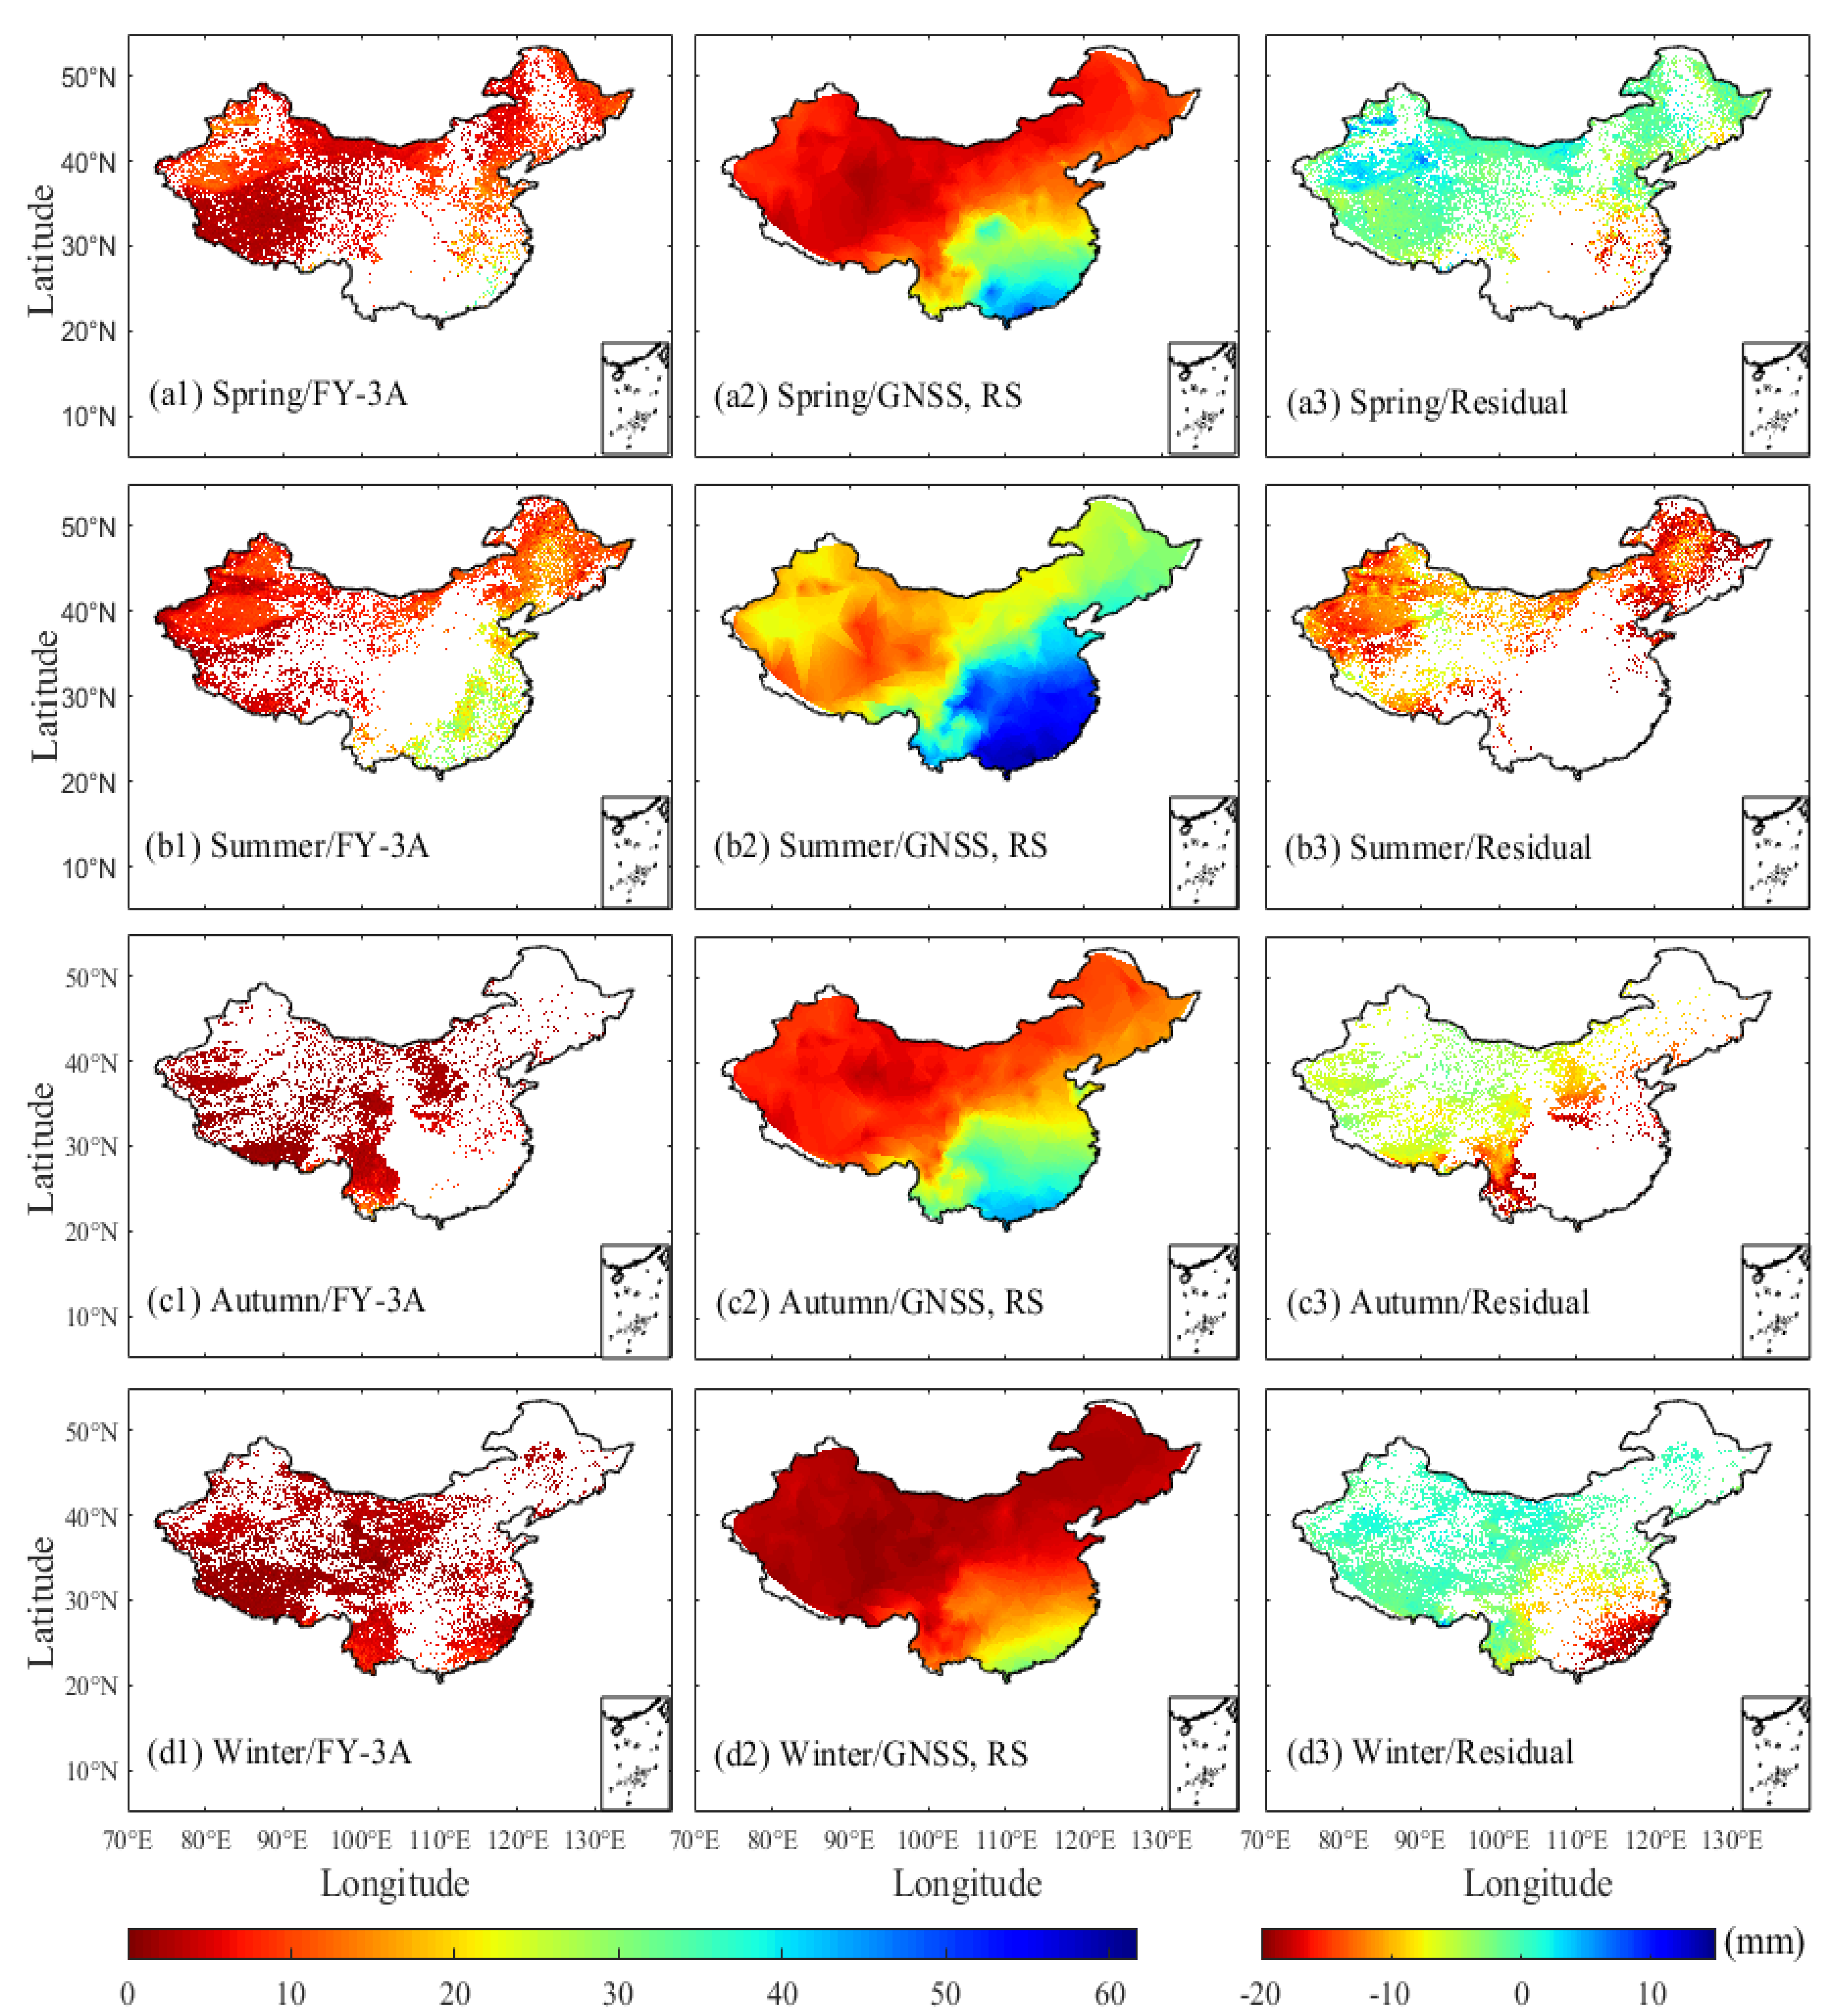
3.1.3. Accuracy Analysis of Satellite-Derived PWV Product

To validate the performance of L2 PWV product provided by the FY-3A/MERSI, the corresponding PWV product over the period of 2012 to 2013 in China was selected and compared with that from the GNSS and RS, respectively. The PWV data of FY-3A/MERSI at GNSS and RS stations were first obtained by averaging the gridded PWV data with the range of 20 pixel nearby the GNSS/RS station [52]. In terms of time matching, the data for FY-3A/MERSI are changed to match the mean of the hour to the GNSS hour data. Figure 7 gives the RMS and Bias distributions of PWV difference between FY-3A/MERSI and GNSS/RS in China over the period of 2012 to 2013. It can be observed that the overall accuracy of FY-3A/MERSI is relatively low in China, especially in the south of China with a large PWV value. Furthermore, the Bias between FY-3A/MERSI and GNSS shows a positive correlation in the north of China and a negative correlation in south of China, whereas that between FY-3A/MERSI and RS has no evident correlation. Table 4 gives the statistical result of averaged RMS, Bias and MAE at those GNSS and RS stations, respectively over the period of 2012 to 2013. It can be found that the averaged RMS, Bias and MAE between FY-3A/MERSI and GNSS/RS are 4.46/4.61 mm, 0.56/−0.33 mm and 3.61/3.79 mm, respectively.
In addition, the GNSS and RS-derived PWV data were used and interpolated with the same spatial resolution of FY-3A/MERSI using the Delaunay method [51] to verify further the spatial accuracy of FY-3A/MERSI-derived PWV in each season. Figure 8 presents the averaged PWV distribution of FY-3A/MERSI, GNSS and RS and their residuals in four seasons over the period of 2012 to 2013. It can be observed that the PWV product of FY-3A/MERSI is missing in some regions, especially in the southeast of China, which is explained by many clouds in coastal areas. The PWV product with clouds is removed because of its inaccuracy [9]. Furthermore, the accuracy of PWV derived from FY-3A/MERSI is low in summer and autumn with a high PWV value, whereas the accuracy of that is relatively high in spring and winter with a low PWV value. Moreover, the PWV values derived from FY-3A/MERSI is smaller than that from GNSS/RS in summer and autumn, but the values are similar except for the southeast of China in spring and winter.
Given the relatively high precision of PWV derived from Sentinel-3A/OLCI [21], only station-based PWV was analyzed between Sentinel-3A/OLCI and GNSS/RS in China from 1 March 2019 to 4 March 2020. The PWV data of Sentinel-3A/OLCI at GNSS and RS stations were first obtained by averaging the gridded PWV data, with a range of 66 pixel nearby the GNSS/RS station [52]. In terms of time matching, the data for Sentinel-3A/OLCI are changed to match the mean of the hour to the GNSS hour data. Figure 9 gives the RMS and Bias distributions of PWV difference between Sentinel-3A/OLCI and GNSS/RS in China from March 1 2019 to March 4 2020. The accuracy of Sentinel-3A/OLCI is high over the whole of China except for several stations. Table 5 gives the statistical result of averaged RMS, Bias and MAE of Sentinel-3A/OLCI in China and the corresponding values are 2.47/2.95 mm, −0.63/0.01 mm and 1.58/1.37 mm, respectively, which are similar to those from Xu and Liu [21].

3.2. Application of CPRAP-Derived PWV

The comparison results above have verified the good performance of the proposed CPRAP for obtaining PWV using different water vapor detection techniques. The corresponding applications, such as drought and rainfall monitoring, are further performed using the CPRAP-derived PWV in this section.

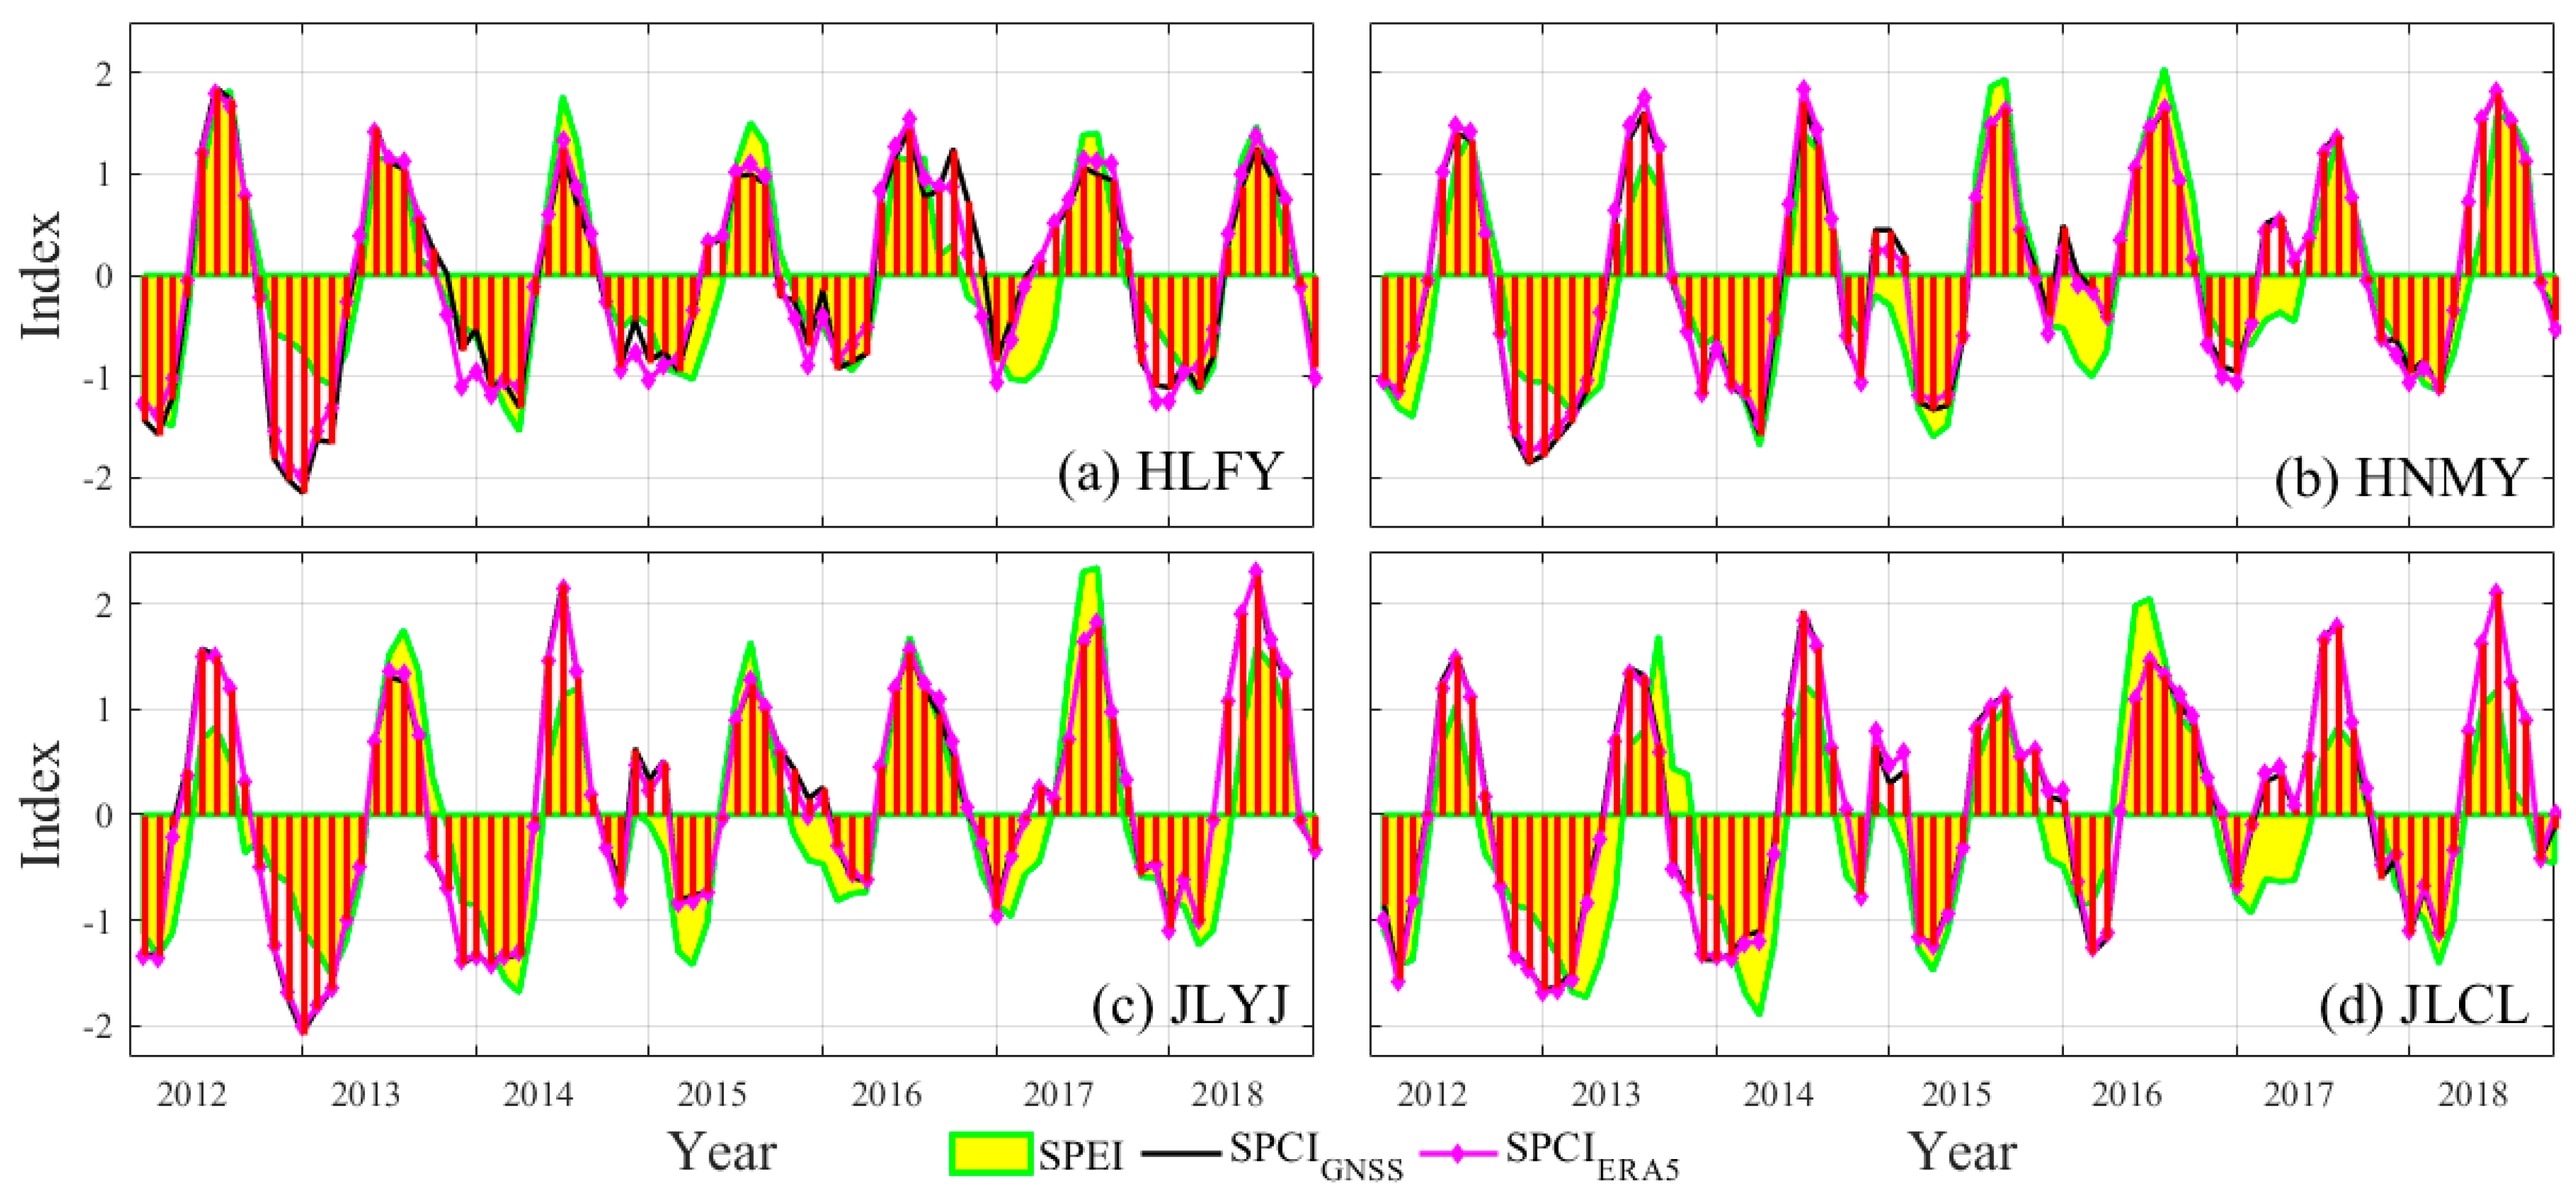
3.2.1. Application of CPRAP for Drought Monitoring

The standardized precipitation conversion index (SPCI) was proposed by Zhao et al. [53] for drought monitoring, which is different from the standardized precipitation evapotranspiration index (SPEI). In SPCI, only the parameters of PWV and precipitation were used, and the SPCI value is easy to obtain. A corresponding study proved that the SPCI with 12-month scale is of good capacity for drought monitoring and the correlation coefficients between SPCI and SPEI are larger than 0.96 (p < 0.05) [53]. Yunnan province is a representative arid area in China [54], making it ideal for drought monitoring. Thus, four stations (HLFY, HNMY, JLYJ and JLCL) in this province were randomly selected to verify the performance of CPRAP-derived PWV for drought monitoring and the corresponding SPCI value was calculated using the precipitation and CPRAP-derived PWV at those stations over the period of 2012 to 2018. Furthermore, the corresponding SPEI was also calculated using the meteorological data at those four stations following the steps proposed in Vicente-Serrano et al. [55]. Figure 10 gives the time series of SPEI and SPCI at four selected stations over the period of 2012 to 2018. It can be observed that the CPRAP-derived SPCI using GNSS observations (SPCIGNSS) and ERA5 data (SPCIERA5) have good consistency with SPEI at four selected stations. Although a small fluctuation existed between SPEI and SPCIGNSS/SPCIERA5, the correlated coefficients at those four stations are larger than 0.8 (p < 0.05) (Table 6). Statistical results show the averaged correlation coefficients of four stations are 0.875 and 0.865 between SPEI and SPCIGNSS/SPCIERA5, respectively, which shows the good performance of CPRAP-derived SPCI and proves the good ability of the established CPRAP for drought monitoring.

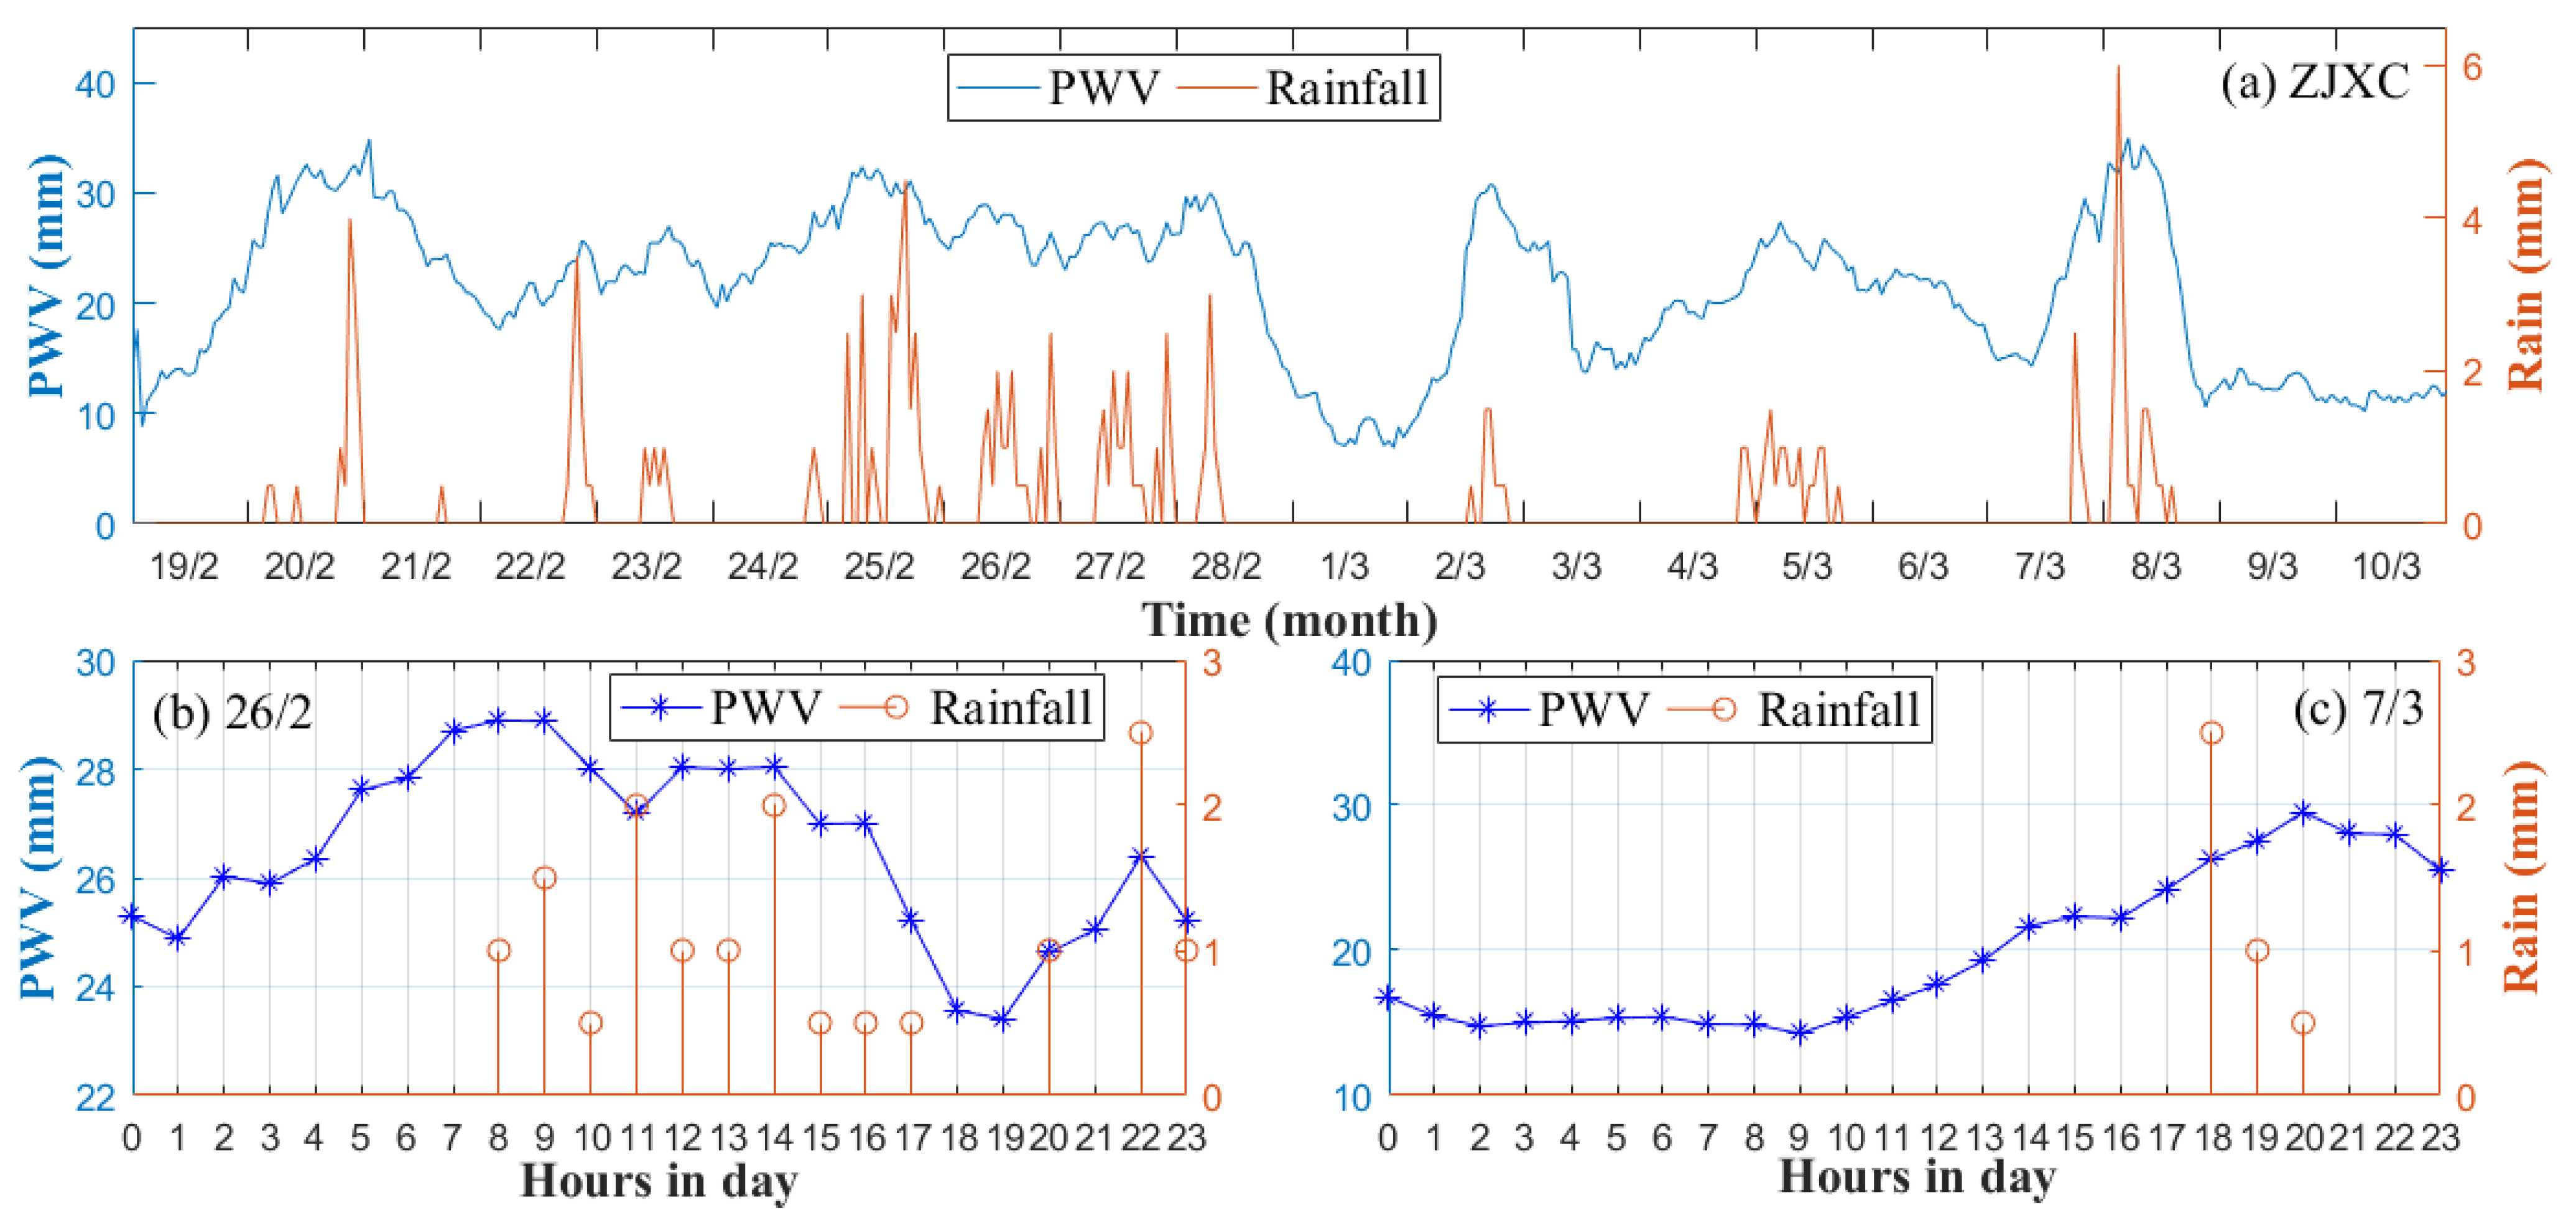
3.2.2. Application of CPRAP for Rainfall Monitoring

Apart from drought monitoring, the established CPRAP is also applied for rainfall monitoring. Previous studies have proven that the atmospheric water vapor changes sharply before precipitation [56], which provides useful indicator for rainfall monitoring and forecasting. GNSS-PWV time series have been widely used in heavy precipitation prediction [57]. Therefore, one GNSS stations (ZJXC, ZHOS) in Zhejiang province was selected to investigate the relationship between PWV and rainfall. This station was determined because it is near the ocean and the evident water vapor change can be observed during the rainfall period. The hourly PWV derived from the CPRAP was first obtained at the ZJXC and ZHOS station and the corresponding rainfall was also obtained from the collocated meteorological station. Figure 11a and Figure 12a gives the time series of PWV and rainfall over the period of 19 February to 10 March 2015, Figure 11b,c provide the hourly PWV and rainfall on 26 February and 7 March respectively. Figure 12b,c provide the hourly PWV and rainfall on 26 February and 7 March, respectively. It can be observed that the PWV showed an increasing trend several hours before the rainfall event and sharply decreased after it. The statistical results also reveal that the PWV increment before the rainfall lasted a few hours and reached more than 20 mm. Therefore, such evident PWV change before rainfall is a very important signal for rainfall forecasting, and the potential of using PWV estimates obtained from the established CPRAP for rainfall monitoring and forecasting.

4. Conclusions

The first comprehensive PWV retrieval and application platform (CPRAP) was established in this study. The CPRAP can be used to obtain PWV from GNSS, RS, ERA5, Sentinel-3A and FY-3A, respectively and can be applied for drought and rainfall monitoring. In retrieving PWV, the RMS, Bias and MAE of GNSS-derived PWV are 2.15, 0.05 and 1.65 mm, respectively, when compared with that of RS. The satellite-based PWV was also evaluated and the averaged RMS, Bias and MAE for FY-3A and Sentinel-3A are 4.46/0.56/3.61 mm and 2.95/0.01/1.37 mm, respectively, when compared with the values derived from GNSS and RS. Furthermore, the ERA5-derived PWV data were also compared with that from GNSS and RS, and the statistical result shows a good accuracy of ERA5 with the RMS of less than 2 mm in China over the period of 2012 to 2020. Experimental results show that in the Chinese region, the overall accuracy of PWV inversion of GNSS and ERA5 is higher. The overall accuracy of FY-3A and Sentinel-3A is lower, especially in the southern region of China, so the accuracy of GNSS and ERA5 in China is higher. In the aspect of PWV application, the CPRAP-derived PWV using different techniques was used for drought monitoring in Yunnan Province. The CPRAP-derived SPCI was found to have a good correlation with SPEI and the correlation coefficient is larger than 0.83 (p < 0.05), which proves the ability of CPRAP-derived SPCI for drought monitoring. Furthermore, CPRAP-derived PWV was also used for rainfall monitoring in Zhejiang province, which shows that PWV generally increased with the different magnitudes and sharply decreased before and after the rainfall event, respectively. Such evident PWV change before rainfall is a very important signal for rainfall forecasting, and verifies the potential of established CPRAP for rainfall monitoring and forecasting.

Author Contributions

Conceptualization, Q.Z., X.Z. and K.W.; methodology, Q.Z. and X.Z.; software, Q.Z. and K.W.; validation, K.W., Y.L., Z.L. and Y.S.; writing—original draft preparation, Q.Z. and X.Z.; writing—review and editing, X.Z., Y.S. and Y.L.; visualization, X.Z., K.W., Y.S. and Y.L.; All authors have read and agreed to the published version of the manuscript.

Funding

This research was supported by the Interdisciplinary joint research program of the department of aerospace medicine, Air Force Military Medical University (2021SZJC1004) and key research and development plan of Shaanxi Province (2022SF-190).

Institutional Review Board Statement

Not applicable.

Informed Consent Statement

Not applicable.

Data Availability Statement

Not applicable.

Acknowledgments

The author would like to thank Crustal Movement Observation Network of China (CMONOC) for providing GNSS observations, the ECMWF, European Space Agency (ESA); National Satellite Meteorological Centre (NCMC) and IGRA are also thanked for providing the corresponding data.

Conflicts of Interest

The authors declare no conflict of interest.

References

  1. Jin, S.; Li, Z.; Cho, J. Integrated water vapor fifield and multiscale variations over China from GPS measurements. J. Appl. Meteorol. Climatol. 2008, 47, 3008–3015. [Google Scholar] [CrossRef]
  2. Huang, L.; Mo, Z.; Xie, S.; Liu, L.; Chen, J.; Kang, C.; Wang, S. Spatiotemporal characteristics of GNSS-derived precipitable water vapor during heavy rainfall events in Guilin, China. Satell. Navig. 2021, 2, 1–17. [Google Scholar] [CrossRef]
  3. Wong, M.S.; Jin, X.; Liu, Z.; Nichol, J.; Chan, P.W. Multi-sensors study of precipitable water vapour over mainland China. Int. J. Climatol. 2015, 35, 3146–3159. [Google Scholar] [CrossRef]
  4. Li, Z.; Sun, Y.; Li, T.; Ding, Y.; Hu, T. Future changes in East Asian summer monsoon circulation and precipitation under 1.5 to 5 °C of warming. Earth’s Future 2019, 7, 1391–1406. [Google Scholar] [CrossRef] [Green Version]
  5. Zhao, Q.; Yao, W.; Yao, Y.; Li, X. An improved GNSS tropospheric tomography method with the GPT2w model. GPS Solut. 2020, 24, 1–13. [Google Scholar] [CrossRef]
  6. Liu, Y.; Zhao, Q.; Yao, W.; Ma, X.; Yao, Y.; Liu, L. Short-term rainfall forecast model based on the improved BP–NN algorithm. Sci. Rep. 2019, 9, 19751. [Google Scholar] [CrossRef]
  7. Zhang, B.; Yao, Y. Precipitable water vapor fusion based on a generalized regression neural network. J. Geod. 2021, 95, 1–14. [Google Scholar] [CrossRef]
  8. Pérez-Ramírez, D.; Whiteman, D.N.; Smirnov, A.; Lyamani, H.; Holben, B.N.; Pinker, R.; Andrade, M.; Alados-Arboledas, L. Evaluation of AERONET precipitable water vapor versus microwave radiometry, GPS and radiosondes at ARM sites. J. Geophys. Res. Atmos. 2014, 119, 9596–9613. [Google Scholar] [CrossRef] [Green Version]
  9. Li, X.; Long, D. An improvement in accuracy and spatiotemporal continuity of the MODIS precipitable water vapor product based on a data fusion approach. Remote Sens. Environ. 2020, 248, 111966. [Google Scholar] [CrossRef]
  10. Li, H.; Wang, X.; Choy, S.; Wu, S.; Jiang, C.; Zhang, J.; Qiu, C.; Li, L.; Zhang, K. A New Cumulative Anomaly-based Model for the Detection of Heavy Precipitation Using GNSS-derived Tropospheric Products. IEEE Trans. Geosci. Remote Sens. 2021, 60, 4105718. [Google Scholar] [CrossRef]
  11. Zhang, W.; Zhang, H.; Liang, H.; Lou, Y.; Cai, Y.; Cao, Y.; Zhou, Y.; Liu, W. On the suitability of ERA5 in hourly GPS precipitable water vapor retrieval over China. J. Geod. 2019, 93, 1897–1909. [Google Scholar] [CrossRef]
  12. Bevis, M.; Businger, S.; Herring, T.A.; Rocken, C.; Anthes, R.A.; Ware, R.H. GPS meteorology: Remote sensing of atmospheric water vapor using the Global Positioning System. J. Geophys. Res. Atmos. 1992, 97, 15787–15801. [Google Scholar] [CrossRef]
  13. Zhang, W.; Lou, Y.; Huang, J.; Zheng, F.; Cao, Y.; Liang, H.; Shi, C.; Liu, J. Multiscale Variations of Precipitable Water Over China Based on 1999–2015 Ground-Based GPS Observations and Evaluations of Reanalysis Products. J. Clim. 2018, 31, 945–962. [Google Scholar] [CrossRef]
  14. Zhao, Q.; Yang, P.; Yao, W.; Yao, Y. Hourly PWV dataset derived from GNSS observations in China. Sensors 2020, 20, 231. [Google Scholar] [CrossRef] [PubMed] [Green Version]
  15. Huang, L.; Jiang, W.; Liu, L.; Chen, H.; Ye, S. A new global grid model for the determination of atmospheric weighted mean temperature in GPS precipitable water vapor. J. Geod. 2019, 93, 159–176. [Google Scholar] [CrossRef]
  16. Gao, W.; Gao, J.; Yang, L.; Wang, M.; Yao, W. A novel modeling strategy of weighted mean temperature in China using RNN and LSTM. Remote Sens. 2021, 13, 3004. [Google Scholar] [CrossRef]
  17. Wang, S.; Xu, T.; Nie, W.; Jiang, C.; Yang, Y.; Fang, Z.; Li, M.; Zhang, Z. Evaluation of precipitable water vapor from five reanalysis products with Ground-Based GNSS observations. Remote Sens. 2020, 12, 1817. [Google Scholar] [CrossRef]
  18. Lu, Q.; Hu, J.; Wu, C.; Qi, C.; Wu, S.; Xu, N.; Sun, L.; Li, X.; Liu, H.; Guo, Y.; et al. Monitoring the performance of the Fengyun satellite instruments using radiative transfer models and NWP fields. J. Quant. Spectrosc. Radiat. Transf. 2020, 107239. [Google Scholar] [CrossRef]
  19. He, J.; Liu, Z. Comparison of satellite-derived precipitable water vapor through near-infrared remote sensing channels. IEEE Trans. Geosci. Remote Sens. 2019, 57, 10252–10262. [Google Scholar] [CrossRef]
  20. Gong, S.; Hagan, D.F.; Wu, X.; Wang, G. Spatio-temporal analysis of precipitable water vapour over northwest china utilizing MERSI/FY-3A products. Int. J. Remote Sens. 2018, 39, 3094–3110. [Google Scholar] [CrossRef]
  21. Xu, J.; Liu, Z. The First Validation of Sentinel-3 OLCI Integrated Water Vapor Products Using Reference GPS Data in Mainland China. IEEE Trans. Geosci. Remote Sens. 2021, 60, 4102817. [Google Scholar] [CrossRef]
  22. Altamimi, Z.; Collilieux, X.; Métivier, L. ITRF2008, an improved solution of the international terrestrial reference frame. J. Geod. 2011, 85, 457–473. [Google Scholar] [CrossRef] [Green Version]
  23. Yuan, Y.; Zhang, K.; Rohm, W.; Choy, S.; Norman, R.; Wang, C.S. Real-time retrieval of precipitable water vapor from GPS precise point positioning. J. Geophys. Res. Atmos. 2014, 119, 10044–10057. [Google Scholar] [CrossRef]
  24. Ssenyunzi, R.C.; Oruru, B.; D’ujanga, F.M.; Realini, E.; Barindelli, S.; Tagliaferro, G.; von Engeln, A.; van de Giesen, N. Performance of ERA5 data in retrieving Precipitable Water Vapour over East African tropical region. Adv. Space Res. 2020, 65, 1877–1893. [Google Scholar] [CrossRef]
  25. Jiang, P.; Ye, S.R.; Liu, Y.Y.; Zhang, J.J.; Xia, P.F. Near real-time water vapor tomography using ground-based GPS and meteorological data: Long-term experiment in Hong Kong. Annales Geophysicae. Copernic. GmbH 2014, 32, 911–923. [Google Scholar] [CrossRef] [Green Version]
  26. Durre, I.; Vose, R.S.; Wuertz, D.B. Overview of the integrated global radiosonde archive. J. Clim. 2006, 19, 53–68. [Google Scholar] [CrossRef] [Green Version]
  27. Hersbach, H.; Bell, B.; Berrisford, P.; Hirahara, S.; Horányi, A.; Muñoz-Sabater, J.; Nicolas, J.; Peubey, C.; Radu, R.; Schepers, D.; et al. The ERA5 global reanalysis. Q. J. R. Meteorol. Soc. 2020, 146, 1999–2049. [Google Scholar] [CrossRef]
  28. Yang, J.; Dong, C. Products and Application of New Generation Chinese Polar-orbit Meteorological Satellite; Science Press: Beijing, China, 2011; pp. 240–244. [Google Scholar]
  29. Sun, L.; Hu, X.; Guo, M.; Xu, N. Multisite calibration tracking for FY-3A MERSI solar bands. IEEE Transact. Geosci. Remote Sens. 2012, 50, 4929–4942. [Google Scholar] [CrossRef]
  30. Zhang, W.; Zhang, S.; Ding, N.; Holden, L.; Wang, X.; Zheng, N. GNSS-RS tomography: Retrieval of tropospheric water vapor fields using GNSS and RS observations. IEEE Trans. Geosci. Remote Sens. 2021, 60, 1–13. [Google Scholar] [CrossRef]
  31. Segarra, J.; Buchaillot, M.L.; Araus, J.L.; Kefauver, S.C. Remote sensing for precision agriculture: Sentinel-2 improved features and applications. Agronomy 2020, 10, 641. [Google Scholar] [CrossRef]
  32. Donlon, C.; Berruti, B.; Buongiorno, A.; Ferreira, M.H.; Féménias, P.; Frerick, J.; Goryl, P.; Klein, U.; Laur, H.; Mavrocordatos, C.; et al. The global monitoring for environment and security (GMES) sentinel-3 mission. Remote Sens. Environ. 2012, 120, 37–57. [Google Scholar] [CrossRef]
  33. Solheim, F.S.; Vivekanandan, J.; Ware, R.H.; Rocken, C. Propagation delays induced in GPS signals by dry air, water vapor, hydrometeors and other particulates. J. Geophys. Res. Atmos. 1999, 104, 9663–9670. [Google Scholar] [CrossRef]
  34. Li, X.; Dick, G.; Ge, M.; Heise, S.; Wickert, J.; Bender, M. Real-time GPS sensing of atmospheric water vapor: Precise point positioning with orbit, clock, and phase delay corrections. Geophys. Res. Lett. 2014, 41, 3615–3621. [Google Scholar] [CrossRef] [Green Version]
  35. Saastamoinen, J. Contributions to the theory of atmospheric refraction. Bull. Géodésique 1973, 107, 13–34. [Google Scholar] [CrossRef]
  36. Böhm, J.; Möller, G.; Schindelegger, M.; Pain, G.; Weber, R. Development of an improved empirical model for slant delays in the troposphere (GPT2w). GPS Solut. 2015, 19, 433–441. [Google Scholar] [CrossRef] [Green Version]
  37. Huang, L.; Liu, L.; Chen, H.; Jiang, W. An improved atmospheric weighted mean temperature model and its impact on GNSS precipitable water vapor estimates for China. GPS Solut. 2019, 23, 1–16. [Google Scholar] [CrossRef]
  38. Kirkland, E.J. Bilinear interpolation. In Advanced Computing in Electron Microscopy; Springer: Boston, MA, USA, 2010; pp. 261–263. [Google Scholar]
  39. Huang, L.; Peng, H.; Liu, L.; Xiong, S.; Xie, S.; Chen, J.; Li, J.; He, H. GNSS precipitable water vapor retrieval with the aid of NWM data for China. Earth Space Sci. 2021, 8, e2020EA001550. [Google Scholar] [CrossRef]
  40. Suparta, W.; Iskandar, A.; Singh, M.S.J.; Ali, M.A.M.; Yatim, B.; Yatim, A.N.M. Analysis of GPS water vapor variability during the 2011 La Niña event over the western Pacific Ocean. Ann. Geophys. 2013, 56, R0330. [Google Scholar] [CrossRef]
  41. Ferreira, A.P.; Nieto, R.; Gimeno, L. Completeness of radiosonde humidity observations based on the Integrated Global Radiosonde Archive. Earth Syst. Sci. Data 2019, 11, 603–627. [Google Scholar] [CrossRef] [Green Version]
  42. Von Storch, H.; Zwiers, F.W. Statistical Analysis in Climate Research; Cambridge University Press: Cambridge, UK, 2002. [Google Scholar]
  43. Huang, L.; Zhu, G.; Liu, L.; Chen, H.; Jiang, W. A global grid model for the correction of the vertical zenith total delay based on a sliding window algorithm. GPS Solut. 2021, 25, 1–14. [Google Scholar] [CrossRef]
  44. Wang, X.; Zhang, K.; Wu, S.; Fan, S.; Cheng, Y. Water vapor-weighted mean temperature and its impact on the determination of precipitable water vapor and its linear trend. J. Geophys. Res. Atmos. 2016, 121, 2849–2857. [Google Scholar] [CrossRef]
  45. Liangke, H.U.A.N.G.; Zhixiang, M.O.; Lilong, L.I.U.; Shaofeng, X.I.E. An empirical model for the vertical correction of precipitable water vapor considering the time-varying lapse rate for Mainland China. Acta Geod. Et Cartogr. Sin. 2021, 50, 1320. [Google Scholar]
  46. Yang, P.; Zhao, Q.; Li, Z.; Yao, W.; Yao, Y. High temporal resolution global PWV dataset of 2005–2016 by using a neural network approach to determine the mean temperature of the atmosphere. Adv. Space Res. 2021, 67, 3087–3097. [Google Scholar] [CrossRef]
  47. Gao, B.C.; Kaufman, Y.J. Water vapor retrievals using Moderate Resolution Imaging Spectroradiometer (MODIS) near-infrared channels. J. Geophys. Res. 2003, 108, 4389. [Google Scholar] [CrossRef]
  48. Preusker, R.; Carbajal Henken, C.; Fischer, J. Retrieval of Daytime Total Column Water Vapour from OLCI Measurements over Land Surfaces. Remote Sens. 2021, 13, 932. [Google Scholar] [CrossRef]
  49. Fischer, J.; Bennartz, R. Retrieval of Total Water Vapour Content From MERIS Measurements. Available online: https://earth.esa.int/eogateway/documents/20142/37627/MERIS%20ATBD%202-04 (accessed on 21 April 2022).
  50. Xu, J.; Liu, Z. Radiance-based retrieval of total water vapor content from sentinel-3A OLCI NIR channels using ground-based GPS measurements. Int. J. Appl. Earth Obs. Geoinf. 2021, 104, 102586. [Google Scholar] [CrossRef]
  51. Li, X.; Dick, G.; Lu, C.; Ge, M.; Nilsson, T.; Ning, T.; Wickert, J.; Schuh, H. Multi-GNSS meteorology: Real-time retrieving of atmospheric water vapor from BeiDou, Galileo, GLONASS and GPS observations. IEEE Trans. Geosci. Remote Sens. 2015, 53, 6385–6393. [Google Scholar] [CrossRef] [Green Version]
  52. Bai, J.; Lou, Y.; Zhang, W.; Zhou, Y.; Zhang, Z.; Shi, C. Assessment and calibration of MODIS precipitable water vapor products based on GPS network over China. Atmos. Res. 2021, 254, 105504. [Google Scholar] [CrossRef]
  53. Zhao, Q.; Ma, X.; Yao, W.; Liu, Y.; Yao, Y. A drought monitoring method based on precipitable water vapor and precipitation. J. Clim. 2020, 33, 10727–10741. [Google Scholar] [CrossRef]
  54. Jiang, W.; Yuan, P.; Chen, H.; Cai, J.; Li, Z.; Chao, N.; Sneeuw, N. Annual variations of monsoon and drought detected by GPS: A case study in Yunnan, China. Sci. Rep. 2017, 7, 1–10. [Google Scholar]
  55. Vicente-Serrano, S.M.; Beguería, S.; López-Moreno, J.I. A multiscalar drought index sensitive to global warming: The standardized precipitation evapotranspiration Bernard 10740 JOURNAL OF CLIMATE VOLUME 33 index. J. Climate 2010, 23, 1696–1718. [Google Scholar] [CrossRef] [Green Version]
  56. Li, H.; Wang, X.; Wu, S.; Zhang, K.; Chen, X.; Qiu, C.; Zhang, S.; Zhang, J.; Xie, M.; Li, L. Development of an improved model for prediction of short-term heavy precipitation based on GNSS-derived PWV. Remote Sens. 2020, 12, 4101. [Google Scholar] [CrossRef]
  57. Li, H.; Wang, X.; Wu, S.; Zhang, K.; Chen, X.; Zhang, J.; Qiu, C.; Zhang, S.; Li, L. An improved model for detecting heavy precipitation using GNSS-derived zenith total delay measurements. IEEE J. Sel. Top. Appl. Earth Obs. Remote Sens. 2021, 14, 5392–5405. [Google Scholar] [CrossRef]
Figure 1. Flowchart of establishing CPRAP and its applications for drought and rainfall monitoring.
Remotesensing 14 02507 g001
Figure 2. Geographic distributions of GNSS and RS stations selected in China.
Remotesensing 14 02507 g002
Figure 3. Scatter density diagram of PWV derived from four collocated stations over the period of 2012 to 2020.
Remotesensing 14 02507 g003
Figure 4. RMS and Bias distributions of PWV differences between GNSS and RS over the period of 2012 to 2020.
Remotesensing 14 02507 g004
Figure 5. Time series of hourly PWV derived from ERA5 and RS at two stations and PWV difference statistics over the period from 2012 to 2020.
Remotesensing 14 02507 g005
Figure 6. RMS and Bias distributions of PWV differences derived from ERA5 and GNSS/RS over the period of 2012–2020.
Remotesensing 14 02507 g006
Figure 7. RMS and Bias distributions of PWV differences between FY-3A and GNSS/RS over the period of 2012 to 2013.
Remotesensing 14 02507 g007
Figure 8. Two-dimensional image of PWV distributions at four seasons, where the first column is obtained from FY-3A, the second column is from the GNSS/RS and the last column is the PWV difference between the FY-3A and GNSS/RS over the period of 2012 to 2013.
Remotesensing 14 02507 g008
Figure 9. RMS and Bias distributions of PWV differences between Sentinel-3A and GNSS/RS over the period of 1 March 2019 to 4 March 2020.
Remotesensing 14 02507 g009
Figure 10. Long-term change of SPEI, SPCIERA5 and SPCIGNSS at HLFY, HNMY, JLYJ and JLCL stations, respectively over the period of 2012 to 2018.
Remotesensing 14 02507 g010
Figure 11. Relationship between hourly PWV and rainfall at ZJXC station over the period from 19 February to 10 March 2015, where (a) refers the time series of PWV and rainfall over the period of 19 February to 10 March 2015, (b,c) are the hourly PWV and rainfall on 26 February and 7 March, respectively.
Remotesensing 14 02507 g011
Figure 12. Relationship between hourly PWV and rainfall at ZHOS station over the period from 19 February to 10 March 2015, where (a) refers the time series of PWV and rainfall over the period of 19 February to 10 March 2015, (b,c) are the hourly PWV and rainfall on 26 February and 7 March, respectively.
Remotesensing 14 02507 g012
Table 1. Specific information of the data used for the establishing CPRAP.
CategoryResourcePeriodSpatial-Temporal ResolutionSource
Ground-BasedGNSS1 January 2012–31 December 20201 hStation (260)ftp://ftp.cgps.ac.cn/products/ (accessed on 24 April 2022)
RS1 January 2012–31 December 202012 hStation (87)ftp://ftp.ncdc.noaa.gov/ (accessed on 24 April 2022)
Reanalysis-BasedERA51 January 2012–31 December 20201 h0.25° × 0.25°https://www.ecmwf.int/ (accessed on 24 April 2022)
Space-BasedFY-3A/MERSI1 January 2012–31 December 20135 min1 km × 1 kmhttp://satellite.nsmc.org.cn/ (accessed on 24 April 2022)
Sentinel-3A/OLCI1 March 2019–4 March 20205 min0.3 km × 0.3 kmhttps://scihub.copernicus.eu/ (accessed on 24 April 2022)
Table 2. Statistical results of RMS, Bias and MAE of PWV differences between GNSS and RS (54) in China over the period 2012 to 2020.
IndexRMSBiasMAE
Value
Mean2.150.051.65
Max3.240.613.54
Min0.86−0.690.66
Table 3. Statistical results of RMS, Bias, MAE of PWV differences between ERA5 and GNSS (260)/RS (87) in China over the period of 2012–2020.
TypeComparison with RSComparison with GNSS
Index RMSBiasMAERMSBiasMAE
Mean1.90−0.051.511.860.111.48
Max3.610.242.854.720.274.01
Min0.79−0.260.620.9−0.540.71
Table 4. Statistical results of RMS, Bias, MAE of PWV differences between FY3-A and GNSS (260)/RS (87), respectively, in China over the period of 2012 to 2013.
TypeComparison with RSComparison with GNSS
Index RMSBiasMAERMSBiasMAE
Mean4.460.563.614.61−0.333.79
Max9.261.568.0311.385.918.71
Min0.98−0.420.782.00−8.711.57
Table 5. Statistical results of RMS, Bias, MAE of PWV differences between Sentinel-3A and GNSS (260)/RS (87) over the period from 1 March 2019 to 4 March 2020.
TypeComparison with RSComparison with GNSS
Index RMSBiasMAERMSBiasMAE
Mean2.47−0.631.582.950.011.37
Max8.40−6.886.8810.820.847.51
Min0.09−0.420.010.24−0.890.07
Table 6. Correlation coefficients between SPEI and SPCIERA5/SPCIGNSS at HLFY, HNMY, JLYJ and JLCL stations (p < 0.05) over the period of 2012 to 2018.
Stations SPCI ERA 5 SPCI GNSS
Mean.0.8750.865
HLFY0.880.86
HNMY0.900.90
JLYJ0.880.87
JLCL0.840.83
Publisher’s Note: MDPI stays neutral with regard to jurisdictional claims in published maps and institutional affiliations.

