Article

Source Model and Triggered Aseismic Faulting of the 2021 Mw 7.3 Maduo Earthquake Revealed by the UAV-Lidar/Photogrammetry, InSAR, and Field Investigation

1
State Key Laboratory of Geohazard Prevention and Geoenvironment Protection, Chengdu University of Technology, Chengdu 610059, China
2
Hebei Key Laboratory of Earthquake Dynamics, Sanhe 065201, China
3
Department of Geosciences, National Taiwan University, Taipei 10617, Taiwan
4
Department of Remote Sensing and Geoinformation Engineering, Southwest Jiaotong University, Chengdu 610031, China
*
Author to whom correspondence should be addressed.
Remote Sens. 2022, 14(22), 5859; https://0-doi-org.brum.beds.ac.uk/10.3390/rs14225859
Submission received: 1 October 2022 / Revised: 5 November 2022 / Accepted: 14 November 2022 / Published: 18 November 2022
(This article belongs to the Special Issue Earthquake Ground Motion Observation and Modelling)

Abstract

:
Multi-source datasets, including the UAV-Lidar/Photogrammetry, InSAR, and field investigation data, have been used for revealing the complex surface displacement pattern and focal mechanism of the 2021 Maduo Mw 7.3 earthquake. First, a co-seismic surface deformation field was extracted from the Synthetic Aperture Radar (SAR) images captured by ALOS-2 and Sentinel-1 satellites. Second, the SAR pixel offset tracking results were adopted to detect the initial location of the seismogenic fault. Then, the Lidar digital elevation model with high spatial resolution and field investigation were employed to refine and verify the location of the seismogenic fault. It was found that bifurcated strike-slip rupture should account for the 2021 Maduo earthquake. As indicated by the estimated faulting model based on the InSAR data, the maximal fault slip was ~6.2 m, occurring in the southeast of the main seismogenic fault, and five remarkable slip concentrations controlled the surface displacement of the 2021 Maduo earthquake. Furthermore, the co- and post-seismic InSAR deformation, dilatation, shear strain, Coulomb failure stress, and aftershock sequence suggest that the co-seismic rupture of the two main seismogenic faults have triggered the aseismic slip along the Changmahe fault. Lastly, according to the Coulomb failure stress change due to the historical earthquakes and the 2021 Maduo earthquake, the 1937 M 7.8 earthquake predominantly controlled the Coulomb failure stress change along the Kunlun fault, and the Xidatan-Alake Lake and Maqin segments had a higher risk of future earthquake than the other segments.

Graphical Abstract

1. Introduction

An earthquake with a moment magnitude of Mw 7.3 struck Huanghe County (Figure 1), Qinghai Province, China, at 18:04:13 (UTC time) of 21 May 2021 (02:04:13 on 22 May 2021, in Chinese time). This earthquake covers a wide interest in recent publications, and some studies focus on estimating the fault rupture model [1,2,3,4,5], while others try to find the possible pre-earthquake anomalies eventually relatable to its preparations [4,6,7,8]. The 2021 Maduo earthquake occurred in the north of the Bayan Har block and was close to the northern boundary, the Kunlun Fault (Figure 1). In addition, the 2021 Mw 7.3 Maduo earthquake is the largest event that has occurred in this area since the 2001 Kokoxili Mw 7.8 earthquake. Fortunately, this earthquake occurred in an unpopulated zone, and the epicenter was located in a high mountain region, thus, no mortalities and nearly 20 people injured were reported [9,10]. A hypothesis is proposed that the 2021 Maduo earthquake should be attributed to the rupture of the Kunlunshankou-Jiangcuo fault within the Bayan Har block (Figure 1), and no moderate and strong earthquakes were recorded along this fault for at least 300 years [9,10,11,12,13].
The Bayan Har block is the north sub-block of the Tibetan Plateau, accommodating the block motion from ~30 mm/year (Qiangtang block) of northeast motion to ~10 mm/year (Qaidam and Ordos block) of almost pure east motion [14,15,16], as represented by pink arrows in Figure 1). Accordingly, the significant crustal strain accumulated along the boundary fault of Bayan Har block, and thus several moderate and strong earthquakes (e.g., the 2001 Kokoxili Mw 7.8 earthquake, 2008 Wenchuan earthquake, 2010 Yushu Mw 6.9 earthquake, and 2017 Jiuzhaigou Mw 6.5 earthquake) occurred around the Bayan Har block [17,18,19]. However, rare strong earthquakes occurred in the interior of the Bayan Har block. The 1947 Mw 7.3 earthquake occurring ~170 km southeast of the Maduo event was the last recorded strong earthquake in the Bayan Har block [17,20,21,22]. Thus, it is crucial to research the mechanism of the 2021 Maduo earthquake and analyze whether the earthquake that occurred in the block shares a similar mechanism with the earthquakes that occurred along the boundaries of the Bayan Har block. Furthermore, it is hypothesized that the east segment of the Kulun fault (e.g., the Dongdatan, Maqin, and Maqu segments) may have a high seismic potential due to the lack of recorded moderate or strong earthquakes, as pointed out by previous studies [16,23]. The 2001 Kokoxili Mw 7.8 earthquake and other moderate and strong earthquakes occurring in the adjacent area may have significantly changed the stress and affected the seismic potential of the mentioned segments [17]. Accordingly, the study of whether the 2021 Maduo Mw 7.3 earthquake increased or decreased the seismic potential in the above-mentioned segments of the Kunlun fault should be carried out.
After the main shock of the 2021 Maduo earthquake, several institutions (e.g., the United States Geological Survey (USGS), China Earthquake Network Center (CENC), and Global Centroid Moment Tensor (GCMT)) have reported the mechanism solutions derived by seismic waveform data. As indicated by the USGS solution, an E–W striking (strike angle of 92°) and south-dipping sinistral strike-slip fault could account for the 2021 Maduo earthquake (USGS, 2021, [24]). However, as indicated by the GCMT solution and the faulting model derived by co-seismic surface displacements, including the InSAR and/or GPS observations, a north-dipping fault with a dominated sinistral strike-slip and slight normal rupture should be responsible for the 2021 Maduo earthquake [1,2,3,4,25,26,27]. The relocated aftershocks also show that a very high dip-angle fault should be the seismogenic fault of the 2021 Maudo earthquake. Moreover, the aftershock distribution profiles have a different dipping direction in the different segments along the seiemogenic fault, which suggests a very complex fault geometry of the main shock of the 2021 Maduo earthquake [28,29]. In addition, as revealed by the field investigation, optical remote sensing image, and InSAR observation, the co-seismic surface ruptured over a distance of ~150 km and was separated into three sub-segments by two rupture gaps [9,13,30]. Furthermore, the surface deformation pattern is highly complex in the east terminate of the seismic fault, where the fault bifurcated into sub-parallel strands [9,11,25]. In addition, the field investigation suggests that the Changmahe fault, that is near orthogonal to the southeastern seismogenic fault, may have been triggered by the main shock [9,13]. However, the Changmahe fault geometry, slip distribution, and triggered mechanism are still unknown.
In this study, the multi-platform SAR images were firstly used to reveal the co-seismic surface displacement pattern of the 2021 Maduo earthquake. Then, the SAR-POT (pixel offset tracking), UAV-Lidar/Photogrammetry data, and the field investigation were employed to extract the surface fault trace. Furthermore, the InSAR displacements from ascending and descending satellite orbital tracks were adopted to estimate the co-seismic and triggered aseismic faulting model of the 2021 Maduo earthquake, and the complex rupture mechanism in the east end of the seismogenic fault was analyzed. Furthermore, the time-series post-seismic InSAR deformation, aftershocks, field investigation, shear strain, surface dilatation, and Coulomb failure stress were used to analyze the triggered slip on the Changmahe fault. Lastly, the Coulomb failure stress change attributed to the historical earthquakes and the 2021 Maduo event was used to assess the seismic hazard along the Kunlun fault.

2. Datasets and Processing

2.1. SAR Images and Interference

The interferometric wide swath mode (250 km swath, 2.3 by 13.9 m spatial resolution) SAR images (for detailed information see Table S1) captured by the Sentinel-1 (C band with radar wavelength of 5.5 cm, designed and launched by European Space Agency) satellite, and the ScanSAR mode (350 km width swath, 100 m spatial resolution) PALSAR-2 images observed by the ALOS-2 satellite (L band with radar wavelength of 23.6 cm, designed and launched by Japan Aerospace Exploration Agency) were collected to map the co-seismic surface deformation caused by the 2021 Maduo earthquake (Figure 2). The GAMMA-V20180813 software developed by GAMMA Remote Sensing Company in Switzerland, was employed to carry out two-pass interferometry based on the collected SAR images [31].
The SRTM-4 digital elevation model (DEM) with a resolution of 30 m was adopted to model and remove the topography component from the interferogram [32]. The minimum cost flow algorithm was adopted to unwrap the differential interferogram [33]. Then, a bilinear ramp model was estimated based on the far-field InSAR data with slight co-seismic deformation, which was used to remove the noise component attributed to inaccurate satellite orbit vectors. Notably, a significant ionospheric error could be found in the differential interferogram of the ALOS-2 descending orbital track InSAR observations. Thus, a 2D polynomial model was used to simulate and remove both the orbital and ionospheric error components for the ALOS-2 descending orbital track InSAR data [34].

2.2. UAV-Lidar Measurement

The vertical take-off and landing fixed-wing unmanned aerial vehicle (UAV) system developed by the Hi Target Company served as the platform of the Lidar sensor. A total of 6 air routes were adopted in the seismic zone of the 2021 Maduo earthquake. Lastly, ~83.9 km2 Lidar point clouds’ data and optical images were captured around the seismogenic fault of the 2021 Maduo earthquake (Figure S1). It is worth noting that the Lidar data are lacking in some segments, especially for the central to east segments of the seismogenic fault. It was caused by the bad road in these segments and the limited power of the UAV system.
The original Lidar point clouds include considerable noise points attributed to shaking of the UAV and suspended particles in the atmosphere. The mentioned noise points were removed using the Gaussian filtration algorithm. Moreover, the filtered Lidar data largely comprised the points of the ground surface, vegetation, and the artificial structure (Figure S1). Furthermore, the points of the ground surface were isolated from the filtered dataset above. The single point or point group that is significantly lower or higher than the ground surface will be firstly removed from the filtered Lidar dataset. Then, the ground surface point was extracted based on the reflection intensity, the number of echoes, and the shape of the ground object. A ground surface model was generated based on the extracted ground surface point cloud, then, the model and point cloud were further improved through the checking and correction of the surface discontinuity and abnormal relief. Finally, the digital elevation model around the seismic fault was built using irregular triangles or the grid interpretation method under the LiDAR point cloud of the ground surface [35,36,37]. The derived Lidar-DEM and the observed optical images would significantly facilitate the determination of the position of the co-seismic fault of the 2021 Maduo earthquake in some regions.

3. Methodology

3.1. Estimating the Faulting Model Based on InSAR Measurement

The Sentinel-1 and ALOS-2 satellite InSAR observations provide sufficient surface deformation in both the near- and far-fault zones, which makes it possible to estimate the co-seismic faulting model of the 2021 Maduo earthquake based on the observed co-seismic deformations. In addition, considering that the POT data have a significantly lower accuracy than the InSAR observation, therefore, only the co-seismic surface deformation extracted based on InSAR technology was used to estimate the faulting model of the 2021 Maduo earthquake. Firstly, to avoid the negative effect on the estimation of the faulting model using the unreliable InSAR data, the observations with interferometric coherence less than 0.3 were removed from the original InSAR deformation field. Then, the ascending and descending orbital tracks InSAR observations were down-sampled using the quadtree algorithm to decrease the computation load [38]. Lastly, 2307 Sentinel-1 ascending orbital track points, 2678 Sentinel-1 descending orbital track points, and 874 ALOS-2 descending orbital track data were kept to estimate the faulting model of the 2021 Maduo earthquake.
The NW–SE striking main seismogenic fault model (F1 in Figure 3) was first constructed using the geometry parameters derived from the InSAR, Lidar, and field investigation. The fault location, length, and strike angle could be successfully obtained from the mentioned datasets (Section 2), whereas the fault width (size along the fault down-dip direction), dip angle, and rake angle are unknown. The fault width was set to 40 km, which was sufficient for a moderate or strong earthquake. Furthermore, the searching range of all segments were set to [0°, 90°] for the fault dip angle, and [−180°, 180°] for the rake angle. The second fault (F2 in Figure 3 and Figure 4) composed by three segments was constructed under the POT deformation fields. The dipping direction was set as north dipping since the POT deformation in the north side was more significant than that in the south side. Furthermore, the searching ranges of the dip angle and rake angle were set as [0°, 90°] and [−180°, 180°], respectively. In terms of the Changmahe fault (F3 in Figure 3), the A-2 descending orbital track InSAR deformation indicated that significant surface deformation occurred at the northeast side of the fault; thus, a northeast dipping and NW–SE striking fault was constructed for modeling it. The searching ranges of the dip angle and rake angle were the same as the main fault.
The inversion algorithm developed by Yang et al. [39] was adopted to estimate the faulting model. The faults were first divided by a size of 10 (along strike direction) × 5 km (along down-dip direction), and then the simulated annealing algorithm was used to search the optimal fault parameters (fault dip angle and rake angles). The searched best-fitting fault parameters were used to construct the fault geometry model, and then the fault was further divided by a smaller division size of 2.5 × 2.5 km. Finally, a fine fault slip distribution was estimated based on the InSAR measurements under the least square theory. More detailed information of the theory and inversion processing of the faulting model based on the InSAR and/or GPS measurements can be acquired from the previous studies [34,39,40].

3.2. Calculation of the Coulomb Failure Stress Change

The Coulomb failure stress (CFC) change is an important factor to reveal the earthquake triggering relation, which has been widely used for assessing the earthquake potential in previous studies [39,41,42,43]. The CFS change depends on both the shear and normal stress change on the fault, which could be calculated based on Equation (1):
Δ S = Δ τ + ( Δ δ + Δ P ) × μ
where Δ S indicates the Coulomb failure stress change, Δ τ is the shear stress change, Δ δ indicates the normal stress change, Δ P denotes the pore pressure change, and μ is the effective friction coefficient.
The shear and normal stress change is calculated using the faulting model or focal mechanism based on the elastic dislocation theory [44,45]. The pore pressure is not considered since it is difficult to collect after the main shock. Finally, the friction coefficient is generally varied from 0.1 to 0.8 due to the lithology, regional stress, and fault motion [46]. Here, the friction coefficient was set as 0.4, the middle value of the possible range, because it is difficult to have the best value [34].

4. Results

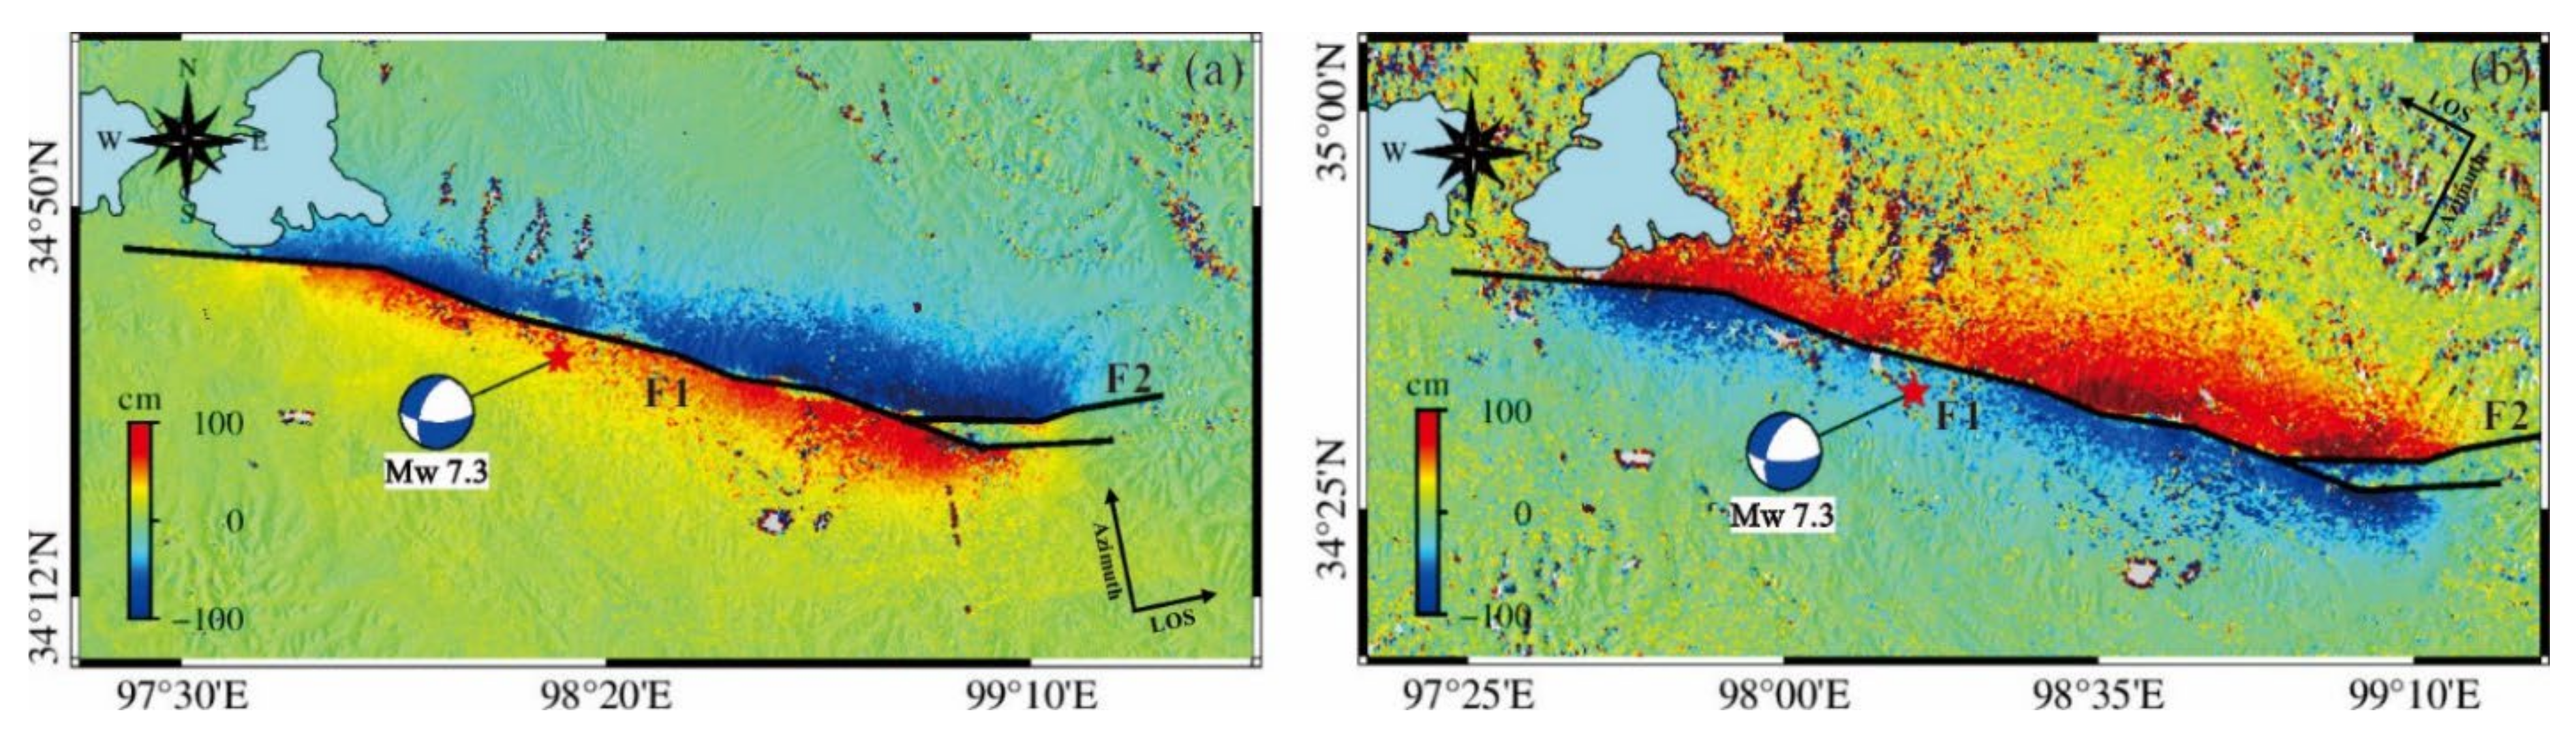
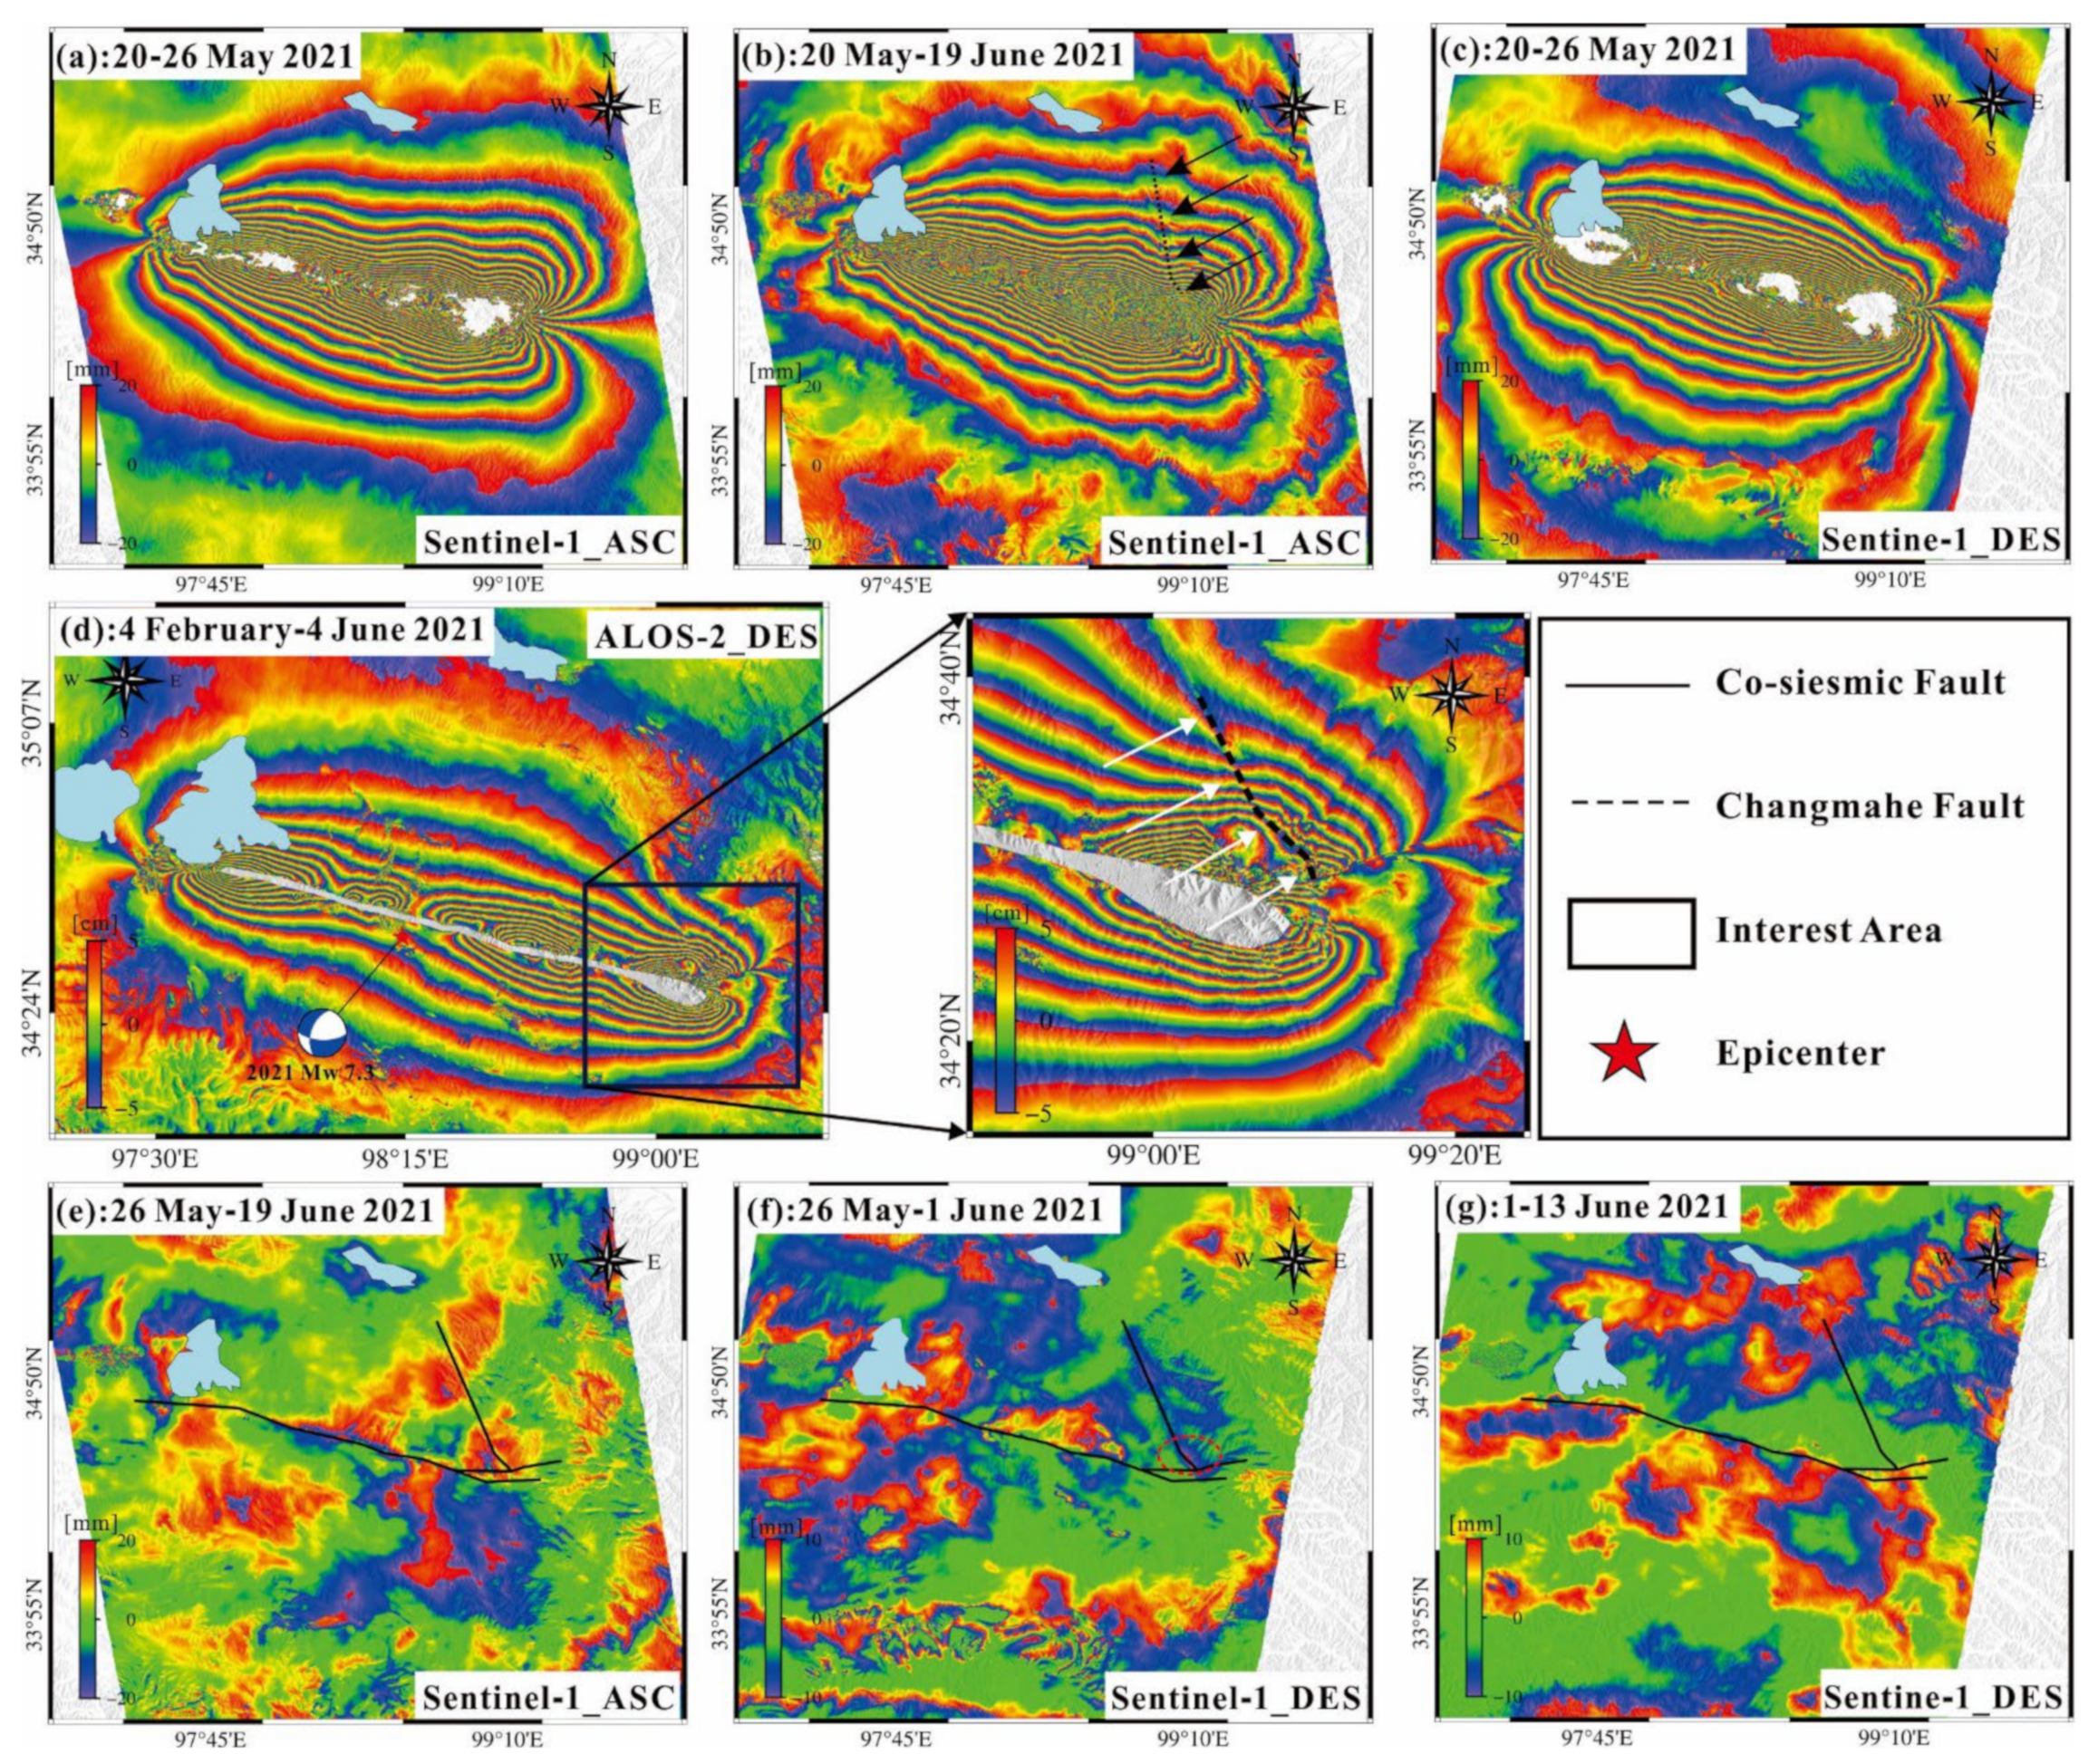
4.1. Co-Seismic Surface Deformation Field of the 2021 Maduo Earthquake

The ascending and descending Sentinel-1 satellite orbital tracks’ observations (Figure 3) were de-correlated in the near-fault zone, which should be attributed to the significant surface deformation caused by the fault rupture. However, the ALOS-2 descending orbital track data, maintaining the interferometric correlation in most areas (e.g., the near-fault zone), could provide more help for the estimation of the fault motion of the 2021 Maduo earthquake. In addition, the InSAR deformation from ascending and descending satellite orbital tracks were de-correlated in the southeast end of the fault, suggesting complicated accommodation of seismic rupture in this area. Thus, it is challenging to detect the partition of the co-seismic slip along the different branches of the seismogenic fault. Some deformation lobes could be found along the seismogenic fault, which indicates significant fault slip that occurred along the seismogenic fault. In addition, both the Sentinel-1 ascending orbital track and the ALOS-2 descending orbital track interferograms suggest that there are notable fringe discontinuities at the southeast of the seismic zone (Figure 3 and Figure 5), and it is hypothesized that the above-mentioned abnormal deformation may be attributed to the rupture of the Changmahe fault. However, it is worth noting that multiple InSAR interferograms (Figure 5) suggest that the fault slip on the Changmahe fault occurred after 26 May 2021. Therefore, the deformation signal due to the faulting of the Changmahe fault could not be found from the InSAR deformation field generated by the post-seismic SAR image captured before 26 May (Figure 5a,c). In addition, the interferometric de-correlation also meant that the F3 could not be found in the Sentinel-1 InSAR deformation fields (Figure 3d,g). More detailed discussions of the fault rupture of the Changmahe fault can be found in Section 5.
To further reveal the co-seismic surface motion due to the 2021 Maduo earthquake, the horizontal (along the east and north directions) and vertical surface displacement were estimated based on the ascending and descending orbital tracks’ InSAR observation. Considering that the InSAR deformation was not sensitive to the surface displacement along the north direction, then, the multiple aperture interferometry (MAI) technique was adopted to extract the surface displacement along the satellite flight direction, which is approximate to the north direction [47,48]. It is a pity that the MAI deformation was only successfully extracted from the Sentinel-1 ascending orbital track SAR images (Figure S2). In addition, the near-fault de-correlation Sentinel-1 InSAR deformation was replaced by the surface deformation (Figure 4) extracted based on the SAR pixel offset tracking technique [49]. Figure S2b–d show the estimated surface three-dimensional (3D) deformation of the 2021 Maduo earthquake. It could be found from Figure S2 that the co-seismic deformation was controlled by a significant east displacement, slight north displacement, and insignificant vertical displacement [50]. The opposite east motion (Figure S2b) between the fault’s north and south sides suggested a predominant sinistral strike-slip of the 2021 Maduo earthquake. Figure S2d shows that the vertical surface displacement at the north side is larger than at the south side; in addition, surface subsidence could be found in the northwest and central segments of the seismogenic fault. It suggests that the seismogenic fault should be dipping to the northeast, and some normal fault rupture has occurred on it.

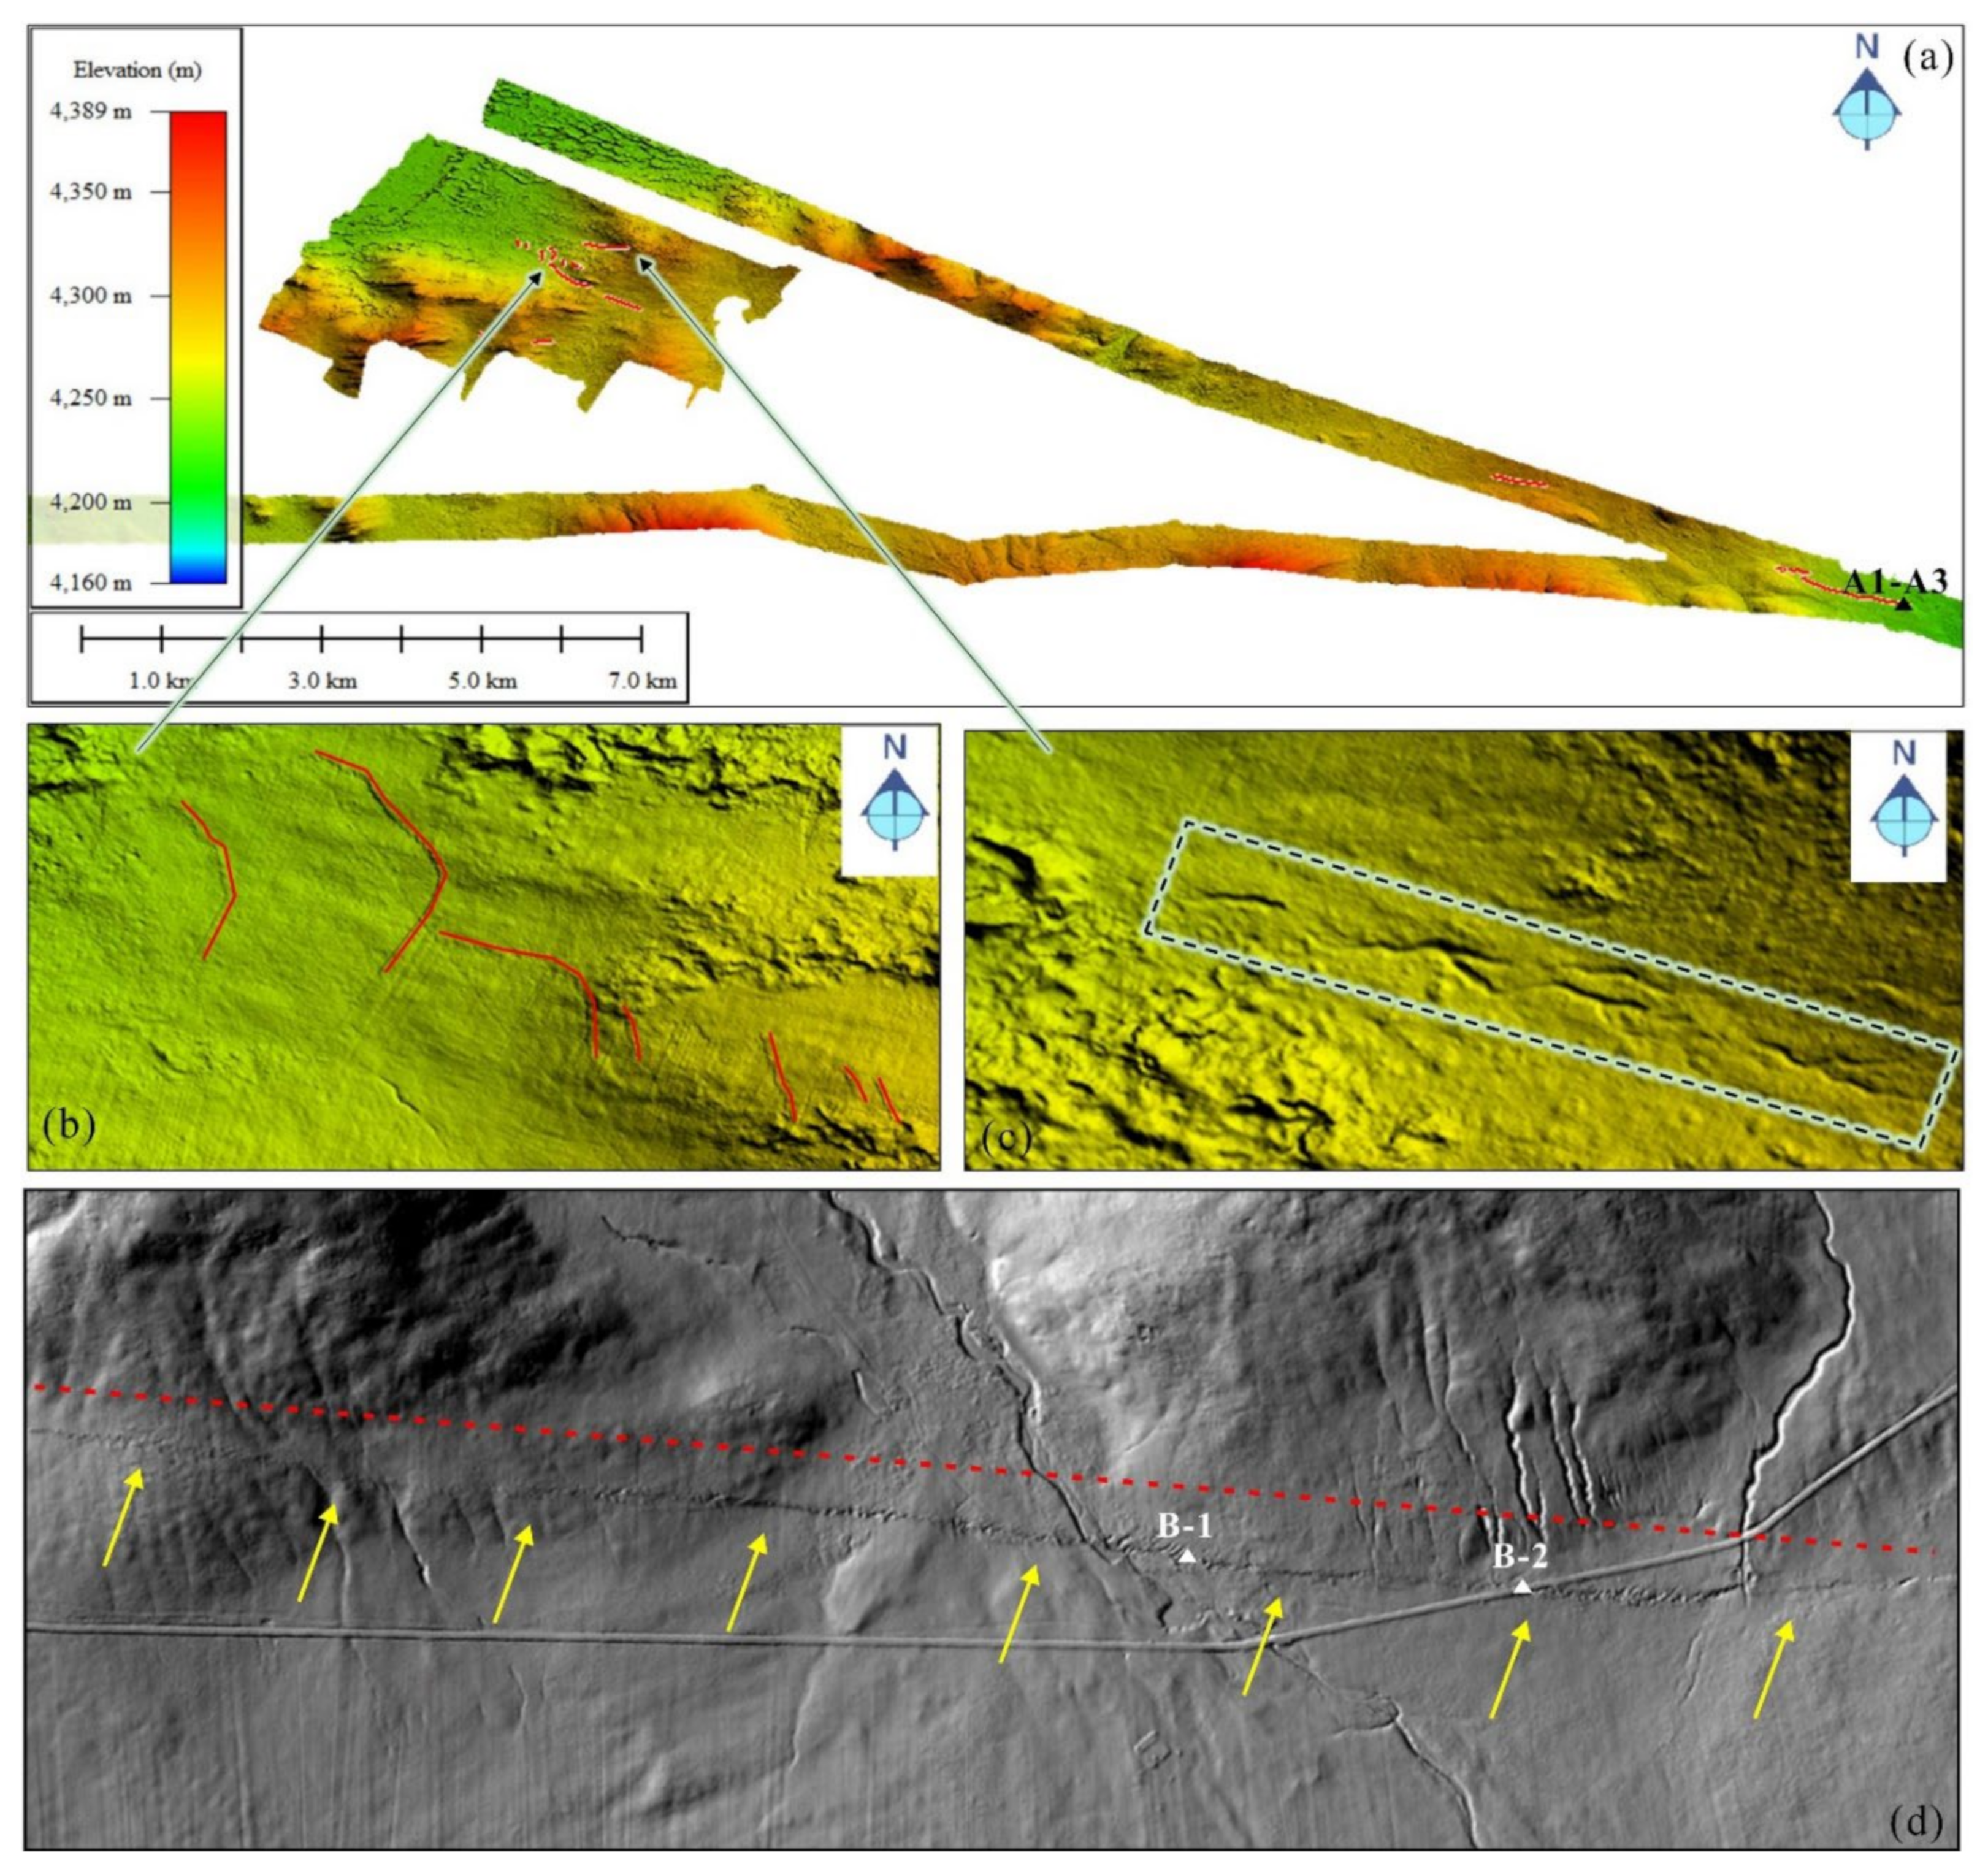
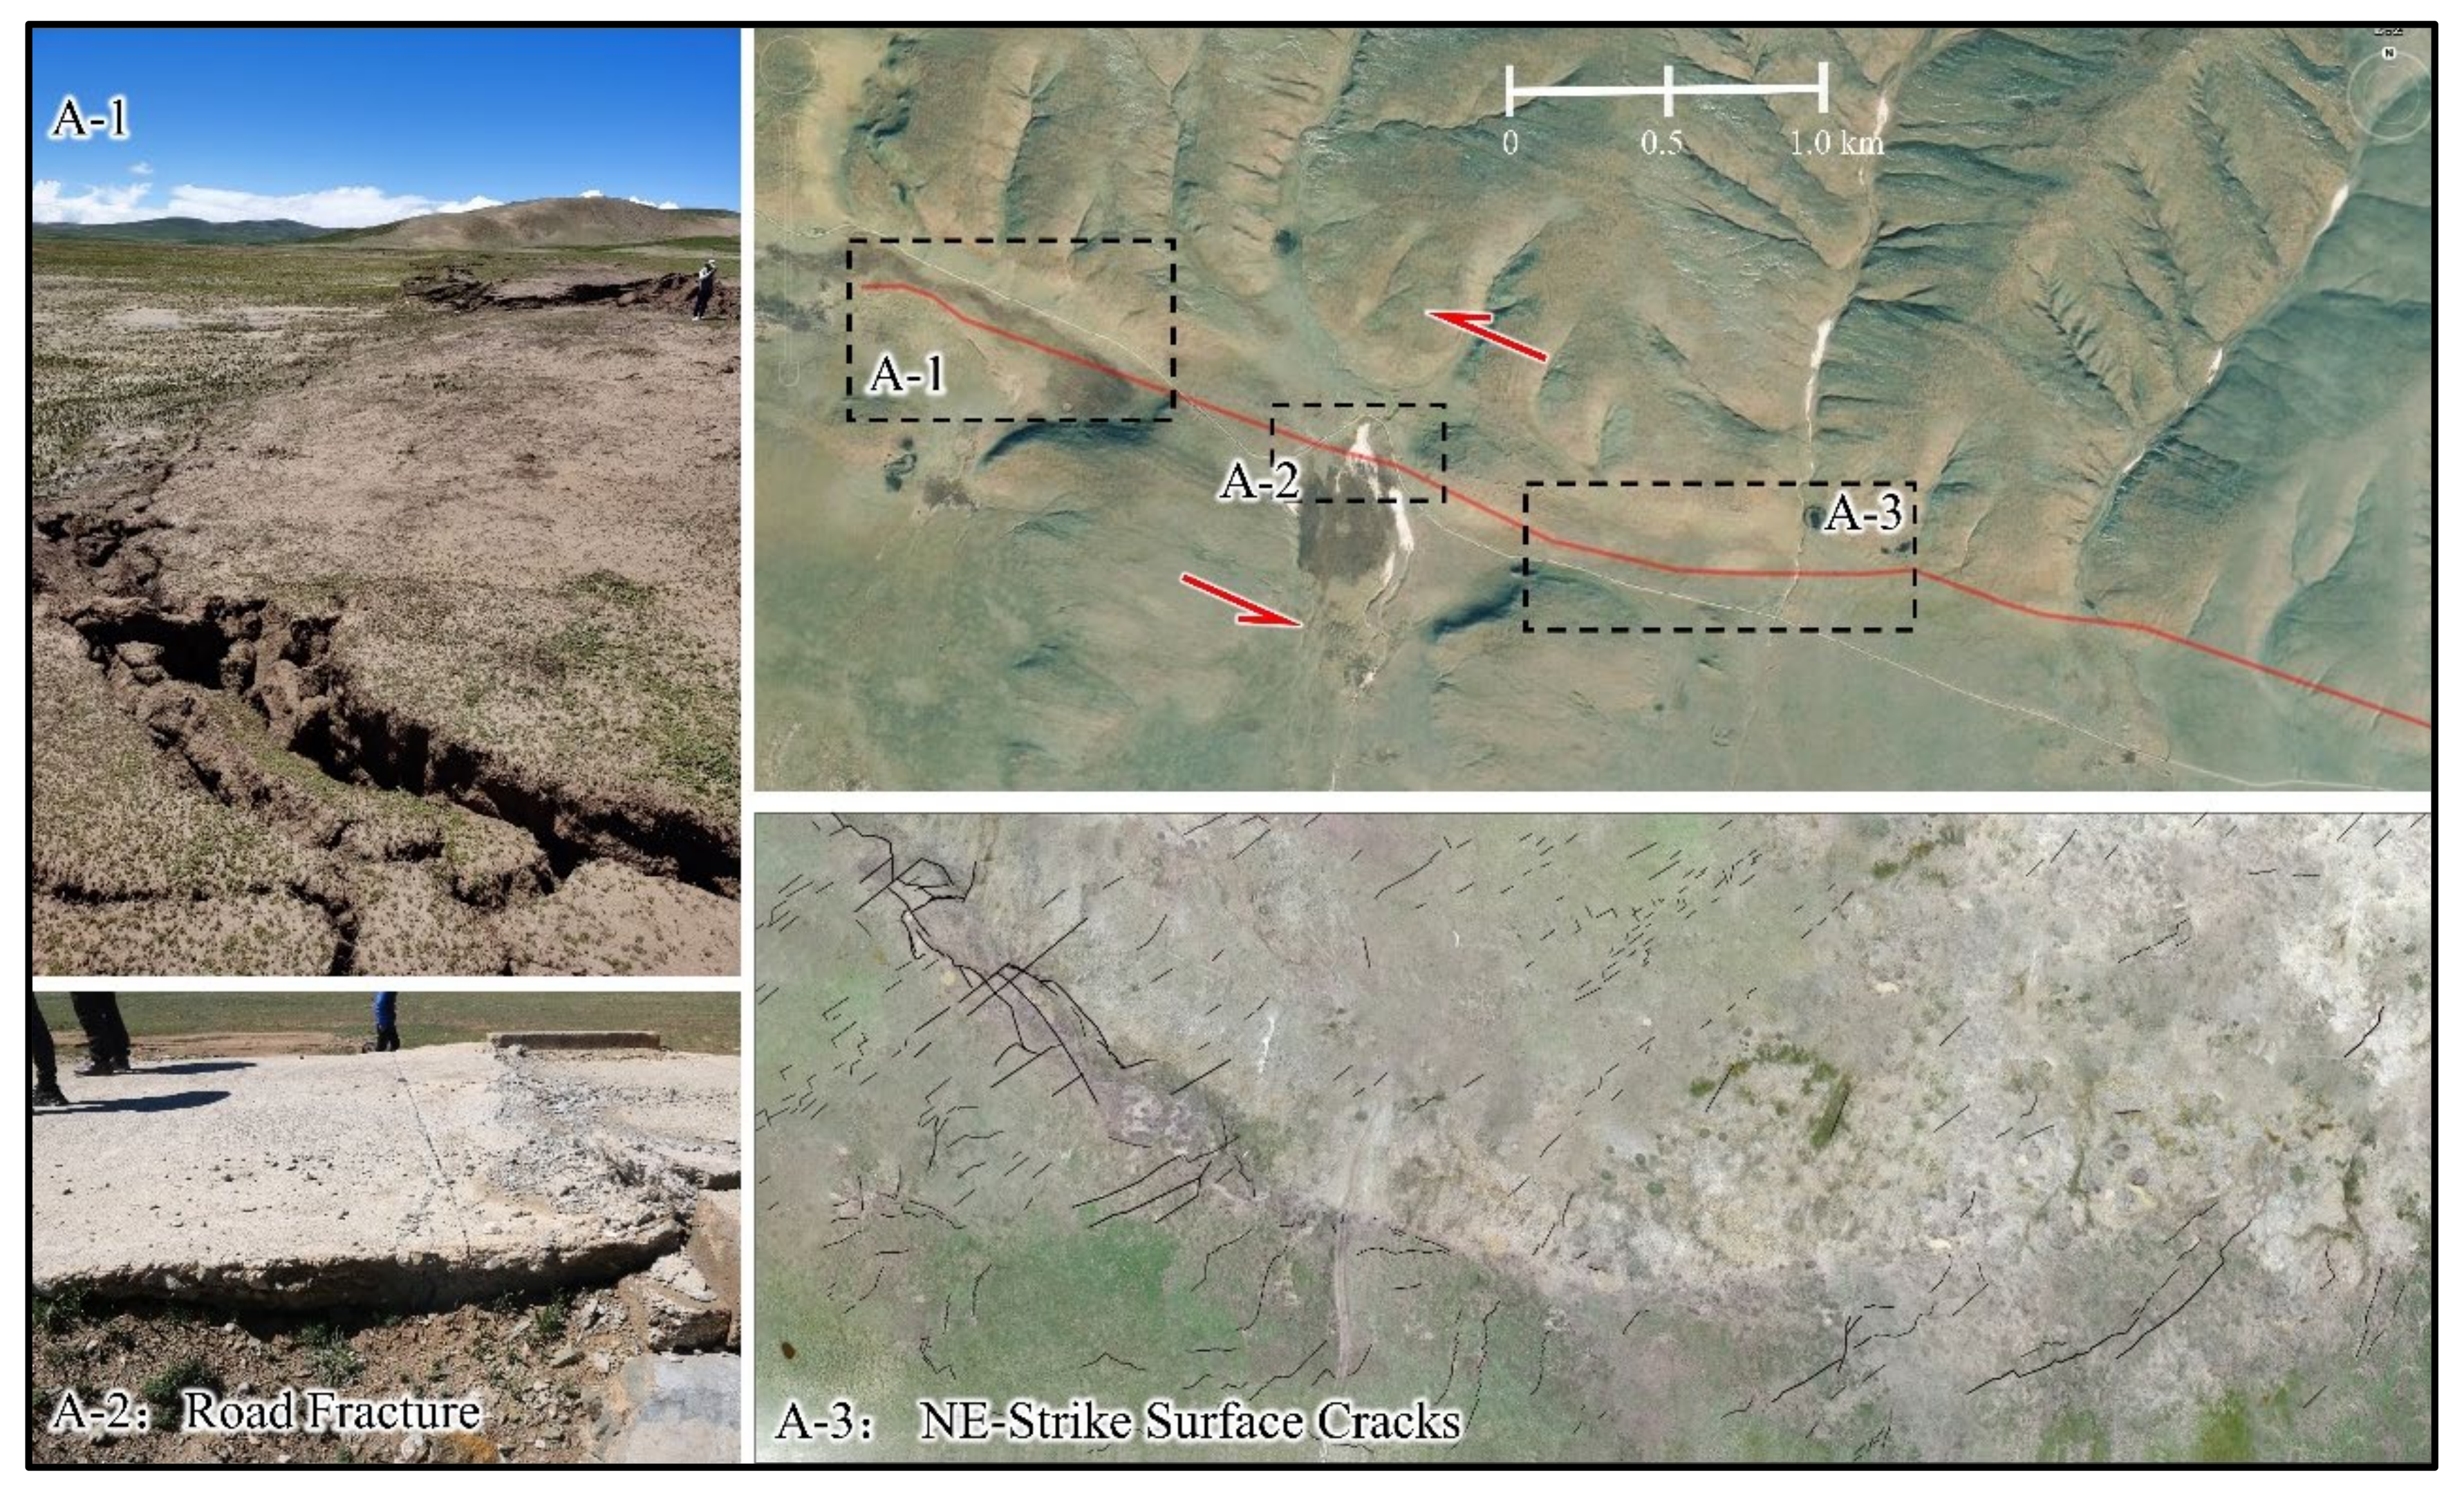
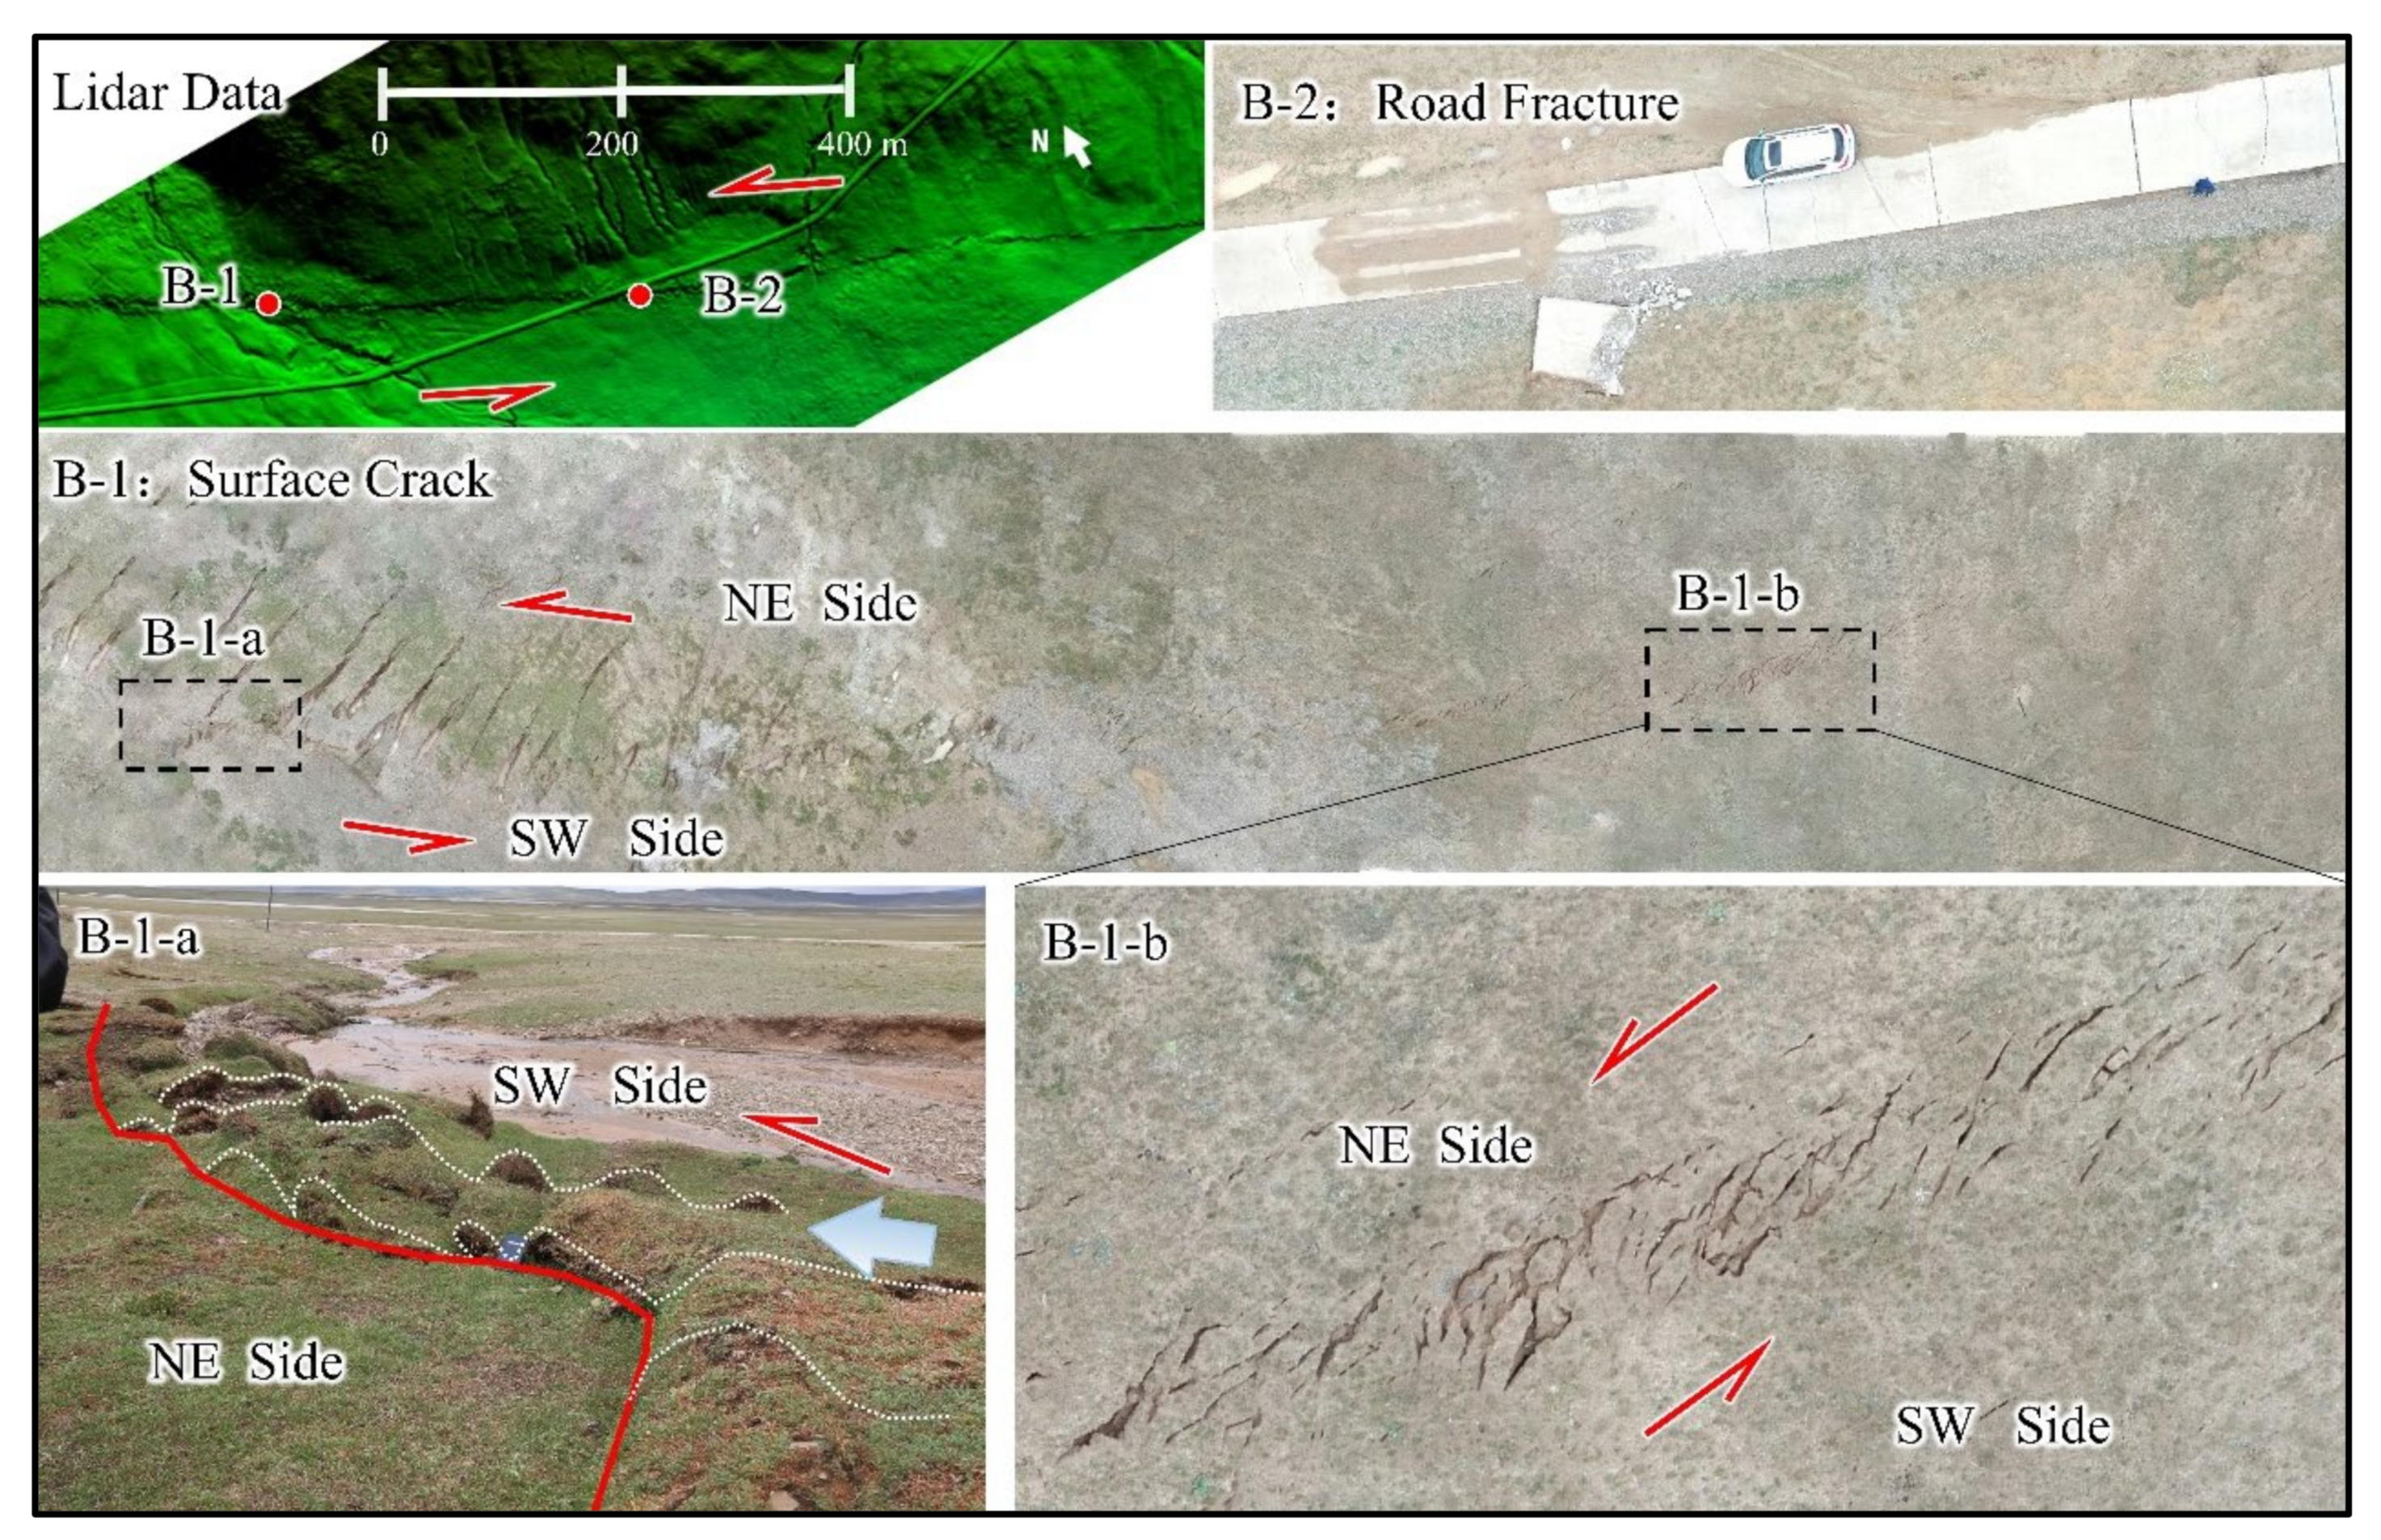
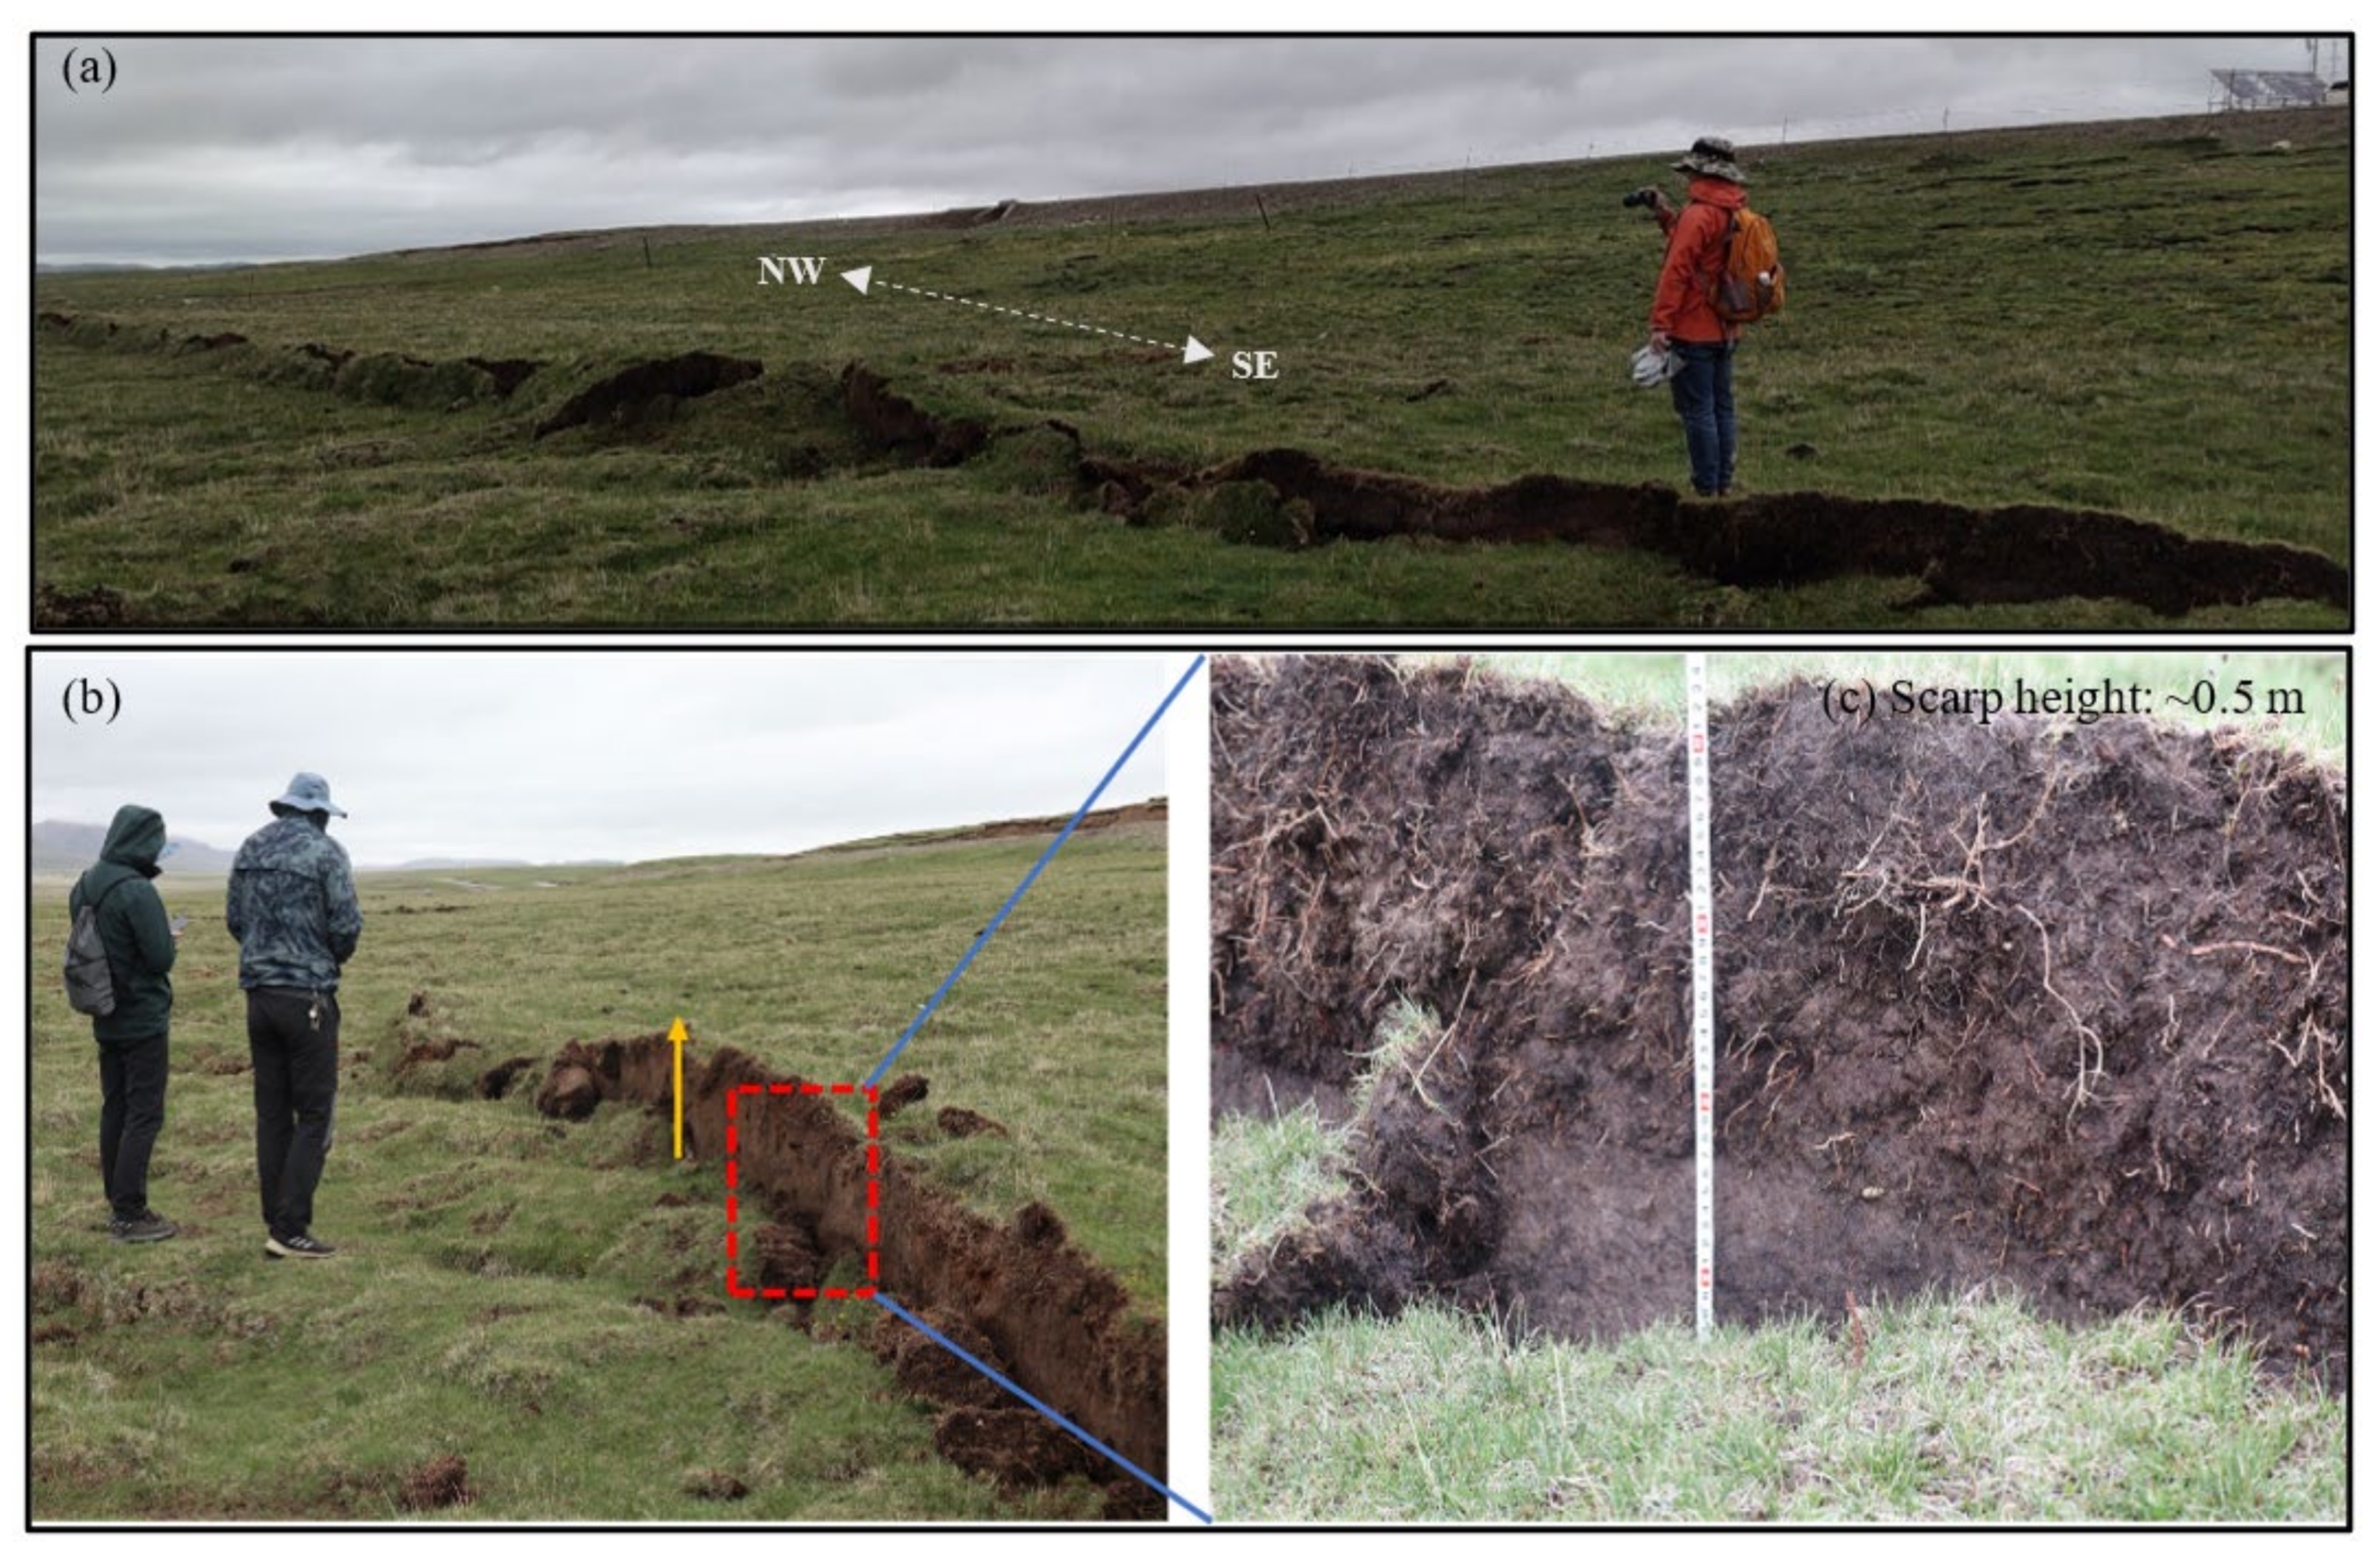
4.2. Fault Trace Detection and Field Investigation

Both the ascending and descending satellite orbital tracks’ InSAR observations lost the coherence in the near-fault zone (the masked near-fault areas in Figure 3), which would hinder the detection of the fault surface trace. To obtain the near-fault surface deformation, we performed the POT based on the Sentinel-1 SAR images [49]. As indicated in Figure 4, the POT method successfully extracts the surface deformation along the seismogenic fault, and two faults (F1 and F2) could be detected from the POT results. Figure 4 indicates that the F2 should partially control the surface motion in the adjacent area. However, the POT-derived fault surface trace was characterized by non-negligible uncertainty due to the low resolution and accuracy of the POT deformation.
The Lidar DEM has a higher spatial resolution than the POT result, and it could effectively distinguish the location of the fault in the near-fault zone. Accordingly, we corrected the location of the POT-derived fault based on the UAV-Lidar DEM data (Figure 6). In addition, the ALOS-2 InSAR and Sentinel-1 POT data were used to detect the surface trace of the seismogenic fault in the segment without UAV-Lidar DEM. Furthermore, the field investigation was also conducted to verify the reliability of the detected fault surface trace. Field investigation shows that the surface rupture due to the 2021 Maduo earthquake is mainly located along the N85°W strike [13]. The western end of the surface rupture is located near the Eling Lake, and the eastern end is near the Changmahe County [9,13,30]. The surface rupture belt has a length of 151 km, it is mainly located in the high mountainous areas with elevations of 4200–4600 m and is characterized by a significant sinistral strike-slip motion in most segments of the seismogenic fault. The main surface rupture styles include discontinuous shear fissures, tension fissures, tensile shear fissures, en échelon cracks, reverse fault ridges, and extrusion bulges (ridges) and surface rifts (Figure 7 and Figure 8, and Figure S3). The width of the rupture belt ranges from a few meters to ~100 m, and most rupture belt width are concentrated in 30–50 m. In addition, the field investigation shows that the 2021 Maduo earthquake caused severe damage to the Yematan and Changmahe bridges (Figure S4) in the northwest and southeast segments of the seismogenic fault. Moreover, more than 140 houses collapsed in the Changmahe Village, which is located in the middle between the two main faults (Figure S5).

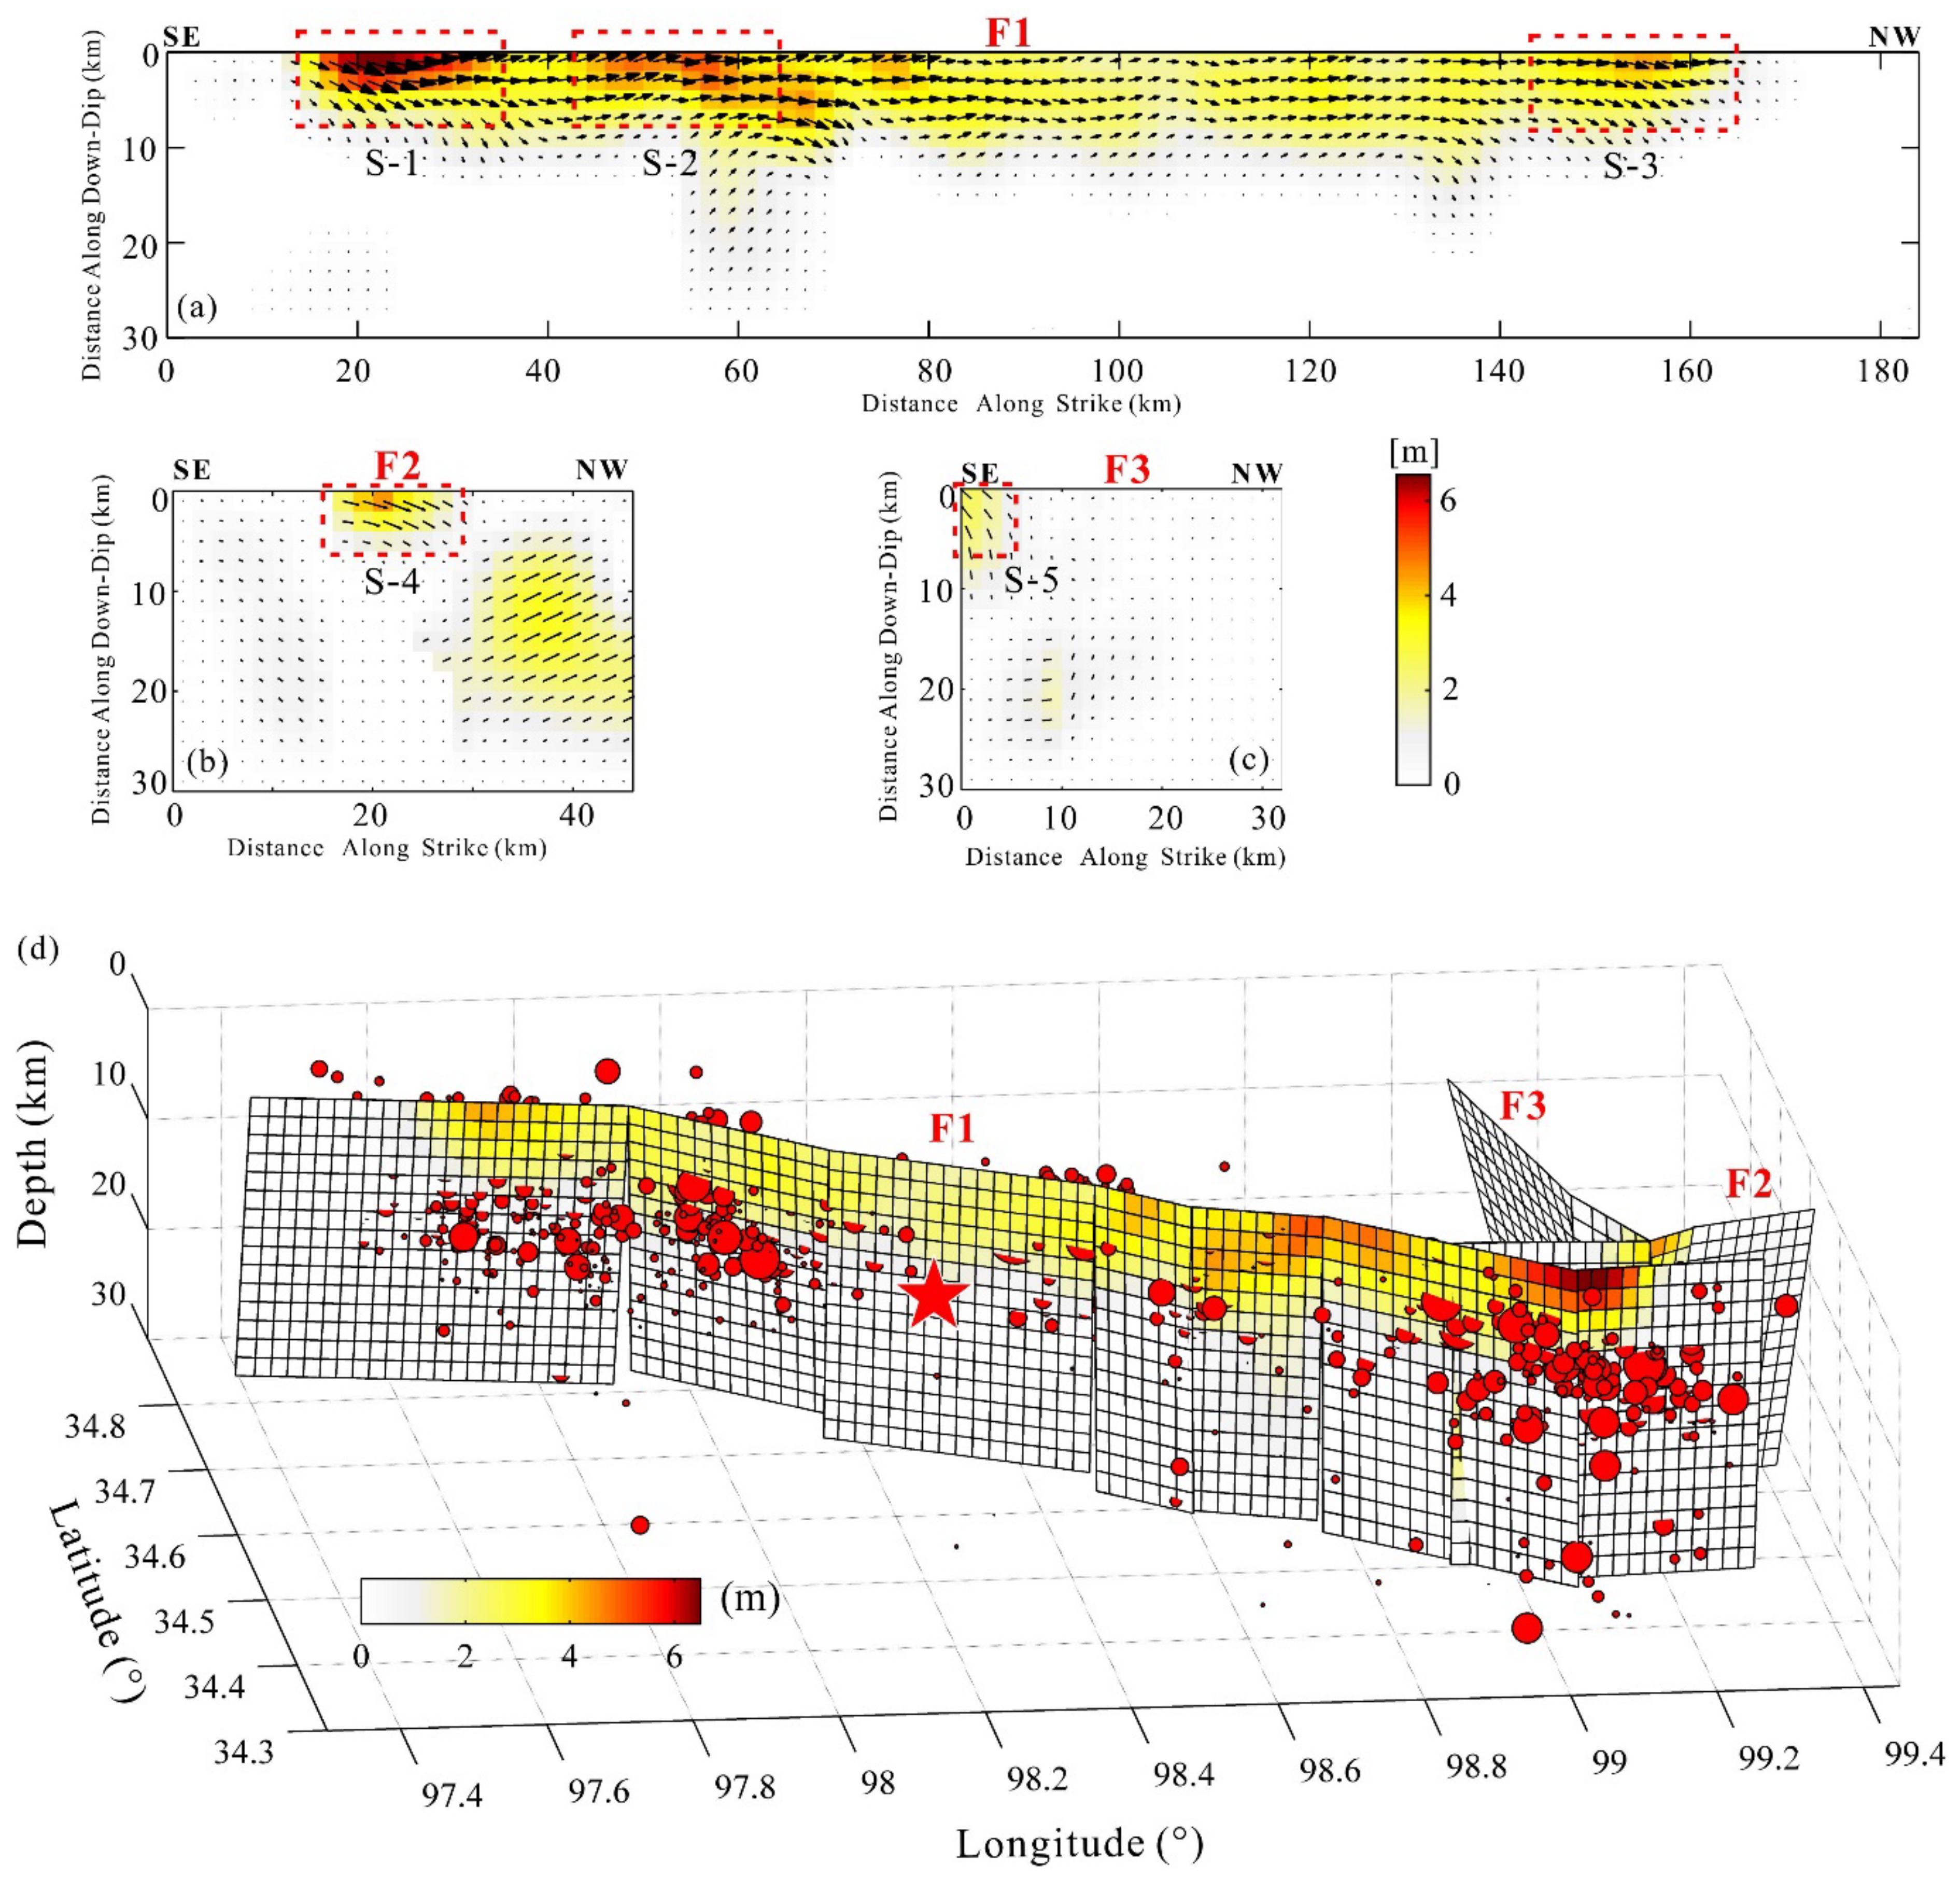
4.3. The Estimated Faulting Model of the 2021 Maduo Earthquake

Figure 9 presents the estimated best-fitting co-seismic faulting model of the 2021 Maduo earthquake. Three distinguished high-slip areas following the main seismogenic fault (F1) were observed. The high-slip areas of S-1 and S-2 were located at the southeast of the hypocenter, and S-3 was located at the northwest. S-3 was located along the strike distance of 140–160 km and along the down-dip distance of 0–5 km, with a maximal slip magnitude of ~4.0 m. In addition, the fault slip was dominated by the sinistral slip with the slight normal rupture. S-2 was located at 45–65 km southeast of the hypocenter with the peak slip of ~4.3 m. The fault slip in this segment was controlled by an almost pure sinistral slip. S-1 was the largest high-slip area of the 2021 Maduo earthquake, located at the southeast end of the main seismogenic fault, which was along the strike distance of 15–37 km and the down-dip distance of 0–10 km. In this area, over 63% seismic moment was released. The maximal slip magnitude in this area was ~6.2 m, and the area was composed of significant sinistral slip and slight dip-slip as well. The estimated seismogenic faulting model above was well-consistent with the results of He et al. [30] and Chen et al. [1] in the slip magnitude and distribution. Furthermore, our best-fitting faulting model found more fault rupture in shallow crust compared with the results of Liu et al. [3] and Zhao et al. [4]. It was hypothesized that the mentioned discrepancy should be mainly attributed to different data sources and fault geometry models, especially in the southeast segment of the seismogenic fault.
In addition, Wang et al. [5] estimated the fault rupture model based on the far-field P and SH waveform and the Sentinel-1 ascending orbital track InSAR deformation. It was found that the 2021 Maduo earthquake should be controlled by a significant sinistral strike-slip rupture and a slight normal dip-slip component, which is consistent with our best-fitting result (Figure 9). The estimated peak slip by Wang et al. [5] is 6.82 m, larger than our result of 6.2 m. In addition, the faulting model of Wang et al. [5] suggests that the main shock has caused the deep fault rupture (below 15 km), especially in the southeast segment of the seismogenic fault. However, the deep slip is not significant in our best-fitting faulting model and other results derived from InSAR and/or GPS observations [1,2,3,4]. In addition, it is hypothesized that the above-mentioned difference may be caused by the different data sources, especially for the seismic waveform data adopted by Wang et al. [5]. Moreover, only the Sentinel-1 ascending orbital track InSAR deformation has been used in the study of Wang et al. [5], however, the Sentinel-1 ascending and descending orbital tracks and the ALOS-2 descending orbital track InSAR data have been adopted in several other studies. Then, the different adopted surface deformation datasets would contribute to the above-mentioned differences.
A slip asperity area of S-4 was found in the F2 seismogenic fault, and it was located at the strike distance of 18–30 km and along the down-dip distance of 0–5 km. The slip in S-4 was composed by a sinistral slip and reverse motion with a similar slip magnitude. Notably, the magnitude and area of the slip concentration (S-4) on the F2 of our result was smaller than the results of the previous studies [2,3,4]. The above-mentioned differences may be caused by the adjacent Changmahe fault (F3), which was added for estimating the faulting of the 2021 Maduo earthquake. The Changmahe fault was partially responsible for the observed surface deformation in the southeast of the seismic zone, causing the decrease of the slip magnitude and area on the F2. The two mentioned slip asperities (S3 and S4) caused sharp surface displacement in the southeast end of the seismogenic fault [13], further leading to the InSAR de-correlation in the southeast end of the seismic zone.
The predicted InSAR deformation (Figure 3) was calculated based on the inferred best-fitting faulting model. It is obvious that the predicted data shared a similar deformation magnitude and distribution with the observed data presented in Figure 3. As indicated by the residual distributions, some residuals could be identified in the near-fault zone, which should be attributed to the difference between the applied planar fault model and the possible curved fault surface of the Maduo event. Moreover, InSAR phase unwrapped error and atmospheric and ionosphere delay errors might contribute to the residuals in the near-fault zone. Furthermore, as revealed by the quantitative comparison between the observed and predicted deformations, over 97.2% ascending Sentinel-1 satellite orbital track, 95.4% descending Sentinel-1 satellite orbital track, and 96.8% descending ALOS-2 satellite track data could be explained using the preferred faulting model. It suggested that the estimated co-seismic faulting model could be reliable for revealing the fault rupture of the 2021 Mw 7.3 Maduo earthquake.

5. Discussion

5.1. Bifurcation of Fault Slip in the Southeast End of the Seismic Zone

Bifurcated fault rupture (F1 and F2) in the southeast end of the seismogenic fault is an important feature of the 2021 Maduo earthquake [2,9,25]. The above-mentioned fault slip pattern (horsetail at the terminate of a strike-slip fault) has been found in the studies of other moderate and strong earthquakes around the world [51,52,53]. Besides, a similar bifurcating co-seismic fault rupture had also been found in the 2001 Kokoxili Mw 7.8 earthquake [54], which occurred along the west segment of the Kunlun fault. However, the above-mentioned bifurcating faulting has not been reported in the other historical earthquakes, including the 2008 Wenchuan Mw 7.8 earthquake [55], 2011 Yushu Mw 7.0 earthquake [56], and the 2017 Jiuzhaigou Mw 7.0 earthquake [57], which occurred in the boundary of the Bayan Har block.
Jin and Fialko [51] proposed that the bifurcated faulting may play an important role to stop the propagation of fault rupture on the seismogenic fault. However, it is worth noting that the southeast end of the seismogenic fault reached the boundary of the Anemaqen restraining bend associated with the left-lateral motion near the Maqin-Maqu segment of the Kulun fault (Figure 1), and some faults (e.g., Maduo-Gande fault, Changmahe fault) cutting across the seismogenic fault have been developed in this zone, and these faults could also provide help for terminating the fault dynamic rupture of the 2021 Maduo earthquake [9].

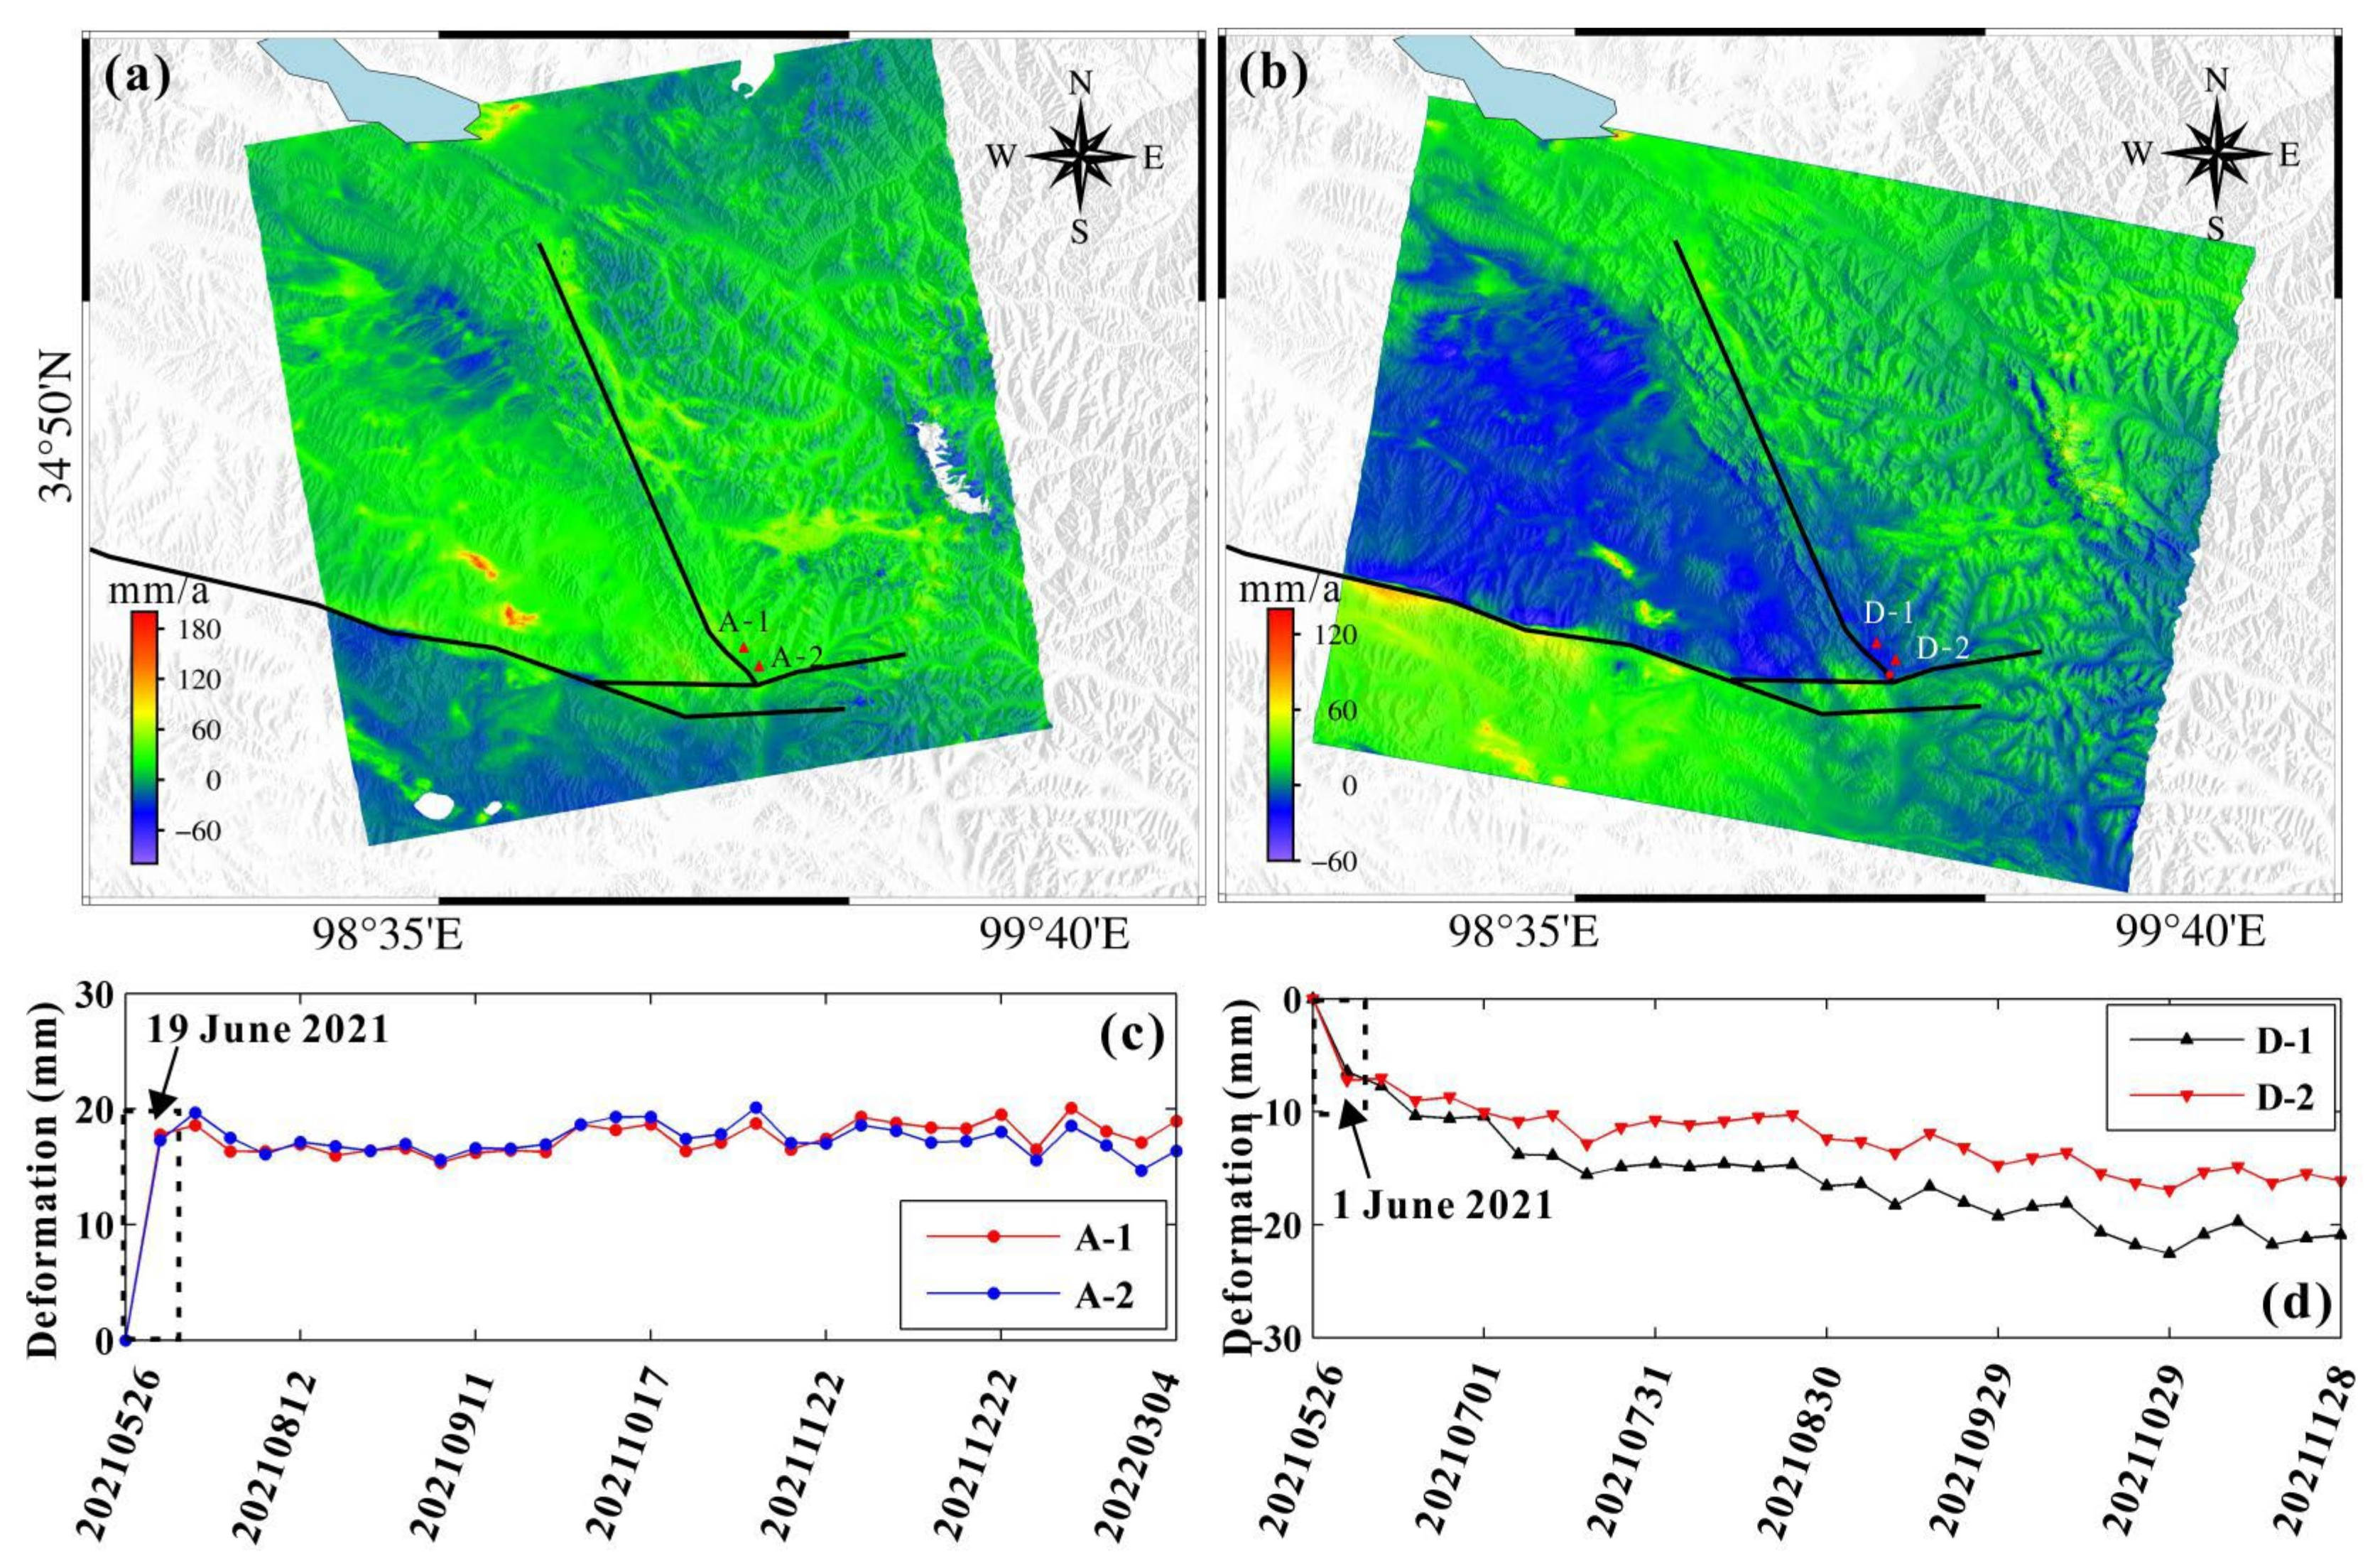
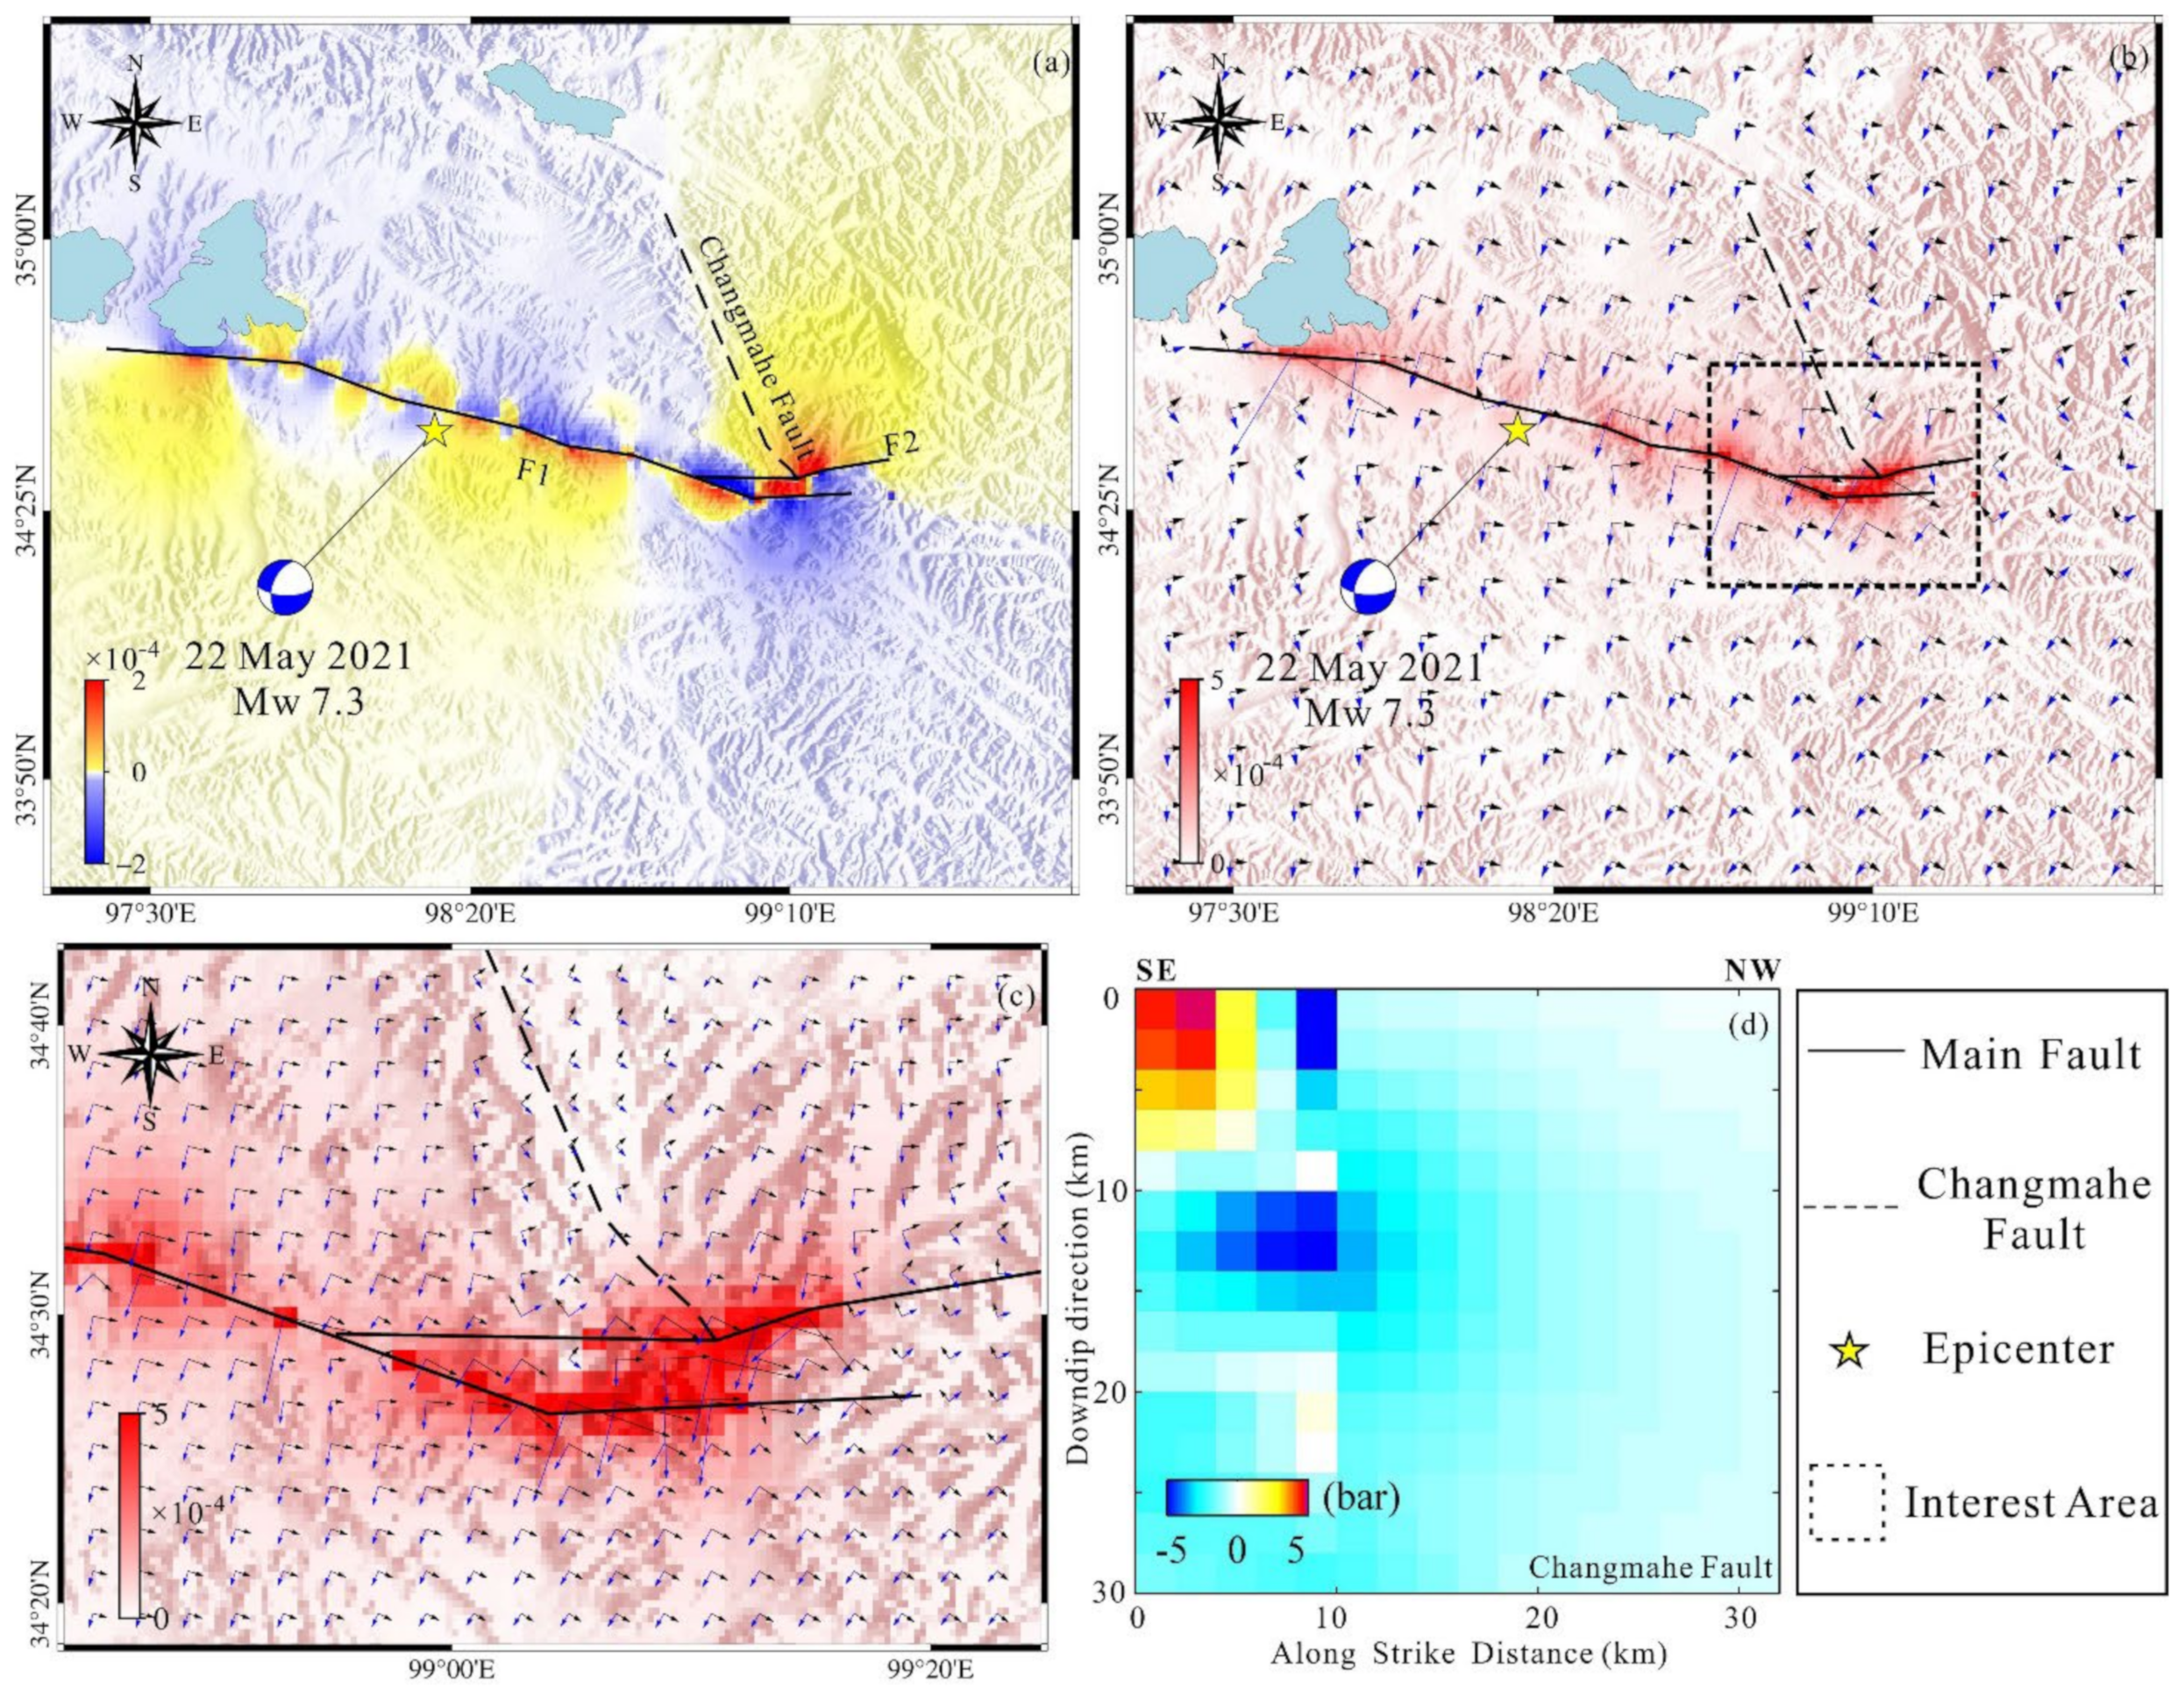
5.2. Post-Seismic Deformation and Triggered Aseismic Slip along the Changmahe Fault

The Changmahe fault is located in the central segment of the Xizangdagou-Changmahe fault, which is the southwestern boundary of the Anemaqen restraining bend area [9,10]. The previous studies have not reported the motion of this fault due to the 2021 Maduo earthquake [1,2,3,4,25]. Both the ascending and descending orbital tracks’ InSAR deformation with early post-seismic SAR images captured by the Sentinel-1 satellite also suggest that there was not a significant deformation difference between both sides of the Changmahe fault (Figure 5a,c) after the main shock. It suggests that the Changmahe fault was not ruptured during the co-seismic process of the 2021 Maduo earthquake.
However, the InSAR deformation observed by Sentinel-1 (Figure 5b) and ALOS-2 (Figure 5d) satellites with later post-seismic SAR images indicates that there were visible fringe discontinuities along the Changmahe fault. In addition, the field investigation (Figure 10) evidenced the Changmahe fault motion [9], where the scarp of the fault could reach to a 0.5 m height. According to Figure 9, a non-negligible fault slip (within the red dashed rectangle, S-5) was concentrated at the south end (close to the F2) of the Changmahe fault. Furthermore, the inferred fault slip of the Changmahe fault was dominated by dip-slip motion, and the maximal reverse slip magnitude was ~0.6 m, occurring near the ground surface, as verified by the field investigation (Figure 10).
It could be found from Figure 5f that significant surface deformation (within the red dashed ellipse in Figure 5f) along the Changmahe fault could be detected from the deformation field generated by the SAR images captured on 26 May and 1 June 2021, and the deformation signal disappeared after 1 June (Figure 5g). Furthermore, the time-series post-seismic surface deformation (Figure 11) suggests that a significant deformation jump (within the black dashed rectangle in Figure 11c,d) occurred between 26 May and 1 June 2021, which differs from the long-term post-seismic deformation rate after 1 June 2021, indicating that the sharp deformation within this period may be caused by a sudden short-term slip on the Changmahe fault. In addition, the geohazard investigation in the seismic zone after the 2021 Maduo earthquake found that only one landslide was triggered by the main shock of the 2021 Maduo earthquake [58]. This landslide was located in Xueshan County, which is far away from the Changmahe fault. In addition, no landslides had been found along the Changmehe fault in our field investigation. Therefore, it is reasonably excluded that the detected surface deformation should be caused by the landslide.
It is obvious that both the DInSAR and time-series InSAR deformations suggest that the Changmahe fault has been triggered after the main shock, and the triggered slip along the Changmahe fault should occur between 26 May and 1 June. Furthermore, it could be found from Figure 2 and Figure S6 that the aftershocks mainly occurred along the two main faults of F1 and F2, and no aftershocks occurred around the Changmahe fault [28] between 26 May and 1 June. It suggests that the detected abnormal surface deformation should not be the result of the aftershocks. Therefore, it is suspected that the Changmahe fault motion should be the aseismic slip triggered by the stress transfer due to the main shock of the 2021 Maduo earthquake.
The surface dilation and shear strain change (Figure 12) due to the main shock were calculated based on the estimated co-seismic faulting model (F1 and F2 shown in Figure 9) of the 2021 Maduo earthquake. According to Figure 12, the Changmahe fault was located in the dilatation area, indicating that normal stress would be reduced by the main shock of the Maduo event. Moreover, it would advance the slip of the Changmahe fault. Furthermore, the maximum shear strain change (Figure 12) was ~4.8 × 10⁻⁴ in the south end of the Changmahe fault, and the direction of maximum shear strain change (Figure 12) in this zone was ~119.4°, which was also approximate with ~130° of the strike angle of the southeast segment of the Changmahe fault. In addition, the Coulomb failure stress (CFS) change of the Changmahe fault (Figure 12d) was calculated based on the faulting of F1 and F2 (Figure 9). It can be seen from Figure 12d that a significant positive CFS change was mainly located in the south end of the Changmahe fault, with a depth of 0–5 km, suggesting a good consistency with the high-slip area (S-5) on the Changmahe fault (Figure 8). In addition, the average CFS change in the south end of the Changmahe fault was 3–5 bar, significantly larger than the trigger threshold of 0.1 bar [59,60]. Briefly, the co-seismic fault rupture of the 2021 Maduo earthquake decreased the normal stress and significantly increased the CFS on the Changmahe fault, probably causing the aseismic slip on the fault patches of S5.
The strain rate derived from inter-seismic GPS and InSAR observations (captured before the 2021 Maduo earthquake) also shows that the strain rate in the Anemaqen restraining bend area is significantly higher than the other areas [23,61]. Zhao et al. [61] proposed that these fault segments around the Anemaqen restraining bend may have the potential for large earthquakes due to the high locking depth and fast slip rate. Furthermore, the aseismic slip found on the Changmahe fault suggests that the 2021 Maduo earthquake may have further increased the rupture risk of the boundary faults of the Anemaqen restraining bend area (Figure 1), and more attention should be paid to them in the future.

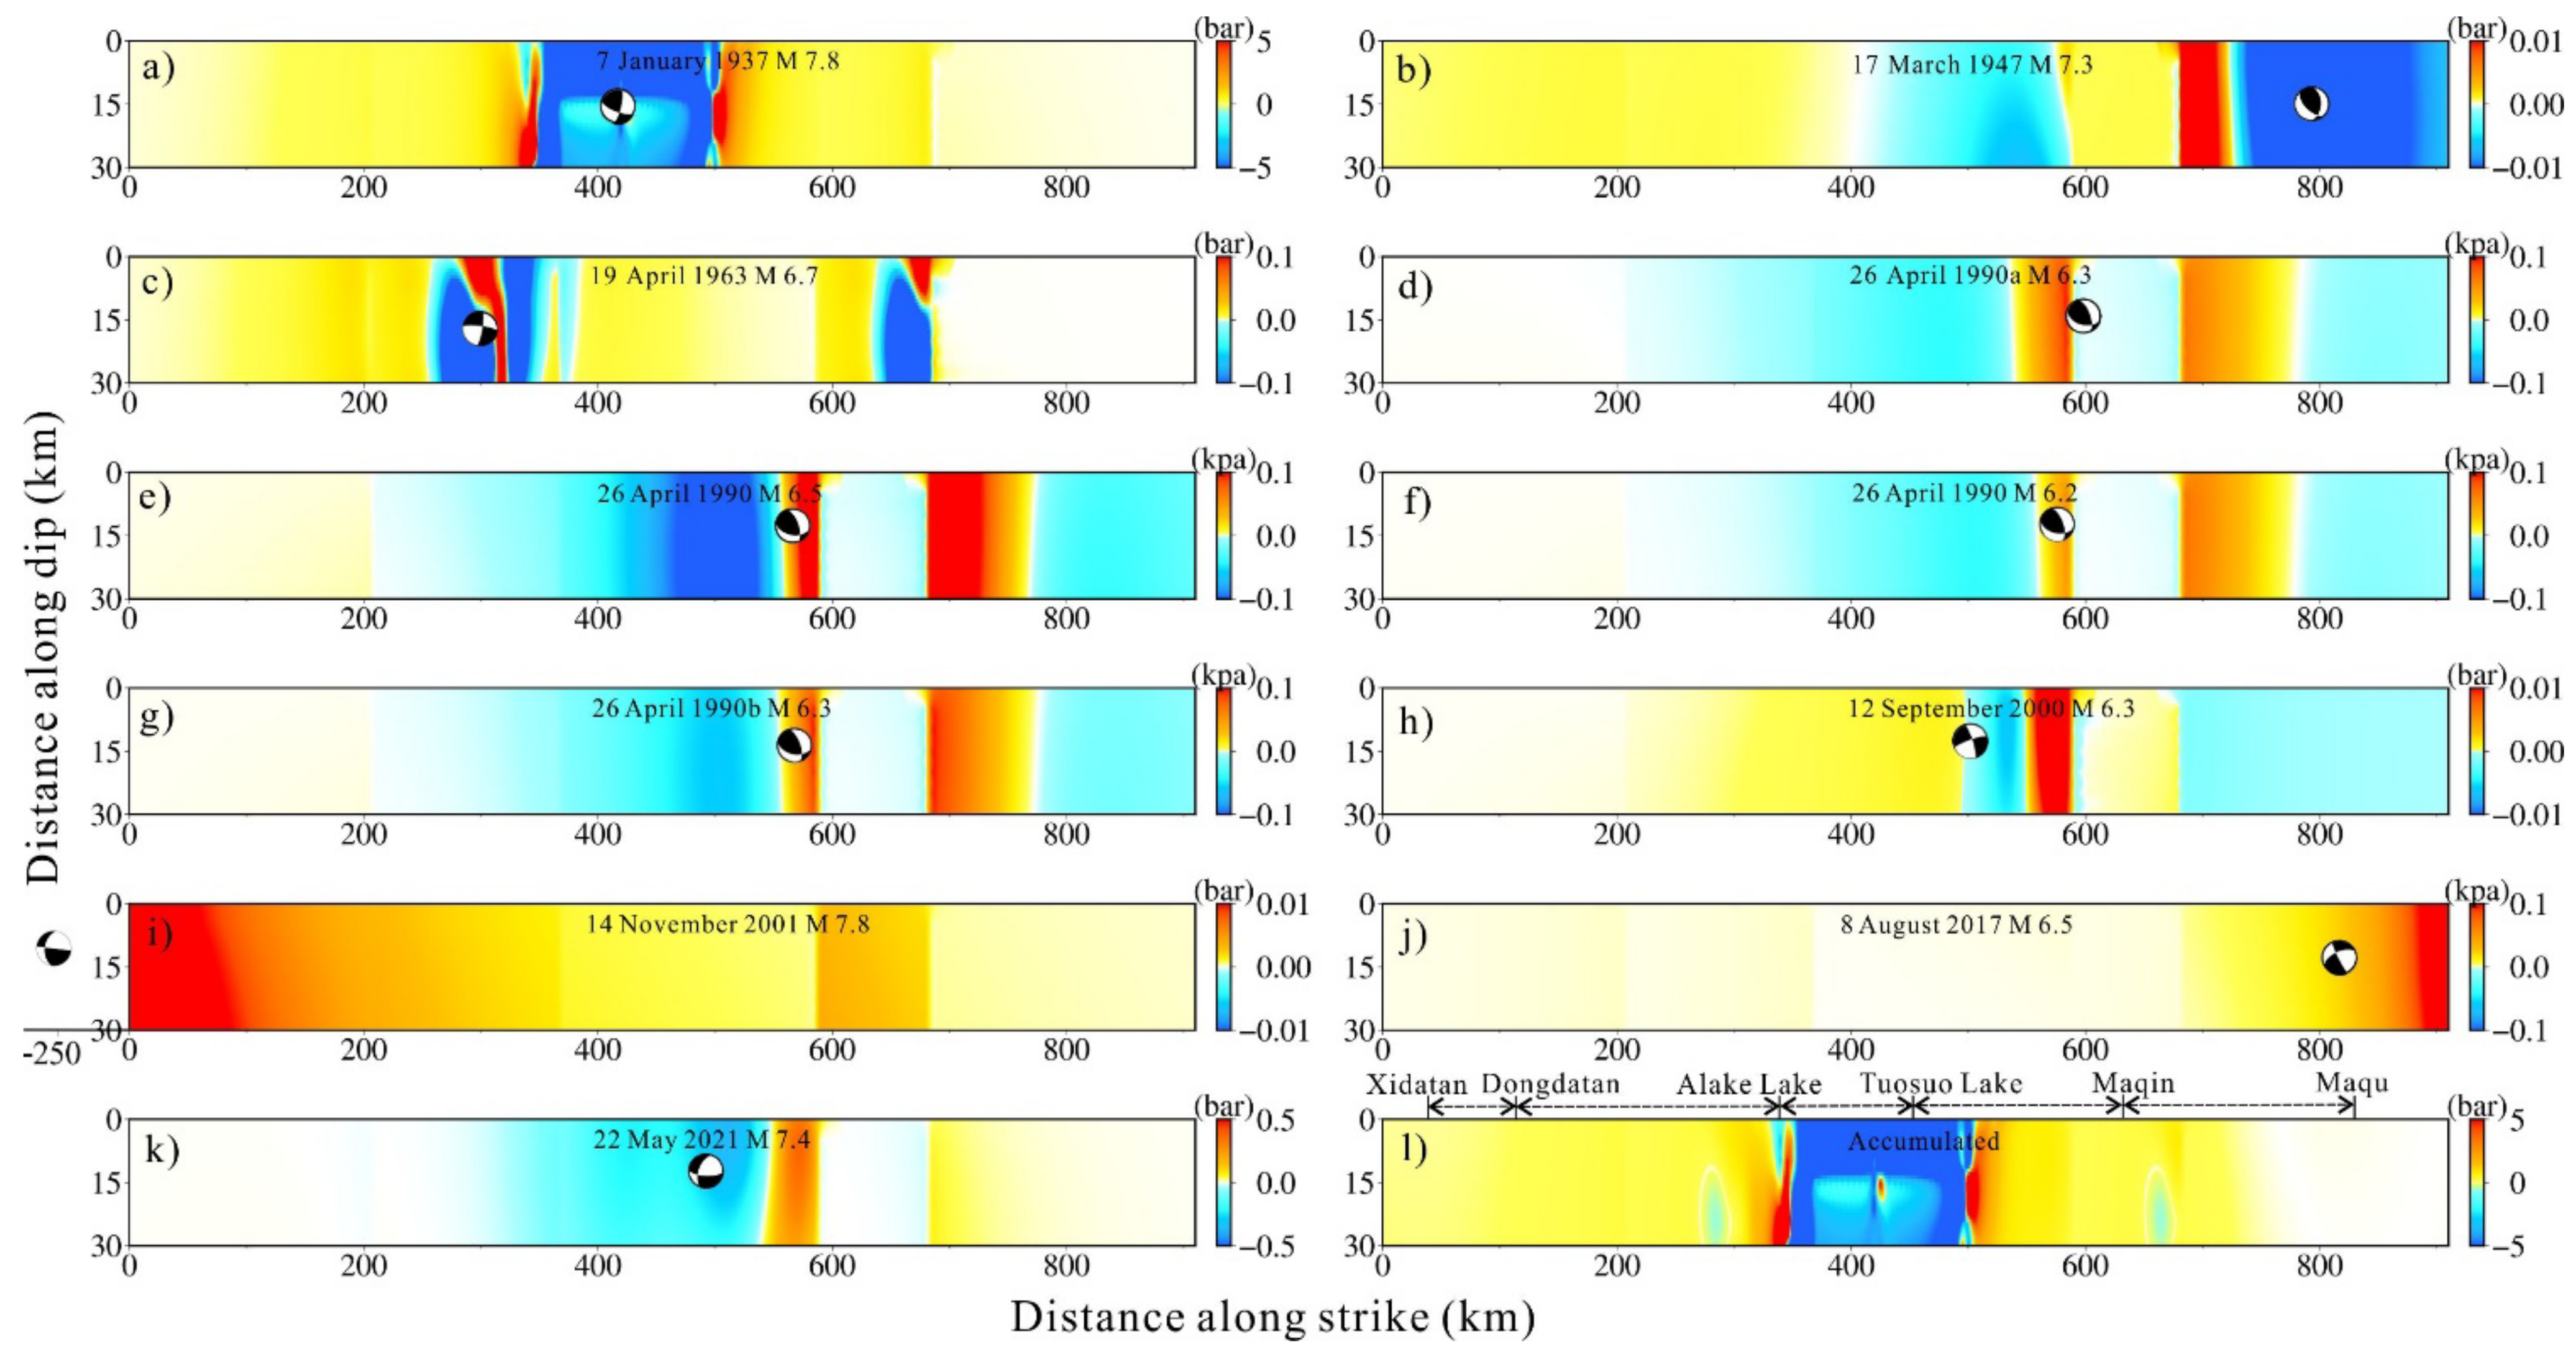
5.3. Coulomb Stress Change of the Kunlun Fault due to the Maduo Earthquake and Historical Events

The Kunlun fault is a very important boundary fault of the Bayan Har block. Lots of moderate and strong earthquakes (e.g., the 1963 Mw 6.7 earthquake, 1937 Mw 7.8 earthquake, and 2001 Mw 7.8 earthquake) occurred along the Kunlun fault [20,21]. The mentioned historical earthquakes would change the stress status of the Kunlun fault and increase or decrease the potential of the future earthquake of some segments of the Kunlun fault. For instance, according to an existing study, the Maqin and Maqu segments of the Kunlun fault might have a high risk of earthquakes after the 2001 Mw 7.8 event [23]. Thus, it is necessary to carry out the research of the earthquake risk along the Kunlun fault after the 2021 Maduo earthquake.
The Coulomb failure stress change has been widely used for assessing the earthquake potential in previous studies [34,39,41,42,43]. Here, the CFS change on the Kunlun fault (Figure 13) due to the historical earthquakes (Table S2) with a magnitude larger than 6.0 and that occurred 150 km within the Kunlun fault were calculated. According to Figure 13a, the 1937 M 7.8 earthquake significantly changed the CFS on the Kunlun fault. The CFS decreased 3–5 bar in the Tuosuo Lake segment, so there were no moderate and strong earthquakes in this segment over the past ~80 years. In addition, the 1937 M 7.8 earthquake significantly increased the CFS (1–5 bar) in the Xidatan-Alake and Maqin-Maqu segments, which would raise the risk of earthquakes in the mentioned segments. Furthermore, the other historical earthquakes, including the 2001 M 7.8 earthquake, caused insignificant CFS change (less than 0.1 bar) on the Kunlun fault, and it would not remarkably affect the risk of earthquakes along the Kunlun fault.
Figure 13k shows that the 2021 Mw 7.3 Maduo earthquake caused a significantly larger CFS change than the other historical earthquakes, except the 1937 M 7.8 earthquake, on the Kunlun fault. It could be found from that the 2021 Mw 7.3 Maduo earthquake decreased the CFS in the Dongdatan-Tuosuo Lake and Maqin segments and increased the CFS change in the Maqu segment. It suggests that the 2021 Maduo earthquake further decreased the risk of future earthquakes in the Tuosuo Lake segment of the Kunlun fault. Figure 13l shows that the accumulated CFS change on the Kunlun fault was mainly controlled by the 1937 M 7.8 earthquake, and the other historical earthquakes, including the 2021 Maduo earthquake, slightly changed the local CFS along the Kunlun fault. Overall, the historical earthquakes caused a non-negligible CFS increase in the Xidatan-Alake Lake and Maqin segments, indicating a high risk of future earthquakes. However, the accumulated CFS change is about −3.0 bar on the Tuosuo Lake segment, demonstrating a low risk of moderate and strong earthquakes. The accumulated CFS change in the Maqu segment was close to zero, suggesting that the seismic activity was primarily controlled by the inter-seismic crust motion in the Maqu segment.

6. Conclusions

Comprehensive studies of the surface displacement, fault rupture trace, seismogenic mechanism, triggered aseismic slip, and future seismic risk along the Kunlun fault were performed based on the multi-source data. Firstly, the SAR-POT, Lidar, and field investigation were used to detect and verify the fault surface trace of the 2021 Maduo earthquake. It was found that the 2021 Maduo earthquake caused significant surface rupture along the seismogenic fault. Then, the InSAR deformation field was used to estimate the faulting model, and the result suggests that a bifurcated strike-slip rupture was responsible for the 2021 Maduo Mw 7.3 earthquake. The two seismogenic faults shared a similar rupture mechanism with the Kunlun fault characterized by a high dip angle and predominant sinistral slip and slight dip-slip. Furthermore, the post-seismic InSAR deformation, dilatation, shear strain, field investigation, aftershock distribution, and CFS change indicate that the main shock has triggered the aseismic slip on the Changmahe fault. We should pay more attention to the faults of the Anemaqen restraining area in the future. The CFS change attributed to the historical earthquakes suggests that the CFS change on the Kunlun fault was primarily affected by the 1937 M 7.8 earthquake. The accumulated CFS change indicates that the Xidatan-Alake Lake and Maqin segments had a higher risk of future earthquakes than the other segments, and the Tuosuo Lake segment was safer due to the significant negative CFS change attributed to the 1937 M 7.8 earthquake and the 2021 Maduo earthquake.
In addition, as for the approaches adopted in this study, the InSAR technique could be used to measure co-seismic surface deformation, however, interferometric de-correlation, especially in the near-fault zone, makes it difficult to detect the seismogenic fault surface trace based only the InSAR observation for some moderate and strong earthquakes. The SAR-POT technique could be used to extract the near-fault surface displacements; however, the low accuracy and space resolution would cause a high uncertainty of the extracted fault surface trace. The Lidar technique could generate the digital elevation model with a high spatial resolution, which could provide help to correct the location of the fault surface trace extracted from InSAR and/or SAR-POT data. However, the high cost and limited power of the UAV means that it is only feasible to obtain the DEM in near-fault and/or important zones along the seismogenic fault. Finally, the field investigation is an important approach to find the co-seismic surface rupture and verify the reliability of remote sensing data. However, it does not work well in the segment without significant fault outcrop. In conclusion, the comprehensive application of these approaches could provide a great help to understand the seismogenic mechanism of an earthquake event.

Supplementary Materials

The following supporting information can be downloaded at: https://0-www-mdpi-com.brum.beds.ac.uk/article/10.3390/rs14225859/s1, Figure S1: The flowchart of Lidar observation and data processing; Figure S2: The estimated 3D surface deformation field of the 2021 Maduo earthquake; Figure S3: The distinguished surface cracks along the seismogenic fault from UAV-Lidar DEM and optical images; Figure S4: The destroyed Yematan and Changmahe bridges by the 2021 Maduo earthquake; Figure S5: House collapse of the Changmahe village in the southeast of the seismogenic fault of the 2021 Maduo earthquake; Figure S6: Aftershock distribution of the 2021 Mw 7.3 Maduo earthquake; Table S1: Parameters of the InSAR pairs associated with the 2021 Maduo earthquake; Table S2: Focal mechanism of the historical earthquakes with magnitude larger than M 6.0 and occurred 150 km within the East-Kunlun fault.

Author Contributions

Conceptualization, Y.-H.Y.; methodology, Y.-H.Y.; software, Y.-J.Z.; validation, Q.C.; formal analysis, H.-L.L.; investigation, X.-J.D. and Y.-S.W.; resources, Y.-H.Y.; data curation, X.-J.D.; writing—original draft preparation, Y.-H.Y.; writing—review and editing, J.-C.H.; visualization, H.-L.L.; supervision, Q.X. and Y.-S.W.; project administration, Q.X; funding acquisition, Q.X and Y.-H.Y. All authors have read and agreed to the published version of the manuscript.

Funding

This research is supported by the Hebei Key Laboratory of Earthquake Dynamics (FZ212102), the Fund for Creative Research Groups of China (Grant No. 41521002), the State Key Laboratory of Geohazard Prevention and Geo-Environment Protection Independent Research Project (SKLGP2021Z016), the Science and technology project of POWERCHINA (DJ-ZDXM-2020-03), the National Key R&D Program of China (Grant Nos. 2018YFC1505402, 2018YFC1504901), and the National Natural Science Foundation of China (Grant Nos. 41472255, 41704014, and 41631073).

Data Availability Statement

The Japan Aerospace Exploration Agency (JAXA) provided the ALOS-2 SAR images (ALOS-2 project, PI Nos. ER2A2N136 and ER3A2N537), which can be obtained on the website https://auig2.jaxa.jp/ips/home (accessed on 5 June 2021). The European Space Agency (ESA) provided the Sentinel-1 SAR images (https://scihub.copernicus.eu/, accessed on 25 June 2021). The SRTM DEM can be acquired on the website http://srtm.csi.cgiar.org/ (accessed on 26 June 2021). All the figures were mapped based on the Generic Mapping Tools (GMT) software [62].

Conflicts of Interest

The authors declare no conflict of interest.

References

  1. Chen, H.; Qu, C.; Zhao, D.; Ma, C.; Shan, X. Rupture kinematics and co-seismic slip model of the 2021 Mw 7.3 Maduo (China) earthquake: Implications for the seismic hazard of the Kunlun fault. Remote Sens. 2021, 13, 3327. [Google Scholar] [CrossRef]
  2. He, K.; Wen, Y.; Xu, C.; Zhao, Y. Fault geometry and slip distribution of the 2021 Mw 7.4 Maduo, China, Earthquake inferred from InSAR measurements and relocated aftershocks. Seismol. Res. Lett. 2021, 93, 8–20. [Google Scholar] [CrossRef]
  3. Liu, J.; Hu, J.; Li, Z.; Ma, Z.; Zhu, J. Complete three-dimensional coseismic displacements due to the 2021 Maduo earthquake in Qinghai Province, China from Sentinel-1 and ALOS-2 SAR images. Sci. China Earth Sci. 2021, 65, 687–697. [Google Scholar] [CrossRef]
  4. Zhao, D.; Qu, C.; Chen, H.; Shan, X.; Song, X.; Gong, W. Tectonic and geometric control on fault kinematics of the 2021 Mw7.3 Maduo (China) earthquake inferred from interseismic, co-seismic and postseismic InSAR observations. Geophys. Res. Lett 2021, 48, e2021GL095417. [Google Scholar] [CrossRef]
  5. Wang, W.; He, J.; Wang, X.; Zhou, Y.; Hao, J.; Zhao, L.; Yao, Z. Rupture process models of the Yangbi and Maduo earthquakes that struck the eastern Tibetan Plateau in May 2021. Sci. Bull. 2022, 67, 466–469. [Google Scholar] [CrossRef]
  6. Du, X.; Zhang, X. Ionospheric Disturbances Possibly Associated with Yangbi Ms6. 4 and Maduo Ms7. 4 Earthquakes in China from China Seismo Electromagnetic Satellite. Atmosphere 2022, 13, 438. [Google Scholar] [CrossRef]
  7. Jing, F.; Zhang, L.; Singh, R.P. Pronounced Changes in Thermal Signals Associated with the Madoi (China) M7.3 Earthquake from Passive Microwave and Infrared Satellite Data. Remote Sens. 2022, 14, 2539. [Google Scholar] [CrossRef]
  8. Yang, X.; Zhang, T.B.; Lu, Q.; Long, F.; Liang, M.J.; Wu, W.W.; Gong, Y.; Wei, J.X.; Wu, J. Variation of thermal infrared brightness temperature anomalies in the Madoi earthquake and associated earthquakes in the Tibetan Plateau (China). Front. Earth Sci. 2022, 10, 332. [Google Scholar] [CrossRef]
  9. Pan, J.; Bai, M.K.; Li, C.; Liu, F.C.; Li, H.B.; Liu, D.L. Coseismic surface rupture and seismogenic structure of the 2021-05-22 Maduo (Qinghai) Ms 7.4 earthquake. Acta Geol. Sin. 2021, 95, 1655–1670. [Google Scholar]
  10. Zhan, Y.; Liang, M.; Sun, X.; Huang, F.; Zhao, L.; Gong, Y.; Zhang, H.; Jing, H.; Li, C.; Zhang, P.; et al. Deep structure and seismogenic pattern of the 2021.5.22 Madoi (Qinghai) Ms7.4 earthquake. Chin. J. Geophys. 2021, 64, 2232–2252. [Google Scholar] [CrossRef]
  11. Wang, L.; Li, X.J.; Yang, L.C.; Liu, A.W.; Wang, Y.; Wu, Q.; Wang, N.; Chen, K.; Li, X.X. Earthquake damage characteristics of the Maduo Mss7.4 earthquake in Qinghai Province. J. Basic Sci. Eng. 2021, 1–10. Available online: https://kns.cnki.net/kcms/detail/11.3242.TB.20210615.1759.002.html (accessed on 30 December 2021).
  12. Dong, P.; Zhao, B.; Qiao, X. Interaction between historical earthquakes and the 2021 Mw7. 4 Maduo event and their impacts on the seismic gap areas along the East Kunlun fault. Earth Planets Space 2022, 74, 42. [Google Scholar] [CrossRef]
  13. Yuan, Z.; Li, T.; Su, P.; Sun, H.; Ha, G.; Guo, P.; Thompson Jobe, J. Large Surface-Rupture Gaps and Low Surface Fault Slip of the 2021 Mw 7.4 Maduo Earthquake Along a Low-Activity Strike-Slip Fault, Tibetan Plateau. Geophys. Res. Lett 2022, 49, e2021GL096874. [Google Scholar] [CrossRef]
  14. Deng, Q.; Zhang, P.; Ran, Y.; Yang, X.; Min, W.; Chu, Q. Basic characteristics of active tectonics of China. Sci. China Ser. D-Earth Sci. 2003, 46, 356–372. [Google Scholar] [CrossRef]
  15. Kirby, E.; Harkins, N.; Wang, E.; Shi, X.; Fan, C.; Burbank, D. Slip rate gradients along the eastern Kunlun fault. Tectonics 2007, 26, TC2010. [Google Scholar] [CrossRef] [Green Version]
  16. Zhu, L.; Ji, L.; Liu, C. Interseismic slip rate and locking along the Maqin-Maqu segment of the east Kunlun fault, northern Tibetan Plateau, based on Sentinel-1 images. J. Asian Earth Sci. 2021, 211, 104703. [Google Scholar] [CrossRef]
  17. Wen, X.; Yi, G.; Xu, X. Background and precursory seismicities along and surrounding the Kunlun fault before the Ms8.1, 2001, Kokoxili earthquake, China. J. Asian. Earth. Sci. 2007, 30, 63–72. [Google Scholar] [CrossRef]
  18. Li, J.J.; Zhang, J.L.; Cai, Y.Y. Investigation of historical earthquakes, paleo-earthquakes and seismic gap in the eastern Kunlun fault zone. Earthquake 2017, 37, 103–111. (In Chinese) [Google Scholar]
  19. Xu, D.; Xiao, J.; He, J.; Wang, W. Strong earthquake clustering around the eastern Tibetan Plateau after the 2008 Mw 7.9 Wenchuan earthquake. Sci. China Earth Sci. 2020, 63, 999–1012. [Google Scholar] [CrossRef]
  20. Yang, X.; Chen, L.; Yang, L.; Li, Y.; Tan, P. Numerical simulation on strong earthquake dynamic process of Bayan Har block. Acta Seismol. Sin. 2013, 35, 304–314. [Google Scholar]
  21. Li, P.; Liao, L.; Feng, J.; Liu, P. Numerical simulation of relationship between stress evolution and strong earthquakes around the Bayan Har block since 1900. Chinese. J. Geophys. 2019, 62, 4170–4188. [Google Scholar] [CrossRef]
  22. Liang, M.; Yang, Y.; Du, F.; Gong, Y.; Sun, Y.; Zhao, M.; He, Q. Late quaternary activity of the ce-ntral segment of the Dari fault and restudy of the surface rupture zone of the 1947 M 7¾ Dari earthquake, Qinghai Province. Seismol. Geol. 2020, 42, 703–714. (In Chinese) [Google Scholar] [CrossRef]
  23. Zhu, Y.; Diao, F.; Yuchao, F.U.; Liu, C.; Xiong, X. Slip rate of the seismogenic fault of the 2021 Maduo earthquake in western China inferred from GPS observations. Sci. China Earth Sci. 2021, 64, 8. [Google Scholar] [CrossRef]
  24. United States Geological Survey (USGS). M7.3-Southern Qinghai, China. Available online: https://earthquake.u-sgs.gov/earthquakes/eventpage/us7000e54r/executive (accessed on 20 October 2021).
  25. Jin, Z.; Fialko, Y. Co-seismic and early postseismic deformation due to the 2021 M7. 4 Maduo (China) earthquake. Geophys. Res. Lett. 2021, 48, e2021GL095213. [Google Scholar] [CrossRef]
  26. Li, Z.; Ding, K.; Zhang, P.; Wen, Y.; Zhao, L.; Chen, J. Coseismic deformation and slip distribution of 2021 Mw 7.4 Madoi earthquake from GNSS observation. Geomat. Inf. Sci. Wuhan Univ. 2021, 46, 1489–1497. (In Chinese) [Google Scholar] [CrossRef]
  27. Zhang, J.; Xu, L. The centroid moment tensor solution of the 2021 MW7.5 Maduo, Qinghai, earthquake. Acta Seismol. Sin. 2021, 3, 387–391. [Google Scholar] [CrossRef]
  28. Wang, W.; Fang, L.; Wu, J.; Tu, H.; Chen, L.; Lai, G.; Zhang, L. Aftershock sequence relocation of the 2021 Ms7.4 Maduo Earthquake, Qinghai, China. Sci. China Earth Sci. 2021, 64, 1371–1380. [Google Scholar] [CrossRef]
  29. Yin, X.X.; Wang, W.H.; Cai, R.; Deng, J.; Ma, L. Precise location of the 2021 Maduo, Qinghai MS 7.4 earthquake and its seismogenic structure. China Earth Eng. J. 2021, 834–839. Available online: https://kns.cnki.net/kcms/detail/62.1208.P.20210625.0932.004.html (accessed on 30 December 2021).
  30. Ha, G.; Liu, J.; Ren, Z.; Zhu, X.; Bao, G.; Wu, D.; Zhang, Z. The Interpretation of Seismogenic Fault of the Maduo Mw 7.3 Earthquake, Qinghai Based on Remote Sensing Images—A Branch of the East Kunlun Fault System. J. Earth Sci. 2022, 33, 857–868. [Google Scholar] [CrossRef]
  31. Wegmuller, U.; Werner, C. Gamma SAR processor and interferometry software. In Proceedings of the 3rd ERS Symposium, Space Service Environment (Special Publications 414, ESA), Florence, Italy, 14–21 March 1997; Volume III, pp. 1687–1692. [Google Scholar]
  32. Jarvis, A.; Reuter, H.I.; Nelson, A.; Guevara, E.; Hole-filled SRTM for the globe Version 4. Retrieved from the CGIAR-CSI SRTM 90m Database. 2008. Available online: http://srtm.csi.cgiar.org (accessed on 26 June 2021).
  33. Chen, C.W.; Zebker, H.A. Phase unwrapping for large SAR interferograms: Statistical segmentation and generalized network models. IEEE Trans. Geosci. Remote Sens. 2022, 40, 1709–1719. [Google Scholar] [CrossRef] [Green Version]
  34. Yang, Y.; Chen, Q.; Xu, Q.; Liu, G.; Hu, J. Source model and Coulomb stress change of the 2015 Mw 7.8 Gorkha earthquake determined from improved inversion of geodetic surface deformation observations. J. Geodesy 2019, 93, 333–351. [Google Scholar] [CrossRef]
  35. Priestnall, G.; Jaafar, J.; Duncan, A. Extracting urban features from LiDAR digital surface models. Comput. Environ. Urban Syst. 2000, 24, 65–78. [Google Scholar] [CrossRef]
  36. Rayburg, S.; Thoms, M.; Neave, M. A comparison of digital elevation models generated from different data sources. Geomorphology 2009, 106, 261–270. [Google Scholar] [CrossRef]
  37. Guan, X.; Wu, H. Leveraging the power of multi-core platforms for large-scale geospatial data processing: Exemplified by generating DEM from massive LiDAR point clouds. Comput. Geosci. 2010, 36, 1276–1282. [Google Scholar] [CrossRef]
  38. Welstead, S.T. Fractal and Wavelet Image Compression Techniques; SPIE Optical Engineering Press: Bellingham, WA, USA, 1999. [Google Scholar] [CrossRef]
  39. Yang, Y.; Tsai, M.; Hu, J.; Aurelio, M.; Hashimoto, M.; Escudero, J.A.P.; Su, Z.; Chen, Q. Co-seismic slip deficit of the 2017 Mw 6.5 Ormoc earthquake that occurred along a creeping segment and geothermal field of the Philippine fault. Geophys. Res. Lett. 2018, 45, 2659–2668. [Google Scholar] [CrossRef]
  40. Funning, G.J.; Parsons, B.; Wright, T.J.; Jackson, J.A.; Fielding, E.J. Surface displacements and source parameters of the 2003 Bam (Iran) earthquake from Envisat advanced synthetic aperture radar imagery. J. Geophys. Res.-Sol. Earth 2005, 110, B9. [Google Scholar] [CrossRef] [Green Version]
  41. Hanks, T.H. Earthquake stress-drops, ambient tectonic stresses, and the stresses that drive plates. Pure Appl. Geophys. 1977, 115, 441–558. [Google Scholar] [CrossRef]
  42. Stein, R.S. The role of stress transfer in earthquake occurrence. Nature 1999, 402, 605. [Google Scholar] [CrossRef]
  43. Huang, M.-H.; Tung, H.; Fielding, E.; Huang, H.-H.; Liang, C.; Huang, C.; Hu, J.-C. Multiple fault slip triggered above the 2016 Mw 6.4 MeiNong earthquake in Taiwan. Geophys. Res. Lett. 2016, 43, 7459–7467. [Google Scholar] [CrossRef] [Green Version]
  44. Okada, Y. Deformation due to shear and tensile faults in a half-space. Bull. Seismol. Soc. Am. 1992, 82, 1018–1040. [Google Scholar] [CrossRef]
  45. Yang, Y.H.; Hu, J.C.; Chen, Q.; Lei, X.; Zhao, J.; Li, W.; Chiu, C.Y. Shallow slip of blind fault associated with the 2019 M S 6.0 Changning earthquake in fold-and-thrust belt in salt mines of Southeast Sichuan, China. Geophys. J. Int. 2021, 224, 909–922. [Google Scholar] [CrossRef]
  46. Hsu, Y.J.; Rivera, L.; Wu, Y.M.; Chang, C.H.; Kanamori, H. Spatial heterogeneity of tectonic stress and friction in the crust: New evidence from earthquake focal mechanisms in Taiwan. Geophys. J. Int. 2010, 182, 329–342. [Google Scholar] [CrossRef] [Green Version]
  47. Jung, H.S.; Won, J.S.; Kim, S.W. An improvement of the performance of multiple-aperture SAR int-erferometry (MAI). IEEE Trans. Geosci. Remote Sens. 2009, 47, 2859–2869. [Google Scholar] [CrossRef]
  48. Mastro, P.; Serio, C.; Masiello, G.; Pepe, A. The multiple aperture SAR interferometry (MAI) technique for the detection of large ground displacement dynamics: An overview. Remote Sens. 2020, 12, 1189. [Google Scholar] [CrossRef]
  49. Michel, R.; Avouac, J.P.; Taboury, J. Measuring ground displacements from SAR amplitude images: Application to the Landers earthquake. Geophys. Res. Lett. 1999, 26, 875–878. [Google Scholar] [CrossRef] [Green Version]
  50. Petricca, P.; Bignami, C.; Doglioni, C. The epicentral fingerprint of earthquakes marks the coseismically activated crustal volume. Earth-Sci. Rev. 2021, 218, 103667. [Google Scholar] [CrossRef]
  51. Fialko, Y.; Simons, M.; Agnew, D. The complete (3D) surface displacement field in the epicentral area of the 1999 Mw7. 1 Hector Mine earthquake, California, from space geodetic observations. Geophys. Res. Lett. 2001, 28, 3063–3066. [Google Scholar] [CrossRef] [Green Version]
  52. Haeussler, P.J.; Schwartz, D.P.; Dawson, T.E.; Stenner, H.D.; Lienkaemper, J.J.; Sherrod, B.; Personius, S.F. Surface rupture and slip distribution of the Denali and Totschunda faults in the 3 November 2002 M 7.9 earthquake, Alaska. Bull. Seismol. Soc. Am. 2004, 94, S23–S52. [Google Scholar] [CrossRef]
  53. Jin, Z.; Fialko, Y. Finite slip models of the 2019 Ridgecrest earthquake sequence constrained by space geodetic data and aftershock locations. Bull. Seismol. Soc. Am. 2020, 110, 1660–1679. [Google Scholar] [CrossRef]
  54. Lasserre, C.; Peltzer, G.; Crampé, F.; Klinger, Y.; Van der Woerd, J.; Tapponnier, P. Co-seismic deformation of the 2001 Mw = 7.8 Kokoxili earthquake in Tibet, measured by synthetic aperture radar interferometry. J. Geophys. Res.-Sol. Earth 2005, 110, B12. [Google Scholar] [CrossRef] [Green Version]
  55. Yang, Y.; Chen, Q.; Liu, G.; Cheng, H.Q.; Liu, L.Y.; Hu, J.C. Correction of co-seismic deformation field associated with Wenchuan earthquake with GPS observables and InSAR adjacent track smoothing and fault slip inversion. Chinese. J. Geophys. 2014, 57, 1462–1476. [Google Scholar] [CrossRef]
  56. Tobita, M.; Nishimura, T.; Kobayashi, T.; Hao, K.X.; Shindo, Y. Estimation of co-seismic deformation and a fault model of the 2010 Yushu earthquake using PALSAR interferometry data. Earth Planet. Sci. Lett. 2011, 307, 430–438. [Google Scholar] [CrossRef]
  57. Zheng, A.; Yu, X.; Xu, W.; Chen, X.; Zhang, W. A hybrid source mechanism of the 2017 Mw 6.5 Jiuzhaigou earthquake revealed by the joint inversion of strong-motion, teleseismic and InSAR data. Tectonophysics 2020, 789, 228538. [Google Scholar] [CrossRef]
  58. Yin, X.; Li, X.; Ma, Z.; Yao, S.H.; Gai, H.L.; Xu, W.Y. Characteristics of seismic disasters caused by the Maduo MS7.4 earth-quake in Qinghai Province. China Earth Eng. J. 2021, 1–8. Available online: https://kns.cnki.net/kcms/detail/62.1208.P.20210705.0908.002.html (accessed on 30 December 2021).
  59. Harris, R.A. Earthquake stress triggers, stress shadows, and seismic hazard. Int. Geo. 2003, 81, 1217–1232. [Google Scholar]
  60. Tymofyeyeva, E.; Fialko, Y.; Jiang, J.; Xu, X.; Sandwell, D.; Bilham, R.; Moafipoor, S. Slow slip event on the Southern San Andreas fault triggered by the 2017 Mw 8.2 Chiapas (Mexico) earthquake. J. Geophys. Res.-Sol. Earth 2019, 124, 9956–9975. [Google Scholar] [CrossRef]
  61. Zhao, D.; Qu, C.; Bürgmann, R.; Gong, W.; Shan, X.; Qiao, X.; Liu, L. Large-Scale Crustal Deformation, Slip-Rate Variation, and Strain Distribution along the Kunlun Fault (Tibet) From Sentinel-1 InSAR Observations (2015–2020). J. Geophys. Res. Sol. Earth 2022, 127, e2021JB022892. [Google Scholar] [CrossRef]
  62. Wessel, P.; Smith, W.H.F. New, improved version of Generic Mapping Tools released. EOS Trans. Am. Geophys. Union 1998, 79, 579. [Google Scholar] [CrossRef]
Figure 1. Tectonic background of the 2021 Mw 7.3 Maduo earthquake. The black solid lines indicate the fault surface trace, and the bold black lines denotes the boundary fault of the Bayan Har block. The red rectangle indicates the area of interest. Black arrows show the GPS horizontal velocity, white arrows with numbers are block motion rate, blue balls and beach balls indicate the locations and source mechanism of historical earthquakes, yellow star denotes the epicenter of the 2021 Maduo earthquake, and the black beach ball indicates the source mechanism solution of the main shock.
Remotesensing 14 05859 g001
Figure 2. SAR image coverage and fault distribution in the seismic zone of the 2021 Maduo earthquake. Black, brown, and blue polygons indicate the coverage of the Sentinel-1 ascending (ASC), descending (DES), and ALOS-2 descending (DES) orbital tracks SAR images. Black lines denote the fault surface traces in the seismic zone, and the blue star indicates the epicenter of the 2021 Maduo earthquake. The color balls indicate the aftershocks, whose original times are denoted by the color of the ball (see the color bar).
Remotesensing 14 05859 g002
Figure 3. InSAR deformation caused by the 2021 Mw 7.3 Maduo earthquake. InSAR deformation observed by ALOS-2 descending orbital track (a), Sentinel-1 ascending orbital track (d), and Sentinel-1 descending orbital track (g). (b,e,h) The InSAR deformation predicted by the estimated faulting model. (c,f,i) The residual between the observed and predicted InSAR deformation. Black lines denote the detected fault surface trace, and the red star indicates the epicenter of the 2021 Maduo earthquake. F1 and F2: The two main seismogenic faults, F3: Changmahe fault.
Remotesensing 14 05859 g003
Figure 4. The extracted surface deformation along the satellite range direction ((a) Sentinel-1 ascending orbital track and (b) Sentinel-1 descending orbital track) of the 2021 Maduo earthquake based on the POT technique. The black lines denote the detected co-seismic fault surface trace, and the red star indicates the epicenter of the 2021 Maduo earthquake.
Remotesensing 14 05859 g004
Figure 5. Co- and post-seismic surface deformation in the seismic zone. The red star denotes the epicenter of the 2021 Maduo earthquake, and the black dashed line indicates the distinguished discontinuous fringe along the Changmahe fault. Co-seismic surface deformation observed by ascending Sentinel-1 satellite orbital track with different periods of 20–26 May 2021 (a) and 20 May–19 June 2021 (b). Co-seismic surface deformation observed by descending satellite orbital tracks of Sentinel-1 ((c): 20–26 May 2021) and ALOS-2 ((d): 4 February–4 June 2021). (e) Post-seismic InSAR deformation observed by ascending Sentinel-1 satellite orbital track within the period of 26 May–19 June 2021. Post-seismic InSAR deformation observed by descending Sentinel-1 satellite orbital track with different periods of 26 May–1 June 2021 (f) and 1–13 June 2021 (g).
Remotesensing 14 05859 g005
Figure 6. Lidar-DEM along the seismogenic fault of the 2021 Maduo earthquake. (a) The acquired Lidar-DEM in the northwest segment of the seismogenic fault. (b,c) The partial enlarged detail of the Lidar-DEM. (d) The difference between the Lidar- and POT-derived fault surface traces Red solid lines indicate the distinguished surface cracks from the Lidar-DEM. Red dashed line denotes the detected fault location from the SAR POT data, and yellow arrows suggest the actual fault surface trace detected from the Lidar-DEM data. The black and white triangles indicate the location of A1–A3 and B1–B2, and the detailed field investigations of them are shown in Figure 7 and Figure 8.
Remotesensing 14 05859 g006
Figure 7. The surface cracks caused by the Maduo earthquake found in the northwest segment of the seismogenic fault in the field investigation. The red line indicates the surface trace of the detected co-seismic fault, the black lines denote the distinguished surface cracks from the UAV images, the red dashed rectangles show three significant surface rupture zones, and the red arrows show the surface motion direction. Localities A1–A3, see Figure 6a.
Remotesensing 14 05859 g007
Figure 8. En échelon cracks and pressure ridges due to sinistral shear along the co-seismic fault of the Maduo earthquake in the field investigation. Red line indicates the fault trace, and the red semi-arrows represent the sinistral shear along the surface rupture. Localities B1 and B2, see Figure 6d.
Remotesensing 14 05859 g008
Figure 9. Estimated faulting model of the 2021 Mw 7.3 Maduo earthquake. The inferred fault slip distribution on the seismogenic fault of F1 (a), F2 (b) and the Changmahe fault (c). (d) The 3D view of the fault slip and aftershock distribution. Red star indicates the hypocenter of the 2021 Maduo Mw 7.3 earthquake, and red circles denote the aftershocks after the main shock. F1–F2 indicate the two main seismogenic faults, and F3 is the Changmahe fault.
Remotesensing 14 05859 g009
Figure 10. The surface rupture along the Changmahe fault (a). The found fault outcrop (b) with a scarp height of 0.5 m (c). The white arrow shows the surface rupture direction of the Changmahe fault. The location of the field investigation is indicated by the red circle in Figure 11b.
Remotesensing 14 05859 g010
Figure 11. Post-seismic InSAR deformation of the 2021 Maduo earthquake in the seismic zone. Post-seismic surface deformation velocity of the ascending (a) and descending (b) orbital tracks of the Sentinle-1 satellite. The red triangles indicate the selected point, and the time-series InSAR deformations of them are shown in (c,d). The red circle in Figure 11b denotes the location of the field investigation of the Changmahe fault (Figure 10).
Remotesensing 14 05859 g011
Figure 12. Strain and Coulomb failure stress change caused by the rupture of the main faults (F1 and F2). (a) Surface dilatation due to the faulting of the main faults, and positive and negative values indicate surface extension and compression, respectively. (b) The maximum shear strain change caused by the rupture of the main faults, and the blue and black arrows indicate the direction of the maximum shear strain change. (c) Maximum shear strain change within the black dashed rectangle in Figure 12b. (d) Coulomb failure stress change on the Changmahe fault (F3) caused by the rupture of the main faults (F1 and F2). The black solid lines indicate the surface trace of the two main faults, F1 and F2, the black dashed line denotes the Changmahe fault, and the yellow star indicates the epicenter of the 2021 Maduo Mw 7.3 earthquake.
Remotesensing 14 05859 g012
Figure 13. The Coulomb failure change on the Kunlun fault caused by the historical earthquakes including the 1937 M 7.8 (a), 1947 M 7.3 (b), 1963 M 6.7 (c), 1990a M 6.3 (d), 1990 M 6.5 (e), 1990 M 6.2 (f), 1990b M 6.3 (g), 2000 M 6.3 (h), 2001 M 7.8 (i), 2017 M 6.5 (j) and the 2021 Maduo earthquake (k). (l) The accumulated CFS change on the Kunlun fault by the historical earthquakes. It should be noted that the color bar of each sub-figure is chosen based on the CFS change magnitude. The strike angle of the receiver fault was set based on the strike of each segment of the Kunlun fault, and the dip angle and rake angle were set as 77° and 0° based on the historical earthquakes that occurred along the Kunlun fault.
Remotesensing 14 05859 g013
Publisher’s Note: MDPI stays neutral with regard to jurisdictional claims in published maps and institutional affiliations.

