Article

Mask R-CNN–Based Landslide Hazard Identification for 22.6 Extreme Rainfall Induced Landslides in the Beijiang River Basin, China

1
Faculty of Land Resource Engineering, Kunming University of Science and Technology, Kunming 650031, China
2
Guangzhou Institute of Geography, Guangdong Open Laboratory of Geospatial Information Technology and Application, Guangdong Academy of Sciences, Guangzhou 510070, China
*
Author to whom correspondence should be addressed.
Remote Sens. 2023, 15(20), 4898; https://0-doi-org.brum.beds.ac.uk/10.3390/rs15204898
Submission received: 13 August 2023 / Revised: 15 September 2023 / Accepted: 18 September 2023 / Published: 10 October 2023

Abstract

:
Landslides triggered by extreme precipitation events pose a significant threat to human life and property in mountainous regions. Therefore, accurate identification of landslide locations is crucial for effective prevention and mitigation strategies. During the prolonged heavy rainfall events in Guangdong Province between 21 May and 21 June 2022, shallow and clustered landslides occurred in the mountainous regions of the Beijiang River Basin. This research used high-resolution satellite imagery and integrated the Mask R-CNN algorithm model with spectral, textural, morphological and physical characteristics of landslides in remote sensing imagery, in addition to landslide-influencing factors and other constraints, to interpret the landslides induced by the event through remote sensing techniques. The detection results show that the proposed methodology achieved a high level of accuracy in landslide identification, with a precision rate of 81.91%, a recall rate of 84.07% and an overall accuracy of 87.28%. A total of 3782 shallow landslides were detected, showing a distinct clustered distribution pattern. The performance of Mask R-CNN, Faster-CNN, U-Net and YOLOv3 models in landslide identification was further compared, and the effects of setting the rotation angle and constraints on the identification results of the Mask R-CNN algorithm model were investigated. The results show that each model improves the evaluation indices, but the Mask R-CNN model has the best detection performance; the rotation angle can effectively improve the generalization ability and robustness of the model, and the landslide-inducing factor data and texture feature sample data are the best for landslide identification. The research results provide valuable references and technical support for deepening our understanding of the distribution patterns of rainfall-triggered shallow and cluster landslides in the Beijiang River Basin.

Graphical Abstract

1. Introduction

The southern region of China experiences a high frequency of rainfall-induced landslides, particularly under extreme precipitation conditions. This can lead to the development of a distinct form of shallow, mass landslide hazards within specific basins. These hazards exhibit unique characteristics, including small individual scales, prolonged durations, multiple hazard locations and distinct watershed subordination features. Consequently, they generate a cumulative and amplifying impact throughout the hazard event, resulting in substantial damage [1,2,3]. In addition, the complex geological conditions in the area are influenced by a variety of natural factors, resulting in a large number of hazards from mass landslides, including casualties, property damage, infrastructure damage, economic loss, ecological damage and many other aspects [4,5,6]. Such landslides induced by extreme rainfall are not uncommon around the world, such as in the Andean region [7], Hong Kong [8], America [9] and Malaysia [10], where rainfall-induced landslide disasters have caused severe human and economic losses.
Traditional methods of landslide identification are time-consuming, labor-intensive and relatively difficult to identify for large-scale areas [11]. However, remote sensing technology is a very effective means of obtaining topographic and geomorphological information to identify potential landslides and landslide histories, which in turn can lead to landslide hazard assessment and landslide risk analysis [12]. Although predicting rainfall can effectively prevent geological disasters from occurring in advance, and some scholars are now conducting research in this field [13], the identification of regional landslides after extreme heavy rainfall weather events not only helps to reveal the causes and mechanisms of landslides and provide a scientific basis for landslide prevention and control but also helps to predict and allows for warning of landslides, thus reducing disaster losses. Therefore, the accurate identification and monitoring of regional landslides is of great academic and practical significance and can make a positive contribution to safeguarding people’s lives and property, maintaining social stability and promoting economic development.
Currently, four methods are widely used in traditional large-scale landslide identification studies of remote sensing imagery: visual interpretation, image-based methods, object-oriented methods and deep learning. The visual interpretation method is more accurate, but it relies on expert knowledge and experience, which is costly in terms of time and manpower, and has a relatively small scope of application and cannot be interpreted quickly [14,15,16,17]. The image element–based method has the advantages of fast recognition and high accuracy, but it requires analysis under the same resolution of the geographical environment, which is prone to information waste and the “salt and pepper” phenomenon [18,19]. The object-oriented method can classify objects with similar spectral texture features into one category, which effectively improves recognition accuracy and avoids the “salt and pepper” phenomenon, but many small noises will be generated in the process of image object segmentation, and these units need to be ignored during classification, which presents certain limitations [20,21,22,23].
With the rapid development of computer image recognition technology, the cross-fertilization between the field of deep learning and the field of landslide detection has become one of the current research hotspots. Many scholars have carried out research work in this area, and some of them have proposed new algorithmic models using convolutional neural networks to develop the principle, such as U-Net [24], DeepLab V3+ [25], Faster R-CNN [26], Mask R-CNN [27], Yolov [28] and so on. Other scholars have improved the algorithmic models based on their predecessors by optimizing the model structure or combining them with other algorithms to improve the model feature extraction capability, thus increasing the recognition efficiency [29,30,31,32,33]. Some other scholars believe that deep learning network models are still inadequate in extracting features at multiple scales and need to be improved by adding constraints to their design [34,35,36,37,38]. Deep learning methods have the advantages of being adaptable and having good recognition effects, which can better solve the problems in traditional methods and thus present a new direction for landslide recognition.
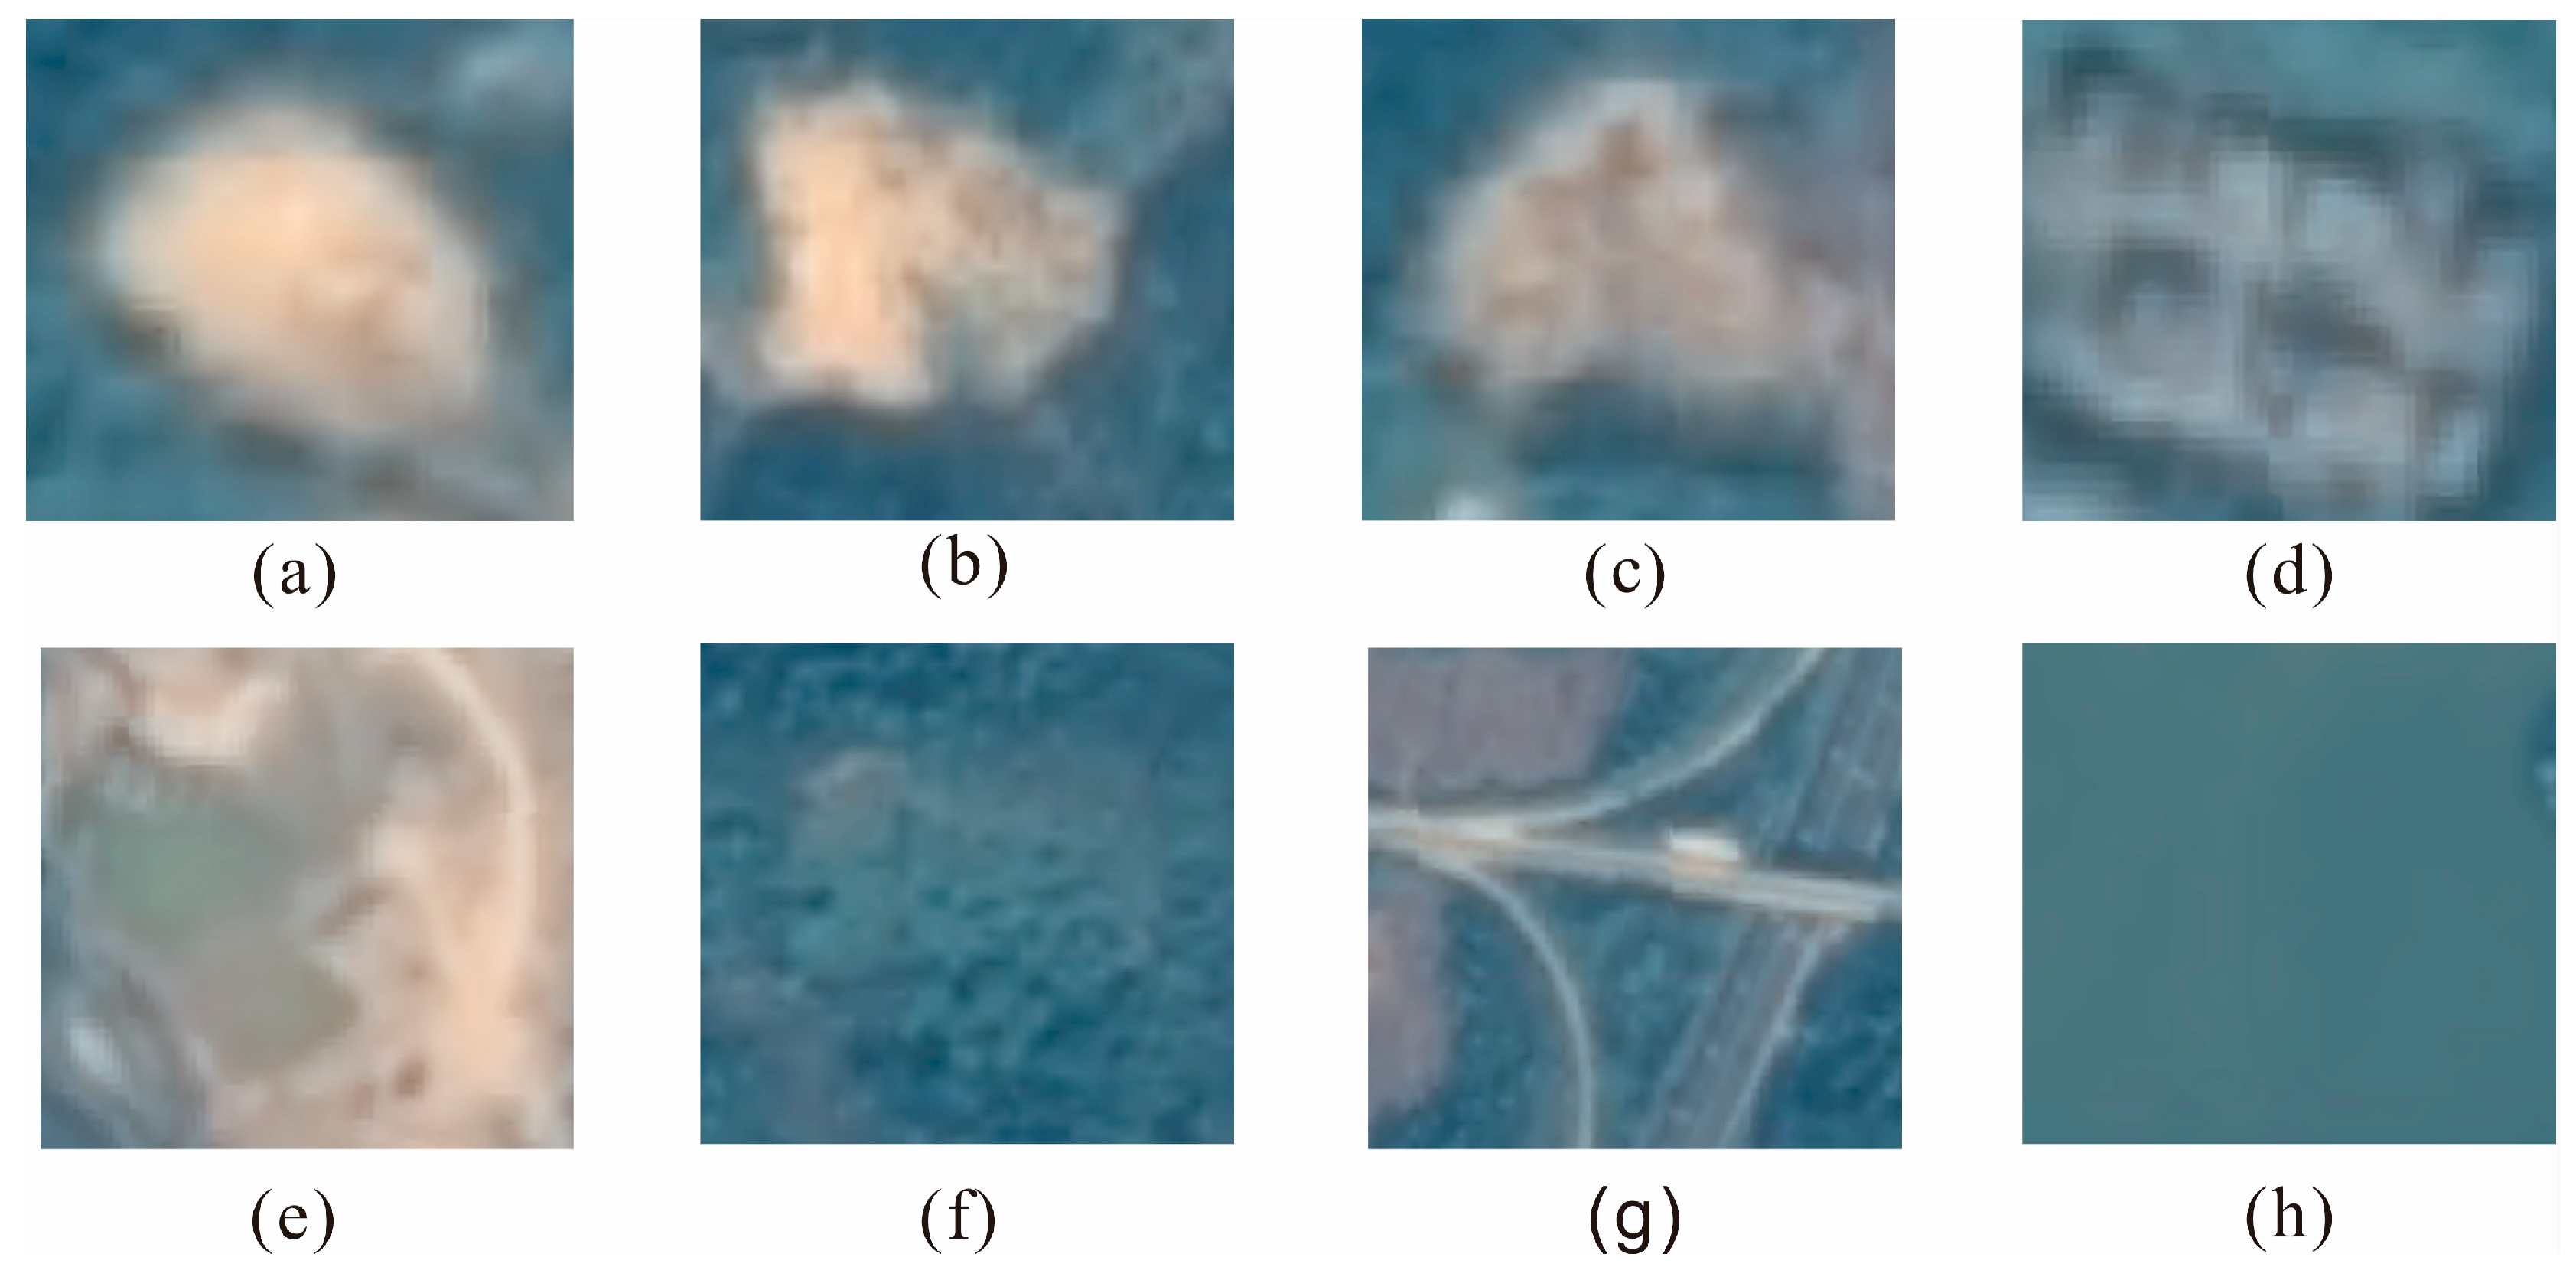
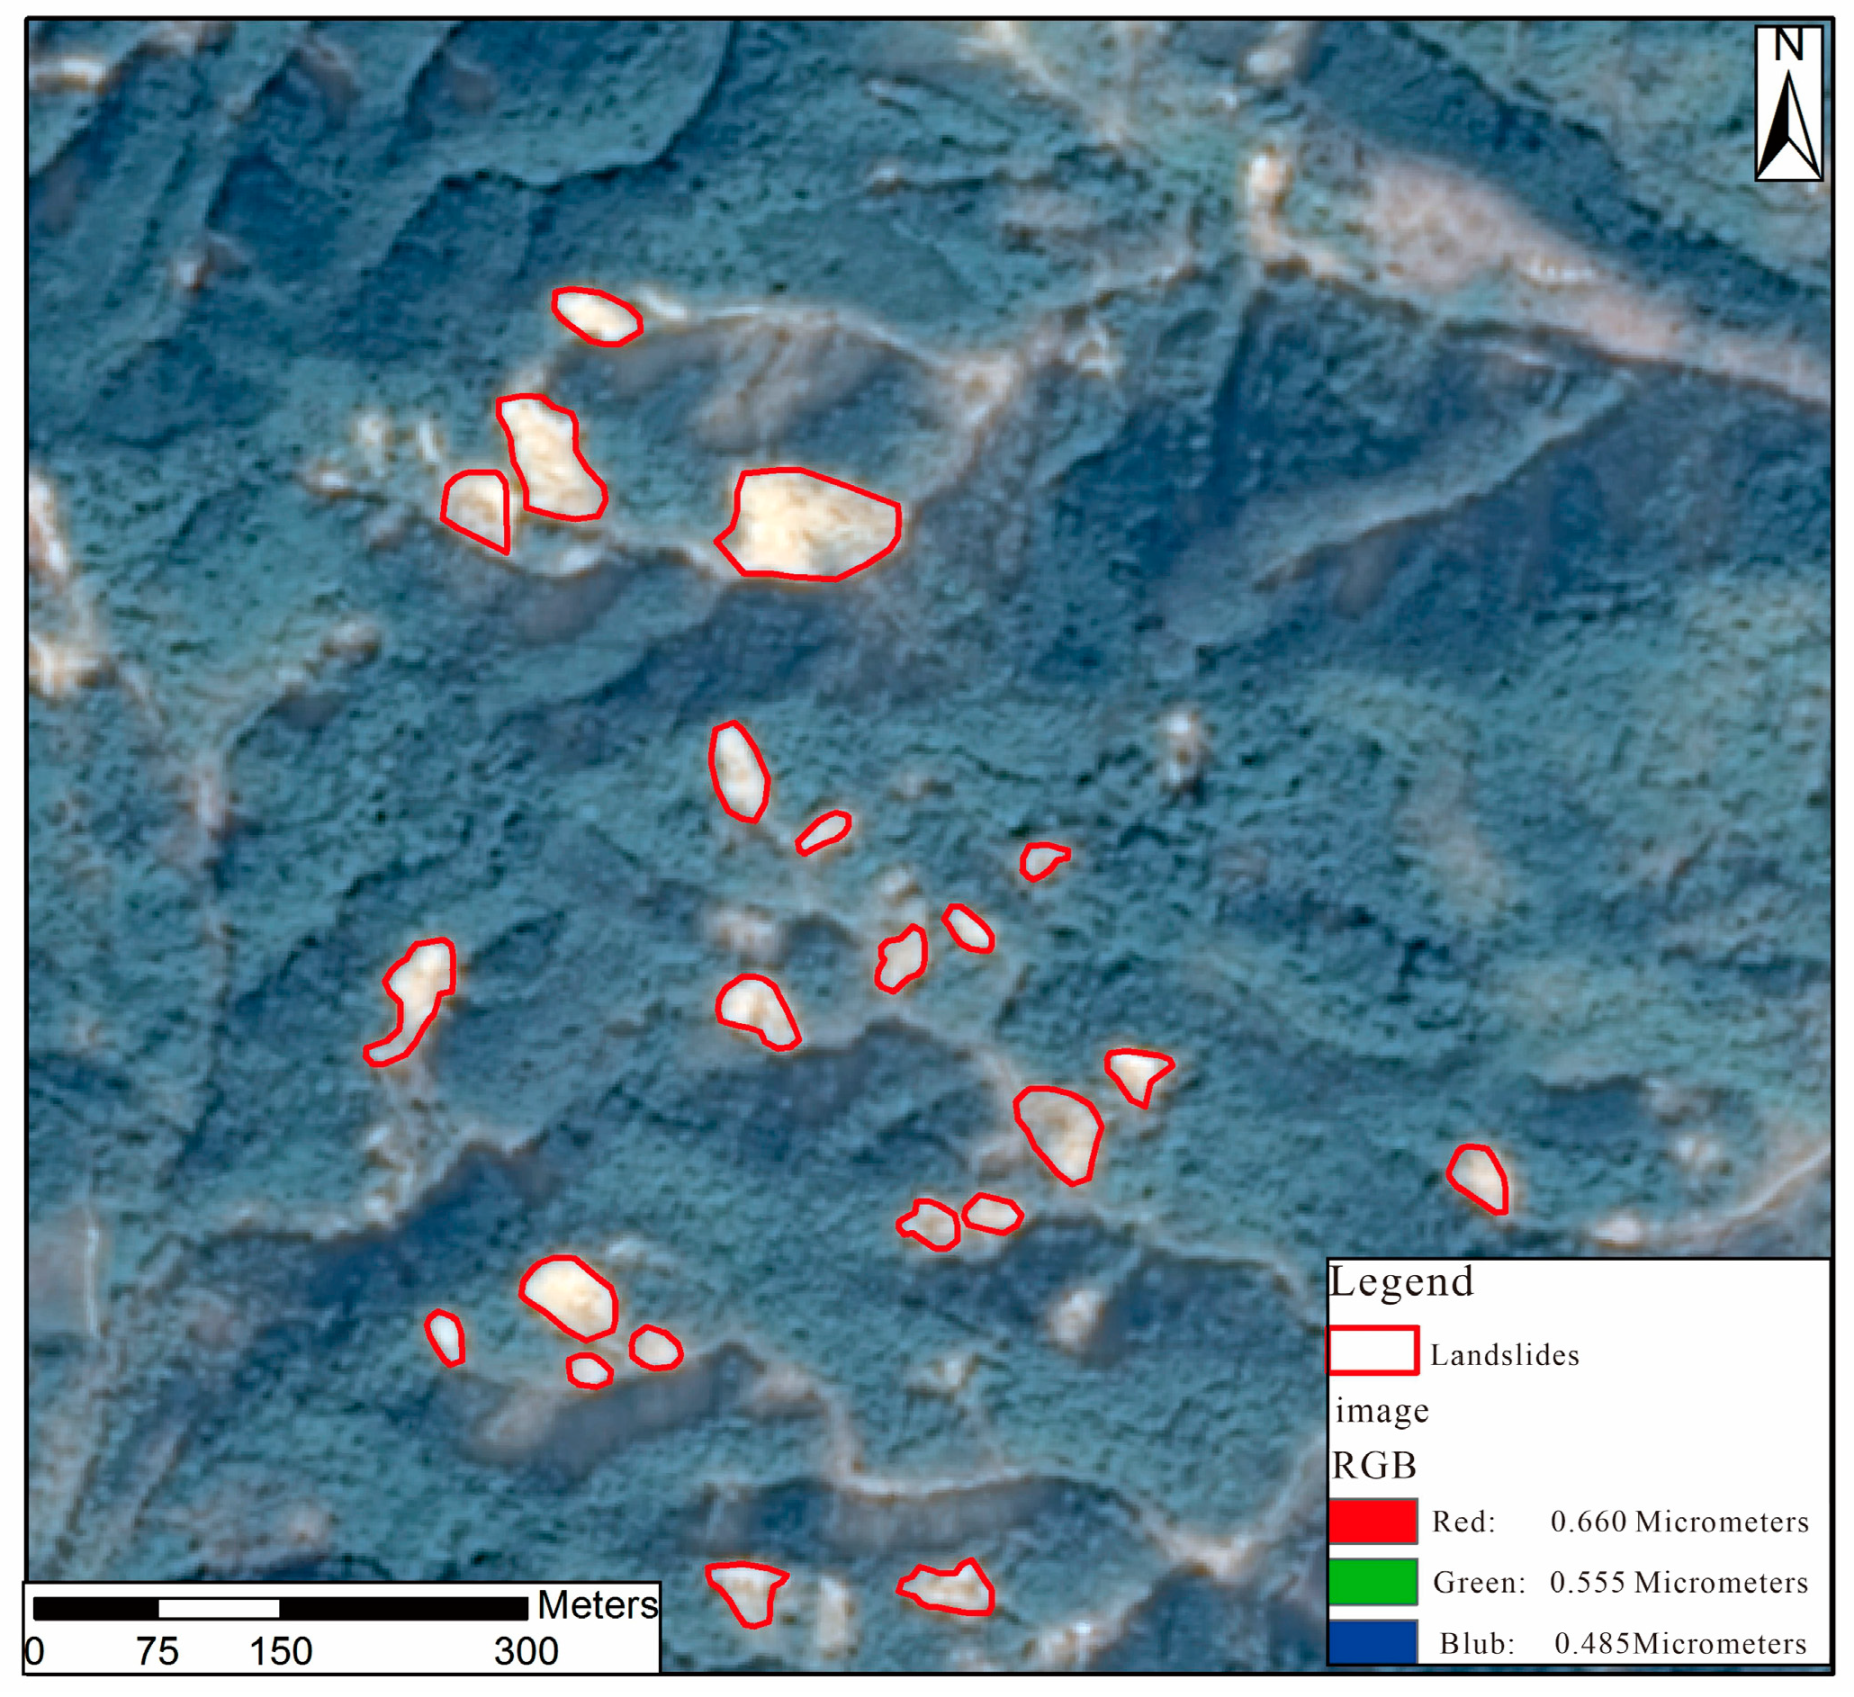
Rainfall-induced landslides in South China are small in monolithic scale and not well recognizable from other features such as bare land, roads and mining areas. Located in the Beijiang basin area of South China, the area is heavily covered by vegetation and is often affected by cloudy and rainy weather, which leads to the inability of visible light and microwaves to penetrate effectively through the surface vegetation; the areas with a high degree of vegetation cover in this region are also usually steeply sloped and densely vegetated, which makes it obviously difficult to carry out field investigations [
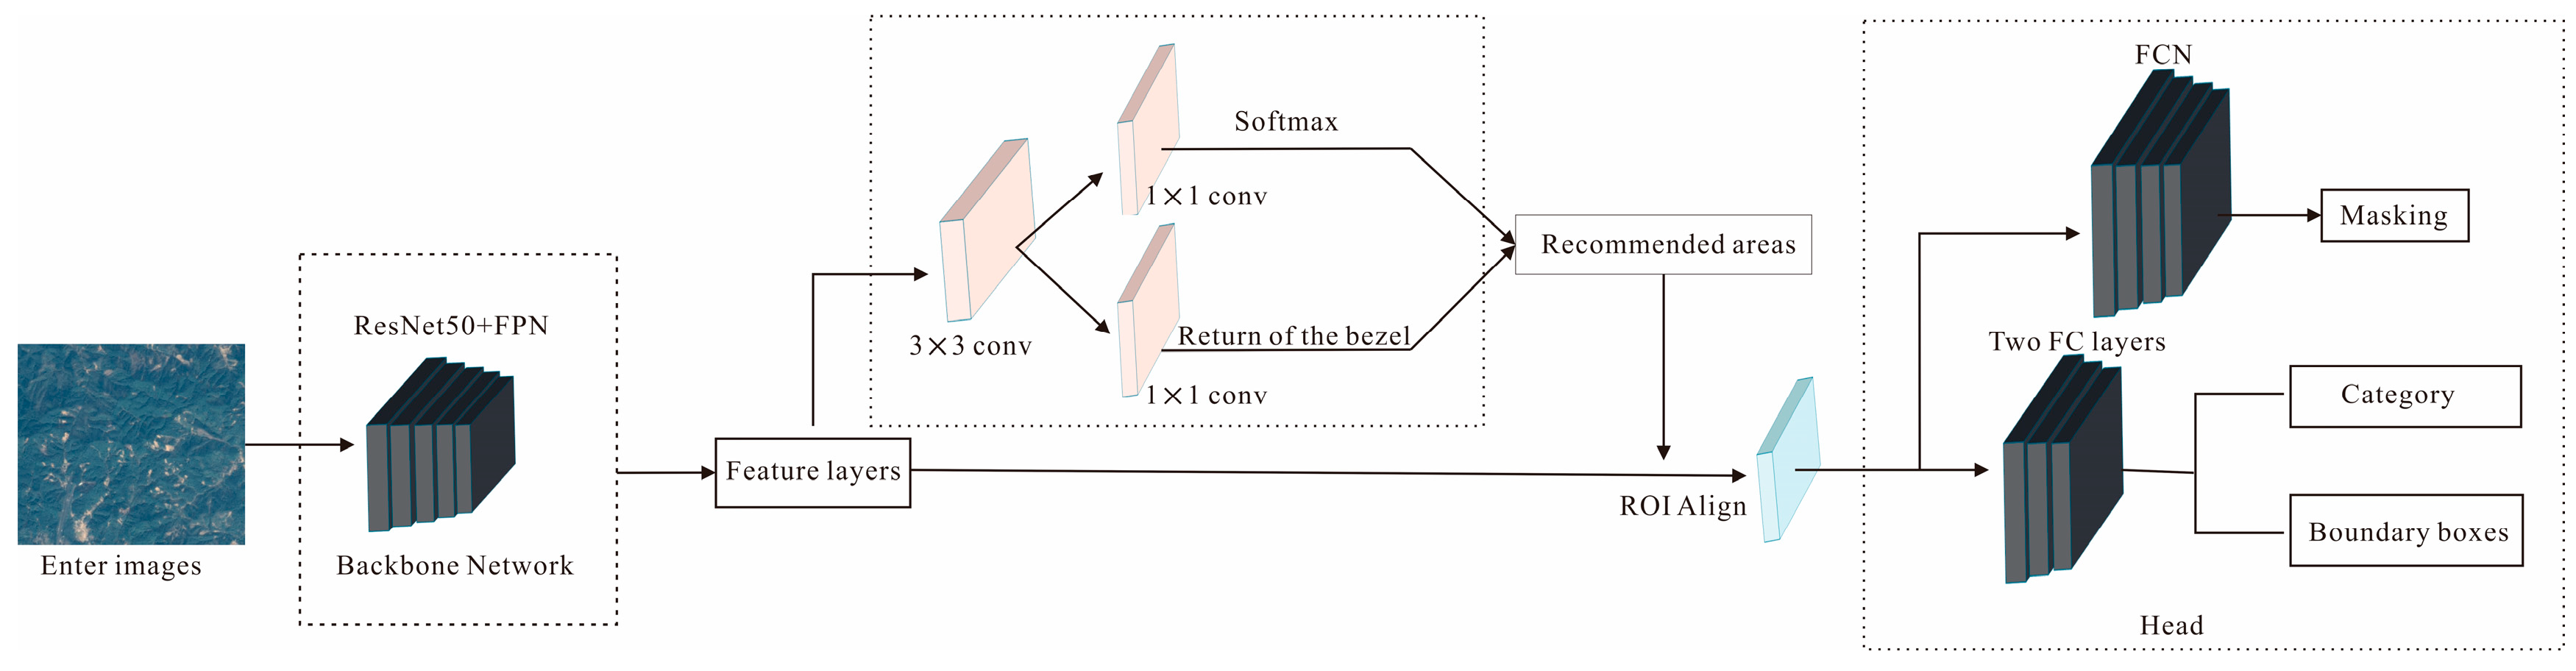
39]. Therefore, accurate remote sensing interpretation of the landslide hazard remains a significant challenge. The Mask R-CNN algorithm model can not only accurately detect targets in images but also generate pixel-level segmentation masks for each detected target. It is also able to discriminate object boundaries in complex environments, improving the accuracy of detection segmentation. In addition, the Mask R-CNN algorithm model is able to perform detection and segmentation directly on the input image without additional pre-processing steps, providing a high recognition rate and high accuracy [40].
Since He et al. [27] proposed Mask R-CNN, the algorithm has been widely used in various fields. For example, Sui et al. [41] improved the Mask R-CNN model by introducing the CBAM attention module to achieve façade damage detection of complex building faces after an earthquake. In addition, Liu et al. [42] used Mask R-CNN as a base model and introduced an attention mechanism to establish an automatic landslide identification model for InSAR observation and achieved better results. In addition, Jiang et al. [43] used the Sichuan–Tibet transportation corridor as the study area and combined Mask R-CNN and migration learning methods to successfully detect old and new landslides, indicating that the migration-learning-improved Mask R-CNN can be effectively used for landslide and ice avalanche detection. Yang et al. [44] proposed a background enhancement method by adding landslide triggering factors to the data as auxiliary information and compared the applicability of Mask R-CNN, U-Net and PSP-Net methods. These research results not only provide new ideas and methods for landslide hazard monitoring, early warning and prevention but also promote the development and application of deep learning techniques.
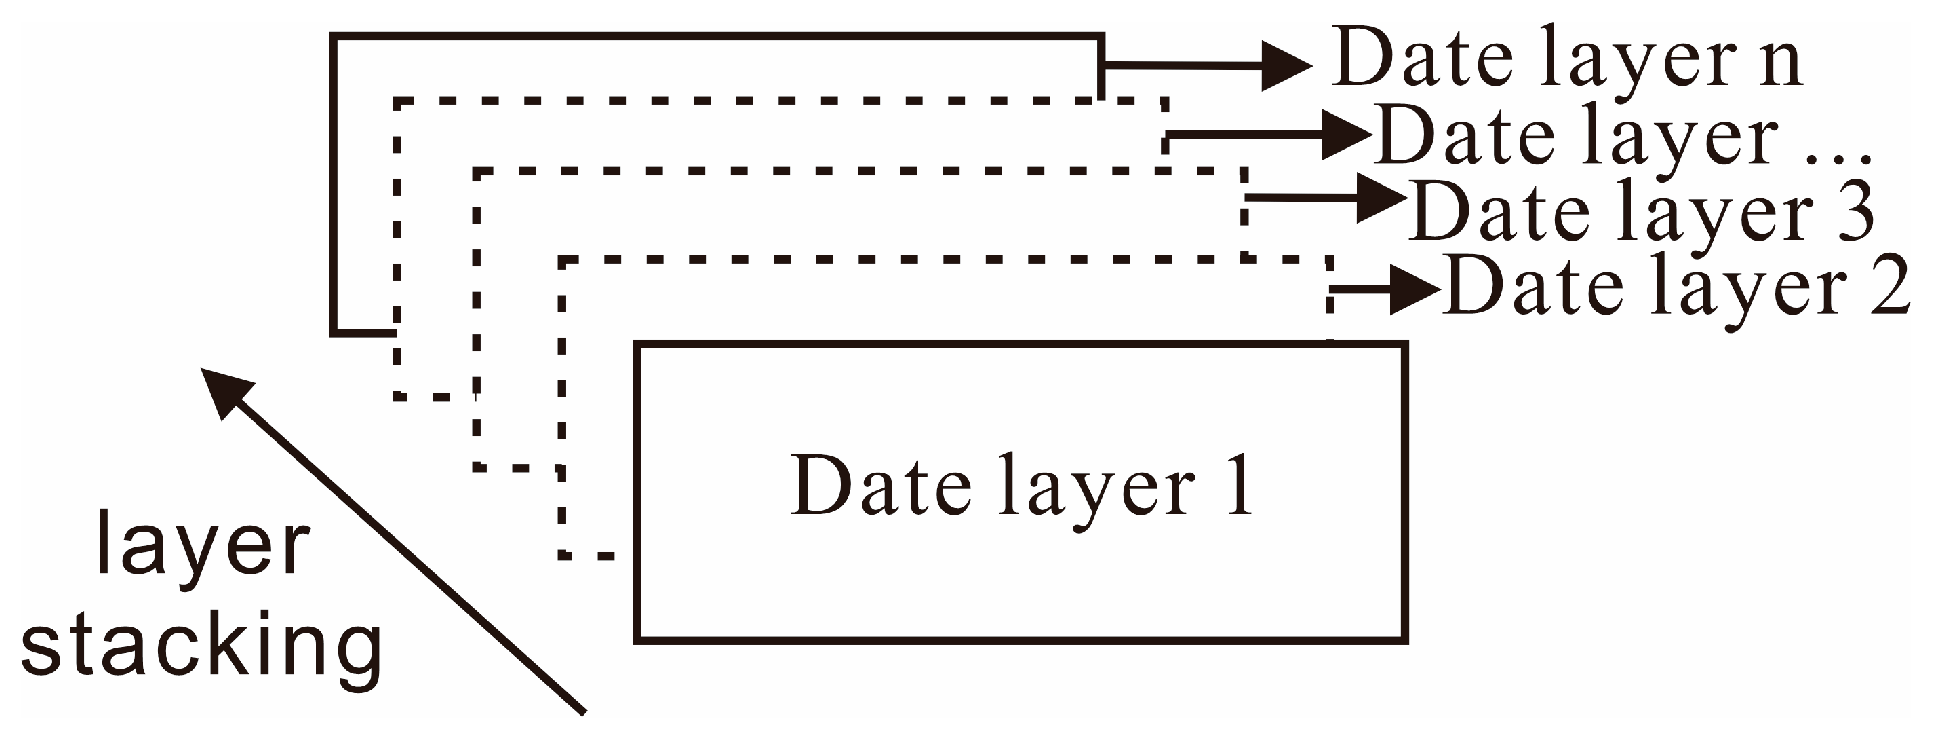
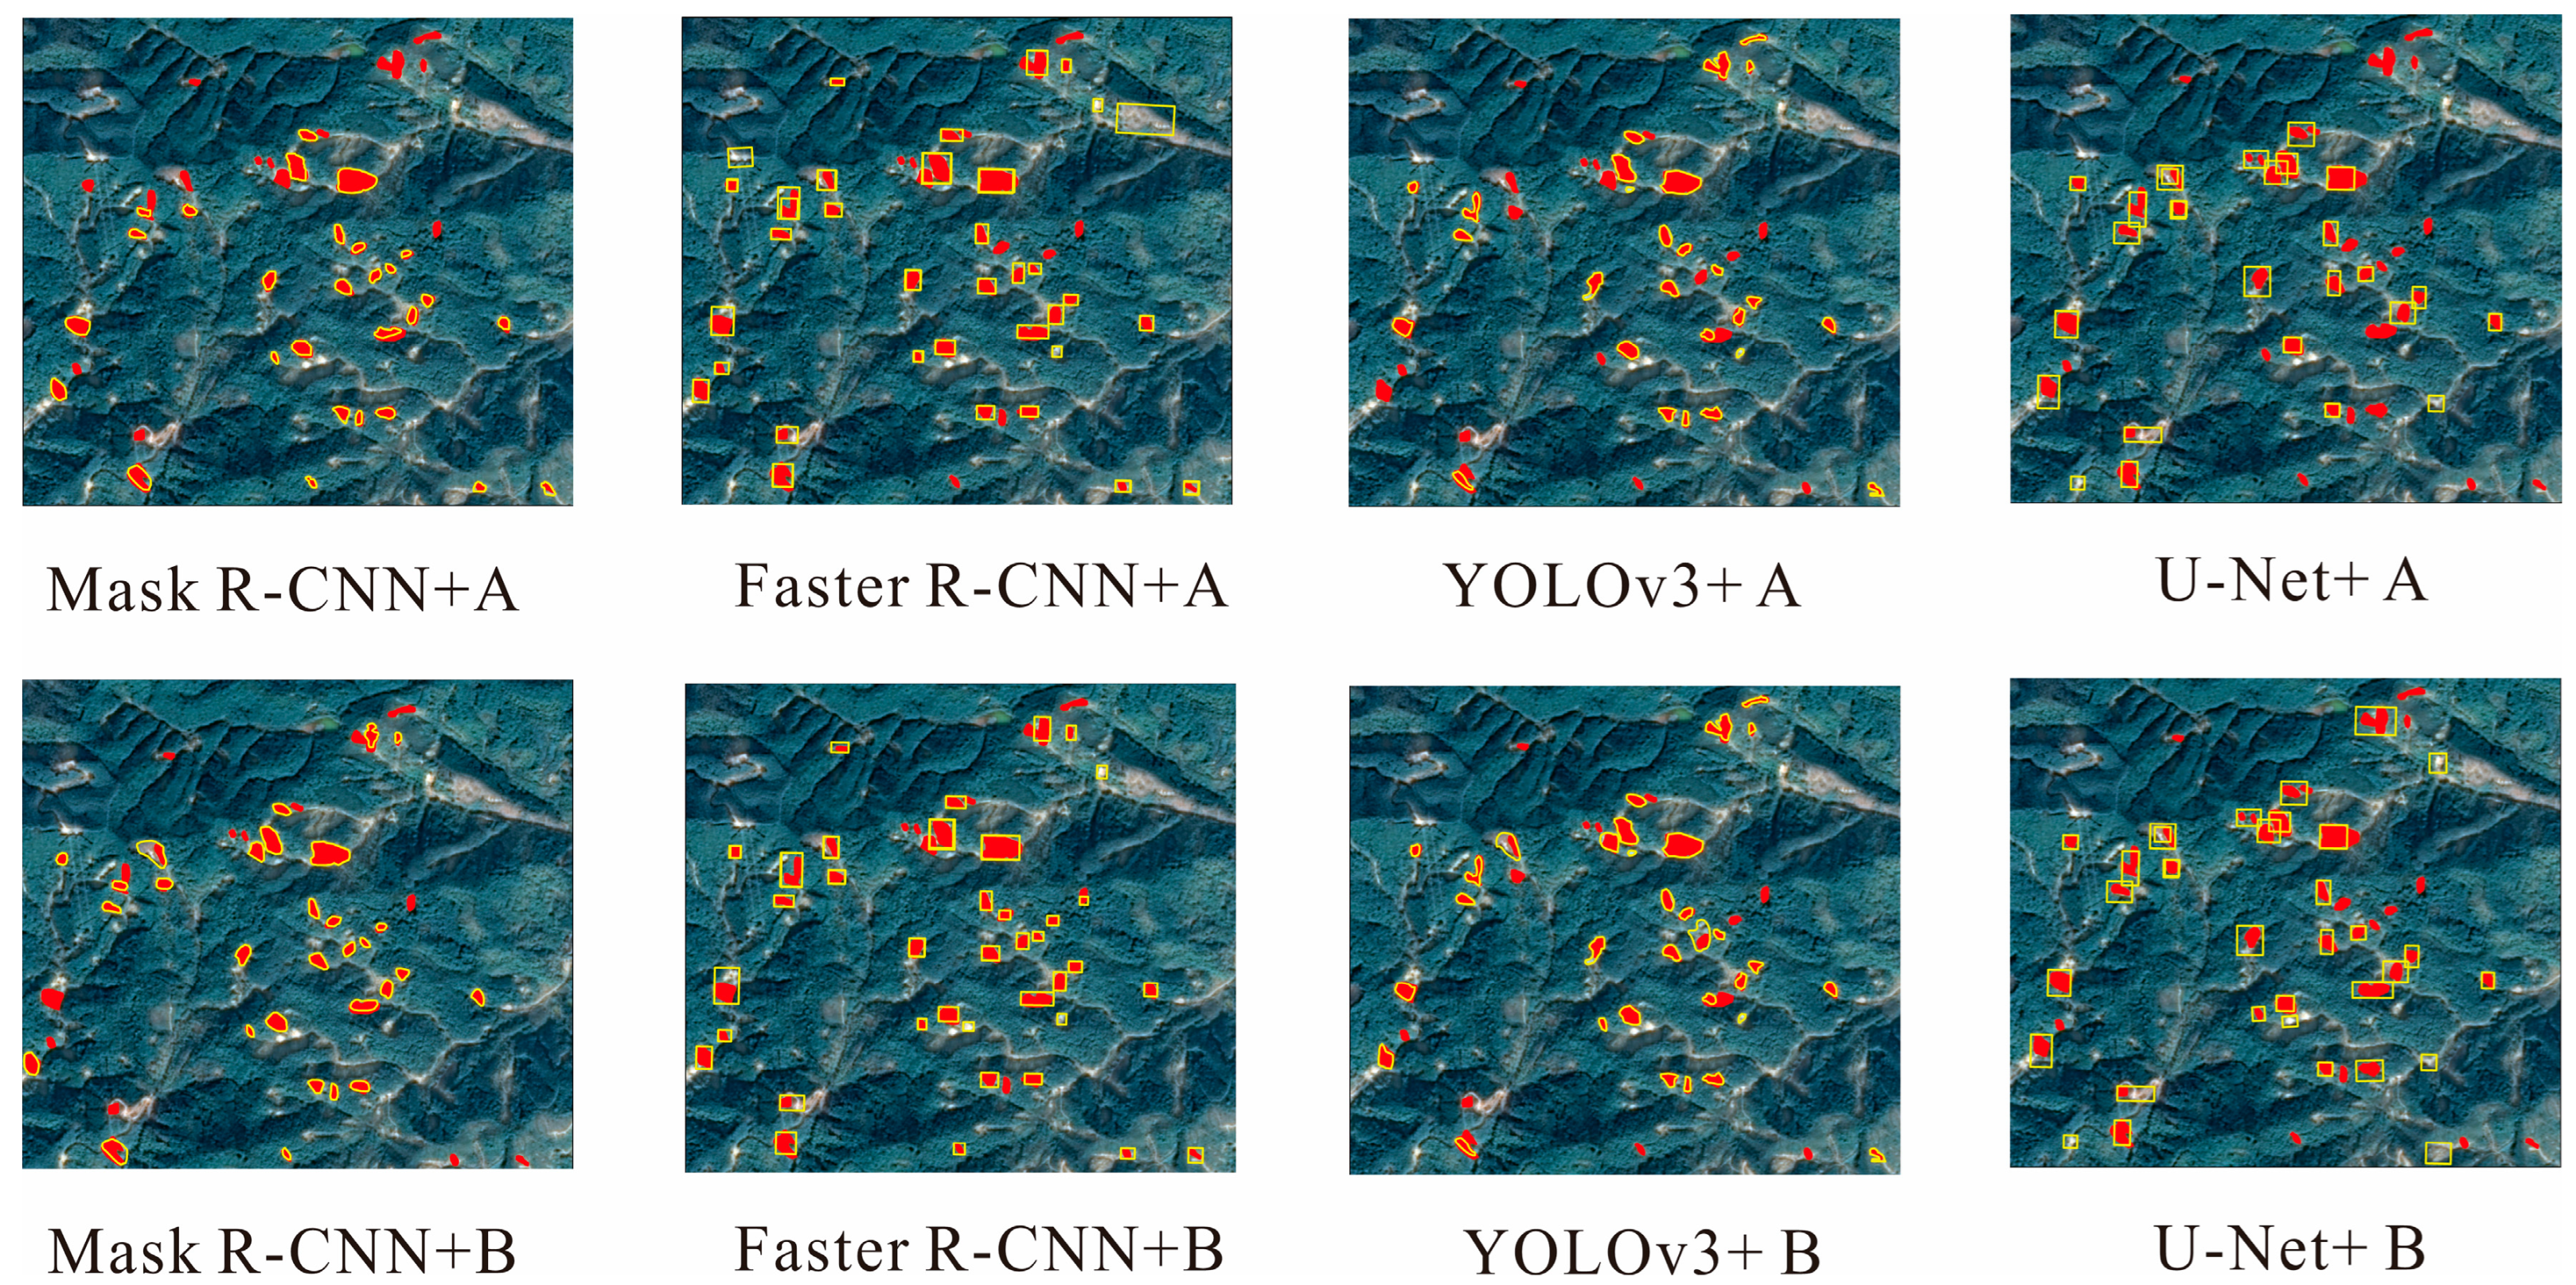
This paper aims to perform remote sensing interpretation through combining the masked R-CNN algorithm model with the constraints of spectral, structural, morphological and physical features of landslides in remote sensing imagery. The method makes use of the stacking of data layers to effectively extract features from the data, which improves the precision and accuracy of landslide identification and demonstrates a good ability to identify small, shallow landslides in southern China. First, a landslide recognition sample dataset is established based on known landslide information, and then various deep learning models based on sample libraries and constraints, including Mask R-CNN, Faster R-CNN, U-Net and YOLOv3, are trained and tested to compare the recognition accuracy of each algorithmic model. This is followed by a comparison of the effect of different rotation angles and different combinations of constraints on the recognition of the masked R-CNN model. Finally, the Mask R-CNN model is used to automatically extract landslides from all the image data and to exclude erroneously identified blocks of bare ground based on the physical characteristics of landslides. The results of this study can be used in the investigation of shallow rainfall-type landslide disasters in mountainous areas to provide technical methods, data support and decision guidance.

2. Study Area and Data

2.1. Study Area

From 21 May to 21 June 2022, heavy rainfall occurred in Guangdong Province, China, under the influence of the “Longzhoushui” phenomenon, with a cumulative rainfall of nearly 847.2 mm; in particular, from 16 to 21 June, the average rainfall reached 294 mm, nearly seven times the normal rainfall for the period. The continuous exceptionally heavy rainfall provided rich hydroclimatic conditions for landslide hazards, resulting in a large number of landslides of varying sizes in the study area, with landslides mainly developing in granite residual soil layers, and a small proportion of landslides in alluvial ditches evolving into debris flows. Among them, 110 townships in nine counties of Shaoguan and Qingyuan cities in the Beijiang basin were severely affected, with direct economic losses amounting to USD 268.2 million, with Qingyuan being one of the most affected areas during the round of heavy rainfall, posing a serious threat to local transportation and personal property and safety [45].
The Beijiang River Basin, located between 23°10′–25°31′N and 115°55′–114°50′E, has a total area of 46,700 km2, of which 92%, i.e., 42,900 km2, is a fan-shaped area in Guangdong Province. The first-order tributaries are Zhenjiang, Jinjiang, Wujiang, Nanshui, Yanjiang, Lianjiang, Jiujiang, Binjiang and Suijiang, whose geographical locations are shown in Figure 1. The Beijiang basin has a typical subtropical monsoonal humid climate, with cloudy and rainy weather; it has an average annual rainfall of between 1300 and 2500 mm, with an average annual rainfall of 1800 mm in the basin, showing a decreasing trend from south to north. The annual precipitation is mainly concentrated between April and September, with the longest and most intense continuous precipitation in May. The good climatic conditions provide conditions for the growth and development of vegetation. According to statistics, it takes about six months to restore vegetation cover to the areas damaged by shallow landslides, which makes the work of remote sensing interpretation somewhat difficult. The topography is mainly mountainous and hilly. The study area is influenced by tectonic movements, with folds and fractures being more developed, while neotectonic movements are relatively complex. The special natural geographical environment, climatic conditions and geological conditions have led to the existence and development of landslide hazards in the area.

2.2. Data Source

In this paper, a series of datasets are used, which include remote sensing image data from the Gaofen-1 satellite, digital elevation data, lithology data, rainfall data and the boundary data of the Beijiang River Basin; the detailed sources are shown in Table 1. In addition, in this paper the slope data were extracted on the basis of the DEM.

3. Methodology

Figure 2 shows the flow chart of landslide identification based on the Mask R-CNN model and incorporating physical mechanism–optical–morphological features of landslide hazards. Firstly, data collection and processing is performed, including radiometric calibration, geometric correction, orthorectification, geometric alignment, image fusion, resampling and normalization of the image data and geographic factor data (such as landslide-inducing factor data, texture feature pattern data and geometry feature pattern data). Secondly, the sample dataset and the training model are established: the sample dataset is established by the known landslide point data, and the geographical factors applicable to landslide identification are selected and used as constraints for the establishment of the training model. Finally, automatic landslide hazard identification is carried out on remote sensing images according to the training model.

3.1. Remote Sensing Characterization of Landslides

Rainfall landslides are characterized by geomorphological features such as a wide range of distribution, small scale and multiple groups. In the landslide development area, the surface vegetation and soil are damaged by rainfall, resulting in exposed ground surface and reduced vegetation cover [46,47]. These features make the landslides exhibit distinct spectral, morphological and textural characteristics in remote sensing images and clearly distinguish them from surrounding features [48]. Therefore, in this study, landslides in a newly developed stage were selected as the object of study, and the Mask R-CNN model was used for the automatic identification of landslides based on their spectral, morphological and textural features.

3.1.1. Spectral Characteristics

In the analysis of remote sensing imagery, we were able to identify landslides of the shallow unstable, rotational and offset slide types with some accuracy. There are significant differences in tonality between the landslide area and the surrounding features. Areas where landslides occur show grey or white tones, reflecting the color characteristics of fresh soil or rock masses, while vegetation and water bodies show darker tones. Through the comparative analysis of the brightness characteristics, we are able to exclude obvious distracting features, thus improving the accuracy and precision of landslide identification. In addition to this, the vegetation around the landslide area after the occurrence of the landslide is significantly different from the vegetation in other areas, as shown in Figure 3b,c below, where the vegetation on the slope is relatively sparse, with no huge upright trees but a small number of smaller trees. This results in vegetation and landslides showing significant variability in the red light band. Therefore, the NDVI normalized vegetation index was used to enhance the delineation of vegetated and non-vegetated areas.

3.1.2. Textural Features

On remote sensing images, the textures of buildings, roads and other areas of human activity differ significantly from natural features such as vegetation and bare soil and can be effectively distinguished from each other (see Figure 4 below). Landslides are very similar in tone to recently tilled agricultural land, but landslide textures are coarser on the imagery, and large patchy masses can be seen on some rocky landslide imagery; thus, texture features can be used to effectively remove buildings, roads and cultivated land. In this paper, texture features are extracted in ENVI 5.6 from grey-scale co-occurrence matrix images, with the window size of the statistical image element set to 5 × 5, the shift step set to 2 and the shift direction set to 2, and the grey-scale quantization level set to 64. The texture information used for this landslide identification includes the mean value reflecting the grey scale of the image and the contrast reflecting the sharpness of the image and the depth of the grooves in the texture.

3.1.3. Geometrical Features

In terms of geometry, landslides are mostly bumpy, horseshoe-shaped, oxbow-shaped, oval, or spatulate, without uniform morphology. As shown in Figure 5, in this study area, tongue and spoon shapes are predominant. The landslides have broken rocks, undulating topography, unevenly sunken local platforms on the slope surface, and steep and long slopes; although there are landslide platforms, their area is not large, and there is a slow dip downwards. Based on previous visual interpretations and landslide patterns in the study area, we found that the aspect ratio of shallow landslides is usually about 2.5, where the line segment with the greatest distance between any two points of a polygon patch is used as the long axis (L) of the polygon, and the short axis length is obtained by dividing the polygon area (A) by the long axis (W = A/L).

3.1.4. Physical Characteristics

During the occurrence of rainfall-type landslides, the movement of landslide materials is often subject to the influence of gravity and microtopography. A certain elevation difference will be generated within the landslide area; the elevation difference of river floodplains and construction areas and roads, except for exposed rocks, is obviously small. The area (A) and elevation difference ( D E M m a x D E M m i n ) of the study area, identified as a cluster of landslides, were extracted separately using Arcgis Pro software, and the statistical elevation difference was quantified using the area ( ( D E M m a x D E M m i n ) / A ) to exclude disturbing features with similar spectral, texture and shape characteristics.

3.2. Creation of a Landslide Sample Database

The landslide sample database consists of three components: stacking, data extraction and database creation [49]. As shown in Figure 6, the original one-dimensional data from each layer are stacked to form an n-dimensional dataset containing the joint data of all layers by stacking data layers representing different predictor variables. The joint dataset consists of remotely sensed imagery, landslide impact factors and landslide feature factors. Landslide samples verified in the field by drones, Google HD imagery and field surveys are then labelled at the pixel level using the LabelMe labelling tool (Figure 7), with a total of 378 landslides labelled. The labelled results are used as a ‘positive sample’, which includes the entire n-dimensional data of the surrounding area, and a negative sample is generated by randomly selecting areas where no landslides have been recorded. It is necessary to resample the input data to make the number of rows and columns consistent, as these data come from different sources, and the data standards are not uniform. Firstly, to facilitate training of a deep learning network, input data need to be resampled in order to have a consistent number of rows and columns. In this paper, resampling is done using linear interpolation, where image element values of four nearby points are used to perform linear interpolation, assigning different weights according to distance from interpolation point. Secondly, the input data consistency relationship should be constructed so that the data are standardized and unified, with remote sensing images as the reference, in order to facilitate the training of the deep learning network. Each factor is converted to a raster format with a spatial resolution of 2 × 2 m and normalized and classified according to the Jenks natural breakpoint method in the ArcMap program. The normalization formula is as follows:
x i = x i x m i n x m a x x m i n
where x i denotes the ith original data point, x m i n is the minimum value in the original dataset, x m a x is the maximum value in the original dataset and x i is the corresponding normalized value for the ith original data point.

3.3. Deep Learning Models

3.3.1. Fundamentals of Mask R-CNN

Mask R-CNN is an advanced instance segmentation technique that improves on Faster R-CNN to perform both target detection and semantic segmentation. The framework of the Mask R-CNN model is shown in Figure 8. The algorithm uses a convolutional neural network as the backbone model to extract the convolutional features of an image and construct a feature pyramid. In Mask R-CNN, ResNet and FPN are used as the backbone network to process the input image and generate a feature pyramid for further feature extraction. Candidate regions of different sizes and scales are generated on the feature pyramid by RPN, and these potential targets are classified and bounding box–generated. Unlike the RoI Align used by Faster R-CNN, Mask R-CNN uses a RoI Align layer to maintain the spatial correspondence between the image and the mask, resulting in accurate pixel-level mask prediction. Finally, each RoI alignment feature mapping provides two branches: one for target classification and bounding box regression, and the other for segmentation mask prediction. Mask R-CNN uses a multi-task training approach that takes into account a combination of target classification loss, bounding box regression loss and segmentation mask loss. Together, these loss functions drive the optimization and learning process of the model to improve the performance of target detection and segmentation.
L = L cls + L box + L mask L mask = Sigmoid ( mask k )
where Lcls is the target classification loss, Lbox is the bounding box regression loss and Lmask is the kth mask loss. Lmask is defined as the average binary cross-entropy on the kth mask and is calculated from the per-pixel sigmoid on the mask.
The backbone network, as the basis of convolutional neural networks, is used to extract the depth features of an image and different convolutional neural network architectures can be selected; Mask R-CNN selects the ResNet network as the image feature extraction network, while combining with FPN to fuse the location-accurate top-level features with the semantic-rich bottom-level features [51]. The core idea of ResNet is constant mapping, i.e., replacing the original ideal mapping f(x) with f(x) − x, which can ensure a faster subsequent feature extraction. In this paper, we use ResNet-50, a deep residual network with 50 layers, which is a subclass of convolutional networks and is the most commonly used image classification model. The advantage of FPN is that it can improve the accuracy and fast detection of small objects at multiple scales without increasing the computational effort.
RPN is based on the convolutional neural network structure to further determine the feature layers obtained by ResNet and FPN previously, filter out the locations where there may be targets, and integrate the operation of selecting candidate regions into the target detection framework. ROI Align is used to optimize the spatial location misalignment problem caused by ROI Pooling. The bilinear interpolation method is used to determine the feature value of each point in the feature map, and then pooling and other operations are performed to improve the accuracy, solving the problem of misalignment caused by extracting feature nuggets for rounding at the corresponding locations of the feature map. After ROI Align, the uniformly sized region of interest is entered into the classification regression branch and the mask branch. In the classification regression branch, two 1024-sized fully connected layers are passed, and then the specific category is determined in the classification branch. Unlike the initial category determination, the RPN only determines if it is an object. Further fine-tuning of the centroid and aspect of the position border is performed in the regression branch to precisely locate the object.

3.3.2. Faster R-CNN Model

The Faster R-CNN model was developed on the basis of the Fast R-CNN model [52]. The extraction of candidate regions in the network structure of Fast R-CNN is performed by a selective search. The selective search operation mainly uses a CPU and cannot use the high speed of a GPU; thus, the speed is still very slow. Ren et al. [26] proposed Faster R-CNN. The network is unique in that it proposes the RPN network structure; the candidate region search is similarly added to the training process, and RPN shares parameters with the convolutional layer, further improving network detection efficiency. Although it uses a convolutional neural network, it offers advantages over conventional neural networks in terms of higher detection quality and a capacity to incorporate multiple loss functions into a single training process. The model is said to be a true end-to-end object detection system because it organically combines the four modules of feature extraction, region generation suggestion, RoI merging, and classification and regression within the same network.

3.3.3. The U-Net Model

U-Net is a model based on a modified FCN proposed by Ronneberger et al. [53] in 2015 and initially applied to the task of medical image segmentation. The net structure of U-Net consists of a compressing and an expanding path, also known as the encoder–decoder structure. The contraction path is used to obtain contextual information and perform feature extraction, while the expansion path is used to accurately locate the feature positions and to connect the feature maps in the up- and downsampling processes through branch connections to achieve the fusion of the superficial and deep semantic information to reduce the loss of edge information. The branch connections of U-Net fully incorporate the features corresponding to the superficial layers during the decoding process, so that the small samples of the data are not easy to overfit. However, U-Net’s training rate is slow. The reason is that the network performs classification at each pixelpoint, and segmentation requires one patch at each pixelpoint for training. The high resemblance between neighboring pixel points causes high redundancy and thus slows down the network training.

3.3.4. YOLOv3 Model

YOLO was first proposed by Redmon et al. [54] in 2015 as a single-step target detection algorithm with a speed benefit over traditional two-step algorithms. YOLOv3 introduces a new network structure, Darknet-53, and introduces residual learning features and a high number of residual chunks to increase network depth and representativeness [55]. During training, YOLOv3 uses a number of independent logistic regression classifiers, with the classification prediction made via a binary cross-entropy loss function. This classifier design enables the model to perform multiple label classification, that is, to determine whether an object within the object boundaries belongs to the current label. In addition, YOLOv3 uses the idea of feature pyramid networks to make predictions at three different scales, 13 × 13, 26 × 26 and 52 × 52, in order to improve detection accuracy and maintain high-speed operation. These three scales allow information to be extracted, feature maps of varying sizes to be fused and recognition outputs to be produced. This design enhances detection accuracy while maintaining fast performance.

4. Experiments

4.1. Evaluation Indicators for Recognition Accuracy

In this paper, the secondary evaluation metrics precision, recall and accuracy are used as the accuracy evaluation of the recognition model [56]. Precision shows the ratio of correctly identified landslide hazards to the number of instances identified as landslide hazards; recall shows the ratio of correctly identified landslide hazards to the number of actual landslide instances; and accuracy shows the ratio of predicted landslide hazards to correct predictions.
P r e c i s i o n = T P T P + F P
R e c a l l = T P T P + F N
a c c u r a c y = T P + T N T P + F N + T P + F N
where TP is a true positive, which represents the landslide area accurately described by the applied method. FP is a false positive, which is defined as the non-landslide area detected by the applied method as the landslide area in the image. FN is a false negative, which shows the actual landslide area not detected by the applied method. TN is a true negative, which shows the non-landslide area detected by the applied method.

4.2. Experimental Design

The hardware environment of this research was a GeForce GTX 1080 graphics card, an Intel(R) Xeon(R) CPU E5-2680 v3 @ 250 GHz processor, and 40 GB of RAM. The experimental parameters were 20 epochs, 100 steps per epoch, a batch size of 4 and a 0.0001% learning rate.
A first set of comparison experiments was designed to determine the applicability and effectiveness of the proposed method. As shown in Table 2, a number of popular deep network models (MaskR-CNN, Faster-CNN, U-Net and YOLOv3) were selected for testing during the training process, and the training datasets were the original images and the image data with additional geographic factors added for overlay processing. We defined “Original satellite images” as “A” and “Original satellite images + geographical factors” as “B”. In addition to analyzing the impact of this paper’s approach on different deep learning models, we can also reliably assess whether the models built in this study have advantages in landslide extraction tasks.
The good or bad training effect of the deep learning model is not only related to the model parameter adjustment; the size of the used dataset also has a significant impact on the training effect: the larger the dataset, the better the recognition effect of the trained model for landslide hazard recognition [57]. There are landslides with different orientations in the study area, and the features extracted from images of the same target taken at different azimuths can be transformed into each other using rotational angle processing to improve the accuracy of detecting landslide hazards with different orientations. In the second part of the work, the model will be trained again by rotating the batch size images and comparing the recognition results with different rotation angles.
In addition, a third set of comparison experiments is designed in this paper to analyze which combination of factors in the proposed method is the key to improving the recognition efficiency. Six comparison experiments are designed depending on the input training dataset, as shown in Table 3. In Experiment Ⅰ, the original image, the additional landslide-inducing factor data, the texture feature sample data and the geometric feature sample data are used as the input dataset and processed with physical features. Based on Experiment Ⅰ, Experiment Ⅱ reduces the landslide-inducing factor data, Experiment Ⅲ reduces the textural feature sampling data, Experiment Ⅳ reduces the geometry feature sampling, Experiment Ⅴ reduces the physical feature processing, and Experiment Ⅵ uses only the original image as the input data.

5. Results

5.1. Comparing Different Deep Learning Models

The first set of results is shown in Table 4, which compares the test results of the different models, each of which shows an improvement in all evaluation metrics. Among them, the Mask R-CNN model outperforms the Faster-CNN, U-Net and YOLOv3 models in terms of recognition performance. It improves precision and accuracy by more than 2.5% compared to the other models. Figure 9 shows the recognition results of the different models in the test set. As can be seen from the figure, Mask R-CNN not only provides more accurate detection results than the other models but can also segment each landslide shape independently and shows better landslide edge segmentation results. The mask for the recognition of large-scale landslides is more complete and fits well with the actual shape of the landslide, while also taking into account the recognition of small-scale landslides.

5.2. Dataset and Sample Processing

The rotation angle can effectively improve the precision, recall and accuracy of the model. The results of the second set of experiments are shown in Table 5. In particular, when the rotation angle was set to 90°, the precision, recall and accuracy of the model achieved 87.31%, 86.54% and 91.29%, respectively. However, when the rotation angle was less than 90°, the dataset was overexpanded, the precision, recall and accuracy of the model were reduced, and the time required for model training increased significantly with the reduction of the rotation angle. Therefore, in order to avoid the redundancy of the model dataset, an appropriate rotation angle should be selected in order to improve the efficiency and accuracy of the model training.

5.3. Keys Affecting Recognition Precision

From the results of the comparison experiments in Table 6, it can be seen that the landslide triggering factor data, the texture feature sample data, the geometric feature samples and the execution of the physical feature processing can effectively help the model to discriminate between the background objects and the landslides. Among them, the landslide evoking factor data and texture feature sample data improve the accuracy of landslide identification most clearly, with the precision increasing by 5.39% and 6.8%, the recall increasing by 4.59% and 5.25%, and the accuracy increasing by 5.1% and 6.24%, respectively. The increase in precision and recall is usually accompanied by an increase in the number of correctly identified landslides and decrease in the number of incorrect classifications. Therefore, based on the results obtained, it can be seen that a reasonable selection of geographical factors can effectively improve the performance of the Mask R-CNN model and reduce the number of misclassified and omitted landslides to a certain extent.

6. Discussion

6.1. Analysis of Identification Results

Based on the results of the above three sets of experiments, landslides for the June 2022 extreme rainfall events that occurred in the Beijiang River Basin were identified using a Mask R-CNN model trained on the dataset with geographical factors superimposed and rotated by 90°. The identification results are shown in Figure 10, where the number of induced landslides is 3782, and the total identified landslide area reaches 4.6 × 10⁶ m2. However, landslides with a landslide area of more than 10,000 m2 account for less than 5% of the total number, and landslides with a landslide area of more than 5000 m2 account for less than 10% of the total number, suggesting that this rainfall event mainly induced landslides of a relatively small size. Since the landslides are considered as point elements, their geographical locations can be expressed in terms of coordinates; 3782 landslide points were imported into ArcMap10.8. The results of the calculation using the average nearest neighbor tool showed that the average nearest neighbor index of landslide points in the study area was 0.398 (Figure 11a) and passed the significance test at the 0.01 confidence level. This indicates that landslide points in the study area have a strong spatial aggregation tendency. On this basis, the estimated kernel density was calculated to show the area of spatial aggregation and the degree of aggregation. The kernel density results are shown in Figure 11b. This figure shows that the spatial distribution of landslide hazards in the study area has a high spatial aggregation and spatial variability; the maximum value appeared in the Beijiang River Basin and the Lianjiang River Basin, reaching more than 1.13, which indicates that the distribution of landslides in these areas is the most concentrated. It is not difficult to see that the results have a strong correlation with the water system.
We comprehensively analyzed the training and validation sets based on the recognition accuracy evaluation index to quantitatively evaluate the landslide recognition. The experimental results showed that landslide detection precision reached 87.31%, recall reached 86.54%, and accuracy reached 91.29%. We conducted field validation in Lechang, Yangshan, Lianzhou, Luyuan and Yizhang, covering a total of 378 landslide cases, to verify the effect of the Mask R-CNN–based model with superimposed landslide recognition features on landslide recognition accuracy. After the comparative analysis, we were able to successfully assess the accuracy of 341 landslides, with a remote sensing detection accuracy of more than 90%. This further validates the feasibility and high accuracy of this research method in identifying landslides, which can be applied to identifying landslides on a large scale.

6.2. Limitations and Future Prospects

In this paper, based on datasets with different feature combinations and using physical features to highlight landslide areas, we distinguish flat bare land, mining areas, buildings, etc., to reduce the misjudgment of landslides in mountainous areas. This effectively improves the recognition efficiency and accuracy of the Mask R-CNN model for mass landslides and provides a feasible reference solution for geological disaster investigation. However, the limited sample size of the landslide hazard dataset used for deep learning in this study area resulted in some omissions and misjudgments in the recognition results. Landslides can be detected by increasing the effective sample size or obtaining the changing image information in the time period before and after the event. Moreover, the spatial resolution of remote sensing images needs to be improved to accurately identify rainfall-induced small mass landslides still. In addition, the spatial attributes are not considered; the geological–geomorphological and hydro-climatic conditions in the northern and southern parts of the Beijiang River Basin are highly variable, and the key influencing factors of landslides are closely related to the geological, hydro-meteorological and topographical features of the study area, which makes the transferability of this paper’s method a challenge. This problem can be solved by increasing the sample size of complex areas or cutting the study area into smaller images and setting higher weights of network parameters for areas with complex terrain, so as to improve the problem of recognition error caused by the imbalance between samples in different areas. Previous studies have shown that the background information of remote sensing images can improve the generalization ability of the model during the recognition process, but this information also interferes with the model detection capability [58]. Therefore, it is necessary to reasonably combine effective features or add the attention mechanism in the feature pyramid to enhance the interrelationship between the features, and to select the landslide-related information from a large amount of information.

7. Conclusions

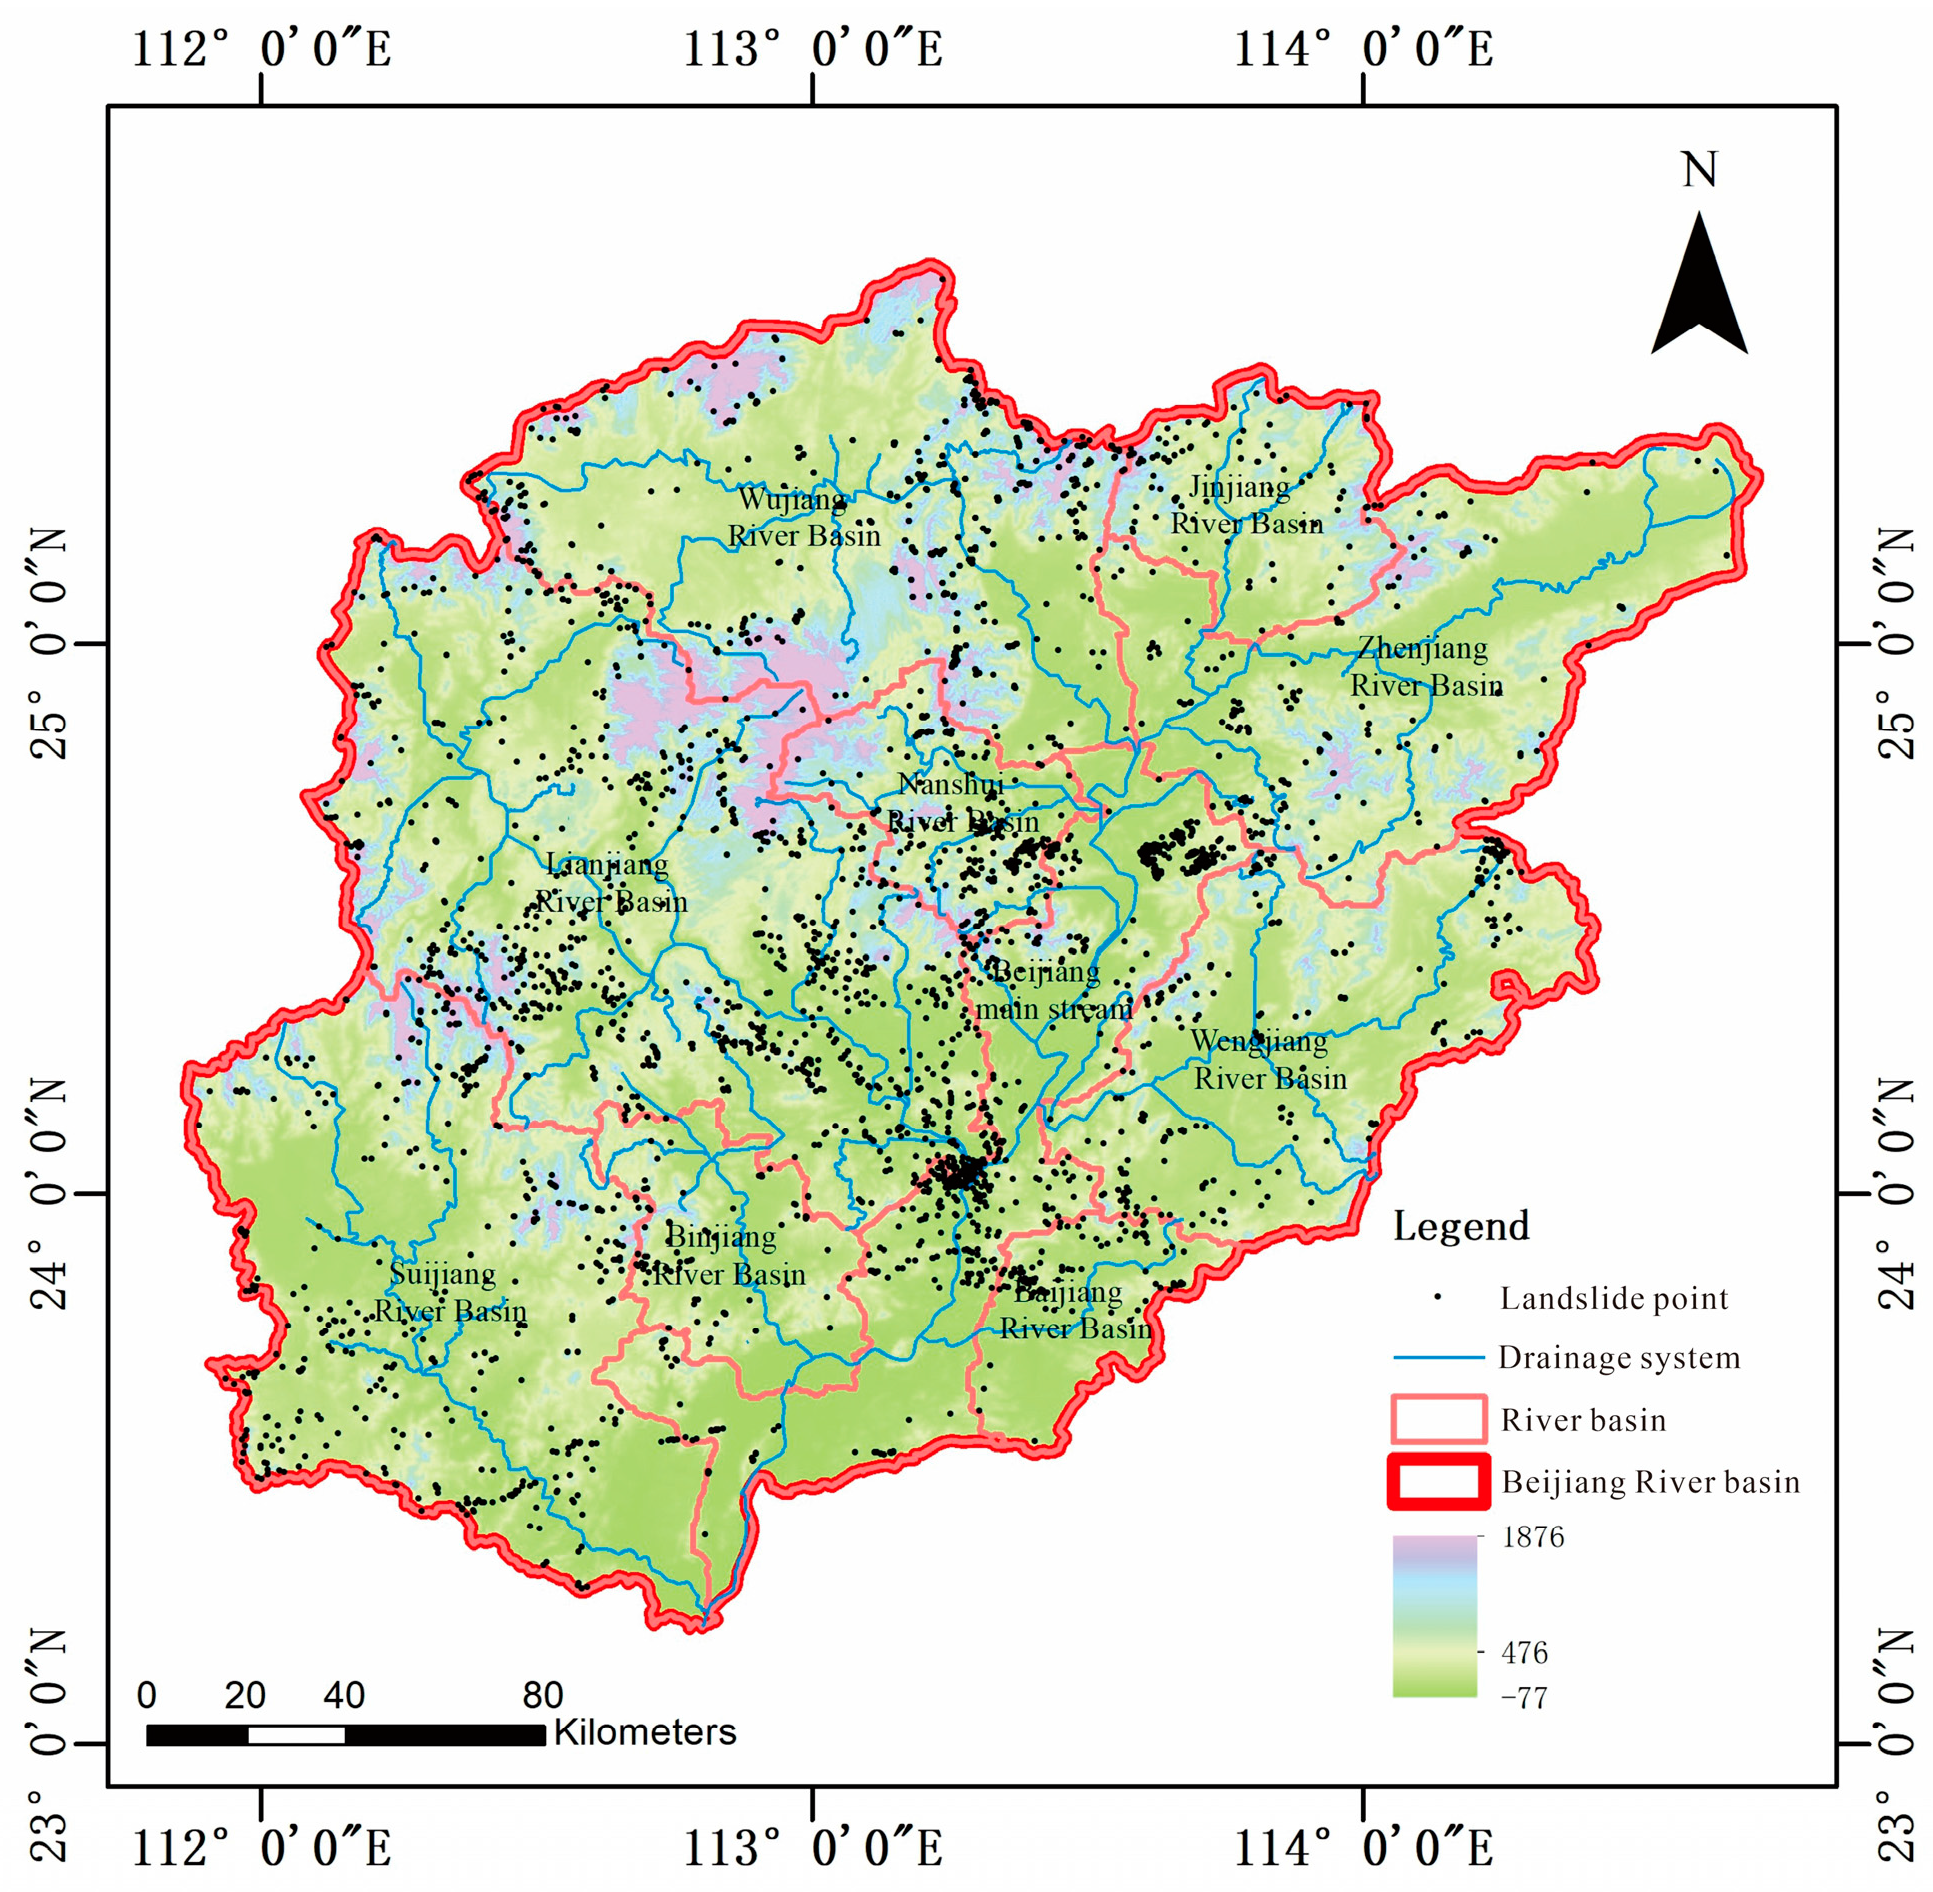
In this study, a Mask R-CNN model constructed on the basis of geographic factors affecting landslide generation and landslide remote sensing identification features is proposed to address the lack of training dataset and misdiagnosis of confusing features (e.g., bare ground, river floodplains, buildings, roads, etc.). The method was validated using data from June 2022 rainfall-induced landslides in the Beijiang River Basin. In addition, Faster-CNN, U-Net and YOLOv3 models were used to compare the applicability of different depth models with the incoming Mask R-CNN model, and the results showed that the performance of the Mask R-CNN model was better compared to the other models, with a precision rate of 81.91%, a recall rate of 84.07% and an accuracy of 87.28%. By comparing the results of model training with different rotation angles, it is found that the model has the strongest generalization ability and robustness when rotated by 90°, which can effectively improve the efficiency and accuracy of model recognition. By adding constraints, the recognition accuracy and precision can be improved. From the comparison experiments of different constraints, it can be found that superimposing landslide-evoking factor data and texture feature sample data improves the recognition accuracy of the model. This finding can bring improvement to different deep learning models, as it involves modifications at the data level. However, there are still errors in the extraction results, and how to find effective features and make reasonable combinations of them instead of simply adding various triggering factors to train the model will become a future research trend. The exceptionally heavy rainfall in June 2022 was a major factor in triggering this landslide. This study can help to understand the distribution pattern of rainfall-induced, shallow, massive landslides in the Beijiang River Basin and provide data and technology for the prevention of rainfall-induced geological hazards in the hilly areas of southeastern China.

Author Contributions

Data curation, formal analysis, methodology, writing—original draft, writing—review and editing, visualization, Z.W.; resources, writing—review and editing, S.Y. and Q.G.; formal analysis, writing—review and editing, H.L. and B.Z.; data curation, validation, J.W. All authors have read and agreed to the published version of the manuscript.

Funding

This research was funded by the National Natural Science Foundation of China (NSFC) (Grant Nos.41977413, 42101084, 42271091); Natural Science Foundation of Guangdong Province (Grant No. 2022A1515011898).

Data Availability Statement

Not applicable.

Acknowledgments

Thanks to the Guangdong Data Centre for Geographical Sciences (Guangzhou Institute of Geography) and Chen Jun for providing the relevant data.

Conflicts of Interest

The authors declare no conflict of interest.

References

  1. Yu, G.; Zhang, M.; Hu, W. Analysis on the development characteristics and hydrodynamic conditions for the massive debris flow in Tianshui. Northwest Geol. 2014, 47, 185–191. [Google Scholar]
  2. Liu, J. Study on the Pattern and Mechanism of Large-Scale Landslides in Longnan Mountainous Area; Lanzhou University: Lanzhou, China, 2020. [Google Scholar]
  3. Guo, Z.; Yin, K.; Gui, L.; Liu, Q.; Huang, F.; Wang, T. Regional rainfall warning system for landslides with creep deformation in three gorges using a statistical black box model. Sci. Rep. 2019, 9, 8962. [Google Scholar] [CrossRef] [PubMed]
  4. Lin, Q.; Wang, Y. Spatial and temporal analysis of a fatal landslide inventory in China from 1950 to 2016. Landslides 2018, 15, 2357–2372. [Google Scholar] [CrossRef]
  5. Huang, Y.; Xu, C.; Zhang, X.; Li, L. Bibliometric analysis of landslide research based on the WOS database. Nat. Hazards Res. 2022, 2, 49–61. [Google Scholar] [CrossRef]
  6. Gariano, S.L.; Guzzetti, F. Landslides in a changing climate. Earth-Sci. Rev. 2016, 162, 227–252. [Google Scholar] [CrossRef]
  7. Fustos-Toribio, I.; Manque-Roa, N.; Vásquez Antipan, D.; Hermosilla Sotomayor, M.; Letelier Gonzalez, V. Rainfall-induced landslide early warning system based on corrected mesoscale numerical models: An application for the southern Andes. Nat. Hazards Earth Syst. Sci. 2022, 22, 2169–2183. [Google Scholar] [CrossRef]
  8. Dai, F.; Lee, C. Frequency–volume relation and prediction of rainfall-induced landslides. Eng. Geol. 2001, 59, 253–266. [Google Scholar] [CrossRef]
  9. Piciullo, L.; Calvello, M.; Cepeda, J.M. Territorial early warning systems for rainfall-induced landslides. Earth-Sci. Rev. 2018, 179, 228–247. [Google Scholar] [CrossRef]
  10. Lee, M.L.; Ng, K.Y.; Huang, Y.F.; Li, W.C. Rainfall-induced landslides in Hulu Kelang area, Malaysia. Nat. Hazards 2014, 70, 353–375. [Google Scholar] [CrossRef]
  11. Ray, R.L.; Lazzari, M.; Olutimehin, T. Remote sensing approaches and related techniques to map and study landslides. Landslides-Investig. Monit. 2020, 2, 1–25. [Google Scholar]
  12. Ahmad, M.N.; Shao, Z.; Aslam, R.W.; Ahmad, I.; Liao, M.; Li, X.; Song, Y. Landslide hazard, susceptibility and risk assessment (HSRA) based on remote sensing and GIS data models: A case study of Muzaffarabad Pakistan. Stoch. Environ. Res. Risk Assess. 2022, 36, 4041–4056. [Google Scholar] [CrossRef]
  13. Ehteram, M.; Ahmed, A.N.; Sheikh Khozani, Z.; El-Shafie, A. Convolutional Neural Network-Support Vector Machine Model-Gaussian Process Regression: A New Machine Model for Predicting Monthly and Daily Rainfall. Water Resour. Manag. 2023, 37, 3631–3655. [Google Scholar] [CrossRef]
  14. Sato, H.P.; Hasegawa, H.; Fujiwara, S.; Tobita, M.; Koarai, M.; Une, H.; Iwahashi, J. Interpretation of landslide distribution triggered by the 2005 Northern Pakistan earthquake using SPOT 5 imagery. Landslides 2007, 4, 113–122. [Google Scholar] [CrossRef]
  15. Mohan, A.; Singh, A.K.; Kumar, B.; Dwivedi, R. Review on remote sensing methods for landslide detection using machine and deep learning. Trans. Emerg. Telecommun. Technol. 2021, 32, e3998. [Google Scholar] [CrossRef]
  16. Leshchinsky, B.A.; Olsen, M.J.; Tanyu, B.F. Contour Connection Method for automated identification and classification of landslide deposits. Comput. Geosci. 2015, 74, 27–38. [Google Scholar] [CrossRef]
  17. Ju, Y.; Xu, Q.; Jin, S.; Li, W.; Su, Y.; Dong, X.; Guo, Q. Loess landslide detection using object detection algorithms in northwest China. Remote Sens. 2022, 14, 1182. [Google Scholar] [CrossRef]
  18. Zhao, W.; Li, A.; Nan, X.; Zhang, Z.; Lei, G. Postearthquake landslides mapping from Landsat-8 data for the 2015 Nepal earthquake using a pixel-based change detection method. IEEE J. Sel. Top. Appl. Earth Obs. Remote Sens. 2017, 10, 1758–1768. [Google Scholar] [CrossRef]
  19. Ma, Y. An Automatic Landslide Identification Method Based on Remote Sensing Image Recognition; Tibet University: Lhasa, China, 2022. [Google Scholar]
  20. Zhang, Q.; Zhao, C. Semiautomatic object-oriented loose landslide recognition based on high resolution remote sensing images in Heifangtai, Gansu. J. Catastrophology 2017, 32, 210–215. [Google Scholar]
  21. Zhang, P.; Xu, C.; Ma, S.; Shao, X.; Tian, Y.; Wen, B. Automatic extraction of seismic landslides in large areas with complex environments based on deep learning: An example of the 2018 iburi earthquake, Japan. Remote Sens. 2020, 12, 3992. [Google Scholar] [CrossRef]
  22. Qigen, L.; Zhenhua, Z.; Yingqi, Z.; Ying, W. Object-oriented detection of landslides based on the spectral, spatial and morphometric properties of landslides. Remote Sens. Technol. Appl. 2017, 32, 931–937. [Google Scholar]
  23. Hui, D.; Maosheng, Z.; Weihong, Z.; Tao, Z. High resolution remote sensing for the identification of loess landslides: Example from Yan’an City. Northwestern Geol. 2019, 52, 231–239. [Google Scholar]
  24. Yu, B.; Chen, F.; Xu, C. Landslide detection based on contour-based deep learning framework in case of national scale of Nepal in 2015. Comput. Geosci. 2020, 135, 104388. [Google Scholar] [CrossRef]
  25. Chen, L.-C.; Zhu, Y.; Papandreou, G.; Schroff, F.; Adam, H. Proceedings of the European Conference on Computer Vision (ECCV); Springer: Berlin/Heidelberg, Germany, 2022; pp. 801–818. [Google Scholar]
  26. Ren, S.; He, K.; Girshick, R.; Sun, J. Faster r-cnn: Towards real-time object detection with region proposal networks. IEEE Trans. Pattern Anal. Mach. Intell. 2017, 39, 1137–1149. [Google Scholar] [CrossRef] [PubMed]
  27. He, K.; Gkioxari, G.; Dollár, P.; Girshick, R. Mask r-cnn. In Proceedings of the IEEE International Conference on Computer Vision, Cambridge, MA, USA, 20–23 June 1995; pp. 2961–2969. [Google Scholar]
  28. Redmon, J.; Divvala, S.; Girshick, R.; Farhadi, A. You only look once: Unified, real-time object detection. In Proceedings of the IEEE Conference on Computer Vision and Pattern Recognition, San Juan, PR, USA, 17–19 June 1997; pp. 779–788. [Google Scholar]
  29. Ullo, S.L.; Mohan, A.; Sebastianelli, A.; Ahamed, S.E.; Kumar, B.; Dwivedi, R.; Sinha, G.R. A new mask R-CNN-based method for improved landslide detection. IEEE J. Sel. Top. Appl. Earth Obs. Remote Sens. 2021, 14, 3799–3810. [Google Scholar] [CrossRef]
  30. Qi, W.; Wei, M.; Yang, W.; Xu, C.; Ma, C. Automatic mapping of landslides by the ResU-Net. Remote Sens. 2020, 12, 2487. [Google Scholar] [CrossRef]
  31. Lei, T.; Xue, D.; Lv, Z.; Li, S.; Zhang, Y.; Nandi, A.K. Unsupervised change detection using fast fuzzy clustering for landslide mapping from very high-resolution images. Remote Sens. 2018, 10, 1381. [Google Scholar] [CrossRef]
  32. Fu, R.; He, J.; Liu, G.; Li, W.; Mao, J.; He, M.; Lin, Y. Fast seismic landslide detection based on improved mask R-CNN. Remote Sens. 2022, 14, 3928. [Google Scholar] [CrossRef]
  33. Ding, A.; Zhang, Q.; Zhou, X.; Dai, B. Automatic recognition of landslide based on CNN and texture change detection. In Proceedings of the 31st Youth Academic Annual Conference of Chinese Association of Automation (YAC), Wuha, China, 11–13 November 2016; pp. 444–448. [Google Scholar]
  34. Wang, Y.; Wang, X.; Jian, J. Remote sensing landslide recognition based on convolutional neural network. Math. Probl. Eng. 2019, 2019, 1–12. [Google Scholar] [CrossRef]
  35. Huang, J.; Xin, L.; Fang, C.; Ru, C.; Huimin, L.; Bowen, D. A deep learning recognition model for landslide terrain based on multi-source data fusion. Chin. J. Geol. Hazard Control 2022, 33, 33–41. [Google Scholar]
  36. Ghorbanzadeh, O.; Shahabi, H.; Crivellari, A.; Homayouni, S.; Blaschke, T.; Ghamisi, P. Landslide detection using deep learning and object-based image analysis. Landslides 2022, 19, 929–939. [Google Scholar] [CrossRef]
  37. Ghorbanzadeh, O.; Blaschke, T.; Gholamnia, K.; Meena, S.R.; Tiede, D.; Aryal, J. Evaluation of different machine learning methods and deep-learning convolutional neural networks for landslide detection. Remote Sens. 2019, 11, 196. [Google Scholar] [CrossRef]
  38. Gao, X.; Chen, T.; Niu, R.; Plaza, A. Recognition and mapping of landslide using a fully convolutional DenseNet and influencing factors. IEEE J. Sel. Top. Appl. Earth Obs. Remote Sens. 2021, 14, 7881–7894. [Google Scholar] [CrossRef]
  39. Zhang, C.; Zhou, J.; Wang, H.; Tan, T.; Cui, M.; Huang, Z.; Wang, P.; Zhang, L. Multi-species individual tree segmentation and identification based on improved mask R-CNN and UAV imagery in mixed forests. Remote Sens. 2022, 14, 874. [Google Scholar] [CrossRef]
  40. Feng, W.; Bai, H.; Lan, B.; Wu, Y.; Wu, Z.; Yan, L.; Ma, X. Spatial–temporal distribution and failure mechanism of group-occurring landslides in Mibei village, Longchuan County, Guangdong, China. Landslides 2022, 19, 1957–1970. [Google Scholar] [CrossRef]
  41. Sui, H.; Huang, L.; Liu, C. Detecting building façade damage caused by Earthquake using CBAM-improved mask R-CNN. Geomat. Inf. Sci. Wuhan Univ. 2020, 45, 1660–1668. [Google Scholar]
  42. Liu, Y.; Yao, X.; Gu, Z.; Zhou, Z.; Liu, X.; Chen, X.; Wei, S. Study of the automatic recognition of landslides by using InSAR images and the improved mask R-CNN model in the Eastern Tibet Plateau. Remote Sens. 2022, 14, 3362. [Google Scholar] [CrossRef]
  43. Jiang, W.; Xi, J.; Li, Z.; Zang, M.; Chen, B.; Zhang, C.; Liu, Z.; Gao, S.; Zhu, W. Deep Learning for Landslide Detection and Segmentation in High-Resolution Optical Images along the Sichuan-Tibet Transportation Corridor. Remote Sens. 2022, 14, 5490. [Google Scholar] [CrossRef]
  44. Yang, R.; Zhang, F.; Xia, J.; Wu, C. Landslide extraction using Mask R-CNN with background-enhancement method. Remote Sens. 2022, 14, 2206. [Google Scholar] [CrossRef]
  45. Lixin, W. Lessons learnt from the defence against the “22-6” Beijiang River deluge. China Water Resources 2022. Available online: https://kns.cnki.net/kcms/detail/detail.aspx?FileName=SLZG202222005&DbName=CJFQ2022 (accessed on 17 May 2023).
  46. Yan, L.; Gong, Q.; Wang, F.; Chen, L.; Li, D.; Yin, K. Integrated Methodology for Potential Landslide Identification in Highly Vegetation-Covered Areas. Remote Sens. 2023, 15, 1518. [Google Scholar] [CrossRef]
  47. Bai, H.; Feng, W.; Yi, X.; Fang, H.; Wu, Y.; Deng, P.; Dai, H.; Hu, R. Group-occurring landslides and debris flows caused by the continuous heavy rainfall in June 2019 in Mibei Village, Longchuan County, Guangdong Province, China. Nat. Hazards 2021, 108, 3181–3201. [Google Scholar] [CrossRef]
  48. Ji, S.; Yu, D.; Shen, C.; Li, W.; Xu, Q. Landslide detection from an open satellite imagery and digital elevation model dataset using attention boosted convolutional neural networks. Landslides 2020, 17, 1337–1352. [Google Scholar] [CrossRef]
  49. Wang, H.; Zhang, L.; Yin, K.; Luo, H.; Li, J. Landslide identification using machine learning. Geosci. Front. 2021, 12, 351–364. [Google Scholar] [CrossRef]
  50. Xie, B. Research on Segmentation Algorithm for Wood Defect Detection Based on Improved Mask R-CNN; Harbin Institute of Technology: Harbin, China, 2022. [Google Scholar]
  51. Lin, T.-Y.; Dollár, P.; Girshick, R.; He, K.; Hariharan, B.; Belongie, S. Feature pyramid networks for object detection. In Proceedings of the IEEE Conference on Computer Vision and Pattern Recognition, San Juan, PR, USA, 17–19 June 1997; pp. 2117–2125. [Google Scholar]
  52. Zhong, Z.; Sun, L.; Huo, Q. Improved localization accuracy by LocNet for Faster R-CNN based text detection in natural scene images. Pattern Recognit. 2019, 96, 106986. [Google Scholar] [CrossRef]
  53. Ronneberger, O.; Fischer, P.; Brox, T. Medical Image Computing and Computer-Assisted Intervention–MICCAI 2015. In Proceedings of the Part III 18th International Conference, Munich, Germany, 5–9 October 2015; Springer: Berlin/Heidelberg, Germany, 2015; pp. 234–241. [Google Scholar]
  54. Hinton, G.; Vinyals, O.; Dean, J. Distilling the knowledge in a neural network. arXiv 2015, arXiv:1503.02531. [Google Scholar]
  55. Kou, X.; Liu, S.; Cheng, K.; Qian, Y. Development of a YOLO-V3-based model for detecting defects on steel strip surface. Measurement 2021, 182, 109454. [Google Scholar] [CrossRef]
  56. AlDahoul, N.; Ahmed, A.N.; Allawi, M.F.; Sherif, M.; Sefelnasr, A.; Chau, K.-w.; El-Shafie, A. A comparison of machine learning models for suspended sediment load classification. Eng. Appl. Comput. Fluid Mech. 2022, 16, 1211–1232. [Google Scholar] [CrossRef]
  57. Khalifa, N.E.; Loey, M.; Mirjalili, S. A comprehensive survey of recent trends in deep learning for digital images augmentation. Artif. Intell. Rev. 2022, 55, 2351–2377. [Google Scholar] [CrossRef]
  58. Hou, H.; Chen, M.; Tie, Y.; Li, W. A universal landslide detection method in optical remote sensing images based on improved YOLOX. Remote Sens. 2022, 14, 4939. [Google Scholar] [CrossRef]
Figure 1. Location of the study area.
Remotesensing 15 04898 g001
Figure 2. Flow chart of landslide identification based on Mask R-CNN model and incorporating physical mechanism–optical–morphological features of landslide hazards.
Remotesensing 15 04898 g002
Figure 3. Spectral features of landslides on remote sensing imagery: (ac) landslides; (d) house structures; (e) lakes and bare ground; (f) vegetation; (g) roads; and (h) water systems.
Remotesensing 15 04898 g003
Figure 4. Map of the textural features of a landslide on remote sensing imagery: (a) landslide body; (b) bare ground; (c) mining area; (d) river floodplain.
Remotesensing 15 04898 g004
Figure 5. Geometric features of landslides on remote sensing imagery. The red circled area is the detected landslide.
Remotesensing 15 04898 g005
Figure 6. Laminated image. Adapted with permission from Ref. [49].
Remotesensing 15 04898 g006
Figure 7. Landslide sample dataset tagging.
Remotesensing 15 04898 g007
Figure 8. Overall framework of Mask R-CNN. Adapted with permission from Ref. [50].
Remotesensing 15 04898 g008
Figure 9. Results of different models. The red polygon represents the real boundary of the landslide, while the yellow wireframe represents the predicted landslide boundary.
Remotesensing 15 04898 g009
Figure 10. Landslide identification results.
Remotesensing 15 04898 g010
Figure 11. Landslide spatial distribution characteristics: (a) mean nearest neighbor index; (b) kernel density.
Remotesensing 15 04898 g011
Table 1. The sources and characteristics of the data used in the paper.
DataResolutionDateSource
Panchromatic images2 m2022https://www.cresda.com/ (accessed on 5 January 2023)
Multispectral images8 m2022https://www.cresda.com/ (accessed on 5 January 2023)
Normalized difference Vegetation index30 m2022https://www.resdc.cn/DOI (accessed on 7 January 2023)
Digital elevation model12.5 m https://www.resdc.cn/ (accessed on 7 January 2023)
Rainfall1 km2022https://pmm.nasa.gov/precipitation-measurement-missions (accessed on 6 January 2023)
Basin boundaries https://www.hydrosheds.org (accessed on 8 January 2023)
Stratigraphic lithology1:500,000 http://geodata.ngac.cn (accessed on 7 January 2023)
Table 2. Comparison of first set of experiments.
No.Deep Learning ModelTraining Dataset
1Mask R-CNNA
2Mask R-CNNB
3Faster-CNNA
4Faster-CNNB
5U-NetA
6U-NetB
7YOLOv3A
8YOLOv3B
Table 3. Comparison of third set of experiments.
No.Deep Learning ModelTraining Dataset
IMask R-CNNOriginal satellite images + landslide-inducing factors + textural features + geometric features + physical features
IIMask R-CNNOriginal satellite images + textural features + geometric features + physical features
IIIMask R-CNNOriginal satellite images + landslide-inducing factors + geometric features + physical features
IVMask R-CNNOriginal satellite images + landslide-inducing factors + textural features + physical features
VMask R-CNNOriginal satellite images + landslide-inducing factors + textural features + geometric features
VIMask R-CNNOriginal satellite images
Table 4. Accuracy of different deep network models.
ModelPrecision/%Recall/%Accuracy/%
175.5178.6978.13
287.3186.5491.29
372.8473.6576.37
481.7184.3985.58
565.7270.4668.94
678.4781.7382.46
764.2967.0566.78
873.3376.5377.85
Table 5. Results for different rotation angles.
Angle/°Precision/%Recall/%Accuracy/%
81.9184.0787.28
30°85.1787.3490.55
60°86.6787.7391.71
90°87.3186.5491.29
120°85.4886.0390.26
150°84.8485.2788.53
180°83.6684.8289.85
Table 6. Comparison of experimental results.
Lab No.Precision/%Recall/%Accuracy/%
I81.9184.0787.28
II76.5279.4882.18
III75.1178.8281.04
IV78.1682.8585.35
V79.8484.0186.16
VI72.0474.9579.31
Disclaimer/Publisher’s Note: The statements, opinions and data contained in all publications are solely those of the individual author(s) and contributor(s) and not of MDPI and/or the editor(s). MDPI and/or the editor(s) disclaim responsibility for any injury to people or property resulting from any ideas, methods, instructions or products referred to in the content.

