Contact-Based Methods for Measuring Respiratory Rate
by
 , , , , and
Carlo Massaroni
1,* ,
,
Andrea Nicolò
2 ,
,
Daniela Lo Presti
1 ,
,
Massimo Sacchetti
2 ,
,
Sergio Silvestri
1 and
and
Emiliano Schena
1 1
Unit of Measurements and Biomedical Instrumentation, Department of Engineering, Università Campus Bio-Medico di Roma, Via Alvaro del Portillo, 21, 00128 Rome, Italy
2
Department of Movement, Human and Health Sciences, University of Rome “Foro Italico”, 00135 Rome, Italy
*
Author to whom correspondence should be addressed.
Sensors 2019, 19(4), 908; https://0-doi-org.brum.beds.ac.uk/10.3390/s19040908
Submission received: 4 January 2019
/
Revised: 15 February 2019
/
Accepted: 17 February 2019
/
Published: 21 February 2019
Abstract
:There is an ever-growing demand for measuring respiratory variables during a variety of applications, including monitoring in clinical and occupational settings, and during sporting activities and exercise. Special attention is devoted to the monitoring of respiratory rate because it is a vital sign, which responds to a variety of stressors. There are different methods for measuring respiratory rate, which can be classed as contact-based or contactless. The present paper provides an overview of the currently available contact-based methods for measuring respiratory rate. For these methods, the sensing element (or part of the instrument containing it) is attached to the subject’s body. Methods based upon the recording of respiratory airflow, sounds, air temperature, air humidity, air components, chest wall movements, and modulation of the cardiac activity are presented. Working principles, metrological characteristics, and applications in the respiratory monitoring field are presented to explore potential development and applicability for each method.
1. Introduction
There is an ever-growing demand for measuring respiratory variables during a variety of applications. Respiratory rate, also known as respiratory frequency (), appears to be among the most promising and measured variables because it provides fundamental information. In view of its peculiar neurophysiological regulation, is very sensitive to a variety of physiological, psychological and environmental stressors [1,2,3], and is considered to be one of the most informative vital signs [4,5]. Conversely, tidal volume (the other determinant of minute ventilation) plays a major role in satisfying the metabolic requirements of the human body [1,2,3]. This explains why and tidal volume have been defined as the behavioral and metabolic components of minute ventilation, respectively [1]. The differential control of and tidal volume justifies the special attention devoted to monitoring.
There are different methods for measuring , which complicates the choice of the specific sensor or measurement technique to use. Several factors need to be considered when measuring , including applications, measurement requirements, and user needs. This choice is even more difficult in view of the limited attempts made so far to classify and detail the numerous measuring methods used [6,7,8]. Therefore, we aim to provide an overview of the currently available methods for measuring . Given the extent of the topic, this review focuses on the contact-based methods only, to guarantee that each method is described in sufficient detail to enable the reader to make an informed choice on the method to use.
The paper is structured in nine sections. Section 1 provides a brief description of the importance of monitoring in clinical settings, occupational settings, and during sporting activities and exercise. Besides, Section 1 provides a taxonomy of the available techniques for measuring , which are categorized according to the measurand. For each of the methods identified in the taxonomy, we have dedicated a separate Section (from Section 2, Section 3, Section 4, Section 5, Section 6, Section 7 and Section 8), which consists of a brief introduction of the measuring principle and a short overview of the most popular sensors that can be used to transduce the physical or chemical quantity into a signal to extract . At the end of each section, a table summarizes metrological properties, sensor characteristics and possible applications, and a short summary describes strengths and weaknesses of the different sensors. Specifically, we describe methods based on airflow (Section 2), respiratory sounds (Section 3), air temperature (Section 4), air humidity (Section 5), air components (Section 6), respiratory-induced chest wall movements (Section 7), and respiratory modulation of cardiac activity (Section 8). The last section is dedicated to conclusions (Section 9).
1.1. The Importance of Respiratory Rate Monitoring
Before dealing with the methods, we briefly describe the major applications where the monitoring of is invaluable. A further aim is to increase awareness of the importance of measuring . Indeed, despite a large body of evidence indicating that is a very relevant vital sign that responds to a variety of stressors, this parameter has long been overlooked in the clinical field [4,9] as well as in other fields [8].
1.1.1. Clinical Settings
Substantial evidence indicates that is a very informative vital sign. It is an early indicator of physiological deterioration [9,10] and a predictor of potentially serious adverse events [4]. Specifically, is an important predictor of cardiac arrest and of intensive care unit admission [4] as well as an independent prognostic marker for risk assessment after acute myocardial infarction [11]. Besides, it is fundamental in the early detection of the risk of the occurrence of dangerous conditions such as sleep apnea [12], respiratory depression in post-surgical patients [13] and sudden infant death syndrome [14]. Furthermore, is sensitive to several other pathological conditions including diabetic ketoacidosis, toxicological issues, shock, pain, sepsis, allergic reactions and dehydration [5]. Yet, is overlooked and under-recorded [4]. Suffice to consider that among four classic vital signs, is the only one that is often measured clinically instead of with objective devices [5], and is frequently omitted from hospital documentation [4]. The limited consideration given to is partially explained by the fact that there are no clear indications on how should be measured in clinical settings, and that clinical staff has low confidence in the methods currently used to assess [15]. Therefore, technological development and validation studies [16] are required to fill the gap between the urgent need to accurately measure in clinical settings and current clinical practice. The present review may help to reduce this gap.
1.1.2. Occupational Settings
Technological development is driving an increasing interest in the monitoring of workers during their activities, with the aim to improve health, well-being, and safety. Various multiparameter wearable devices measuring have been developed and tested with the aim of monitoring workers facing high levels of psychophysiological stress [17,18]. Monitoring during working activities is of great value because is sensitive to cognitive load, emotional stress, environmental challenges, pain, and discomfort, among other factors [3,19]. Specifically, has been proposed as a sensitive marker of cognitive load, with important implications for workers exposed to highly demanding tasks and weighty responsibilities, including pilots, soldiers and surgeons [19,20]. Besides, can be used as an indicator of thermal stress because it is substantially influenced by body temperature [21]. This is important for workers operating in hot environments as well as for those wearing protective clothing and equipment that may interfere with thermoregulation, including firefighters [22].
1.1.3. Sport and Exercise
The importance of measuring during exercise has recently been reviewed by Nicolò et al. [8]. The authors make a point for being a better marker of physical effort compared to traditionally monitored physiological variables such as oxygen uptake, blood lactate and heart rate [8]. Unlike these variables, is closely associated with perceived exertion in a variety of exercise conditions [2,23,24,25] and experimental interventions [8], and responds very rapidly to abrupt changes in work rate which occur during intermittent exercise [8,25,26]. This is important because many sporting activities are of intermittent nature, including soccer and other team sports. Measuring during exercise is not only relevant for athletes but also for other populations. For instance, is associated with exercise-induced dyspnea [27] and is a marker of exercise tolerance in patients with chronic obstructive pulmonary disease [28]. Furthermore, can provide information on physical effort in cardiopathic patients who have heart rate altered by pharmacological interventions such as beta blockers.
However, the measure of during exercise has been neglected so far [8], and there is a paucity of respiratory wearable devices that have been specifically designed for sporting activities. Yet, different exercise modalities may introduce diverse methodological challenges that need to be faced, with motion artifacts being a classical example. Therefore, a detailed overview of the contact-based techniques for measuring may favor the development and use of respiratory devices designed for specific applications, including the monitoring of during exercise.
1.2. Taxonomy of Available Techniques for Respiratory Rate Monitoring
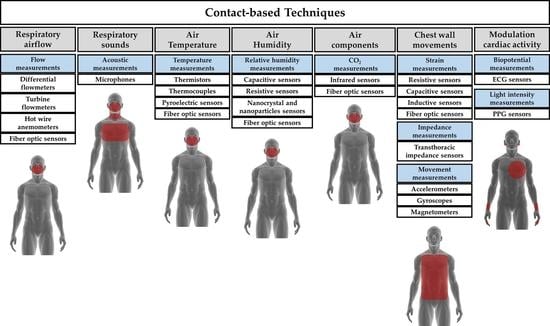
Different technologies are available for measuring . Such technologies may be classed in contact-based and contactless. In contact-based measuring techniques, the sensor (i.e., the element directly affected by the measurand) must be in contact with the subject’s body. Figure 1 shows a classification of the most popular contact-based techniques for monitoring and the related area of the body where the sensor must be positioned. In this review, we provide an overview of sensors and measuring systems with different working principles, based on physical and chemical principles. We have identified seven different techniques, categorized according to the measurand. Some of these techniques have been split into subclasses: it is the case of chest wall movement sensors that can be classed in sensors devoted to transducing chest wall strains, impedance changes, and tridimensional motion caused by the respiratory activity. Similarly, several techniques can be used to retrieve values and respiratory activity from the modulatory effect that breathing has on cardiac activity (e.g., biopotential and light intensity modulation). In this review, the Table at the end of each section provides a qualitative overview of:
(i) metrological properties:
(ii) sensor characteristics:
- Size (i.e., the size of the sensor used to collect the physical/chemical quantity);
- Cost (including an estimate of the cost of signal conditioning electronics);
- Real-time monitoring: ability to record the respiratory signal (and values) in real time;
- Measurement intrusiveness: how the sensor or the measuring technique limits the subject’s activity and movements;
- Sensitivity to body motion artifacts: sensitivity of a measuring technique to movements and motions not related to breathing that negatively affect the output signal;
- Influence of environmental factors: influence of temperature, humidity, external strains and other environmental factors that can affect sensor measurement and consequently the sensor output;
- Presence of wire: presence of tube, wires, and connections needed to supply the sensors, and/or register the physical/chemical quantity, and/or transfer the data for processing.
(iii) possible applications based on the aforementioned properties and characteristics. The typical values of at rest measured in breaths per minute (in short bpm) vary with age. In this review, we have considered the following applications related to specific breathing ranges (valid for adults with age < 65 years old [30]):
While a ≥ 21 bpm is classified as FB at rest, values higher than 60 bpm are commonly registered during high-intensity exercise [8]. Therefore, when possible, we provide more specific information on the highest that can be registered with different sensors.
2. Techniques Based on Respiratory Airflow
Different sensors can be used for measuring the volume and/or the velocity of the inhaled and exhaled air during breathing. The temporal trend of volume or velocity allows to estimate . Among others, differential flowmeters (DFs), turbine flowmeters, hot wire anemometers (HWAs) and fiber-optic-based flowmeters have been investigated (see Figure 2).
2.1. Flow Sensors
2.1.1. Differential Flowmeters
DFs are largely used for collecting the temporal trend of inhaled and exhaled air during breathing. In addition, DFs have gained broad acceptance as sensors for monitoring gases delivered by mechanical ventilators and recorded by commercial spirometers [36,37]. This kind of flowmeters consists of a pneumatic resistance placed within the pipe in which the gas flows. This resistance transduces the gas flowrate (Q) within a pressure drop () with a well-known relationship. Accordingly, these flowmeters need a secondary element which measures the value (i.e., a differential pressure sensor). There are two main types of DFs used in the field of interest:
- Pneumotachographs. They can be subdivided into Fleisch, where the resistance consists of capillary tubes [38], and into Lilly, where the resistance is a fine wire mesh [39]. In both cases, Hagen-Poiseuille law may express the linear relationship between the output () and the input (Q):being the dynamic viscosity of the gas, and L, r, and n the length, the radius, and the number of the capillary, respectively. Although quadratic models have been investigated [40,41], the linear relationship (Equation (1)) is mostly used for pneumotachographs. Linearity and a good frequency response (response time in the order of tens of ms) are two key factors for the use of this flowmeter in respiratory monitoring, if an adequate differential pressure sensor is chosen. One potential concern is related to the influence of the gas composition and the temperature on the pneumotachograph response because these factors affect the value of in Equation (1). Nevertheless, this aspect is relevant for accurate flow measurements, while it can be neglected for the estimation of .
- Orifice meters. They can be split into fixed orifice meters, where the resistance is an orifice plate, and into variable orifice meters, where the plate composing the resistance increases its passage area with flowrate (e.g., it consists of a flexible flap [42,43]). In both cases, the input-output relationship ( vs. Q) may be expressed as follows:where is the flowrate calculated considering ideal conditions, d is the diameter of the orifice, the ratio between the diameter of the orifice and the internal diameter of the pipe, and the gas density. Therefore, the input-output relationship is not linear for fixed orifice meter; conversely, the increase of the passage area with flow in the variable orifice meter has the effect of linearizing the input-output relationship. As for pneumotachographs, they have a good frequency response when an adequate differential pressure sensor is chosen.
DFs are used to monitor the trend of respiratory flows in both adults and infants since they are designed to reach an ideal trade-off between sensitivity and additional resistance to the respiratory system. Indeed, an adequate design of the resistance for both pneumotachographs and orifice meters can adjust the sensitivity and the measuring range of these sensors allowing the development of sensors able to either measure very low flowrates (<0.1 L·min−1) or to have a wide range of measurements (>100 L·min−1). In addition, DFs can discriminate between inhaled and exhaled flows since they are bidirectional. However, the need to collect the entire inhaled and exhaled airflow may pose an important problem because further resistance is added, and the presence of a collector (e.g., a face-mask) may sometimes not be well tolerated by critically ill patients or even athletes [6]. These flowmeters are largely used for respiratory monitoring. For instance, this kind of flowmeter is embedded in medical devices (e.g., spirometers and mechanical ventilators). They are often used as reference tools to assess new techniques designed ad hoc for (or respiratory function) monitoring [44,45,46] because they measure the flow directly.
2.1.2. Turbine Flowmeters
Similar to DFs, turbine flowmeters are used to collect respiratory temporal trends during breathing. Several spirometers and metabolic carts embed this type of sensors. These flowmeters consist of a turbine with flat blades in which the air ventilated by the patient is conveyed externally to the distributor. The distributor is represented by a cylinder with slots on its surface. Slots orient the air flow tangentially with respect to the blades [47]. The dimensional analysis of this turbine provides the following equation:
where is the turbine revolutions per minute, D is the inner diameter of the distributor, and is the kinematic viscosity. The function can be obtained as a function of (that is the number of Reynolds), when is negligible. The mass of the blades is tens of mg, and this allows to obtain a reduced moment of inertia with respect to the rotation axis. For this reason, the dynamic response is excellent with a rise time much shorter than 10 ms [47]. The number of revolutions is typically collected using a phototransistor that records the passage of the blade in front of it, providing an impulse for each passage. The higher is the number of revolutions per minute, the higher is the Q in accordance with the following Equation (4):
For Reynolds number values greater than 800–1000, the ratio is constant: the relationship between Q and is linear, independent from fluid properties (e.g., ) but dependent on the geometry of the sensor [47]. An adequate design of the mechanical parts of the sensors can adjust their sensitivity and the measuring range to allow the linear relationship in Equation (4) to be valid also at low Q values (≤1 L·min−1). These sensors do not need any correction for temperature on exhalation and are not affected by humidity or altitude changes [48]. Turbine flowmeters can be placed at the end of a mouthpiece in which the patient can breathe (with the nose closed by a nose clip) or they can be positioned at the distal extremity of a face-mask.
Turbine flowmeters are used to measure the breathing pattern in the clinical practice [48] and to extract respiratory variables and parameters (e.g., the , tidal volume, FEV1 and FVC) [49]. These sensors show good performance in the estimation of the duration of inspiratory and expiratory breathing phases, and of the respiratory period [50]. Turbine flowmeters are the most used sensors in commercial certified portable spirometers (medical devices), and they are usually used to provide reference measurements for the assessment of new measuring systems. In the field of exercise science, most companies selling metabolic carts (e.g., COSMED S.r.l., Rome, Italy) adopt these flowmeters in their instruments [51]. The validity of turbine flowmeters has been extensively demonstrated for a wide range of values and during various exercise modalities of different intensities [8,52,53], suggesting that turbine flowmeters are not affected by motion artifacts.
2.1.3. Hot Wire Anemometers
Similar to DFs and turbine flowmeters, HWAs are used for collecting temporal trends of inhaled and exhaled air during breathing, and they are embedded in several commercial mechanical ventilators and spirometers [36]. These flowmeters consist of one or more heated wires exchanging heat with the fluid flow. The equilibrium temperature of the wire () can be expressed as [54]:
where i is the current flowing through the wire, is the wire resistance, h is the coefficient of heat transfer, S is the exchange surface, and is the temperature of the gas. The King’s law expresses the relationship between h and the velocity of the gas (v) that hits the wire [55]:
where A and B are two empirical constants.
As shown by Equations (5) and (6), HWAs have a nonlinear response with high sensitivity at low Q values; hence they are mainly used for pediatric applications where Q is low. Due to the small size of the wire (typical diameter of ∼10 µm), the dynamic response is excellent with a rise time much shorter than 1 ms allowing a flat frequency response up to hundreds of Hz. The main concern for the use of HWAs in monitoring is related to their fragility due to the small size of the wire. Moreover, the typical configuration with a single wire is not able to discriminate the direction of the flow, hence the use of more complex configurations based on at least two wires are used to discriminate between inspiratory and expiratory phases [56]. HWAs are used to measure the breathing pattern in clinical settings, showing good performances in the estimation of the duration of inspiratory and expiratory breathing phases, and of the . They are embedded in several commercial medical devices (mechanical ventilators and spirometers), and they are also used to provide reference measurements for the assessment of new systems [57,58,59]. They are often used with face-masks, but other solutions have also been proposed [60]. For instance, a tube-free configuration has recently been proposed as it allows non-intrusive respiratory monitoring [61].
2.1.4. Fiber-Optic Based Flowmeters
Different types of fiber-optic sensors (FOSs) have recently been proposed to monitor flowrates. Among others, intensity-based FOSs, and fiber Bragg grating (FBG) sensors have been investigated [62,63,64,65,66,67]. Intensity-based FOSs have been proposed for breathing pattern monitoring [62,68,69,70]. The working principle of the flowmeters proposed in these articles is based on the changes of coupled light power with a fiber bending caused by the inhaled or exhaled airflow. Therefore, the light power measured by a photodetector represents the sensor output and depends on Q. The high sensitivity allows detecting low airflow (<1 L·min−1) [71]. Custom configurations allow the use of these sensors even in harsh environments and in the presence of strong electromagnetic fields (e.g., during magnetic resonance scans), where electronic sensors cannot be used. The sensors proposed in [68,69] were also tested on humans proving their ability to measure the airflow, but no comparison was made with a reference system to assess the accuracy of the sensors. The intensity-based sensor proposed in [69] may help distinguish between different breathing conditions (e.g., regular and irregular breathing, SB, QB and FB patterns). The sensing element of these sensors may be considered as a small-sized fiber-optic (diameter of hundreds of µm). The metrological properties depend on specific configuration used, and sensors with good static and dynamic performance may be potentially designed.
Table 1 summarizes the main metrological properties, sensor characteristics, and applications for each airflow sensor.
2.2. Short Summary
Flowmeters are used for respiratory activities monitoring because of their accuracy, sensitivity and frequency response especially in the case of DFs, turbine flowmeters, and HWAs. These sensors must be exposed to the air inhaled and exhaled by the subject. The consequence is that their measurement is usually quite intrusive, although the small size of the sensing element in the case of turbine flowmeters, HWAs and of fiber-optic-based flowmeters allows designing configurations that permit unobstructed measurements. Because of the direct measurement of Q, flowmeters are often used as a reference tool to assess new techniques designed ad hoc for monitoring (even on breath-by-breath basis). When all the expired and inhaled flow is conveyed into the flowmeters, these sensors allow recording breathing lung volume and tracking its changes. One of the main concerns related to the use of HWAs is their fragility, while the DFs are more solid. Turbine flowmeters are good in a wide range of Q, and their performance is unaffected by humidity, temperature, or altitude changes. Finally, fiber-optic-based flowmeters may potentially have several advantages (small size, short response time, usability in harsh environments) but their use is still at a relatively early stage. The first application in respiratory monitoring on subjects was in 2010, even though no detailed description of their performance can be found in literature.
3. Techniques Based on Respiratory Sounds
During breathing, the sound generated by the air flowing through the patient’s throat and airways may be collected to investigate the inspiration and expiration phases of breathing to estimate [72]. The respiratory sounds are characterized by broad spectrum noise with a frequency range depending on the body location of the sensor (i.e., mouth, trachea or chest wall) [72]. Acoustic sensors adhering to the skin can be used to measure these sounds. All the measuring techniques and related algorithms can be referred to Computerized Respiratory Sound Analysis (CORSA). Standardization of CORSA have recently been provided along with guidelines for breath sound recording [72].
The working principle of acoustic sensors is based on their sensitivity to physical changes of the environment surrounding the sound source. The most common sensors are microphones used to record air pressure changes caused by the sound waves (see Figure 3) [73].
3.1. Acoustic Sensors
Microphones
A microphone is a transducer that converts acoustic pressure variation into an electrical signal. Different methods may be employed to accomplish this conversion: capacitors, electrets, moving-coils, piezoelectric elements and fiber optics can be used as primary elements of the measuring chain [75].
The most common primary methods of transduction employ capacitors. In the capacitor microphones, one plate of the condenser is fixed while the other plate (i.e., the diaphragm), which is very close to it, is free to vibrate when the sound strikes it [76]. As diaphragm moves in and out under the influence of sound waves, the capacitance varies following Equation (7):
where is the electrical charge on the plates, C is the capacitance, and E is the applied voltage (across a variable capacitance). Typically, a battery is used to establish the charge to the condenser; pre-polarized condenser elements (known as electrets) may also be alternatively used [76]. Additional circuitry may be used to reduce electrical noise and to achieve wide dynamic ranges.
Dynamic microphones use the principle of magnetic induction in which a coil of wire produces a small output voltage as it moves through a magnetic field. The voice coil is generally no larger than 1 cm in diameter to cover the required audio frequency range. The voice coil is attached to a light diaphragm (in aluminum or plastic) [76]. Dynamic microphones are relatively unaffected by temperature or humidity.
Usually, the output provided by microphones is amplified, filtered in the bandwidth of 50–2500 Hz and digitized by a sampling rate higher than at least 5 kHz [77].
During the inspiratory and expiratory phases, the relationship between tracheal sound amplitude and flow can be represented with a power law curve [78]. Generally, the sound is recorded over the suprasternal notch of the trachea since this part of the upper airways is generally not affected by lung disease. The tracheal sound has a direct relationship with airflow and reaches frequency values up to 1500 Hz under physiological conditions [77]. Alternatively, normal breath sounds can be recorded at the level of the upper anterior chest wall. These breath sounds have approximately similar intensities during the inspiratory and expiratory phases of breathing. When the microphone is positioned on the posterior chest wall, abnormal breathing sounds may be identified because they contain higher-frequency components and a higher intensity than that of normal breathing sounds [72].
The estimation of using an acoustical approach has recently gained popularity in clinical settings. Different computational techniques can be used to obtain breathing information, as detailed in [79]. can be monitored at the bedside using an adhesive sensor with an integrated acoustic transducer positioned on the patient’s throat, as in [80]. When the adhesive sensor was compared to a CO2 sensor used as a reference instrument, a bias of ∼0.0 ± 1.4 bpm was found, with ranging from 6 to 24 bpm [80] (hereinafter the bias is reported as MOD ± LOA, obtained from Bland-Altman analysis [81]. The bias was used to provide a quantitative values of the agreement between estimated by the technique and reference values. MOD = mean of the differences; LOAs = limits of agreement, calculated as 1.96 times the standard deviation of the measurements estimated by the two methods).
In [82] sounds were acquired in the same position and analyzed using a combined investigation of the sound envelope and frequency content. Recently, a commercial device that monitors via tracheal sounds has been introduced in clinical settings (Masimo Rainbow SET Acoustic Monitoring, Masimo Corp., Irvine, CA, USA). However, only a few attempts have been made to develop portable and unobtrusive devices measuring outside the clinical setting [83]. For instance, a miniaturized and wearable system to estimate composed by a small sensor and a noise-robust algorithm has been described in [83]. Good results have also been obtained using microphones embedded into a smartphone; when compared to reference measurements (i.e., by a spirometer), a bias of 0.0 ± 1.5 bpm was found for subjects breathing in a quiet room, with ranging from 15 to 35 bpm [78]. Using the microphone of a Bluetooth headset (breath sounds were recorded at the level of the mouth), breath-by-breath monitoring of was carried out during running activity in an outdoor scenario by applying specific filters and a sound training phase to discriminate breath content from noise [84]. However, acoustical approaches remain extremely susceptible to background noise (i.e., music, traffic, other people speech) and to subject activities not related to the breathing such as arms/legs movements, speaking, coughing and swallowing. Furthermore, an appropriate placement of the sensor is critical to obtaining accurate and reliable monitoring with this method [80], especially outside the clinical scenario. Additionally, the actual estimation by acoustical means requires many more signal processing techniques [84,85] and investigations (i.e., heart sound cancellation [77], body vibration/movement cancellation or attenuation [86]) than other techniques (e.g., based on the air flow or temperature measurements). For these reasons, this technique does not usually allow real-time monitoring of .
Table 2 summarizes the main metrological properties, sensors characteristics and applications of the acoustic sensors used for monitoring.
3.2. Short Summary
Microphone sensors are becoming of interest to respiratory activity monitoring because of their reduced encumbrance and because they can be embedded in wearable devices. However, acoustical approaches remain susceptible to both background noise and subject activity not related to the breathing. This measuring method is not generally recommended to record the respiratory waveform over time. Some studies have demonstrated good performance in extremely structured environments (i.e., intensive care unit). A few studies have been investigated this technique outside the clinical scenario (i.e., sporting activities), but they lack preliminary validation studies.
4. Techniques Based on Air Temperature
During breathing, the exhaled air is warmer than the inhaled air which is at environmental temperature. The temperature difference between inspired and expired air can reach approximately 15 °C [87]. Therefore, different kinds of temperature sensors allow estimating , based on the temperature difference between exhaled and inhaled air.
Different technologies and working principles can be used to sense temperature changes related to the breathing activity. From a plethora of available sensors, we report the most common electric-based sensors (i.e., thermistors, thermocouples, and pyroelectric sensors) that are largely employed for breathing patterns recording and for estimating values. In addition, a short description of FOSs is provided since these kinds of sensor are gaining interest in monitoring (see Figure 4).
4.1. Temperature Sensors
4.1.1. Thermistors
The resistive thermometer (i.e., thermistor) is a type of resistor (made from certain metal oxides) for which resistance is dependent on temperature. There are two types of thermistors: the negative temperature coefficient thermistors, which show a resistance drop when the surrounding temperature increases; the positive temperature coefficient thermistors which show an opposite behavior (the resistance increases with a temperature increment). Steinhart–Hart equation may express the nonlinear relationship between temperature (T) and the resistance (R) [47]. By using an approximation, the relationship can be expressed as in Equation (8):
being R the resistance at any temperature T, the resistance at the reference temperature , and a constant that depends on thermistor material [47]. Due to the nature of the basic process, the number of conducting electrons increases exponentially with temperature. This pronounced non-linearity is a disadvantage of thermistors and limits their temperature span to about 100 °C. However, thermistors are characterized by high sensitivity in the temperature range of interest for respiratory monitoring (i.e., 10– 40 °C). Commercial thermistors are quite small (a few mm in diameter), but they have a quite high response time (typically some seconds) which can jeopardize a correct analysis of breathing pattern, especially in the FB case [90,91] and for real-time monitoring purposes. These sensors can be used to measure the respiratory signal at the level of the nose in adults and infants given their small size and low intrusiveness, in the clinical scenario. Since the sevenths, these sensors have been proven to be sufficiently accurate to detect regularity of and apnea stages when compared to gold standard techniques [92]. Given the relatively low cost (less than 10 dollars) and their ease-of-use, they are used as reference instruments in several studies as in [93,94], during QB.
4.1.2. Thermocouples
A thermocouple produces a temperature-dependent voltage as a result of the thermoelectric effect (Seebeck effect), i.e., the occurrence of an electric potential occurs when two different metals are joined into a loop and the two junctions are held at different temperatures [95]. This Seebeck electromotive force () is a voltage difference between the two ends of the conductor that depends on the temperature difference between the ends and a material property called the Seebeck coefficient as in Equation (9):
When wires of two different materials, A and B, are connected, the electromotive force that occurs depends on the temperatures of the free ends of the two wires and the temperature of the junction between the two wires. By considering the two free ends at temperature and the junction at a temperature , the voltage difference between the free hands may be written as in Equation (10):
being the relative Seebeck emf of materials A and B. Some conductive materials and combinations are better than others to form a thermocouple [96]. The specific configuration may influence sensitivity, effects of corrosion, costs, and other characteristics. The accuracy is similar to that of thermistors, with typical values of 1 °C (or ± 0.75% of the measurement range) [47]. The response time of thermocouples is typically 0.5 s, although small-sized thermocouples allow obtaining shorter response time [47]. This property encourages the adoption of such sensors also in case of high values of which can occur in the clinical scenario [97]. Size of thermocouples which can be used for respiratory monitoring are comparable to those of thermistors, so their field of use is similar. Usually, the cost of thermocouples is higher than thermistors. Because of their size, these sensors may be integrated into face-masks or placed under the nostrils or into the nose for monitoring temperature during hypopnea [98,99,100,101].
4.1.3. Pyroelectric Sensors
Sensors based on pyroelectric effect may also be used to monitor the temperature of respiratory airflow [91]. When a pyroelectric sensor is heated, the dipoles within the sensor exhibit random motion by thermal agitation. This phenomenon causes a reduction in the average polarization of the transducer, generating a charge build-up on the transducers. The output current (i.e., i) is proportional to the rate of temperature change. The output voltage produced by the transducer across the amplifier with an input resistance is related to the cross-sectional area of the transducer surface, the pyroelectric coefficient of the piezoelectric transducer, the upstream and downstream electrodes average temperature [102]. The i from the pyroelectric sensor can be calculated from the Stefan–Boltzmann law as in:
where is the temperature gradient between the object and its surroundings, P is the pyroelectric coefficient, is the Stefan–Boltzmann constant, a is the lens area, is the lens transmission coefficient, H is the thickness, and c is the specific heat of the pyroelectric element, respectively, and is the distance to the object [103]. The i value is directly proportional to the .
Typical accuracy is ± 1 °C, while typical response time is comparable with that of thermocouples, or even better in the case of microfabricated pyroelectric sensors [104]. Since the sensors can assume different shapes as cylindrical [91] or thin films [105], they may be embedded in a face-mask [91] or on headphones near the nostrils [105] for respiratory monitoring purposes. In [105], an error of 1.12% on the average value was found compared to data recorded by a thermistor.
4.1.4. Fiber-Optic Sensors
Recently, FOSs have been proposed to measure the temperature changes of the exhaled and inhaled air during breathing. Among others, FBG sensors have been used in the respiratory field. The principle of work is that the peak Bragg wavelength () of an FBG sensor shifts to longer wavelengths as the temperature increases, and towards shorter wavelengths when the temperature decreases. The response is linear, and its temperature sensitivity coefficient is a function of the operating wavelength and the material’s properties of the fiber in which the FBG is inscribed [106]. This change may be expressed as follow [106]:
being the refractive index of the fiber core, the coefficient of expansion, the thermo-optic coefficient of the fiber, and T the temperature change. Peculiarities of these sensors are their small size (typical outer diameter of the fiber is 250 µm), the biocompatibility, the lightweight and the intrinsic safety because light powers them. For these reasons, sensors may be placed close to the patient nose or lips without causing discomfort and risks. Regarding the metrological properties, FBGs are characterized by a typical response time of 10 ms and sensitivity of 10.0 pm/°C that guarantee excellent performance in the monitoring of breathing even at high frequency [107].
Usually, these sensors are embedded into a small probe for monitoring breathing to avoid mechanical fiber breakage [108]. FBGs have been used to monitor the respiratory signal and by placing the sensor in the nasal-cavity during MR imaging procedure [109]. Alternatively, FBGs have been used to collect during mechanical ventilation by embedding the sensors in a small probe [108,109,110]. Despite one FBG is quite inexpensive and its cost is comparable to that of thermistors, the system used to interrogate the FBGs is expensive (more than 3000 dollars) and bulky. For this reason, this technology is mainly used for research purposes and tests in laboratory environment, or in particularly harsh environment (e.g., in the case of monitoring in MR room). In addition, FBGs are intrinsically sensitive to strain, so when used for temperature measurements it is pivotal to avoid or minimize mechanical strain.
Table 3 summarizes the main metrological properties and characteristics of the temperature sensors specific for monitoring, and their field of use.
4.2. Short Summary
Temperature sensors may be used for monitoring . Depending on their response time (from 10 ms for FOSs up to some s for thermistors), temperature sensors can allow the monitoring of apnea, SB, QB, and FB. Thermistors typically present a quiet slow response time, hence their use is discouraged for quiet and fast monitoring, where other temperature sensors are preferable. Temperature sensors are usually placed at the level of the nostrils or/and lips and integrated into mechanical supports or face-masks to give mechanical stability to the sensor and reduce the sensitivity to body movements. All temperature sensors require to be exposed to the air exhaled and inhaled by the subject. For this reason, the measurements are intrinsically obtrusive; however, these sensors generally allow recording the respiratory waveform over time and the analysis on a breath-by-breath basis. In the case of FOSs, wires are needed to supply the power to the sensor and to deliver light. The sensitivity to environmental factors, the obtrusiveness and the presence of wires may limit the applicability of temperature sensors to indoor controlled environments (e.g., during imaging procedures) and in clinical settings (e.g., intensive care unit, geriatrics), while they are seldom employed in the monitoring of athletes especially in outdoor scenarios.
5. Techniques Based on Air Humidity
The inhaled and exhaled air differ in the content of water vapor. Therefore, different types of sensors and configurations have been proposed to estimate the respiratory signal from the difference of water vapor contents between inhaled and exhaled air. Indeed, inhaled air is at environmental conditions (relative humidity (RH) from 40% to 80%), while the exhaled air is at body temperature and saturated by vapor (RH = 100%) [111]. Among others, electrical and FOSs have been mainly investigated for respiratory monitoring purposes (see Figure 5).
The principle of work of the electric humidity sensors is based on the sensitivity of one electric parameter to RH. The most common ones are based on the change of capacitance and of resistance with RH. Recently, new solutions based on nanoparticles, nanocrystals, and graphene have been investigated. Among FOSs, FBGs, and long-period grating sensors are used in this application.
5.1. Humidity Sensors
5.1.1. Capacitive Sensors
The working principle of capacitive sensors for RH measurements is related to the capacitance change with the dielectric properties of the material interposed between the two electrodes of the capacitance [116]. This type of sensors is the most used in RH measurements, representing more than 75% of the market [117]. Although different configurations have been investigated, usually, a sandwiched structure with two electrode surfaces on each side or an interdigitated structure with comb electrodes are used. A dielectric material (i.e., polymer film or ceramic material) is deposited between the two electrodes; it is usually made of a porous material that either absorbs water vapor when the environmental RH rises or releases it when RH decreases. The dielectric properties of the material change with the amount of absorbed water vapor and therefore with the environmental RH. Since the sensor’s capacitance depends on the dielectric properties, its changes can be used as an indirect measurement of RH. Usually, an appropriate electronic circuit allows transducing the capacitance within an electric signal that represents the sensor output. The estimation of the is based on the cyclic changes of the sensor’s output due to RH changes during the two respiratory phases. These sensors show good linearity and accuracy (around 3%); the rise time is usually of some seconds although faster solutions have been proposed [116].
5.1.2. Resistive Sensors
The principle of work of resistive sensors for RH estimation is based on the electrical impedance change with humidity. Therefore, RH values are estimated starting from the changes of electrical conductivity of the sensing films [116]. A specific electronic circuit allows the transduction of the resistance into a voltage signal, which represents the sensor’s output. Several studies have shown the potential of resistive RH sensors for monitoring and for detecting apnea stages. During the 1980s, this capability was shown on patients and volunteers using a resistive sensor with a rise time of almost 10 s [118]. Faster resistive sensors have been proposed in the literature and assessed in the laboratory or using simulated breathing patterns [119,120,121,122]. Recently, a new instrumented mask embedding one of this type of sensor has been assessed on humans, showing good performance in the estimation of (limits of agreement of ±1 bpm) [10,123]. Resistive RH sensors have also shown good performance up to very high values (e.g., up to 240 bpm) [10]. Recently a fast and ultra-sensitive electrical humidity sensor was also tested for monitoring on humans and on rats [124]. Thanks to the high resolution (0.1%) and fast response time (37 ms) it was able to monitor the on rats that have smaller tidal volume and higher than humans.
5.1.3. Nanocrystals and Nanoparticles Sensors
The investigation of sensors for RH monitoring fabricated with nanocrystals, nanoparticles and graphene-based nanocomposites has been encouraged by the high ratio between exchange surface and volume, so different solutions have been proposed [125,126,127]. For instance, the resistance of a thin film of SiO2 nanoparticles which non-linearly changes with RH has been proposed for monitoring [125]. The response and recovery time of the sensor were approximately 1 s. The authors assessed the capability of the sensor to follow values up to approximately 100 bpm at rest and it is also able to both monitor respiratory signal and discriminate respiratory phases during exercise. The same group fabricated a flexible nanocrystal-based RH sensor with a response/recovery time of 40 ms [128]. The system was assessed on humans and showed the capability to follow breathing patterns, although its output was not compared with a reference system. A cost-effective sensor ($0.005 for materials for the paper chip and $1.50 for the mask) based on the changes of resistance of a paper with printed graphite electrodes has been also investigated for respiratory monitoring [129]. The sensor was embedded into a mask and showed the ability to follow at rest and during walking up to 60 bpm.
5.1.4. Fiber-Optic Sensors
RH sensors based on fiber optics are gaining broad acceptance for application in monitoring. Among others, FBGs and long-period grating sensors have been largely investigated in this field [130,131]. Since they can sense only physical parameters (i.e., temperature and strain), polymer and nanoparticle-based coatings are used to make FBGs and long-period gratings sensitive to RH [132,133]. The coatings are made of hygroscopic materials that absorb or desorb environmental water vapor in response to RH changes. This phenomenon induces changes in the gratings behavior making it able to detect RH changes [134,135,136]. Also, interferometric-based FOSs have been used for this application. Solutions based on hygroscopic materials which cause a shift in the interference pattern due to the sorption of water vapor have been proposed [137].
The metrological properties of these sensors strongly depend on the material coatings and the coating thickness. For instance, the response time ranges from tens of ms to tens of s [138,139]. The capability of RH sensors based on fiber-optic technology to monitor has been investigated using several configurations. Interferometric-based ones have shown the ability to follow breathing patterns [140], but the authors did not used a reference to assess the performance of the sensor. Sensors based on optical fiber gratings have been tested during mechanical ventilation [110,141,142]. The sensor was assessed by analyzing its capability of estimating the during mechanical ventilation from 12 bpm to 24 bpm [143] and on humans, during QB. During the assessment on humans the results provided by the proposed system were compared with values estimated by a reference (i.e., by a spirometer). The experiments showed good agreement between the two techniques with an absolute value of the percentage errors lower than 2.07%, with values up to 35 bpm [144]. A simple intensity-based sensor able to discriminate inspiratory and expiratory phases due to the condensation on an optical fiber tip placed in front of one of the two nostrils has been also assessed on 10 smoking men. The system showed the ability to follow the breathing signal during QB and to discriminate apnea phases [145].
Table 4 summarizes the main metrological properties and characteristics of the RH sensors specific for monitoring, and their field of use.
5.2. Short Summary
RH sensors allow monitoring by detecting the difference of water vapor content between inspiratory and expiratory air. Therefore, they need to be exposed to the inhaled and exhaled air, with consequent invasiveness, slightly mitigated by the small size of some solutions. Furthermore, RH is usually detected at the level of the nostrils or/and mouth, sometimes by using sampling face-masks. Electric sensors, especially capacitive ones, are the most commonly used for estimation, but solutions based on fiber-optic technology and nanoparticles are starting to attract the interest of scientists. Given the good metrological characteristics, all RH sensors can be used to record the respiratory waveform over time. These sensors have been used in extremely structured environments (e.g., intensive care unit), but rarely during exercise and in outdoor applications.
6. Techniques Based on Air Components
During breathing, the content of oxygen and carbon dioxide (CO2) differs between the inhaled and exhaled air as a result of cellular respiration. The CO2 percentage fluctuates from typically 0.04% (<300 parts per million, ppm) during inhalation up to 6% (around 60,000 ppm) during exhalation [146]. Therefore, CO2 variations can be used to estimate .
Different kinds of chemical sensors are used for the estimation of starting from the CO2 concentration difference between exhaled and inhaled air. Among others, electrical and optical sensors are the most used at this scope (see Figure 6). A technique that uses sensors for measuring human respiration CO2 from exhaled gases is known as capnography. The typical pattern of a capnogram (i.e., expiration, alveolar plateau, and inspiration phases) can be found in [147].
6.1. CO2 Sensors
6.1.1. Infrared Sensors
Infrared sensors are used to detect CO2 in a gaseous environment by its characteristic absorption, working as spectroscopic sensors. The estimation of with such kind of sensors mainly requires the use of a nasal cannula or a mask to convey the inhaled and exhaled gas to the sensor. The key components of the measuring chain are an infrared source, a light tube, an interference (wavelength) filter, and an infrared sensor. The gas is pumped or diffuses into the light tube, and the absorption of the characteristic wavelength of light is measured. Among others, nondispersive infrared sensors (NDIR) are the most often used for measuring CO2. These sensors can have a discrimination threshold of 20–50 ppm. Their accuracy is usually of ±0.3% CO2 (±300 ppm). The principle of work of NDIR gas sensors is based on the Beer-Lambert Law [149]:
being the initial radiation beam intensity, I is the beam intensity after traversing the gas to the detector, is an absorption coefficient, is a gas concentration, is the sample optical path length defined typically by the effective sample chamber length of the sensor [149].
Shorter response time values (up to <100 ms) are typical of NDIR gas sensors which use the flow through sample method, compared to diffusion sampling method (>10 s). To implement the flow through sample method, the following stages upstream the sensor are required: the gas output sampling with a tube, a particulate filter, a water trap (or Nafion tube that contains a highly selective, semi-permeable membrane to water vapor), a hydrophobic filter, a pump (which eventually may be placed downstream of the sensor). All these elements required for the measurement let the price rise (typically 300–1000 dollars). It is also crucial to highlight that such kinds of sensors require a calibration (The calibration procedure is strictly required for the accurate measurement of the CO2 concentration. Given that the CO2 level strongly varies during breathing activity, the outputs of CO2 sensors may potentially be used to accurately estimate even without a recurring calibration.) each time they are used for collecting CO2 and a warm-up time (i.e., the time elapsed from sensor power to the time when the sensor output value is stable) is usually 60–120 s.
CO2 sensor may be positioned inside the main unit, away from the subject or between the endotracheal tube and the breathing circuit, especially in clinical settings. Sensors may be placed at the end of the mask of the nasal cannula to perform partial or total sampling of CO2 [150]. A recent patent of Medtronic introduced a new approach for the CO2 sampling, which can be used to sample CO2 in the case of concurrent delivering oxygen to one nostril and when one or both nostrils are blocked (e.g., deviated septum, sinus congestion). This approach is based on CO2 collection at the level of the lips [151]. Yang et al. [152] have positively tested the ability to estimate in real time with a low-power and portable device. The system was used in conjunction with modulation technology to eliminate the fluctuations at the trough of the waveform of the CO2 concentration signal.
6.1.2. Fiber-Optic Sensors
FOSs have been extensively used as sensors for gas concentration. Generally, the fiber is used to transfer the light and to investigate variation at the fiber’s distal end where a CO2 sensitive material is positioned. Considering the spectrum of absorption of the CO2, two main kinds of light can be used: near-infrared light (range of wavelengths 0.7–1.4 µm) and mid-infrared light (range of wavelength 1.6–5.0 µm). Long-period fiber gratings [153,154] and optical fiber-based Fabry Perot interferometer [155] have been used with near-infrared light. Additionally, cheaper systems based on mid-infrared light (with a wavelength of around 4.2 µm that is strongly absorbed by CO2) to directly detect molecular absorption of CO2 have also been proposed. Flexible hollow optical fiber that shows low transmission loss for mid-infrared light has been used. Recently, it has been developed a small gas cell attached to the distal end of a thin optical fiber probe that could be inserted into airways via a catheter or a bronchoscope [148]. The target gas penetrates the cell through small holes. A polyvinylidene chloride film is attached to the distal end of the hollow optical fiber. The measurement of the CO2 is then obtained with Fourier-transform infrared spectroscopy. Measurement error of the mentioned system is ±0.3%, minimum threshold of 0.45% of CO2 [148].
In Table 5 the main metrological properties and characteristics of the air component sensors specific for monitoring—and their field of use—are reported.
6.2. Short Summary
CO2 sensors may be used to monitor , given their good accuracy and response time. Infrared sensors are the most common sensors both in clinical settings and during sporting activities in indoor structured environments. All the sensors presented for respiratory monitoring purposes require to be exposed to the air exhaled by the subject, so the measuring systems are intrinsically quite intrusive, requiring pneumatic connections and tubes to sample the gas. FOSs are attracting interest in real-time monitoring starting from the analysis of air concentration; however, only a few examples are reported in the literature with explicit tests on humans during breathing. Commonly, CO2 is sampled at the level of the nostrils or lips and usually sampling face-masks are used. This kind of measurement is quite insensitive to body movements. One of the main drawbacks of CO2 sensors is their cross-sensitivity to other gas components and to environmental factors changes (i.e., humidity, temperature). Furthermore, both electrical and optical sensors need numerous stages to process the measurand and to extract the breathing pattern, hence these techniques are mainly used in clinical settings (e.g., intensive care unit), while they are seldom employed in the monitoring of athletes especially in outdoor scenarios. Nevertheless, CO2 sensors are suitable for the continuous recording of the respiratory waveform over time.
7. Techniques Based on Chest Wall Movement Analysis
Breathing is made possible by the work of the respiratory muscles, with the diaphragm and external intercostal muscles playing a major role during inspiration. The diaphragm contracts itself and moves downward producing a pressure difference causing air to enter the lungs. The contraction of the intercostal muscles causes the ribs to elevate which results in the expansion of the chest cavity allowing a greater volume of air to enter. This amount of air within the lungs causes an expansion of the chest wall diameter up to ∼7 cm [156]. For this reason, techniques based on the analysis of chest wall movement have been extensively explored. Among others, three approaches have been mainly investigated: based on the record of chest wall strain caused by the respiratory activity, based on the transthoracic impedance change and based on the record of thorax tridimensional movements (e.g., thorax inclination, acceleration, and velocities).
7.1. Strain Sensors
Several methods exploit the deformations of the chest wall for the indirect measurement of respiratory activity. Strain sensors are used to transduce the cyclic expansion and contraction of the chest cavity in a signal that can be managed to extract breathing pattern and values. The working principle and output signals of the strain sensors are reported in Figure 7.
7.1.1. Resistive Sensors
The working principle of the piezoresistive strain sensors is based on the variation of electrical charge concentration in response to externally applied strain, which modifies the geometrical shape of the piezoresistive sensing element. These changes in shape can be measured, and the strain can be determined. In piezoresistive strain gauges, the strain is related to the change in resistance. The performance of these sensors is generally reported by referencing the gauge factor () according to the following formula:
where is the resistance in the absence of strain, is the length in the absence of strain, and are the changes in resistance and length due to an applied mechanical strain. Details on the theory and technology of piezoresistive sensors can be found in [157]. Over the mechanical strain limit of the sensor, the output may become unstable due to excessive strain of the sensing element and mechanical failure of the sensing element may occur.
Two main approaches can be used for manufacturing piezoresistive textile-based strain sensors: fabrics are coated with conductive polymers or elastomers [161] and conductive yarns are embedded into the textile structure during the manufacturing process [162,163].
When piezoresistive fabrics or conductive yarns embedded into textile are specifically intended for the use as breathing-related strain sensors, the elasticity of the fabrics and textiles is an essential property. There are two main limits of this type of sensors: issues related to their durability, so possible shortcomings are poor repeatability and performance deterioration after washing or repeated folding [164], and () the sensor output may be affected by motion artifacts (i.e., breathing-unrelated movements, such as walking and speaking). Therefore, specific filters in the post-processing phase have to be used [165,166]. Generally, performance improves when the sensor is positioned at the level of the upper thorax that is less susceptible to body motion artifacts during walking and running in comparison to the abdominal area [165].
Several measuring systems for respiratory activity monitoring based on the integration of one or more strain sensors have been designed. Two sensors have been used in [167] to record both the thoracic and abdominal strain. The obtained measuring system can be used to detect the during QB [167]. A weft-knitted strain sensor has been proposed in [165] and successfully used to detect apnea stages as well as SB, QB, and FB. Piezoresistive sensors have been integrated into automobile safety belt to monitor respiration in [168]. Although there are many studies that use these sensors in the respiratory field, only a few of these have carried out a quantitative comparison against reference values gathered by gold standard instruments. When available, generally the comparison takes into account average values calculated in fixed time windows [169]. Good performance was reported in [170], where the use of one piezoresistive sensor allowed estimating with a maximum error of 1.8 bpm when compared to reference values (i.e., by spirometer) during QB. Rarely, studies have compared the performance of piezoresistive sensors on a breath-by-breath basis against a reference instrument [170]. Average values of have been recorded with piezoresistive sensors during exercise (walking, running, and cycling) [166]. The worst results were obtained during running activity, with a bias of ∼1.01 ± 4.01 bpm when compared against reference values (i.e., by a spirometer) [166].
7.1.2. Capacitive Sensors
The alternation of inhalation and exhalation determines changes in capacitance that can be registered at the abdomen or chest levels.
The human body is mainly composed of water (permittivity = 80) and a conductive electrolytic solution, while the air that flows in and out of the body during breathing is nonconductive and has a lower permittivity ( = 1) than water [159]. Considering a configuration where an electrode is placed on the anterior part of either the chest or the abdomen and another electrode is placed on the corresponding posterior side, both permittivity and between-electrode distance change during breathing. Consequently, capacitance decreases during inhalation and increases during exhalation. By forming a capacitor area between the two electrodes, inhalation and exhalation can be detected by measuring the capacitance, C, according to the following equation:
where is the electrode area, is the distance between the electrodes, the vacuum permittivity and the relative permittivity of the inner body material placed between the electrodes [159].
The sensitivity of sensors relies on electrodes number, size, the distance between them and the position of the electrodes [171]. Electrodes could be flexibly or tightly connected. When electrodes are embedded into a flexible, elastic connecting belt, the measuring device can be better adjusted to the human body; tight electrodes eliminate C changes caused by electrodes movements and significantly reduce noises in output signals [172].
The sensors’ outputs allow for the identification of the respiration cycle and the distinction between different breathing modes (i.e., quiet, panting, apnea, and deep breathing) [171]. Capacitance meter can be used to record C changes [171,173], while sophisticated circuit may promote the use of such kind of sensors to develop smart garment [172,174,175,176]. During QB respiration (on two healthy subjects, 50 min), a comparison with a reference instrument demonstrated excellent performance in the monitoring with a bias of 0.01 ± 1.90 breaths/min [177]. When tested on 9 patients with COPD at rest (after exercise), capacitive sensors demonstrated excellent performance when monitoring values over 2 min (bias of −0.14 ± 0.55 bpm) [177].
7.1.3. Inductive Sensors
Direct current-coupled inductive sensors can be used to register changes in the self-inductance and oscillatory frequency of coils encircling the rib cage and abdomen. This method can be used to monitor the volume and time components of the breathing pattern [178]. Generally, the monitoring device consists of one or two elastic cloth bands, which contain insulated wires encircling the rib cage and/or the abdomen. These wires are connected to an oscillator module that oscillates at a low-amplitude wave. Respiratory activity produces variations in the self-inductance of the coil, thereby changing frequency. This frequency is then demodulated to provide an analog signal related to the rib cage and abdomen strains.
Each coil forms the inductance element of a resonant circuit maintained in oscillation at a frequency chosen to avoid interference with other medical equipment:
where f is the oscillation frequency, the inductance and C is related to circuit capacitance [179].
This method is one of the most widespread in strain-based respiratory monitoring, and it has been widely adopted in several commercial products, including LifeShirt (VivoMetrics Inc., Ventura, CA, USA). Several studies have tested measuring systems based on inductive sensors on healthy subjects (in the standing, supine, sitting, prone and semi-recumbent postures [178]), on critically ill patients [180], in newborns [44], and in children [181]. Wakefulness and sleep in patients with obstructive sleep apnea have also been investigated with two inductive sensors embedded at the level of upper thorax and abdomen [182]. They have also been used to investigate the breath-by-breath variability from thoraco-abdominal strain signals collected in healthy subjects [183]. Literature reports robust studies aiming at comparing the performance of systems based on inductive sensors and reference systems in a wide range of scenarios and values. Systems have been tested during an incremental running test on a treadmill, and multiple periods of recovery [10], and during cycling [184]. On patients with respiratory issues, similar thoraco-abdominal asynchronies and values were found when comparing a two-coil inductive sensor with a motion capture system (requiring complex model and markers to be attached on the chest [185]) both during quiet breathing and exercise [186]. Good performance have also been reported when testing a smart t-shirt instrumented by inductive sensors on healthy subjects [187]. Specifically, a bias of 0.01 ± 0.11 s (mean error 2%) was found during walking and running across different exercise–intensity domains, when analyzing breath-by-breath values [187]. Similar results were obtained on heart failure and COPD patients, with the sensors placed around the rib cage and abdomen at the level of the nipples, and of the umbilicus [187].
7.1.4. Fiber-Optic Sensors
The use of FOSs is gaining large acceptance as an alternative to electrical and mechanical sensors for monitoring strains. FOSs can be designed using different working principles. FBGs and intensity-based FOSs are the most used technologies to develop systems for respiratory monitoring. An extensive review on this topic has been recently published [188], while health supervisions applications through the use of FOSs embedded in textile have been reviewed in [189]. FBGs typically have short response time (approximately 10 ms) and high strain sensitivity (typically 1 nm/mϵ). These features allow monitoring both rapid and small chest wall movements.
Numerous papers have investigated the use of patches and or instrumented mattresses or cushions embedding one or more FBGs. Such solutions exhibited errors always lower than 12% when compared to reference values [190], or bias of ±1 bpm in [191]. The integration of FBGs in wearable mechanical structures used to amplify the heartbeat and the sensitivity to respiration has also been proposed, as in [192] where a single FBG has been tightly bonded across the diaphragm using a thin layer of cyanoacrylate adhesive. Smart textiles based on more FBGs have been developed and tested. Solutions based on 2 sensors [193], 6 sensors [194], or 12 sensors [46,195,196] have been proposed. The system embedding 12 sensors showed a bias of −0.02 ± 2.03 bpm against a reference system (i.e., a marker-based motion capture system) when breath-by-breath values were estimated on healthy volunteers during QB [195]. Different solutions based on signal intensity changes of optical fibers integrated into textile have also been proposed to measure average [197,198,199]. In supine position during MR scan, a bias of 0.01 ± 2 bpm has been found comparing data retrieved by a fiber-optic-based garment with data recorded by an MR-compatible bellow (used as reference instrument) [200].
Table 6 summarizes the main metrological properties and characteristics of the strain sensors specific for monitoring, and their field of use.
7.2. Impedance Sensors
Transthoracic Impedance Sensors
Cyclic change of thoracic impedance occurs during breathing. Changes in the electrical resistance of the lungs are mainly a result of the following two effects: during inspiration, there is an increase in the gas volume of the chest in relation to the fluid volume, which decreases conductivity; during inspiration, the length of the conductance paths increases because of expansion. Both of these effects cause an increment of the electrical impedance during inspiration. The relationship between this impedance change and the respiratory volume is approximately linear. Therefore, transthoracic impedance sensors provide a way to measure respiratory activity by sensing these changes (see Figure 8).
This method is based on the use of electrodes (either two or four) placed on the chest of the subject. The electrocardiogram electrodes can be used for respiration as well by taking advantage of this measuring technique [201,202]. Considering a four-electrode configuration, a high-frequency (typically ∼50 kHz) and low-amplitude current (less than 1 mA) is injected by two electrodes on the thorax, whereas the other two electrodes are used to record the Z changes by measuring the voltage changes between them. When measuring respiratory activity, the thorax presents an electrical impedance to the electrode that consists of two impedance components: an almost constant value and a varying value. The relatively constant value is the baseline impedance (typically 500 ). The varying value is known as respiratory impedance.
The Z change, (expressed as Ω/m3), can be described with the following equation:
where and are two time instants, the conductivity change between the two time instants, the lead field of the voltage measurement electrodes for unit reciprocal current, the lead field of the current feeding electrodes for unit current, and v the conductor volume [203]. Even though the two-terminal measurement configuration is the most used, it introduces some measuring errors. They are mainly related to nonlinear voltages (recorded by the two electrodes) generated by the current flowing through the polarization impedance at the electrode-tissue interface and overlapped to the signal of interest [202]. The four-electrode configuration yields a more accurate measurement because the sites of current injection and voltage measurement are physically separated, but require two additional electrodes [201].
This technique has shown promising results for long-term monitoring of respiration during sleep in adult males [204,205]. Performance in terms of estimation has been tested in different postures (i.e., supine, left-lateral lying, right-lateral lying, sitting, standing) and during different activities (i.e., slow walking, fast walking, slow running, fast running) in [206]. Correlation coefficients were always higher than 0.75, with excellent results even during running and walking (coefficients always > 0.93) [206]. The posture specificity of the method has also been investigated in [207]. By analyzing the power spectrum of the respiratory impedance curve, average values of of very preterm infants have been investigated in [208]. Impedance sensors have also been used to identify childhood pneumonia [209]. Besides, a pacemaker integrated with transthoracic impedance sensor has been developed and tested for sleep apnea screening [210]. Recently, the use of advanced data analysis techniques (i.e., empirical mode decomposition—EMD) has been tested to improve the accuracy in capturing respiratory episodes from thoracic impedance raw signals [206]. As in the case of other strain-based methods, the transthoracic impedance measurement is affected by movement artifacts. Simultaneous use of a piezoresistive-based t-shirt and a transthoracic measurement system during four physical exercises in a gym (i.e., walking, running, cycling, elliptic exercises) have been tested in [166]: piezoelectric sensors showed better performance in terms of robustness and reduced susceptibility to movement artifacts.
Table 7 summarizes the main metrological properties and characteristics of the impedance sensors specific for monitoring, and their field of use.
7.3. Movement Sensors
Different sensors may be used to record data related to chest movements. Acceleration forces, angular velocities variations and changes in the magnetic field allows recording breathing-related data. Generally, movement sensors are placed on the chest wall of the subject so that they can follow its movement. Sensors working principles and output signals are summarized in Figure 9.
7.3.1. Accelerations Sensors (Accelerometers)
An accelerometer is an electromechanical device that converts mechanical motion into an electrical signal. It measures acceleration forces caused by either gravity or motion. Different transduction elements can be used to achieve this goal. Basically, as the small accelerometer mass reacts to motion, it places the transduction element (i.e., capacitive, piezoelectric, piezoresistive sensor) into compression or tension. As the human body moves, the mass of the accelerometer, m, moves with an inertial response. The stiffness of the spring, , provides a restoring force to move m back to equilibrium while internal frictional damping, c, opposes any displacement away from equilibrium. Independently from the working principle, a model of this measuring device may be exemplified with the following equation:
where y denotes the position of m within the accelerometer and x is the displacement of the human body. The wide bandwidth (hundreds of Hz) allows real-time monitoring in SB, QB, and FB [211].
To date, accelerometers-based methods for measuring breathing-related movements have been roughly validated, and rarely research has addressed the problems caused by breathing-unrelated movements as in [212]. Breathing pattern can be recorded with one or more accelerometers at the level of the upper thorax and/or abdomen [213,214]. When single- or dual-axis accelerometers are used, attention must be paid to appropriately align sensors with the major axis of rotation to improve the measurement accuracy. Conversely, the use of a triaxial device allows measuring acceleration regardless of body orientation [212,215]. A triaxial accelerometer positioned at the level of lower costal margin allows the accurate measurement of on seated subjects: values compared to those recorded by a reference instrument (i.e., pressure at the level of the nose) showed a correlation coefficient of 0.98 and a root mean square error of 0.38 bpm (maximum error ∼3 bpm) [212]. Average values estimated by the accelerometer signal were correlated with those from a reference instrument (i.e., spirometer), with an error <1% during QB [216]. Furthermore, different breathing patterns have been monitored with one or more accelerometers (e.g., quiet, bradypnea, tachypnea, Cheyn-stokes, Kaussmal, Biot’s) in [216] and values were extracted. When accelerometers were used during walking (2.5 km/h) and running (6 km/h) activities, the error increases up to 7.45 bpm and 4.52 bpm, respectively, when the information of three axes were merged and used as reported in [217]. Similar results were found during walking and running (mean percentage error of 8.59% and 4.13% during walking at 5 km/h and running at 15 km/h, respectively) in [218].
7.3.2. Angular Velocities Sensors (Gyroscopes)
A gyroscope is a sensor mounted on a frame and able to record an angular velocity if the frame is rotating. Many classes of gyroscopes exist, depending on the operating physical principle and the involved technology. Mechanical and micro-electromechanical system (MEMS) gyroscopes are the most commonly used. MEMS gyroscopes are movement sensors able to detect and measure the rate of rotation of an object around a particular axis (i.e., 1-axis, 2-axis, and 3-axis).
The working principle of a gyroscope is widely described in [219]. Angular velocities (, , ) and Euler angles (, , ) are related as follows:
where is the angular velocity generated by rotation of the x axis, is the angular velocity generated by rotation of y axis, is the angular velocity generated by rotation of the z axis [220]. According to Equation (19), estimation of the change in the thorax angle using only a gyroscope has to entail integral calculation. In this process, the sensor drift may cause a divergent output determined by the integration of not only the change in the thorax angle but also the errors of the gyroscope sensor [221]. For this reason, gyroscopes are usually used in conjunction with an accelerometer. When a triaxial accelerometer is employed, the 3-axial angular velocities are merged with 3-axial accelerations [222]. Therefore, gyroscopes allow producing high-quality respiration signals to overcome the weakness of using a single accelerometer [216], even during exercise [220].
Several metrological characteristics (detailed in [223]) have to be considered when a gyroscope is intended to be used to estimate . The wide bandwidth (more than 100 Hz) allows real-time monitoring in SB, QB, and FB [224].
When a gyroscope was used in conjunction with a triaxial accelerometer on healthy subjects in stationary conditions, the average values of showed discrepancies always lower than 1.5 bpm (average error of 0.77 bpm), when compared to values manually counted by the authors [222]. Respiratory patterns obtained fusing accelerometer and gyroscope signals were investigated in [225]: the average error in estimating average values was 0.7 bpm during QB (max value of 2.0 bpm), and 3.0 bpm during running (max value of 4.0 bpm) [225].
7.3.3. Magnetic Field Sensors (Magnetometers)
A magnetic field sensor (also known as magnetometer) can be used to estimate breathing-related thoracic and abdominal movements by recording the corresponding variations in the magnetic vector. Two approaches can be used: the magnetic field sensor can be worn by the subject on the chest (e.g., it can be embedded in straps or clothes) [226] or the magnetic field sensor can be positioned on the front of the patient’s chest, and a magnet is on the patient’s back [227]. In the first case, the magnetic vector rotates due to the chest movement during the breathing activity and this rotation causes the change of one of the three magnetic vector components [226]. In the second case, the magnetometer detects the strength of the magnetic field (i.e., magnetic flux density) that is inversely proportional to the distance between the sensor and the magnet. Hence, the sensor estimates the position by measuring the intensity of the magnetic field according to the distance between the sensor and the magnet [227]. The use of a passive magnet as a source of magnetic field provides adequate spatial resolution for the specific application and also lower power consumption when compared to other multi-sensors solutions.
When used on humans during regular working activity, good performance was found using the respiratory waveform recorded by a magnetometer to estimate values. By the comparison of these values against ones of a reference system (i.e., thermistor), a maximum error of ∼3 bpm was found [226]. Experimental trials on 40 subjects at rest (sitting and standing) and during treadmill exercise demonstrated excellent performance with a MOD of 0.02 s for inspiratory and expiratory time (no data about ) with respect to reference values (i.e., by spirometer) [228].
The magnetometer is highly sensitive to the movement of the body and to external changes of the magnetic field that can occur in unstructured environments. This may negatively affect the quality of the respiratory signal. Magnetic field sensors have also attracted industries for developing smart textiles for respiratory monitoring in clinical settings, as demonstrated by some registered patents [229].
To overcome some of the aforementioned limitations, a 3-axis accelerometer, a 3-axis gyroscope and a 3-axis magnetometer can be integrated into a single device known as inertial measurement unit (IMU). Each IMU provides 3D-acceleration, 3D-magnetic field, and 3D-angular rate [230]. From these quantities, researchers have tried to retrieve respiratory waveforms [230,231]. These data are then combined to provide accurate tridimensional orientation data of the sensor, represented as a quaternion [231]. Computing research on sensors data fusion is growing rapidly because the use of different algorithms may largely affect the outcome of the signal analysis stage, and thus the suitability of IMUs for monitoring [230].
7.4. Short Summary
Strain and movement sensors may be suitable for monitoring because they can be easily integrated into clothes and garments. Piezoresistive, capacitive and inductive sensors can be embedded directly in the textile during garment manufacturing. Differently, accelerometers, gyroscopes and magnetometers can be placed on the garment at specific locations. These sensors are intrinsically unobtrusive when compared to other technologies. Connections (wires) are required to supply the power to the sensor (this applies for strain sensors), but they have high integration in the textile. Sensors are usually placed at the level of the upper chest (at the level of the xiphoid process) and integrated into mechanical supports to give mechanical stability and robustness to the sensor. Strain sensors have exhibited high performance in the monitoring of apnea, SB, QB and FB. One of the main drawbacks of both strain and movement sensors is their sensitivity to movement unrelated to the breathing activity. A possible solution is to develop hybrid solutions based on more sensors to appreciate breathing-unrelated movements and to exclude or reduce their influence on the breathing signal. Piezoresistive sensors can be sensitive to environmental factors changes (i.e., changes in the environmental temperature or humidity may cause an output drift) if not appropriately superficially treated (e.g., incorporated in polymers or protective materials). Movement sensors are generally validated in structured environments and in the clinical scenario (e.g., intensive care unit, geriatrics), while they are seldom employed in the monitoring of athletes especially in outdoor scenarios. All the sensors reviewed in this section allow the recording of the respiratory waveform in the time domain. Additionally, piezoresistive, capacitive, inductive and transthoracic impedance sensors can be used to record respiratory volume after a pre-calibration phase. Given the possibility of integrating multiple sensors in a garment, strain sensors, transthoracic impedance sensors, and movement sensors can be used to analyze the thoracic and abdominal breathing patterns separately. This peculiarity makes these sensors extremely interesting in physiology and biomedical research.
Table 8 summarizes the main metrological properties and characteristics of the movement sensors for monitoring, and their field of use.
8. Techniques Based on the Modulation of Cardiac Activity
Respiratory activity can be monitored using techniques devoted to recording cardiac activity, in view of the modulatory effect that breathing has on cardiac activity. In particular, electrocardiography, ECG, and photoplethysmography, PPG, can be used to extract values (see Figure 10). Both ECG and PPG signals are easily and widely acquired by non-invasive sensors in both healthcare and consumer electronics devices, making them suitable candidates for measurement in a range of settings, from hospital to outdoor scenarios [232].
8.1. Biopotential Sensors
ECG Sensors
ECG is a measure of the electrical activity generated by the action potentials in heart muscle at each heartbeat. ECG signal is typically acquired by measuring the voltage difference between two or more points on the body surface over time [234]. ECG electrode placement is standardized to guarantee accurate recording of the potentials [235,236]. The ECG signal is generally affected by the motion of the electrodes with respect to the heart caused by respiratory-related and -unrelated movements and by changes in the electrical impedance of the thoracic cavity [232]. These phenomena strongly influence the amplitude in the recorded ECG. Specifically, changes in the orientation of the hearth electrical axis related to the electrodes and modification of the thoracic impedance cause the baseline wander and amplitude modulation of the ECG signal [237]. Generally, methods based on changes in the ECG vector orientation are recognized with the EDR acronym (i.e., ECG-derived respiration). The ECG signal is also affected by the frequency modulation caused by the increase of the heart rate during the inspiration phase and its decrease during the expiration phase [238]. Methods based on frequency modulation of the ECG signal are recognized with the RSA acronym (i.e., respiratory sinus arrhythmia) [12]. One or more of these modulations can be used to estimate average values and breath-by-breath values of , by applying complex algorithms (reviewed in [232,239]) on raw ECG data.
To record biopotential, Ag/AgCl electrodes may be used [236]. However, suitable signals can also be acquired using conductive textiles or polymers integrated into smart clothes [240,241]. Even though the majority of the studies used electrodes positioned on the thorax, promising studies have been published exploring another site (i.e., wrist) to record ECG for estimation [242]. The influence of the sensor’s position on the data quality has been explored in [202] by using multi-channel ECG and considering all the pairs of two neighboring electrodes as potential sensors. In general, it is not yet clear if multi-channel signals provide better performance compared to one-lead ECG [232]. Given the robustness of the circuits used to record and process the signal, ECG can be incorporated into wearable systems for use with ambulatory patients to identify changes in heart rate and cardiac rhythm.
Breath-by-breath analysis during sleep demonstrated an error of 1.8 ± 2.7 bpm when compared to reference data (i.e., by an airflow method) [12]. Experiments on healthy subjects at rest showed a bias of 0.75 ± 2.86 bpm when compared to reference data (i.e., by a wearable system embedding resistive sensors) [243]. The estimation of derived from a single-channel ECG wearable device has been demonstrated feasible when tested on 67 subjects during real-life activities (e.g., office, households and sports), with a bias of ∼0.3 ± 3 bpm [244]. Especially during exercise, poor quality of ECG signals can strongly affect the performance of the method for extracting accurate values [245]. So far, this method has been mainly used in applications where the ECG was already in use for cardiac monitoring, including intensive care setting and remote monitoring of patients [232].
8.2. Light Intensity Sensors
PPG Sensors
PPG is an easy and cost-effective optical technique that can be used to measure changes in blood volume over time in a bed of tissue [246]. To record these changes, PPG sensor uses one or more light-emitting diodes, LED, to emit light (with wavelengths between 500 and 600 nm, i.e., the green-yellow region of the visible spectrum) at the tissue [233], and one photodetector, PD, to record the intensity of the non-absorbed light reflected from the tissue [246]. PPG sensors must be in contact with the tissue. Commonly, the measurement is performed at peripherical sites (i.e., ear, fingers and toes) using pulse oximeter probes that can be easily attached to the skin [233].
The breathing activity modulates the PPG signal in three different ways: amplitude modulation caused by reduced blood stroke volume during the inspiratory phase (resulting by changes in intrathoracic pressure) [247]; frequency modulation caused by spontaneous increase of heart rate during inspiration phase and related decrease during expiration phase (as in the ECG modulation) [238]; wander from the signal baseline caused by changes in tissue blood volume (related to intrathoracic pressure changes carried within the arterial tree and vasoconstriction of arteries during inhalation) [248]. Additionally, the respiratory activity affects the PPG pulse wave width [249]. During the inspiratory phase, sympathetic activation stiffens arteries, increasing pulse wave velocity when compared to the expiratory phase. Moreover, intrathoracic pressure changes induced by the respiratory activity can contribute to these stiffness variations [249].
When a PPG sensor is used for measuring , several factors may be taken into account since the PPG recordings could be affected—among others—by the measuring site (i.e., probe attachment site), the contact force between PPG sensor and site, the subject posture, the ambient temperature [232]. Then, the raw signal is usually corrupted by motion artifacts due to voluntary or involuntary movements of the subject (e.g., during sporting activities) while acquiring the data. Signal processing methods may be used to reduce motion artifacts. Overviews of signal processing techniques that may be used to reduce these artifacts are presented in [233,250]. Additionally, accelerometers or gyroscopes can be used to gather additional information about body site movements and to reduce the motion artifact as presented in [251].
PPG measurement for estimation has been tested on patients in clinical settings during procedural sedation and analgesia: in [252] the PPG sensor on the finger showed a limited ability to provide warning signs for a hypoxemic event during the sedation procedure (bias of 2.25 ± 5.41 bpm in the absence of movements). However, a recent multi-center study demonstrated that PPG sensor signals can be used for QB monitoring on healthy subjects and hospitalized patients with a bias always lower than 0.07 ± 3.90 bpm when compared to reference data (gathered by capnography [253]). A validation study on 205 children with a wide range of (12–50 bpm) during triage (2-min of data collection) demonstrated a bias of 0.9 ± 16.8 bpm [254].
Table 9 summarizes the main metrological properties and characteristics of the sensors for registering cardiac biopotential and light intensity used for monitoring, and their field of use.
8.3. Short Summary
Undoubtedly, there is a growing interest in the use of ECG and PPG signals for the continuous measurement of . One of the main reasons is that electrodes for ECG and optical probes for PPG sensors are already used in clinical practice and for home monitoring of heart activity and of oxygen saturation. On the one hand, these sensors are good candidates for continuous monitoring since they are characterized by low invasiveness, good integration in wearable systems, low energy consumption, and low cost. On the other hand, their high sensitivity to movements unrelated to breathing may substantially limit their use during exercise. Furthermore, the quality of ECG and PPG signals decreases in the case of a bad electrode or probe adherence to the skin. With the growing use of newly available machine learning, artificial intelligence tools, and advanced signal analysis techniques, respiratory waveforms over time can be retrieved from both raw ECG and PPG signals. A certain number of validation studies have demonstrated good performance of both methods in structured environments (e.g., intensive care unit), while far less studies have been performed outside the clinical scenarios (e.g., during sporting activities). There is a growing interest in this field of research, testified by numerous articles aiming at presenting new techniques and algorithms to be used in the next future for the extraction of respiratory variables and values [255].
9. Conclusions
In the present review, we have provided a detailed description of the contact-based methods currently available to estimate . This work was stimulated by the growing interest in monitoring during different applications, the difficulty of choosing the appropriate technique to serve different measurement needs, and the paucity of previous reviews on this topic.
Despite the fact that is a simple physiological variable, measurement needs may change extensively on the basis of population, activities, environmental factors, costs, device intrusiveness, among other factors. For instance, some techniques (e.g., those based on ECG and PPG recording) may be suitable for measuring in clinical settings, but they may not be the preferential choice during sporting activities characterized by motion artifacts. Hence the need for a detailed review that can help understand how to estimate .
We have identified 7 different methods classified according to the measurand: respiratory airflow, respiratory sound, air temperature, air humidity, air components, chest wall movements, and modulation of cardiac activity. For each method, we have provided a schematic representation of the different sensors, with the description of the elements composing the measuring chain for each sensor. Furthermore, each sensor has been described on the basis of its metrological properties (i.e., sensitivity, response time, output linearity and accuracy), its characteristics (i.e., size, cost, real-time monitoring, measurement intrusiveness, sensitivity to body motion artifacts, influence of environmental factors and presence of wire) and potential applications (i.e., apnea detection, monitoring of SB, QB and FB).
We have also provided a schematic comparison (see Table 10) of the different methods and their suitability in measuring in the main fields of application (i.e., clinical settings, occupational settings, and sport and exercise). This schematic comparison can help researchers from various fields and interested readers understand how can be monitored for different purposes. Additionally, we have summarized the main advantage and disadvantage taking into account metrological properties and sensor characteristics for each technique used to monitor .
The proposed classification and methodological approach are expected to guide the choice of techniques for estimation and the development of novel respiratory wearables, while stimulating further research.
Author Contributions
Conceptualization, C.M., A.N. and E.S.; Methodology, C.M., A.N., D.L.P., M.S., S.S. and E.S.; Formal Analysis, C.M., A.N. and E.S.; Investigation, C.M. and A.N.; Resources, C.M., A.N. and E.S.; Data Curation, C.M., A.N.; Writing—Original Draft Preparation, C.M., A.N. and E.S.; Writing—Review & Editing, C.M., A.N., D.L.P. and E.S.; Visualization, C.M., A.N., D.L.P., M.S., S.S. and E.S.; Supervision, M.S., S.S. and E.S.
Funding
This research received no external funding.
Conflicts of Interest
The authors declare no conflict of interest.
Abbreviations
The following abbreviations are used in this manuscript:
| Respiratory frequency | |
| bpm | Breaths per minute |
| SB | Slow breathing |
| QB | Quiet breathing |
| FB | Fast breathing |
| FOS | Fiber-optic sensor |
| DF | Differential flowmeter |
| HWA | Hot wire anemometer |
| FBG | Fiber Bragg Grating |
| Q | Airflow |
| P | Pressure |
| ΔP | Pressure drop |
| i | Current |
| R | Resistance |
| Wavelength | |
| I | Light intensity |
| V | Voltage |
| FEV1 | Forced expiratory volume in the 1st second |
| FVC | Forced vital capacity |
| T | Temperature |
| CORSA | Computerized Respiratory Sound Analysis |
| C | Capacitance |
| E | Applied voltage |
| CO2 | Carbon dioxide |
| MOD | Mean of differences |
| LOA | Limit of agreement |
| Bragg wavelength | |
| RH | Relative humidity |
| ppm | Parts per million |
| NDIR | Nondispersive infrared |
| COPD | Chronic obstructive pulmonary disease |
| Z | Impedance |
| MEMS | Mechanical and micro-electromechanical system |
| IMU | Inertial Measurement Unit |
| PPG | Photoplethysmography |
| ECG | Electrocardiography |
| EDR | ECG-derived respiration |
| RSA | Respiratory sinus arrhythmia |
| LED | Light-emitting diodes |
| PD | Photodetector |
References
- Nicolò, A.; Girardi, M.; Sacchetti, M. Control of the depth and rate of breathing: Metabolic vs. non-metabolic inputs. J. Physiol. 2017, 595, 6363–6364. [Google Scholar] [CrossRef] [PubMed]
- Nicolò, A.; Girardi, M.; Bazzucchi, I.; Felici, F.; Sacchetti, M. Respiratory frequency and tidal volume during exercise: Differential control and unbalanced interdependence. Physiol. Rep. 2018, 6, e13908. [Google Scholar] [CrossRef] [PubMed]
- Tipton, M.J.; Harper, A.; Paton, J.F.; Costello, J.T. The human ventilatory response to stress: Rate or depth? J. Physiol. 2017, 595, 5729–5752. [Google Scholar] [CrossRef] [PubMed]
- Cretikos, M.A.; Bellomo, R.; Hillman, K.; Chen, J.; Finfer, S.; Flabouris, A. Respiratory rate: The neglected vital sign. Med. J. Aust. 2008. [Google Scholar] [CrossRef]
- Lovett, P.B.; Buchwald, J.M.; Stürmann, K.; Bijur, P. The vexatious vital: Neither clinical measurements by nurses nor an electronic monitor provides accurate measurements of respiratory rate in triage. Ann. Emerg. Med. 2005, 45, 68–76. [Google Scholar] [CrossRef]
- Folke, M.; Cernerud, L.; Ekström, M.; Hök, B. Critical review of non-invasive respiratory monitoring in medical care. Med. Biol. Eng. Comput. 2003, 41, 377–383. [Google Scholar] [CrossRef]
- AL-Khalidi, F.Q.; Saatchi, R.; Burke, D.; Elphick, H.; Tan, S. Respiration rate monitoring methods: A review. Pediatr. Pulmonol. 2011, 46, 523–529. [Google Scholar] [CrossRef] [Green Version]
- Nicolò, A.; Massaroni, C.; Passfield, L. Respiratory frequency during exercise: The neglected physiological measure. Front. Physiol. 2017, 8, 922. [Google Scholar] [CrossRef]
- Parkes, R. Rate of respiration: The forgotten vital sign. Emerg. Nurse 2011, 19, 12–19. [Google Scholar] [CrossRef]
- Smith, I.; Mackay, J.; Fahrid, N.; Krucheck, D. Respiratory rate measurement: A comparison of methods. Br. J. Healthc. Assist. 2011, 5, 18–23. [Google Scholar] [CrossRef]
- Barthel, P.; Wensel, R.; Bauer, A.; Müller, A.; Wolf, P.; Ulm, K.; Huster, K.M.; Francis, D.P.; Malik, M.; Schmidt, G. Respiratory rate predicts outcome after acute myocardial infarction: A prospective cohort study. Eur. Heart J. 2013. [Google Scholar] [CrossRef]
- Helfenbein, E.; Firoozabadi, R.; Chien, S.; Carlson, E.; Babaeizadeh, S. Development of three methods for extracting respiration from the surface ECG: A review. J. Electrocardiol. 2014, 47, 819–825. [Google Scholar] [CrossRef] [PubMed]
- Gupta, K.; Prasad, A.; Nagappa, M.; Wong, J.; Abrahamyan, L.; Chung, F.F. Risk factors for opioid-induced respiratory depression and failure to rescue: A review. Curr. Opin. Anaesthesiol. 2018, 31, 110–119. [Google Scholar] [CrossRef] [PubMed]
- Rantonen, T.; Jalonen, J.; Grönlund, J.; Antila, K.; Southall, D.; Välimäki, I. Increased amplitude modulation of continuous respiration precedes sudden infant death syndrome: Detection by spectral estimation of respirogram. Early Hum. Dev. 1998, 53, 53–63. [Google Scholar] [CrossRef]
- Philip, K.; Richardson, R.; Cohen, M. Staff perceptions of respiratory rate measurement in a general hospital. Br. J. Nurs. 2013, 22, 570–574. [Google Scholar] [CrossRef] [PubMed]
- Subbe, C.; Kinsella, S. Continuous Monitoring of Respiratory Rate in Emergency Admissions: Evaluation of the RespiraSense™ Sensor in Acute Care Compared to the Industry Standard and Gold Standard. Sensors 2018, 18, 2700. [Google Scholar] [CrossRef] [PubMed]
- Coca, A.; Roberge, R.J.; Jon Williams, W.; Landsittel, D.P.; Powell, J.B.; Palmiero, A. Physiological monitoring in firefighter ensembles: Wearable plethysmographic sensor vest versus standard equipment. J. Occup. Environ. Hyg. 2009. [Google Scholar] [CrossRef]
- Marcel-Millet, P.; Ravier, G.; Grospretre, S.; Gimenez, P.; Freidig, S.; Groslambert, A. Physiological responses and parasympathetic reactivation in rescue interventions: The effect of the breathing apparatus. Scand. J. Med. Sci. Sports 2018, 28, 2710–2722. [Google Scholar] [CrossRef]
- Grassmann, M.; Vlemincx, E.; von Leupoldt, A.; Mittelstädt, J.M.; Van den Bergh, O. Respiratory changes in response to cognitive load: A systematic review. Neural Plast. 2016, 2016, 8146809. [Google Scholar] [CrossRef]
- Grassmann, M.; Vlemincx, E.; von Leupoldt, A.; Van den Bergh, O. The role of respiratory measures to assess mental load in pilot selection. Ergonomics 2016. [Google Scholar] [CrossRef]
- White, M.D. Components and mechanisms of thermal hyperpnea. J. Appl. Physiol. 2006, 101, 655–663. [Google Scholar] [CrossRef] [PubMed] [Green Version]
- Carballo-Leyenda, B.; Villa, J.G.; López-Satué, J.; Collado, P.S.; Rodríguez-Marroyo, J.A. Fractional contribution of wildland firefighters’ personal protective equipment on physiological strain. Front. Physiol. 2018. [Google Scholar] [CrossRef]
- Nicolò, A.; Bazzucchi, I.; Haxhi, J.; Felici, F.; Sacchetti, M. Comparing continuous and intermittent exercise: An “isoeffort” and “isotime” approach. PLoS ONE 2014, 9, e94990. [Google Scholar] [CrossRef]
- Nicolò, A.; Marcora, S.M.; Sacchetti, M. Respiratory frequency is strongly associated with perceived exertion during time trials of different duration. J. Sports Sci. 2016, 34, 1199–1206. [Google Scholar] [CrossRef] [PubMed]
- Nicolò, A.; Marcora, S.M.; Bazzucchi, I.; Sacchetti, M. Differential control of respiratory frequency and tidal volume during high-intensity interval training. Exp. Physiol. 2017, 102, 934–949. [Google Scholar] [CrossRef] [PubMed]
- Nicolò, A.; Bazzucchi, I.; Lenti, M.; Haxhi, J.; di Palumbo, A.S.; Sacchetti, M. Neuromuscular and metabolic responses to high-intensity intermittent cycling protocols with different work-to-rest ratios. Int. J. Sports Physiol. Perform. 2014, 9, 151–160. [Google Scholar] [CrossRef] [PubMed]
- Puente-Maestu, L.; de Pedro, J.G.; Martínez-Abad, Y.; de Oña, J.M.R.; Llorente, D.; Cubillo, J.M. Dyspnea, ventilatory pattern, and changes in dynamic hyperinflation related to the intensity of constant work rate exercise in COPD. Chest 2005, 128, 651–656. [Google Scholar] [CrossRef] [PubMed]
- Gagnon, P.; Bussières, J.S.; Ribeiro, F.; Gagnon, S.L.; Saey, D.; Gagné, N.; Provencher, S.; Maltais, F. Influences of spinal anesthesia on exercise tolerance in patients with chronic obstructive pulmonary disease. Am. J. Respir. Crit. Care Med. 2012, 186, 606–615. [Google Scholar] [CrossRef] [PubMed]
- Joint Committee for Guides in Metrology (JCGM). 200: 2012—International Vocabulary of Metrology—Basic and General Concepts and Associated Terms (VIM); Technical Report; JCGM: Sèvres, France, 2012. [Google Scholar]
- Rodríguez-Molinero, A.; Narvaiza, L.; Ruiz, J.; Gálvez-Barrón, C. Normal respiratory rate and peripheral blood oxygen saturation in the elderly population. J. Am. Geriatr. Soc. 2013, 61, 2238–2240. [Google Scholar] [CrossRef]
- Martin, E.A. Concise Medical Dictionary; Oxford University Press: New York, NY, USA, 2015. [Google Scholar]
- Ganong, W.F.; Ganong, W. Review of Medical Physiology; Appleton & Lange: Norwalk, CT, USA, 1995. [Google Scholar]
- Medical Technology. Available online: https://www.sensirion.com/en/markets/sensor-solutions-for-medical-applications/ (accessed on 12 December 2018).
- MIR Reusable Turbine. Available online: https://www.spirometry.com/Eng/Products/reusable_turbine.asp (accessed on 1 January 2019).
- Balakrishnan, V.; Phan, H.P.; Dinh, T.; Dao, D.V.; Nguyen, N.T. Thermal flow sensors for harsh environments. Sensors 2017, 17, 2061. [Google Scholar] [CrossRef]
- Schena, E.; Massaroni, C.; Saccomandi, P.; Cecchini, S. Flow measurement in mechanical ventilation: A review. Med. Eng. Phys. 2015, 37, 257–264. [Google Scholar] [CrossRef] [PubMed]
- Stocks, J.; Sly, P.D.; Tepper, R.S.; Morgan, W.J. Infant Respiratory Function Testing; John Wiley & Sons: Hoboken, NJ, USA, 1996. [Google Scholar]
- Fleisch, A. Der Pneumotachograph; ein Apparat zur Geschwindigkeitsregistrierung der Atemluft. Pflüegers Arch. Gesame Physiol. Menschen Tiere 1925, 209, 713–722. [Google Scholar] [CrossRef]
- Lilly, J.C. Flow meter for recording respiratory flow of human subjects. Methods Med. Res. 1950, 11, 113–121. [Google Scholar]
- Schena, E.; Lupi, G.; Cecchini, S.; Silvestri, S. Linearity dependence on oxygen fraction and gas temperature of a novel Fleisch pneumotachograph for neonatal ventilation at low flow rates. Measurement 2012, 45, 2064–2071. [Google Scholar] [CrossRef]
- Finucane, K.E.; Egan, B.A.; Dawson, S.V. Linearity and frequency response of pneumotachographs. J. Appl. Physiol. 1972, 32, 121–126. [Google Scholar] [CrossRef] [PubMed]
- Miller, R.W. Flow Measurement Engineering Handbook; McGraw-Hill: Columbus, OH, USA, 1983. [Google Scholar]
- Tardi, G.; Massaroni, C.; Saccomandi, P.; Schena, E. Experimental assessment of a variable orifice flowmeter for respiratory monitoring. J. Sens. 2015, 2015, 752540. [Google Scholar] [CrossRef]
- Stick, S.; Ellis, E.; LeSouëf, P.; Sly, P. Validation of respiratory inductance plethysmography (“Respitrace”®) for the measurement of tidal breathing parameters in newborns. Pediatr. Pulmonol. 1992, 14, 187–191. [Google Scholar] [CrossRef]
- Sharp, C.; Soleimani, V.; Hannuna, S.; Camplani, M.; Damen, D.; Viner, J.; Mirmehdi, M.; Dodd, J.W. Toward respiratory assessment using depth measurements from a time-of-flight sensor. Front. Physiol. 2017, 8, 65. [Google Scholar] [CrossRef]
- Presti, D.L.; Massaroni, C.; Formica, D.; Saccomandi, P.; Giurazza, F.; Caponero, M.A.; Schena, E. Smart Textile Based on 12 Fiber Bragg Gratings Array for Vital Signs Monitoring. IEEE Sens. J. 2017, 17, 6037–6043. [Google Scholar] [CrossRef]
- Beckwith, T.G.; Buck, N.L.; Marangoni, R.D. Mechanical Measurements; Addison-Wesley: Reading, MA, USA, 1969; Volume 5. [Google Scholar]
- Sokol, Y.; Tomashevsky, R.; Kolisnyk, K. Turbine spirometers metrological support. In Proceedings of the 2016 International Conference on Electronics and Information Technology (EIT), Odessa, Ukraine, 23–27 May 2016; pp. 1–4. [Google Scholar]
- Moore, V. Spirometry: Step by step. Breathe 2012, 8, 232–240. [Google Scholar] [CrossRef]
- Malmberg, L.; Hedman, J.; Sovijärvi, A. Accuracy and repeatability of a pocket turbine spirometer: Comparison with a rolling seal flow-volume spirometer. Clin. Physiol. 1993, 13, 89–98. [Google Scholar] [CrossRef] [PubMed]
- Lucia, A.; Fleck, S.; Gotshall, R.; Kearney, J. Validity and reliability of the Cosmed K2 instrument. Int. J. Sports Med. 1993, 14, 380–386. [Google Scholar] [CrossRef] [PubMed]
- Guidetti, L.; Meucci, M.; Bolletta, F.; Emerenziani, G.P.; Gallotta, M.C.; Baldari, C. Validity, reliability and minimum detectable change of COSMED K5 portable gas exchange system in breath-by-breath mode. PLoS ONE 2018, 13, e0209925. [Google Scholar] [CrossRef] [PubMed]
- Perez-Suarez, I.; Martin-Rincon, M.; Gonzalez-Henriquez, J.J.; Fezzardi, C.; Perez-Regalado, S.; Galvan-Alvarez, V.; Juan-Habib, J.W.; Morales-Alamo, D.; Calbet, J.A. Accuracy and precision of the COSMED K5 portable analyser. Front. Physiol. 2018, 9, 1764. [Google Scholar] [CrossRef] [PubMed]
- Bruun, H.H. Hot-wire Anemometry: Principles and Signal Analysis; Oxford Unversity Press: New York, NY, USA, 1996. [Google Scholar]
- King, L.V. XII. On the convection of heat from small cylinders in a stream of fluid: Determination of the convection constants of small platinum wires with applications to hot-wire anemometry. Philos. Trans. R. Soc. Lond. A 1914, 214, 373–432. [Google Scholar] [CrossRef]
- Yoshiya, I.; Nakajima, T.; Nagai, I.; Jitsukawa, S. A bidirectional respiratory flowmeter using the hot-wire principle. J. Appl. Physiol. 1975, 38, 360–365. [Google Scholar] [CrossRef]
- Te Pas, A.B.; Wong, C.; Kamlin, C.O.F.; Dawson, J.A.; Morley, C.J.; Davis, P.G. Breathing patterns in preterm and term infants immediately after birth. Pediatr. Res. 2009, 65, 352. [Google Scholar] [CrossRef]
- Hager, D.N.; Fuld, M.; Kaczka, D.W.; Fessler, H.E.; Brower, R.G.; Simon, B.A. Four methods of measuring tidal volume during high-frequency oscillatory ventilation. Crit. Care Med. 2006, 34, 751–757. [Google Scholar] [CrossRef]
- Sturtz, W.J.; Touch, S.M.; Locke, R.G.; Greenspan, J.S.; Shaffer, T.H. Assessment of neonatal ventilation during high-frequency oscillatory ventilation. Pediatr. Crit. Care Med. 2008, 9, 101–104. [Google Scholar] [CrossRef]
- Shikida, M.; Naito, J.; Yokota, T.; Kawabe, T.; Hayashi, Y.; Sato, K. A catheter-type flow sensor for measurement of aspirated-and inspired-air characteristics in the bronchial region. J. Micromech. Microeng. 2009, 19, 105027. [Google Scholar] [CrossRef]
- Jiang, P.; Zhao, S.; Zhu, R. Smart sensing strip using monolithically integrated flexible flow sensor for noninvasively monitoring respiratory flow. Sensors 2015, 15, 31738–31750. [Google Scholar] [CrossRef] [PubMed]
- Schena, E.; Saccomandi, P.; Silvestri, S. A high sensitivity fiber optic macro-bend based gas flow rate transducer for low flow rates: Theory, working principle, and static calibration. Rev. Sci. Instrum. 2013, 84, 024301. [Google Scholar] [CrossRef] [PubMed]
- Hu, R.P.; Huang, X.G. A simple fiber-optic flowmeter based on bending loss. IEEE Sens. J. 2009, 9, 1952–1955. [Google Scholar] [CrossRef]
- Zhao, Y.; Chen, K.; Yang, J. Novel target type flowmeter based on a differential fiber Bragg grating sensor. Measurement 2005, 38, 230–235. [Google Scholar] [CrossRef]
- Lu, P.; Chen, Q. Fiber Bragg grating sensor for simultaneous measurement of flow rate and direction. Meas. Sci. Technol. 2008, 19, 125302. [Google Scholar] [CrossRef]
- Lim, J.; Yang, Q.; Jones, B.; Jackson, P. DP flow sensor using optical fibre Bragg grating. Sens. Actuators A Phys. 2001, 92, 102–108. [Google Scholar] [CrossRef]
- Gao, S.; Zhang, A.P.; Tam, H.Y.; Cho, L.; Lu, C. All-optical fiber anemometer based on laser heated fiber Bragg gratings. Opt. Express 2011, 19, 10124–10130. [Google Scholar] [CrossRef]
- Mohanty, L.; Kuang, K.S. A breathing rate sensor with plastic optical fiber. Appl. Phys. Lett. 2010, 97, 073703. [Google Scholar] [CrossRef]
- Li, X.; Liu, D.; Kumar, R.; Ng, W.P.; Fu, Y.Q.; Yuan, J.; Yu, C.; Wu, Y.; Zhou, G.; Farrell, G.; et al. A simple optical fiber interferometer based breathing sensor. Meas. Sci. Technol. 2017, 28, 035105. [Google Scholar] [CrossRef] [Green Version]
- Battista, L.; Sciuto, S.; Scorza, A. An air flow sensor for neonatal mechanical ventilation applications based on a novel fiber-optic sensing technique. Rev. Sci. Instrum. 2013, 84, 035005. [Google Scholar] [CrossRef]
- Saccomandi, P.; Schena, E.; Silvestri, S. A novel target-type low pressure drop bidirectional optoelectronic air flow sensor for infant artificial ventilation: Measurement principle and static calibration. Rev. Sci. Instrum. 2011, 82, 024301. [Google Scholar] [CrossRef] [PubMed]
- Sovijarvi, A.; Dalmasso, F.; Vanderschoot, J.; Malmberg, L.; Righini, G.; Stoneman, S. Definition of terms for applications of respiratory sounds. Eur. Respir. Rev. 2000, 10, 597–610. [Google Scholar]
- Ballantine, D., Jr.; White, R.M.; Martin, S.J.; Ricco, A.J.; Zellers, E.; Frye, G.; Wohltjen, H. Acoustic Wave Sensors: Theory, Design and Physico-Chemical Applications; Elsevier: Amsterdam, The Netherlands, 1996. [Google Scholar]
- Li, S.H.; Lin, B.S.; Tsai, C.H.; Yang, C.T.; Lin, B.S. Design of wearable breathing sound monitoring system for real-time wheeze detection. Sensors 2017, 17, 171. [Google Scholar] [CrossRef]
- Eargle, J. The Microphone Book: From Mono to Stereo to Surround—A Guide To Microphone Design and Application; CRC Press: Boca Raton, FL, USA, 2012. [Google Scholar]
- Eargle, J.M. Handbook of Recording Engineering; Springer Science & Business Media: Berlin, Germany, 2012. [Google Scholar]
- Moussavi, Z. Fundamentals of respiratory sounds and analysis. Synth. Lect. Biomed. Eng. 2006, 1, 1–68. [Google Scholar] [CrossRef]
- Reyes, B.A.; Reljin, N.; Chon, K.H. Tracheal sounds acquisition using smartphones. Sensors 2014, 14, 13830–13850. [Google Scholar] [CrossRef] [PubMed]
- Reichert, S.; Gass, R.; Brandt, C.; Andrès, E. Analysis of respiratory sounds: State of the art. Clin. Med. Circ. Respir. Pulm. Med. 2008, 2, 45–58. [Google Scholar] [CrossRef]
- Mimoz, O.; Benard, T.; Gaucher, A.; Frasca, D.; Debaene, B. Accuracy of respiratory rate monitoring using a non-invasive acoustic method after general anaesthesia. Br. J. Anaesth. 2012. [Google Scholar] [CrossRef]
- Bland, J.M.; Altman, D. Statistical methods for assessing agreement between two methods of clinical measurement. Lancet 1986, 327, 307–310. [Google Scholar] [CrossRef]
- Sierra, G.; Telfort, V.; Popov, B.; Pelletier, M.; Despault, P.; Lanzo, V.; Agarwal, R. Comparison of respiratory rate estimation based on tracheal sounds versus a capnograph. In Proceedings of the 27th Annual International Conference of the Engineering in Medicine and Biology Society (IEEE-EMBS 2005), Shanghai, China, 17–18 January 2006; pp. 6145–6148. [Google Scholar]
- Corbishley, P.; Rodríguez-Villegas, E. Breathing detection: Towards a miniaturized, wearable, battery-operated monitoring system. IEEE Trans. Biomed. Eng. 2008. [Google Scholar] [CrossRef]
- Gu, F.; Niu, J.; Das, S.K.; He, Z.; Jin, X. Detecting breathing frequency and maintaining a proper running rhythm. Pervasive Mob. Comput. 2017, 42, 498–512. [Google Scholar] [CrossRef]
- Oletic, D.; Bilas, V. Energy-efficient respiratory sounds sensing for personal mobile asthma monitoring. IEEE Sens. J. 2016, 16, 8295–8303. [Google Scholar] [CrossRef]
- Wang, Y.D.; Liu, C.H.; Jiang, R.Y.; Lin, B.S.; Lin, B.S. Novel Approach of Respiratory Sound Monitoring under Motion. In International Conference on Intelligent Information Hiding and Multimedia Signal Processing; Springer: Berlin, Germany, 2017; pp. 167–174. [Google Scholar]
- Höppe, P. Temperatures of expired air under varying climatic conditions. Int. J. Biometeorol. 1981, 25, 127–132. [Google Scholar] [CrossRef] [PubMed]
- Hsiao, C.C.; Siao, A.S.; Ciou, J.C. Improvement of pyroelectric cells for thermal energy harvesting. Sensors 2012, 12, 534–548. [Google Scholar] [CrossRef] [PubMed]
- Kim, J.M.; Kim, C.M.; Choi, S.Y.; Lee, B.Y. Enhanced strain measurement range of an FBG sensor embedded in seven-wire steel strands. Sensors 2017, 17, 1654. [Google Scholar] [CrossRef] [PubMed]
- Storck, K.; Karlsson, M.; Ask, P.; Loyd, D. Heat transfer evaluation of the nasal thermistor technique. IEEE Trans. Biomed. Eng. 1996, 43, 1187–1191. [Google Scholar] [CrossRef] [PubMed]
- Huang, Y.; Young, M.S.; Tai, C. Noninvasive respiratory monitoring system based on the piezoceramic transducer’s pyroelectric effect. Rev. Sci. Instrum. 2008, 79, 035103. [Google Scholar] [CrossRef] [PubMed]
- Carskadon, M.A.; Harvey, K.; Dement, W.C.; Guilleminault, C.; Simmons, F.B.; Anders, T.F. Respiration during sleep in children. West. J. Med. 1978, 128, 477. [Google Scholar]
- Suzuki, S.; Matsui, T.; Kawahara, H.; Ichiki, H.; Shimizu, J.; Kondo, Y.; Gotoh, S.; Yura, H.; Takase, B.; Ishihara, M. A non-contact vital sign monitoring system for ambulances using dual-frequency microwave radars. Med. Biol. Eng. Comput. 2009, 47, 101–105. [Google Scholar] [CrossRef]
- Ţarălungă, D.D.; Mocanu, B.; Ţapu, R. Automatic real time derivation of breathing rate from thermal video sequences. IFMBE Proc. 2017. [Google Scholar] [CrossRef]
- Van Herwaarden, A.W.; Sarro, P.M. Thermal sensors based on the seebeck effect. Sens. Actuators 1986. [Google Scholar] [CrossRef]
- Burns, G.; Scroger, M. The Calibration of Thermocouples and Thermocouple Materials. Natl. Inst. Stand. Technol. 1989. [Google Scholar] [CrossRef]
- Marks, M.K.; South, M.; Carter, B.G. Measurement of respiratory rate and timing using a nasal thermocouple. J. Clin. Monit. 1995. [Google Scholar] [CrossRef]
- Lim, S.; Park, S.H.; Do Ahn, S.; Suh, Y.; Shin, S.S.; Lee, S.W.; Kim, J.H.; Choi, E.K.; Yi, B.Y.; Kwon, S.I.; et al. Guiding curve based on the normal breathing as monitored by thermocouple for regular breathing. Med. Phys. 2007. [Google Scholar] [CrossRef] [PubMed]
- Kwon, K.T.; Lim, S.; Kwon, S.I.; Kim, C.M.; Park, S.H.; Shin, S.S.; Lee, S.; Ahn, S.D.; Kim, J.H.; Choi, E.K. Comparison of thermocouple, spirometer and skin motion for respiratory target motion measurement. In World Congress on Medical Physics and Biomedical Engineering 2006; Springer: Berlin/Heidelberg, Germany, 2007; pp. 1977–1979. [Google Scholar] [CrossRef]
- Itasaka, Y.; Miyazaki, S.; Tanaka, T.; Shibata, Y.; Ishikawa, K. Detection of Respiratory Events during Polysomnography: Nasal-Oral Pressure Sensor Versus Thermocouple Airflow Sensor. Pract. Oto-Rhino-Laryngol. Suppl. 2010, 129, 60–63. [Google Scholar] [CrossRef]
- Lim, S.; Park, S.; Ahn, S.; Yi, B.; Shin, S.; Lee, S.; Kim, J.; Choi, E.; Kwon, S.; Jeung, T. SU-FF-J-41: Comparison of Various Respiration Measurement Methods for 4D Radiotherapy. Med. Phys. 2006, 33, 2029. [Google Scholar] [CrossRef]
- Thomson, W., II. On the thermoelastic, thermomagnetic, and pyroelectric properties of matter. Lond. Edinb. Dublin Philos. Mag. J. Sci. 1878, 5, 4–27. [Google Scholar] [CrossRef]
- Webster, J.G. The Measurement, Instrumentation and Sensors Handbook; CRC Press: Boca Raton, FL, USA, 1998. [Google Scholar]
- Cooper, J. A fast-response pyroelectric thermal detector. J. Sci. Instrum. 1962, 39, 467. [Google Scholar] [CrossRef]
- Huang, Y.P.; Huang, K.N. Monitoring of breathing rate by a piezofilm sensor using pyroelectric effect. In Proceedings of the 2013 International Conference on Orange Technologies (ICOT), Tainan, Taiwan, 12–16 March 2013; pp. 99–102. [Google Scholar]
- Krohn, D.A.; MacDougall, T.; Mendez, A. Fiber Optic Sensors: Fundamentals and Applications; Spie Press: Bellingham, WA, USA, 2014. [Google Scholar]
- Schena, E.; Tosi, D.; Saccomandi, P.; Lewis, E.; Kim, T. Fiber optic sensors for temperature monitoring during thermal treatments: An overview. Sensors 2016, 16, 1144. [Google Scholar] [CrossRef]
- Liang, Y.; Mazzolini, A.P.; Stoddart, P.R. Fibre Bragg grating sensor for respiratory monitoring. In Proceedings of the ACOFT/AOS 2006—Australian Conference on Optical Fibre Technology/Australian Optical Society, Melbourne, Australia, 10–13 July 2006. [Google Scholar]
- Yoo, W.J.; Jang, K.W.; Seo, J.K.; Heo, J.Y.; Moon, J.S.; Park, J.Y.; Lee, B.S. Development of respiration sensors using plastic optical fiber for respiratory monitoring inside MRI system. J. Opt. Soc. Korea 2010, 14, 235–239. [Google Scholar] [CrossRef]
- Massaroni, C.; Presti, D.L.; Saccomandi, P.; Caponero, M.A.; D’Amato, R.; Schena, E. Fiber Bragg Grating Probe for Relative Humidity and Respiratory Frequency Estimation: Assessment During Mechanical Ventilation. IEEE Sens. J. 2018, 18, 2125–2130. [Google Scholar] [CrossRef]
- Branson, R.D.; Gentile, M.A. Is humidification always necessary during noninvasive ventilation in the hospital? Respir. Care 2010, 55, 209–216. [Google Scholar] [PubMed]
- Lee, S.P. Synthesis and characterization of carbon nitride films for micro humidity sensors. Sensors 2008, 8, 1508–1518. [Google Scholar] [CrossRef] [PubMed]
- Gaspar, C.; Olkkonen, J.; Passoja, S.; Smolander, M. Paper as active layer in inkjet-printed capacitive humidity sensors. Sensors 2017, 17, 1464. [Google Scholar] [CrossRef] [PubMed]
- Li, W.; Liu, J.; Ding, C.; Bai, G.; Xu, J.; Ren, Q.; Li, J. Fabrication of Ordered SnO2 Nanostructures with Enhanced Humidity Sensing Performance. Sensors 2017, 17, 2392. [Google Scholar] [CrossRef] [PubMed]
- Leone, M.; Principe, S.; Consales, M.; Parente, R.; Laudati, A.; Caliro, S.; Cutolo, A.; Cusano, A. Fiber Optic Thermo-Hygrometers for Soil Moisture Monitoring. Sensors 2017, 17, 1451. [Google Scholar] [CrossRef] [PubMed]
- Farahani, H.; Wagiran, R.; Hamidon, M.N. Humidity sensors principle, mechanism, and fabrication technologies: A comprehensive review. Sensors 2014, 14, 7881–7939. [Google Scholar] [CrossRef]
- Rittersma, Z. Recent achievements in miniaturised humidity sensors—A review of transduction techniques. Sens. Actuators A Phys. 2002, 96, 196–210. [Google Scholar] [CrossRef]
- Tatara, T.; Tsuzaki, K. An apnea monitor using a rapid-response hygrometer. J. Clin. Monit. 1997, 13, 5–9. [Google Scholar] [CrossRef] [PubMed]
- Kalkan, A.K.; Li, H.; O’Brien, C.J.; Fonash, S.J. A rapid-response, high-sensitivity nanophase humidity sensor for respiratory monitoring. IEEE Electron Device Lett. 2004. [Google Scholar] [CrossRef]
- Kupsta, M.R.; Taschuk, M.T.; Brett, M.J.; Sit, J.C. Reactive Ion Etching of Columnar Nanostructured TiO2 Thin Films for Modified Relative Humidity Sensor Response Time. IEEE Sens. J. 2009. [Google Scholar] [CrossRef]
- Tetelin, A.; Pellet, C.; Achen, A.; Toepper, M. Capacitive humidity sensors based on oxidized PhotoBCB polymer films: Enhanced sensitivity and response time. In Proceedings of the 2005 IEEE SENSORS, Irvine, CA, USA, 30 October–3 November 2005. [Google Scholar]
- Scholz, R.; Bracio, B.R.; Brutscheck, M.; Trommler, P. Non-invasive respiratory rate detection in spontaneous respiration by humidity measurement. In Proceedings of the 2017 28th Irish Signals and Systems Conference (ISSC), Killarney, Ireland, 20–21 June 2017; pp. 1–6. [Google Scholar]
- Niesters, M.; Mahajan, R.; Olofsen, E.; Boom, M.; Garcia Del Valle, S.; Aarts, L.; Dahan, A. Validation of a novel respiratory rate monitor based on exhaled humidity. Br. J. Anaesth. 2012. [Google Scholar] [CrossRef] [PubMed]
- Yan, H.; Zhang, L.; Yu, P.; Mao, L. Sensitive and Fast Humidity Sensor Based on A Redox Conducting Supramolecular Ionic Material for Respiration Monitoring. Anal. Chem. 2017. [Google Scholar] [CrossRef] [PubMed]
- Kano, S.; Dobashi, Y.; Fujii, M. Silica Nanoparticle-Based Portable Respiration Sensor for Analysis of Respiration Rate, Pattern, and Phase During Exercise. IEEE Sens. Lett. 2018, 2, 1–4. [Google Scholar] [CrossRef]
- Zhang, D.Z.; Sun, Y.E.; Li, P.; Zhang, Y. Facile Fabrication of MoS2-Modified SnO2 Hybrid Nanocomposite for Ultrasensitive Humidity Sensing. Acs Appl. Mater. Interfaces 2016. [Google Scholar] [CrossRef] [PubMed]
- Yu, H.W.; Kim, H.K.; Kim, T.; Bae, K.M.; Seo, S.M.; Kim, J.M.; Kang, T.J.; Kim, Y.H. Self-powered humidity sensor based on graphene oxide composite film intercalated by poly (sodium 4-styrenesulfonate). ACS Appl. Mater. Interfaces 2014, 6, 8320–8326. [Google Scholar] [CrossRef] [PubMed]
- Kano, S.; Kim, K.; Fujii, M. Fast-response and flexible nanocrystal-based humidity sensor for monitoring human respiration and water evaporation on skin. ACS Sens. 2017, 2, 828–833. [Google Scholar] [CrossRef] [PubMed]
- Güder, F.; Ainla, A.; Redston, J.; Mosadegh, B.; Glavan, A.; Martin, T.; Whitesides, G.M. Paper-based electrical respiration sensor. Angew. Chem. Int. Ed. 2016, 55, 5727–5732. [Google Scholar] [CrossRef]
- Yeo, T.L.; Sun, T.; Grattan, K.T. Fibre-optic sensor technologies for humidity and moisture measurement. Sens. Actuators A Phys. 2008, 144, 280–295. [Google Scholar] [CrossRef]
- Ascorbe, J.; Corres, J.; Arregui, F.; Matias, I. Recent Developments in Fiber Optics Humidity Sensors. Sensors 2017, 17, 893. [Google Scholar] [CrossRef]
- Presti, D.L.; Massaroni, C.; Schena, E. Optical Fiber Gratings for Humidity Measurements: A Review. IEEE Sens. J. 2018, 18, 9065–9074. [Google Scholar] [CrossRef]
- Presti, D.L.; Massaroni, C.; Piemonte, V.; Saccomandi, P.; D’Amato, R.; Caponero, M.; Schena, E. Agar-coated fiber Bragg grating sensor for relative humidity measurements: Influence of coating thickness and polymer concentration. IEEE Sens. J. 2019. [Google Scholar] [CrossRef]
- Shivananju, B.N.; Yamdagni, S.; Fazuldeen, R.; Kumar, A.K.S.; Nithin, S.P.; Varma, M.M.; Asokan, S. Highly sensitive carbon nanotubes coated etched fiber bragg grating sensor for humidity sensing. IEEE Sens. J. 2014. [Google Scholar] [CrossRef]
- Viegas, D.; Goicoechea, J.; Corres, J.M.; Santos, J.L.; Ferreira, L.A.; Arajo, F.M.; Matias, I.R. A fibre optic humidity sensor based on a long-period fibre grating coated with a thin film of SiO2 nanospheres. Meas. Sci. Technol. 2009. [Google Scholar] [CrossRef]
- Corres, J.M.; Matias, I.R.; Hernaez, M.; Bravo, J.; Arregui, F.J. Optical Fiber Humidity Sensors Using Nanostructured Coatings of SiO2 Nanoparticles. IEEE Sens. J. 2008. [Google Scholar] [CrossRef]
- Mathew, J.; Semenova, Y.; Farrell, G. Relative Humidity Sensor Based on an Agarose-Infiltrated Photonic Crystal Fiber Interferometer. IEEE J. Sel. Top. Quantum Electron. 2012. [Google Scholar] [CrossRef]
- Zhang, W.; Webb, D.J.; Peng, G.D. Investigation into time response of polymer fiber bragg grating based humidity sensors. J. Lightwave Technol. 2012. [Google Scholar] [CrossRef]
- Yan, G.; Liang, Y.; Lee, E.H.; He, S. Novel Knob-integrated fiber Bragg grating sensor with polyvinyl alcohol coating for simultaneous relative humidity and temperature measurement. Opt. Express 2015. [Google Scholar] [CrossRef] [PubMed]
- Mathew, J.; Semenova, Y.; Farrell, G. A miniature optical humidity sensor. In Proceedings of the Sensors, 2011 IEEE, Limerick, Ireland, 28–31 October 2011; pp. 2030–2033. [Google Scholar]
- Hernandez, F.; Correia, R.; Morgan, S.; Hayes-Gill, B.; Evans, D.; Sinha, R.; Norris, A.; Harvey, D.; Hardman, J.; Korposh, S. Simultaneous temperature and humidity measurements in a mechanical ventilator using an optical fibre sensor. Int. Soc. Opt. Photonics 2016, 9916, 99160C. [Google Scholar] [Green Version]
- Massaroni, C.; Presti, D.L.; Losquadro, C.; Resta, P.; Saccomandi, P.; Schena, E.; D’Amato, R.; Caponero, M.A. Multi-sensitive FBG-based needle for both relative humidity and breathing rate monitoring. In Proceedings of the 2018 IEEE International Symposium on Medical Measurements and Applications (MeMeA), Rome, Italy, 11–13 June 2018; pp. 1–6. [Google Scholar]
- Massaroni, C.; Caponero, M.A.; D’Amato, R.; Lo Presti, D.; Schena, E. Fiber Bragg grating measuring system for simultaneous monitoring of temperature and humidity in mechanical ventilation. Sensors 2017, 17, 749. [Google Scholar] [CrossRef]
- Iacoponi, S.; Massaroni, C.; Presti, D.L.; Saccomandi, P.; Caponero, M.; D’Amato, R.; Schena, E. Polymer-coated fiber optic probe for the monitoring of breathing pattern and respiratory rate. In Proceedings of the 2018 40th Annual International Conference of the IEEE Engineering in Medicine and Biology Society (EMBC), Honolulu, HI, USA, 18–21 July 2018; pp. 1616–1619. [Google Scholar]
- Vegfors, M.; Lindberg, L.G.; Pettersson, H.; Öberg, P.Å. Presentation and evaluation of a new optical sensor for respiratory rate monitoring. Int. J. Clin. Monit. Comput. 1994, 11, 151–156. [Google Scholar] [CrossRef]
- Nurulain, S.; Radin, M.; Suzalina, K.; Manap, H. Spectra comparison for an optical breathing gas sensor development. AIP Conf. Proc. 2017, 1835, 020035. [Google Scholar] [Green Version]
- Singh, O.P.; Howe, T.A.; Malarvili, M. Real-time human respiration carbon dioxide measurement device for cardiorespiratory assessment. J. Breath Res. 2018, 12, 026003. [Google Scholar] [CrossRef] [PubMed] [Green Version]
- Katagiri, T.; Shibayama, K.; Iida, T.; Matsuura, Y. Infrared Hollow Optical Fiber Probe for Localized Carbon Dioxide Measurement in Respiratory Tracts. Sensors 2018, 18, 995. [Google Scholar] [CrossRef] [PubMed]
- Dinh, T.V.; Choi, I.Y.; Son, Y.S.; Kim, J.C. A review on non-dispersive infrared gas sensors: Improvement of sensor detection limit and interference correction. Sens. Actuators B Chem. 2016, 231, 529–538. [Google Scholar] [CrossRef]
- Jaffe, M.B. Infrared measurement of carbon dioxide in the human breath: “Breathe-through” devices from Tyndall to the present day. Anesth. Analg. 2008, 107, 890–904. [Google Scholar] [CrossRef] [PubMed]
- Accurate Capnography Highly Dependent on a Quality Sampling Line. Available online: https://www.medtronic.com/content/dam/covidien/library/us/en/product/capnography-monitoring/capnography-quality-sampling-lines-white-paper.pdf (accessed on 9 December 2018).
- Yang, J.; Chen, B.; Zhou, J.; Lv, Z. A low-power and portable biomedical device for respiratory monitoring with a stable power source. Sensors 2015, 15, 19618–19632. [Google Scholar] [CrossRef] [PubMed]
- Wu, J.W.; Chiang, C.C. Notched long-period fiber grating with an amine-modified surface nanostructure for carbon dioxide gas sensing. Materials 2015, 8, 4535–4543. [Google Scholar] [CrossRef] [PubMed]
- Wu, C.W.; Chiang, C.C. Sandwiched long-period fiber grating fabricated by MEMS process for CO2 gas detection. Micromachines 2016, 7, 35. [Google Scholar] [CrossRef]
- Ma, W.; Xing, J.; Wang, R.; Rong, Q.; Zhang, W.; Li, Y.; Zhang, J.; Qiao, X. Optical fiber Fabry–Perot interferometric CO2 gas sensor using guanidine derivative polymer functionalized layer. IEEE Sens. J. 2018, 18, 1924–1929. [Google Scholar] [CrossRef]
- Moll, J.M.; Wright, V. An objective clinical study of chest expansion. Ann. Rheum. Dis. 1972. [Google Scholar] [CrossRef]
- Fiorillo, A.; Critello, C.; Pullano, A. Theory, technology and applications of piezoresistive sensors: A review. Sens. Actuators A Phys. 2018. [Google Scholar] [CrossRef]
- Kim, K.; Song, G.; Park, C.; Yun, K.S. Multifunctional Woven Structure Operating as Triboelectric Energy Harvester, Capacitive Tactile Sensor Array, and Piezoresistive Strain Sensor Array. Sensors 2017, 17, 2582. [Google Scholar] [CrossRef] [PubMed]
- Terazawa, M.; Karita, M.; Kumagai, S.; Sasaki, M. Respiratory Motion Sensor Measuring Capacitance Constructed across Skin in Daily Activities. Micromachines 2018, 9, 543. [Google Scholar] [CrossRef] [PubMed]
- Fajkus, M.; Nedoma, J.; Martinek, R.; Vasinek, V.; Nazeran, H.; Siska, P. A non-invasive multichannel hybrid fiber-optic sensor system for vital sign monitoring. Sensors 2017, 17, 111. [Google Scholar] [CrossRef] [PubMed]
- De Rossi, D.; Carpi, F.; Lorussi, F.; Mazzoldi, A.; Paradiso, R.; Scilingo, E.P.; Tognetti, A. Electroactive fabrics and wearable biomonitoring devices. AUTEX Res. J. 2003, 3, 180–185. [Google Scholar]
- Wang, J.; Xue, P.; Tao, X. Strain sensing behavior of electrically conductive fibers under large deformation. Mater. Sci. Eng. A 2011, 528, 2863–2869. [Google Scholar] [CrossRef]
- Egami, Y.; Suzuki, K.; Tanaka, T.; Yasuhara, T.; Higuchi, E.; Inoue, H. Preparation and characterization of conductive fabrics coated uniformly with polypyrrole nanoparticles. Synth. Met. 2011, 161, 219–224. [Google Scholar] [CrossRef]
- Huang, C.T.; Shen, C.L.; Tang, C.F.; Chang, S.H. A wearable yarn-based piezo-resistive sensor. Sens. Actuators A Phys. 2008, 141, 396–403. [Google Scholar] [CrossRef]
- Atalay, O.; Kennon, W.R.; Demirok, E. Weft-knitted strain sensor for monitoring respiratory rate and its electro-mechanical modeling. IEEE Sens. J. 2015, 15, 110–122. [Google Scholar] [CrossRef]
- Lanatà, A.; Scilingo, E.P.; Nardini, E.; Loriga, G.; Paradiso, R.; De-Rossi, D. Comparative evaluation of susceptibility to motion artifact in different wearable systems for monitoring respiratory rate. IEEE Trans. Inf. Technol. Biomed. 2010, 14, 378–386. [Google Scholar] [CrossRef]
- Paradiso, R.; Loriga, G.; Taccini, N. A wearable health care system based on knitted integrated sensors. IEEE Trans. Inf. Technol. Biomed. 2005, 9, 337–344. [Google Scholar] [CrossRef]
- Hamdani, S.T.A.; Fernando, A. The application of a piezo-resistive cardiorespiratory sensor system in an automobile safety belt. Sensors 2015, 15, 7742–7753. [Google Scholar] [CrossRef]
- Jeong, J.; Jang, Y.; Lee, I.; Shin, S.; Kim, S. Wearable respiratory rate monitoring using piezo-resistive fabric sensor. In Proceedings of the World Congress on Medical Physics and Biomedical Engineering, Munich, Germany, 7–12 September 2009; Springer: Berlin, Germany, 2009; pp. 282–284. [Google Scholar]
- Molinaro, N.; Massaroni, C.; Presti, D.L.; Saccomandi, P.; Di Tomaso, G.; Zollo, L.; Perego, P.; Andreoni, G.; Schena, E. Wearable textile based on silver plated knitted sensor for respiratory rate monitoring. In Proceedings of the 2018 40th Annual International Conference of the IEEE Engineering in Medicine and Biology Society (EMBC), Honolulu, HI, USA, 18–21 July 2018; pp. 2865–2868. [Google Scholar]
- Kundu, S.K.; Kumagai, S.; Sasaki, M. A wearable capacitive sensor for monitoring human respiratory rate. Jpn. J. Appl. Phys. 2013, 52, 04CL05. [Google Scholar] [CrossRef]
- Grlica, J.; Martinović, T.; Džapo, H. Capacitive sensor for respiration monitoring. In Proceedings of the 2015 IEEE Sensors Applications Symposium (SAS), Zadar, Croatia, 13–15 April 2015; pp. 1–6. [Google Scholar]
- Ghasemzadeh, H.; Ostadabbas, S.; Guenterberg, E.; Pantelopoulos, A. Wireless medical-embedded systems: A review of signal-processing techniques for classification. IEEE Sens. J. 2013, 13, 423–437. [Google Scholar] [CrossRef]
- Takano, M.; Yamagishi, S.; Ohmuta, T.; Fukuoka, Y.; Ueno, A. Non-contact simultaneous measurements of electrocardiogram and respiratory movements using capacitive sheet electrodes. Adv. Biomed. Eng. 2017, 6, 28–36. [Google Scholar] [CrossRef]
- Luis, J.A.; Roa Romero, L.M.; Gómez-Galán, J.A.; Hernández, D.N.; Estudillo-Valderrama, M.Á.; Barbarov-Rostán, G.; Rubia-Marcos, C. Design and implementation of a smart sensor for respiratory rate monitoring. Sensors 2014, 14, 3019–3032. [Google Scholar] [CrossRef] [PubMed]
- Teichmann, D.; Foussier, J.; Jia, J.; Leonhardt, S. Non-contacting monitoring of respiration and pulse based on capacitive coupling with thoracic tissue. Proc. World Congr. Eng. 2011, 3, 2695–2698. [Google Scholar]
- Naranjo-Hernández, D.; Talaminos-Barroso, A.; Reina-Tosina, J.; Roa, L.; Barbarov-Rostan, G.; Cejudo-Ramos, P.; Márquez-Martín, E.; Ortega-Ruiz, F. Smart Vest for Respiratory Rate Monitoring of COPD Patients Based on Non-Contact Capacitive Sensing. Sensors 2018, 18, 2144. [Google Scholar] [CrossRef] [PubMed]
- Chadha, T.; Watson, H.; Birch, S.; Jenouri, G.; Schneider, A.; Cohn, M.; Sackner, M. Validation of respiratory inductive plethysmography using different calibration procedures. Am. Rev. Respir. Dis. 1982, 125, 644–649. [Google Scholar]
- Dall’Ava-Santucci, J.; Armanganidis, A. Respiratory inductive plethysmography. In Pulmonary Function in Mechanically Ventilated Patients; Springer: Berlin, Germany, 1991; pp. 121–142. [Google Scholar]
- Krieger, B.; Feinerman, D.; Zaron, A.; Bizousky, F. Continuous noninvasive monitoring of respiratory rate in critically III patients. Chest 1986, 90, 632–634. [Google Scholar] [CrossRef]
- Mayer, O.H.; Clayton, R.G., Sr.; Jawad, A.F.; McDonough, J.M.; Allen, J.L. Respiratory inductance plethysmography in healthy 3- to 5-year-old children. Chest 2003, 124, 1812–1819. [Google Scholar] [CrossRef]
- Cantineau, J.P.; Escourrou, P.; Sartene, R.; Gaultier, C.; Goldman, M. Accuracy of respiratory inductive plethysmography during wakefulness and sleep in patients with obstructive sleep apnea. Chest 1992, 102, 1145–1151. [Google Scholar] [CrossRef]
- Fiamma, M.N.; Samara, Z.; Baconnier, P.; Similowski, T.; Straus, C. Respiratory inductive plethysmography to assess respiratory variability and complexity in humans. Respir. Physiol. Neurobiol. 2007, 156, 234–239. [Google Scholar] [CrossRef]
- Caretti, D.M.; Pullen, P.V.; Premo, L.A.; Kuhlmann, W.D. Reliability of respiratory inductive plethysmography for measuring tidal volume during exercise. Am. Ind. Hyg. Assoc. J. 1994, 55, 918–923. [Google Scholar] [CrossRef]
- Massaroni, C.; Carraro, E.; Vianello, A.; Miccinilli, S.; Morrone, M.; Levai, I.K.; Schena, E.; Saccomandi, P.; Sterzi, S.; Dickinson, J.W.; et al. Optoelectronic plethysmography in clinical practice and research: A review. Respiration 2017, 93, 339–354. [Google Scholar] [CrossRef]
- Pereira, M.C.; Porras, D.C.; Lunardi, A.C.; da Silva, C.C.B.M.; Barbosa, R.C.C.; Cardenas, L.Z.; Pletsch, R.; Ferreira, J.G.; de Castro, I.; de Carvalho, C.R.F.; et al. Thoracoabdominal asynchrony: Two methods in healthy, COPD, and interstitial lung disease patients. PLoS ONE 2017, 12, e0182417. [Google Scholar] [CrossRef]
- Clarenbach, C.F.; Senn, O.; Brack, T.; Kohler, M.; Bloch, K.E. Monitoring of ventilation during exercise by a portable respiratory inductive plethysmograph. Chest 2005, 128, 1282–1290. [Google Scholar] [CrossRef]
- Massaroni, C.; Saccomandi, P.; Schena, E. Medical smart textiles based on fiber optic technology: An overview. J. Funct. Biomater. 2015, 6, 204–221. [Google Scholar] [CrossRef]
- Scherer, L.J.; Boesel, L.F.; Wolf, M.; Bona, G.L.; Rossi, R.M. Body-Monitoring and Health Supervision by Means of Optical Fiber-Based Sensing Systems in Medical Textiles. Adv. Healthc. Mater. 2015, 4, 330–355. [Google Scholar]
- Dziuda, L.; Skibniewski, F.W.; Krej, M.; Lewandowski, J. Monitoring respiration and cardiac activity using fiber Bragg grating-based sensor. IEEE Trans. Biomed. Eng. 2012, 59, 1934–1942. [Google Scholar] [CrossRef]
- Dziuda, L.; Krej, M.; Skibniewski, F.W. Fiber Bragg grating strain sensor incorporated to monitor patient vital signs during MRI. IEEE Sens. J. 2013, 13, 4986–4991. [Google Scholar] [CrossRef]
- Chethana, K.; Guru Prasad, A.; Omkar, S.; Asokan, S. Fiber bragg grating sensor based device for simultaneous measurement of respiratory and cardiac activities. J. Biophotonics 2017, 10, 278–285. [Google Scholar] [CrossRef]
- Ciocchetti, M.; Massaroni, C.; Saccomandi, P.; Caponero, M.A.; Polimadei, A.; Formica, D.; Schena, E. Smart textile based on fiber bragg grating sensors for respiratory monitoring: Design and preliminary trials. Biosensors 2015, 5, 602–615. [Google Scholar] [CrossRef]
- Massaroni, C.; Saccomandi, P.; Formica, D.; Presti, D.L.; Caponero, M.A.; Di Tomaso, G.; Giurazza, F.; Muto, M.; Schena, E. Design and feasibility assessment of a magnetic resonance-compatible smart textile based on fiber Bragg grating sensors for respiratory monitoring. IEEE Sens. J. 2016, 16, 8103–8110. [Google Scholar] [CrossRef]
- Massaroni, C.; Venanzi, C.; Silvatti, A.P.; Lo Presti, D.; Saccomandi, P.; Formica, D.; Giurazza, F.; Caponero, M.A.; Schena, E. Smart textile for respiratory monitoring and thoraco-abdominal motion pattern evaluation. J. Biophotonics 2018, 11, e201700263. [Google Scholar] [CrossRef]
- Lo Presti, D.; Massaroni, C.; Saccomandi, P.; Caponero, M.A.; Formica, D.; Schena, E. A wearable textile for respiratory monitoring: Feasibility assessment and analysis of sensors position on system response. In Proceedings of the 2017 39th Annual International Conference of the IEEE Engineering in Medicine and Biology Society (EMBC), Seogwipo, South Korea, 11–15 July 2017; Volume 2017, pp. 4423–4426. [Google Scholar]
- Krehel, M.; Schmid, M.; Rossi, R.M.; Boesel, L.F.; Bona, G.L.; Scherer, L.J. An optical fibre-based sensor for respiratory monitoring. Sensors 2014, 14, 13088–13101. [Google Scholar] [CrossRef]
- Augousti, A.; Maletras, F.; Mason, J. Improved fibre optic respiratory monitoring using a figure-of-eight coil. Physiol. Meas. 2005, 26, 585–590. [Google Scholar] [CrossRef]
- Koyama, Y.; Nishiyama, M.; Watanabe, K. Smart textile using hetero-core optical fiber for heartbeat and respiration monitoring. IEEE Sens. J. 2018, 18, 6175–6180. [Google Scholar] [CrossRef]
- Lau, D.; Chen, Z.; Teo, J.T.; Ng, S.H.; Rumpel, H.; Lian, Y.; Yang, H.; Kei, P.L. Intensity-modulated microbend fiber optic sensor for respiratory monitoring and gating during MRI. IEEE Trans. Biomed. Eng. 2013, 60, 2655–2662. [Google Scholar] [CrossRef]
- Gupta, A.K. Respiration Rate Measurement Based on Impedance Pneumography; Application Report SBAA181; Texas Instruments: Dallas, TX, USA, 2011. [Google Scholar]
- Trobec, R.; Rashkovska, A.; Avbelj, V. Two proximal skin electrodes—A respiration rate body sensor. Sensors 2012, 12, 13813–13828. [Google Scholar] [CrossRef]
- Malmivuo, P.; Malmivuo, J.; Plonsey, R. Bioelectromagnetism: Principles and Applications of Bioelectric and Biomagnetic Fields; Oxford University Press: New York, NY, USA, 1995. [Google Scholar]
- Larsen, V.H.; Christensen, P.H.; Oxhøj, H.; Brask, T. Impedance pneumography for long-term monitoring of respiration during sleep in adult males. Clin. Physiol. 1984, 4, 333–342. [Google Scholar] [CrossRef] [PubMed]
- Lee-Chiong, T.L. Monitoring respiration during sleep. Clin. Chest Med. 2003, 24, 297–306. [Google Scholar] [CrossRef]
- Wang, F.T.; Chan, H.L.; Wang, C.L.; Jian, H.M.; Lin, S.H. Instantaneous respiratory estimation from thoracic impedance by empirical mode decomposition. Sensors 2015, 15, 16372–16387. [Google Scholar] [CrossRef] [PubMed]
- Houtveen, J.H.; Groot, P.F.; de Geus, E.J. Validation of the thoracic impedance derived respiratory signal using multilevel analysis. Int. J. Psychophysiol. 2006, 59, 97–106. [Google Scholar] [CrossRef] [PubMed] [Green Version]
- Van Ravenswaaij-Arts, C.; Hopman, J.; Kollee, L.; Stoelinga, G.; Van Geijn, H. Spectral analysis of heart rate variability in spontaneously breathing very preterm infants. Acta Paediatr. 1994, 83, 473–480. [Google Scholar] [CrossRef] [PubMed]
- Ginsburg, A.S.; Lenahan, J.L.; Izadnegahdar, R.; Ansermino, J.M. A Systematic Review of Tools to Measure Respiratory Rate in Order to Identify Childhood Pneumonia. Am. J. Respir. Crit. Care Med. 2018, 197, 1116–1127. [Google Scholar] [CrossRef] [PubMed]
- Chen, R.; Chen, K.; Dai, Y.; Zhang, S. Utility of transthoracic impedance and novel algorithm for sleep apnea screening in pacemaker patient. In Sleep and Breathing; Springer: Berlin, Germany, 2018; pp. 1–6. [Google Scholar]
- Laine, J.; Mougenot, D. A high-sensitivity MEMS-based accelerometer. Lead. Edge 2014, 33, 1234–1242. [Google Scholar] [CrossRef]
- Bates, A.; Ling, M.J.; Mann, J.; Arvind, D. Respiratory rate and flow waveform estimation from tri-axial accelerometer data. In Proceedings of the 2010 International Conference on Body Sensor Networks, Singapore, 7–9 June 2010; pp. 144–150. [Google Scholar]
- Reinvuo, T.; Hannula, M.; Sorvoja, H.; Alasaarela, E.; Myllyla, R. Measurement of respiratory rate with high-resolution accelerometer and EMFit pressure sensor. In Proceedings of the 2006 IEEE Sensors Applications Symposium, Houston, TX, USA, 7–9 February 2006; pp. 192–195. [Google Scholar]
- Hung, P.; Bonnet, S.; Guillemaud, R.; Castelli, E.; Yen, P.T.N. Estimation of respiratory waveform using an accelerometer. In Proceedings of the 5th IEEE International Symposium on Biomedical Imaging: From Nano to Macro (ISBI 2008), Paris, France, 14–17 May 2008; pp. 1493–1496. [Google Scholar]
- Jin, A.; Yin, B.; Morren, G.; Duric, H.; Aarts, R.M. Performance evaluation of a tri-axial accelerometry-based respiration monitoring for ambient assisted living. In Proceedings of the Annual International Conference of the IEEE Engineering in Medicine and Biology Society (EMBC 2009), Minneapolis, MN, USA, 3–6 September 2009; pp. 5677–5680. [Google Scholar]
- Fekr, A.R.; Janidarmian, M.; Radecka, K.; Zilic, Z. A medical cloud-based platform for respiration rate measurement and hierarchical classification of breath disorders. Sensors 2014, 14, 11204–11224. [Google Scholar] [CrossRef]
- Liu, G.Z.; Guo, Y.W.; Zhu, Q.S.; Huang, B.Y.; Wang, L. Estimation of respiration rate from three-dimensional acceleration data based on body sensor network. Telemed. e-Health 2011, 17, 705–711. [Google Scholar] [CrossRef]
- Vertens, J.; Fischer, F.; Heyde, C.; Hoeflinger, F.; Zhang, R.; Reindl, L.; Gollhofer, A. Measuring Respiration and Heart Rate using Two Acceleration Sensors on a Fully Embedded Platform. In Proceedings of the 3rd International Congress on Sport Sciences Research and Technology Support, Lisbon, Portugal, 15–17 November 2015; pp. 15–23. [Google Scholar]
- Passaro, V.; Cuccovillo, A.; Vaiani, L.; De Carlo, M.; Campanella, C.E. Gyroscope technology and applications: A review in the industrial perspective. Sensors 2017, 17, 2284. [Google Scholar] [CrossRef]
- Yoon, J.W.; Noh, Y.S.; Kwon, Y.S.; Kim, W.K.; Yoon, H.R. Improvement of dynamic respiration monitoring through sensor fusion of accelerometer and gyro-sensor. J. Electr. Eng. Technol. 2014, 9, 334–343. [Google Scholar] [CrossRef]
- Lee, H.J.; Jung, S. Gyro sensor drift compensation by Kalman filter to control a mobile inverted pendulum robot system. In Proceedings of the IEEE International Conference on Industrial Technology (ICIT 2009), Gippsland, VIC, Australia, 10–13 February 2009; pp. 1–6. [Google Scholar]
- Wang, S.; Liu, M.; Pang, B.; Li, P.; Yao, Z.; Zhang, X.; Chen, H. A new physiological signal acquisition patch designed with advanced respiration monitoring algorithm based on 3-axis accelerator and gyroscope. In Proceedings of the 2018 40th Annual International Conference of the IEEE Engineering in Medicine and Biology Society (EMBC), Honolulu, HI, USA, 18–21 July 2018; pp. 441–444. [Google Scholar]
- Pavlov, I. Selection of normalized metrological characteristics of rate gyros. Meas. Tech. 1993, 36, 680–681. [Google Scholar] [CrossRef]
- Yazdi, N.; Ayazi, F.; Najafi, K. Micromachined inertial sensors. Proc. IEEE 1998, 86, 1640–1659. [Google Scholar] [CrossRef]
- Shen, C.L.; Huang, T.H.; Hsu, P.C.; Ko, Y.C.; Chen, F.L.; Wang, W.C.; Kao, T.; Chan, C.T. Respiratory Rate Estimation by Using ECG, Impedance, and Motion Sensing in Smart Clothing. J. Med. Biol. Eng. 2017, 37, 826–842. [Google Scholar] [CrossRef] [PubMed]
- Milici, S.; Lázaro, A.; Villarino, R.; Girbau, D.; Magnarosa, M. Wireless Wearable Magnetometer-Based Sensor for Sleep Quality Monitoring. IEEE Sens. J. 2018, 18, 2145–2152. [Google Scholar] [CrossRef]
- Oh, Y.; Jung, Y.J.; Choi, S.; Kim, D. Design and Evaluation of a MEMS Magnetic Field Sensor-Based Respiratory Monitoring and Training System for Radiotherapy. Sensors 2018, 18, 2742. [Google Scholar] [CrossRef]
- McCool, F.D.; Wang, J.; Ebi, K.L. Tidal volume and respiratory timing derived from a portable ventilation monitor. Chest 2002, 122, 684–691. [Google Scholar] [CrossRef]
- Derchak, P.A.; Czapla, L.; Rogan, C.A. Magnetometer Based Physiological Monitoring Garment. U.S. Patent 9,801,583, 31 October 2017. [Google Scholar]
- Cesareo, A.; Previtali, Y.; Biffi, E.; Aliverti, A. Assessment of Breathing Parameters Using an Inertial Measurement Unit (IMU)-Based System. Sensors 2018, 19, 88. [Google Scholar] [CrossRef]
- Cesareo, A.; Gandolfi, S.; Pini, I.; Biffi, E.; Reni, G.; Aliverti, A. A novel, low cost, wearable contact-based device for breathing frequency monitoring. In Proceedings of the 2017 39th Annual International Conference of the IEEE Engineering in Medicine and Biology Society (EMBC), Seogwipo, Korea, 11–15 July 2017; pp. 2402–2405. [Google Scholar]
- Charlton, P.H.; Birrenkott, D.A.; Bonnici, T.; Pimentel, M.A.; Johnson, A.E.; Alastruey, J.; Tarassenko, L.; Watkinson, P.J.; Beale, R.; Clifton, D.A. Breathing rate estimation from the electrocardiogram and photoplethysmogram: A review. IEEE Rev. Biomed. Eng. 2018, 11, 2–20. [Google Scholar] [CrossRef]
- Tamura, T.; Maeda, Y.; Sekine, M.; Yoshida, M. Wearable photoplethysmographic sensors—Past and present. Electronics 2014, 3, 282–302. [Google Scholar] [CrossRef]
- Goldman, M.J. Principles of Clinical Electrocardiography; Lange Medical Publications: New York, NY, USA, 1986. [Google Scholar]
- Khunti, K. Accurate interpretation of the 12-lead ECG electrode placement: A systematic review. Health Educ. J. 2014, 73, 610–623. [Google Scholar] [CrossRef]
- Jevon, P. Procedure for recording a standard 12-lead electrocardiogram. Br. J. Nurs. 2010, 19, 649–651. [Google Scholar] [CrossRef] [PubMed]
- Bailón, R.; Sörnmo, L.; Laguna, P. ECG derived respiratory frequency estimation - Chapter 8. In Advanced Methods and Tools for ECG Data Analysis; Artech House: London, UK, 2006; Volume 1. [Google Scholar]
- Berntson, G.G.; Cacioppo, J.T.; Quigley, K.S. Respiratory sinus arrhythmia: Autonomic origins, physiological mechanisms, and psychophysiological implications. Psychophysiology 1993, 30, 183–196. [Google Scholar] [CrossRef] [PubMed]
- Tiinanen, S.; Noponen, K.; Tulppo, M.; Kiviniemi, A.; Seppänen, T. ECG-derived respiration methods: Adapted ICA and PCA. Med. Eng. Phys. 2015, 37, 512–517. [Google Scholar] [CrossRef] [PubMed]
- Yu, X.; Boehm, A.; Neu, W.; Venema, B.; Marx, N.; Leonhardt, S.; Teichmann, D. A wearable 12-lead ECG T-shirt with textile electrodes for unobtrusive long-term monitoring—Evaluation of an ongoing clinical trial. In EMBEC & NBC 2017; Springer: Berlin, Germany, 2017; pp. 703–706. [Google Scholar]
- Chi, Y.M.; Jung, T.P.; Cauwenberghs, G. Dry-contact and noncontact biopotential electrodes: Methodological review. IEEE Rev. Biomed. Eng. 2010, 3, 106–119. [Google Scholar] [CrossRef] [PubMed]
- Dutta, D.N.; Das, R.; Pal, S. Automated Real-Time Processing of Single Lead Electrocardiogram for Simultaneous Heart Rate and Respiratory Rate Monitoring. J. Med. Devices 2017, 11, 024502. [Google Scholar] [CrossRef] [Green Version]
- Schmidt, M.; Schumann, A.; Müller, J.; Bär, K.J.; Rose, G. ECG derived respiration: Comparison of time-domain approaches and application to altered breathing patterns of patients with schizophrenia. Physiol. Meas. 2017, 38, 601. [Google Scholar] [CrossRef] [PubMed]
- Alikhani, I.; Noponen, K.; Hautala, A.; Ammann, R.; Seppänen, T. Spectral fusion-based breathing frequency estimation; experiment on activities of daily living. Biomed. Eng. Online 2018, 17, 99. [Google Scholar] [CrossRef]
- Gao, Y.; Yan, H.; Xu, Z.; Xiao, M.; Song, J. A principal component analysis based data fusion method for ECG-derived respiration from single-lead ECG. Australas. Phys. Eng. Sci. Med. 2018, 41, 59–67. [Google Scholar] [CrossRef]
- Allen, J. Photoplethysmography and its application in clinical physiological measurement. Physiol. Meas. 2007, 28. [Google Scholar] [CrossRef]
- Meredith, D.; Clifton, D.; Charlton, P.; Brooks, J.; Pugh, C.; Tarassenko, L. Photoplethysmographic derivation of respiratory rate: A review of relevant physiology. J. Med. Eng. Technol. 2012, 36, 1–7. [Google Scholar] [CrossRef] [PubMed]
- Nitzan, M.; Faib, I.; Friedman, H. Respiration-induced changes in tissue blood volume distal to occluded artery, measured by photoplethysmography. J. Biomed. Opt. 2006, 11, 040506. [Google Scholar] [CrossRef] [PubMed] [Green Version]
- Lázaro, J.; Gil, E.; Bailón, R.; Mincholé, A.; Laguna, P. Deriving respiration from photoplethysmographic pulse width. Med. Biol. Eng. Comput. 2013, 51, 233–242. [Google Scholar] [CrossRef] [PubMed]
- Moraes, J.; Rocha, M.; Vasconcelos, G.; Vasconcelos Filho, J.; de Albuquerque, V. Advances in photopletysmography signal analysis for biomedical applications. Sensors 2018, 18, 1894. [Google Scholar] [CrossRef] [PubMed]
- Lee, H.; Chung, H.; Lee, J. Motion Artifact Cancellation in Wearable Photoplethysmography Using Gyroscope. IEEE Sens. J. 2019, 19, 1166–1175. [Google Scholar] [CrossRef]
- Touw, H.R.; Verheul, M.H.; Tuinman, P.R.; Smit, J.; Thöne, D.; Schober, P.; Boer, C. Photoplethysmography respiratory rate monitoring in patients receiving procedural sedation and analgesia for upper gastrointestinal endoscopy. J. Clin. Monit. Comput. 2017, 31, 747–754. [Google Scholar] [CrossRef] [PubMed]
- Bergese, S.D.; Mestek, M.L.; Kelley, S.D.; McIntyre, R., Jr.; Uribe, A.A.; Sethi, R.; Watson, J.N.; Addison, P.S. Multicenter study validating accuracy of a continuous respiratory rate measurement derived from pulse oximetry: A comparison with capnography. Anesth. Analg. 2017, 124, 1153. [Google Scholar] [CrossRef]
- Shah, S.A.; Fleming, S.; Thompson, M.; Tarassenko, L. Respiratory rate estimation during triage of children in hospitals. J. Med. Eng. Technol. 2015, 39, 514–524. [Google Scholar] [CrossRef]
- Sharma, H.; Sharma, K. ECG-derived respiration using Hermite expansion. Biomed. Signal Process. Control 2018, 39, 312–326. [Google Scholar] [CrossRef]
Figure 1.
Most popular contact-based techniques for measuring and related areas of the body on which the sensors must be positioned. PPG = photoplethysmography; ECG = Electrocardiography.
Figure 1.
Most popular contact-based techniques for measuring and related areas of the body on which the sensors must be positioned. PPG = photoplethysmography; ECG = Electrocardiography.

Figure 2.
Airflow sensors: the main elements composing the measuring chain (sensor, analog electronics, data acquisition, post-processing or signal analysis stage) to estimate . Analog electronic stages vary between different flowmeters because the output quantities are different. , , , , , are pressure drop, turbine revolutions per minute, current, resistance, wavelength, and light intensity changes caused by the airflow (Q), respectively. is the voltage output. The DF figure is from Sensirion [33]; the turbine flowmeter figure is from MIR [34]; the HWA figure is from [35].

Figure 3.
Acoustic sensors: the main elements composing the measuring chain (sensor, analog electronics, data acquisition, post-processing or signal analysis stage) to estimate . P is the acoustical pressure; is the voltage output. The acoustic sensor scheme is adapted from [74].
Figure 3.
Acoustic sensors: the main elements composing the measuring chain (sensor, analog electronics, data acquisition, post-processing or signal analysis stage) to estimate . P is the acoustical pressure; is the voltage output. The acoustic sensor scheme is adapted from [74].

Figure 4.
Temperature sensors: the main elements composing the measuring chain (sensor, analog electronics, data acquisition, post-processing or signal analysis stage) to estimate . Analog electronic stages vary between different sensors since the output quantities are different. , , , ) are resistance, voltage, current and light intensity changes caused by the temperature (T), respectively. is the voltage output. The pyroelectric sensor figure is adapted from [88]; the fiber-optic sensor figure is adapted from [89].

Figure 5.
Relative humidity sensors: main elements composing the measuring chain (sensor, analog electronics, data acquisition, post-processing or signal analysis stage) to estimate . Analog electronic stages vary between different sensors since the output quantities are different. , , , are capacitance, resistance, wavelength, and light intensity changes caused by the RH, respectively. is the voltage output, is the current output. The capacitive sensors picture is adapted from [112]; the resistive sensors picture is from [113]; the nanocrystals and nanoparticles sensors image is from [114]; the fiber-optic humidity sensors picture is adapted from [115].

Figure 6.
CO2 sensors: the main elements composing the measuring chain (sensor, analog electronics, data acquisition, post-processing or signal analysis stage) to estimate . Analog electronic stages vary between different sensors since the output quantities are different. , are current and light intensity changes caused by the CO2, respectively. is the voltage output. The scheme of fiber-optic sensors is adapted from [148].

Figure 7.
Strain sensors: the main elements composing the measuring chain (sensor, analog electronics, data acquisition, post-processing or signal analysis stage) to estimate . Analog electronic stages vary between different sensors since the output quantities are different. , , , , are resistance, capacitance, frequency peak, wavelength and light intensity changes caused by the strain (), respectively. is the voltage output. The resistive sensors picture is from [158]; the capacitive sensor picture is adapted from [159]; the fiber-optic sensors picture is adapted from [160].

Figure 8.
Impedance sensors: the main elements composing the measuring chain (sensor, analog electronics, data acquisition, post-processing or signal analysis stage) to estimate . is the voltage output caused by impedance (Z) changes.
Figure 8.
Impedance sensors: the main elements composing the measuring chain (sensor, analog electronics, data acquisition, post-processing or signal analysis stage) to estimate . is the voltage output caused by impedance (Z) changes.

Figure 9.
Movement sensors: the main elements composing the measuring chain (sensor, analog electronics, data acquisition, post-processing or signal analysis stage) to estimate . The output quantities are different among sensors. , , and are three-axis accelerations, three-axis angular velocities, and three-axis magnetic field outputs changes caused by the acceleration (a), angular velocity (v) and magnetic field () changes, respectively. is the voltage output.

Figure 10.
Sensors for recording breathing modulatory effect on cardiac activity: the main elements composing the measuring chain (sensor, analog electronics, data acquisition, post-processing or signal analysis stage) to estimate . Analog electronic stages vary between different sensors since the output quantities are different. , are light intensity and biopotential signals (number depends on the number of ECG channels), respectively. is the voltage output. The PPG sensor picture is from [233].


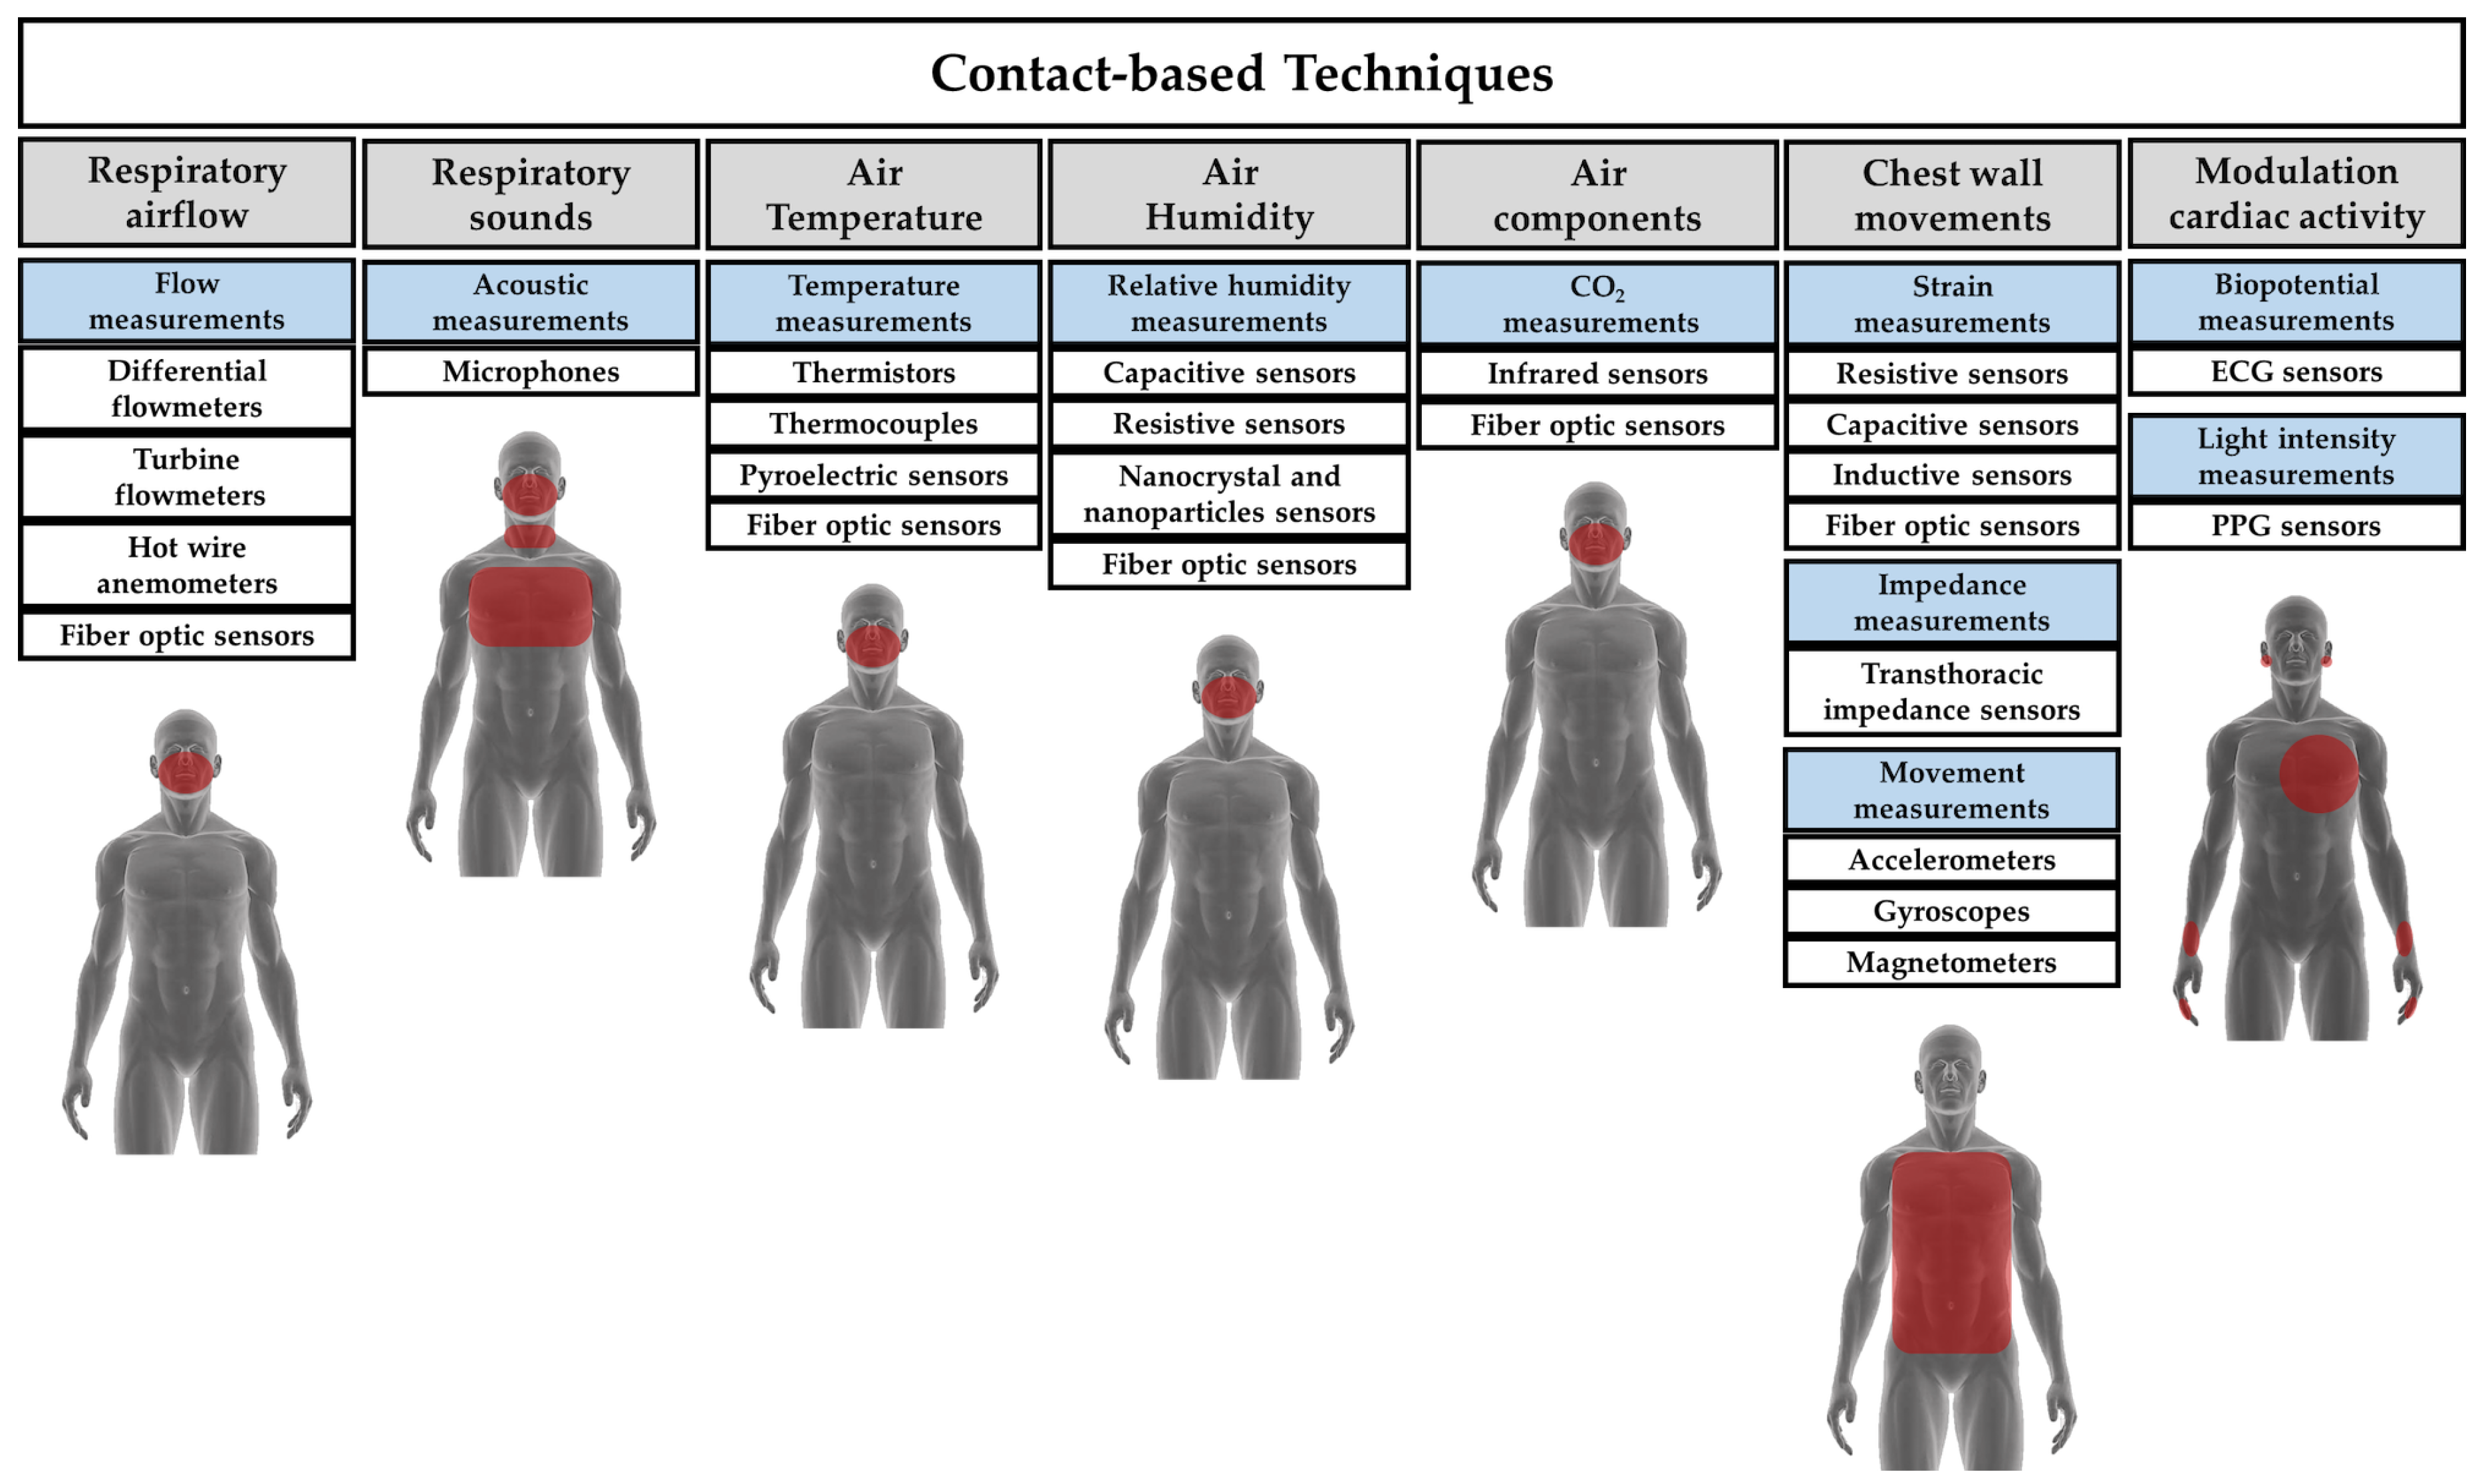
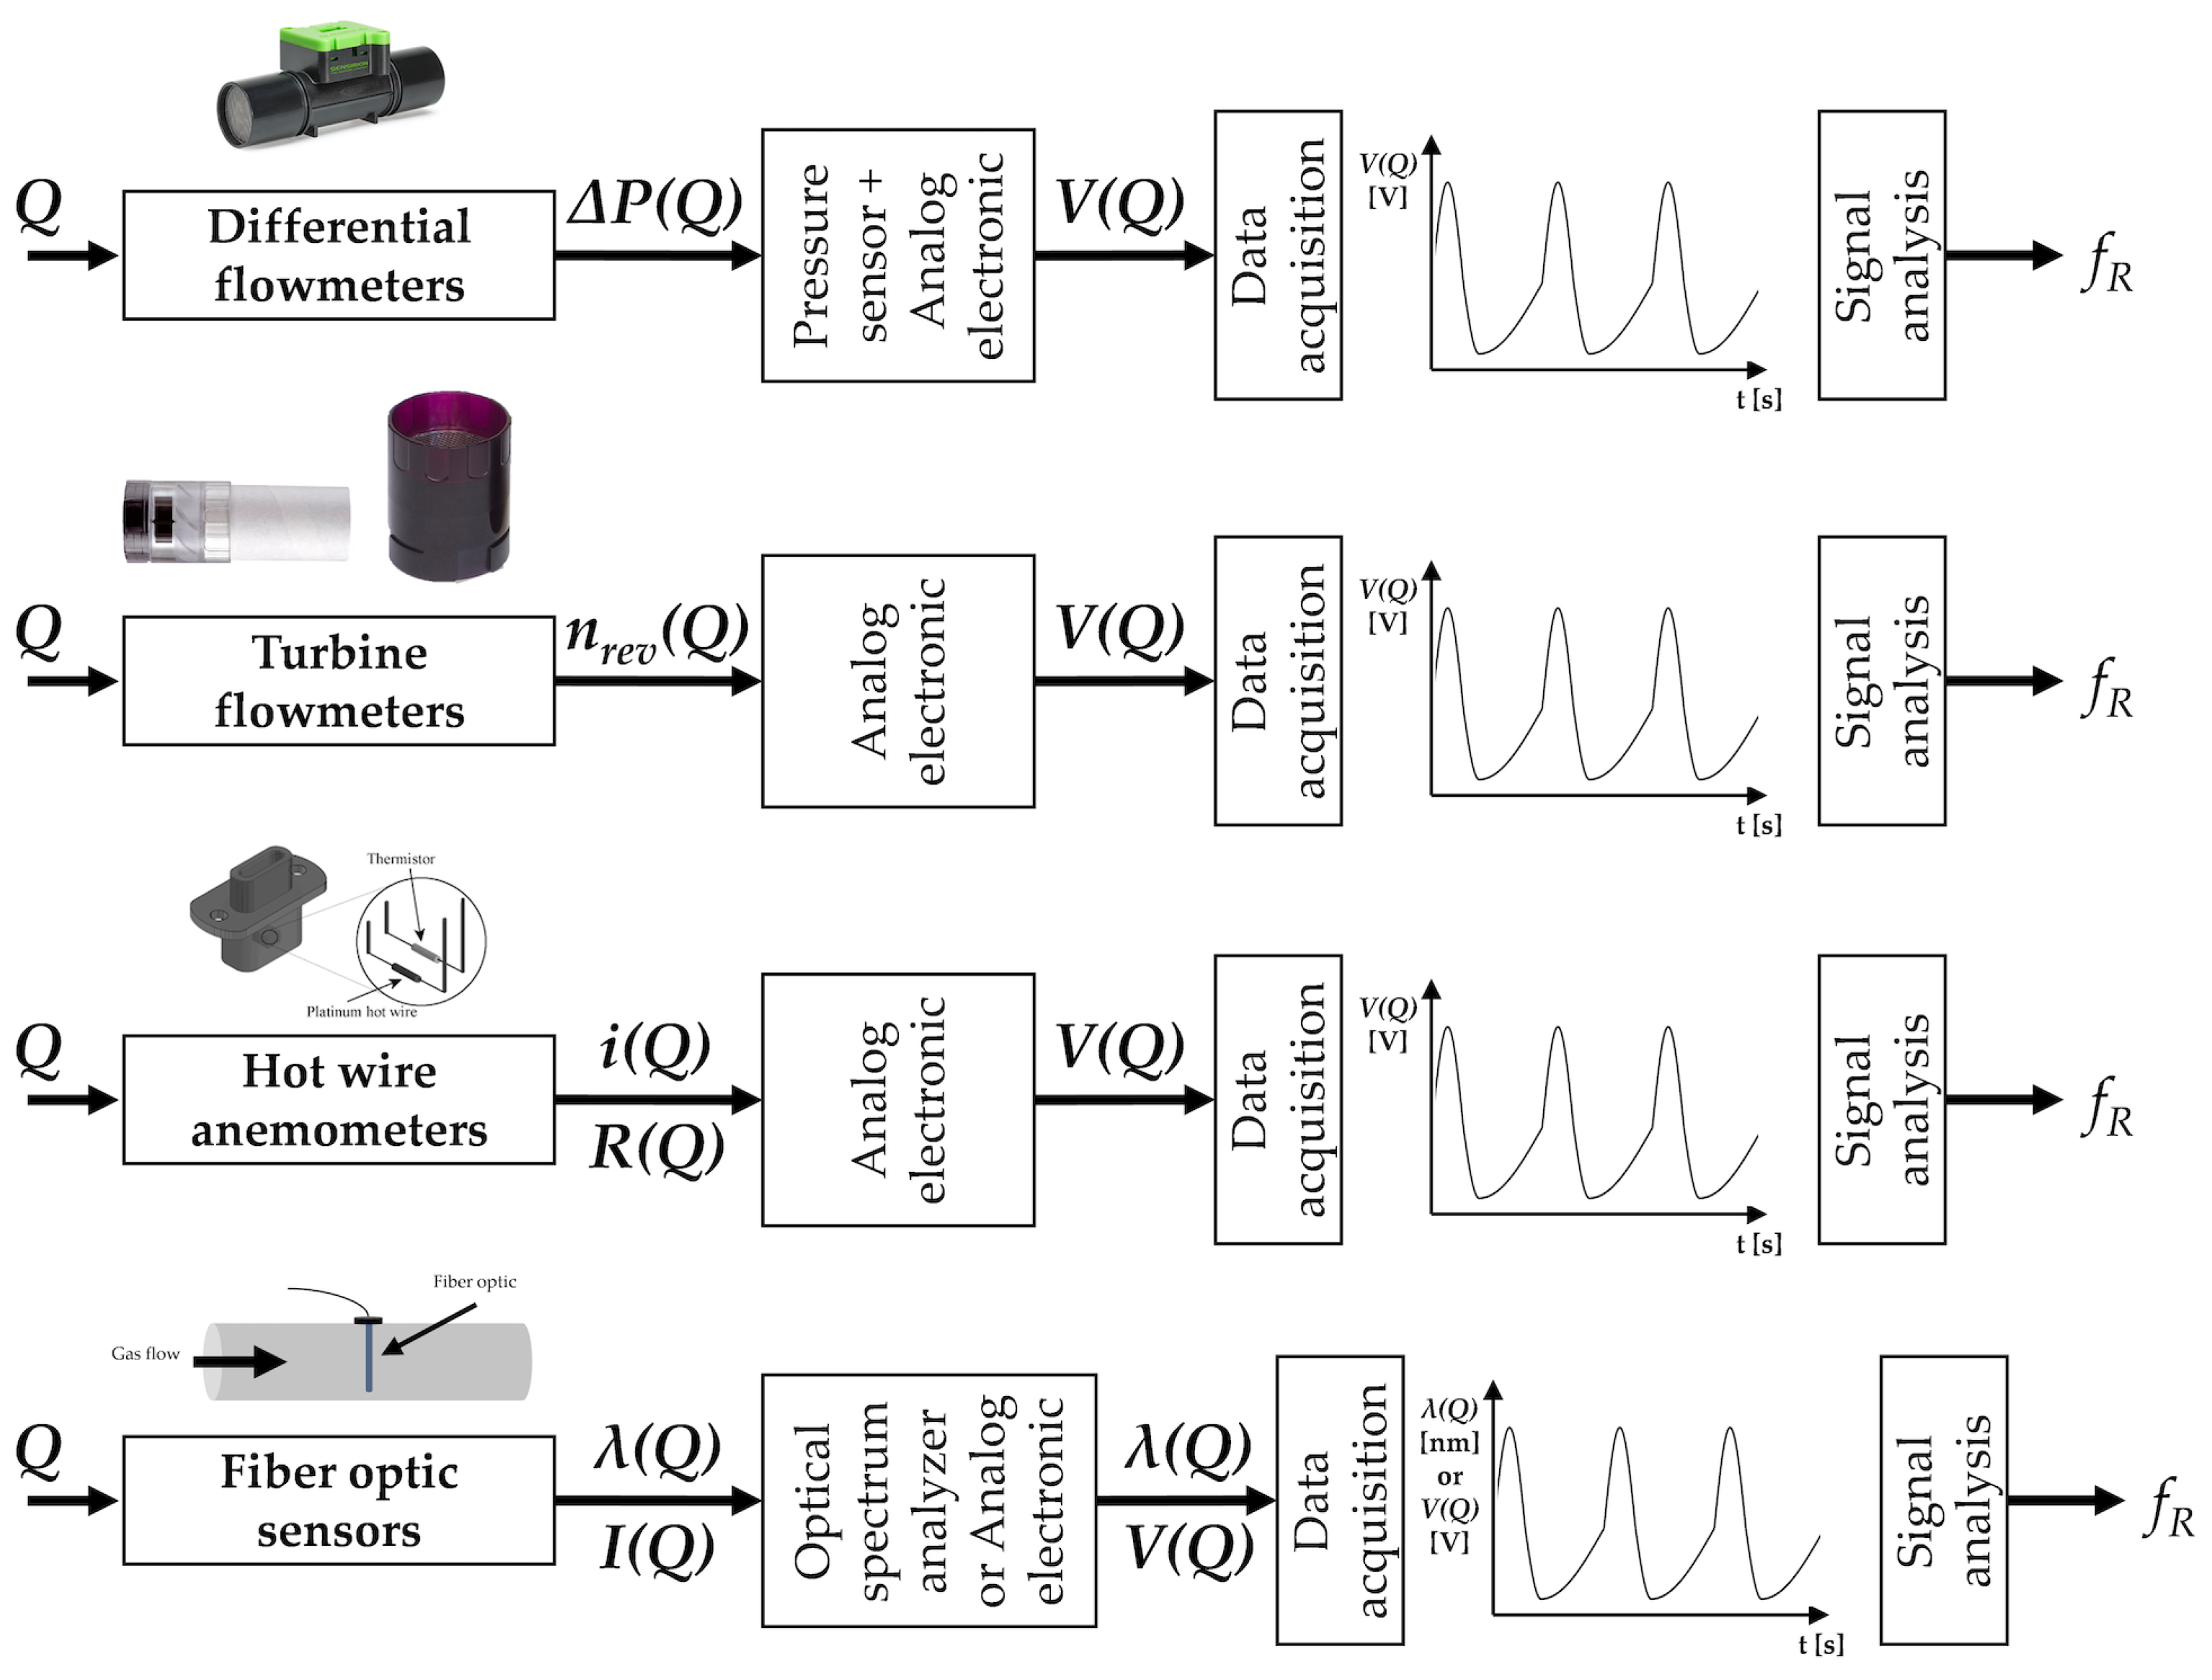
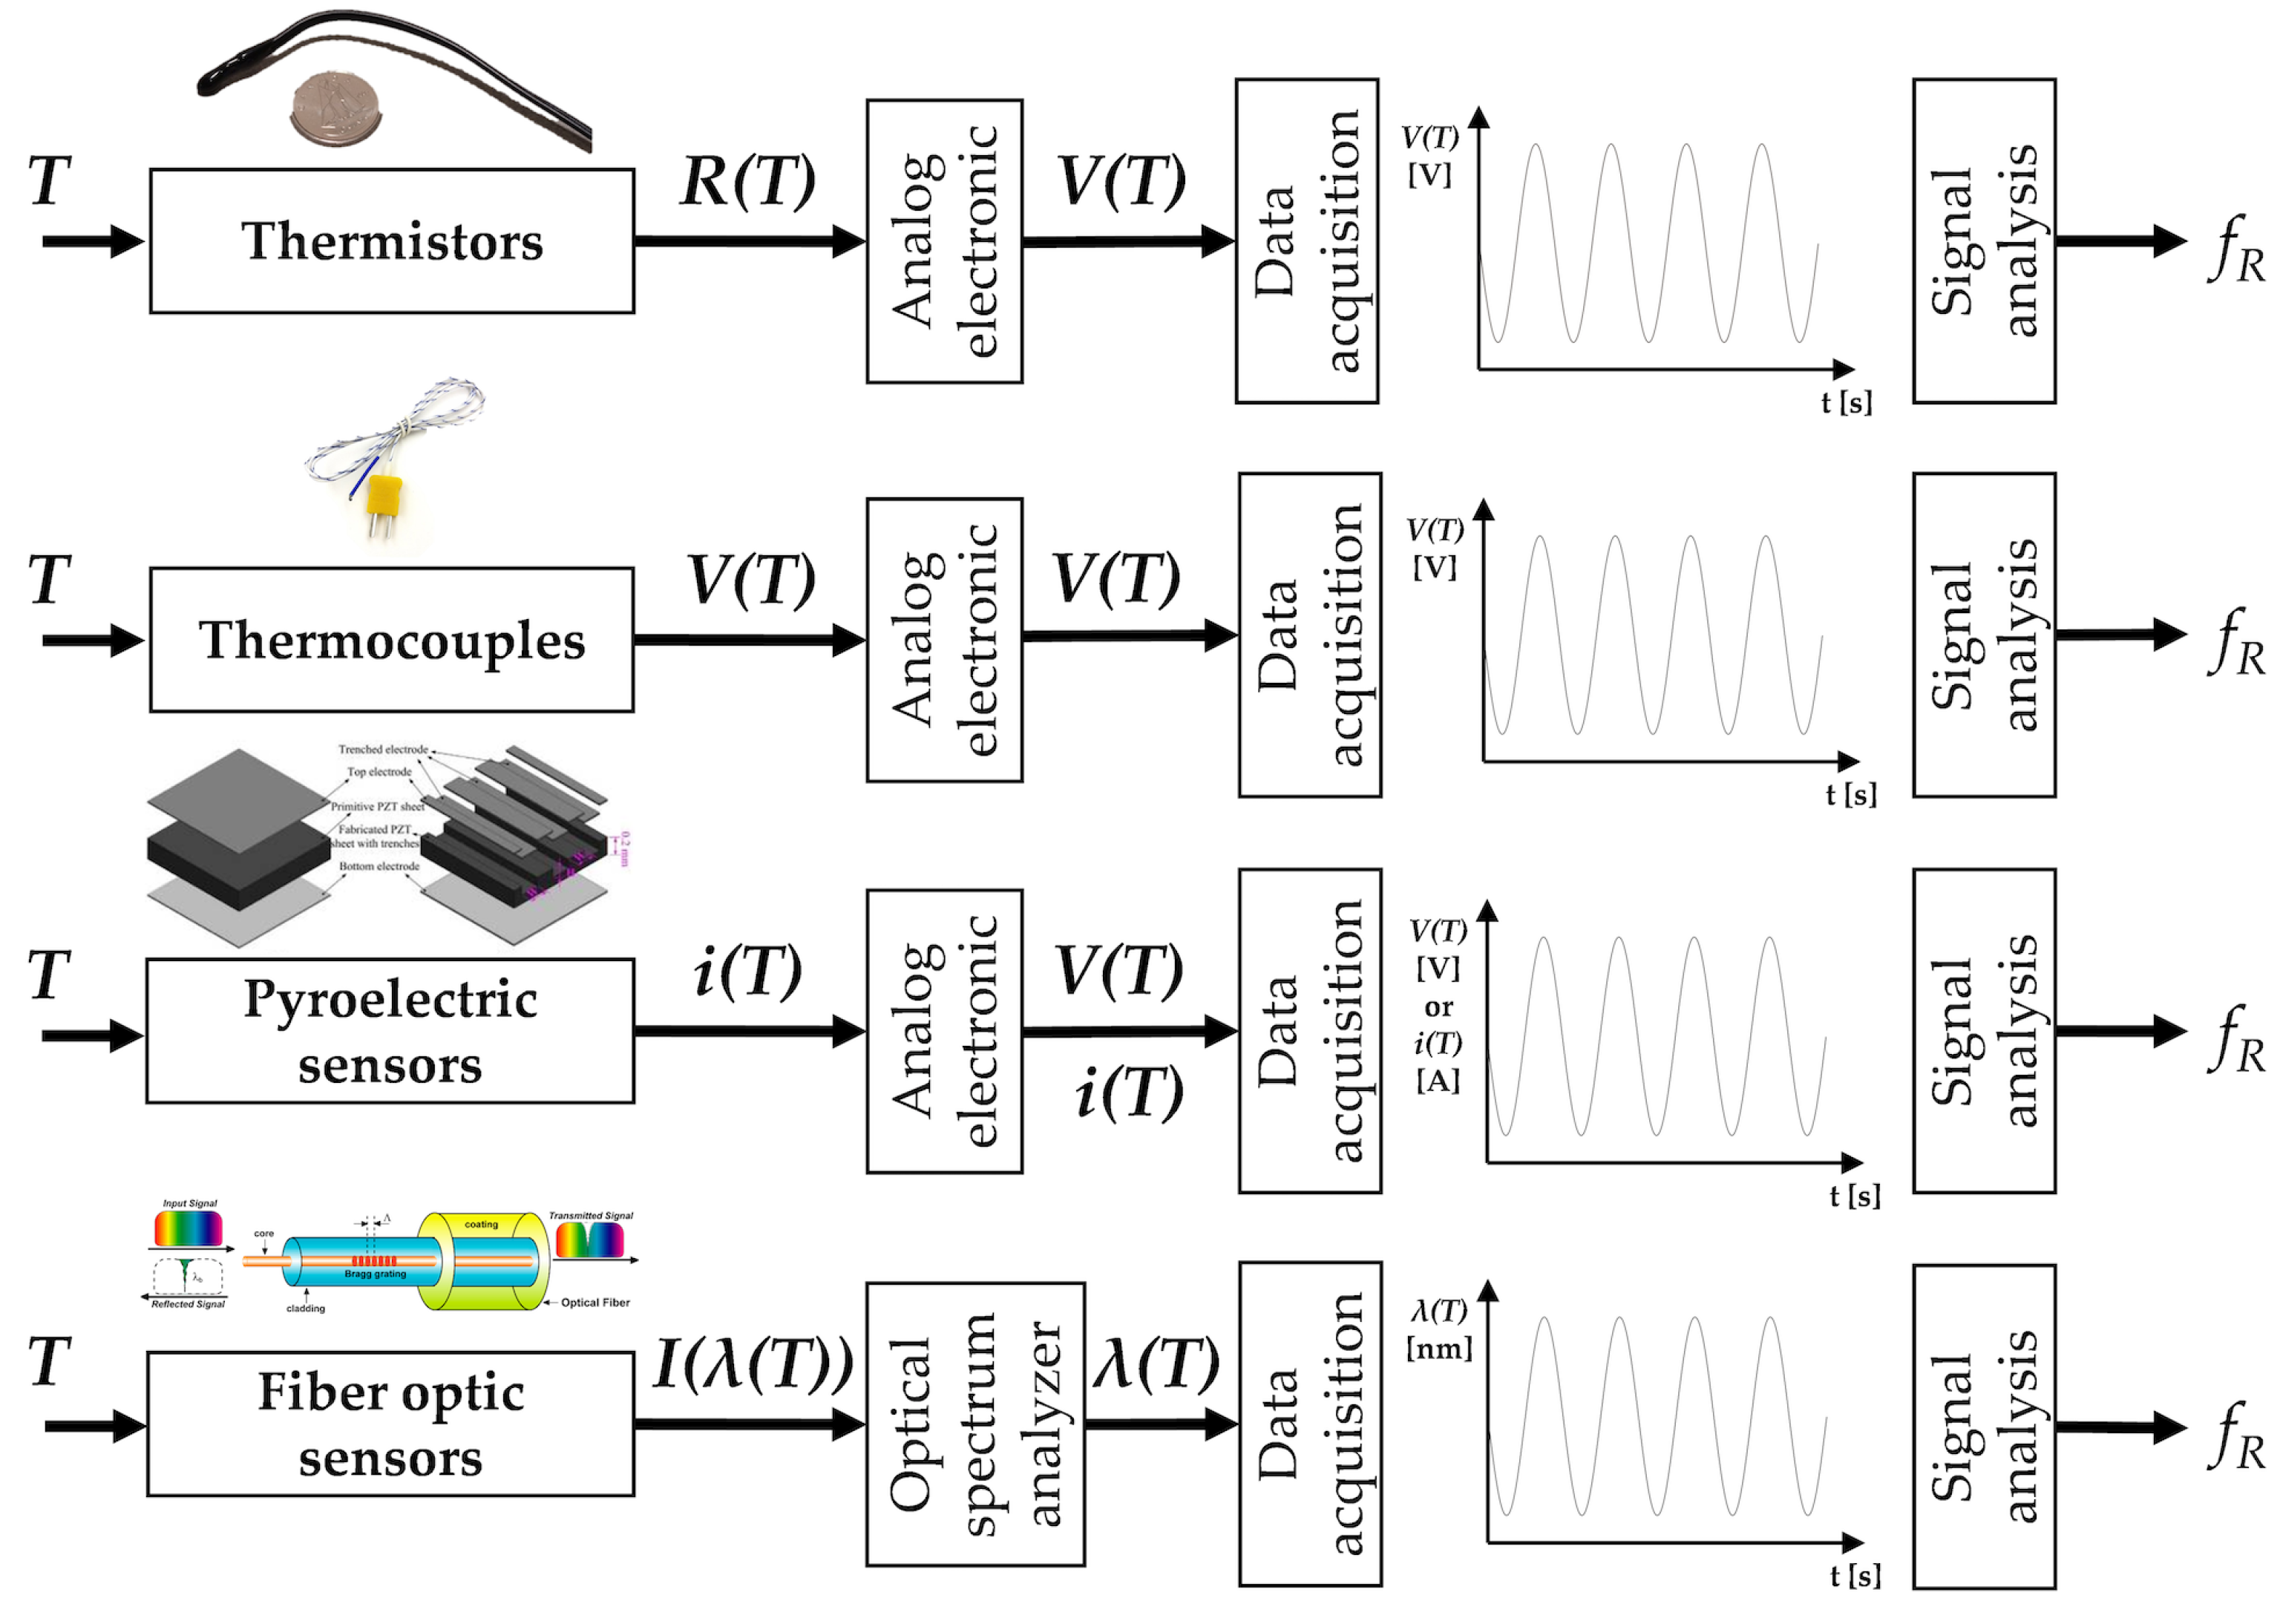
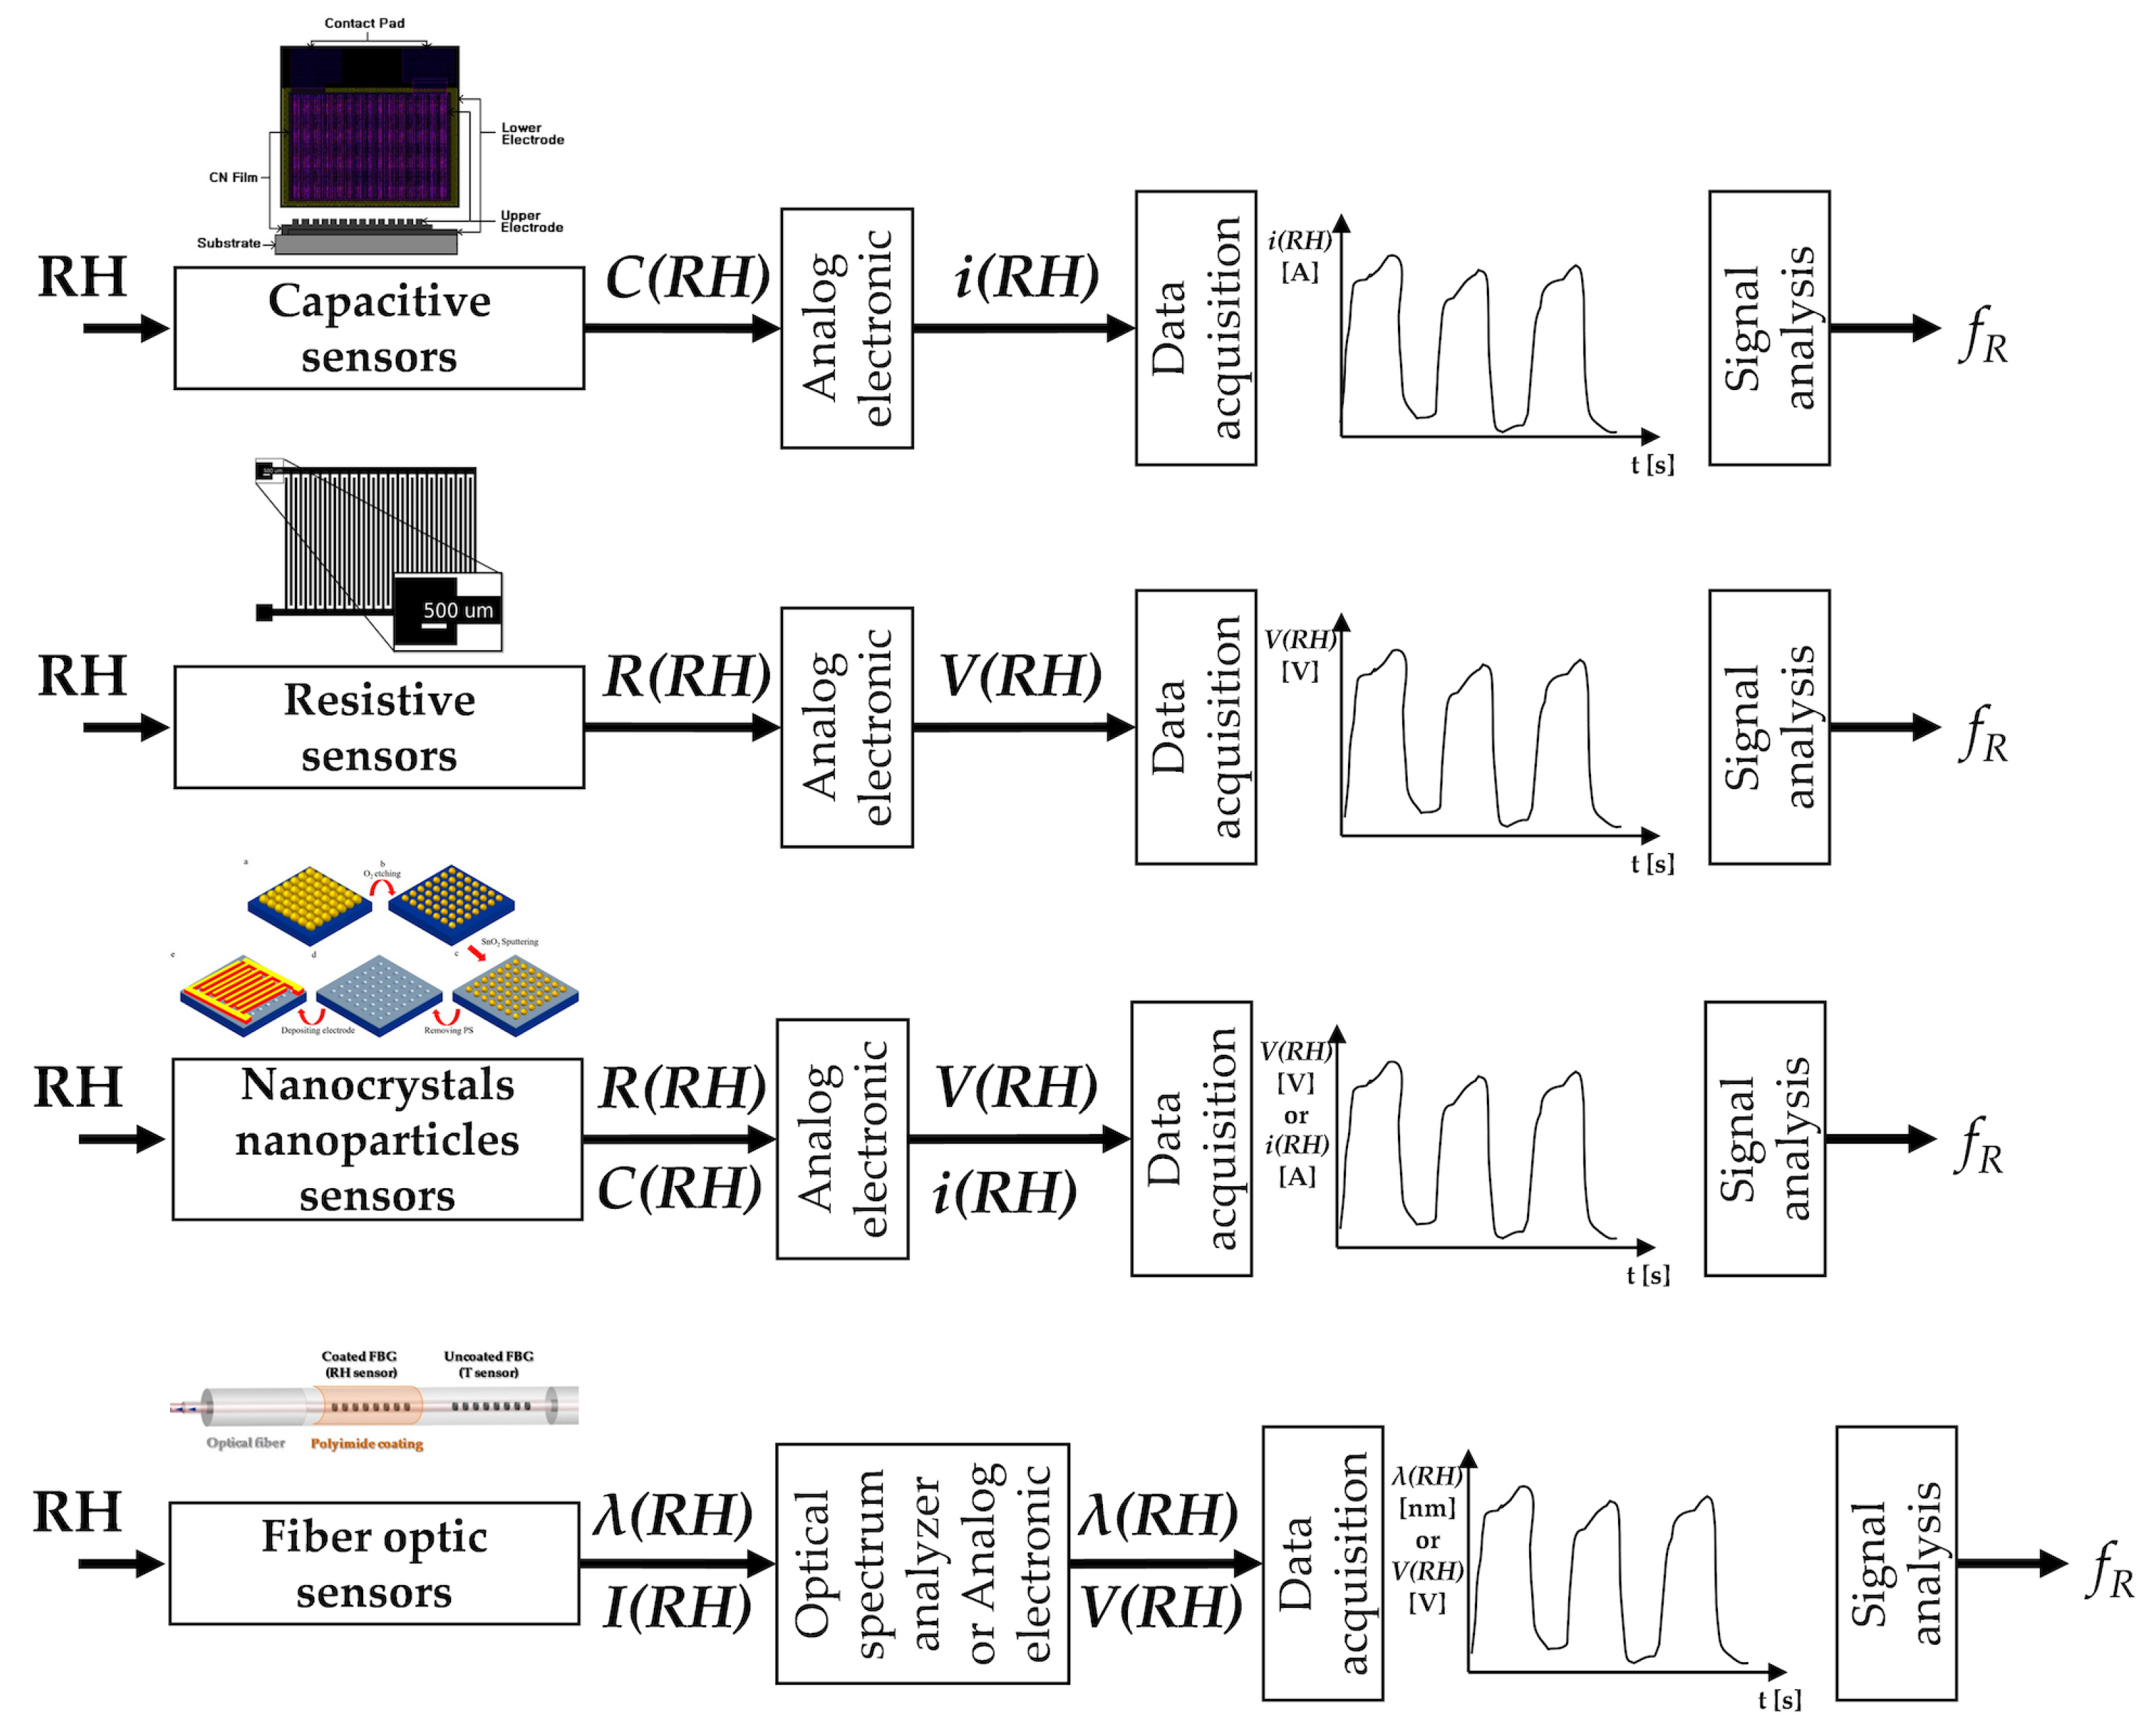
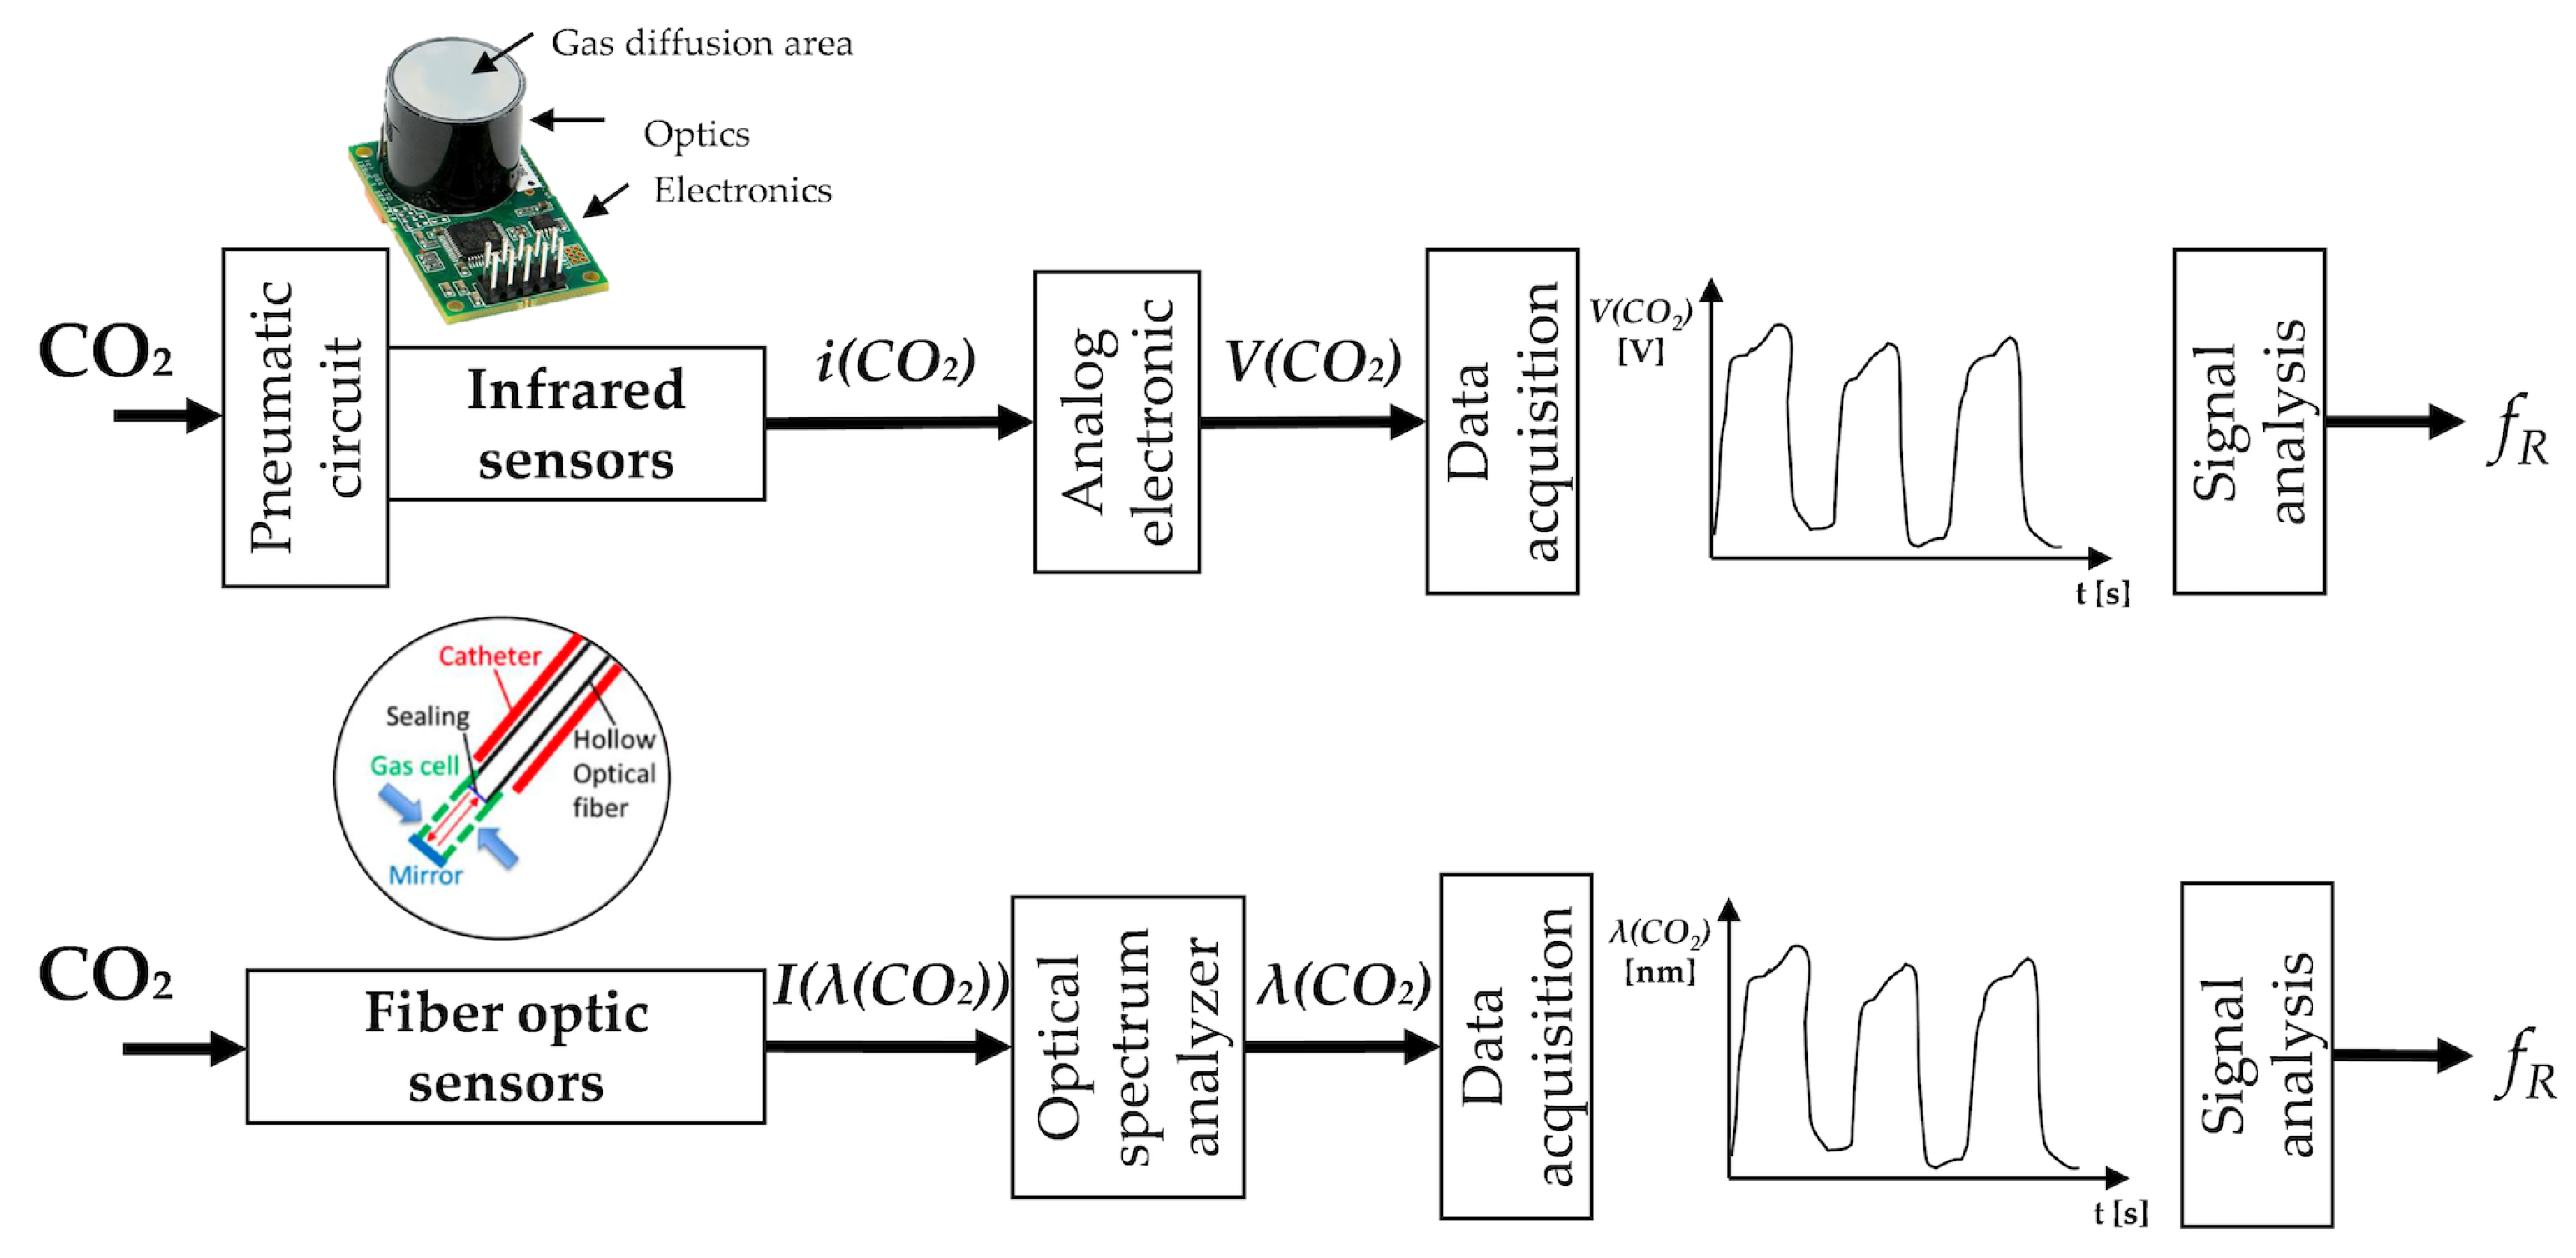
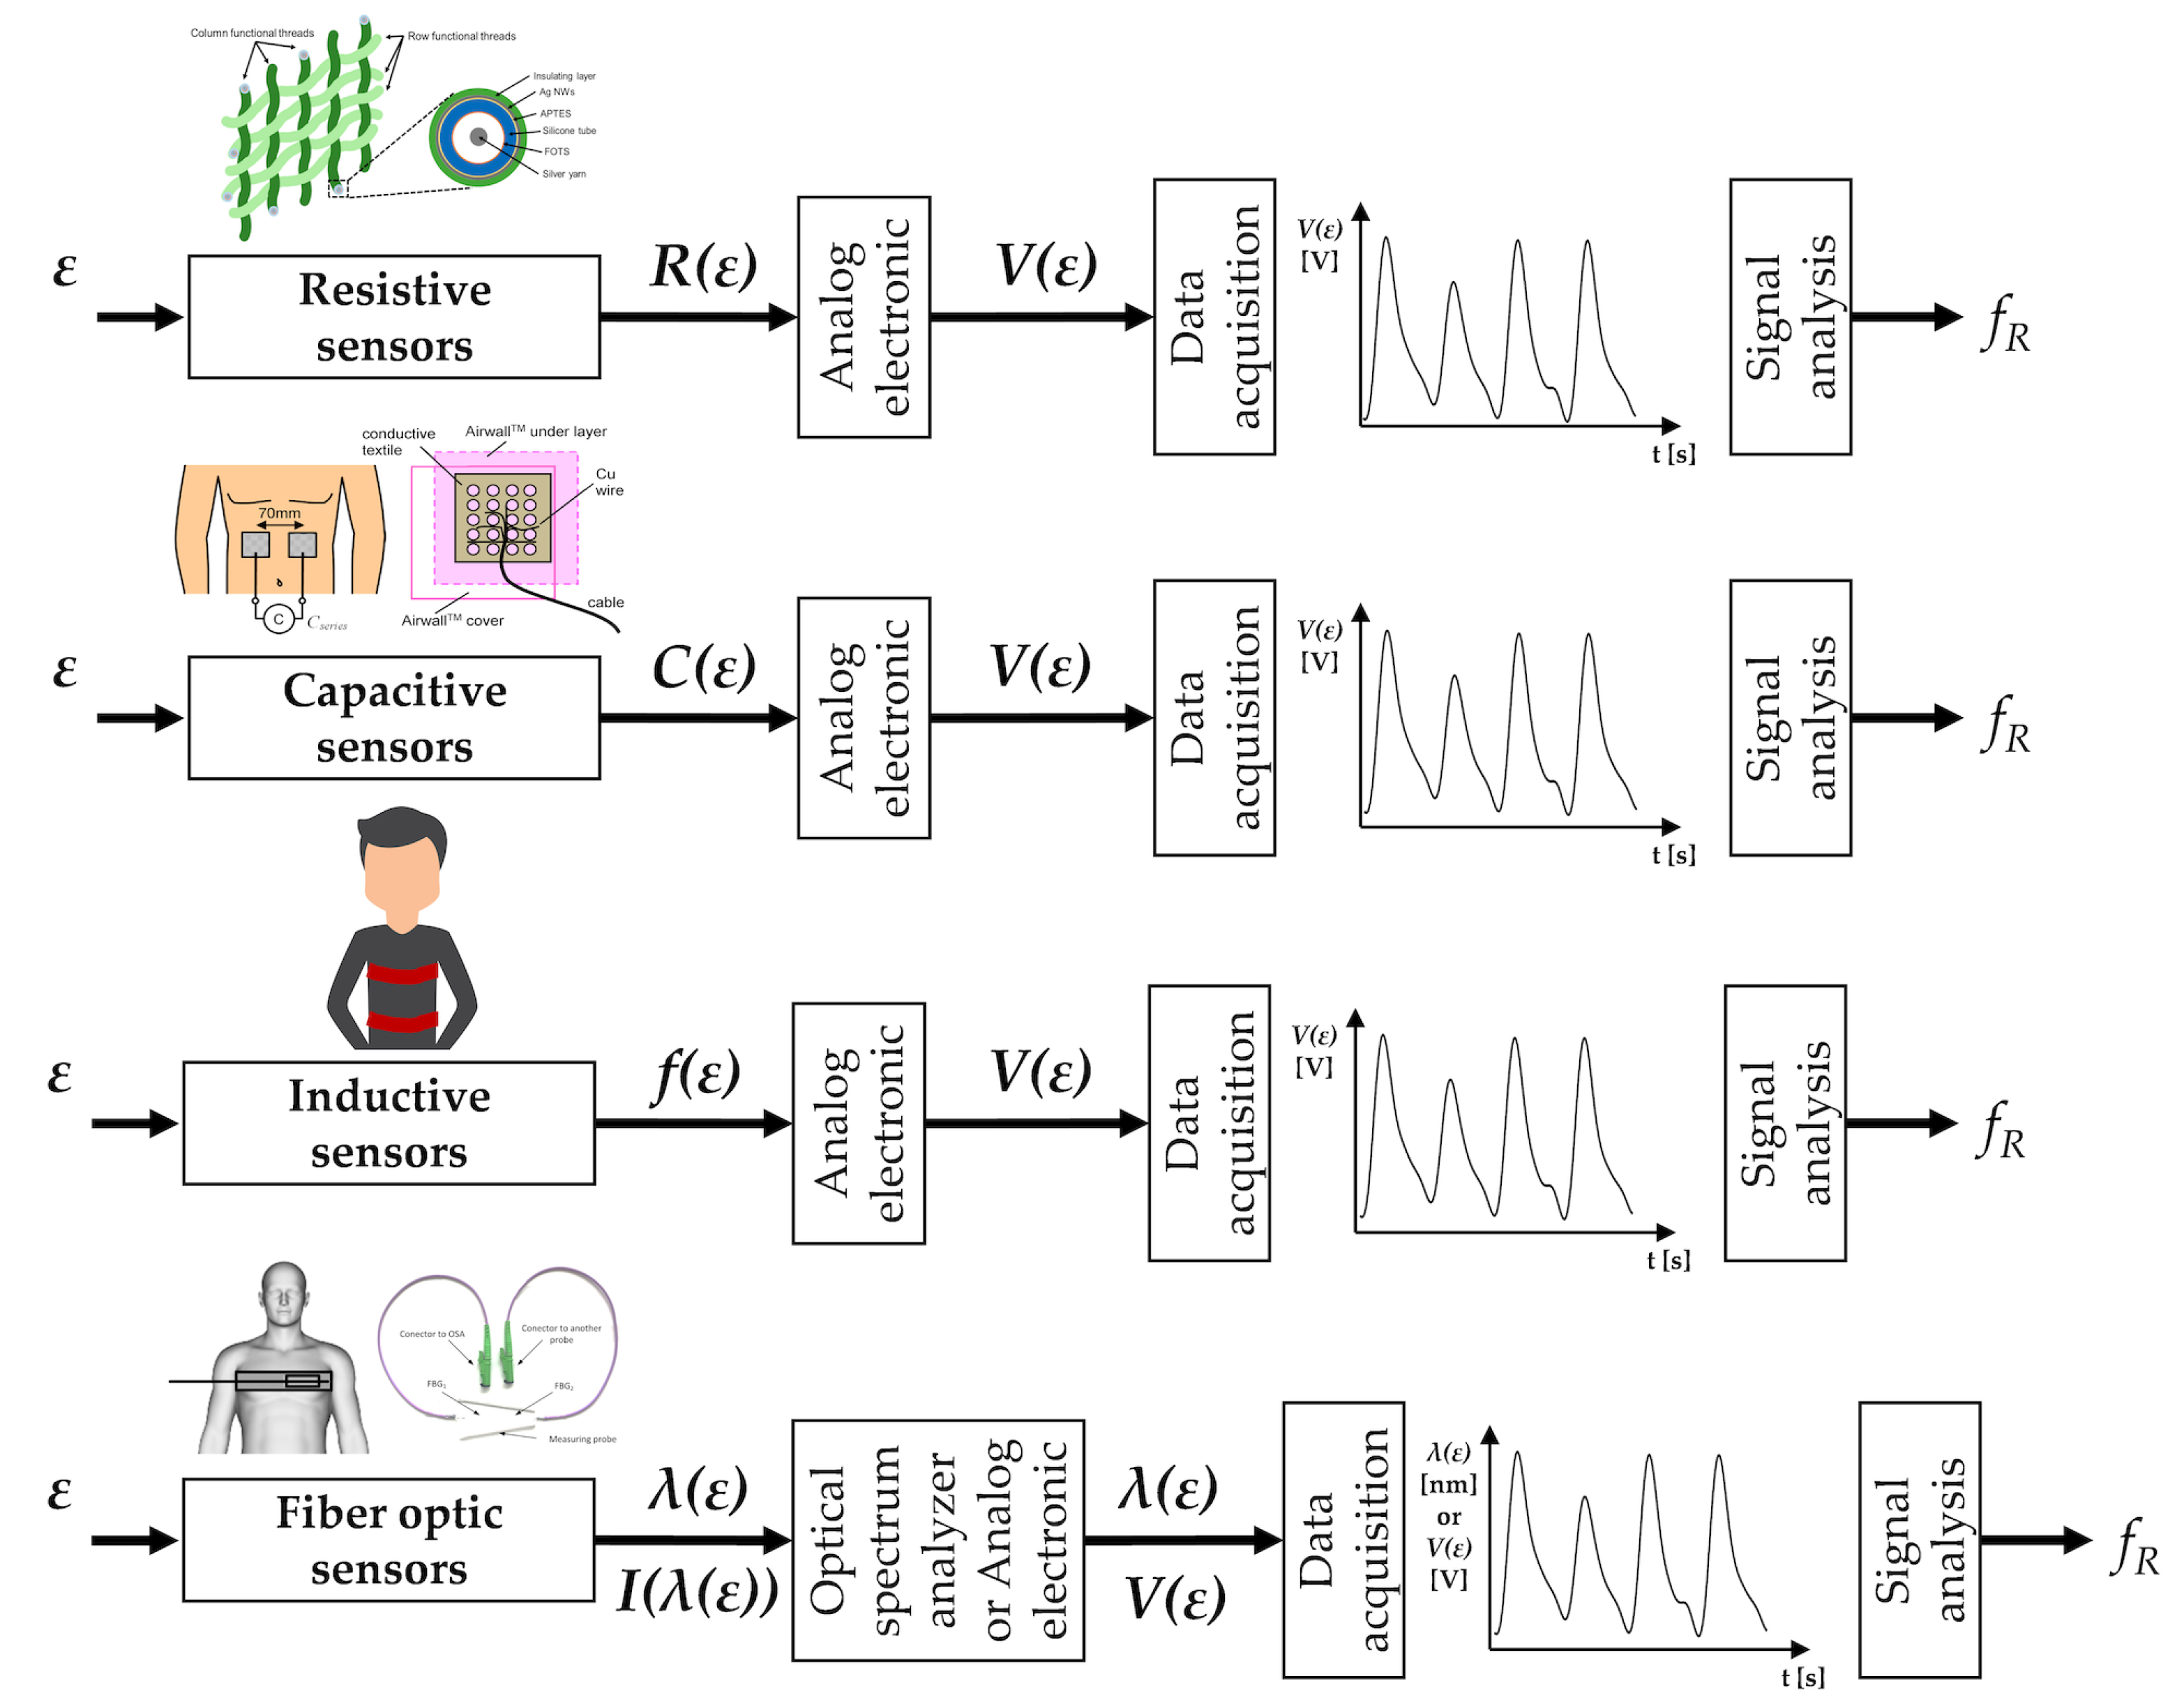
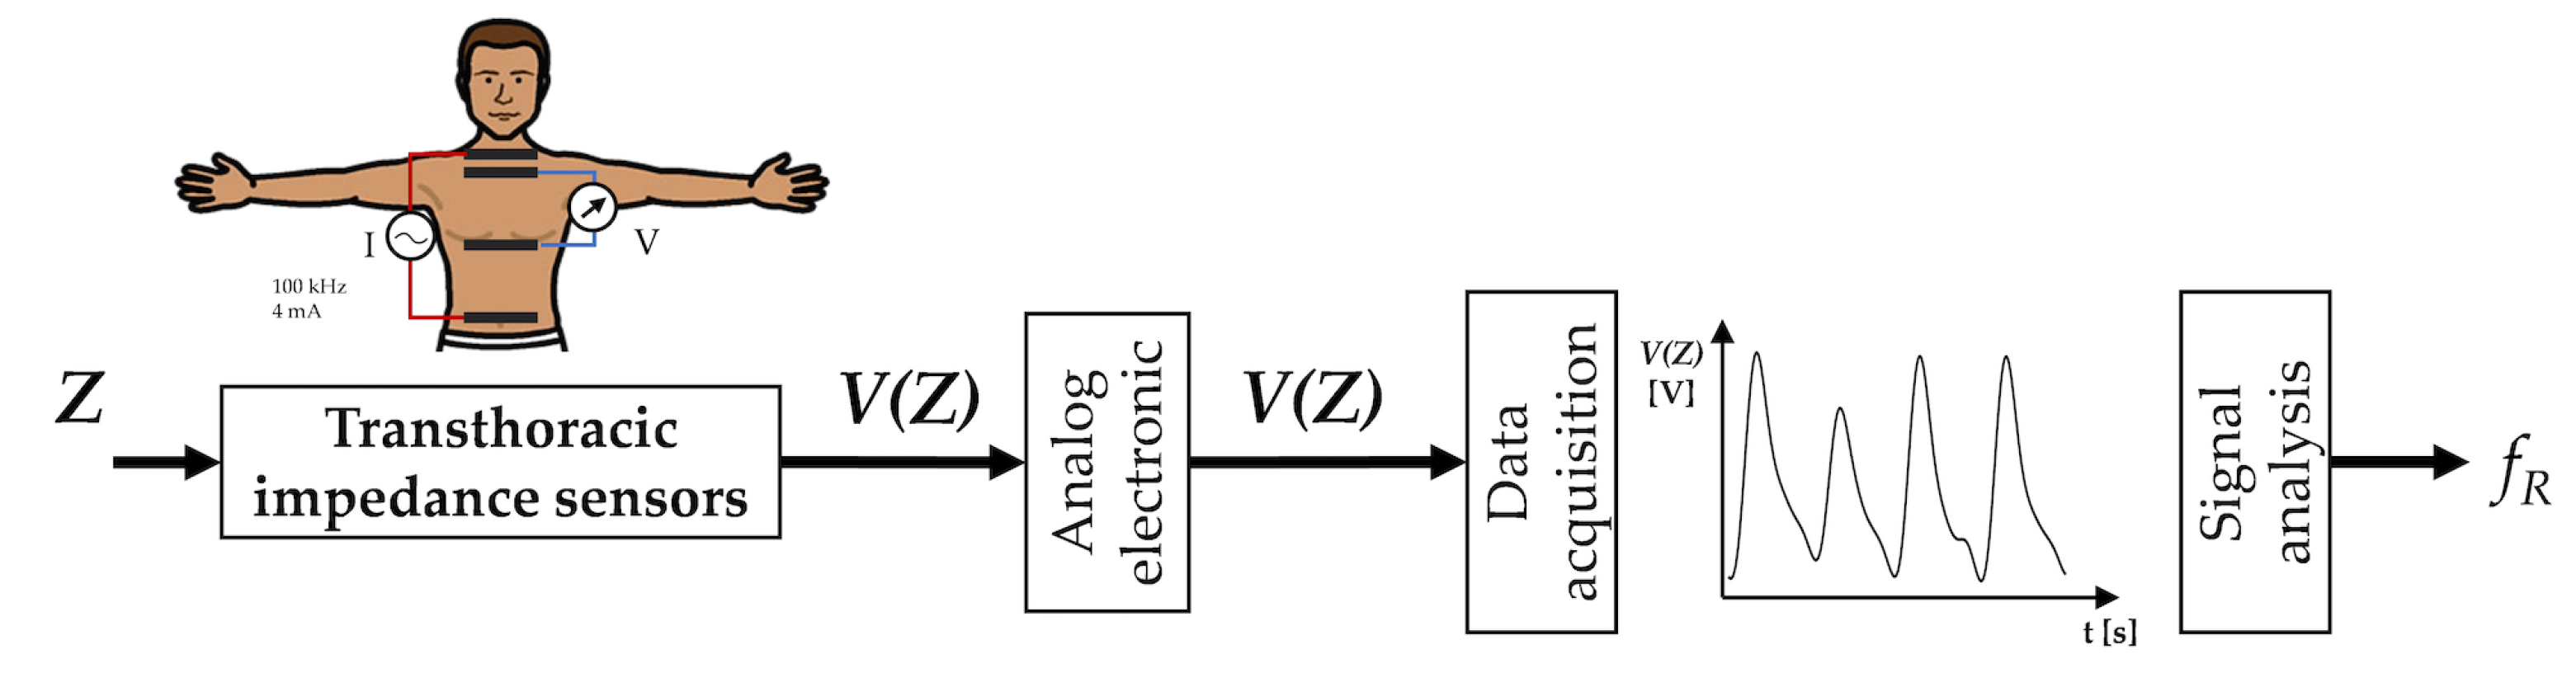
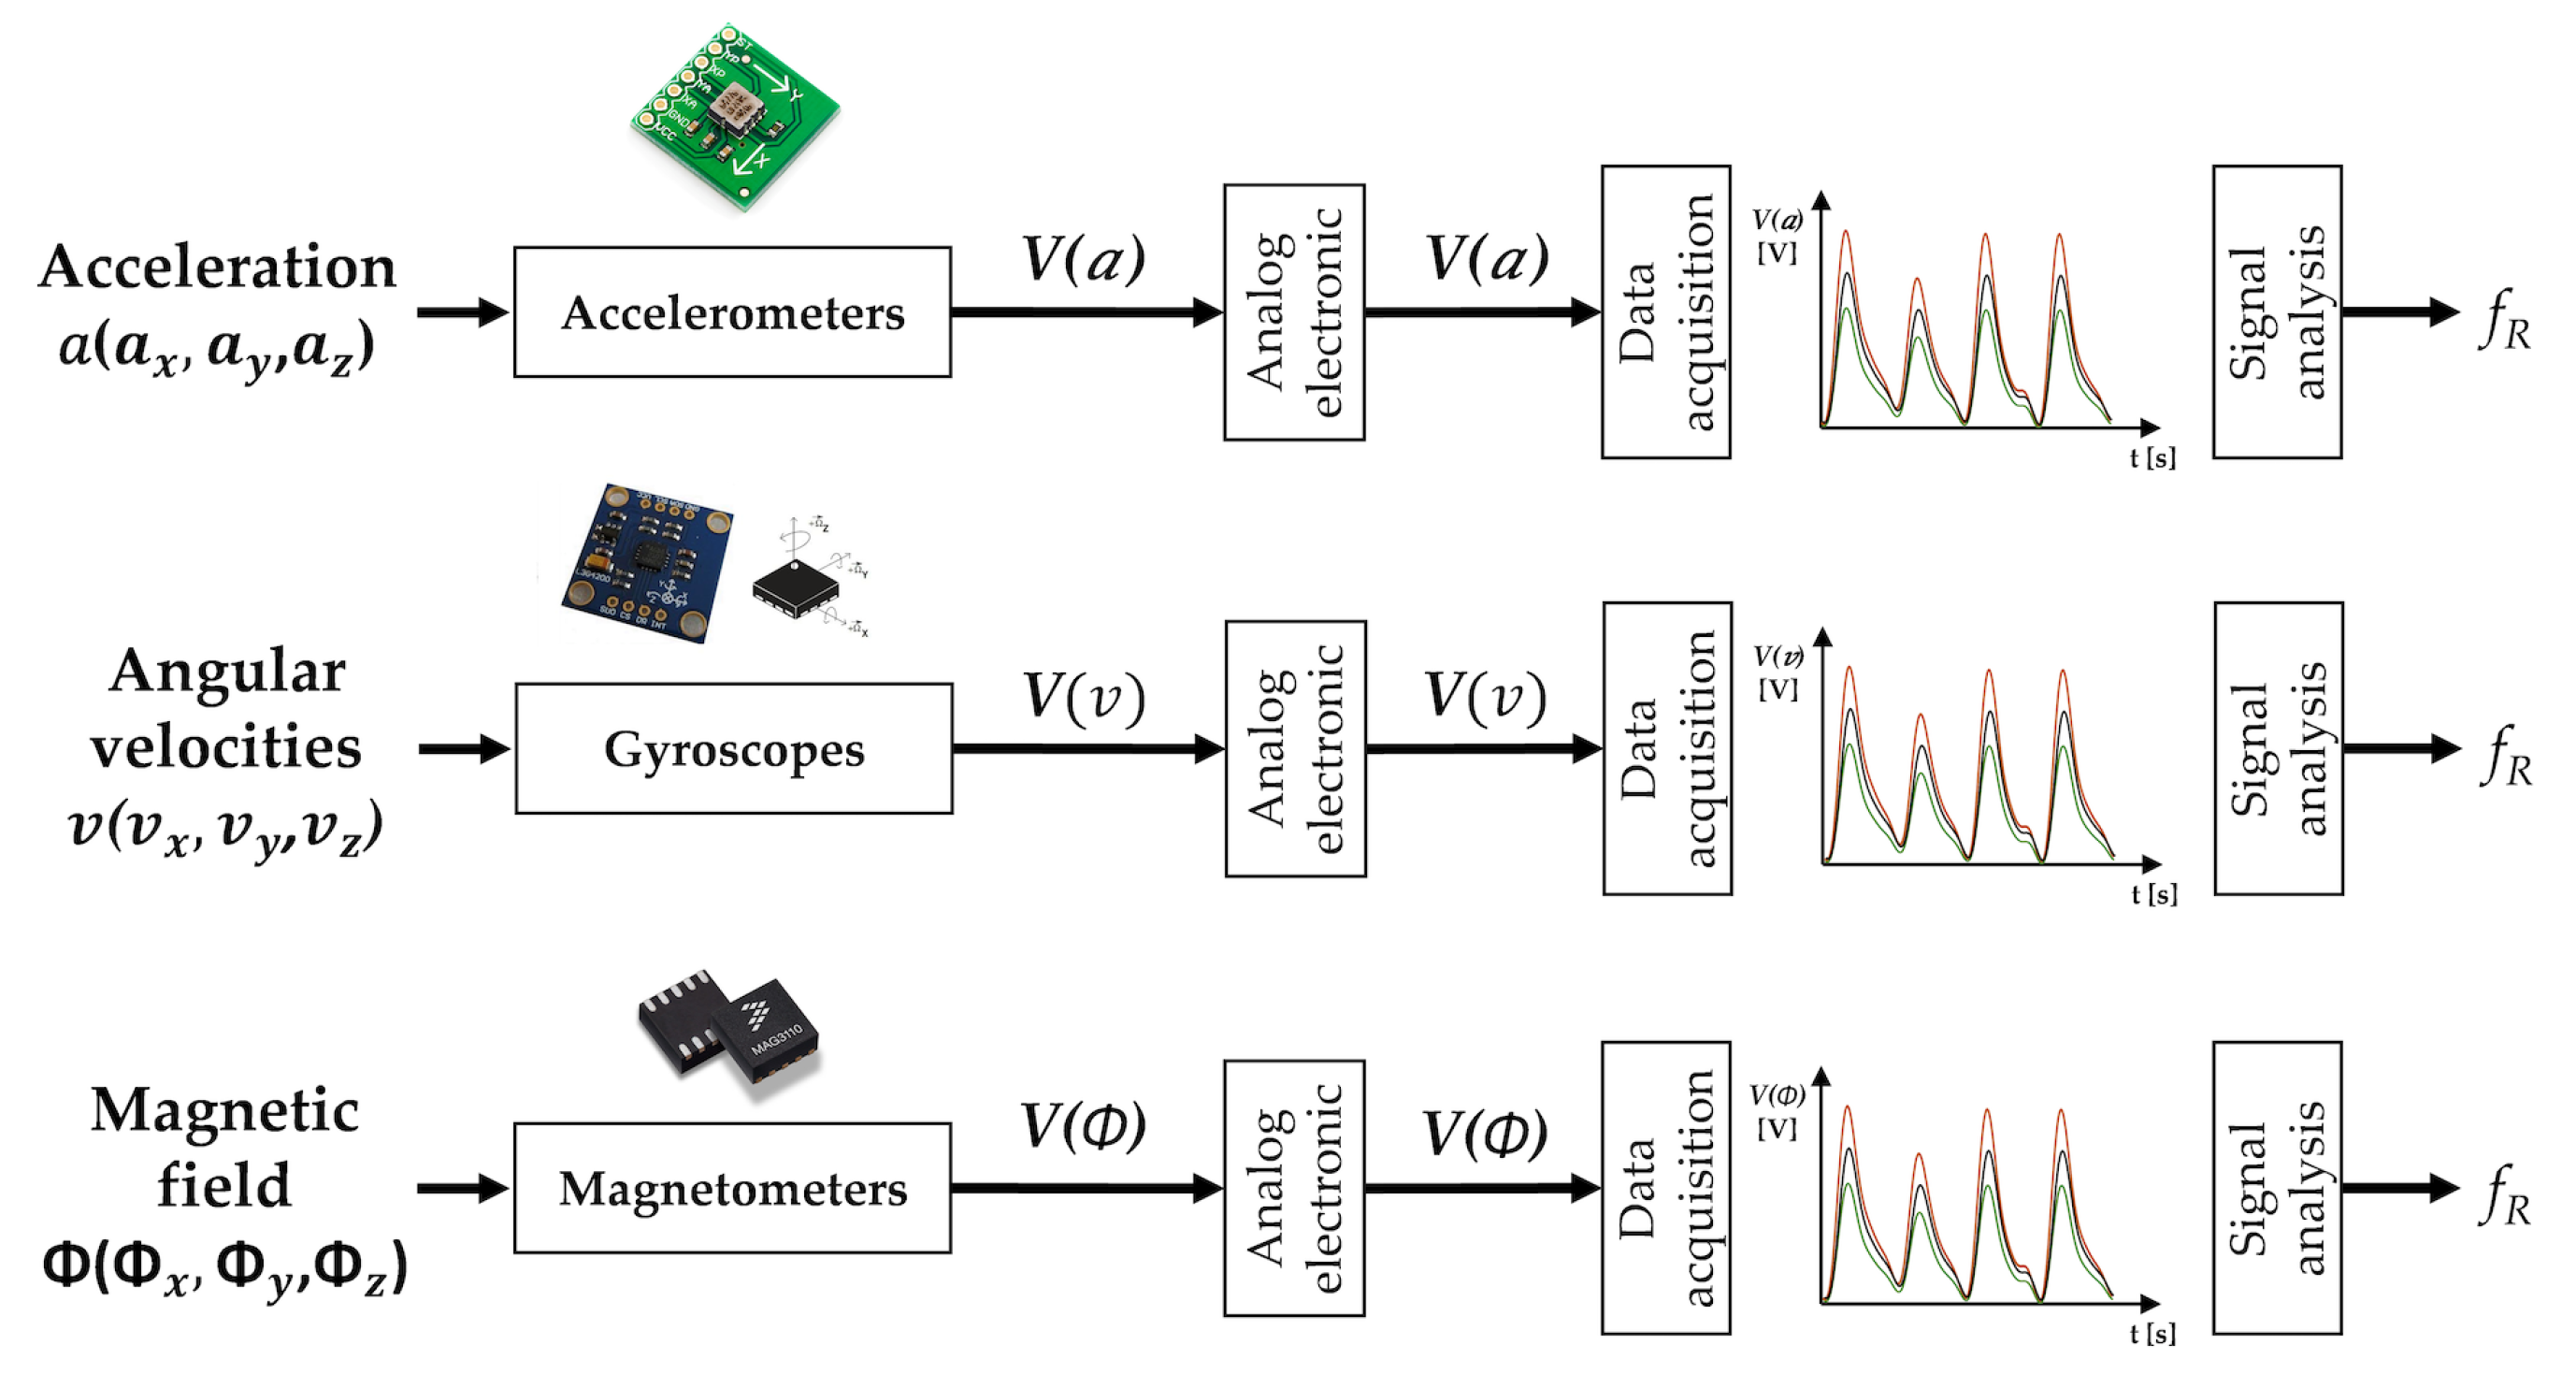
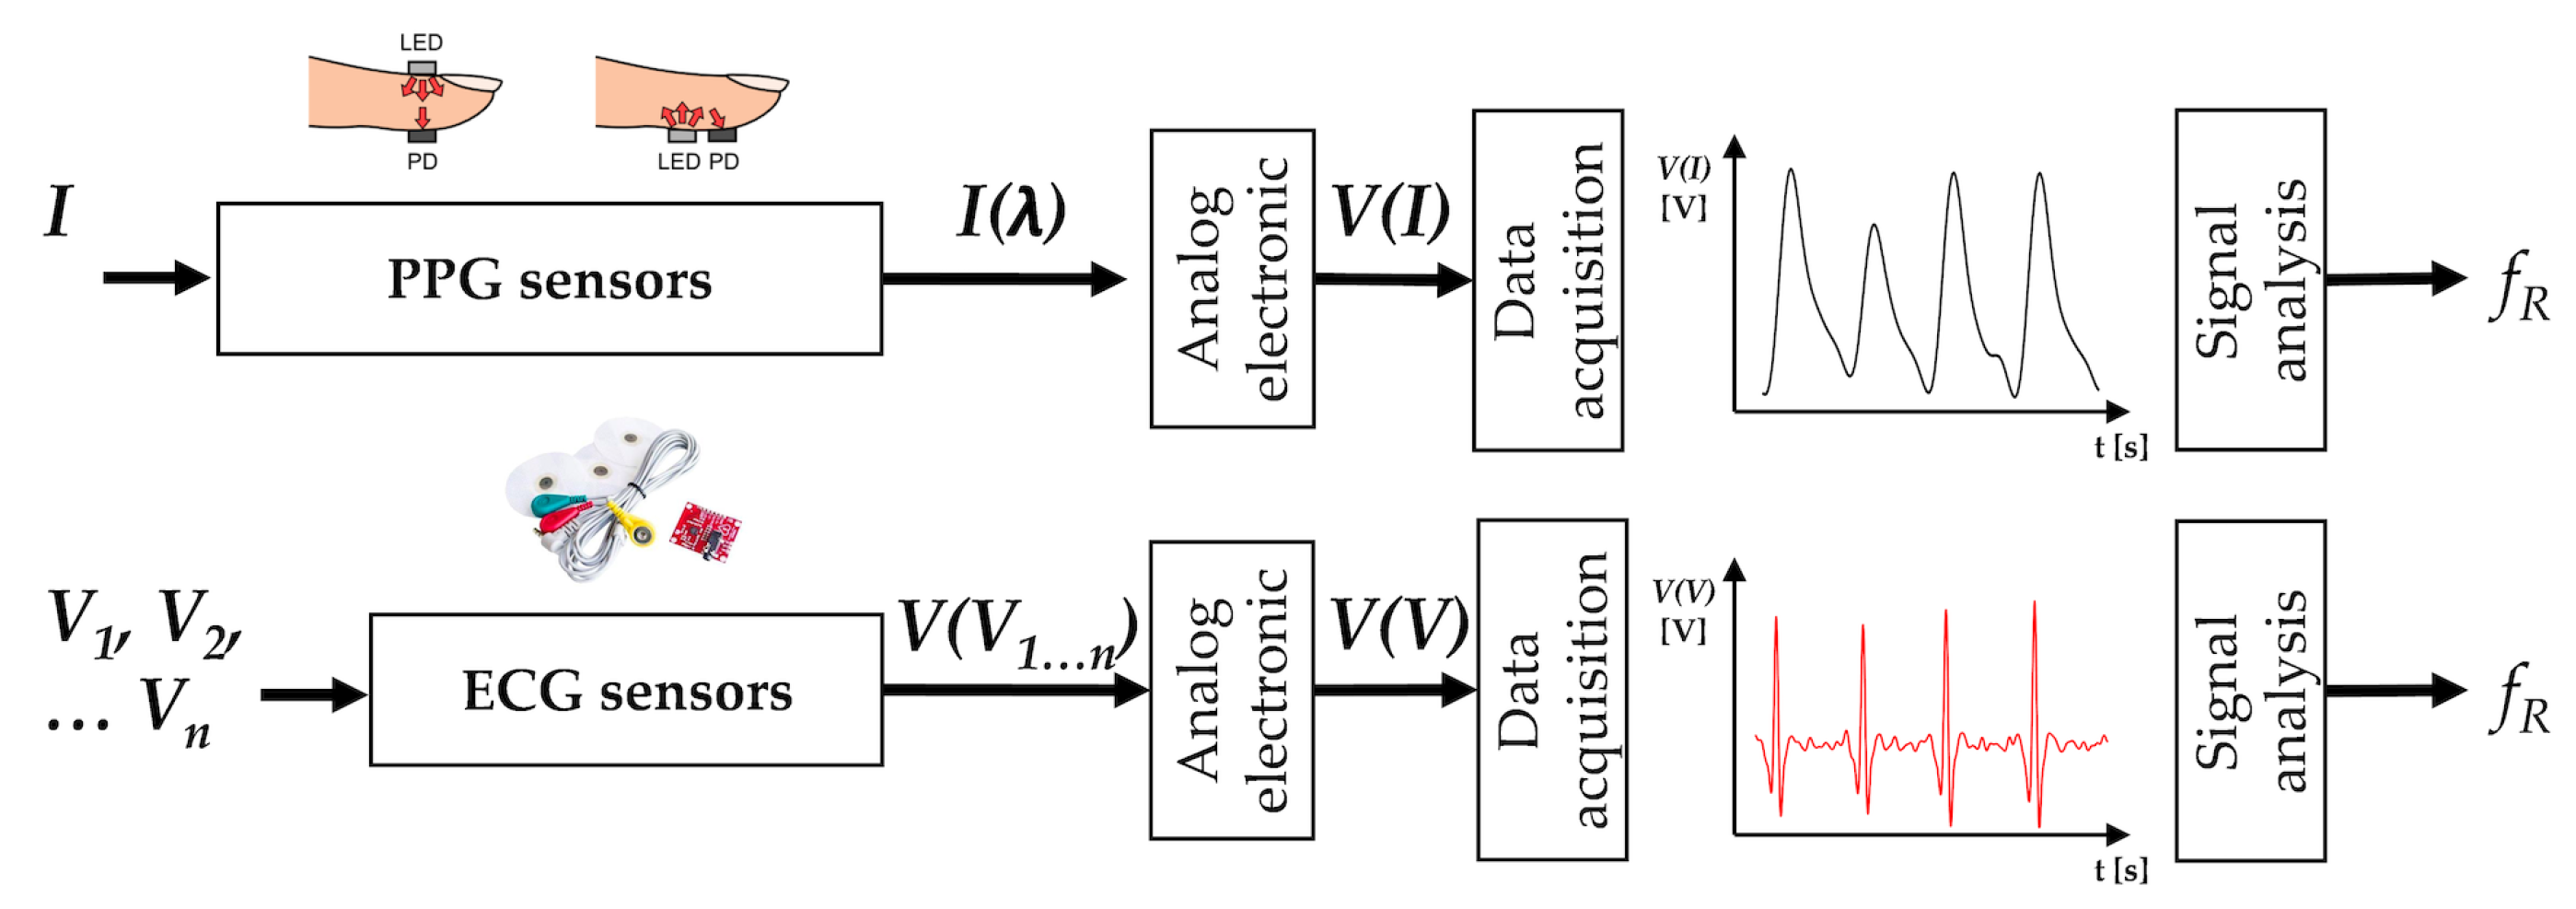
Table 1.
Main metrological properties and characteristics related to airflow sensors specifically used for measurement. ✓ good to excellent, ∼ sufficient, × poor.
Table 1.
Main metrological properties and characteristics related to airflow sensors specifically used for measurement. ✓ good to excellent, ∼ sufficient, × poor.
| Sensors | Metrological Properties | Sensor Characteristics | Applications |
|---|---|---|---|
| Differential flowmeters | ✓ Sensitivity * ✓ Step response time ✓/× Output linearity ** ✓ Accuracy | ∼ Sensor size ∼ Cost ✓ Real-time monitoring ∼ Measurement intrusiveness ✓ Sensitivity to body motion artifacts ✓ Influence of environmental factors × Presence of wire | Apnea SB QB FB |
| Turbine flowmeters | ✓ Sensitivity ✓ Step response time ✓ Output linearity ✓ Accuracy | ✓/∼ Sensor size * ∼ Cost ✓ Real-time monitoring ∼ Measurement intrusiveness ∼ Sensitivity to body motion artifacts ✓ Influence of environmental factors ∼ Presence of wire | Apnea SB QB FB |
| Hot wire anemometers | ✓ Sensitivity ✓ Step response time × Output linearity ✓ Accuracy | ∼ Sensor size ∼ Cost ✓ Real-time monitoring ∼ Measurement intrusiveness × Sensitivity to body motion artifacts ✓ Influence of environmental factors ∼ Presence of wire | Apnea SB QB FB |
| Fiber-optic sensors | ✓ Sensitivity ✓ Step response time ✓ Output linearity ✓ Accuracy | ✓ Sensor size × Cost ✓ Real-time monitoring ∼ Measurement intrusiveness × Sensitivity to body motion artifacts ∼ Influence of environmental factors × Presence of wire | Apnea SB QB FB |
* it may be adjusted by changing the geometry of the sensor; ** it depends on the kind of sensor.
Table 2.
Main metrological properties and characteristics of the acoustic sensors used for measurement. ✓ good to excellent, ∼ sufficient, × poor.
Table 2.
Main metrological properties and characteristics of the acoustic sensors used for measurement. ✓ good to excellent, ∼ sufficient, × poor.
| Sensors | Metrological Properties | Sensor Characteristics | Applications |
|---|---|---|---|
| Microphones | ✓ Sensitivity ✓ Step response time ✓/× Output linearity * ✓ Accuracy | ✓ Sensor size ✓ Cost ∼ Real-time monitoring ✓ Measurement intrusiveness ✓ Sensitivity to body motion artifacts × Influence of environmental factors ∼ Presence of wire ** | Apnea SB QB FB |
* it depends on the kind of sensor; ** it depends on the body area on which the sensor is attached (mouth, nose, chest wall).
Table 3.
Main metrological properties and characteristics of the temperature sensors used for measurement. ✓ good to excellent, ∼ sufficient, × poor.
Table 3.
Main metrological properties and characteristics of the temperature sensors used for measurement. ✓ good to excellent, ∼ sufficient, × poor.
| Sensors | Metrological Properties | Sensor Characteristics | Applications |
|---|---|---|---|
| Thermistors | ✓ Sensitivity ∼ Step response time ✓ Output linearity ✓ Accuracy | ∼ Sensor size ✓ Cost ∼ Real-time monitoring * ∼ Measurement intrusiveness ✓ Sensitivity to body motion artifacts × Influence of environmental factors × Presence of wire | Apnea SB |
| Thermocouples | ✓ Sensitivity ✓ Step response time ✓ Output linearity ✓ Accuracy | ✓ Sensor size ∼ Cost ✓ Real-time monitoring ∼ Measurement intrusiveness ✓ Sensitivity to body motion artifacts × Influence of environmental factors × Presence of wire | Apnea SB QB FB |
| Pyroelectric sensors | ✓ Sensitivity ✓ Step response time ✓ Output linearity ✓ Accuracy | ✓ Sensor size ∼ Cost ✓ Real-time monitoring ∼ Measurement intrusiveness ✓ Sensitivity to body motion artifacts × Influence of environmental factors × Presence of wire | Apnea SB QB FB |
| Fiber-optic sensors | ✓ Sensitivity ✓ Step response time ✓ Output linearity ✓ Accuracy | ✓ Sensor size × Cost ** ✓ Real-time monitoring ∼ Measurement intrusiveness ✓ Sensitivity to body motion artifacts × Influence of environmental factors × Presence of wire | Apnea SB QB FB |
* real-time monitoring is not possible for QB, FB; ** it includes the cost of optical spectrum analyzer to power the sensors and record the data.
Table 4.
Main metrological properties and characteristics of the humidity sensors used for measurement. ✓ good to excellent, ∼ sufficient, × poor.
Table 4.
Main metrological properties and characteristics of the humidity sensors used for measurement. ✓ good to excellent, ∼ sufficient, × poor.
| Sensors | Metrological Properties | Sensor Characteristics | Applications |
|---|---|---|---|
| Capacitive sensors | ✓ Sensitivity × Step response time * ✓ Output linearity ✓ Accuracy | ∼ Sensor size ✓ Cost ✓ Real-time monitoring ∼ Measurement intrusiveness ✓ Sensitivity to body motion artifacts × Influence of environmental factors × Presence of wire | Apnea SB QB ** |
| Resistive sensors | ✓ Sensitivity ∼/× Step response time *** ✓ Output linearity ✓ Accuracy | ∼ Sensor size ✓ Cost ✓ Real-time monitoring ∼ Measurement intrusiveness ✓ Sensitivity to body motion artifacts × Influence of environmental factors × Presence of wire | Apnea SB QB ** FB ** |
| Nanocrystals and nanoparticles sensors | ✓ Sensitivity ✓/∼ Step response time **** ✓ Output linearity ✓ Accuracy | ∼ Sensor size ✓ Cost ✓ Real-time monitoring ∼ Measurement intrusiveness ✓ Sensitivity to body motion artifacts × Influence of environmental factors × Presence of wire | Apnea SB QB FB ** |
| Fiber-optic sensors | ✓ Sensitivity ✓/∼ Step response time ✓ Output linearity ✓ Accuracy | ✓ Sensor size × Cost ✓ Real-time monitoring ∼ Measurement intrusiveness ∼ Sensitivity to body motion artifacts ∼ Influence of environmental factors × Presence of wire | Apnea SB QB FB |
* usually some s, but in some cases ∼300 ms; ** it depends on the kind of sensor: QB and FB monitoring is possible only with sensors with short response time; *** in some cases 10 s, but in some cases <50 ms; **** in the worst case 1 s.
Table 5.
Main metrological properties and characteristics of the air component sensors used for measurement. ✓ good to excellent, ∼ sufficient, × poor.
Table 5.
Main metrological properties and characteristics of the air component sensors used for measurement. ✓ good to excellent, ∼ sufficient, × poor.
| Sensors | Metrological Properties | Sensor Characteristics | Applications |
|---|---|---|---|
| Infrared sensors | ✓ Sensitivity ✓ Step response time ✓ Output linearity ✓ Accuracy | ∼ Sensor size ∼ Cost ✓ Real-time monitoring ∼ Measurement intrusiveness ✓ Sensitivity to body motion artifacts × Influence of environmental factors × Presence of wire | Apnea SB QB FB |
| Fiber-optic sensors | ✓ Sensitivity ✓ Step response time ✓ Output linearity ✓ Accuracy | ✓ Sensor size ∼/× Cost * ✓ Real-time monitoring ∼ Measurement intrusiveness ✓ Sensitivity to body motion artifacts × Influence of environmental factors × Presence of wire | Apnea SB QB FB |
* it depends on sensor technology: mid-infrared light fiber-optic sensors are cheaper than long-period fiber gratings and Fabry Perot interferometer.
Table 6.
Main metrological properties and characteristics of the strain sensors used for measurement. ✓ good to excellent, ∼ sufficient, × poor.
Table 6.
Main metrological properties and characteristics of the strain sensors used for measurement. ✓ good to excellent, ∼ sufficient, × poor.
| Sensors | Metrological Properties | Sensor Characteristics | Applications |
|---|---|---|---|
| Resistive sensors | ✓ Sensitivity ✓ Step response time ∼ Output linearity * ✓ Accuracy | ✓ Sensor size ✓ Cost ✓ Real-time monitoring ✓/∼ Measurement intrusiveness × Sensitivity to body motion artifacts ∼ Influence of environmental factors ✓ Presence of wire | Apnea SB QB FB |
| Capacitive sensors | ✓ Sensitivity ✓ Step response time ∼ Output linearity ✓ Accuracy | ✓ Sensor size ✓ Cost ✓ Real-time monitoring ✓/∼ Measurement intrusiveness × Sensitivity to body motion artifacts ✓ Influence of environmental factors ✓ Presence of wire | Apnea SB QB FB |
| Inductive sensors | ✓ Sensitivity ✓ Step response time ∼ Output linearity ✓ Accuracy | ∼ Sensor size (around the chest) ✓ Cost ✓ Real-time monitoring ✓/∼ Measurement intrusiveness ∼ Sensitivity to body motion artifacts ✓ Influence of environmental factors ∼ Presence of wire | Apnea SB QB FB |
| Fiber-optic sensors | ✓ Sensitivity ✓ Step response time ∼ Output linearity ✓ Accuracy | ✓ Sensor size ∼ Cost ** ✓ Real-time monitoring ✓/∼ Measurement intrusiveness × Sensitivity to body motion artifacts ✓ Influence of environmental factors ∼ Presence of wire *** | Apnea SB QB FB |
* sometimes second order polynomial; ** Low cost in the case of FOSs based on intensity changes; high cost in the case of FBGs because the optical spectrum analyzer is needed; *** Systems based on FBGs require one or more wires to connect the sensors to the optical spectrum analyzer.
Table 7.
Main metrological properties and characteristics of the impedance sensors used for measurement. ✓ good to excellent, ∼ sufficient, × poor.
Table 7.
Main metrological properties and characteristics of the impedance sensors used for measurement. ✓ good to excellent, ∼ sufficient, × poor.
| Sensors | Metrological Properties | Sensor Characteristics | Applications |
|---|---|---|---|
| Impedance sensors | ✓ Sensitivity ✓ Step response time ✓ Output linearity ✓ Accuracy | ✓ Sensor size ✓ Cost ✓ Real-time monitoring ∼ Measurement intrusiveness × Sensitivity to body motion artifacts ✓ Influence of environmental factors ∼ Presence of wire * | Apnea SB QB FB |
* depending on the sensor kind.
Table 8.
Main metrological properties and characteristics of the movement sensors used for measurement. ✓ good to excellent, ∼ sufficient, × poor.
Table 8.
Main metrological properties and characteristics of the movement sensors used for measurement. ✓ good to excellent, ∼ sufficient, × poor.
| Sensors | Metrological properties | Sensor characteristics | Applications |
|---|---|---|---|
| Accelerometers | ✓ Sensitivity ✓ Step response time ✓ Output linearity ✓ Accuracy | ✓ Sensor size ✓ Cost ✓ Real-time monitoring ✓ Measurement intrusiveness × Sensitivity to body motion artifacts ✓ Influence of environmental factors ✓ Presence of wire | Apnea SB QB FB |
| Gyroscopes | ✓ Sensitivity ✓ Step response time ✓ Output linearity ✓ Accuracy | ✓ Sensor size ✓ Cost ✓ Real-time monitoring ✓ Measurement intrusiveness × Sensitivity to body motion artifacts ✓ Influence of environmental factors ✓ Presence of wire | Apnea SB QB FB |
| Magnetometers | ✓ Sensitivity ✓ Step response time ✓ Output linearity ✓ Accuracy | ✓ Sensor size ✓ Cost ✓ Real-time monitoring ✓ Measurement intrusiveness × Sensitivity to body motion artifacts ∼ Influence of environmental factors ✓ Presence of wire | Apnea SB QB FB |
Table 9.
Main metrological properties and characteristics of the biopotential and light intensity sensors used for measurement. ✓ good to excellent, ∼ sufficient, × poor.
Table 9.
Main metrological properties and characteristics of the biopotential and light intensity sensors used for measurement. ✓ good to excellent, ∼ sufficient, × poor.
| Sensors | Metrological Properties | Sensor Characteristics | Applications |
|---|---|---|---|
| ECG sensors | ✓ Sensitivity ✓ Step response time ✓ Output linearity ∼ Accuracy * | ✓ Sensor size ∼ Cost * ✓ Real-time monitoring ∼ Measurement intrusiveness ∼ Sensitivity to body motion artifacts ∼ Influence of environmental factors ∼ Presence of wire ** | Apnea SB QB FB |
| PPG sensors | ✓ Sensitivity ✓ Step response time ✓ Output linearity ∼ Accuracy | ✓ Sensor size ✓ Cost ✓ Real-time monitoring ✓ Measurement intrusiveness × Sensitivity to body motion artifacts *** ✓ Influence of environmental factors ✓ Presence of wire | Apnea SB QB FB |
* it depends on the ECG measuring system; 12-leads medical grade ECG system used in the clinical practice costs over 2000 euro; ** wireless, wearable and implantable ECG measuring systems do not present wires and cables; *** strongly influenced by the body site on which the PPG sensor is positioned (earlobe, finger, etc...).
Table 10.
Suitability of the different contact-based techniques for monitoring in three main fields of application (i.e., clinical settings, occupational settings, and sport and exercise). Each of the three fields has been divided into two parts: part A assesses the suitability in more controlled or structured environments; part B assesses the suitability in less structured or controlled environments. Main advantages and main disadvantages of the different contact-based techniques for monitoring are also reported. ✓ good to excellent, ∼ sufficient, × poor.
| CLINICAL | SETTINGS | OCCUPATIONAL | SETTINGS | SPORT AND | EXERCISE | |||
|---|---|---|---|---|---|---|---|---|
| CONTACT-BASED TECHNIQUE | A | B | A | B | A | B | Main Advantages | Main Disadvantages |
| Respiratory airflow | ✓ | ∼ | ✓ | ∼ | ✓ | ∼ | Accuracy | Intrusiveness |
| Respiratory sounds | ∼ | ∼ | ∼ | × | ∼ | × | Unobtrusiveness | Environmental influence |
| Air temperature | ✓ | ∼ | ∼ | × | ∼ | × | Sensitivity | Intrusiveness |
| Air humidity | ∼ | ∼ | ∼ | × | ∼ | × | Low sensitivity to motion artifacts | Intrusiveness |
| Air components | ✓ | ∼ | ✓ | × | ∼ | × | Accuracy | Intrusiveness |
| Strain measurements | ✓ | ✓ | ✓ | ✓ | ✓ | ✓ | Unobtrusiveness | Motion artifacts |
| Impedance measurements | ✓ | ∼ | ✓ | × | ∼ | × | Unobtrusiveness | Motion artifacts |
| Movement measurements | ∼ | ∼ | ∼ | ∼ | ∼ | × | Unobtrusiveness | Motion artifacts |
| Biopotential measurements (i.e., ECG) | ✓ | ∼ | ∼ | × | ∼ | × | Unobtrusiveness | Motion artifacts |
| Light intensity measurements (i.e., PPG) | ✓ | ∼ | ∼ | × | ∼ | × | Unobtrusiveness | Motion artifacts |
Clinical Settings: A = hospital; B = home/daily activity monitoring. Occupational Settings: A = indoor/structured environment; B = outdoor or unstructured environment. Sport and Exercise: A = indoor/structured environment; B = outdoor or unstructured environment.
© 2019 by the authors. Licensee MDPI, Basel, Switzerland. This article is an open access article distributed under the terms and conditions of the Creative Commons Attribution (CC BY) license (http://creativecommons.org/licenses/by/4.0/).
Share and Cite
MDPI and ACS Style
Massaroni, C.; Nicolò, A.; Lo Presti, D.; Sacchetti, M.; Silvestri, S.; Schena, E. Contact-Based Methods for Measuring Respiratory Rate. Sensors 2019, 19, 908. https://0-doi-org.brum.beds.ac.uk/10.3390/s19040908
AMA Style
Massaroni C, Nicolò A, Lo Presti D, Sacchetti M, Silvestri S, Schena E. Contact-Based Methods for Measuring Respiratory Rate. Sensors. 2019; 19(4):908. https://0-doi-org.brum.beds.ac.uk/10.3390/s19040908
Chicago/Turabian StyleMassaroni, Carlo, Andrea Nicolò, Daniela Lo Presti, Massimo Sacchetti, Sergio Silvestri, and Emiliano Schena. 2019. "Contact-Based Methods for Measuring Respiratory Rate" Sensors 19, no. 4: 908. https://0-doi-org.brum.beds.ac.uk/10.3390/s19040908
Note that from the first issue of 2016, this journal uses article numbers instead of page numbers. See further details here.