Vision System for Automatic On-Tree Kiwifruit Counting and Yield Estimation

 ,
,  and
and
Abstract
:1. Introduction
- -
- An automatic vision-based system for kiwifruit counting and yield estimation.
- -
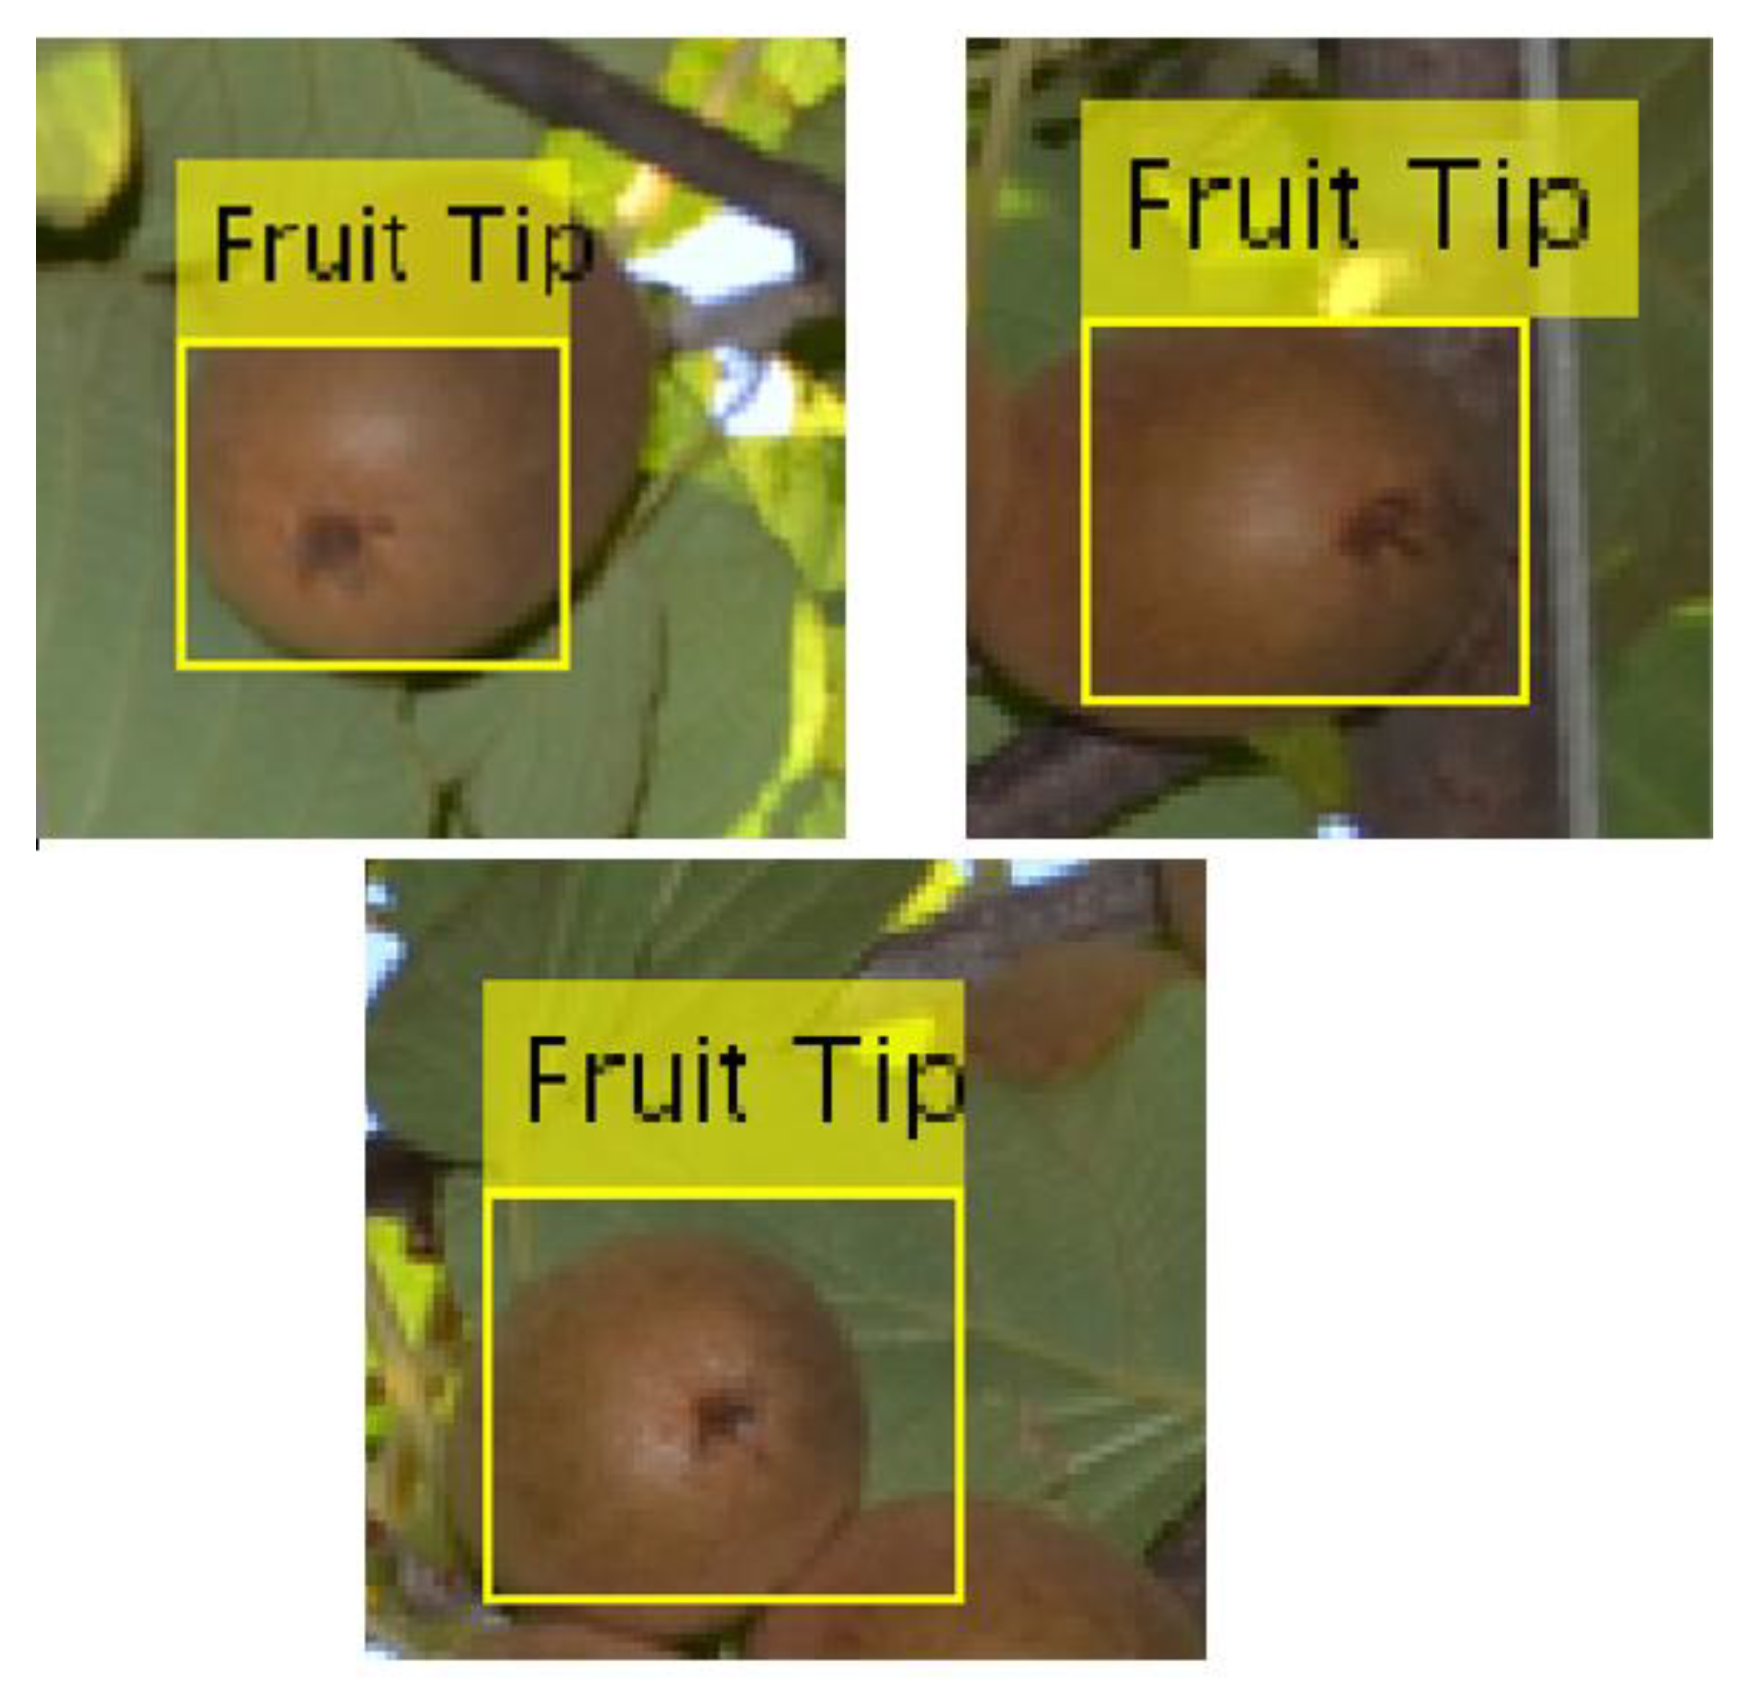
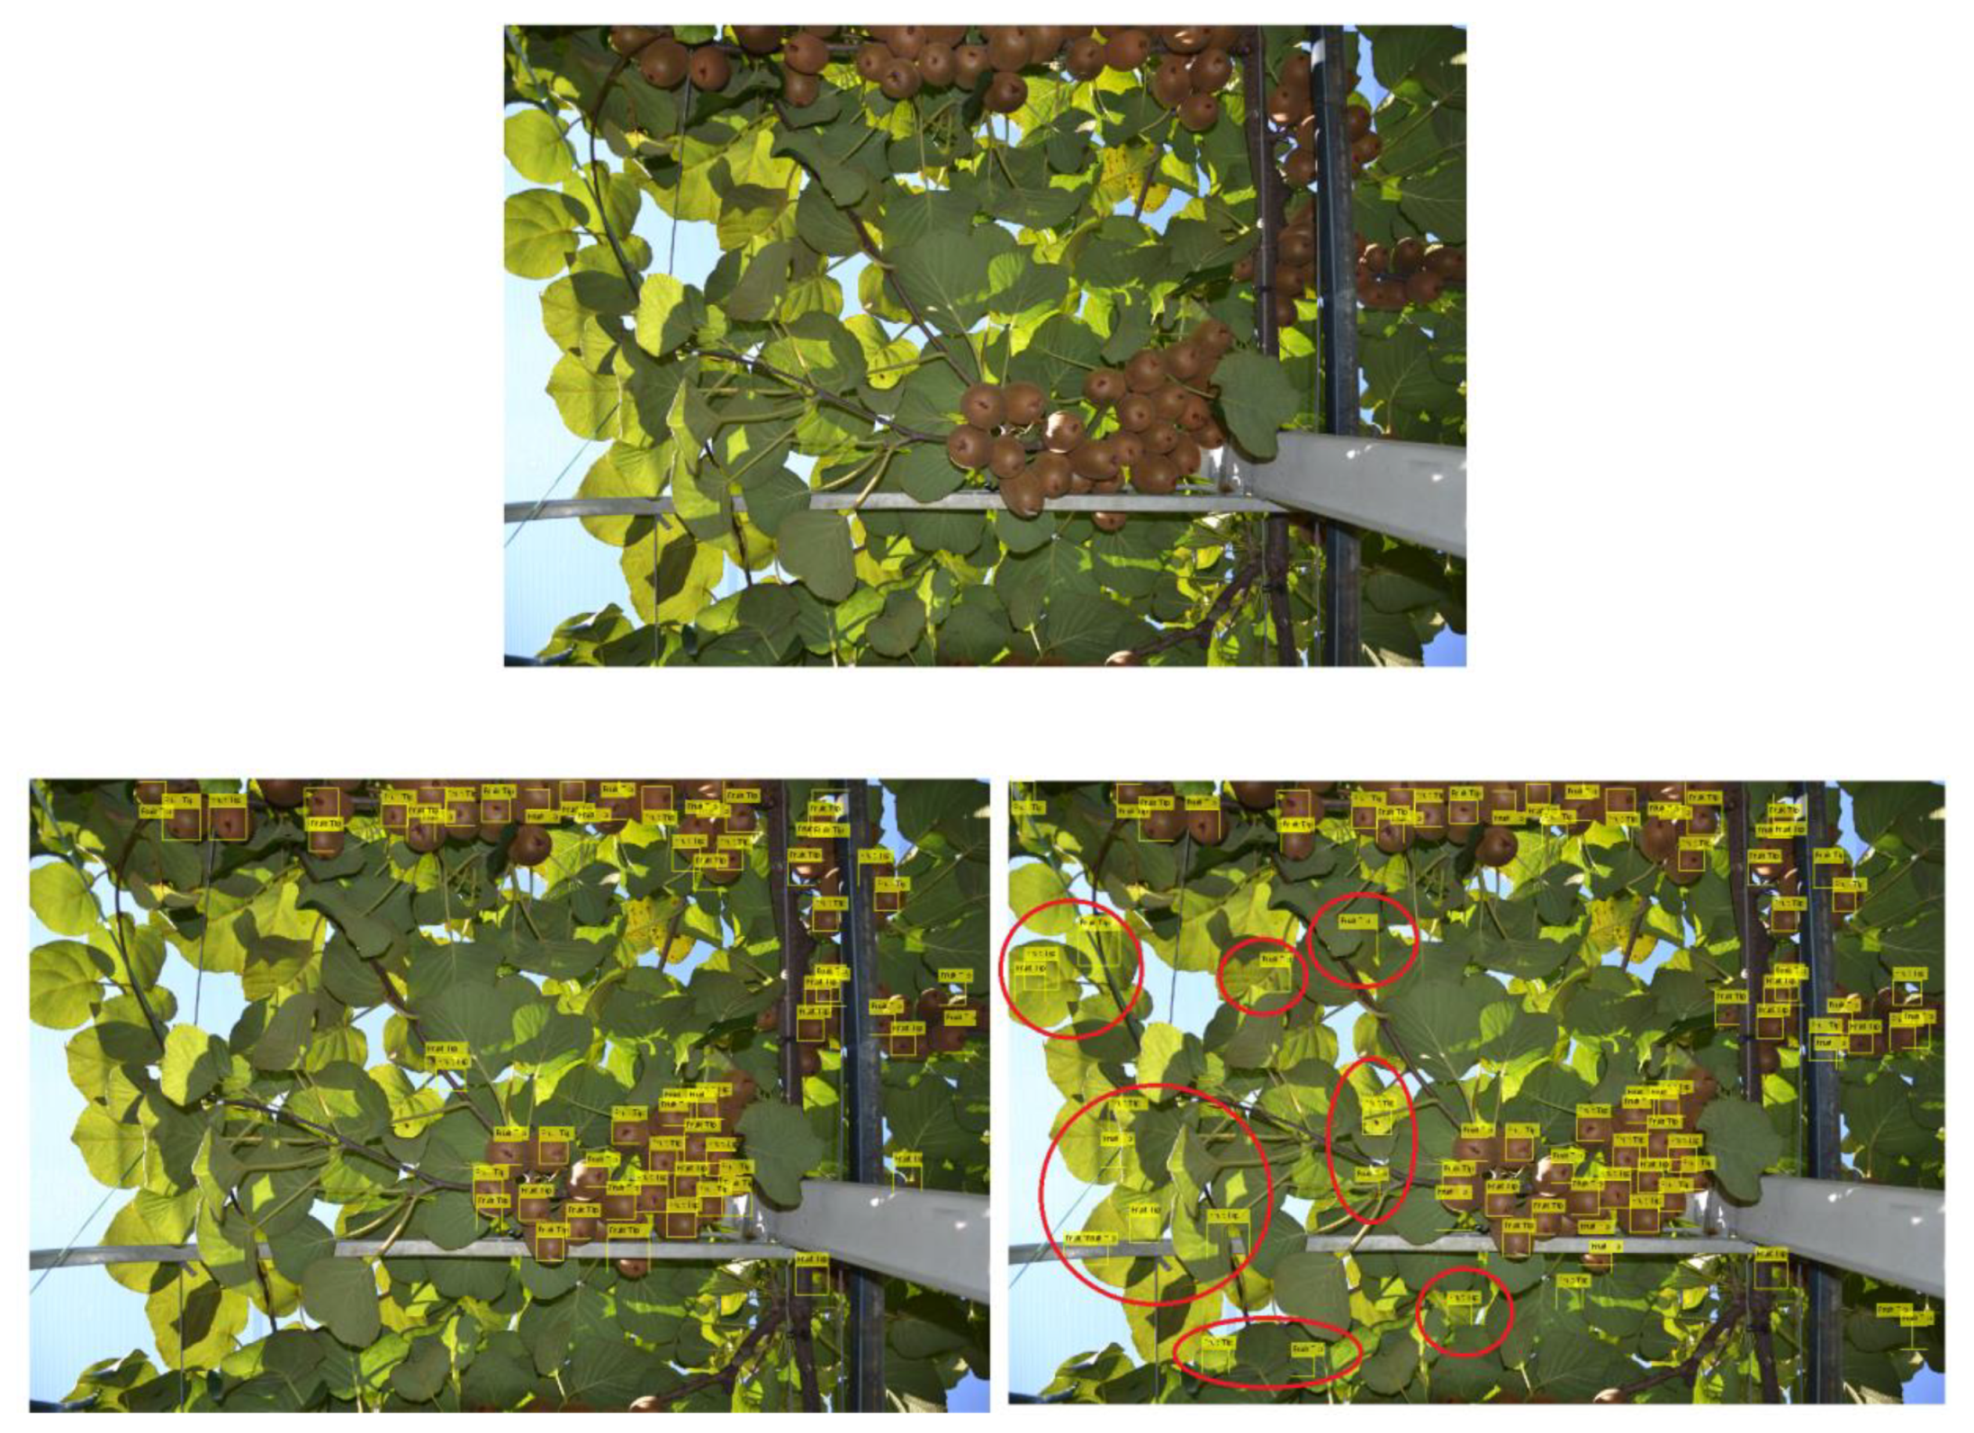
- To increase the robustness of the fruit detection pipeline, we emphasize on the kiwifruit tip instead of the whole fruit which may manifest various shapes, orientations, and occlusions.
- -
- Instead of addressing only the fruit counting issue, we further assess the fruit yield and confront our findings with real data.
- -
- Development of a user-friendly kiwifruit yield estimation interface that functions in two modes. The first one consists in a standalone application, whereas the second one is web based.
2. Materials and Methods
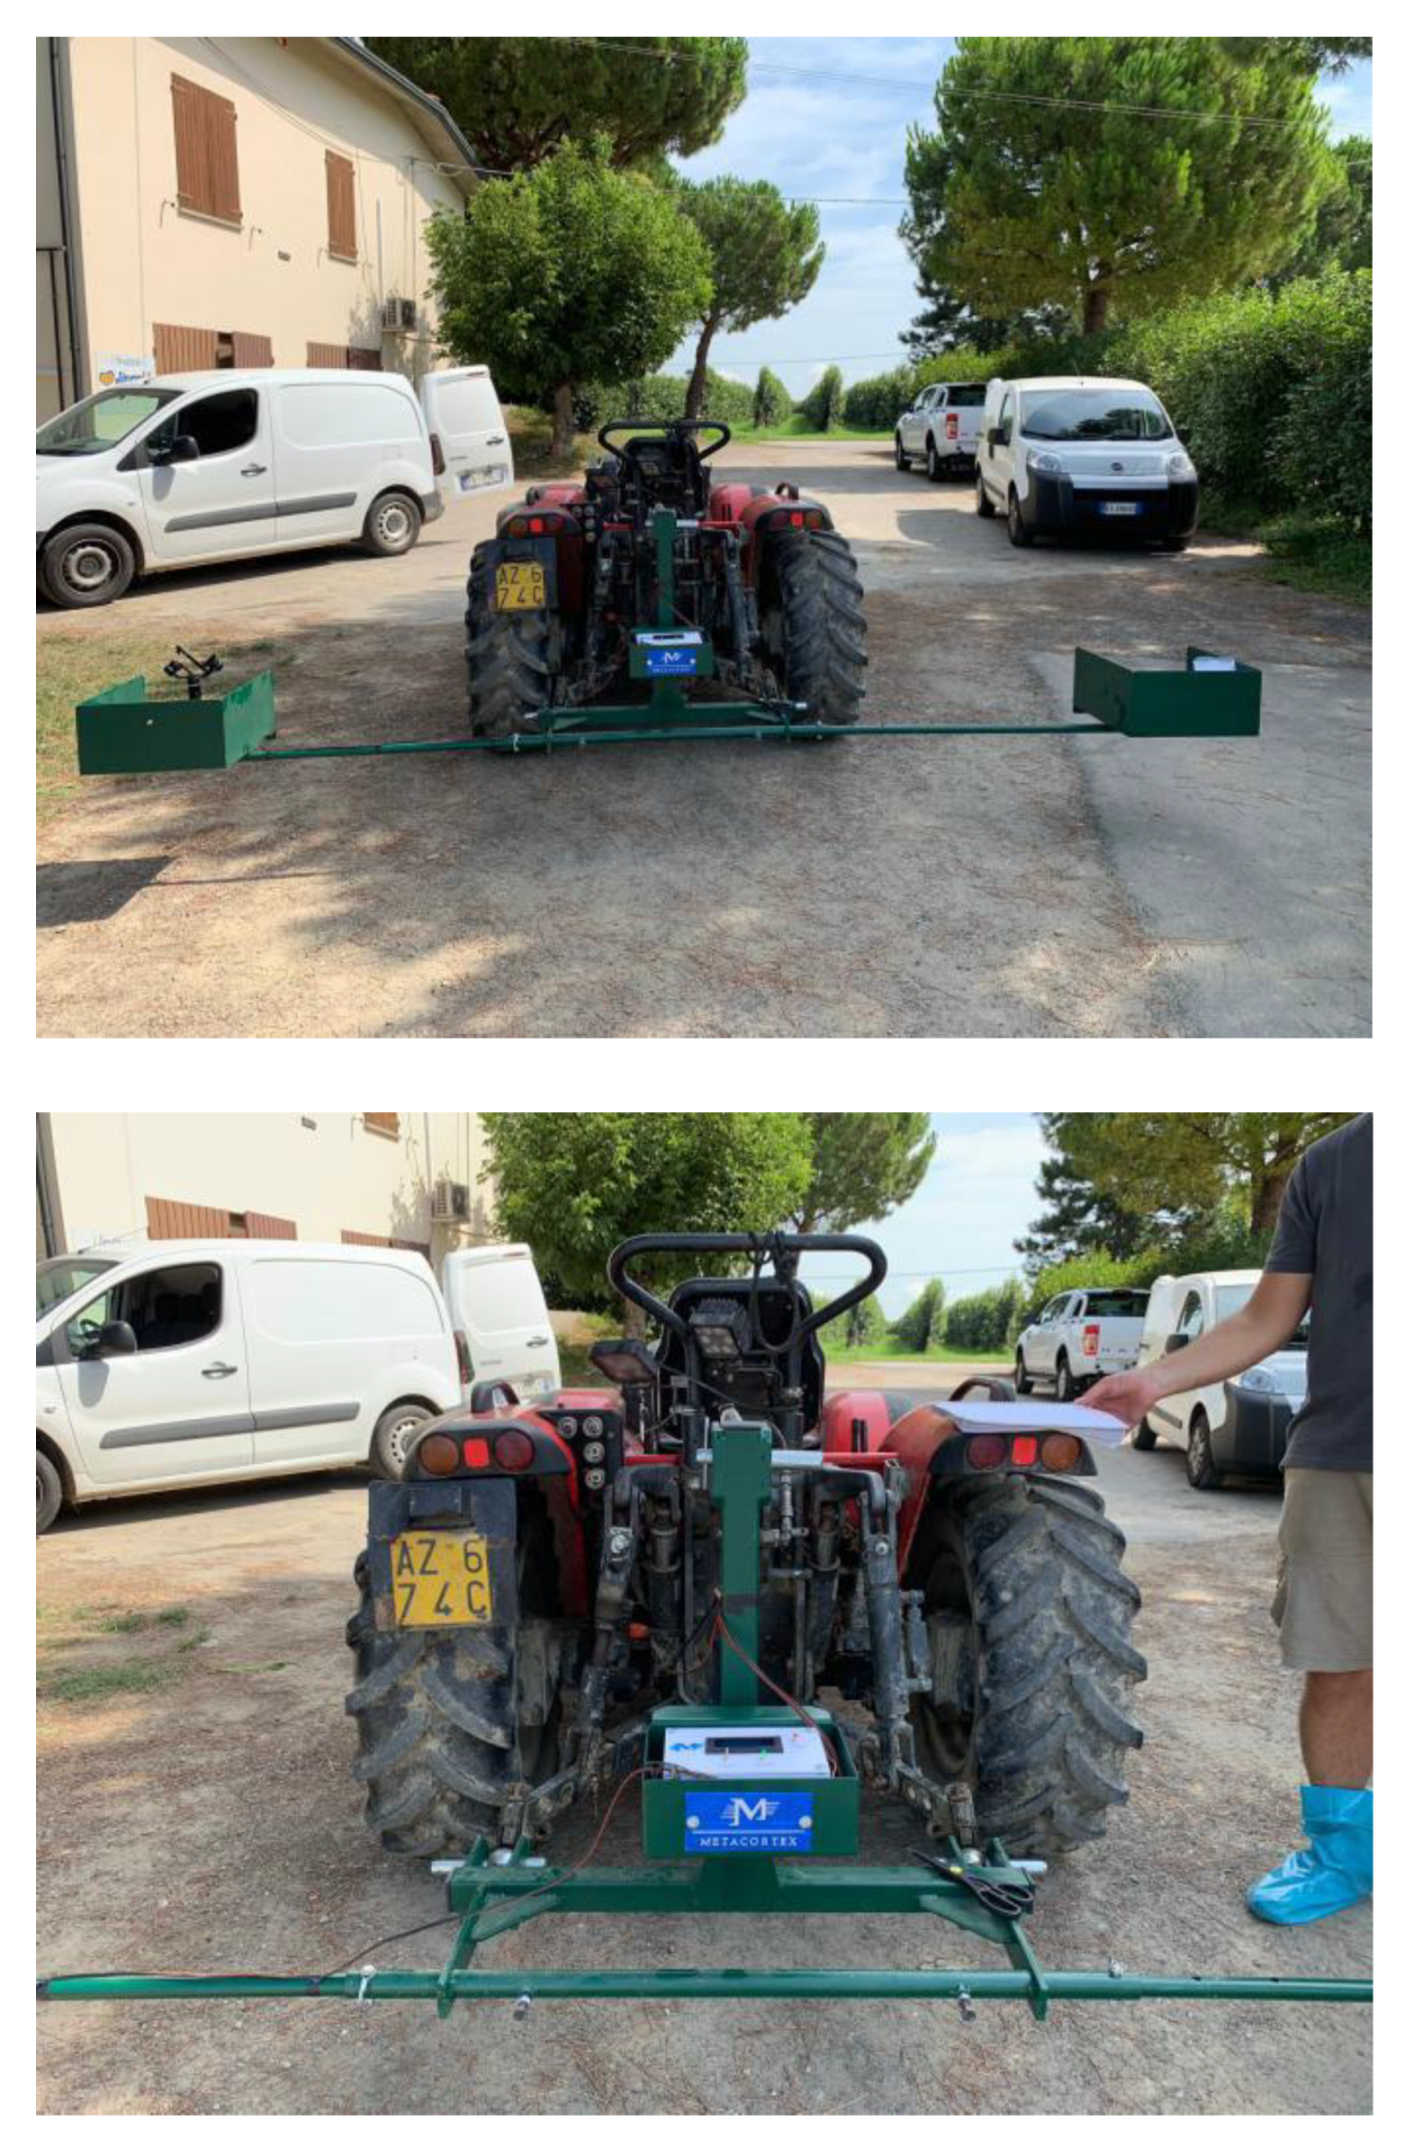
2.1. Prototype Description
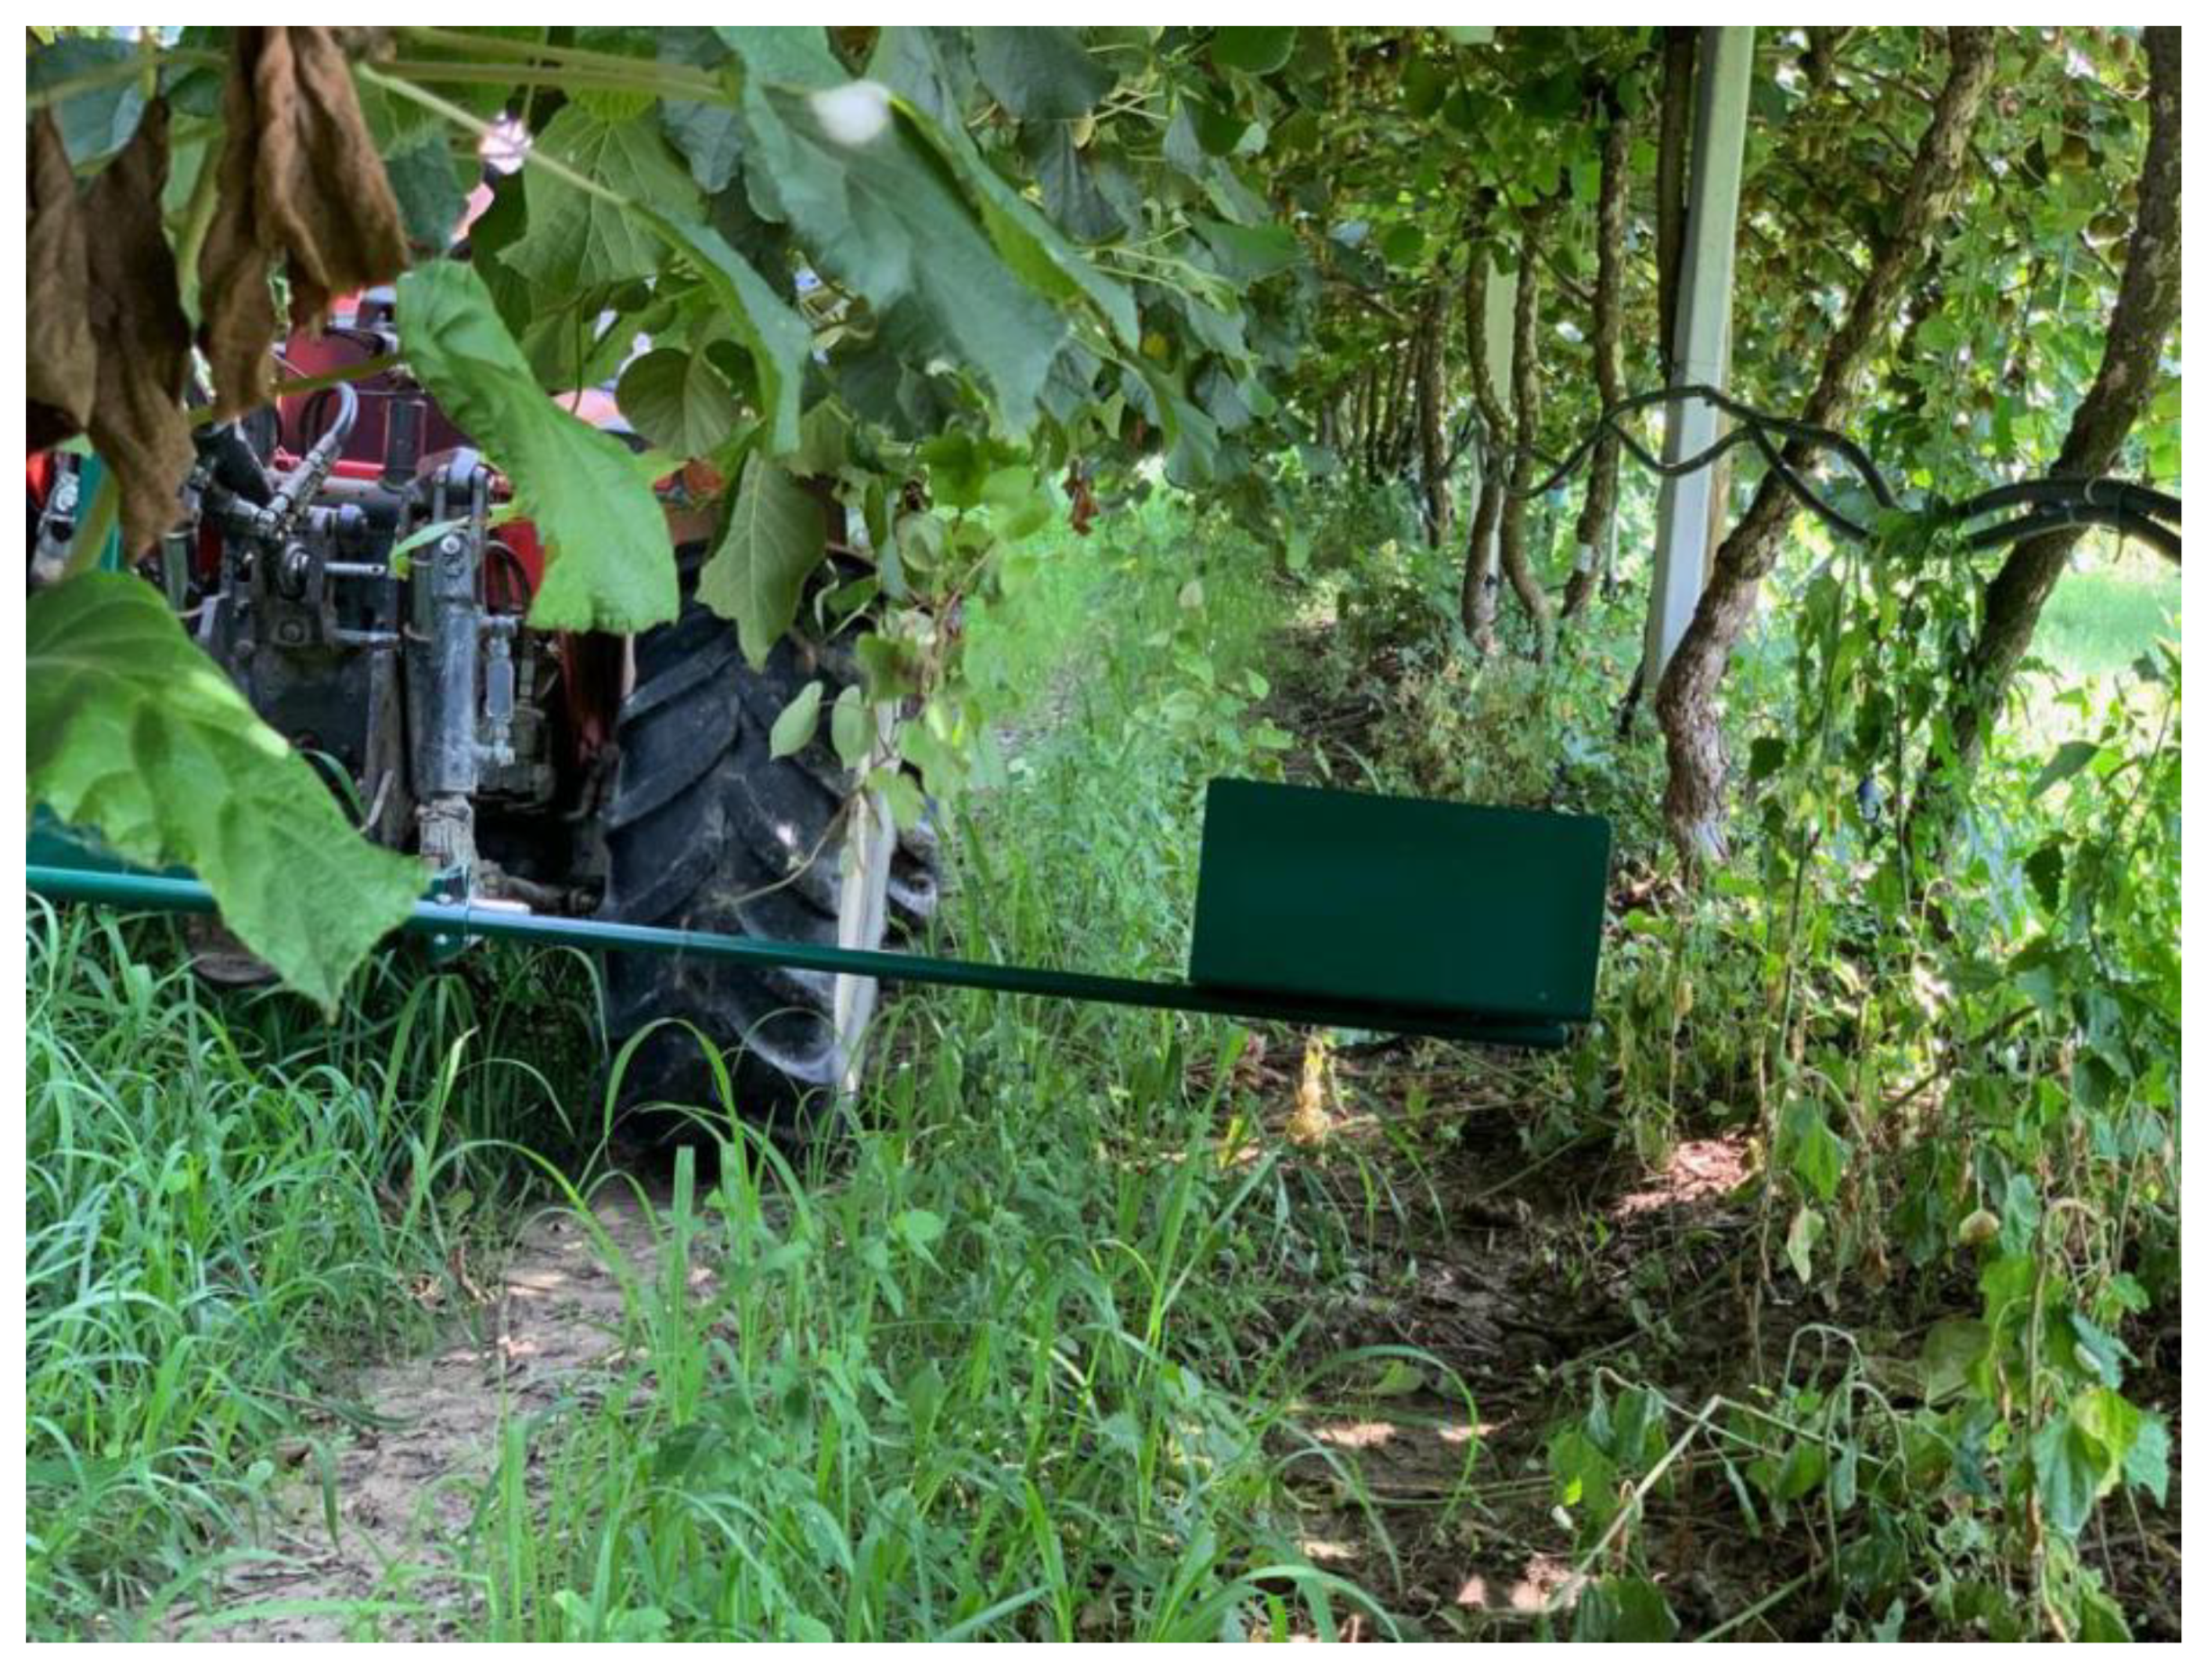
- -
- A horizontal bar that carries the other components, which can be attached/detached to/from the tractor. It is placed at the rear of the tractor by means of a three-point hitch.
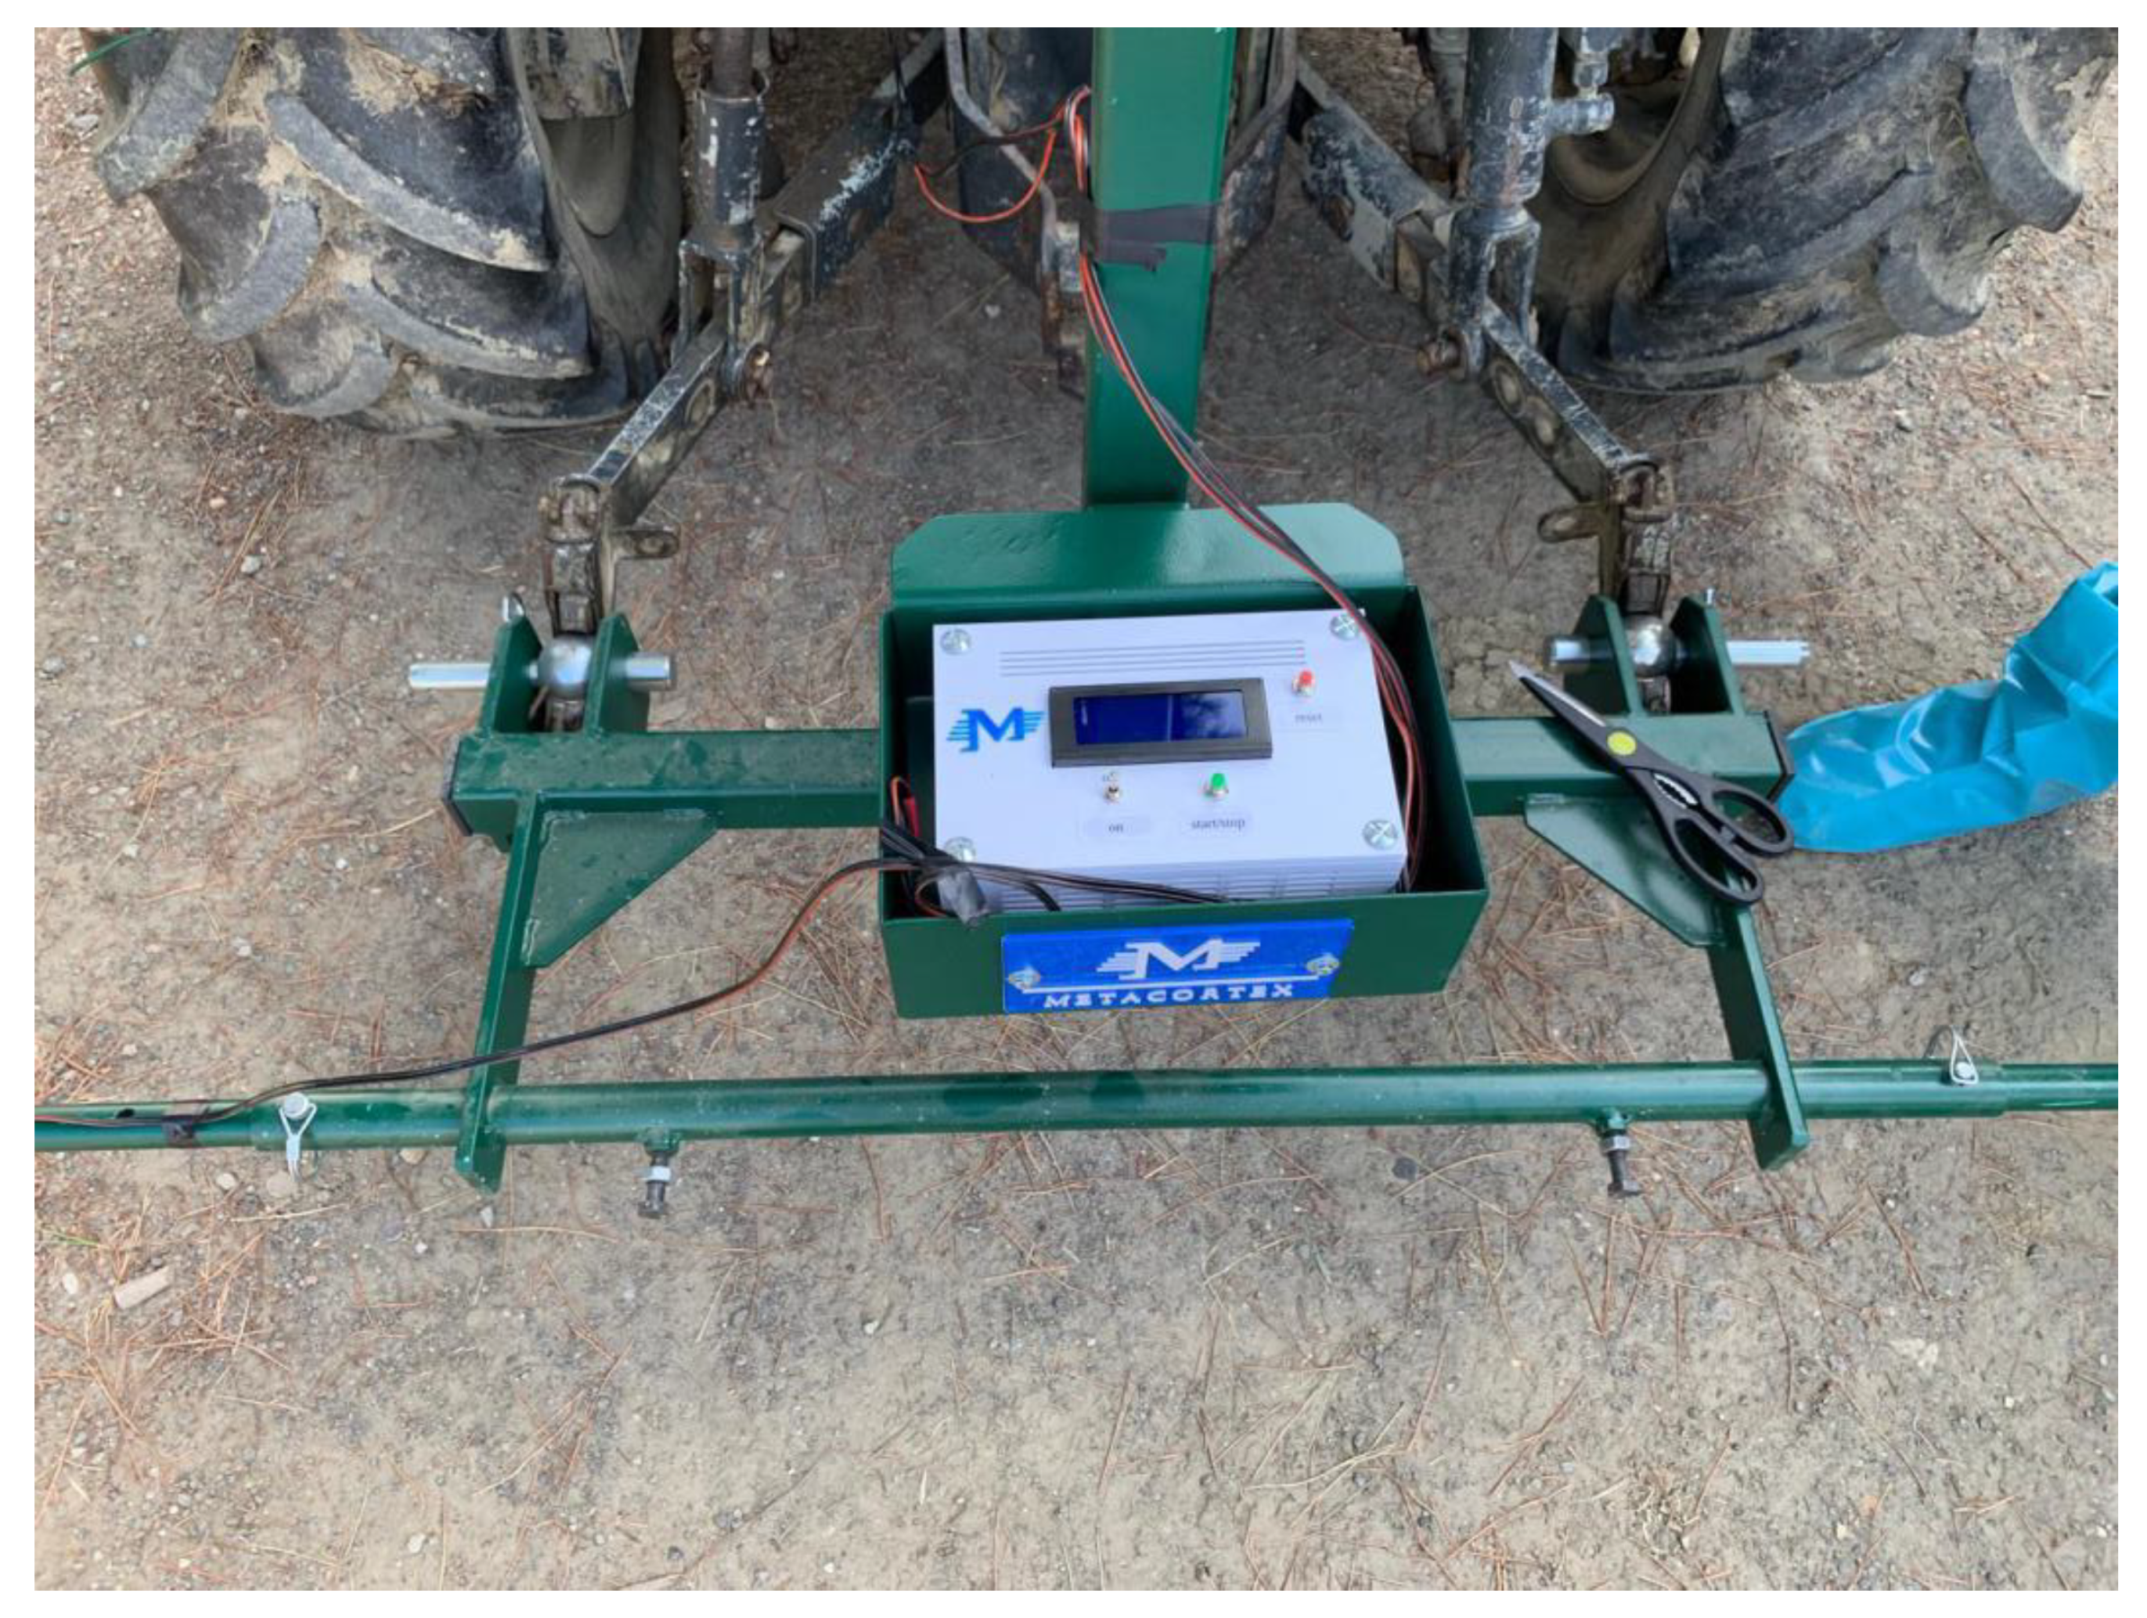
- -
- GPS module, as depicted in Figure 2, in order to save the location of the surveyed orchard, which is implemented with Arduino.
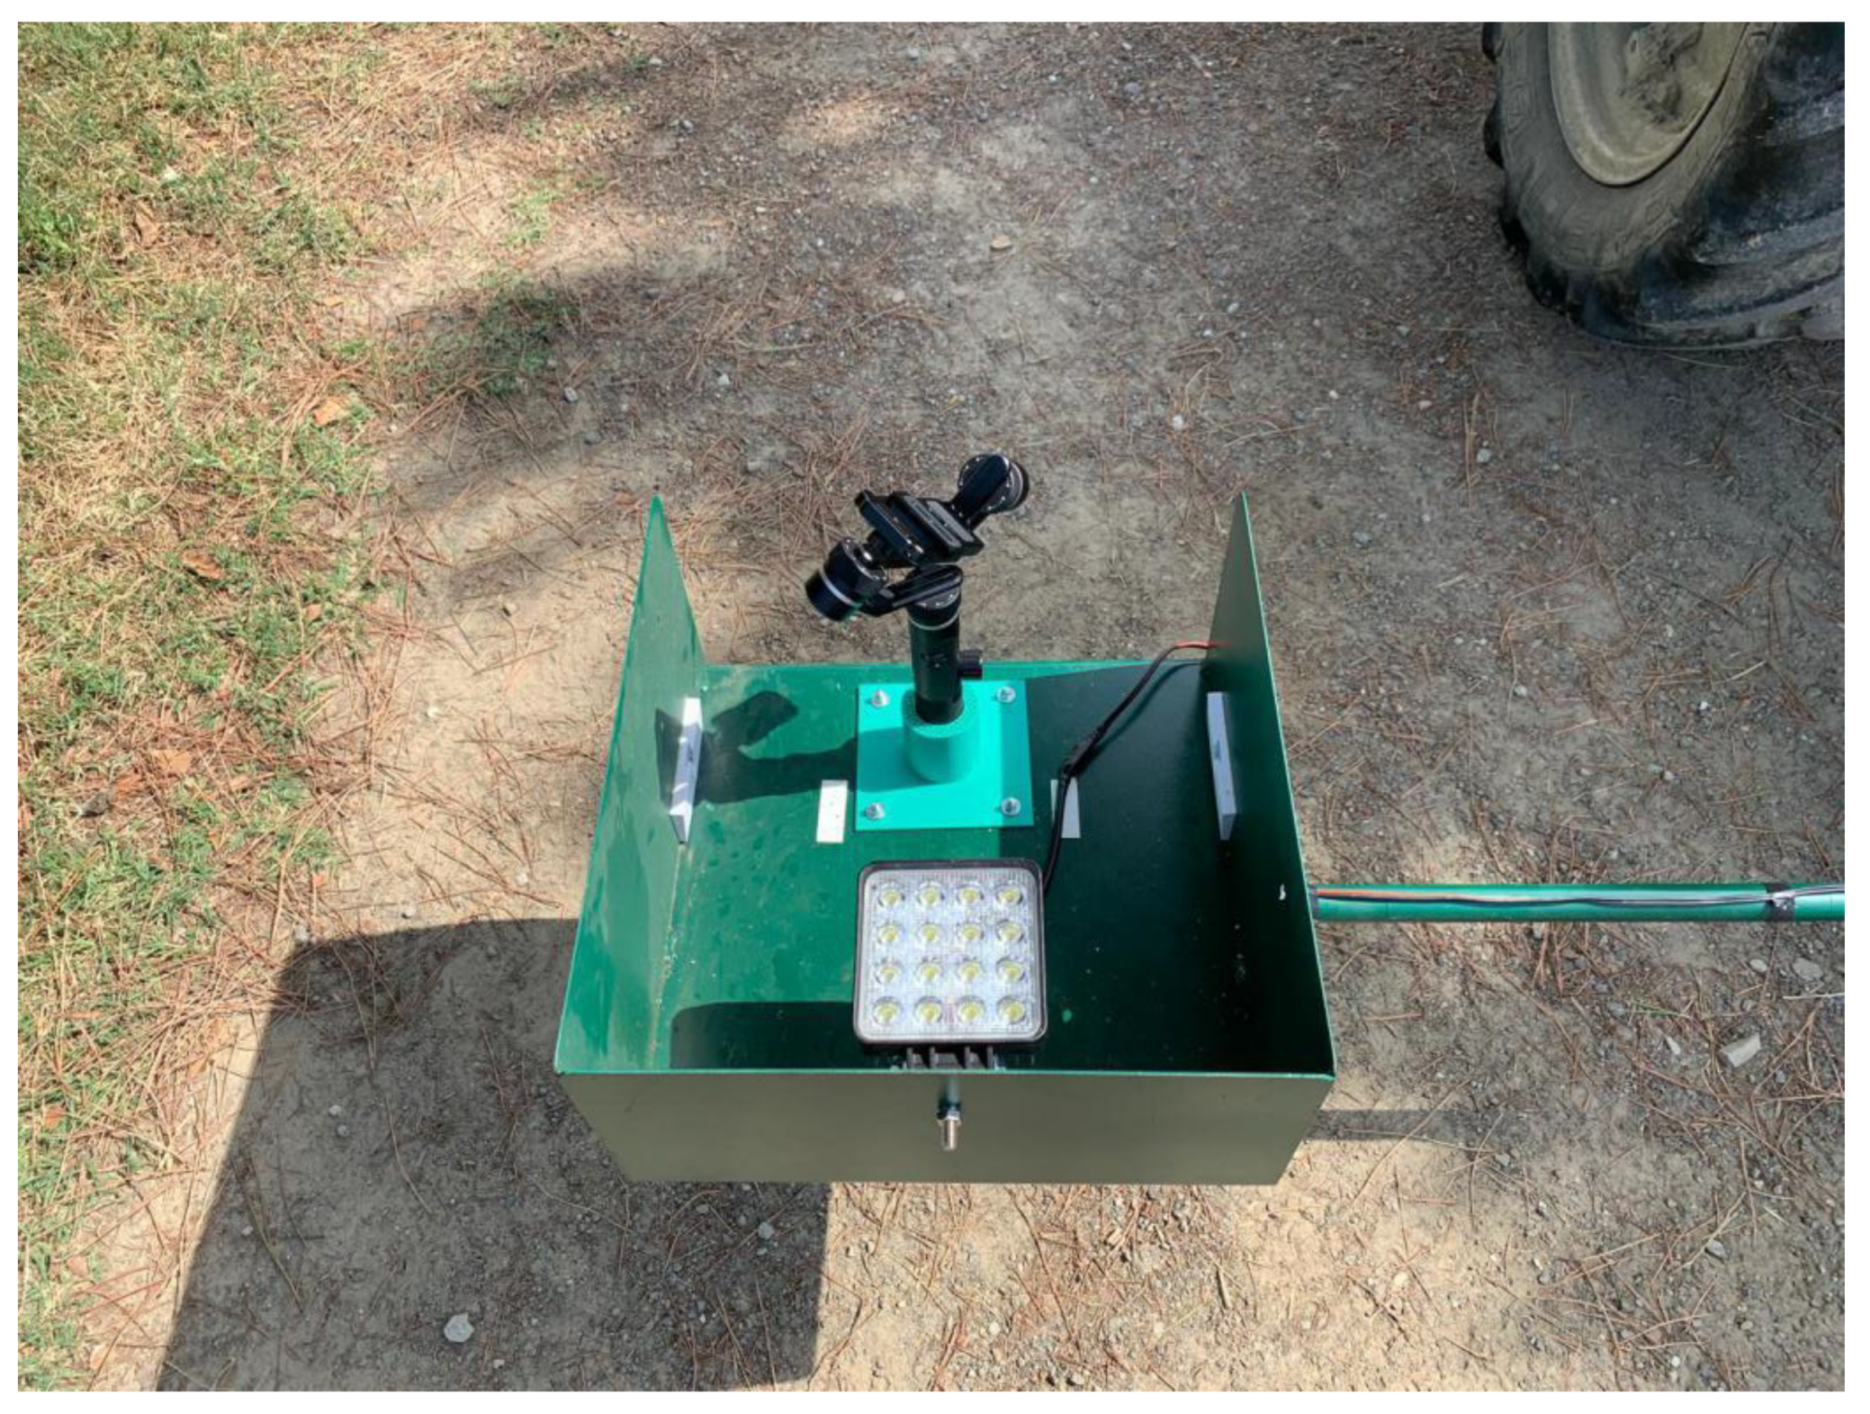
- -
- LED projector (48 Watt, 3800 lm) powered with 12 V via the electric socket of the tractor. The LED is attached to the bar with a fastener and serves for illuminating the inner canopy of the kiwi trees due to the limited sunlight penetration through the leaves, as illustrated in Figure 3.
- -
- Gimbal Feiyu G6 Plus to support and stabilize the camera against sudden tilts owing to the tractor’s vibrations as well as the rough nature of the terrain, as displayed in Figure 3.
- -
- Support to attach the Gimbal on the bar (printed with a 3D printer “FlashForge Creator Pro” using a polylactic acid thread of 1.75 mm diameter), as shown in Figure 3 (i.e., the green piece).
- -
- Camera (Sony Alpha 5100 of 24 MP) mounted on the support of the Gimbal.
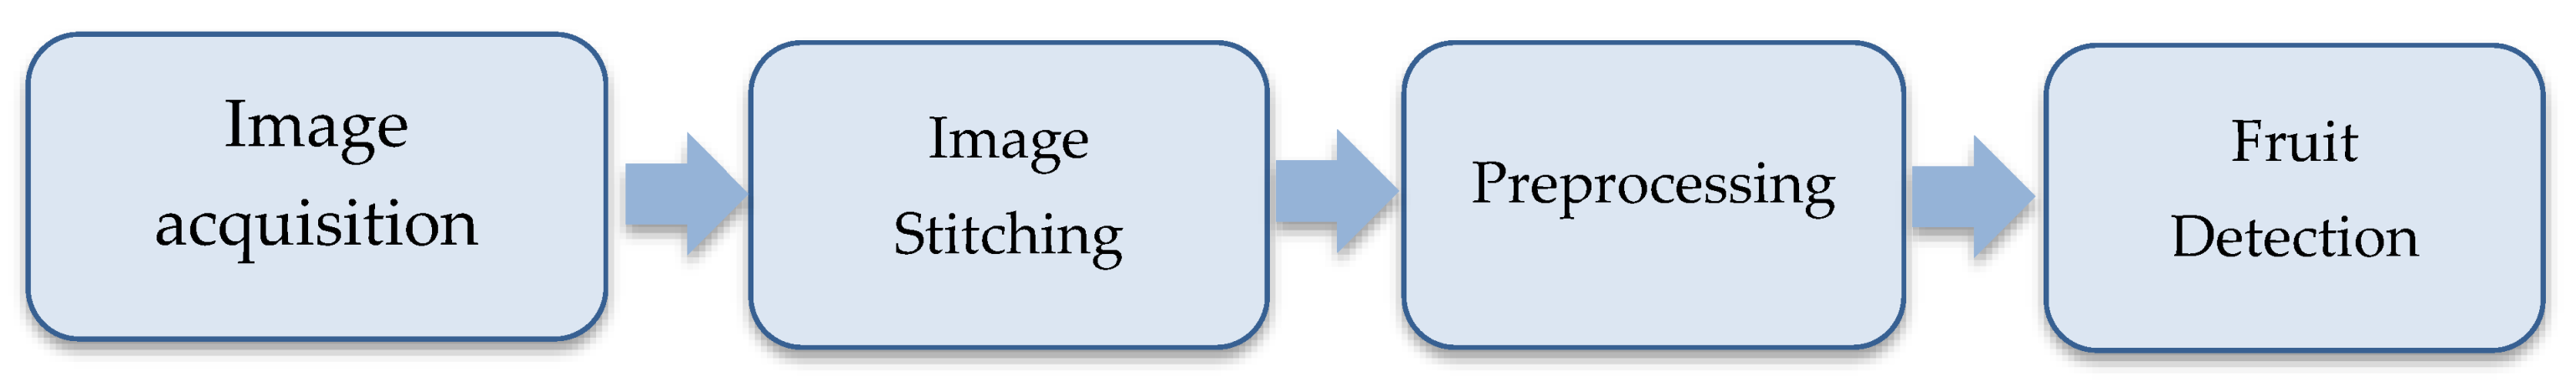
2.2. Fruit Detection Method
2.2.1. Detection Pipeline
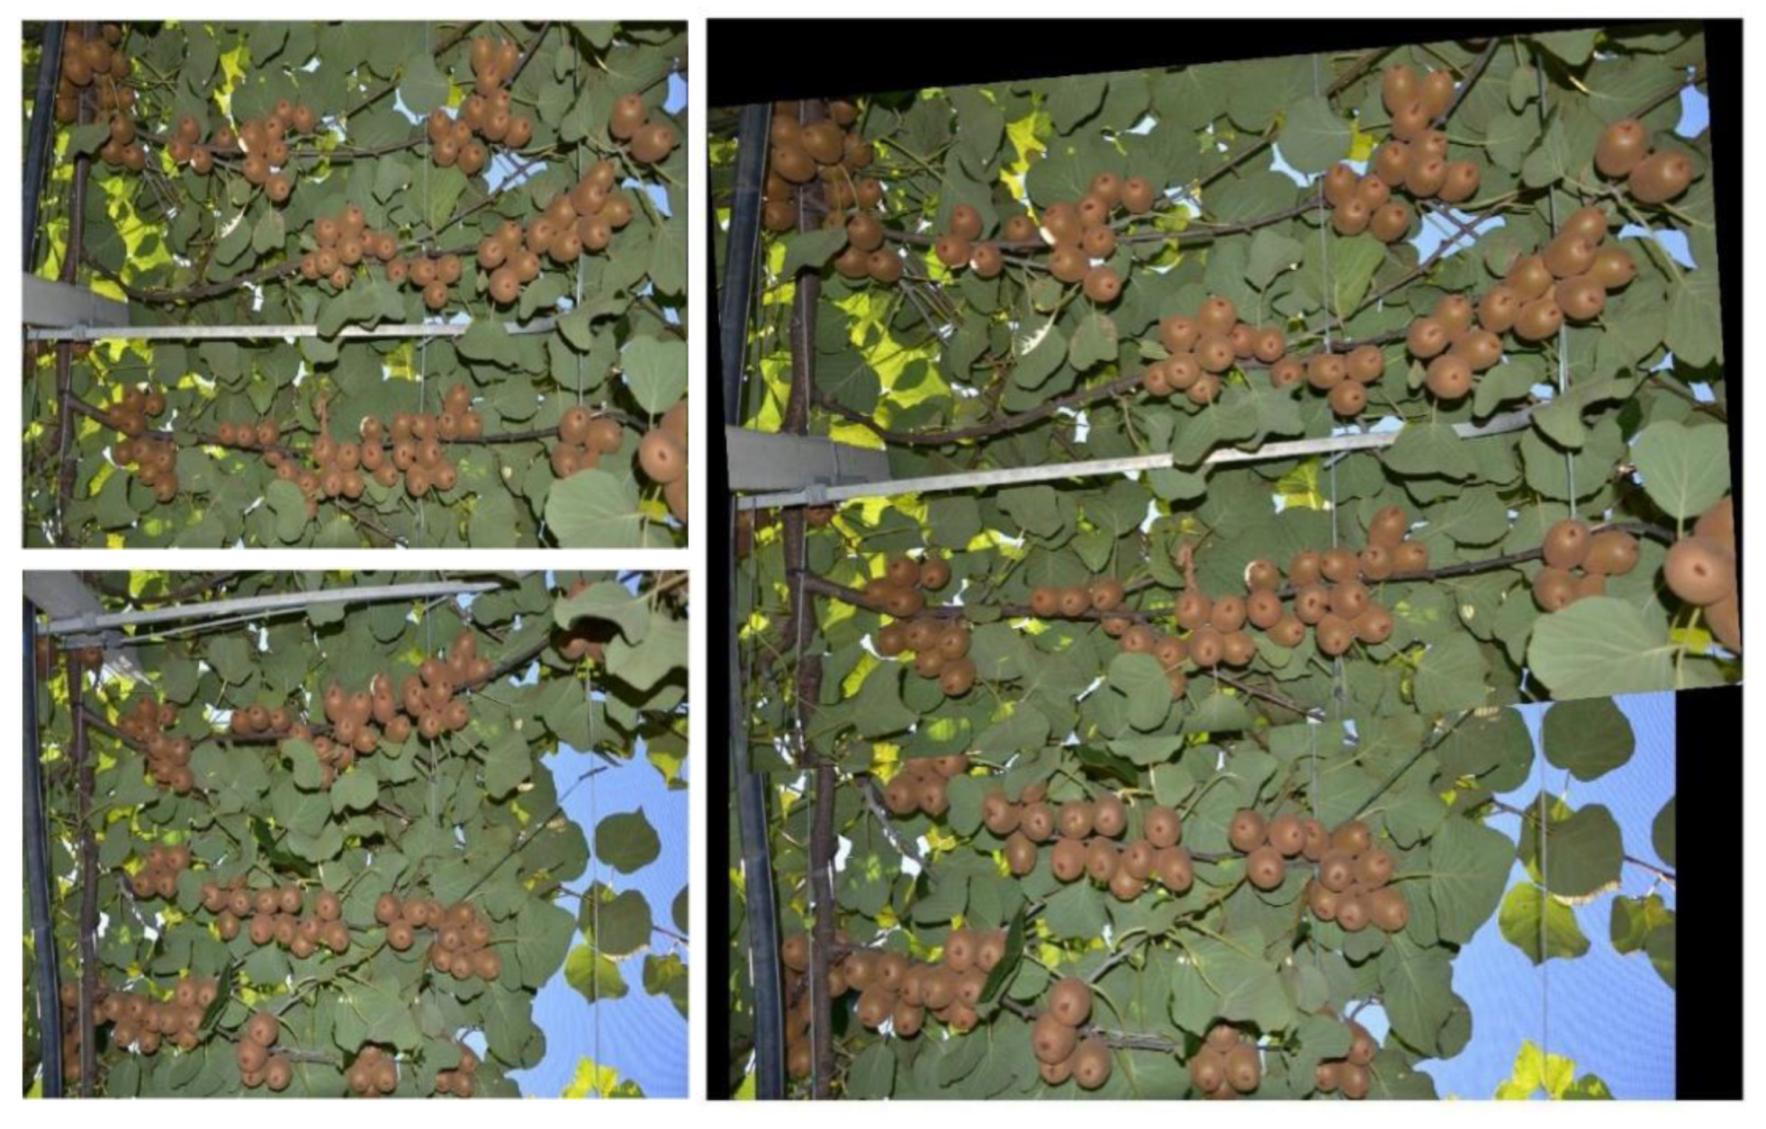
2.2.2. Image Stitching
- SURF feature extraction from both of the images.
- SURF feature matching across both of the images based on Euclidean distance.
- Apply the Random Sample Consensus (RANSAC) algorithm [29] on the matched feature set to estimate a homography matrix.
- Apply an image warping transformation using the homography matrix that was estimated in the previous step.
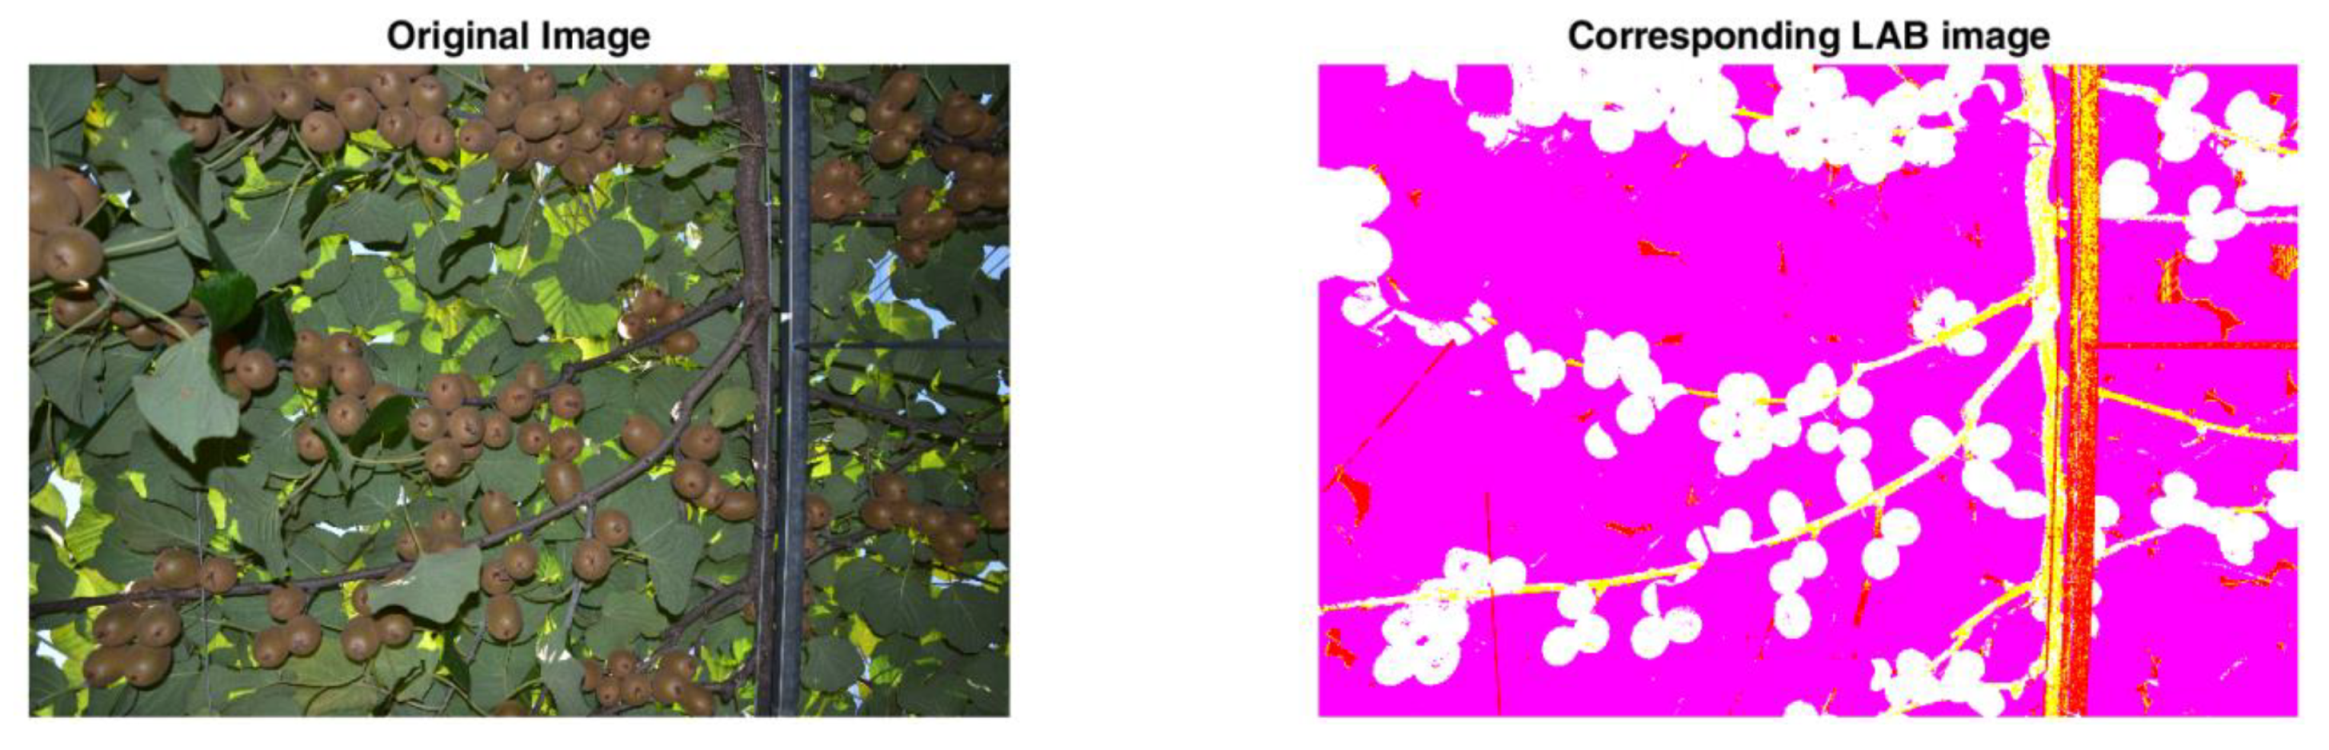
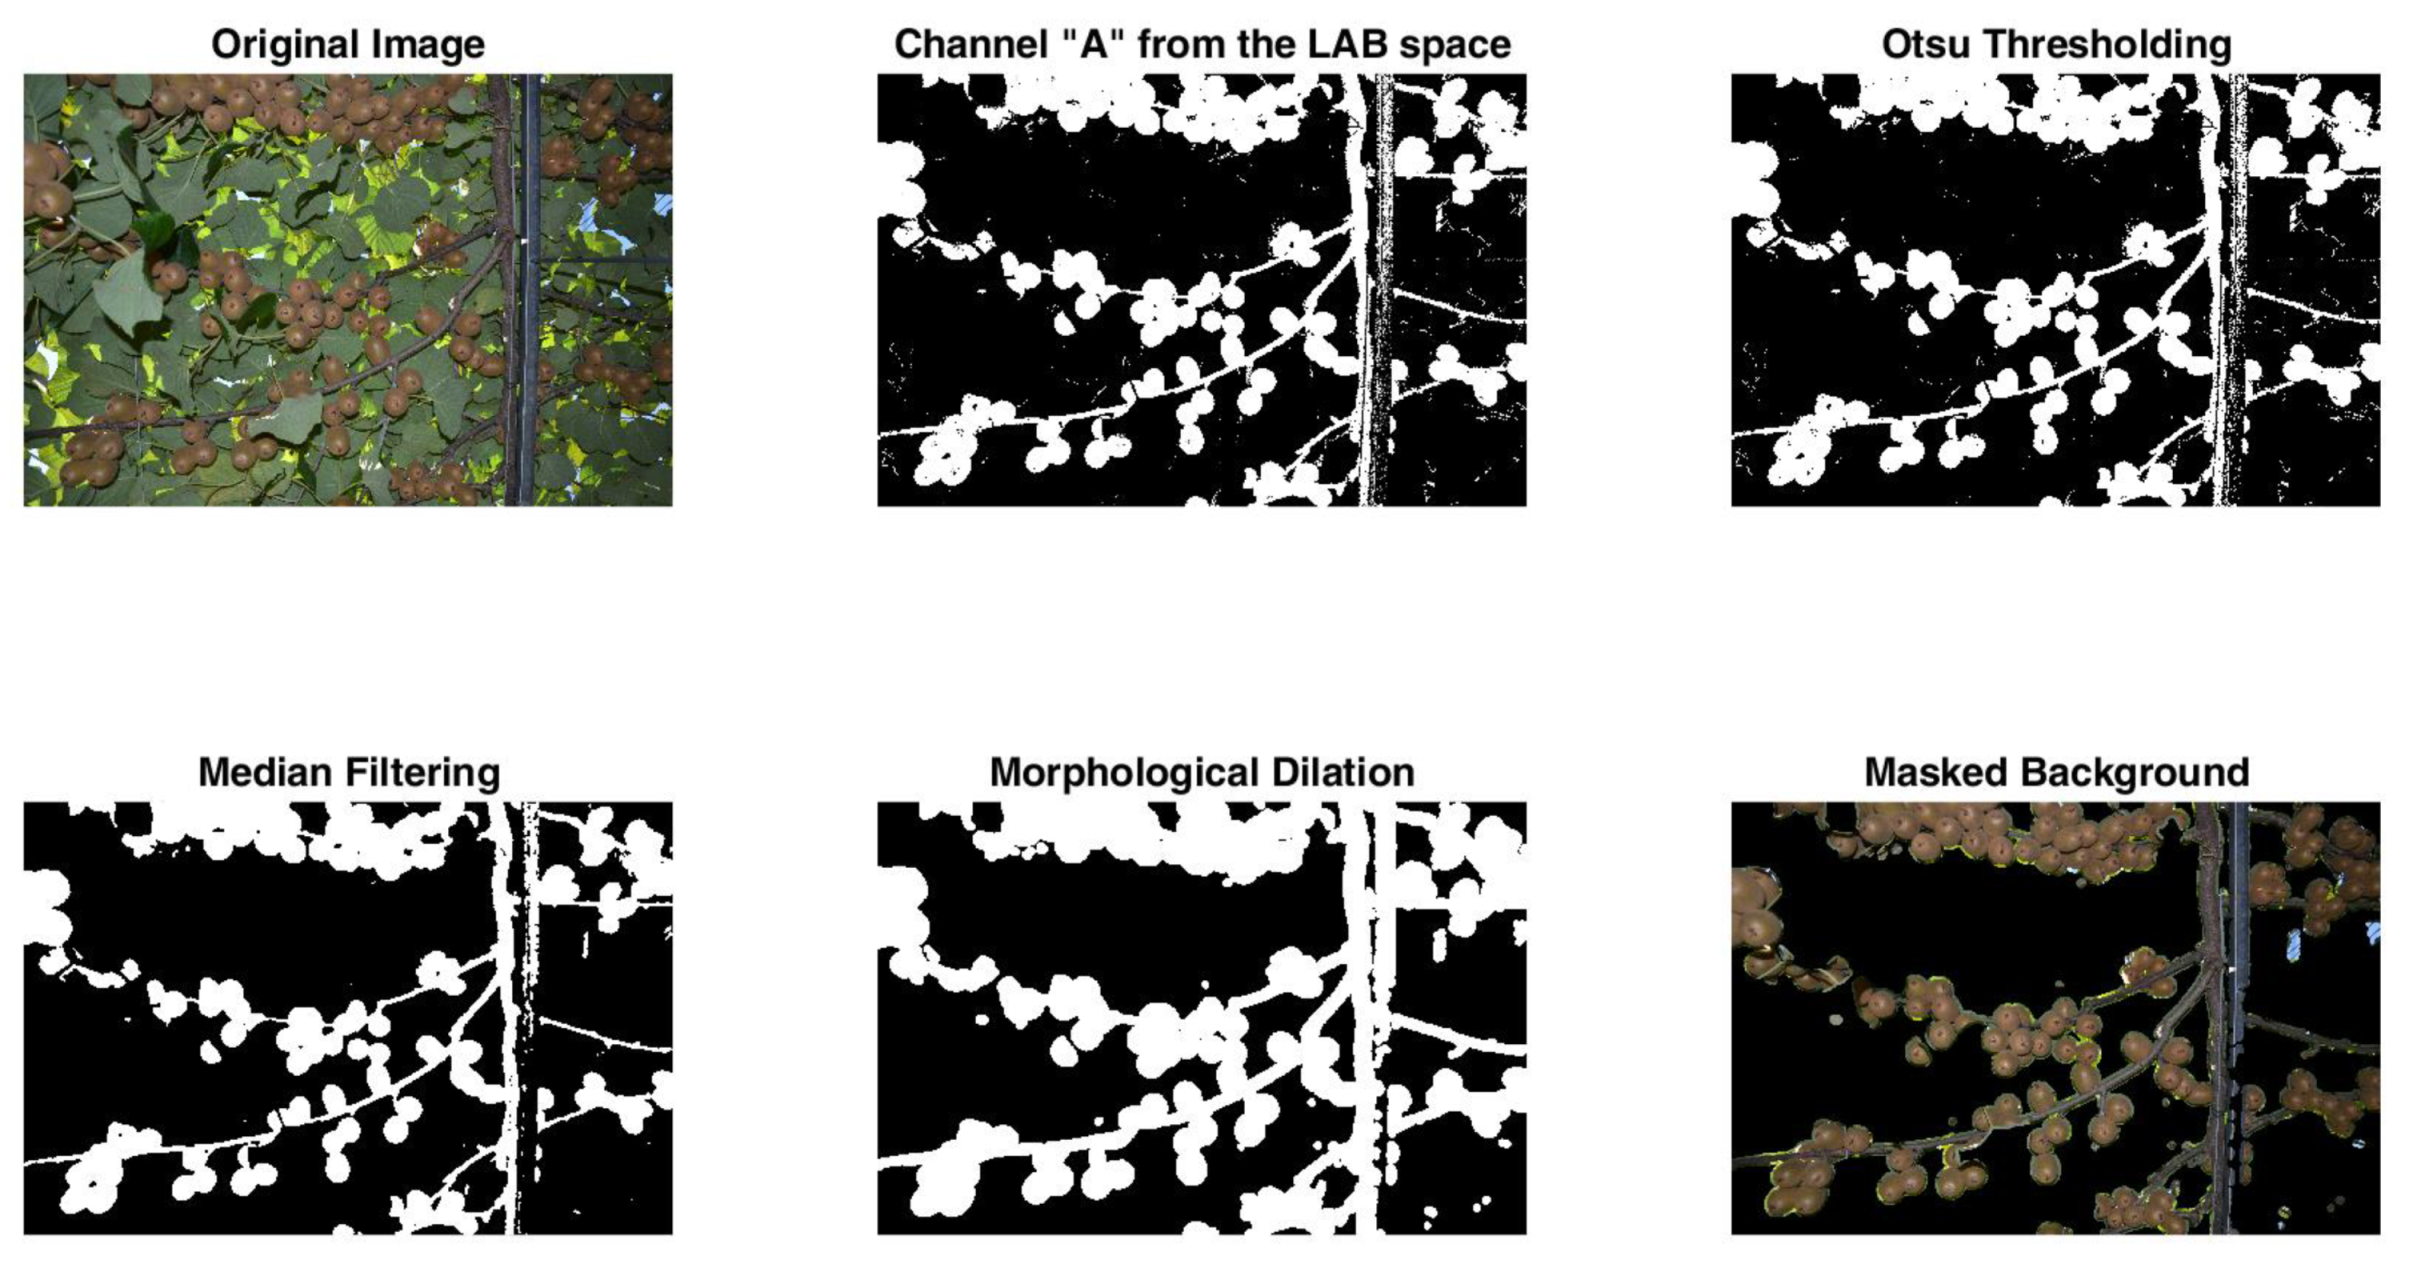
2.2.3. Preprocessing
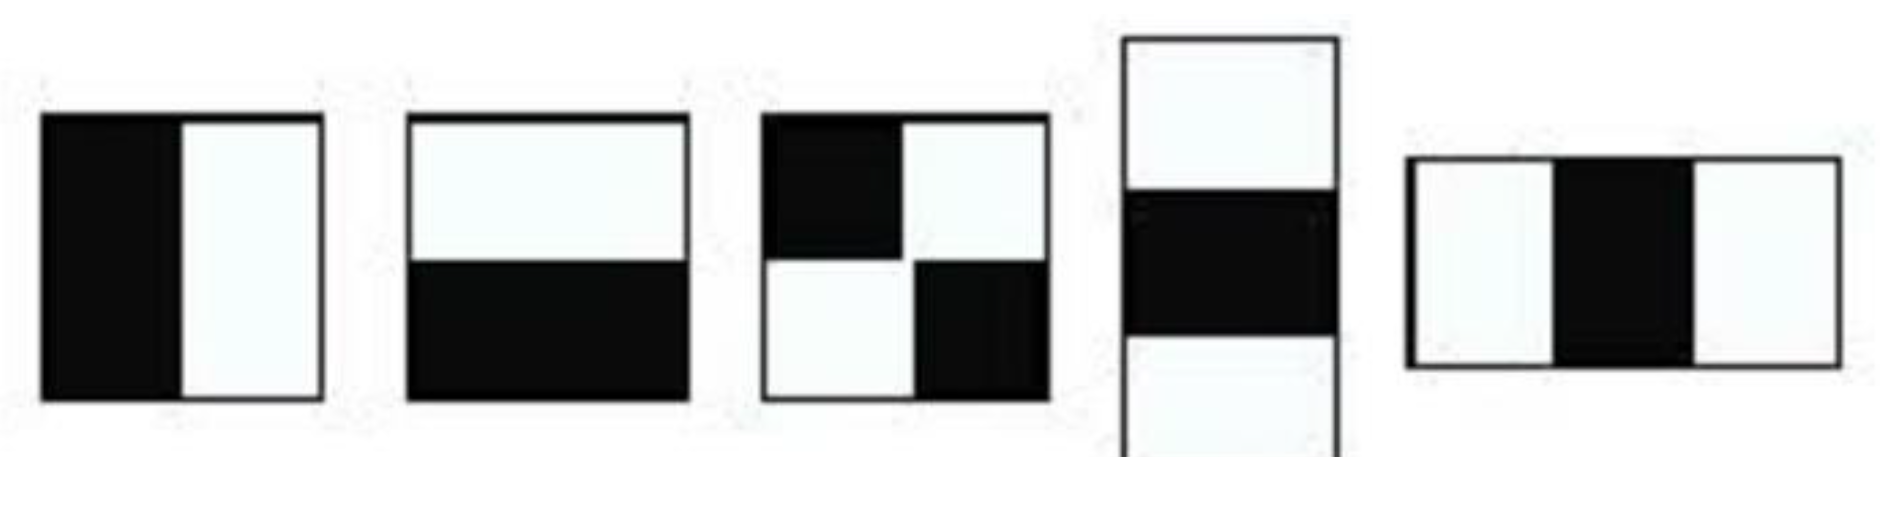
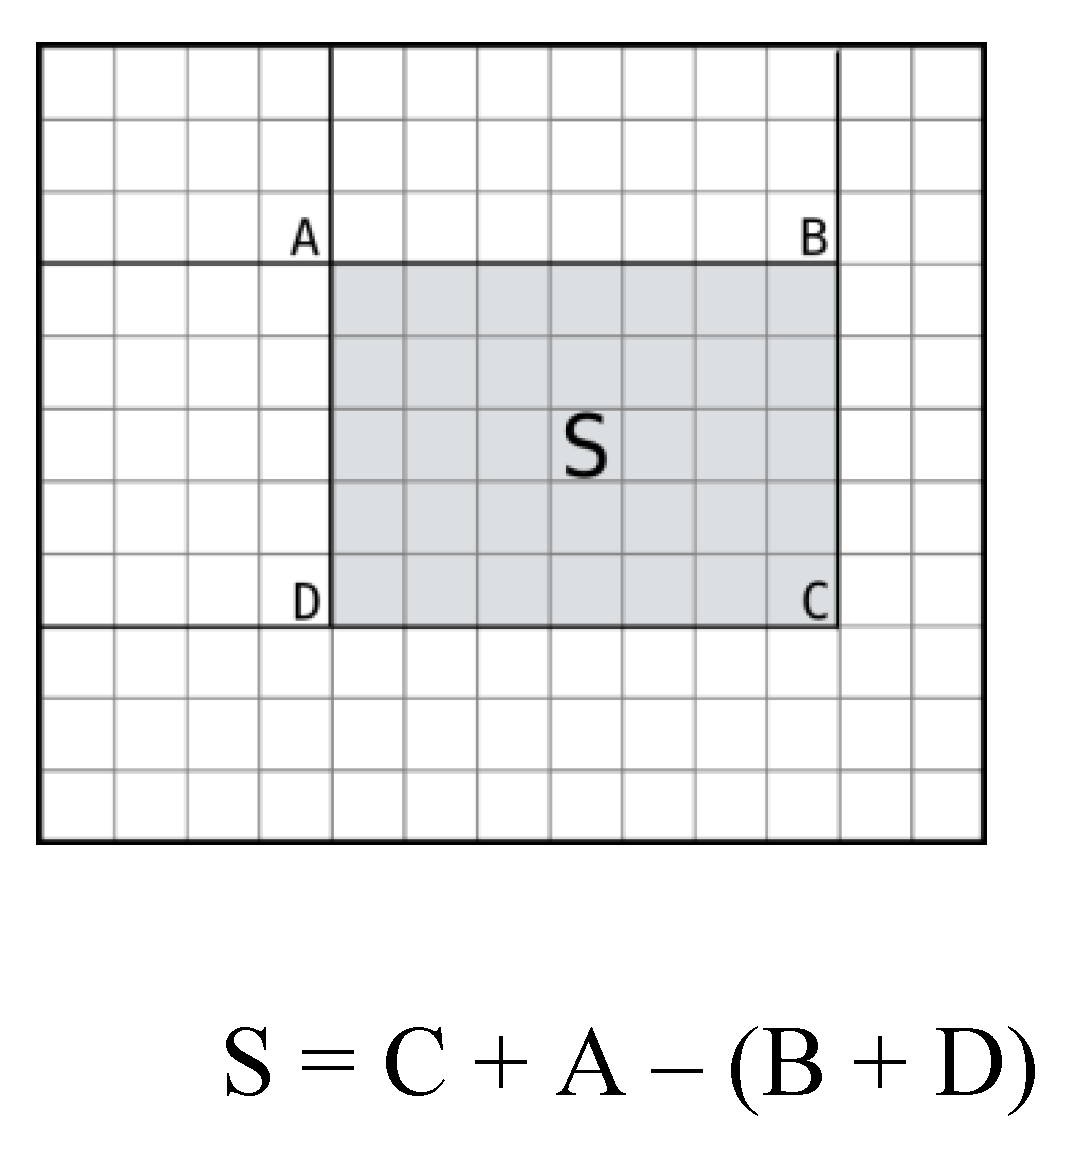
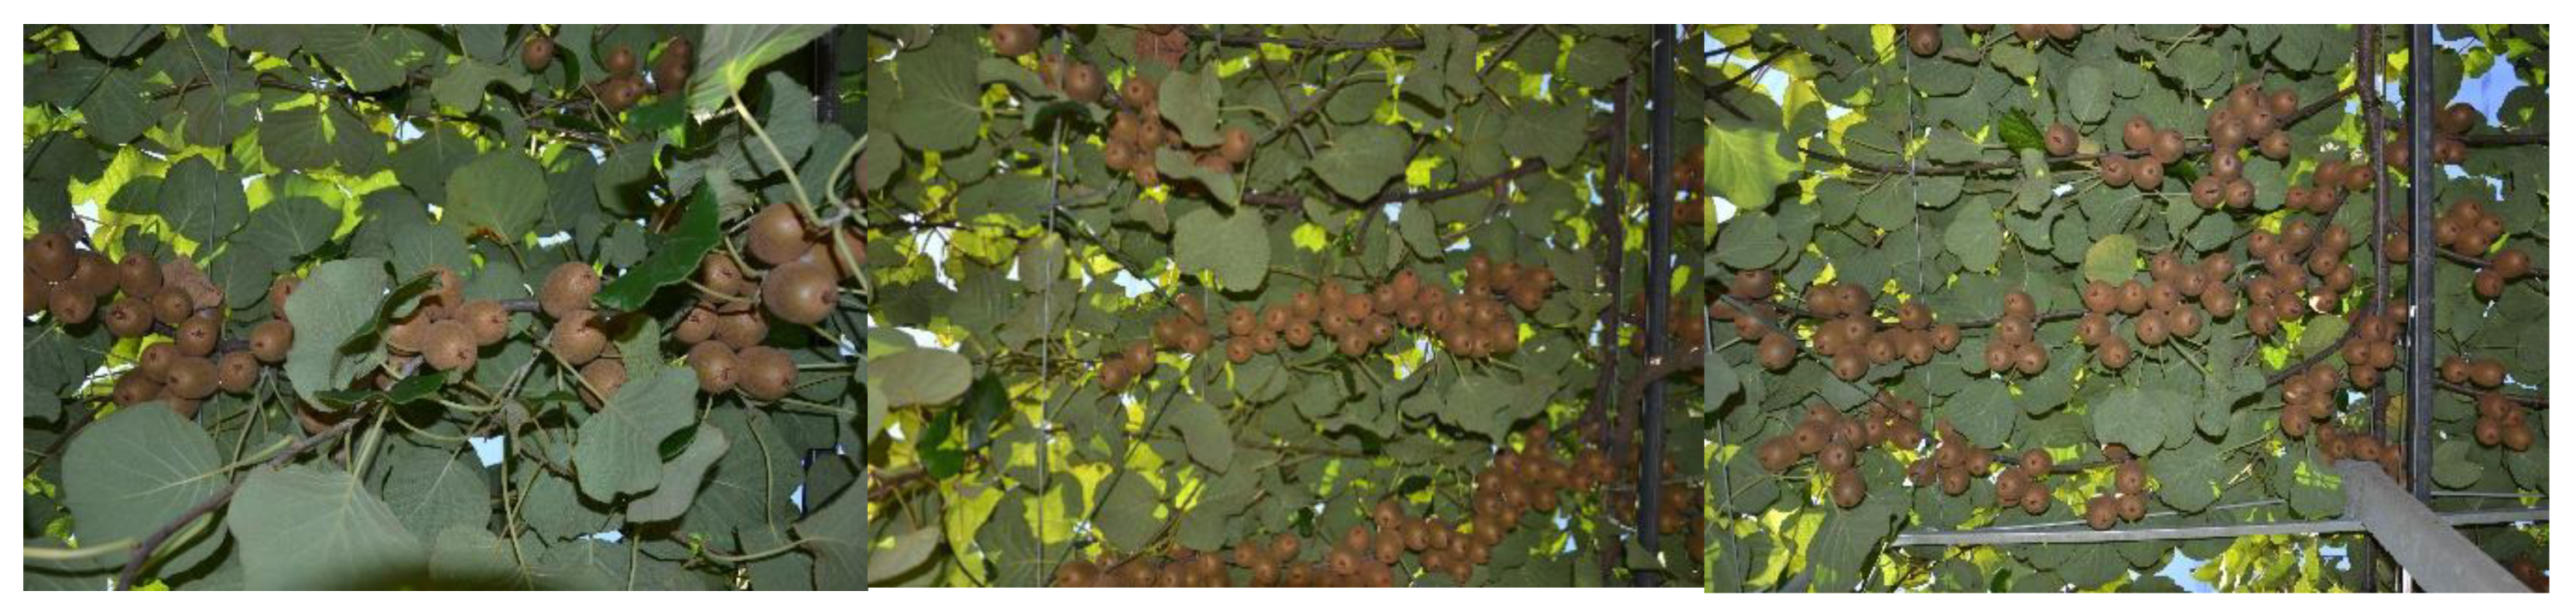
2.2.4. Fruit Detection
| Algorithm 1. AdaBoost training procedure |
|
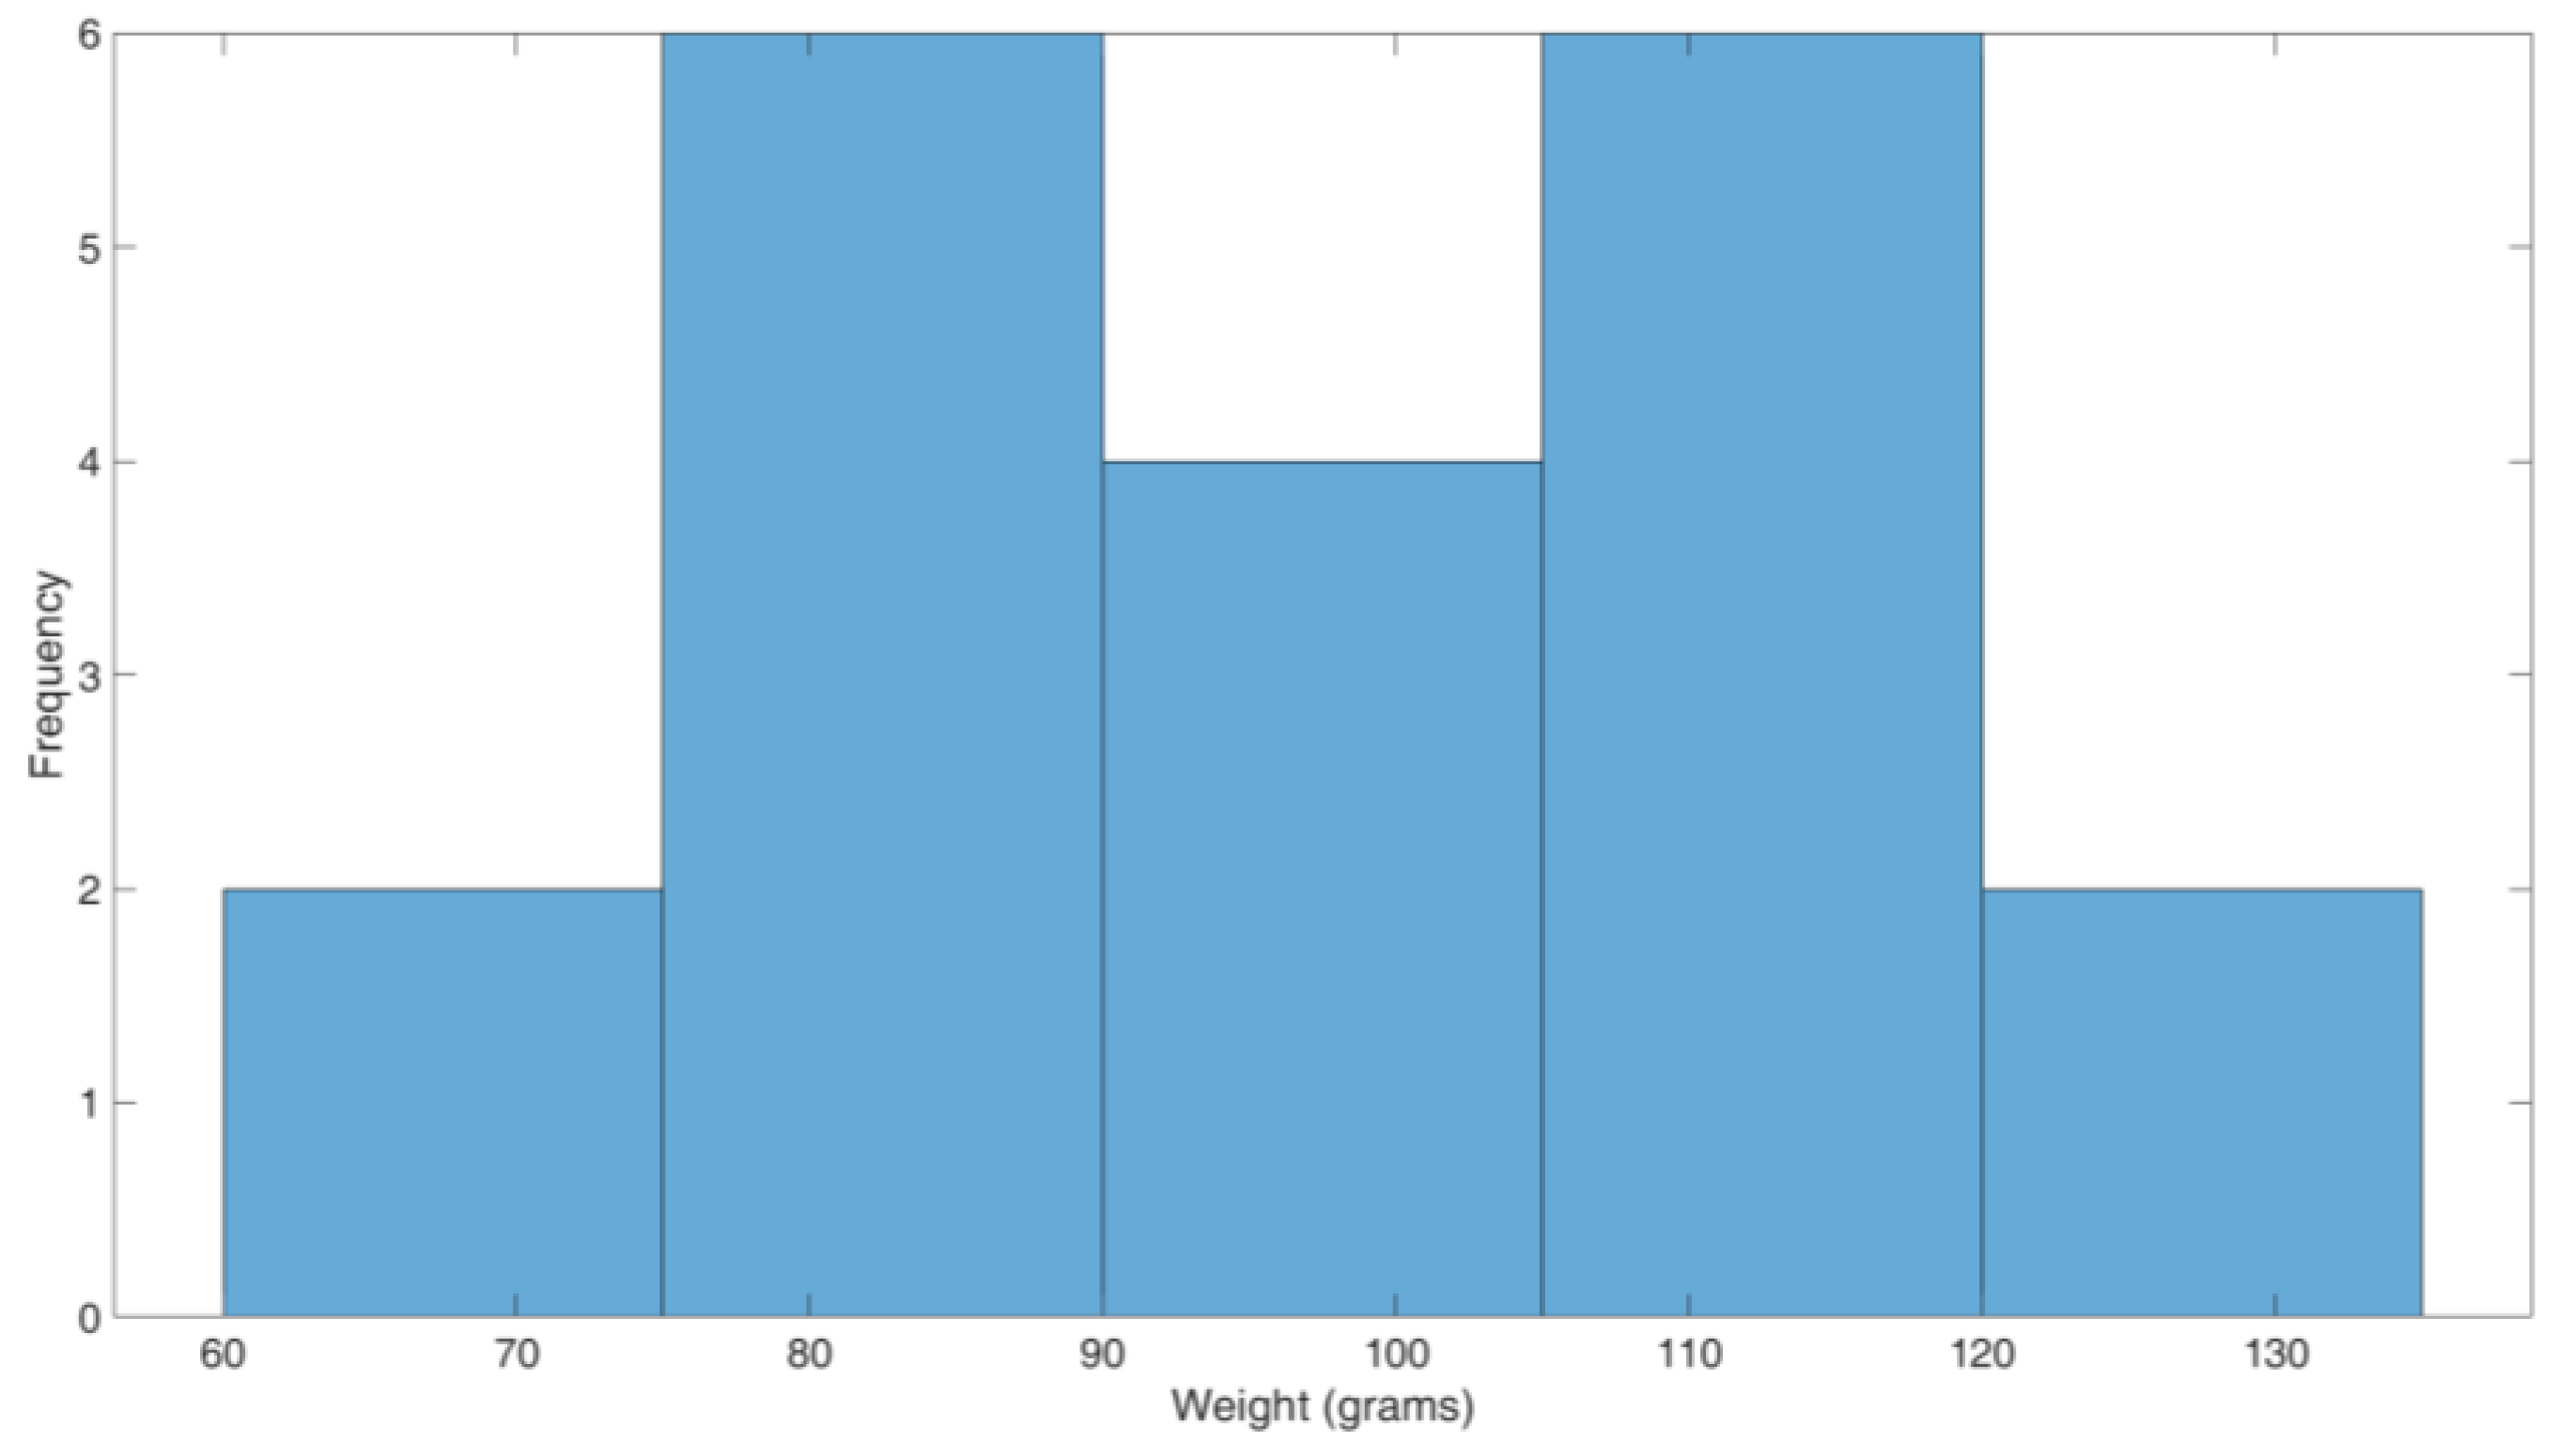
2.2.5. Yield Estimation
3. Experiments
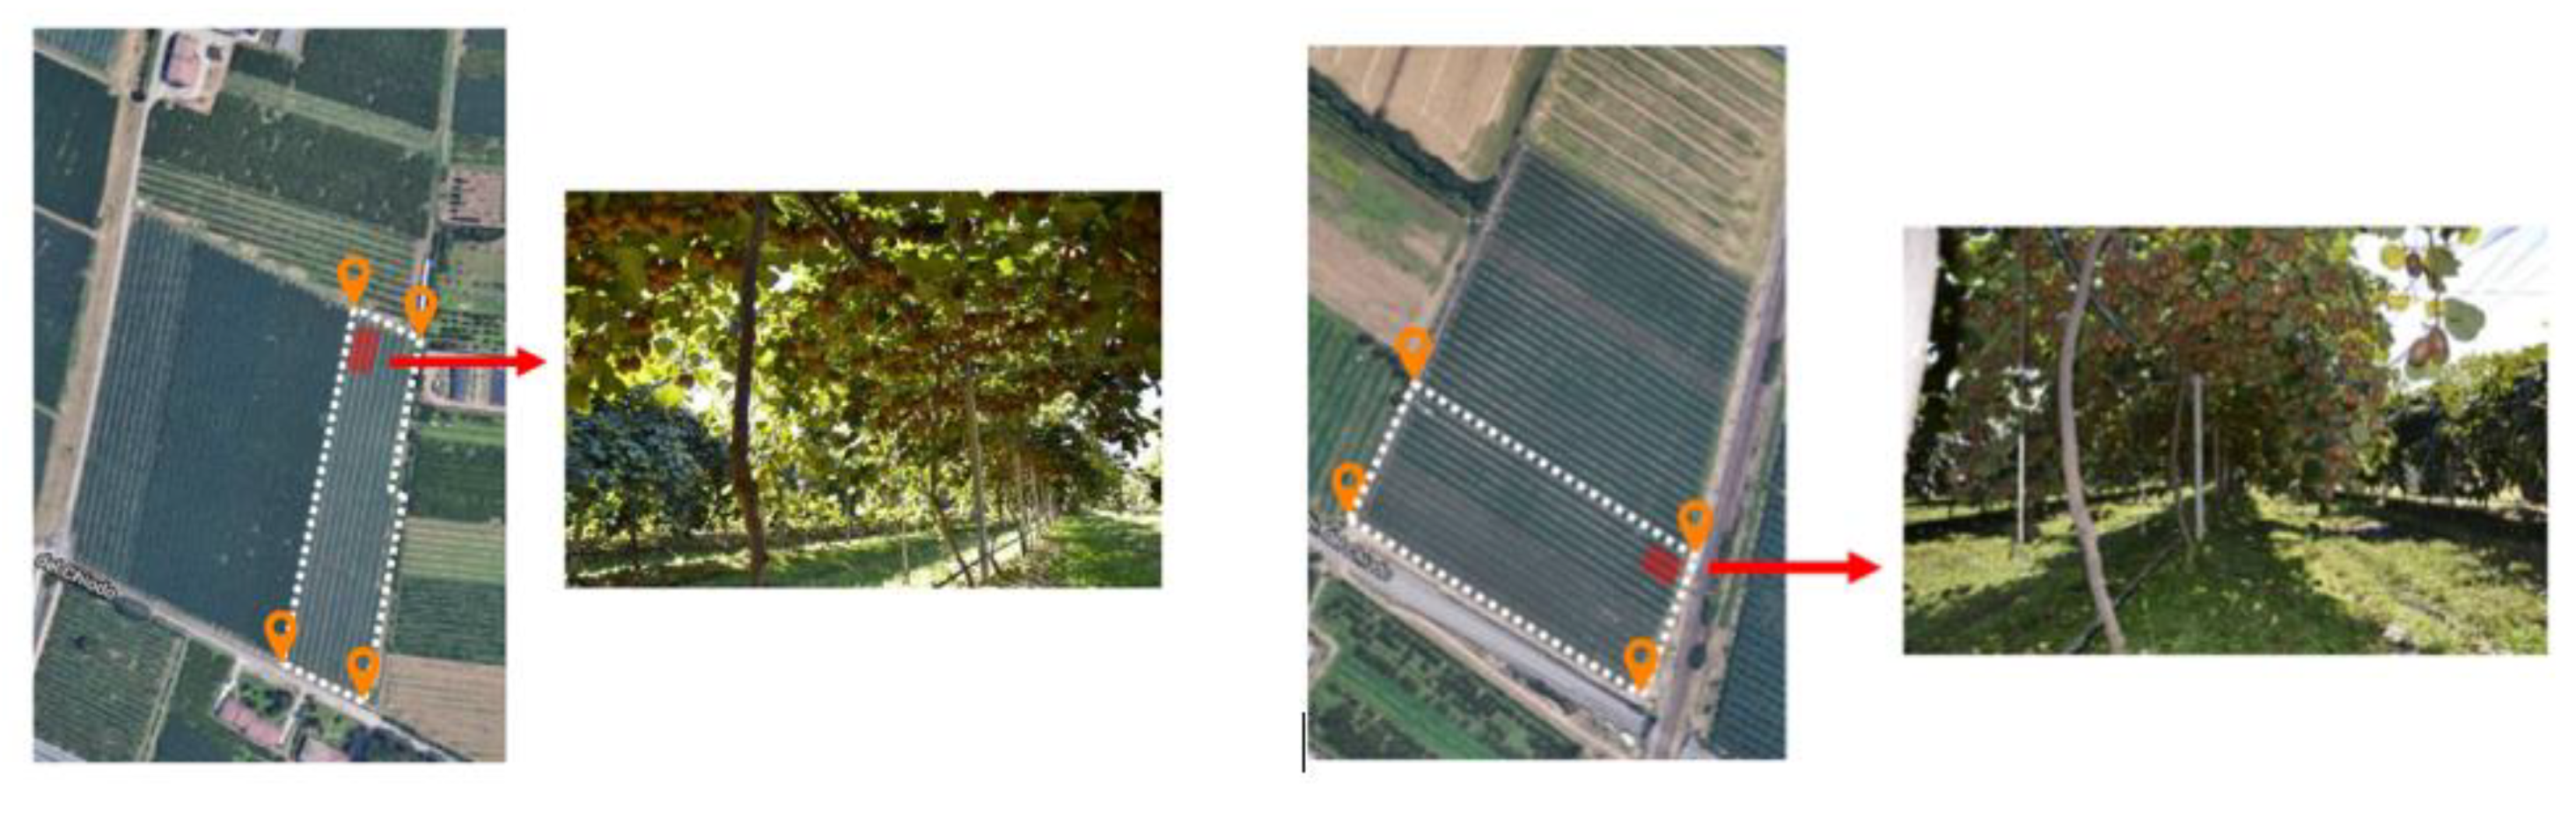
3.1. Setup
3.2. Dataset and Evaluation
4. Results and Discussion
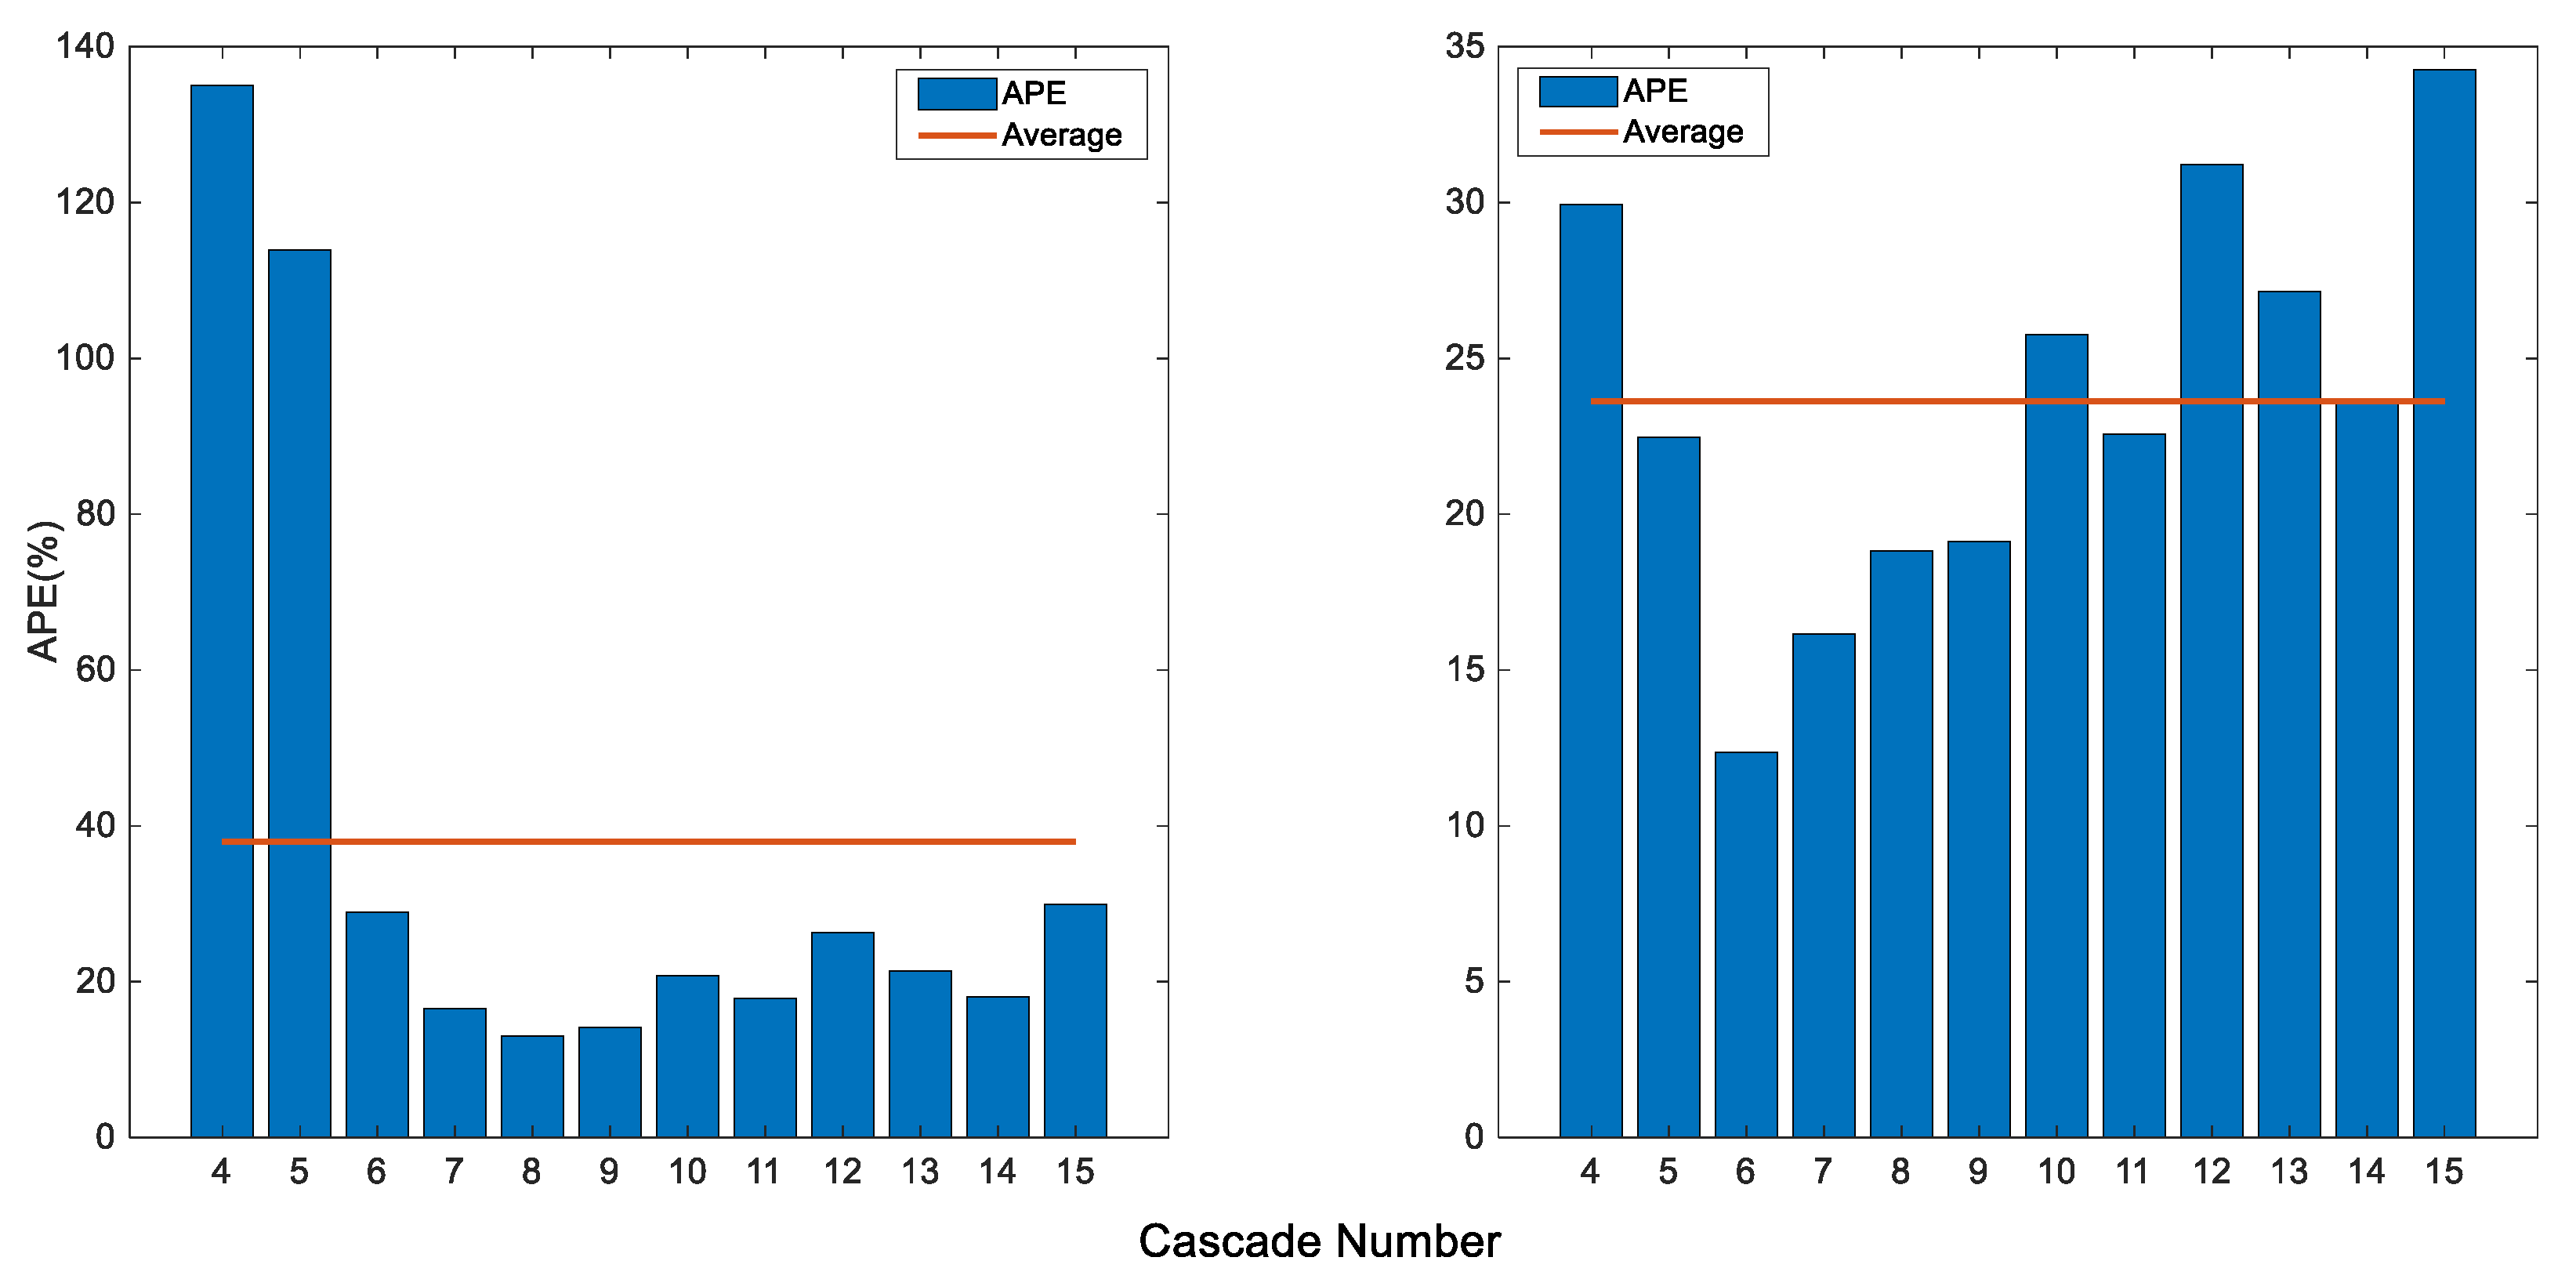
4.1. Effect of Preprocessing at Various Cascade Numbers
4.2. Effect the Rejection Rate
4.3. Yield Estimation
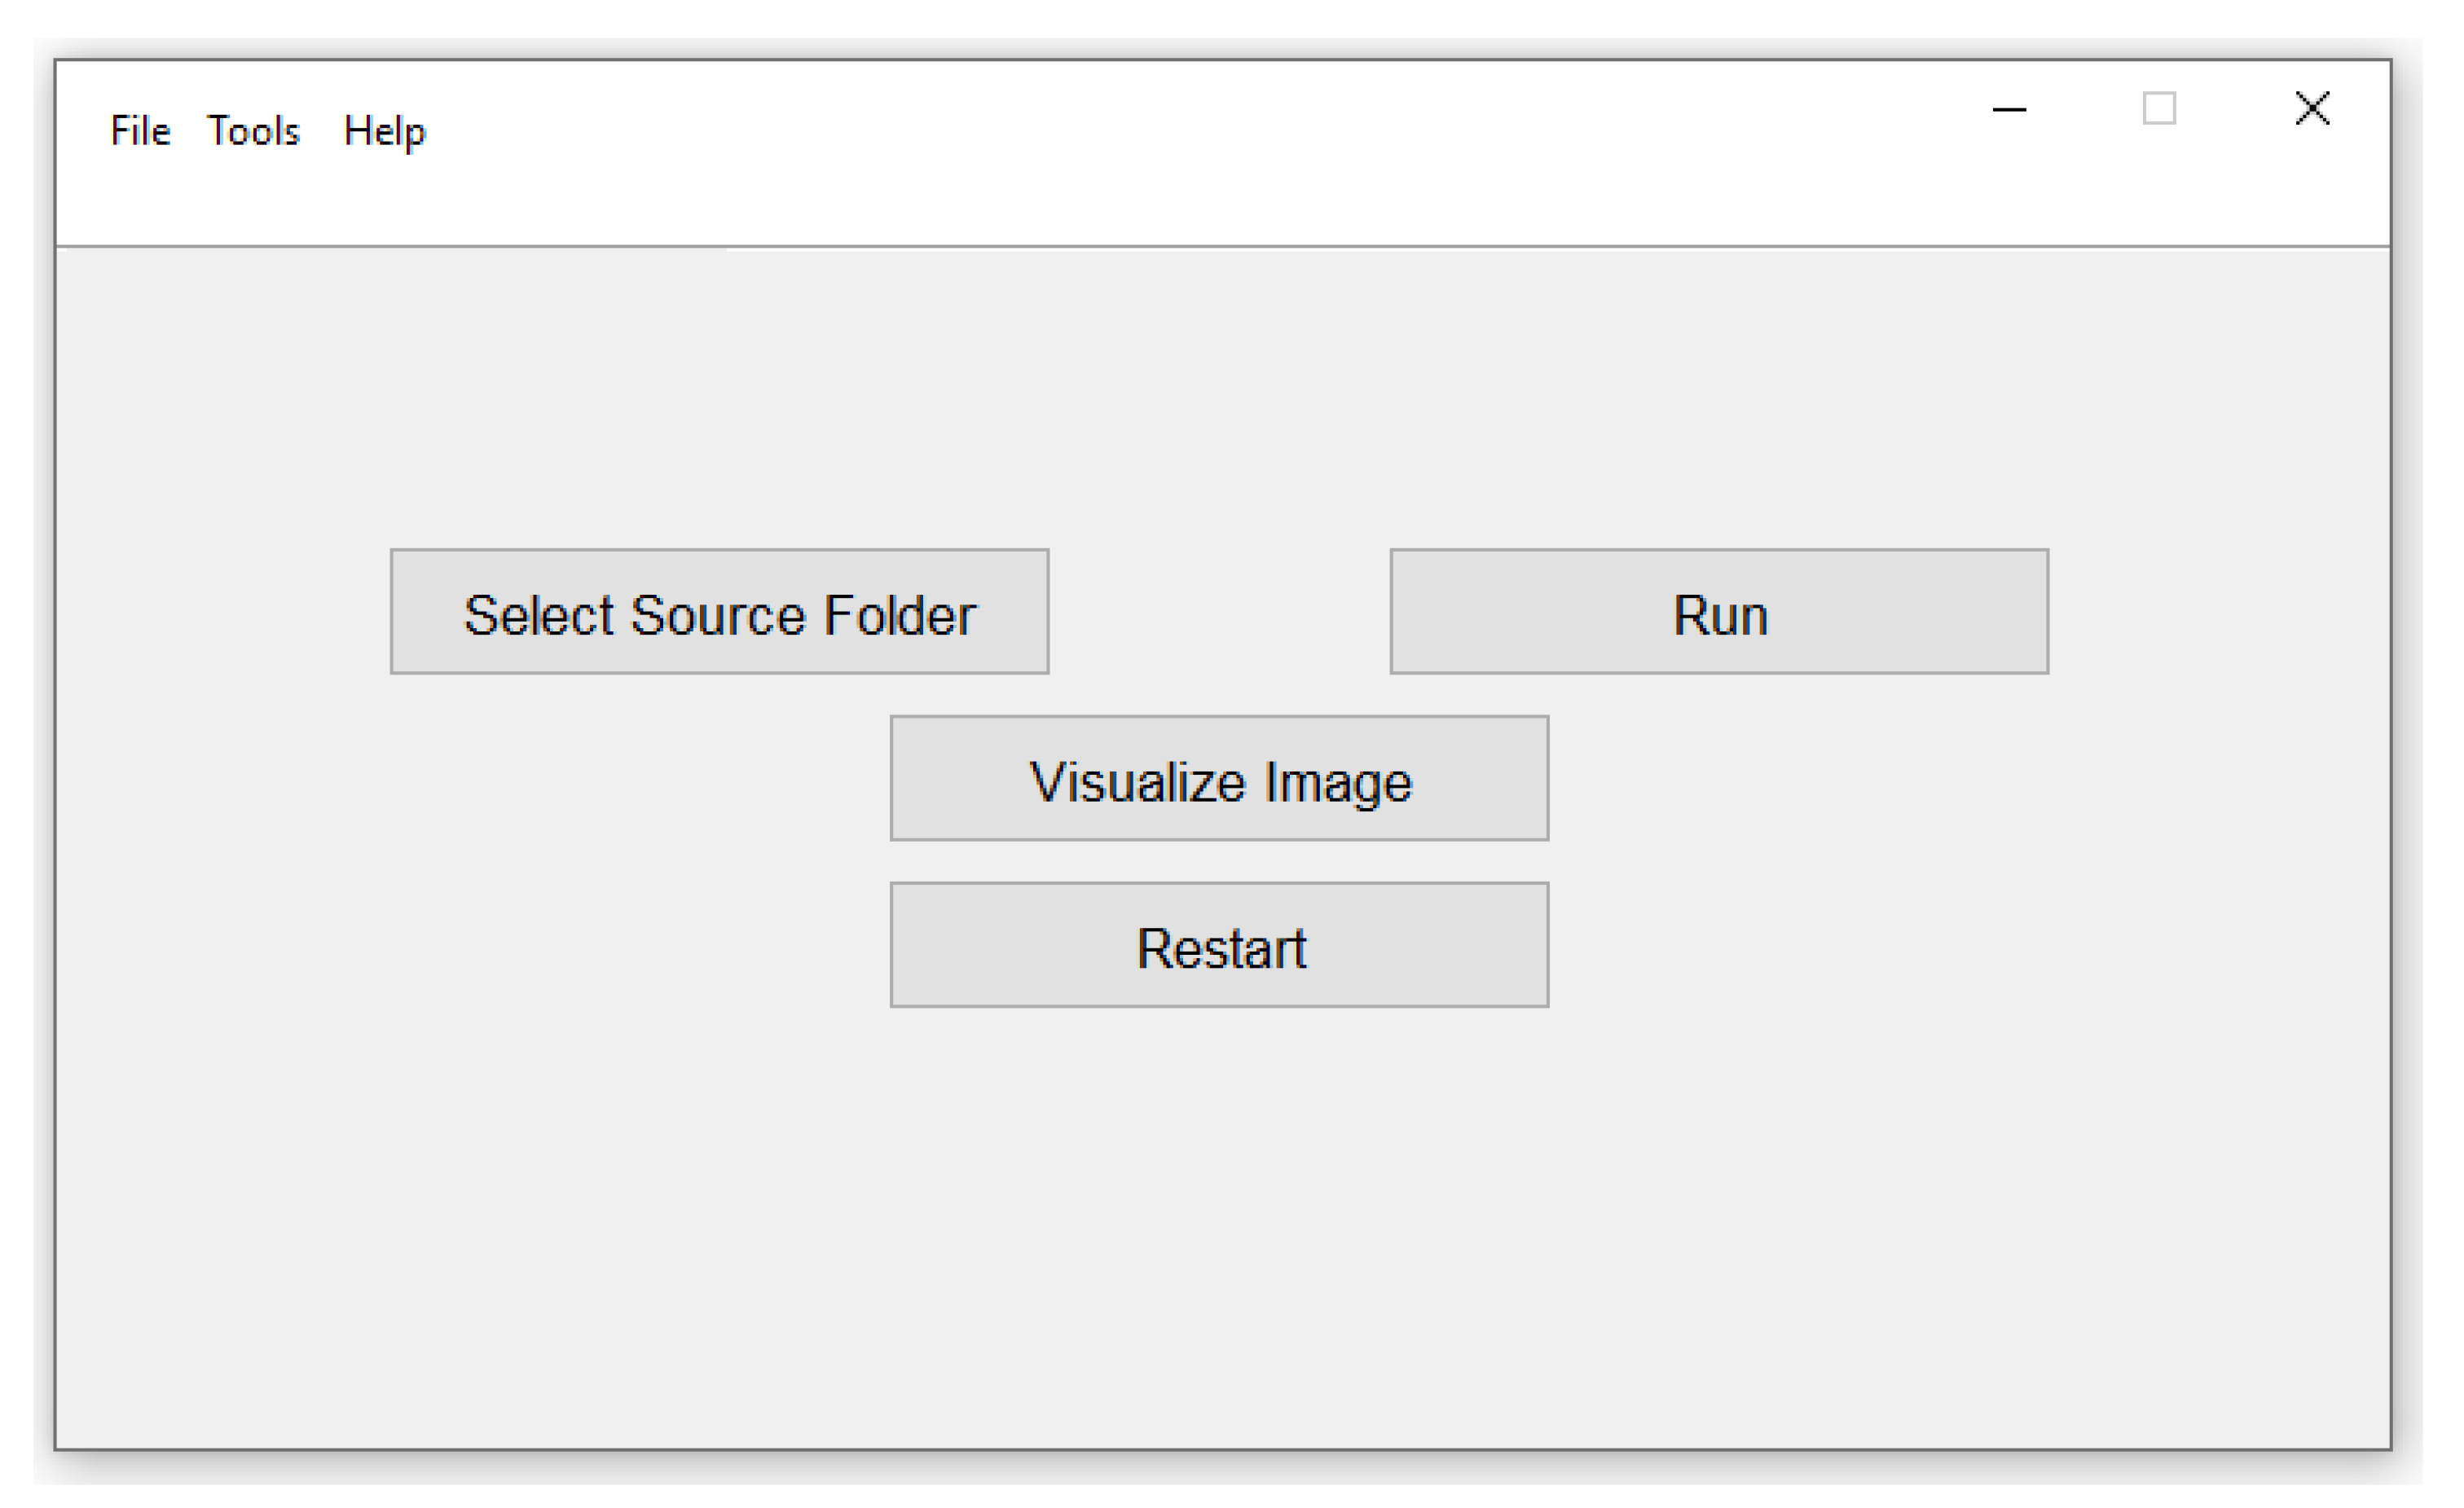
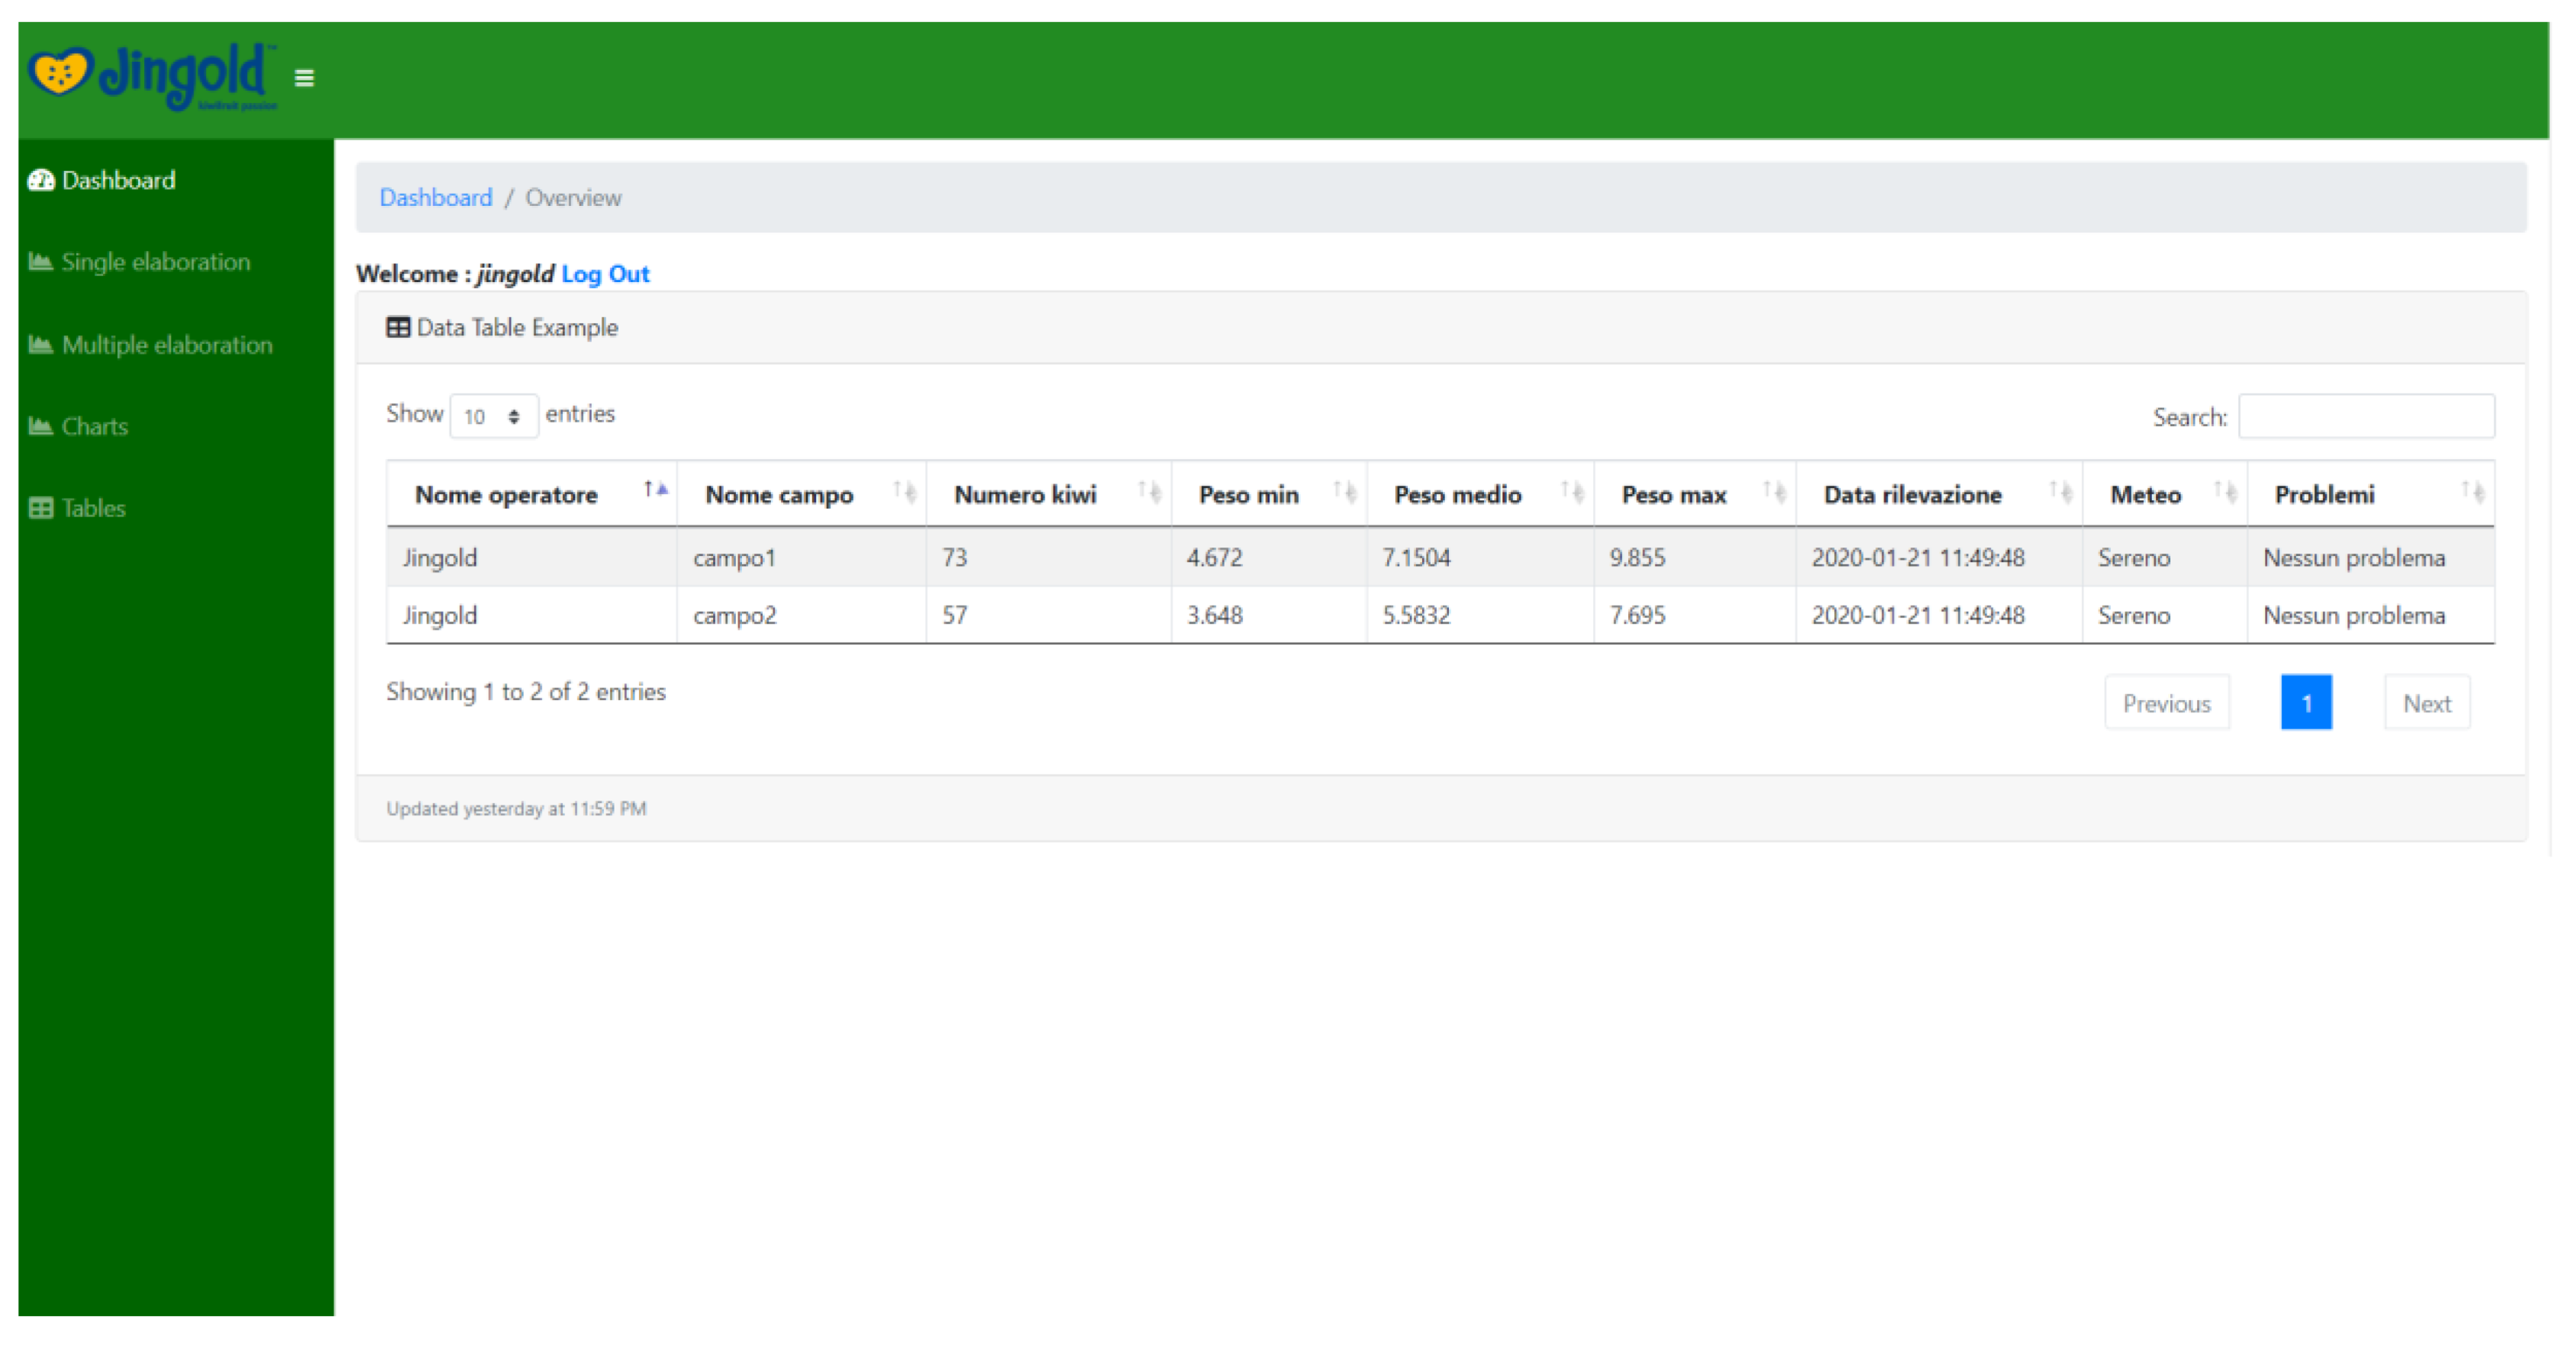
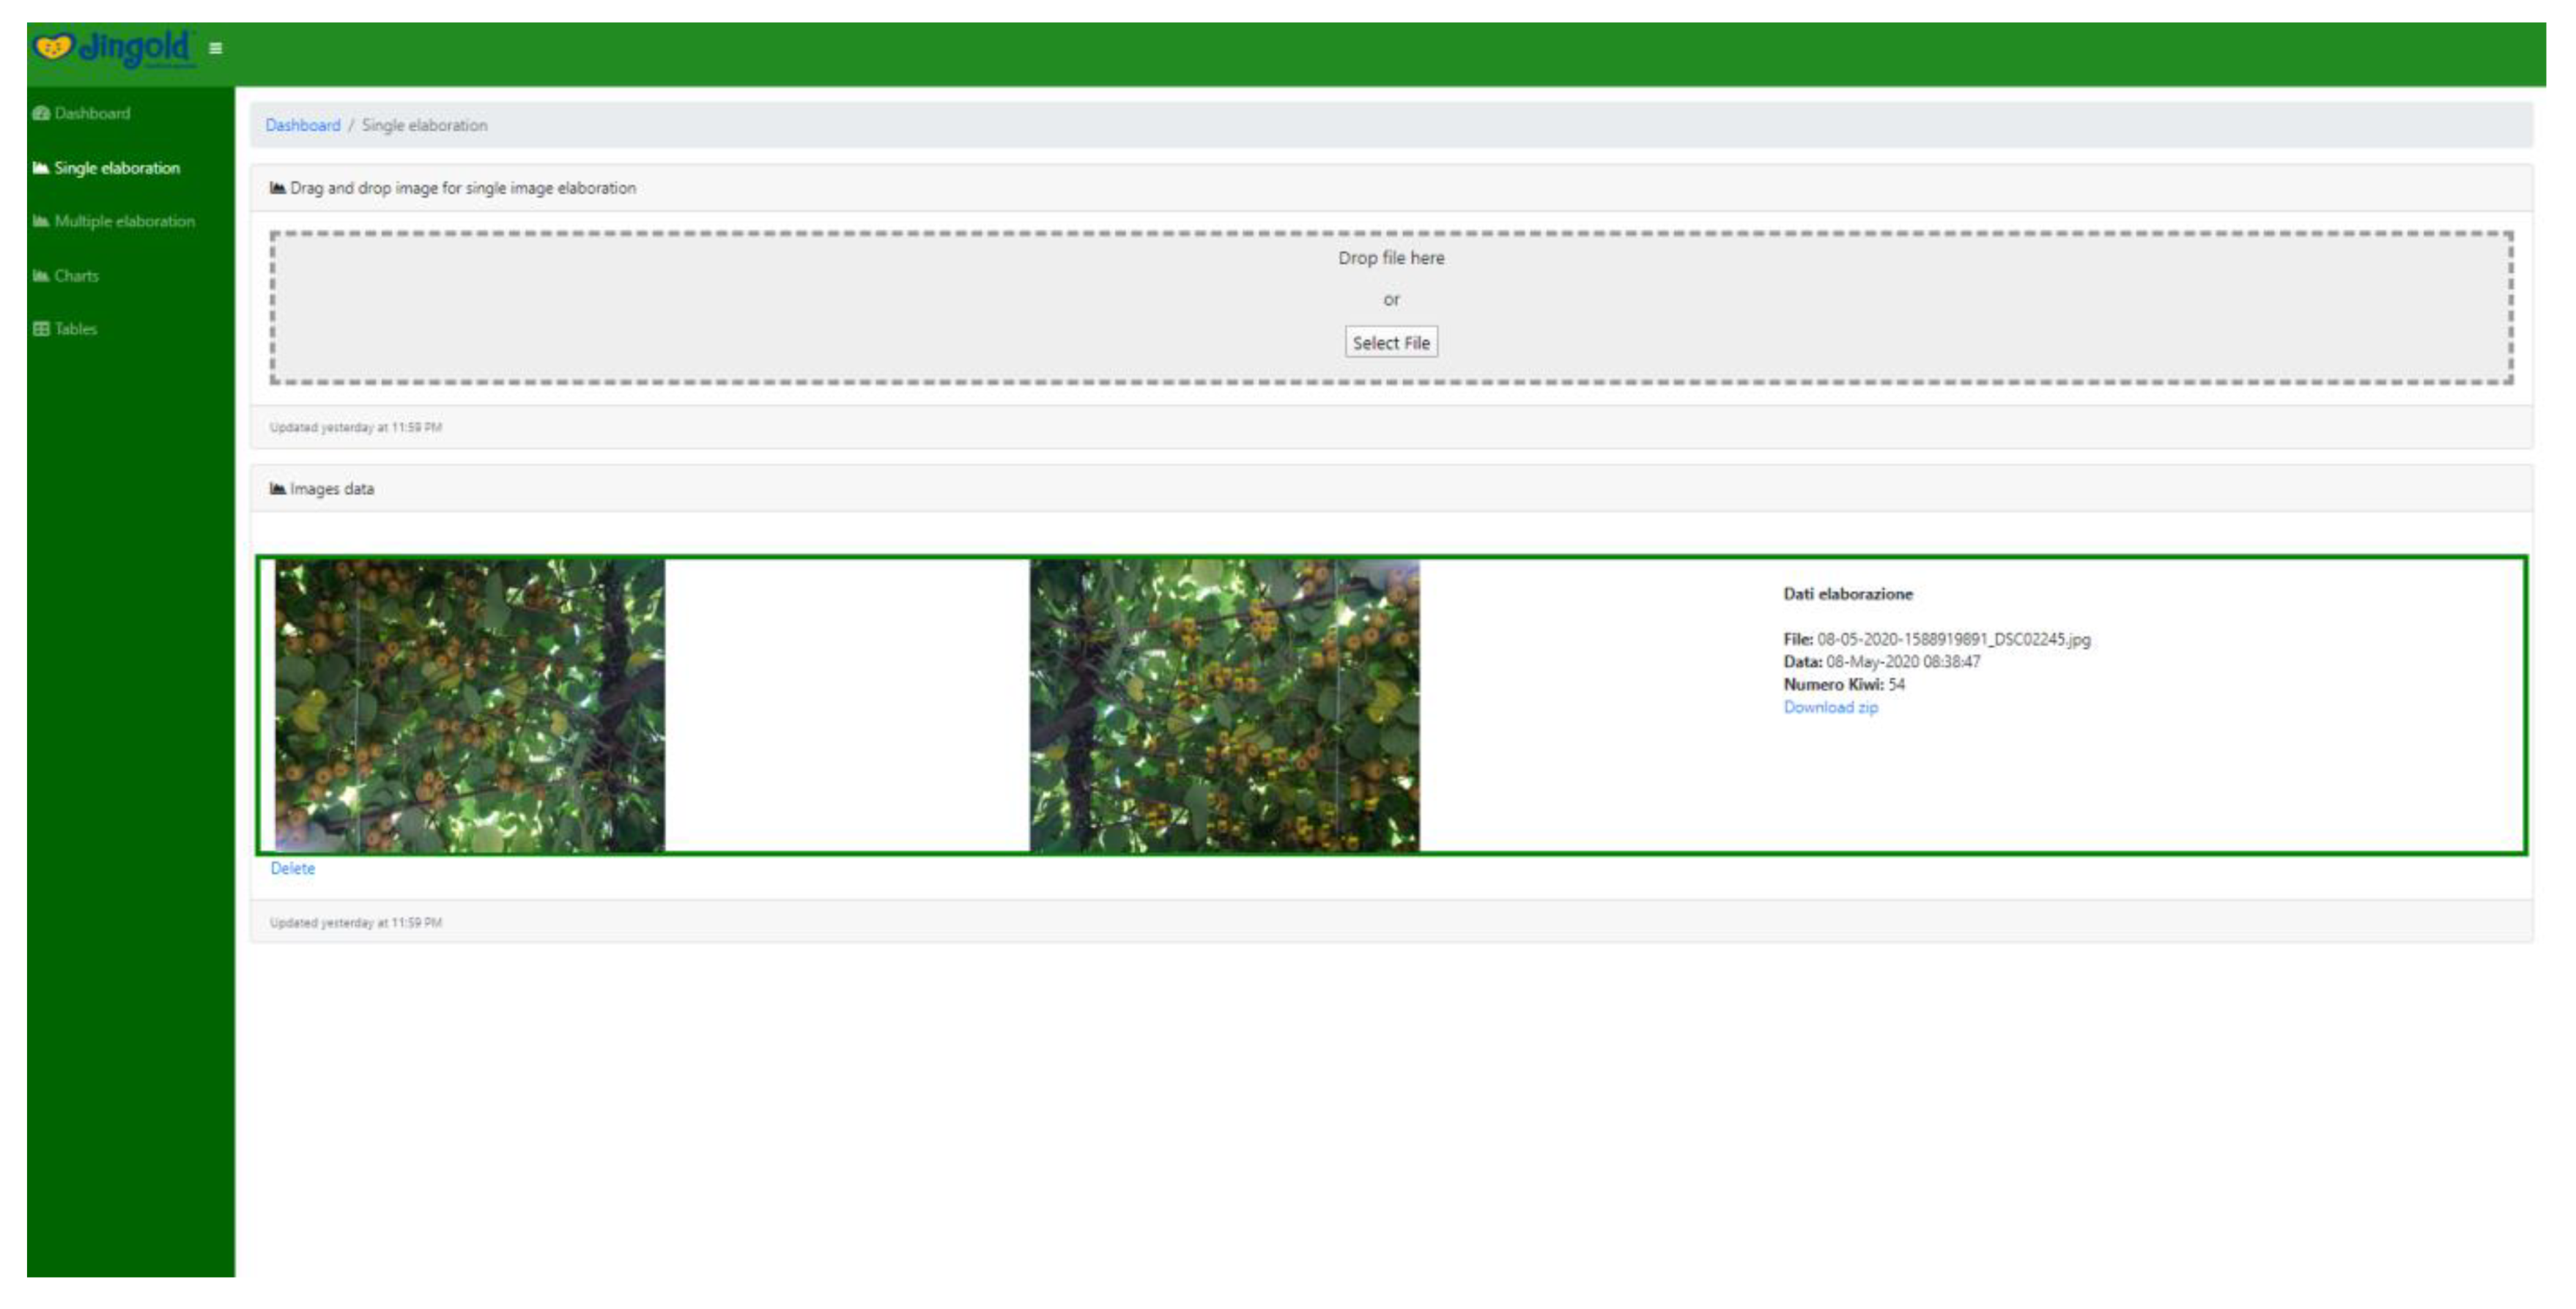
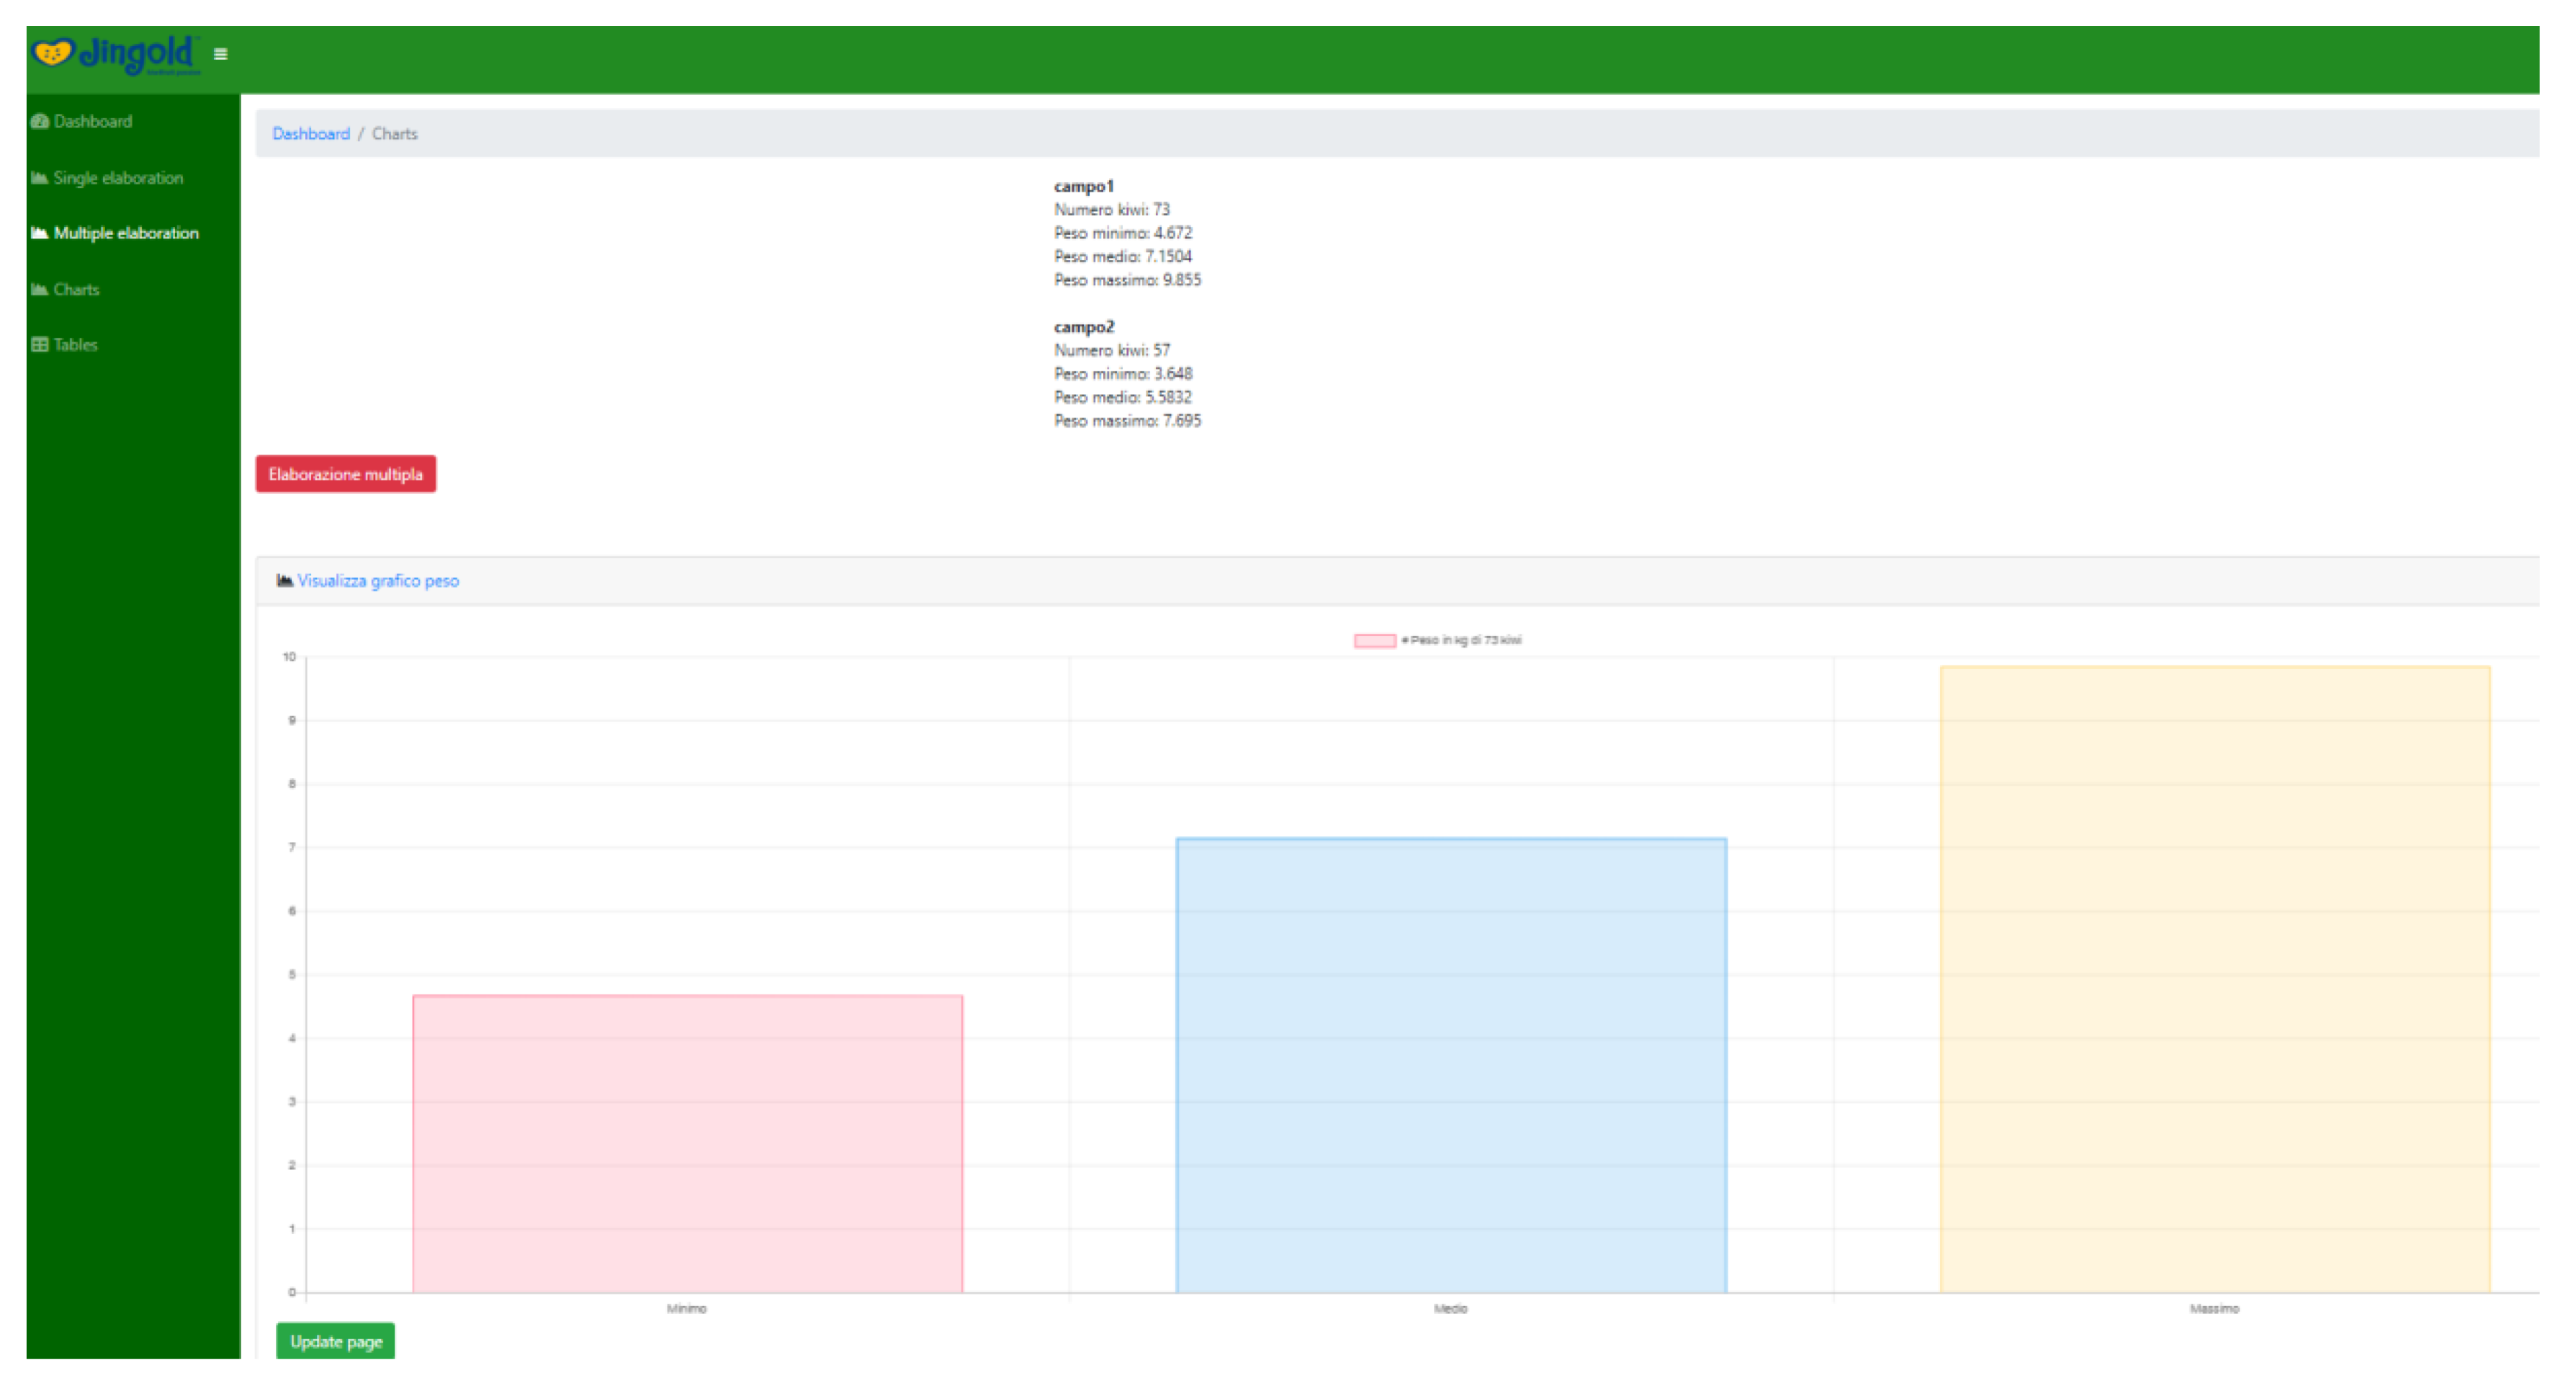
4.4. Graphical User Interface
- -
- Select source folder: Serves for selecting the folder in which the acquired images are stored.
- -
- Run: To launch the counting and yield estimation on the selected folder.
- -
- Visualize image: To display fruit detection and counting instances.
- -
- Restart: To launch another counting and yield estimation session.
5. Conclusions
- -
- Fully automatic system that incorporates image acquisition, stitching, and counting in an end-to-end fashion.
- -
- Robustness against fruit occlusion, size, and orientation changes.
- -
- The acquisition of images across a very large-scale orchard might take some time.
- -
- Image acquisition is carried out on site, while fruit counting is performed off-site on a computer.
- -
- We are considering the adoption of another optical sensor in addition to the existing one in order to cut down the acquisition time by half.
- -
- The yield estimation and fruit counting are an offline task in the current system. Thus, we plan to launch the whole process online on a minicomputer while the tractor drives across the orchard, which allows the human operator to access the results in real time.
Author Contributions
Funding
Acknowledgments
Conflicts of Interest
References
- Yost, M.A.; Kitchen, N.R.; Sudduth, K.A.; Sadler, E.J.; Drummond, S.T.; Volkmann, M.R. Long-term impact of a precision agriculture system on grain crop production. Precis. Agric. 2017, 18, 823–842. [Google Scholar] [CrossRef]
- Patokar, A.; Gohokar, V.V. Precision Agriculture System Design Using Wireless Sensor Network. Inf. Commun. Technol. 2018, 625, 169–177. [Google Scholar] [CrossRef]
- Karim, F.; Karim, F. Monitoring system using web of things in precision agriculture. Procedia Comput. Sci. 2017, 110, 402–409. [Google Scholar] [CrossRef]
- Maes, W.H.; Steppe, K. Perspectives for Remote Sensing with Unmanned Aerial Vehicles in Precision Agriculture. Trends Plant Sci. 2019, 24, 152–164. [Google Scholar] [CrossRef]
- Lei, D.; Mao, Z.; Li, X.; Hu, Z.; Duan, F.; Yan, Y. UAV-based multispectral remote sensing for precision agriculture: A comparison between different cameras. ISPRS J. Photogramm. Remote. Sens. 2018, 146, 124–136. [Google Scholar] [CrossRef]
- Comba, L.; Biglia, A.; Aimonino, D.R.; Gay, P. Unsupervised detection of vineyards by 3D point-cloud UAV photogrammetry for precision agriculture. Comput. Electron. Agric. 2018, 155, 84–95. [Google Scholar] [CrossRef]
- Tsouros, D.C.; Bibi, S.; Sarigiannidis, P.G. A review on UAV-based applications for precision agriculture. Information 2019, 10, 349. [Google Scholar] [CrossRef] [Green Version]
- Chlingaryan, A.; Sukkarieh, S.; Whelan, B. Machine learning approaches for crop yield prediction and nitrogen status estimation in precision agriculture: A review. Comput. Electron. Agric. 2018, 151, 61–69. [Google Scholar] [CrossRef]
- Bargoti, S.; Underwood, J.P. Image Segmentation for Fruit Detection and Yield Estimation in Apple Orchards. J. Field Robot. 2017, 34, 1039–1060. [Google Scholar] [CrossRef] [Green Version]
- Linker, R. Machine learning based analysis of night-time images for yield prediction in apple orchard. Biosyst. Eng. 2018, 167, 114–125. [Google Scholar] [CrossRef]
- Hung, C.; Underwood, J.; Nieto, J.; Sukkarieh, S. A Feature Learning Based Approach for Automated Fruit Yield Estimation. Springer Tracts Adv. Robot. 2015, 485–498. [Google Scholar] [CrossRef]
- Wang, Q.; Nuske, S.; Bergerman, M.; Singh, S. Automated Crop Yield Estimation for Apple Orchards. Springer Proc. Adv. Robot. 2013, 88, 745–758. [Google Scholar] [CrossRef]
- Zhang, C.; Zou, K.; Pan, Y. A Method of Apple Image Segmentation Based on Color-Texture Fusion Feature and Machine Learning. Agronomy 2020, 10, 972. [Google Scholar] [CrossRef]
- Unay, D.; Gosselin, B. Artificial neural network-based segmentation and apple grading by machine vision. In Proceedings of the IEEE International Conference on Image Processing, Genova, Italy, 14 September 2005. [Google Scholar]
- Cheng, H.; Damerow, L.; Sun, Y.; Blanke, M.M. Early Yield Prediction Using Image Analysis of Apple Fruit and Tree Canopy Features with Neural Networks. J. Imaging 2017, 3, 6. [Google Scholar] [CrossRef]
- Papageorgiou, E.I.; Aggelopoulou, K.D.; Gemtos, T.A.; Nanos, G.D. Yield prediction in apples using Fuzzy Cognitive Map learning approach. Comput. Electron. Agric. 2013, 91, 19–29. [Google Scholar] [CrossRef]
- Chen, Y.; Lee, W.S.; Gan, H.; Peres, N.A.; Fraisse, C.W.; Zhang, Y.; He, Y. Strawberry Yield Prediction Based on a Deep Neural Network Using High-Resolution Aerial Orthoimages. Remote. Sens. 2019, 11, 1584. [Google Scholar] [CrossRef] [Green Version]
- Dorj, U.-O.; Lee, M.; Yun, S.-S. An yield estimation in citrus orchards via fruit detection and counting using image processing. Comput. Electron. Agric. 2017, 140, 103–112. [Google Scholar] [CrossRef]
- Annamalai, P.; Lee, W.S.; Burks, T.F. Color Vision System for Estimating Citrus Yield in Real-time. In Proceedings of the ASAE Annual Meeting; American Society of Agricultural and Biological Engineers: Ottawa, ON, Canada, 2004. [Google Scholar]
- Malik, Z.; Ziauddin, S.; Shahid, A.R.; Safi, A. Detection and Counting of On-Tree Citrus Fruit for Crop Yield Estimation. Int. J. Adv. Comput. Sci. Appl. 2016, 7. [Google Scholar] [CrossRef]
- Syal, A.; Garg, D.; Sharma, S. Apple fruit detection and counting using computer vision techniques. In Proceedings of the 2014 IEEE International Conference on Computational Intelligence and Computing Research, Coimbatore, India, 18–20 December 2014; pp. 1–6. [Google Scholar]
- Song, Y.; Glasbey, C.; Horgan, G.W.; Polder, G.; Dieleman, J.A.; Van Der Heijden, G. Automatic fruit recognition and counting from multiple images. Biosyst. Eng. 2014, 118, 203–215. [Google Scholar] [CrossRef]
- Forssén, P.-E. Maximally Stable Colour Regions for Recognition and Matching. In Proceedings of the 2007 IEEE Conference on Computer Vision and Pattern Recognition 2007, Minneapolis, MN, USA, 17–22 June 2007; pp. 1–8. [Google Scholar] [CrossRef]
- Rahnemoonfar, M.; Sheppard, C. Deep Count: Fruit Counting Based on Deep Simulated Learning. Sensors 2017, 17, 905. [Google Scholar] [CrossRef] [Green Version]
- Vasconez, J.; Delpiano, J.; Vougioukas, S.; Cheein, F.A. Comparison of convolutional neural networks in fruit detection and counting: A comprehensive evaluation. Comput. Electron. Agric. 2020, 173, 105348. [Google Scholar] [CrossRef]
- Koirala, A.; Walsh, K.; Wang, Z.; McCarthy, C. Deep learning—Method overview and review of use for fruit detection and yield estimation. Comput. Electron. Agric. 2019, 162, 219–234. [Google Scholar] [CrossRef]
- Gongal, A.; Amatya, S.; Karkee, M.; Zhang, Q.; Lewis, K. Sensors and systems for fruit detection and localization: A review. Comput. Electron. Agric. 2015, 116, 8–19. [Google Scholar] [CrossRef]
- Bay, H.; Tuytelaars, T.; Van Gool, L. Surf: Speeded up robust features. In European Conference on Computer Vision; Springer: Berlin/Heidelberg, Germany, 2006; pp. 404–417. [Google Scholar]
- Chum, O.; Matas, J.; Kittler, J. Locally Optimized RANSAC. In Joint Pattern Recognition Symposium; Springer: Berlin/Heidelberg, Germany, 2003; pp. 236–243. [Google Scholar]
- Otsu, N. A Threshold Selection Method from Gray-Level Histograms. IEEE Trans. Syst. Man Cybern. 1979, 9, 62–66. [Google Scholar] [CrossRef] [Green Version]
- Viola, P.; Jones, M. Rapid object detection using a boosted cascade of simple features. In Proceedings of the 2001 IEEE Computer Society Conference on Computer Vision and Pattern Recognition, Kauai, HI, USA, 8–14 December 2001. [Google Scholar]
- Xu, Y.; Yu, G.; Wu, X.; Wang, Y.; Ma, Y. An Enhanced Viola-Jones Vehicle Detection Method From Unmanned Aerial Vehicles Imagery. IEEE Trans. Intell. Transp. Syst. 2017, 18, 1845–1856. [Google Scholar] [CrossRef]
- Zhang, C.; Platt, J.C.; Viola, P.A. Multiple instance boosting for object detection. In Proceedings of the Advances in Neural Information Processing Systems, Vancouver, BC, Canada, 5–8 December 2005; pp. 1417–1424. [Google Scholar]
- Kolsch, M.; Türk, M. Analysis of rotational robustness of hand detection with a Viola-Jones detector. In Proceedings of the 17th International Conference on Pattern Recognition, Cambridge, UK, 26–26 August 2004; pp. 107–110. [Google Scholar]
- Xu, Y.; Yu, G.; Wang, Y.; Wu, X.; Ma, Y. A Hybrid Vehicle Detection Method Based on Viola-Jones and HOG + SVM from UAV Images. Sensors 2016, 16, 1325. [Google Scholar] [CrossRef] [PubMed] [Green Version]
- Freund, Y.; Schapire, R.E. A desicion-theoretic generalization of on-line learning and an application to boosting. In Computational Learning Theory; Springer: Berlin/Heidelberg, Germany, 1995; pp. 23–37. [Google Scholar]


| Rejection Rate (%) | 10 | 20 | 30 | 40 | 50 |
|---|---|---|---|---|---|
| APE (%) | 20.16 | 12.36 | 24.23 | 38.12 | 41.48 |
© 2020 by the authors. Licensee MDPI, Basel, Switzerland. This article is an open access article distributed under the terms and conditions of the Creative Commons Attribution (CC BY) license (http://creativecommons.org/licenses/by/4.0/).
Share and Cite
Mekhalfi, M.L.; Nicolò, C.; Ianniello, I.; Calamita, F.; Goller, R.; Barazzuol, M.; Melgani, F. Vision System for Automatic On-Tree Kiwifruit Counting and Yield Estimation. Sensors 2020, 20, 4214. https://0-doi-org.brum.beds.ac.uk/10.3390/s20154214
Mekhalfi ML, Nicolò C, Ianniello I, Calamita F, Goller R, Barazzuol M, Melgani F. Vision System for Automatic On-Tree Kiwifruit Counting and Yield Estimation. Sensors. 2020; 20(15):4214. https://0-doi-org.brum.beds.ac.uk/10.3390/s20154214
Chicago/Turabian StyleMekhalfi, Mohamed Lamine, Carlo Nicolò, Ivan Ianniello, Federico Calamita, Rino Goller, Maurizio Barazzuol, and Farid Melgani. 2020. "Vision System for Automatic On-Tree Kiwifruit Counting and Yield Estimation" Sensors 20, no. 15: 4214. https://0-doi-org.brum.beds.ac.uk/10.3390/s20154214