
Deriving Large-Scale Coastal Bathymetry from Sentinel-2 Images Using an HIGH-Performance Cluster: A Case Study Covering North Africa’s Coastal Zone

 , and
, and 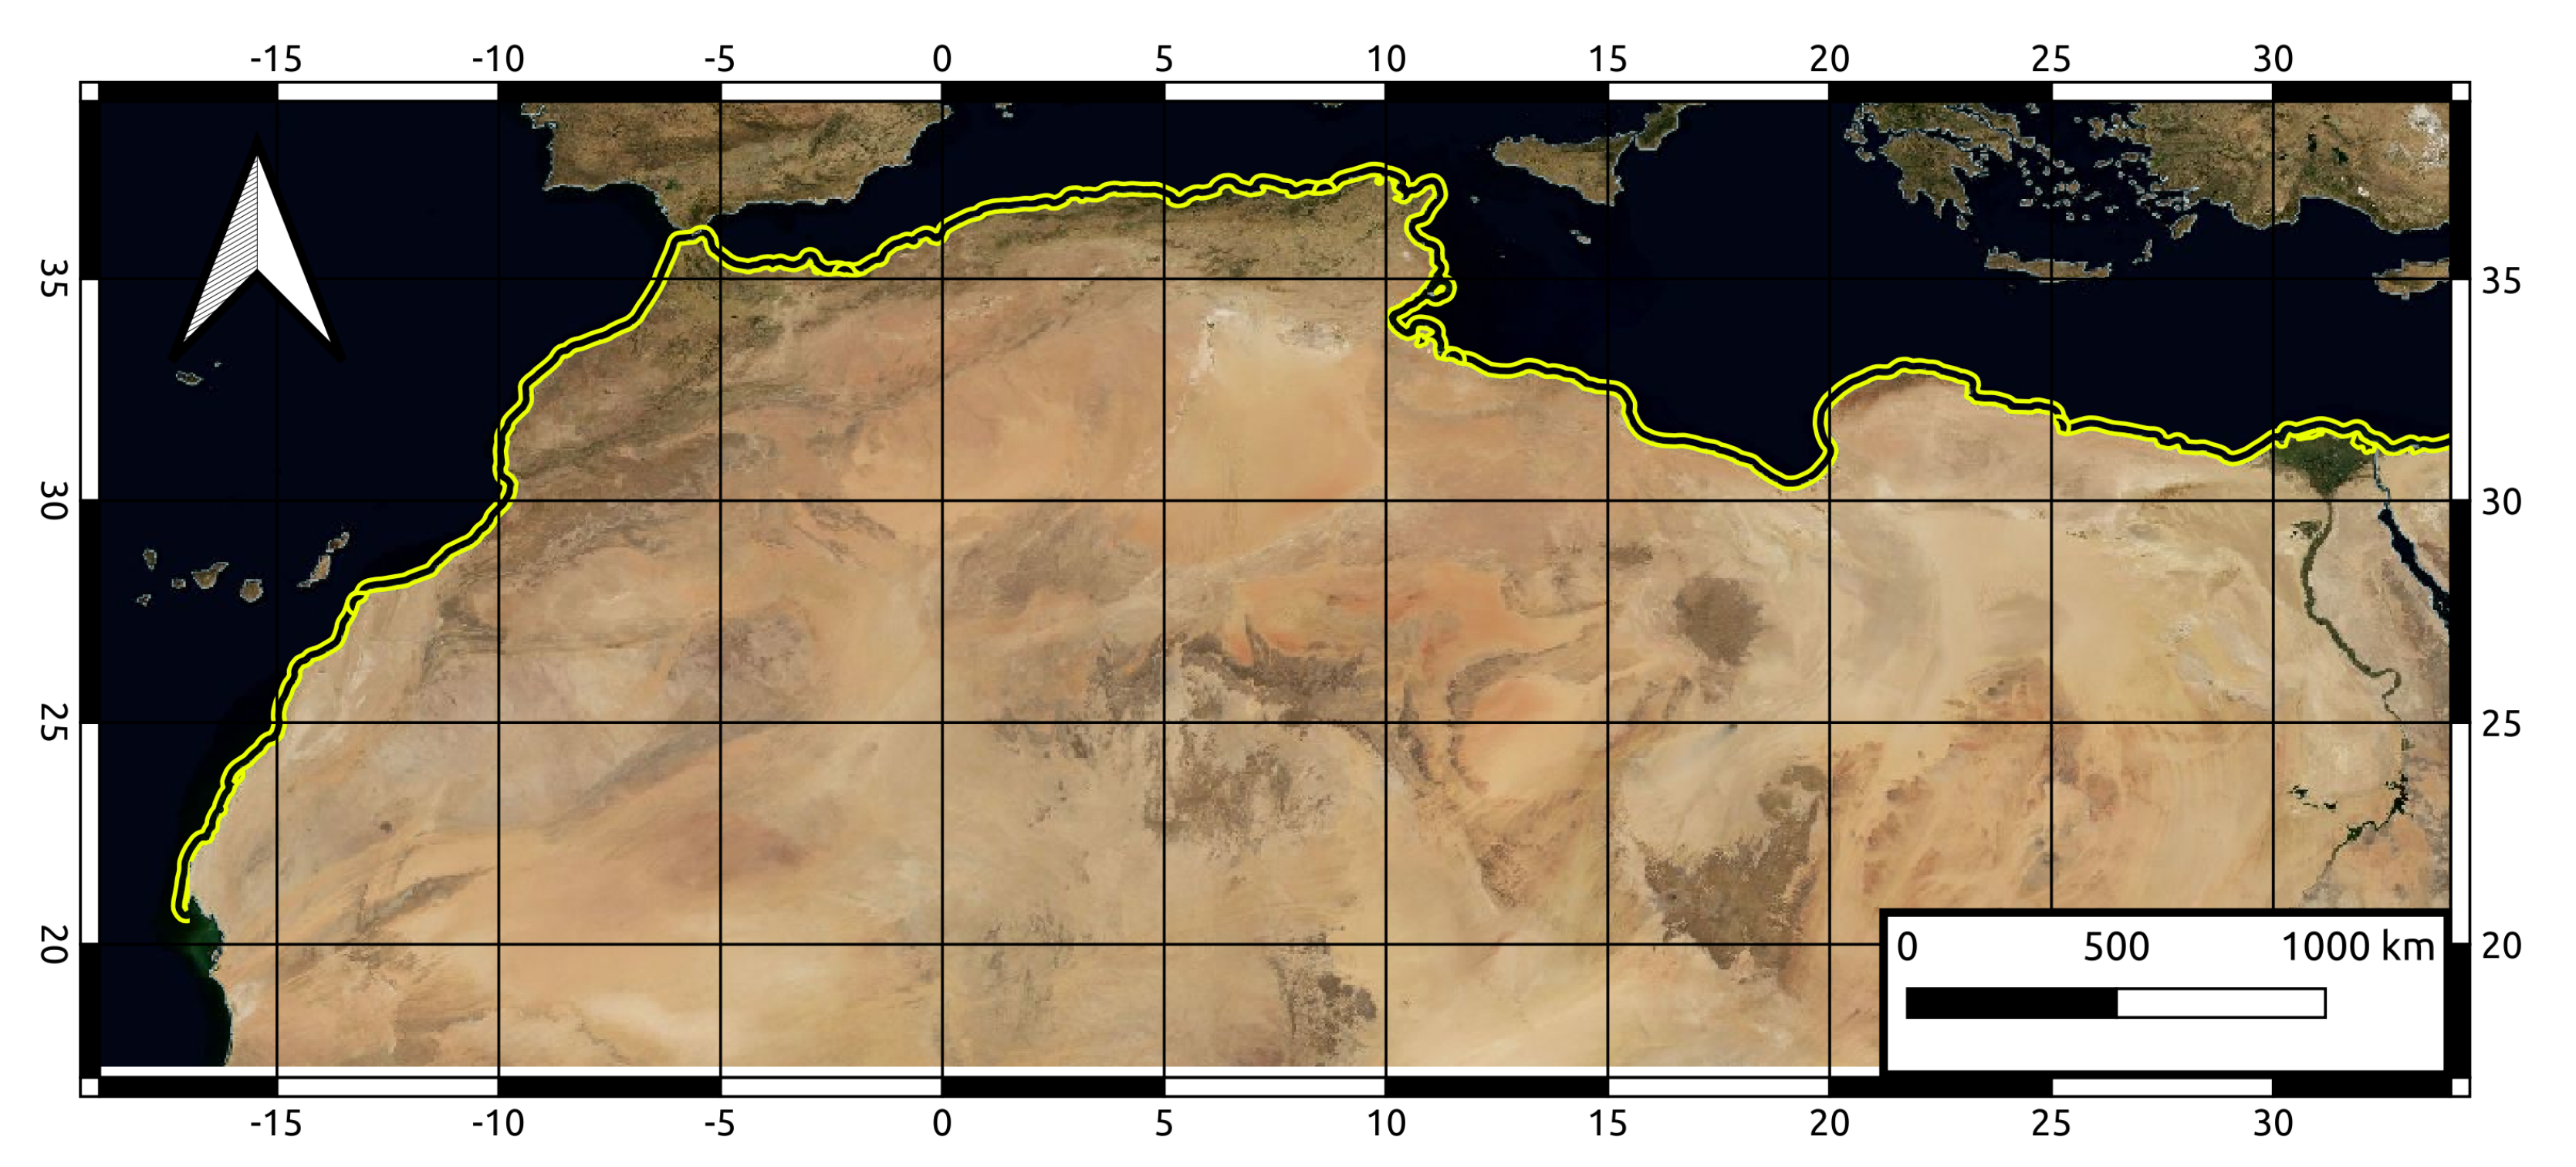
Abstract
:1. Introduction
2. Study Area and Data Source
2.1. Study Area
2.2. Sentinel 2A/B Images Retrieval
Global Water Mask
3. Methods
3.1. Physical Description
3.2. Numerical Implementation and Regional Application
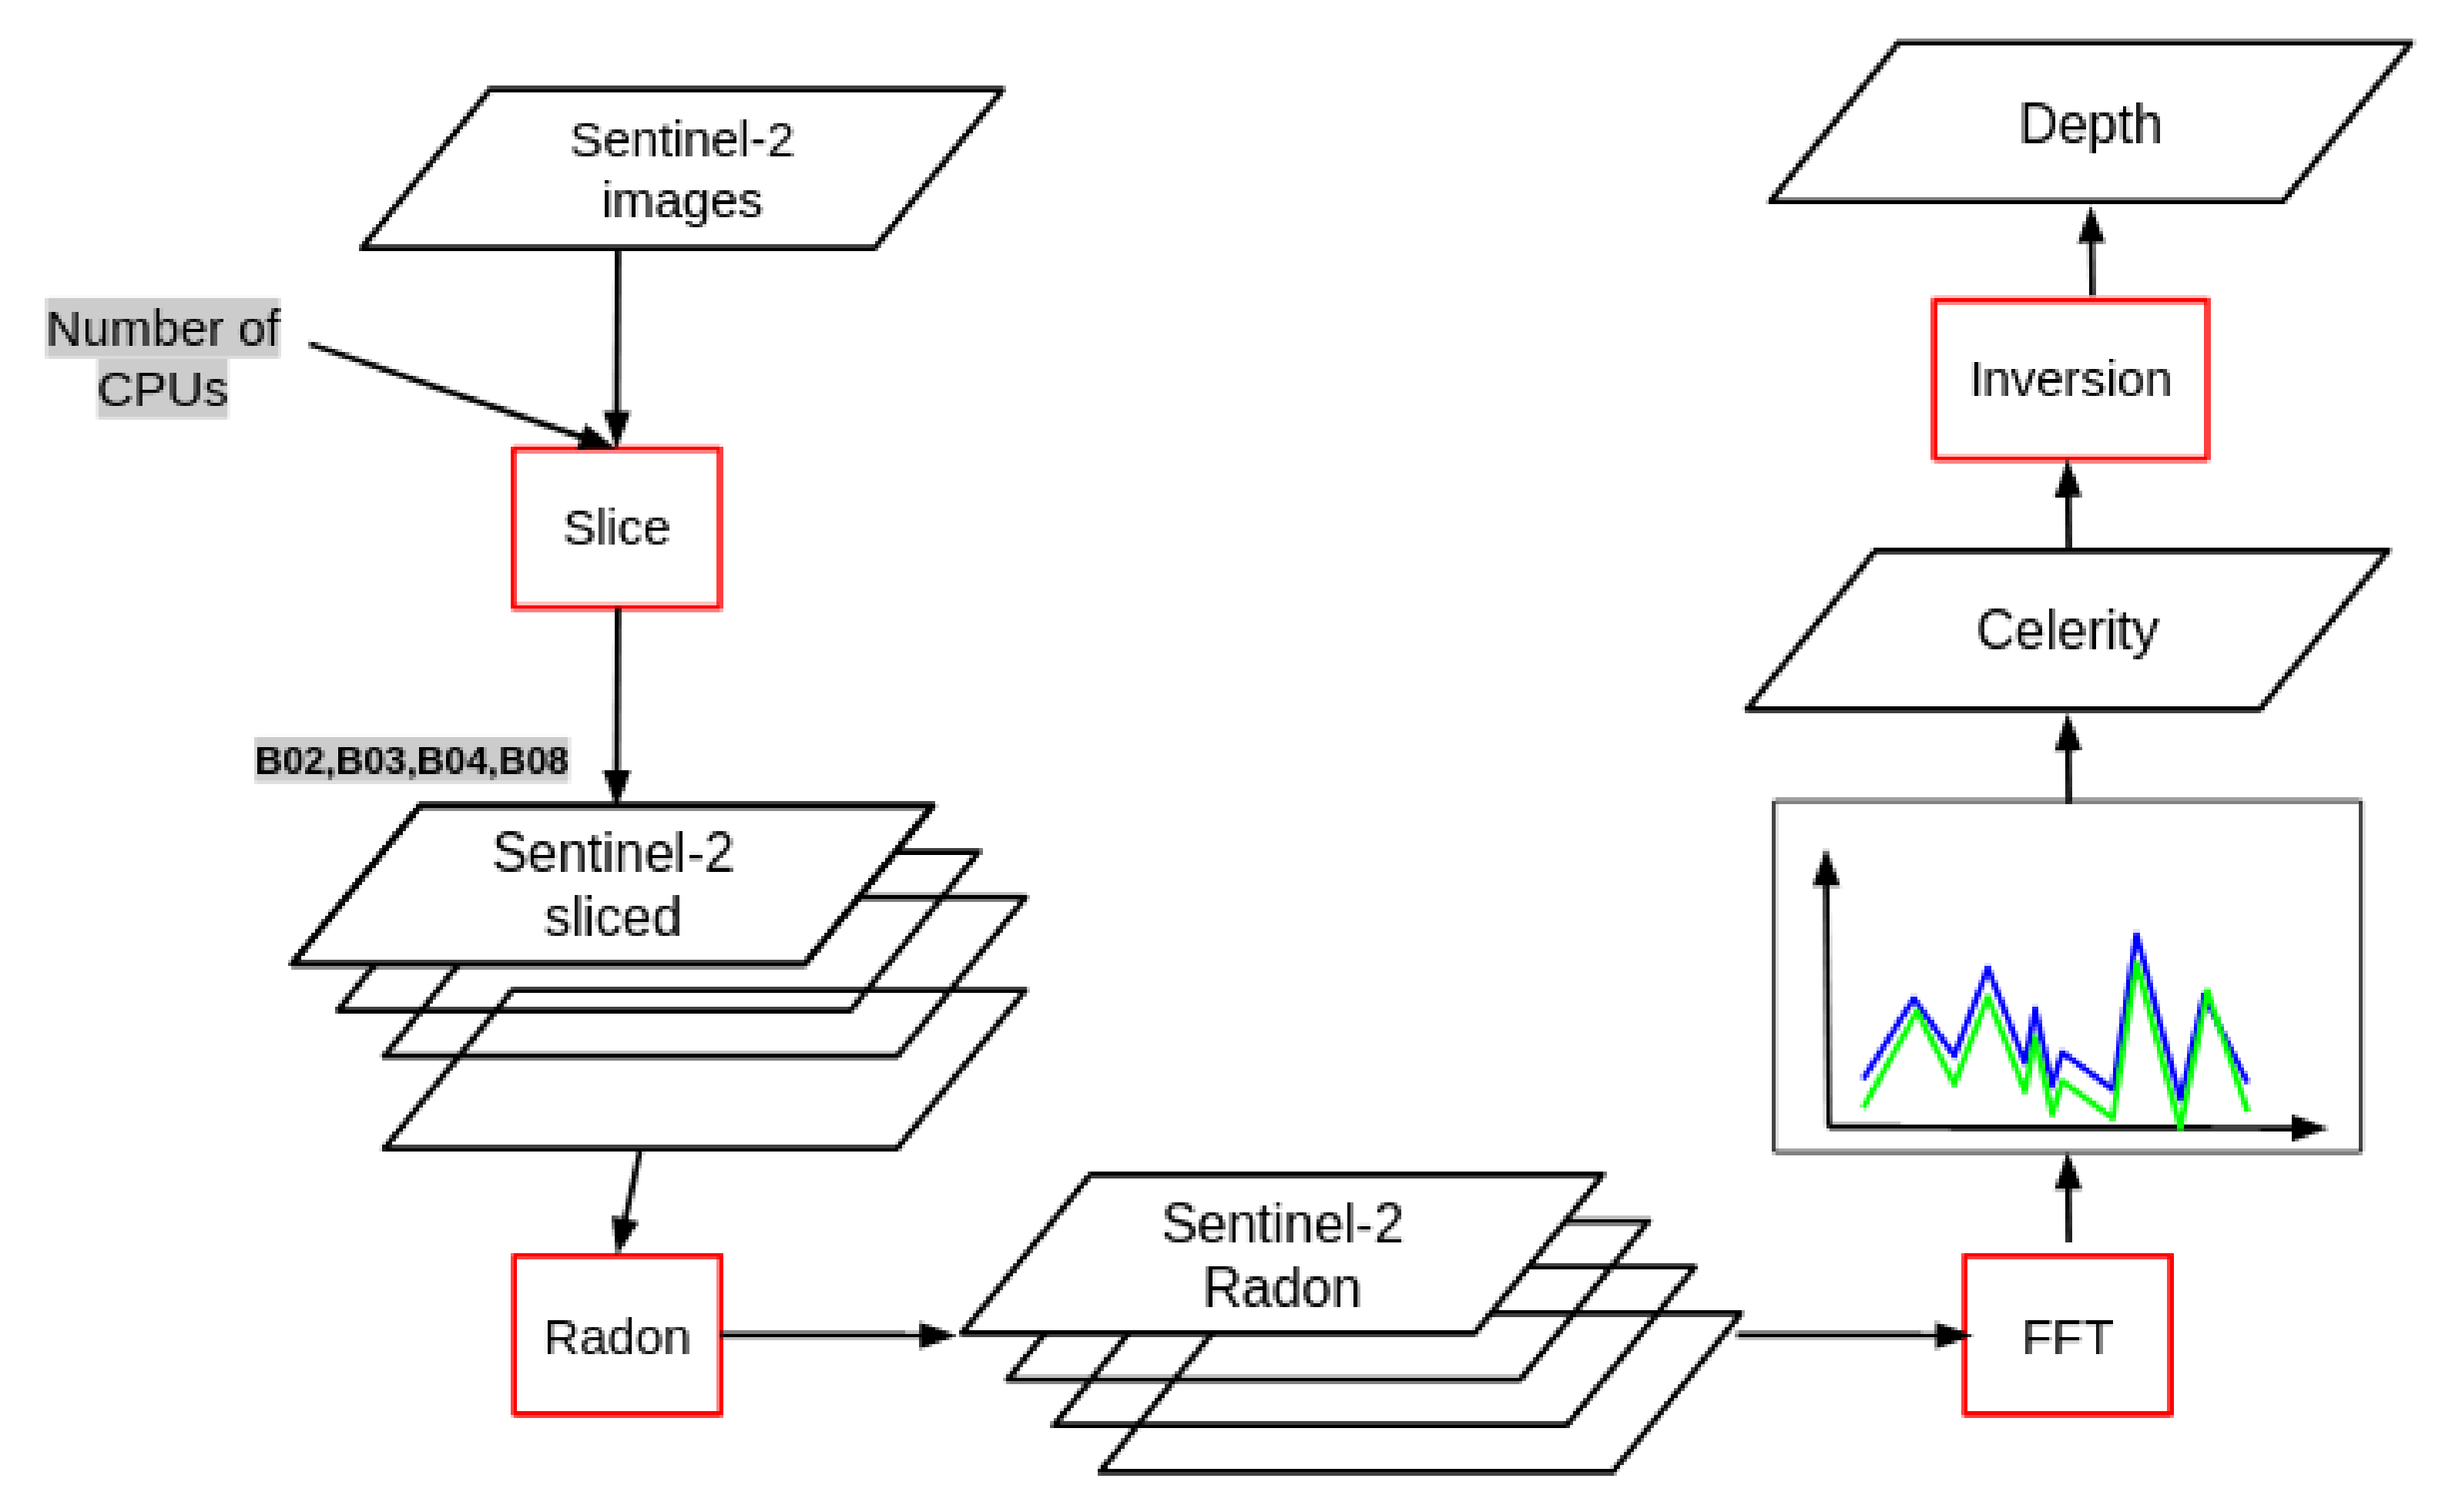
3.2.1. IT Workflow
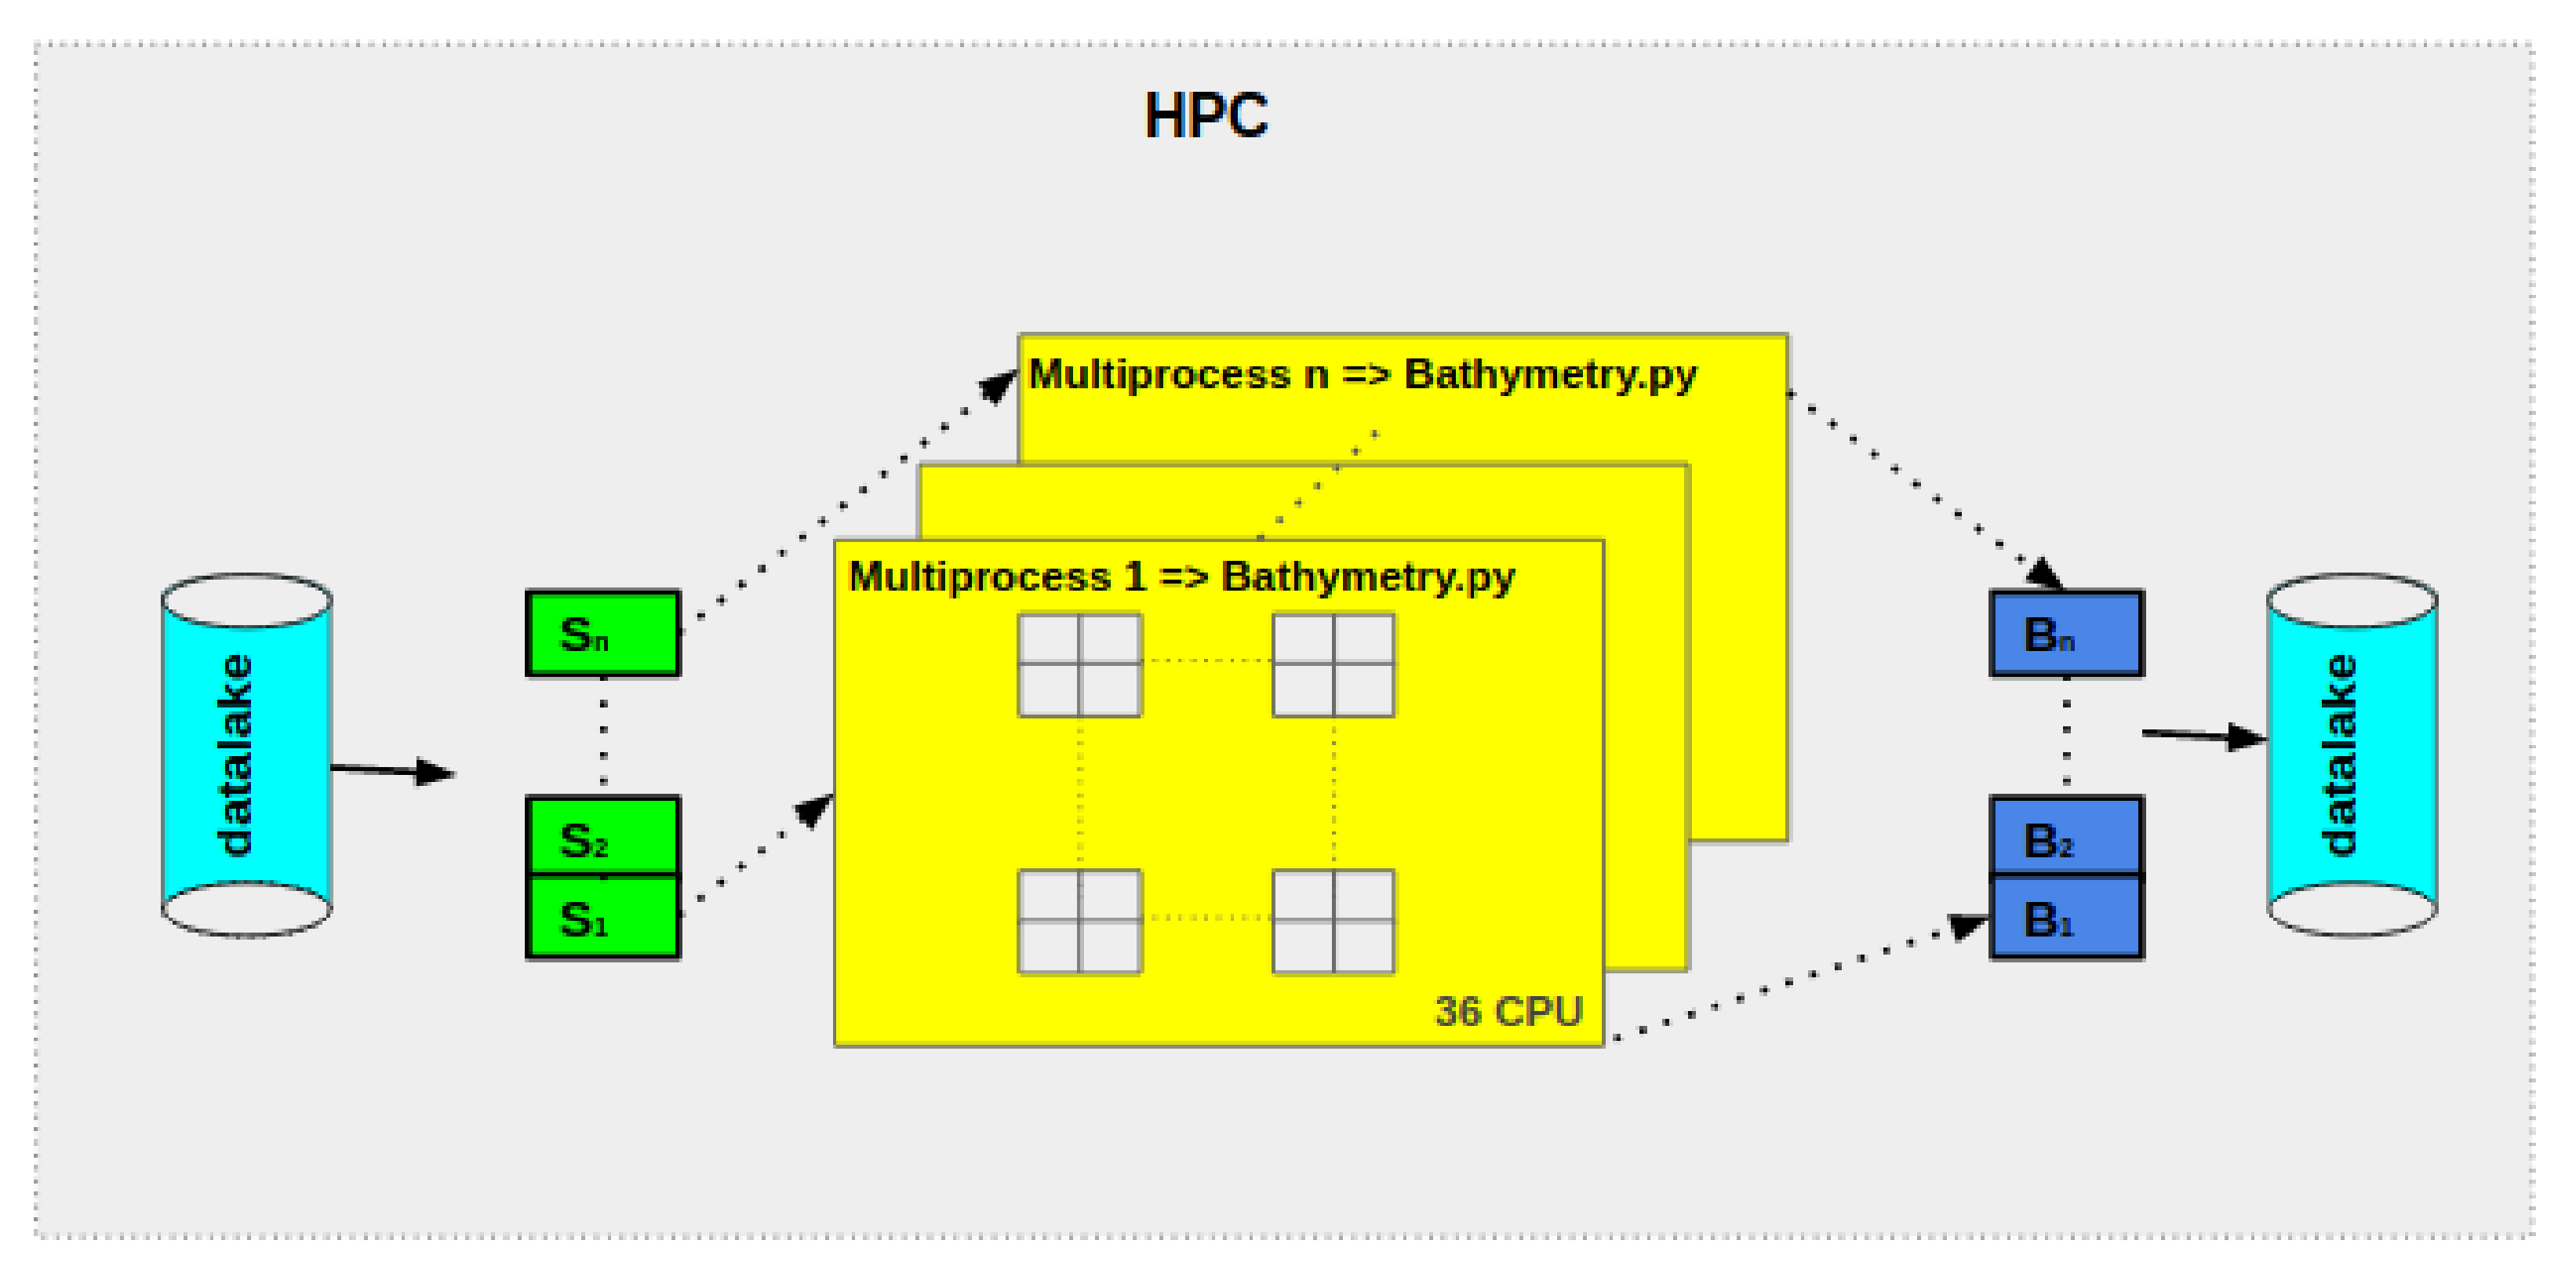
3.2.2. HPC Implementation
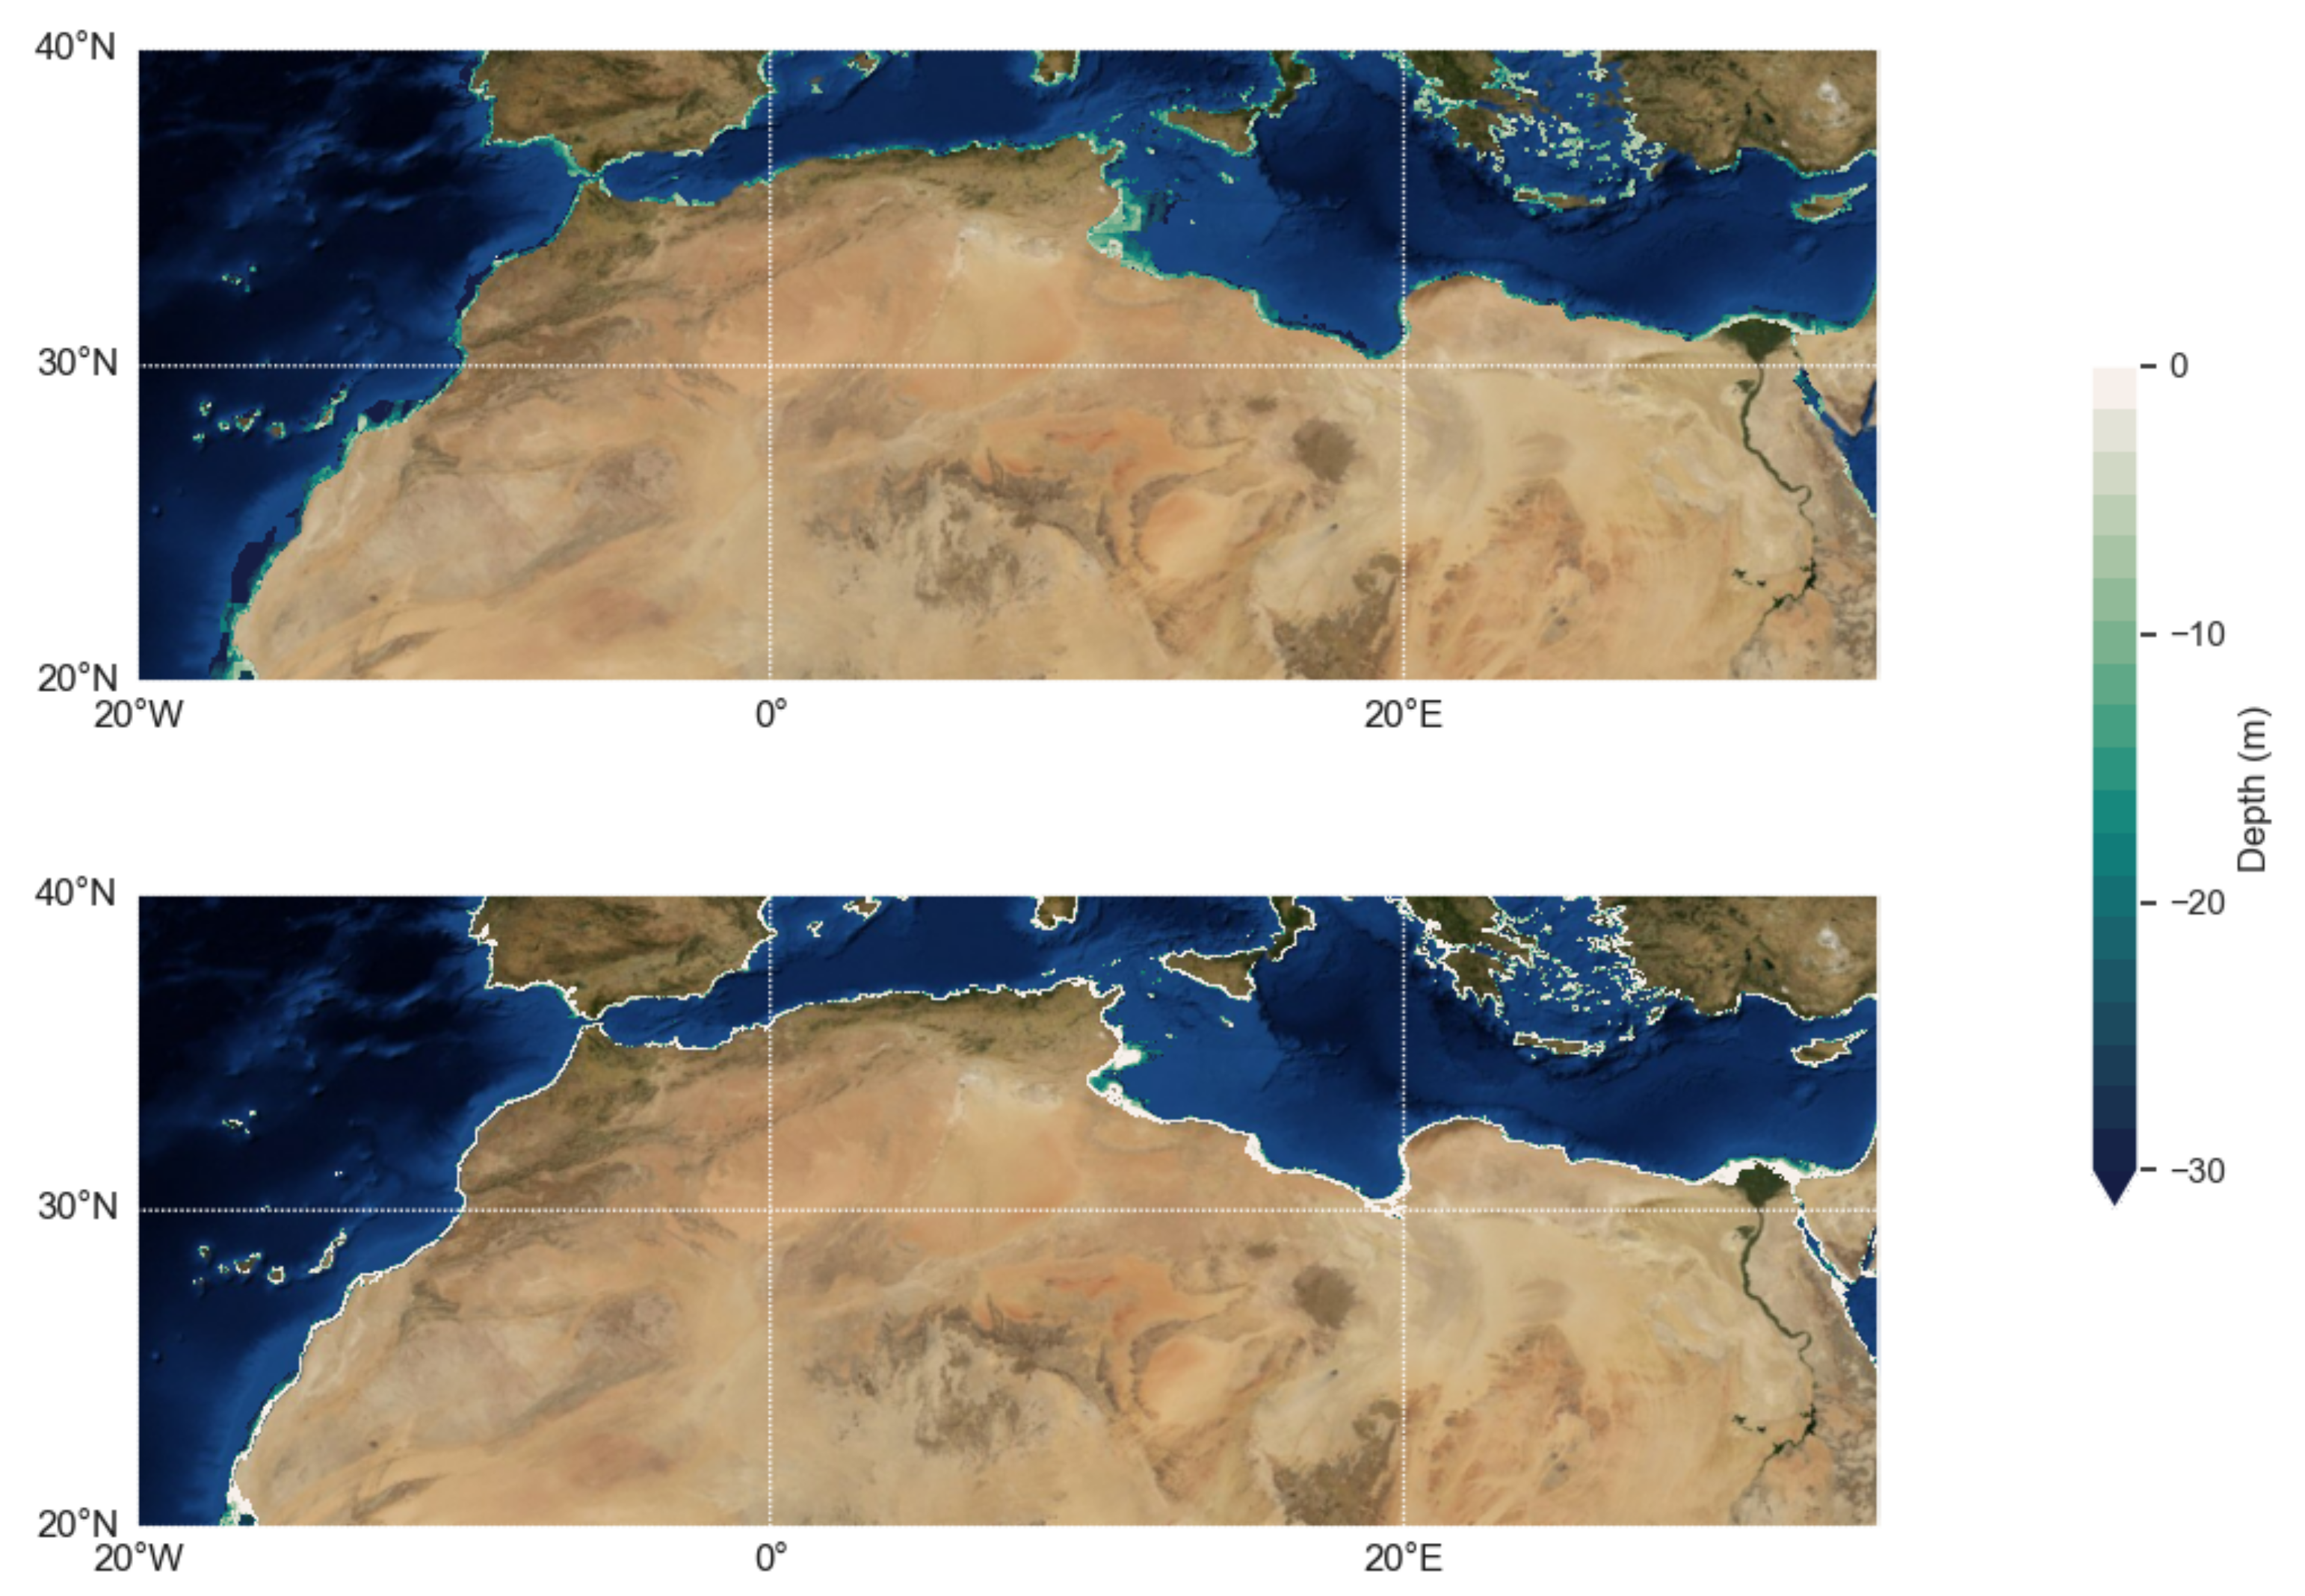
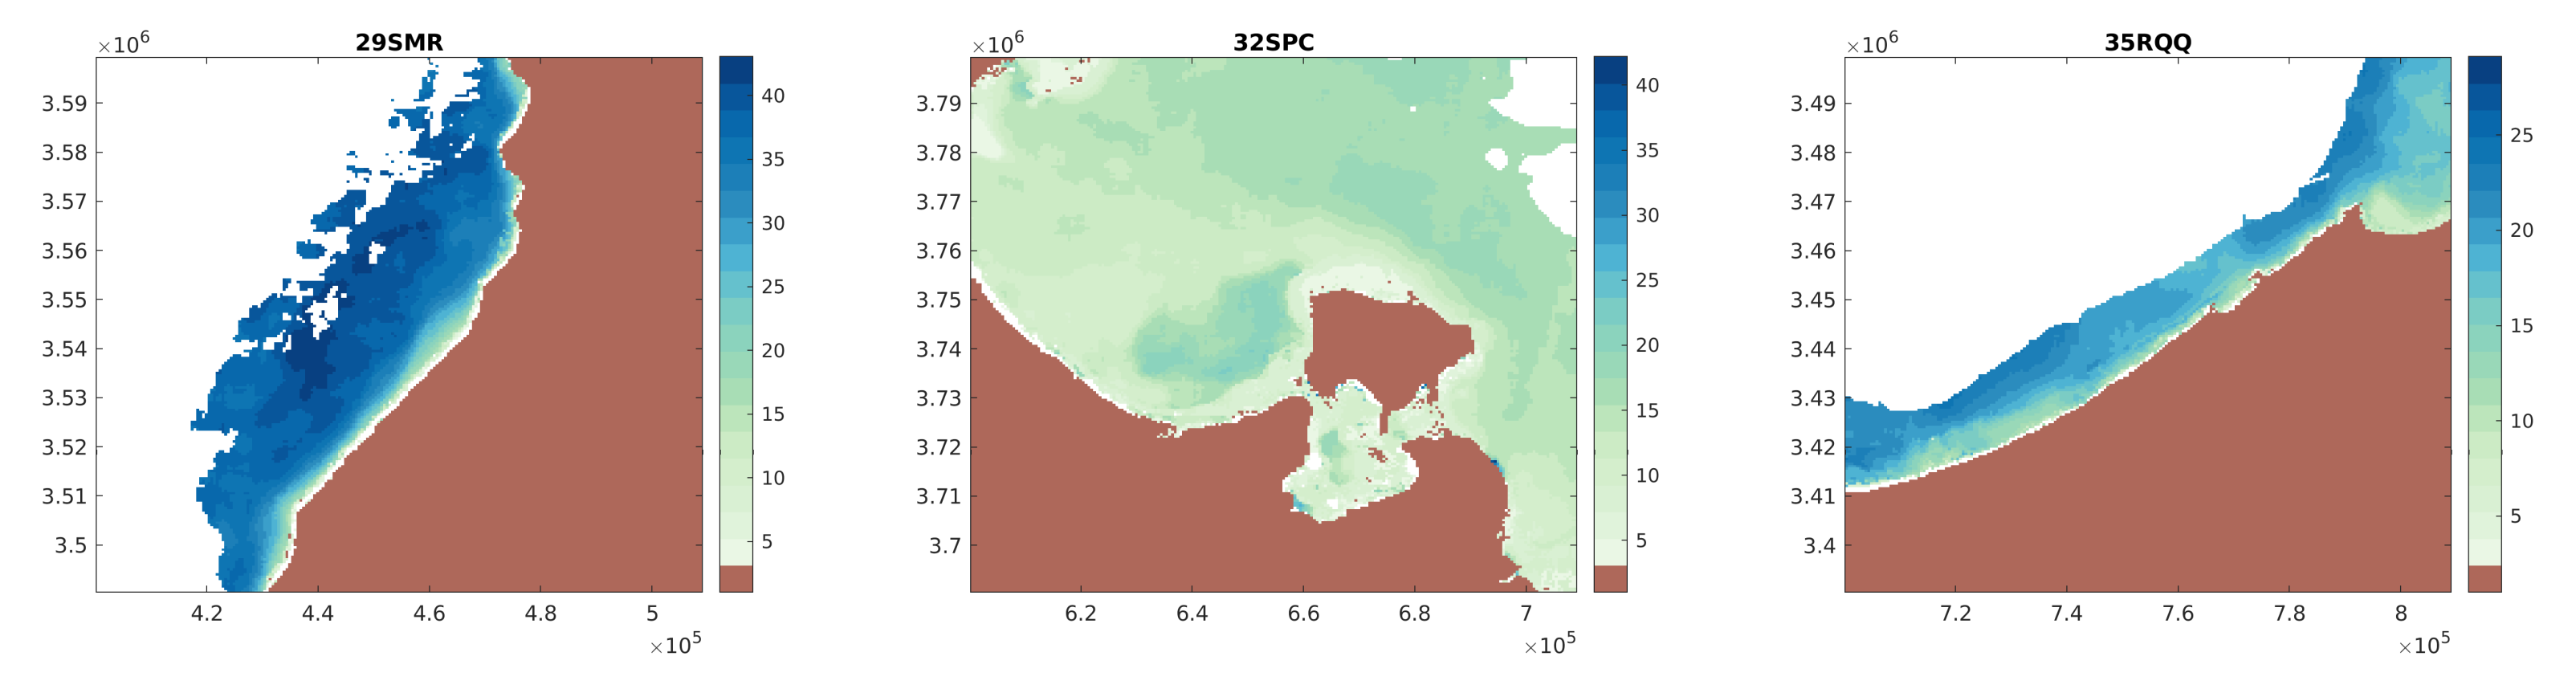
3.3. North Africa Coastal Bathymetry Showcase
4. Conclusions and Way Forward
Author Contributions
Funding
Data Availability Statement
Acknowledgments
Conflicts of Interest
References
- Jonkman, S.N.; Hillen, M.M.; Nicholls, R.J.; Kanning, W.; van Ledden, M. Costs of Adapting Coastal Defences to Sea-Level Rise—New Estimates and Their Implications. J. Coast. Res. 2013, 29, 1212–1226. [Google Scholar] [CrossRef]
- Guenther, G.C. Airborne lidar bathymetry. Digit. Elev. Model Technol. Appl. DEM Users Man. 2007, 2, 253–320. [Google Scholar]
- Irish, J.L.; White, T.E. Coastal engineering applications of high-resolution lidar bathymetry. Coast. Eng. 1998, 35, 47–71. [Google Scholar] [CrossRef]
- Heezen, B.C.; Tharp, M. World Ocean Floor Map. Available online: https://www.lib.uchicago.edu/collex/exhibits/marie-tharp-pioneering-oceanographer/1977-world-ocean-floor-map/ (accessed on 16 October 2021).
- Barton, C. Marie Tharp, oceanographic cartographer, and her contributions to the revolution in the Earth sciences. Geol. Soc. Lond. Spec. Publ. 2002, 192, 215–228. [Google Scholar] [CrossRef]
- Guenther, G.C.; Thomas, R.W.; LaRocque, P.E. Design considerations for achieving high accuracy with the SHOALS bathymetric lidar system. In CIS Selected Papers: Laser Remote Sensing of Natural Waters: From Theory to Practice; International Society for Optics and Photonics: Bellingham, WA, USA, 1996; Volume 2964, pp. 54–71. [Google Scholar]
- Irish, J.L.; McClung, J.; Lillycrop, W.J. Airborne Lidar Bathymetry: The SHOALS System. Available online: https://trid.trb.org/view/652843 (accessed on 16 October 2021).
- Cazenave, A.; Le Cozannet, G.; Benveniste, J.; Woodworth, P.; Champollion, N. Monitoring Coastal Zone Changes from Space. Available online: https://eos.org/opinions/monitoring-coastal-zone-changes-from-space (accessed on 16 October 2021).
- Hamylton, S.M.; Hedley, J.D.; Beaman, R.J. Derivation of high-resolution bathymetry from multispectral satellite imagery: A comparison of empirical and optimisation methods through geographical error analysis. Remote Sens. 2015, 7, 16257–16273. [Google Scholar] [CrossRef] [Green Version]
- Chybicki, A. Mapping south baltic near-shore bathymetry using Sentinel-2 observations. Pol. Marit. Res. 2017, 24, 15–25. [Google Scholar] [CrossRef]
- Stumpf, R.P.; Holderied, K.; Sinclair, M. Determination of water depth with high-resolution satellite imagery over variable bottom types. Limnol. Oceanogr. 2003, 48, 547–556. [Google Scholar] [CrossRef]
- Lyons, M.; Phinn, S.; Roelfsema, C. Integrating Quickbird multi-spectral satellite and field data: Mapping bathymetry, seagrass cover, seagrass species and change in Moreton Bay, Australia in 2004 and 2007. Remote Sens. 2011, 3, 42–64. [Google Scholar] [CrossRef] [Green Version]
- Hzami, A.; Heggy, E.; Amrouni, O.; Mahé, G.; Maanan, M.; Abdeljaouad, S. Alarming coastal vulnerability of the deltaic and sandy beaches of North Africa. Sci. Rep. 2021, 11, 2320. [Google Scholar] [CrossRef]
- Snoussi, M.; Ouchani, T.; Niazi, S. Vulnerability assessment of the impact of sea-level rise and flooding on the Moroccan coast: The case of the Mediterranean eastern zone. Estuar. Coast. Shelf Sci. 2008, 77, 206–213. [Google Scholar] [CrossRef]
- Hakkou, M.; Maanan, M.; Belrhaba, T.; El Khalidi, K.; El Ouai, D.; Benmohammadi, A. Multi-decadal assessment of shoreline changes using geospatial tools and automatic computation in Kenitra coast, Morocco. Ocean Coast. Manag. 2018, 163, 232–239. [Google Scholar] [CrossRef]
- ESA Sentinel-2 Delivers First Images. Available online: https://www.esa.int/Applications/Observing_the_Earth/Copernicus/Sentinel-2/Sentinel-2_delivers_first_images (accessed on 16 October 2021).
- Bergsma, E.W.J.; Almar, R. Coastal coverage of ESA’ Sentinel 2 mission. Adv. Space Res. 2020, 65, 2636–2644. [Google Scholar] [CrossRef]
- Bergsma, E.W.J.; Almar, R.; Maisongrande, P. Radon-Augmented Sentinel-2 Satellite Imagery to Derive Wave-Patterns and Regional Bathymetry. Remote Sens. 2019, 11, 1918. [Google Scholar] [CrossRef] [Green Version]
- Daly, C.J.; Baba, W.; Bergsma, E.; Almar, R.; Garlan, T. The New Era of Regional Coastal Bathymetry from Space: A Showcase for West Africa using Sentinel-2 Imagery. Available online: https://eartharxiv.org/repository/view/187/ (accessed on 16 October 2021).
- Almar, R.; Bergsma, E.W.; Maisongrande, P.; de Almeida, L.P.M. Wave-derived coastal bathymetry from satellite video imagery: A showcase with pleiades persistent mode. Remote Sens. Environ. 2019, 231, 111263. [Google Scholar] [CrossRef]


Publisher’s Note: MDPI stays neutral with regard to jurisdictional claims in published maps and institutional affiliations. |
© 2021 by the authors. Licensee MDPI, Basel, Switzerland. This article is an open access article distributed under the terms and conditions of the Creative Commons Attribution (CC BY) license (https://creativecommons.org/licenses/by/4.0/).
Share and Cite
Baba, M.W.; Thoumyre, G.; Bergsma, E.W.J.; Daly, C.J.; Almar, R. Deriving Large-Scale Coastal Bathymetry from Sentinel-2 Images Using an HIGH-Performance Cluster: A Case Study Covering North Africa’s Coastal Zone. Sensors 2021, 21, 7006. https://0-doi-org.brum.beds.ac.uk/10.3390/s21217006
Baba MW, Thoumyre G, Bergsma EWJ, Daly CJ, Almar R. Deriving Large-Scale Coastal Bathymetry from Sentinel-2 Images Using an HIGH-Performance Cluster: A Case Study Covering North Africa’s Coastal Zone. Sensors. 2021; 21(21):7006. https://0-doi-org.brum.beds.ac.uk/10.3390/s21217006
Chicago/Turabian StyleBaba, Mohamed Wassim, Gregoire Thoumyre, Erwin W. J. Bergsma, Christopher J. Daly, and Rafael Almar. 2021. "Deriving Large-Scale Coastal Bathymetry from Sentinel-2 Images Using an HIGH-Performance Cluster: A Case Study Covering North Africa’s Coastal Zone" Sensors 21, no. 21: 7006. https://0-doi-org.brum.beds.ac.uk/10.3390/s21217006