
Validation of an Embedded Motion-Capture and EMG Setup for the Analysis of Musculoskeletal Disorder Risks during Manhole Cover Handling


Abstract
:1. Introduction
2. Materials and Methods
2.1. Participants
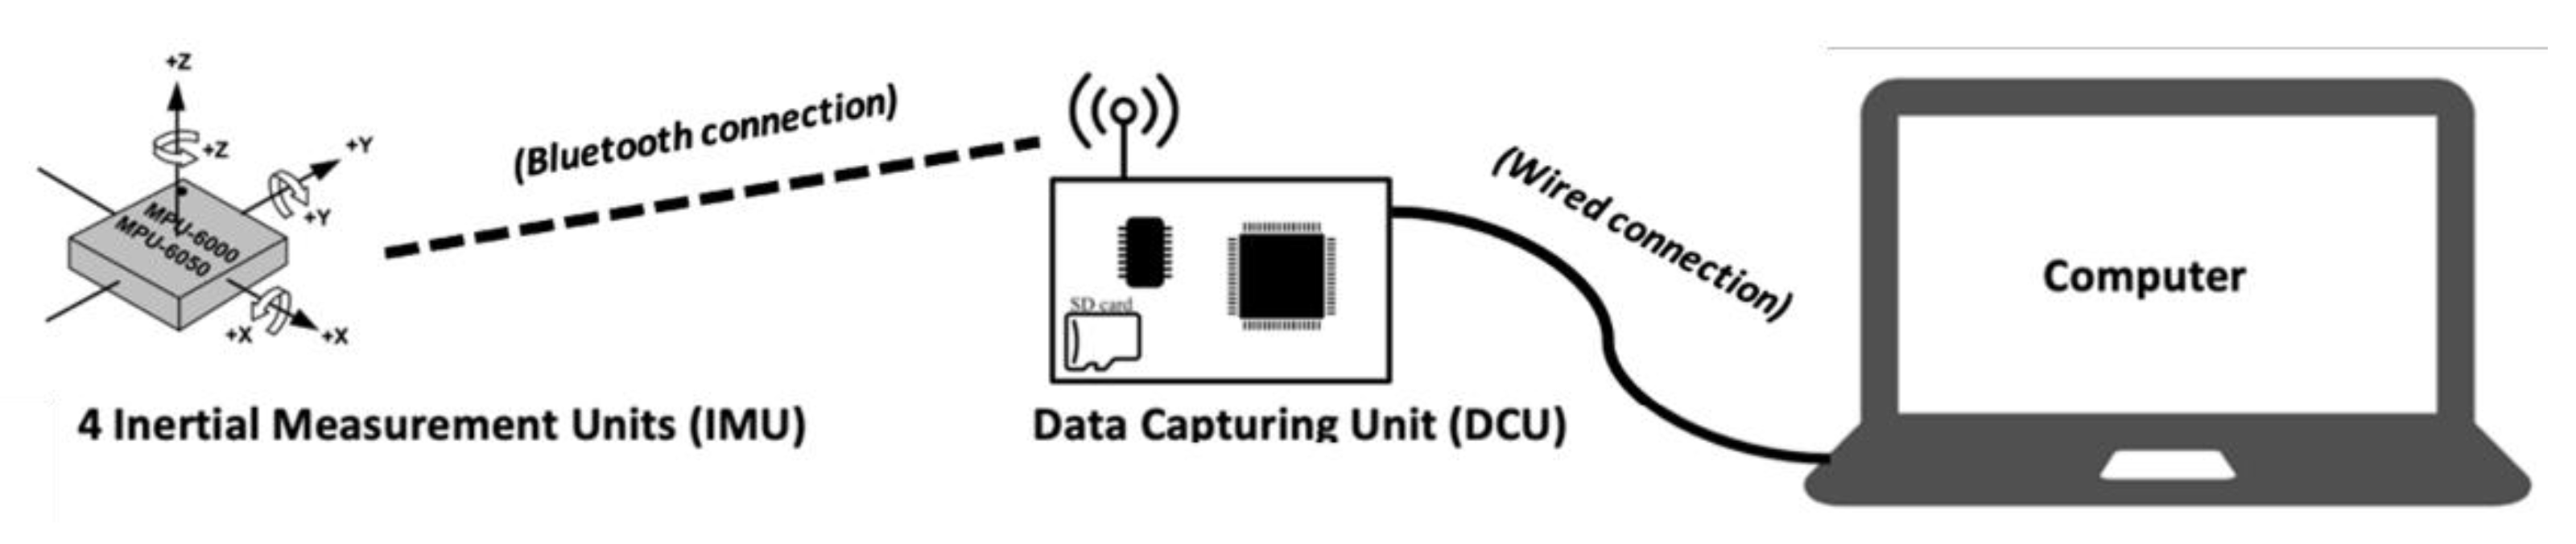
2.2. Material
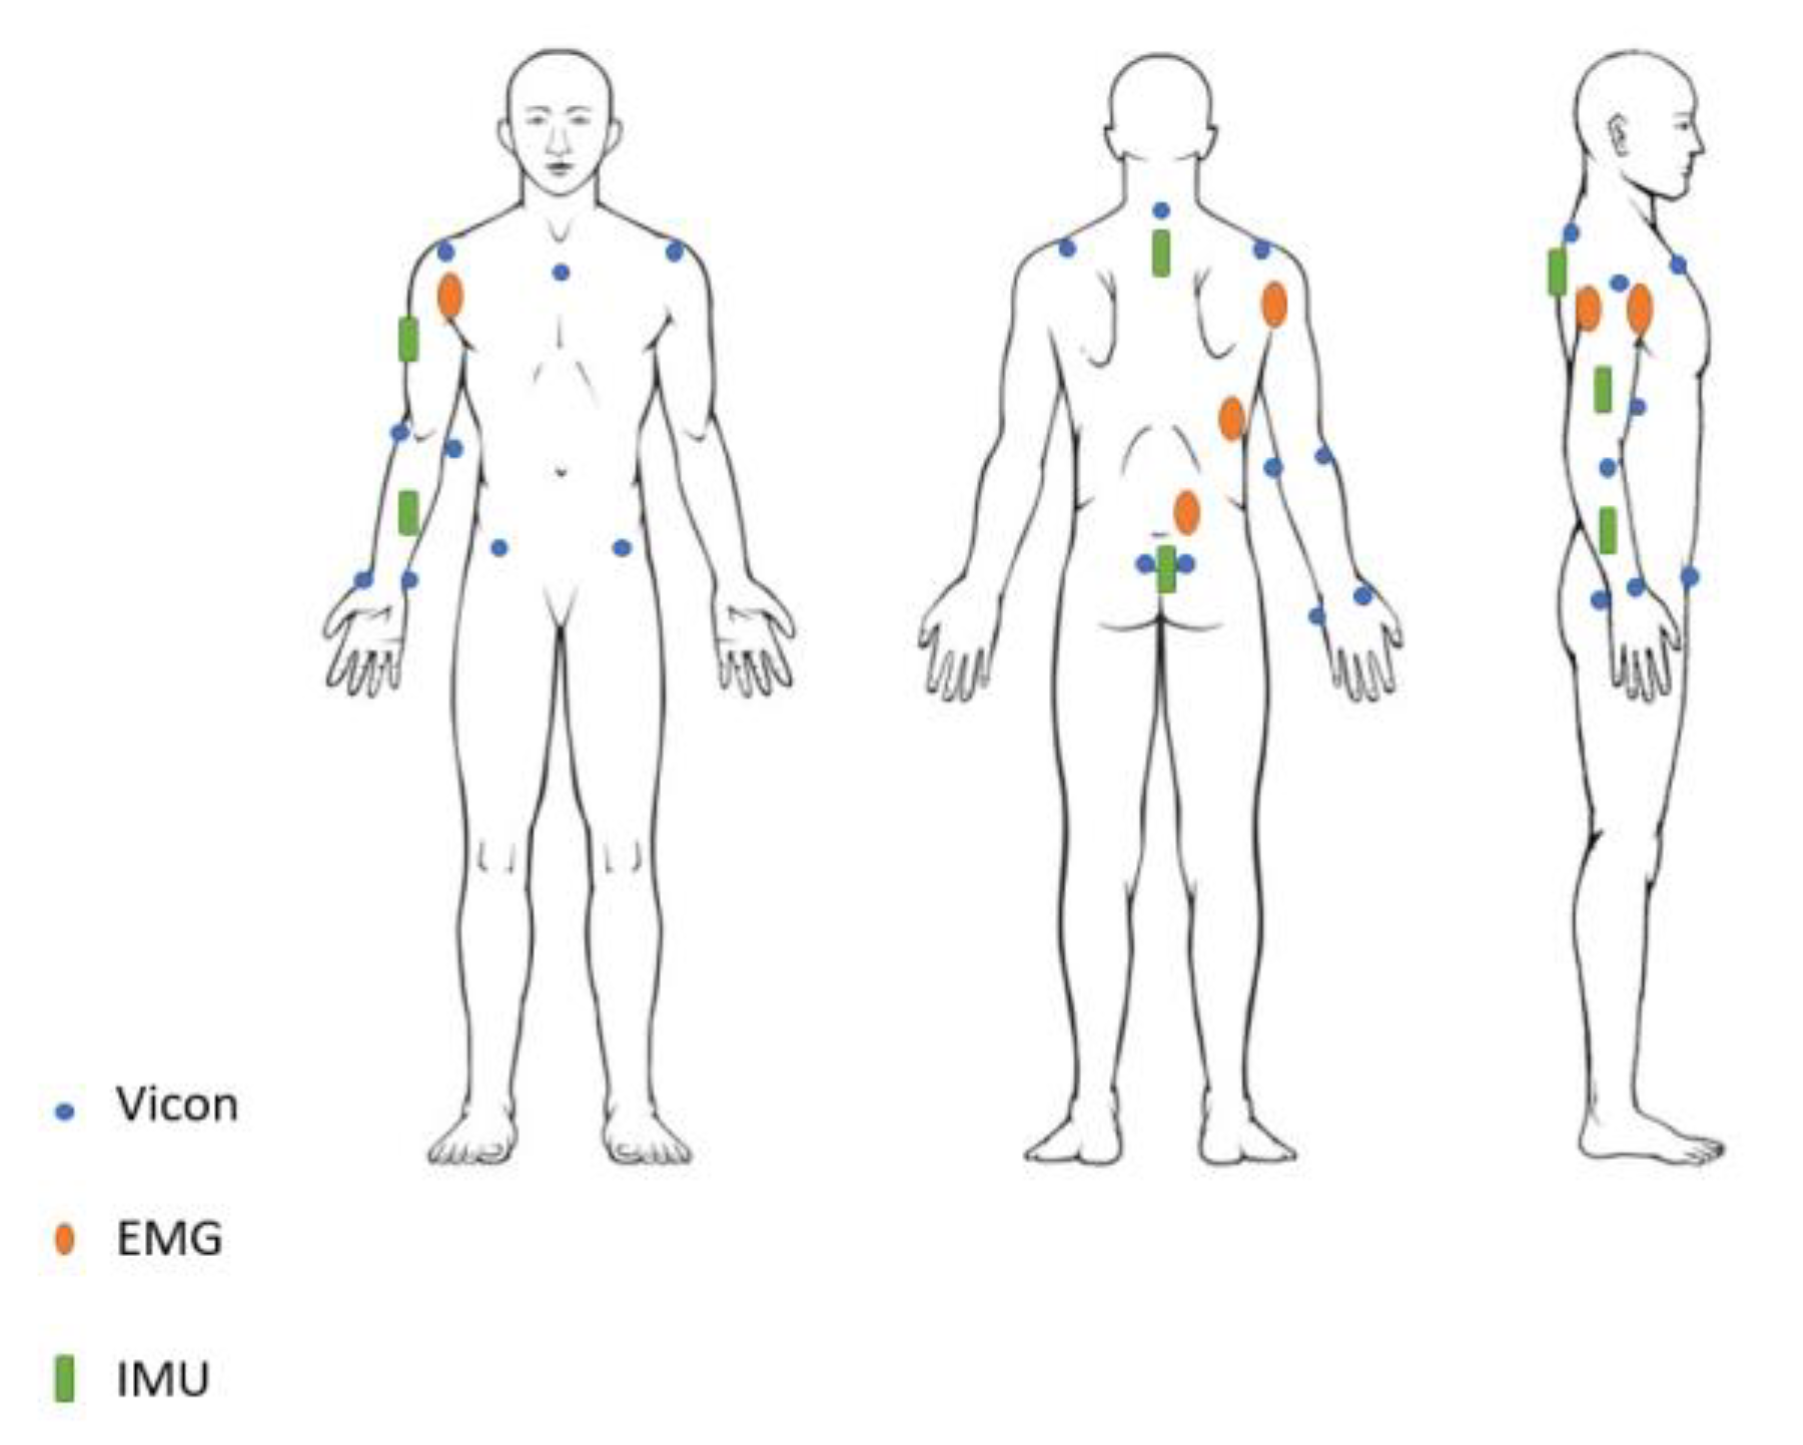
2.2.1. IMU Positioning
2.2.2. VICON Markers Positioning
2.2.3. EMG Positioning
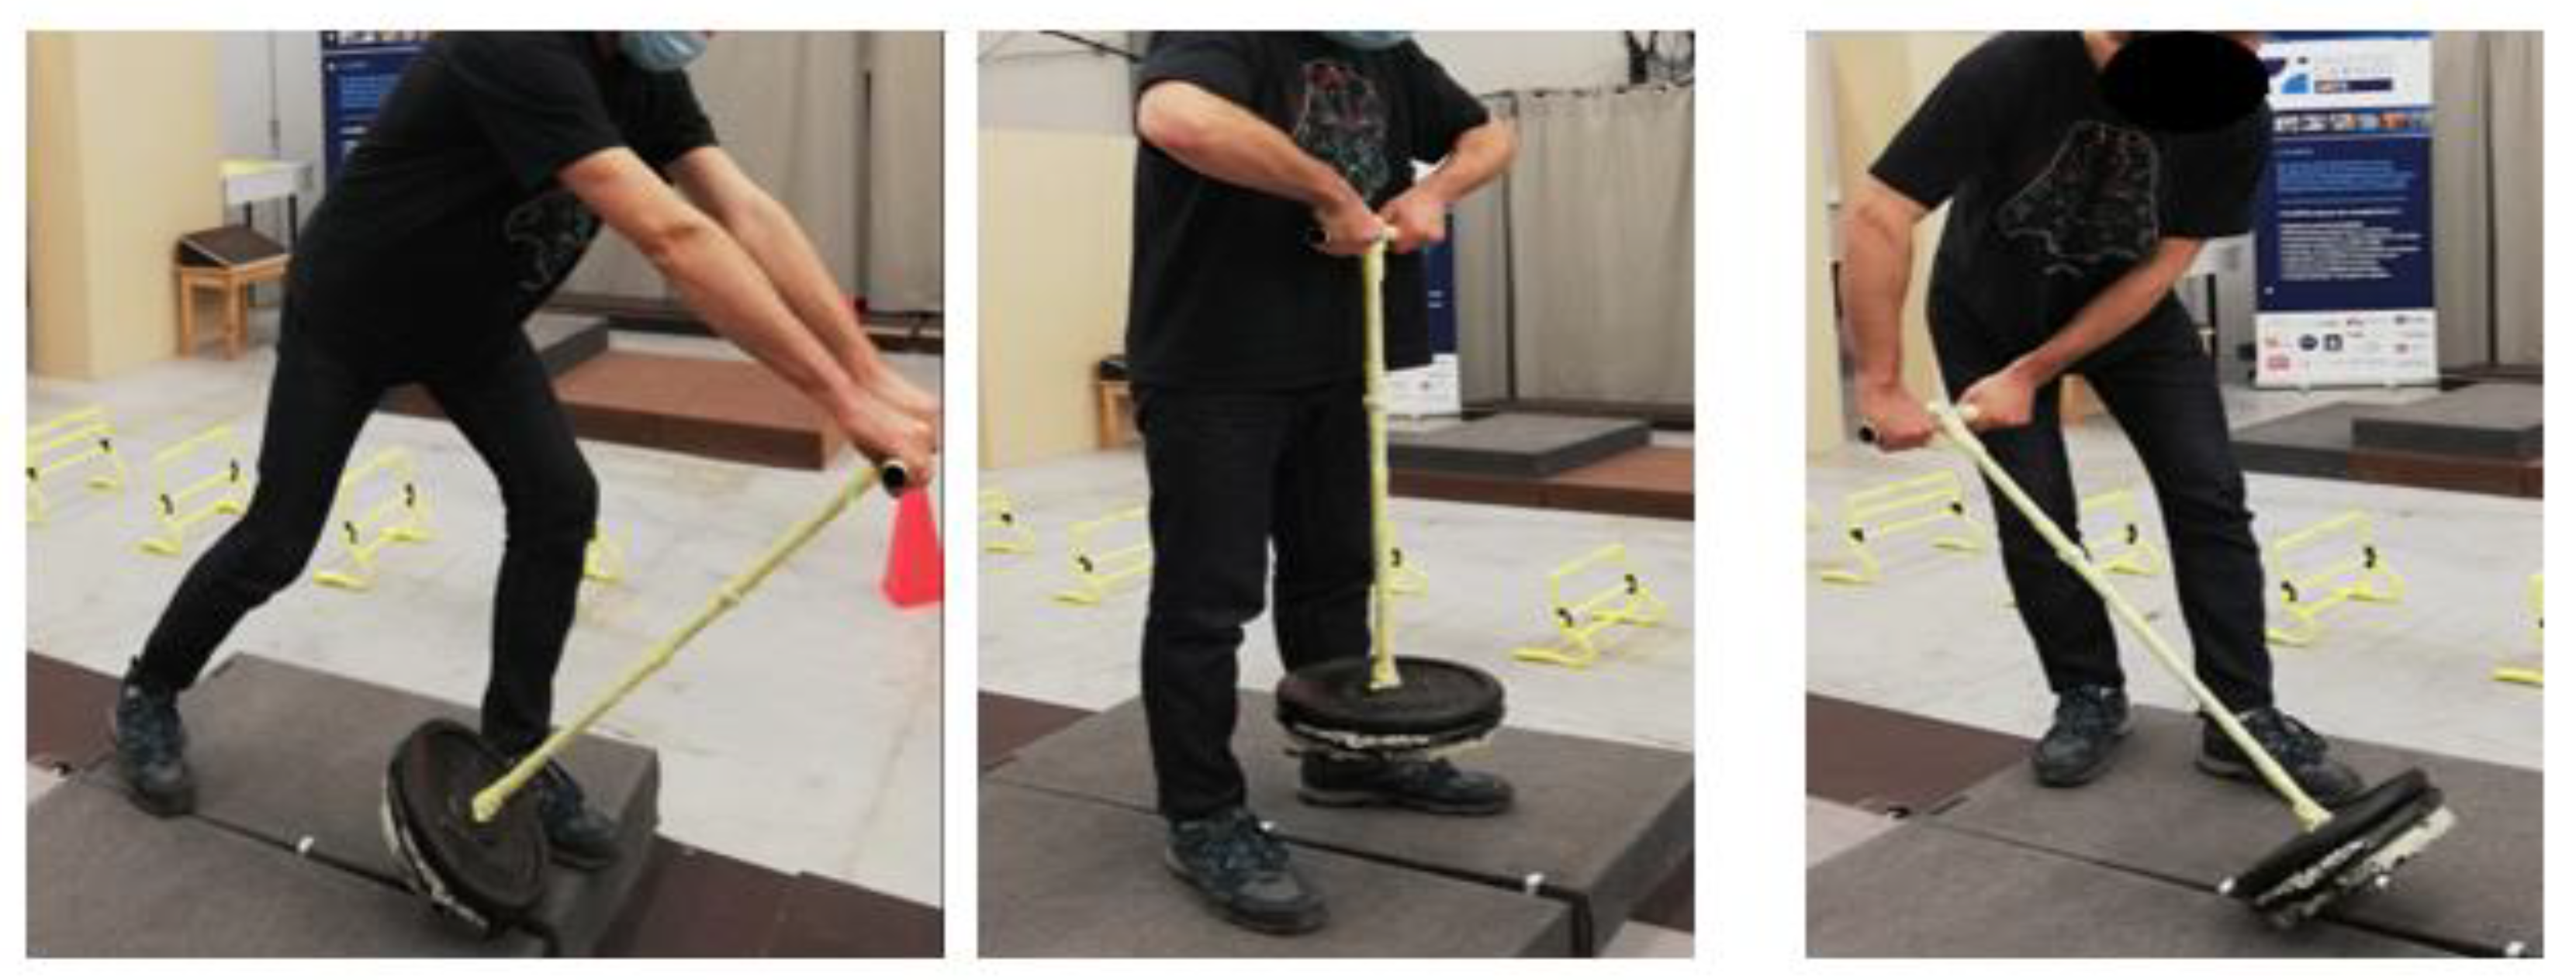
2.3. Protocol
2.4. Data Processing
2.4.1. Synchronisation and Filtering
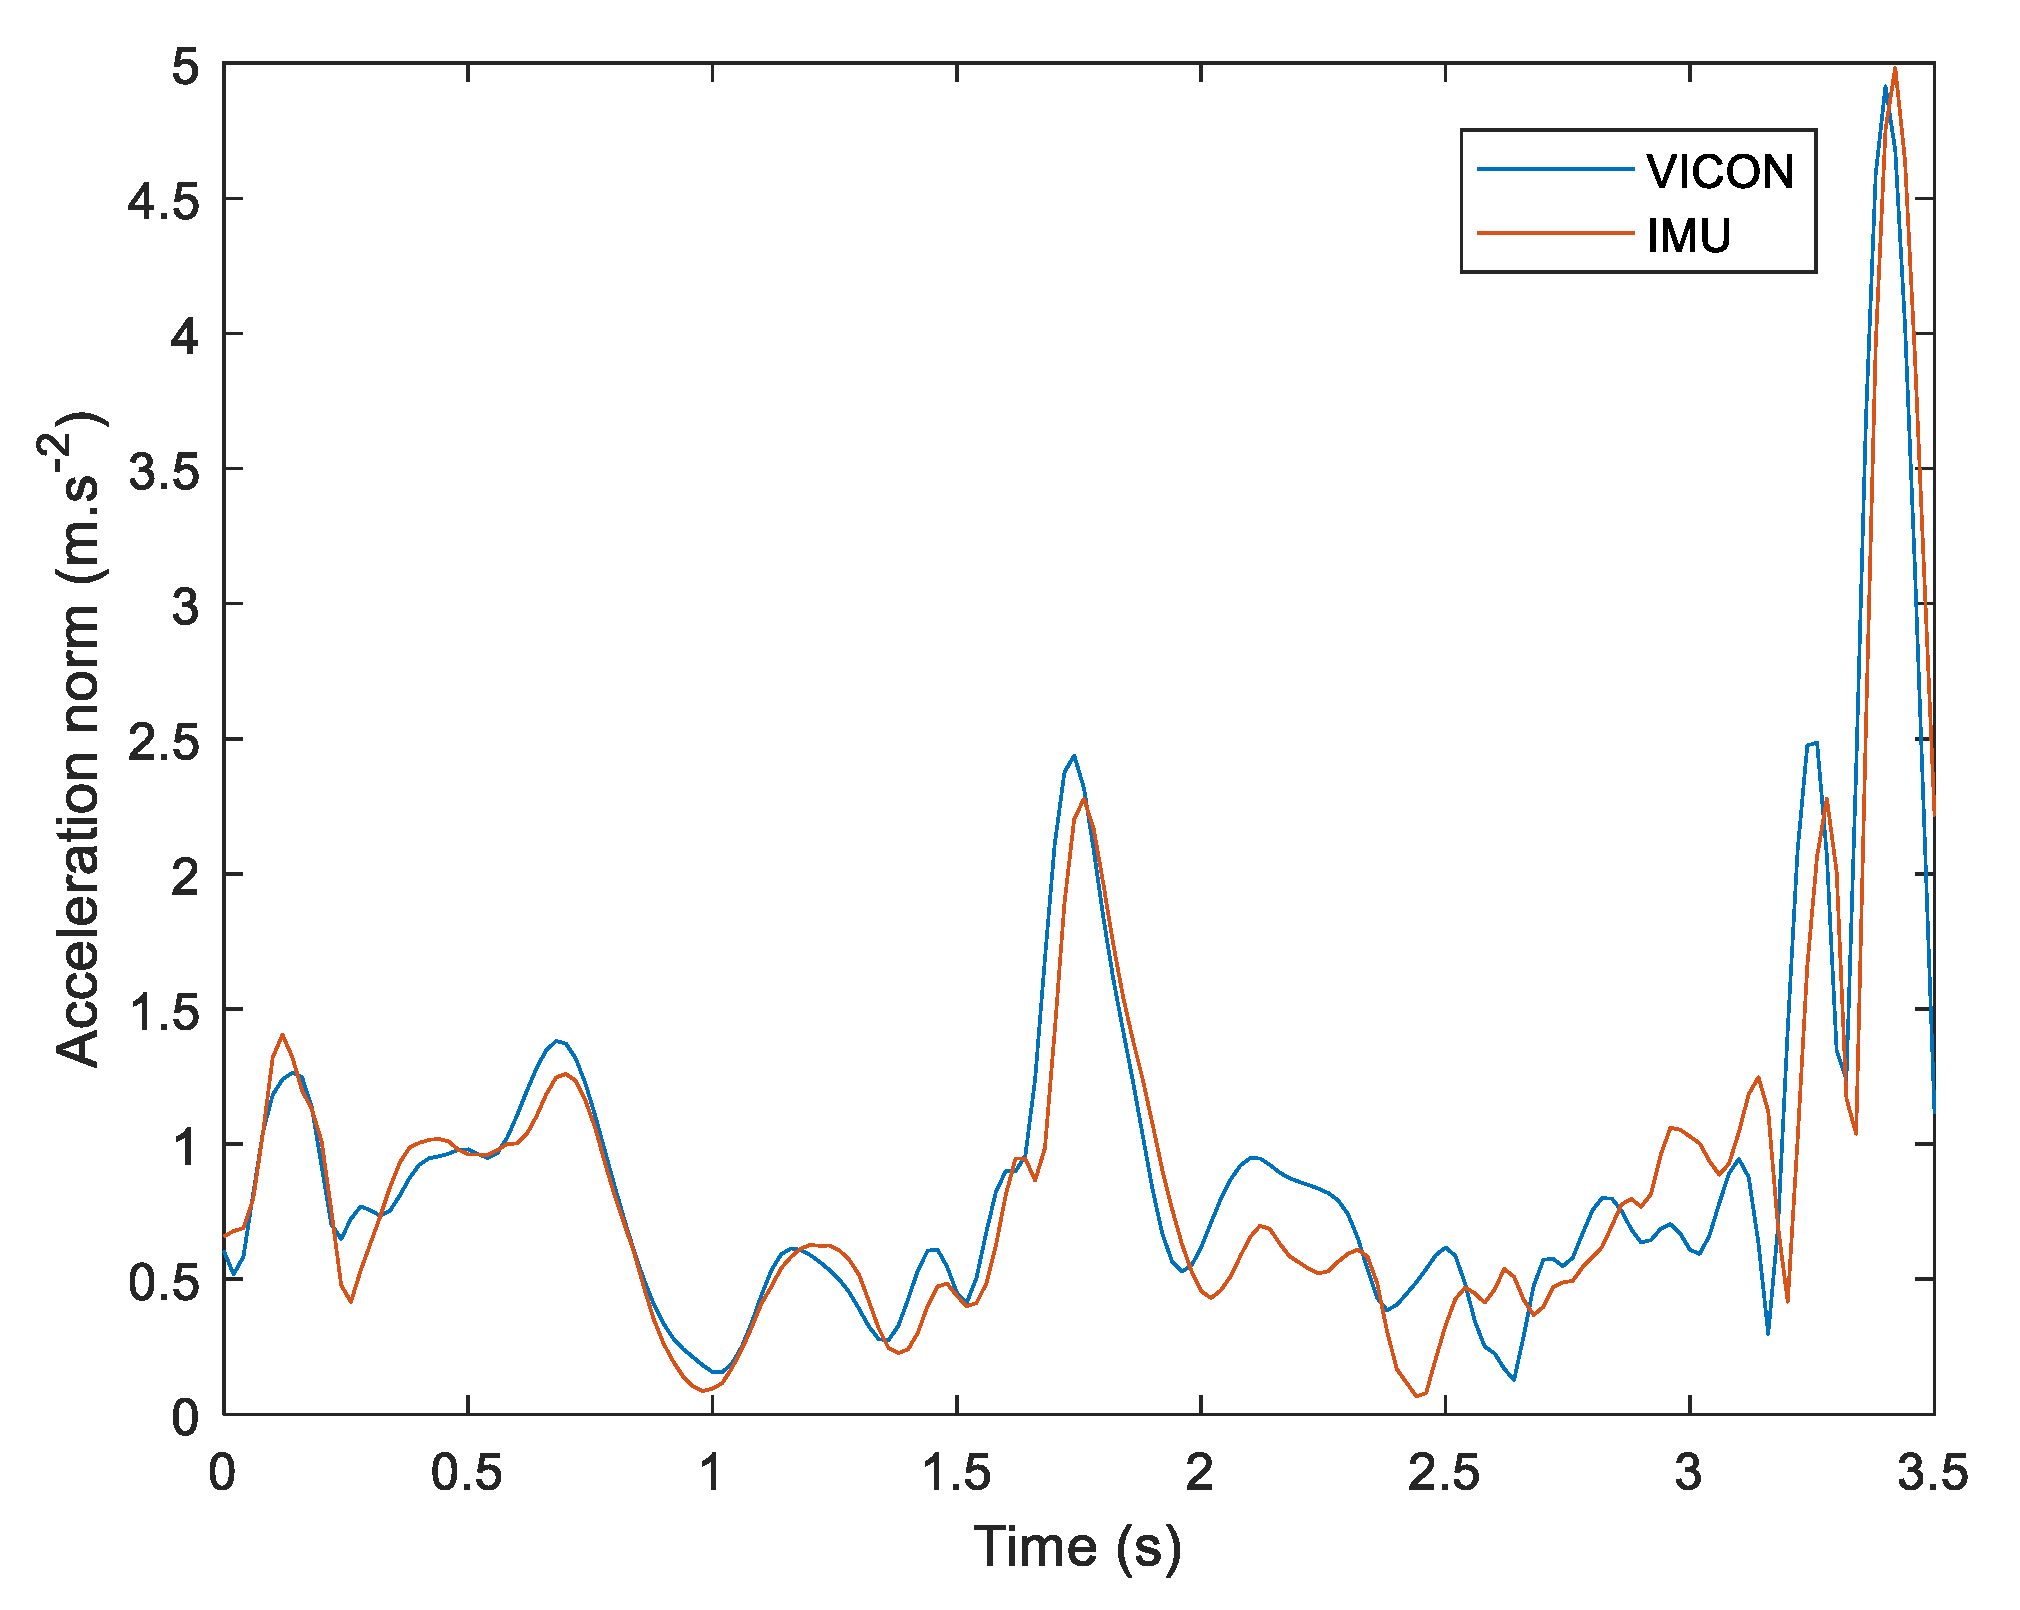
2.4.2. Linear Acceleration
2.4.3. Angle Computation
2.4.4. Time Normalisation
2.4.5. EMG Normalisation
2.5. Data Analysis
2.6. Statistic Analysis
3. Results
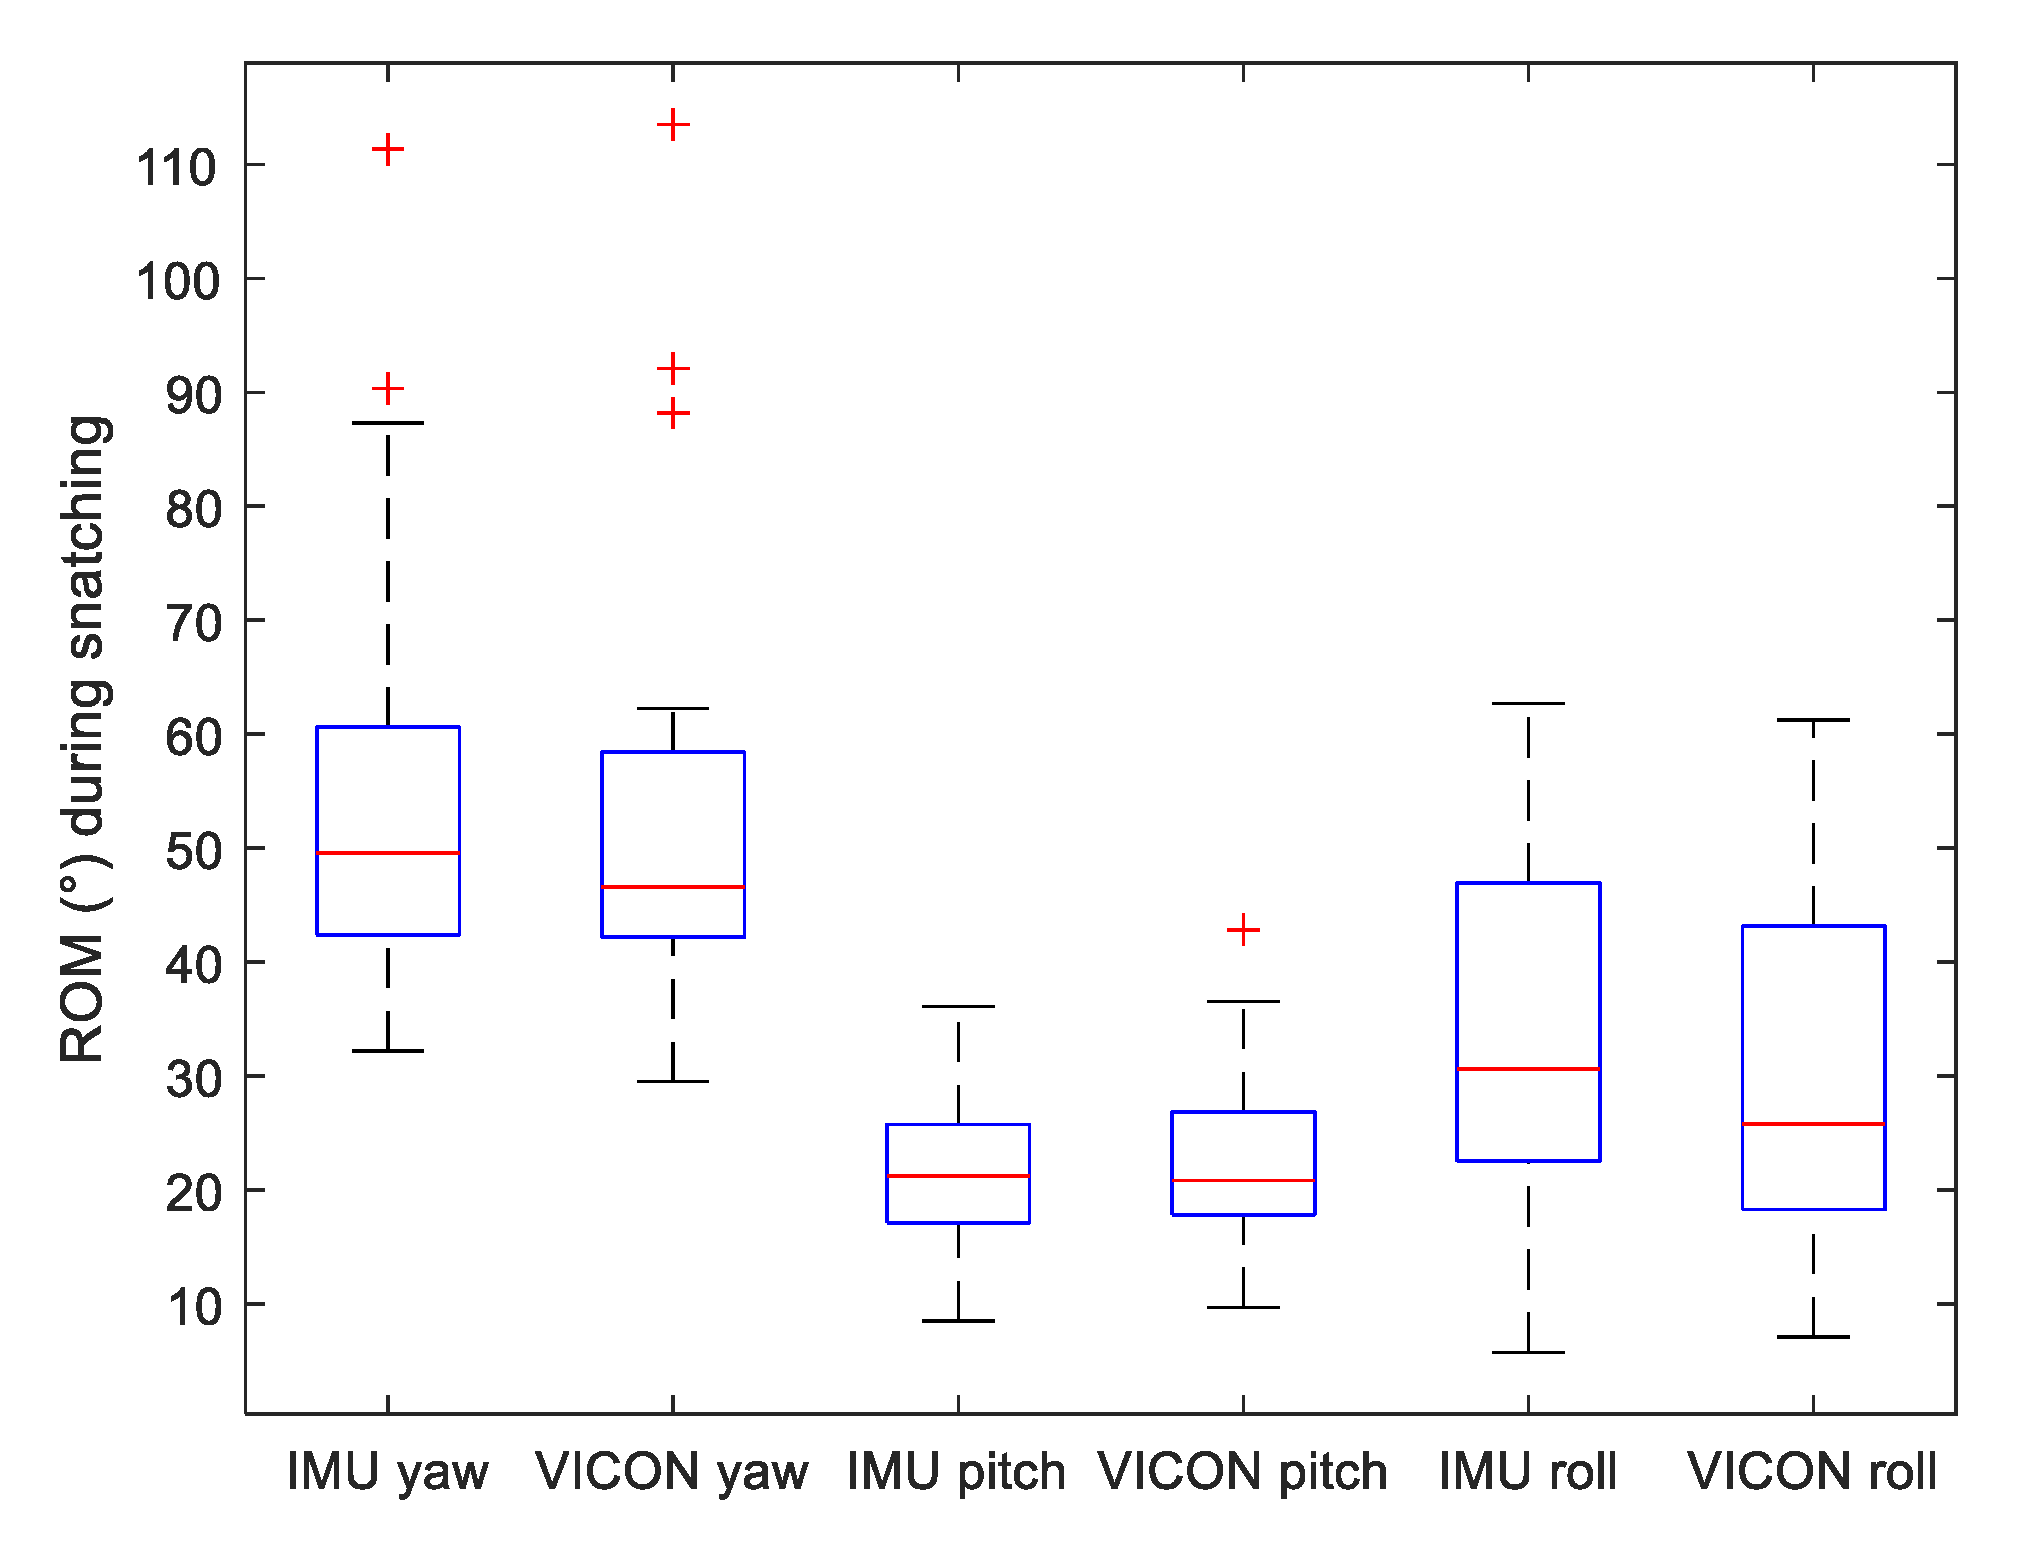
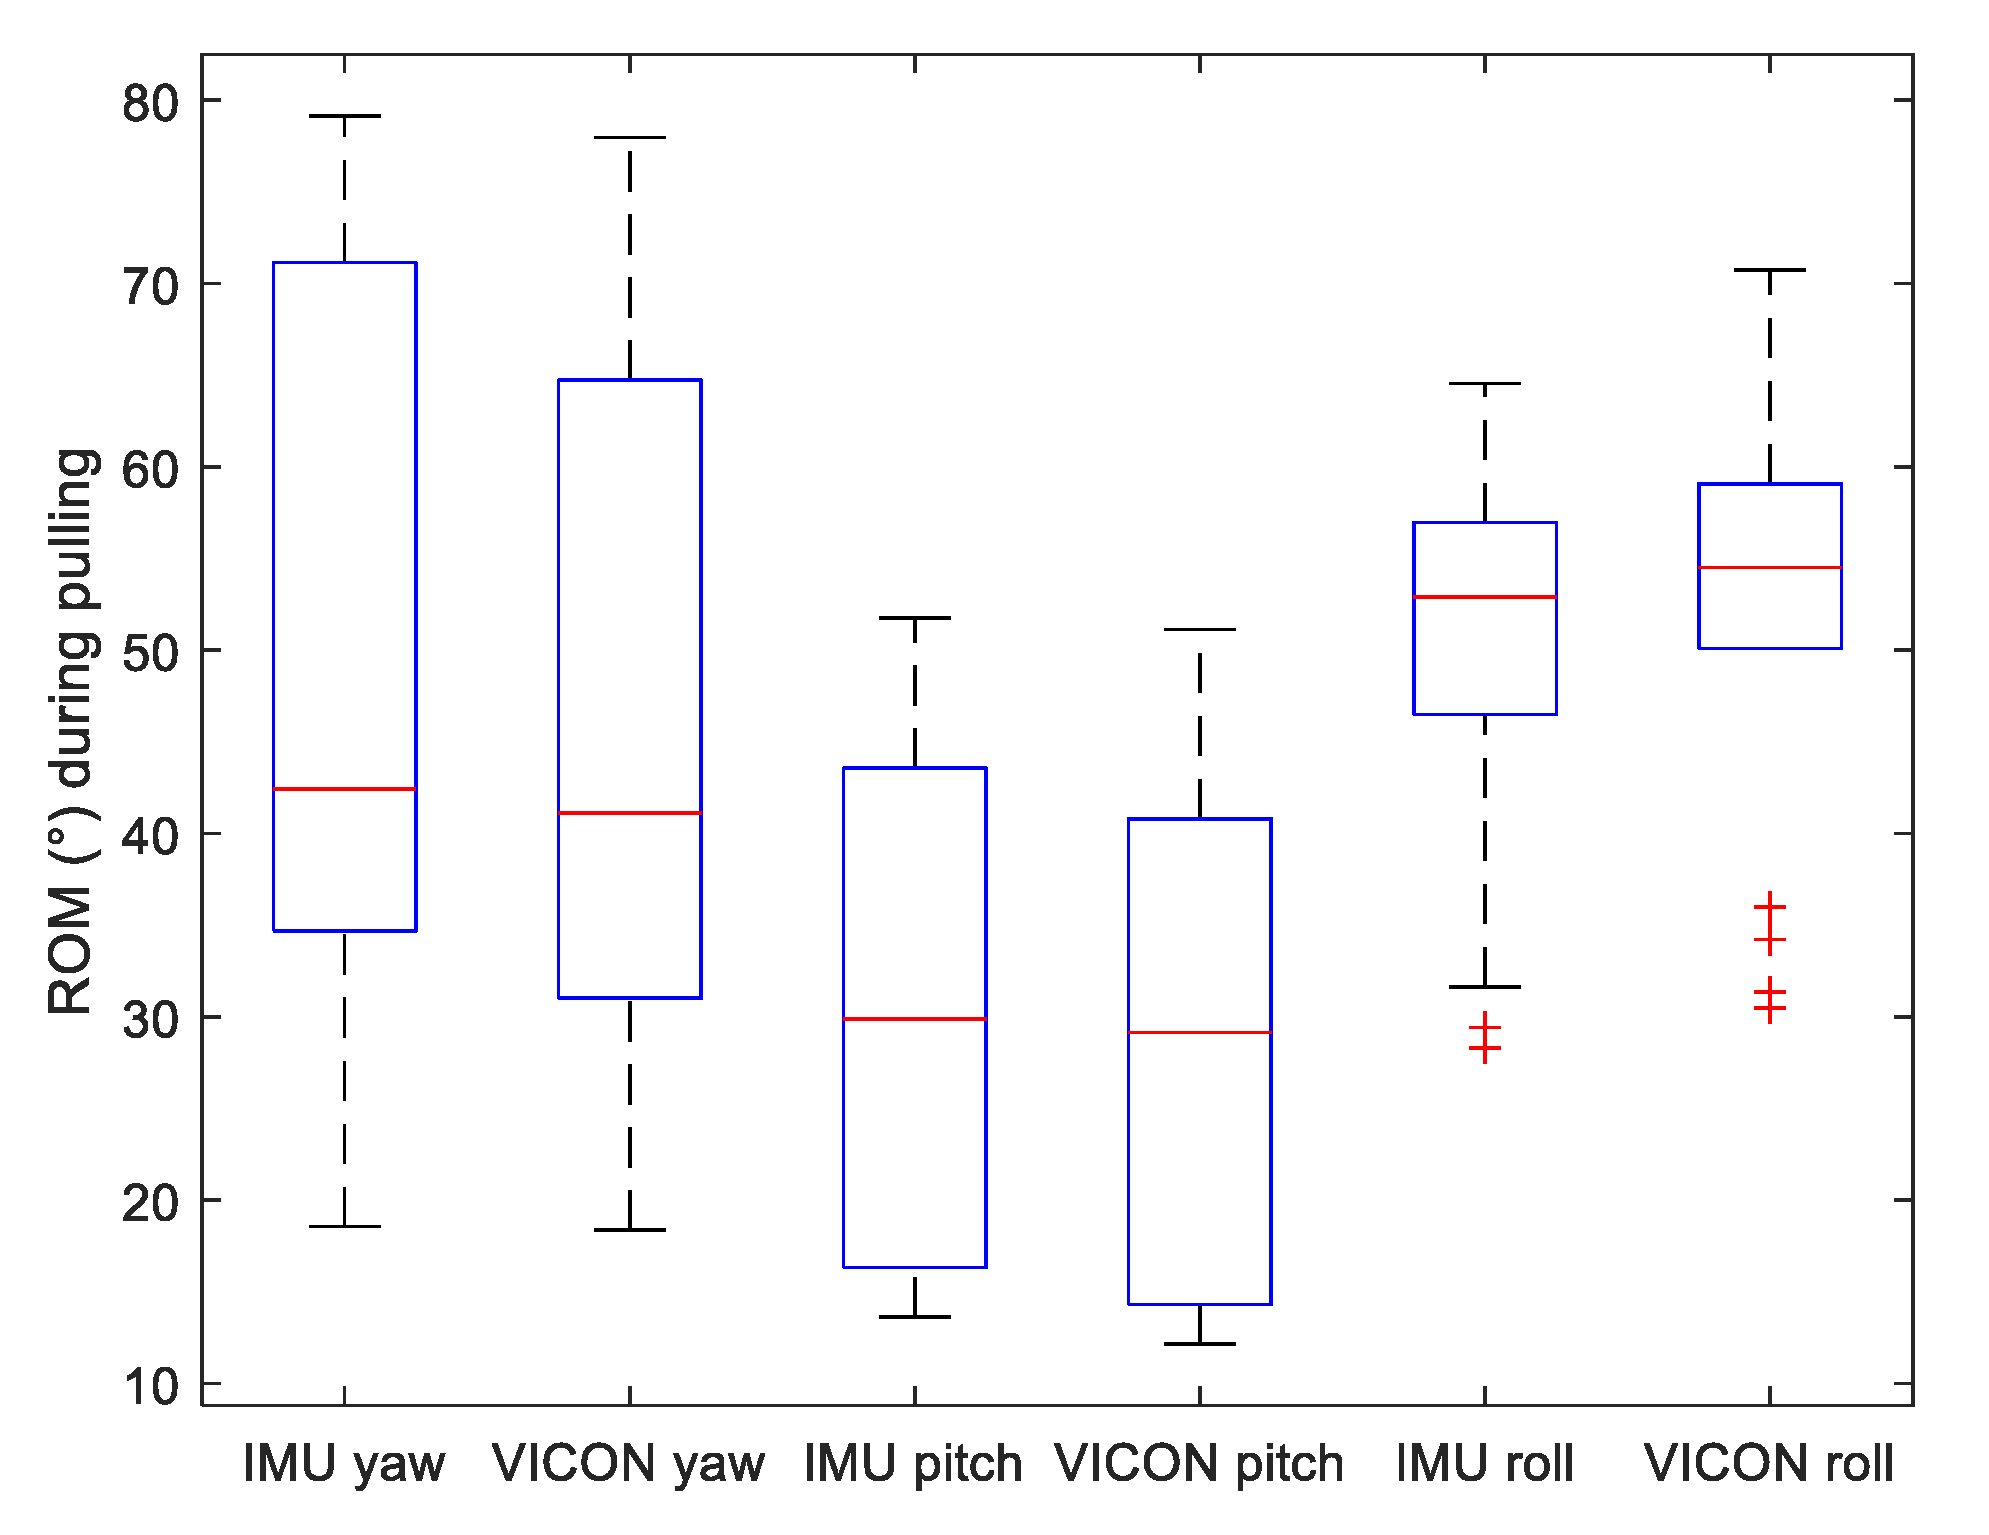
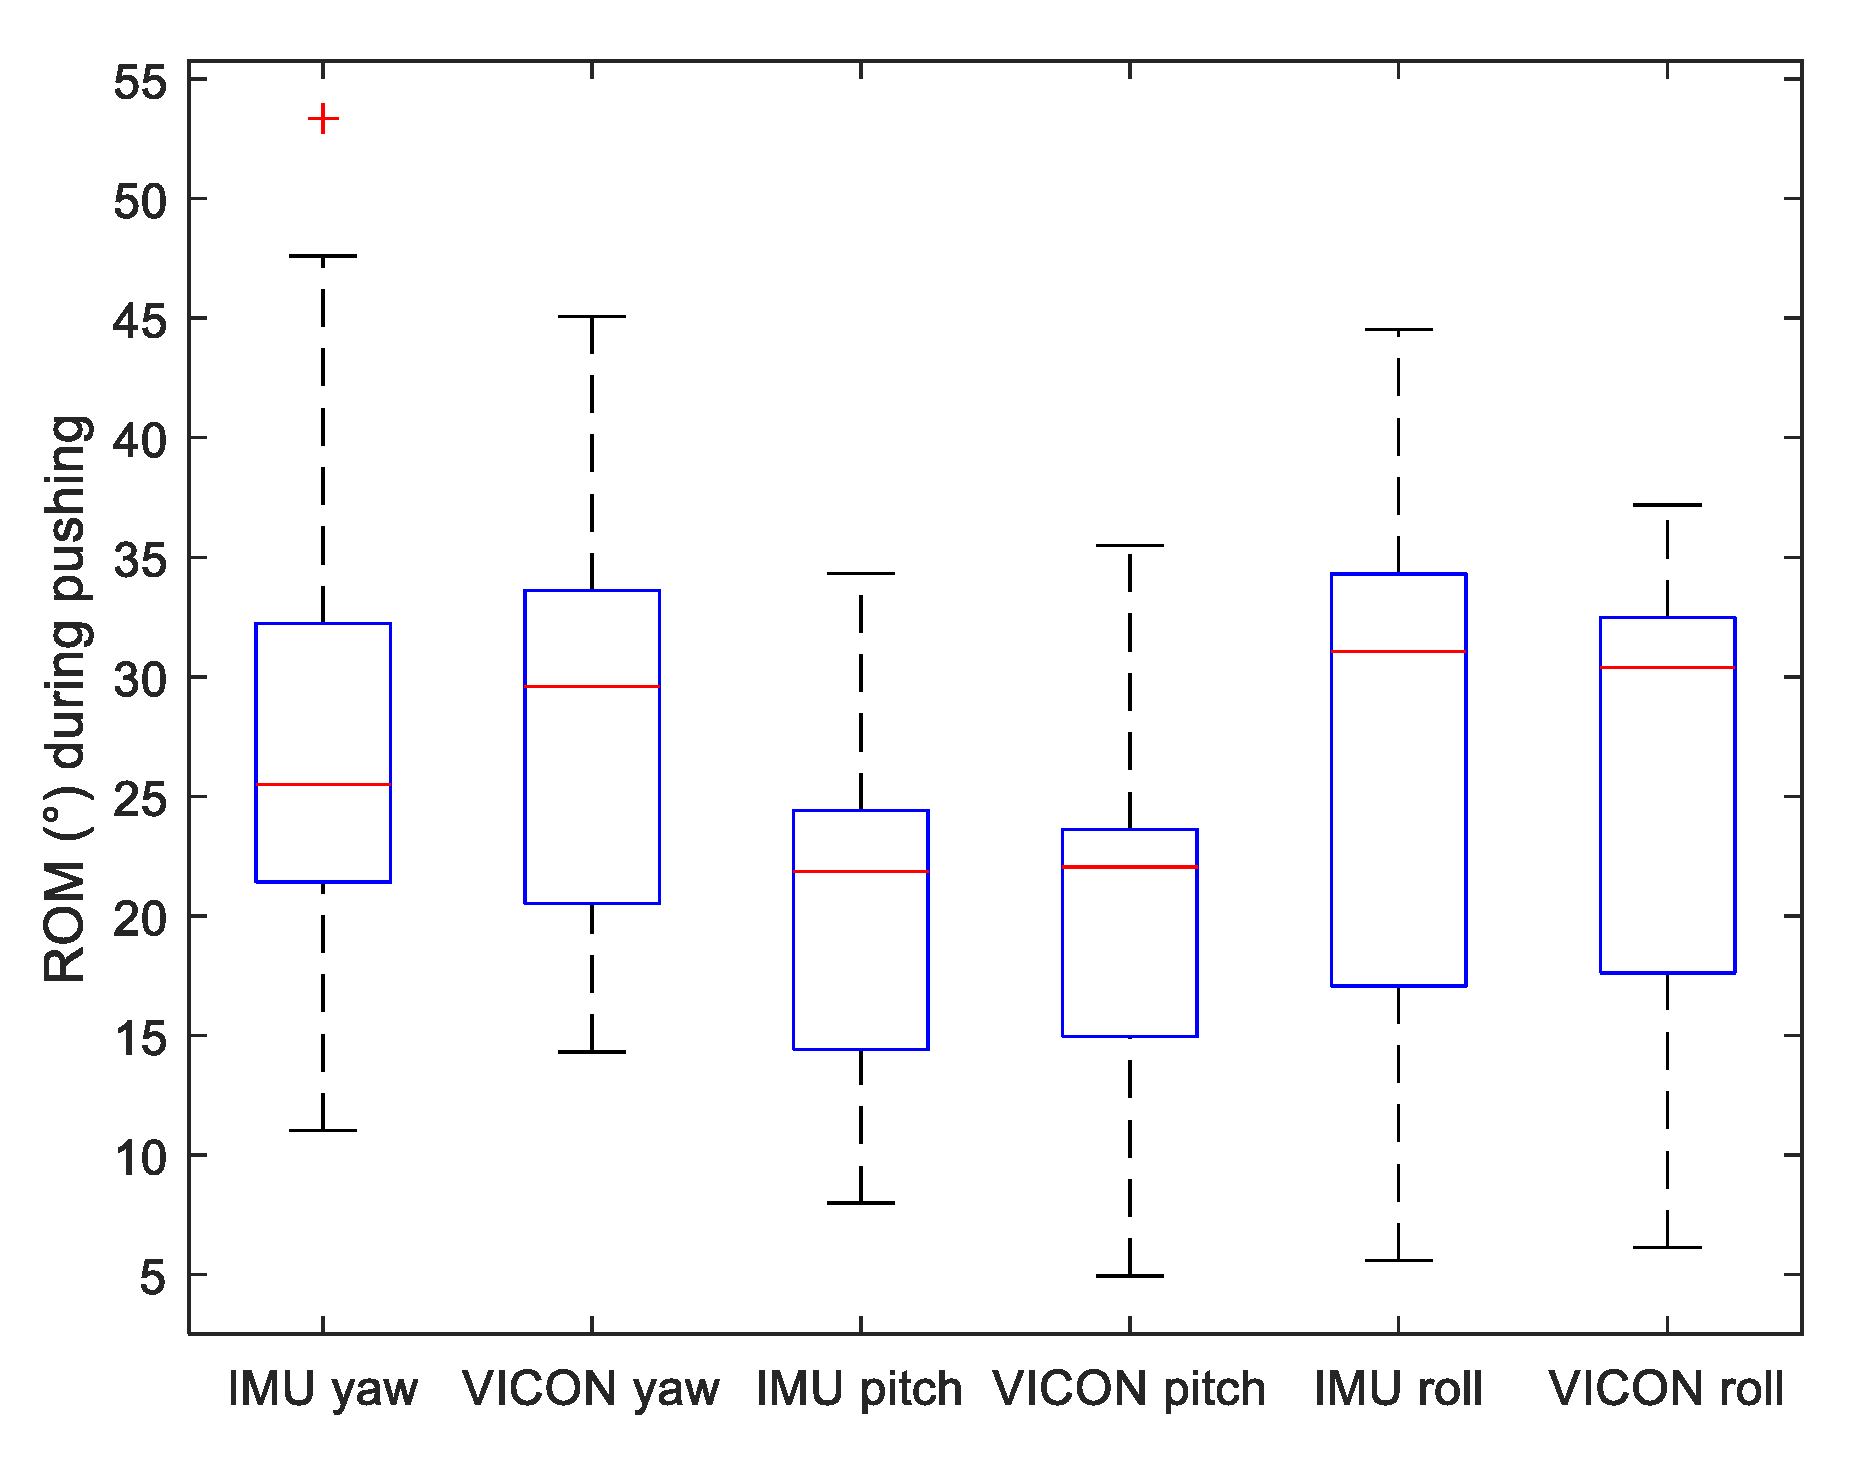
3.1. Comparing IMU to Gold Standard
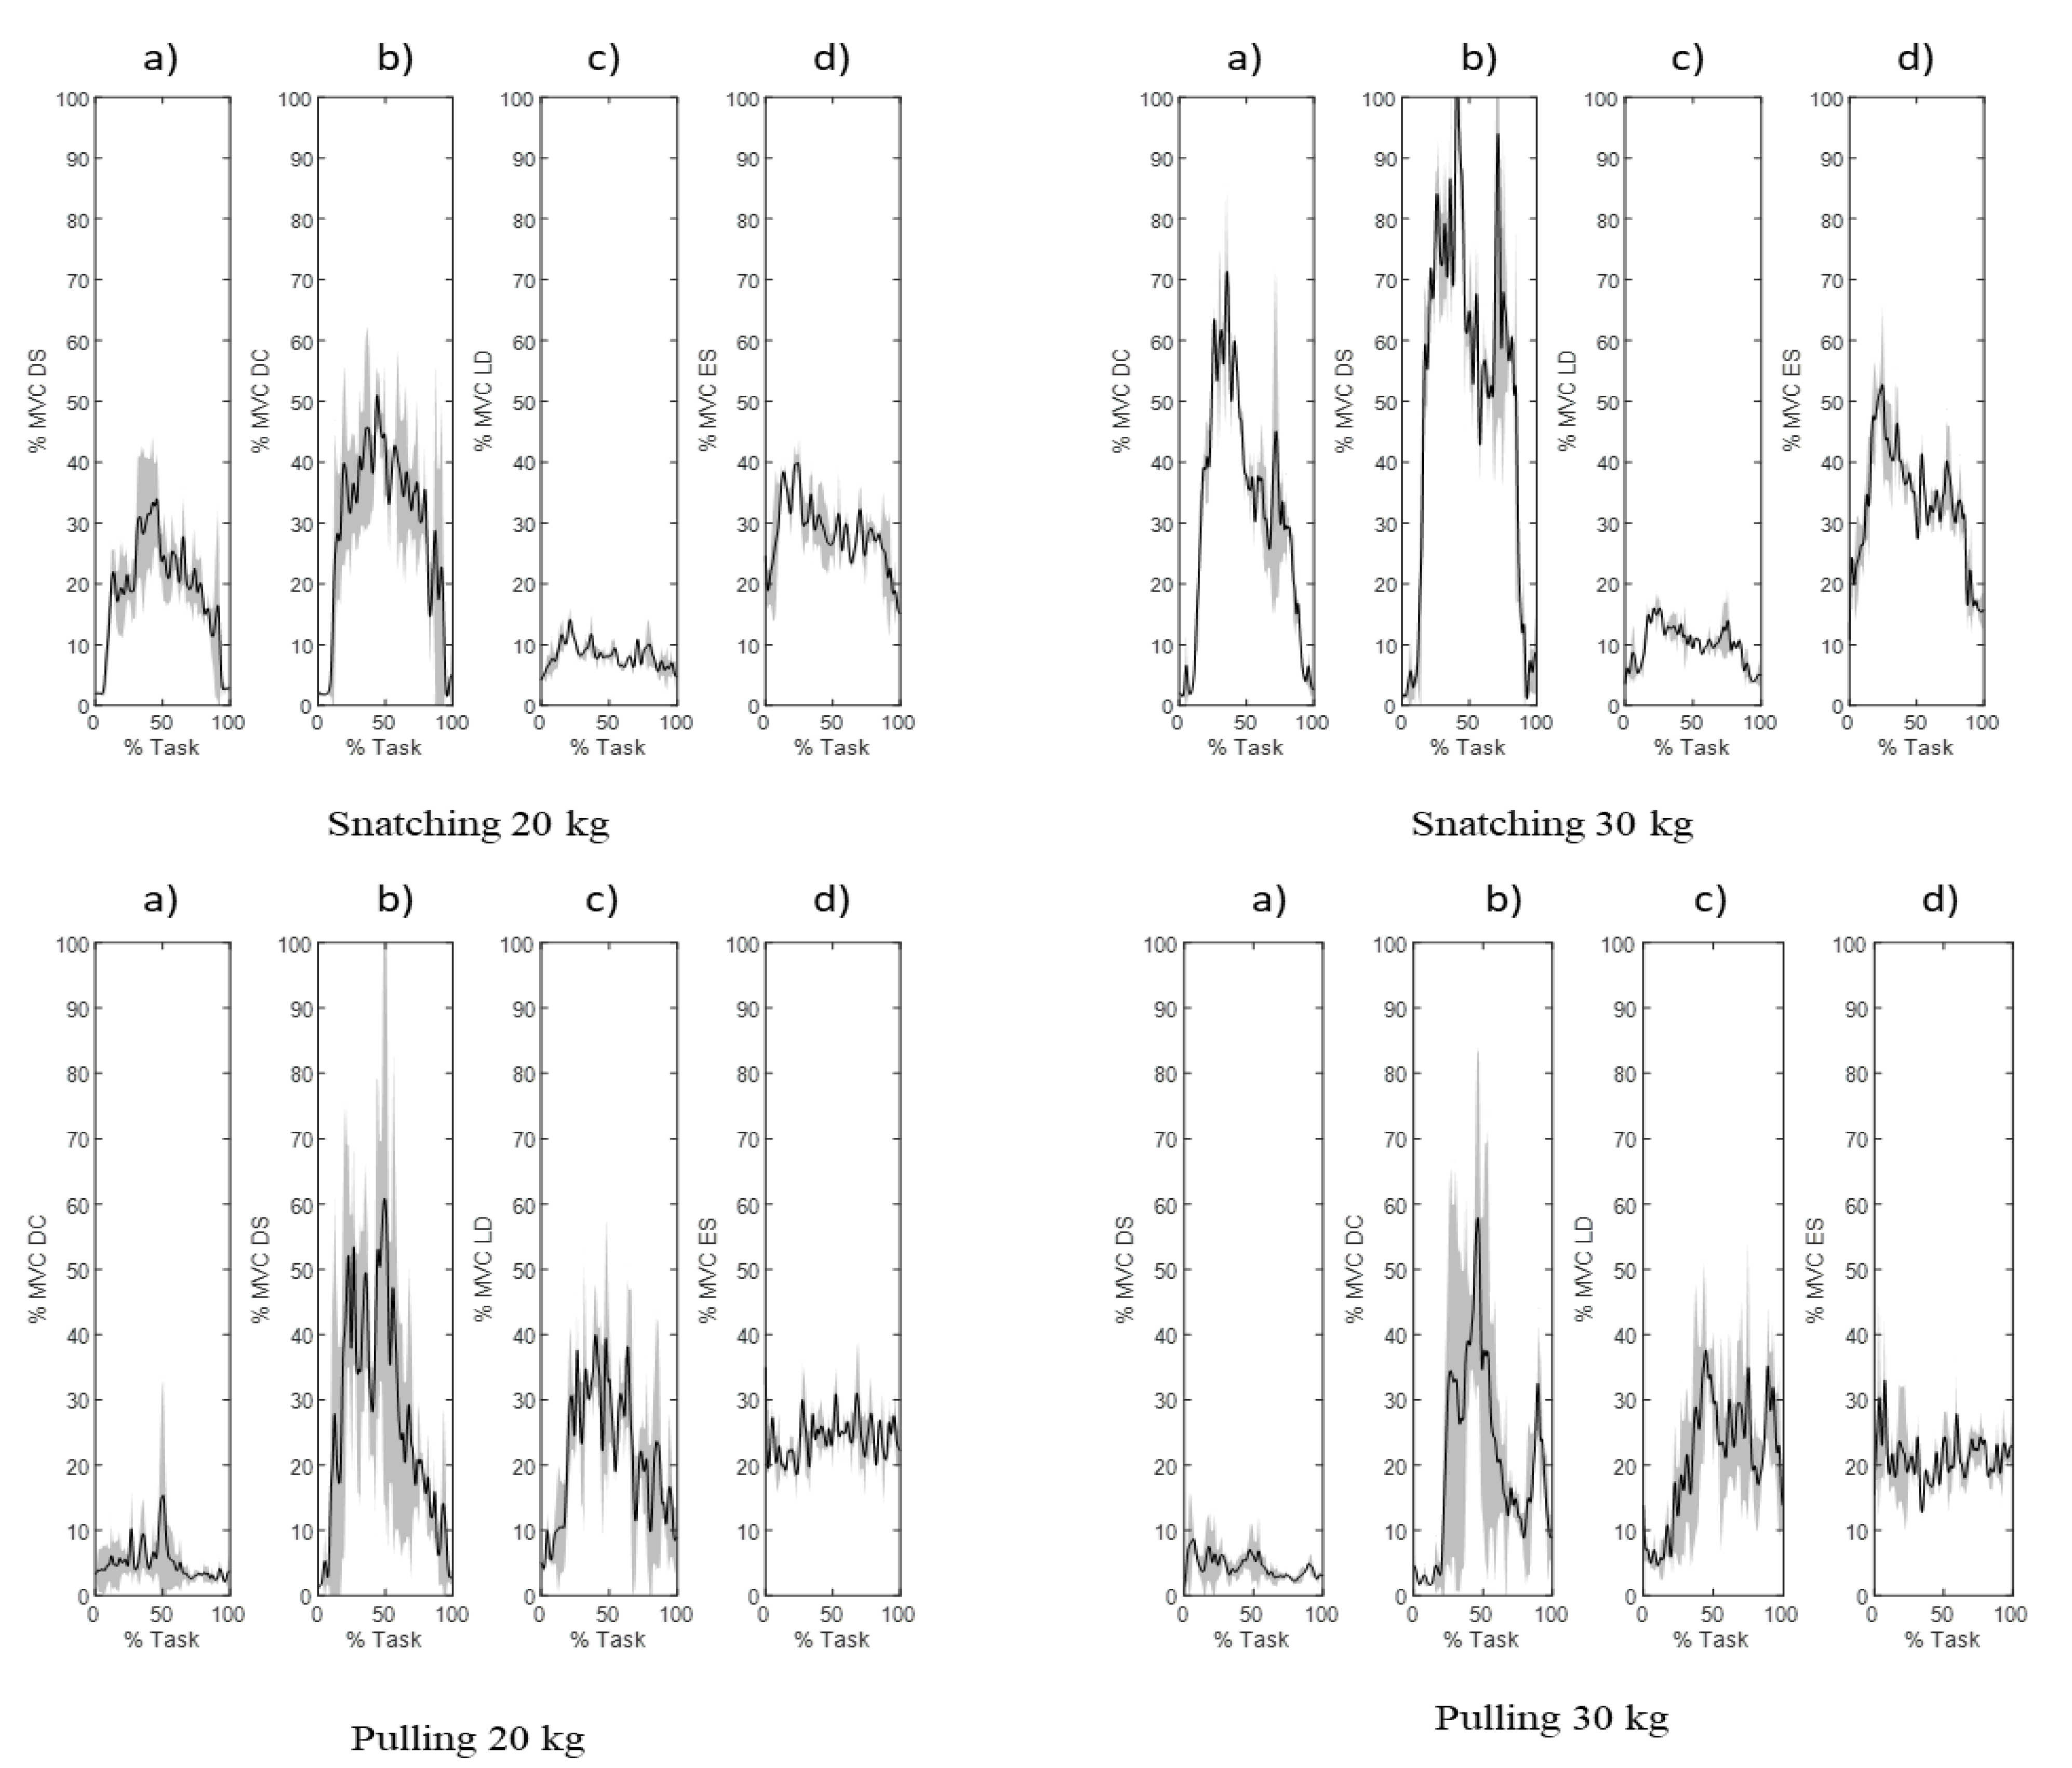
3.2. EMG Analysis
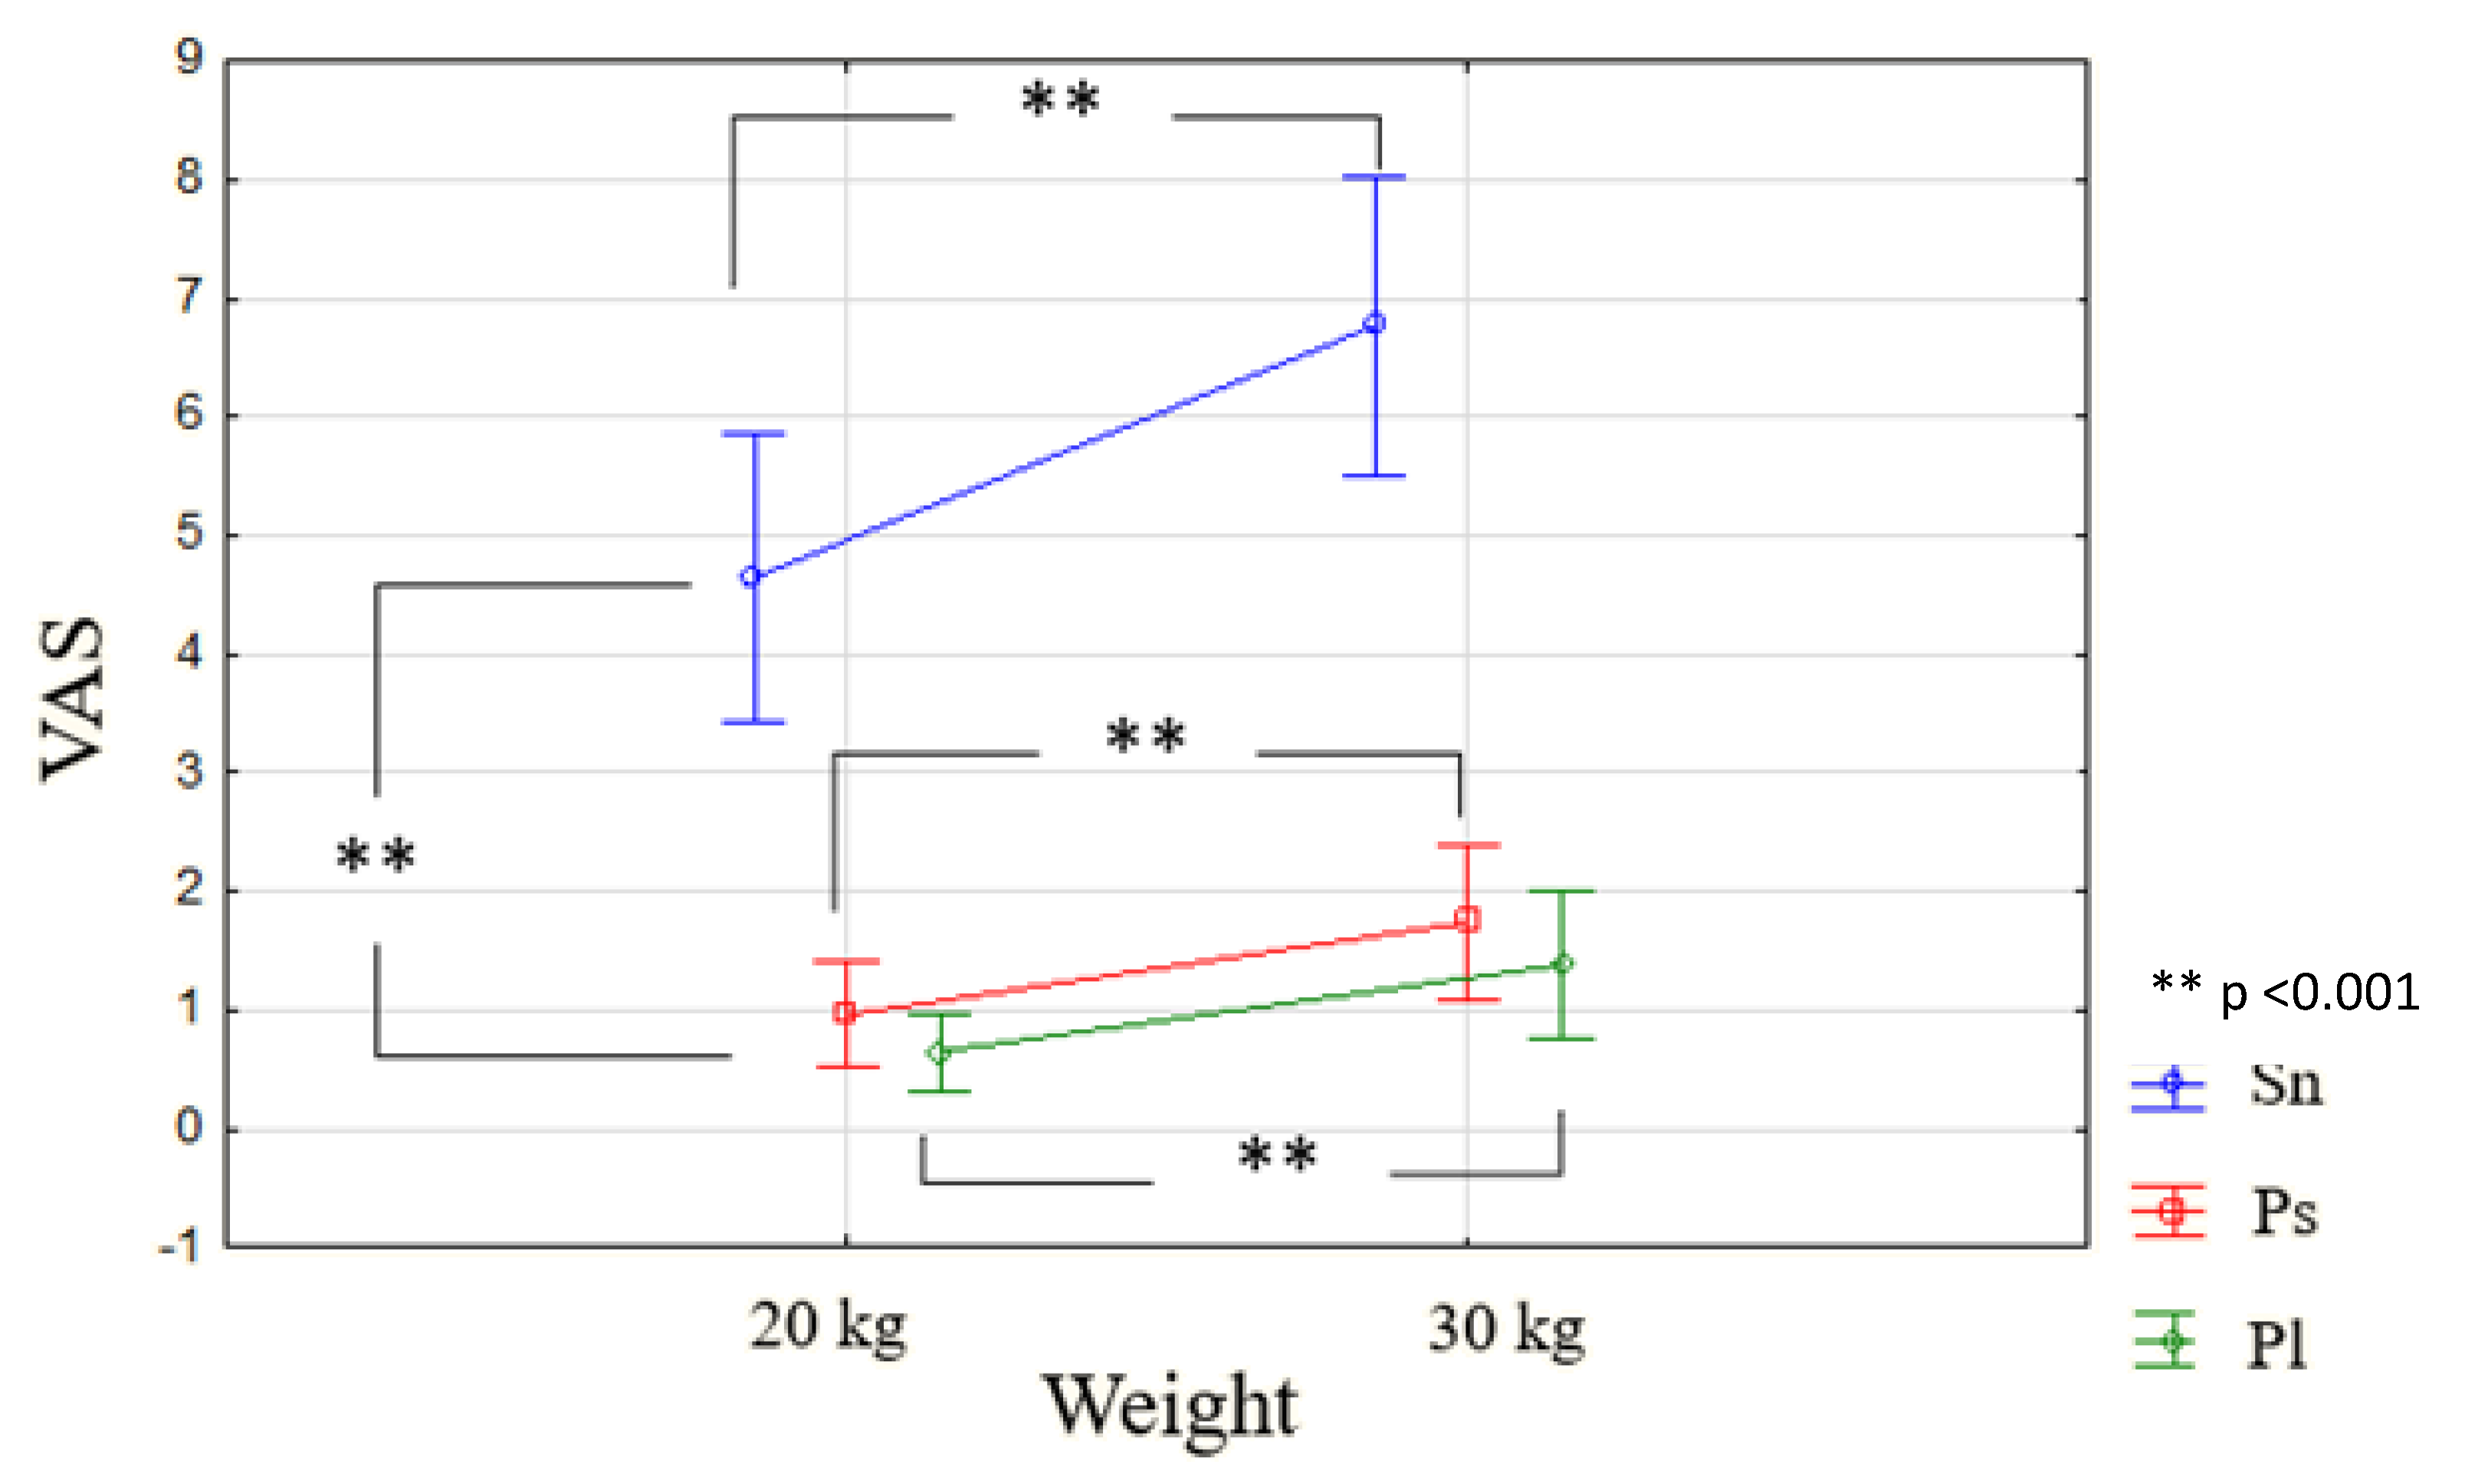
3.3. VAS Analysis
4. Discussion
4.1. Limitations
4.2. Motion-Capture Validation
4.3. EMG and VAS a Complementary Set of Measurements
5. Conclusions
Author Contributions
Funding
Institutional Review Board Statement
Informed Consent Statement
Data Availability Statement
Acknowledgments
Conflicts of Interest
Appendix A. EMG Signal Illustration

References
- OSHA. Introduction to Work-Related Musculoskeletal Disorders; US ISSN 1681-2123; OSHA: Washington, DC, USA, 2007. [Google Scholar]
- CNAMTS. Statistiques de Sinistralité 2016 tous CTN et par CTN. Etude 2017-197-CTN. Caisse Nationale de L’assurance Maladie des Travailleurs Salariés Direction des Risques Professionnels-Mission Statistiques. 2018. Available online: https://www.risquesprofessionnels.ameli.fr/ (accessed on 9 December 2021).
- March, L.; Smith, E.; Hoy, D.G.; Cross, M.J.; Riera, L.S.; Blyth, F.; Buchbinder, R.; Vos, T.; Woolf, A.D. Burden of disability due to musculoskeletal (MSK) disorders. Best Pract. Res. Clin. Rheumatol. 2014, 28, 353–366. [Google Scholar] [CrossRef]
- Panel on Musculoskeletal Disorders A, the Workplace, Institute of Medicine, Commission on Behavioral, Social Sciences, National Research Council. Musculoskeletal Disorders and the Workplace: Low back and upper Extremities; National Academy Press: Washington, DC, USA, 2001. [Google Scholar]
- Bongers, P.M.; Ijmker, S.; Van den Heuvel, S.; Blatter, B.M. Epidemiology of work-related neck and upper limb problems: Psychosocial and personal risk factors (part I) and effective interventions from a bio behavioural perspective (part II). J. Occup. Rehabil. 2006, 16, 272–295. [Google Scholar] [CrossRef]
- Van Rijn, R.M.; Huisstede, B.M.; Koes, B.W.; Burdorf, A. Associations between work-related factors and specific disorders of the shoulder—A systematic review of the literature. Scand. J. Work. Environ. Health 2010, 1, 189–201. [Google Scholar] [CrossRef] [PubMed] [Green Version]
- Kausto, J.; Miranda, H.; Pehkonen, I.; Heliövaara, M.; Viikari-Juntura, E.; Solovieva, S. The distribution and co-occurrence of physical and psychosocial risk factors for musculoskeletal disorders in a general working population. Int. Arch. Occup. Environ. Health 2011, 84, 773–788. [Google Scholar] [CrossRef]
- Hallbeck, M.S.; Bosch, T.; Van Rhijn, G.; Krause, F.; De Looze, M.P.; Vink, P. A tool for early workstation design for small and medium enterprises evaluated in five cases. Hum. Factors Ergon. Manuf. Serv. Ind. 2010, 20, 300–315. [Google Scholar] [CrossRef]
- Bodin, J.; Ha, C.; Sérazin, C.; Descatha, A.; Leclerc, A.; Goldberg, M.; Roquelaure, Y. Effects of Individual and Work-related Factors on Incidence of Shoulder Pain in a Large Working Population. J. Occup. Health 2012, 54, 278–288. [Google Scholar] [CrossRef] [Green Version]
- Caroly, S.; Coutarel, F.; Daniellou, F.; Landry, A. Assessment of the interventions on sustainable prevention of musculoskeletal disorders: Comparison of twenty companies. In Proceedings of the PREMUS Congress, Boston, MA, USA, 27 August 2007; p. 332. [Google Scholar]
- Winkel, J.; Westgaard, R. Risk factors of occupational MSDs and potential solutions: Past, present and future. Risk 2008, 34, 3–7. [Google Scholar]
- Kee, D.; Karwowski, W. LUBA: An assessment technique for postural loading on the upper body based on joint motion discomfort and maximum holding time. Appl. Ergon. 2001, 32, 357–366. [Google Scholar] [CrossRef]
- Stefana, E.; Marciano, F.; Rossi, D.; Cocca, P.; Tomasoni, G. Wearable Devices for Ergonomics: A Systematic Literature Review. Sensors 2021, 21, 777. [Google Scholar] [CrossRef]
- Hubaut, R. Les Outils D’évaluation du Risque de TMS: Caractéristiques, Cas D’usage et Perspectives de Développement. Ph.D. Thesis, Université Grenoble Alpes, Grenoble, France, 2020. [Google Scholar]
- Engholm, G.; Holmström, E. Dose-response associations between musculoskeletal disorders and physical and psychosocial factors among construction workers. Scand. J. Work. Environ. Health 2005, 1, 57–67. [Google Scholar]
- Merlino, L.A.; Rosecrance, J.C.; Anton, D.; Cook, T.M. Symptoms of musculoskeletal disorders among apprentice construction workers. Appl. Occup. Environ. Hyg. 2003, 18, 57–64. [Google Scholar] [CrossRef] [PubMed]
- Boschman, J.S.; Van Der Molen, H.F.; Sluiter, J.K.; Frings-Dresen, M.H. Musculoskeletal disorders among construction workers: A one-year follow-up study. BMC Musculoskelet. Disord. 2012, 13, 196. [Google Scholar] [CrossRef] [Green Version]
- Wang, D.; Dai, F.; Ning, X. Risk Assessment of Work-Related Musculoskeletal Disorders in Construction: State-of-the-Art Review. J. Constr. Eng. Manag. 2015, 141, 04015008. [Google Scholar] [CrossRef]
- Goldsheyder, D.; Weiner, S.S.; Nordin, M.; Hiebert, R. Musculoskeletal symptom survey among cement and concrete workers. Work 2004, 23, 111–121. [Google Scholar] [PubMed]
- Antwi-Afari, M.F.; Li, H.; Edwards, D.J.; Pärn, E.A.; Seo, J.; Wong, A.Y. Biomechanical analysis of risk factors for work-related musculoskeletal disorders during repetitive lifting task in construction workers. Autom. Constr. 2017, 83, 41–47. [Google Scholar] [CrossRef]
- AFNOR Viewer. Available online: https://viewerbdc.afnor.org/html/display/xisIlMvb48A1 (accessed on 1 December 2021).
- Subedi, S.; Pradhananga, N. Sensor-based computational approach to preventing back injuries in construction workers. Autom. Constr. 2021, 131, 103920. [Google Scholar] [CrossRef]
- Seo, J.; Alwasel, A.; Lee, S.; Abdel-Rahman, E.M.; Haas, C. A comparative study of in-field motion capture approaches for body kinematics measurement in construction. Robotica 2019, 37, 928–946. [Google Scholar] [CrossRef]
- Ho, E.S.; Chan, J.C.; Chan, D.C.; Shum, H.P.H.; Cheung, Y.-M.; Yuen, P.C. Improving posture classification accuracy for depth sensor-based human activity monitoring in smart environments. Comput. Vis. Image Underst. 2016, 148, 97–110. [Google Scholar] [CrossRef] [Green Version]
- Valero, E.; Sivanathan, A.; Bosché, F.; Abdel-Wahab, M. Musculoskeletal disorders in construction: A review and a novel system for activity tracking with body area network. Appl. Ergon. 2016, 54, 120–130. [Google Scholar] [CrossRef]
- Yan, X.; Li, H.; Li, A.R.; Zhang, H. Wearable IMU-based real-time motion warning system for construction workers’ musculoskeletal disorders prevention. Autom. Constr. 2017, 74, 2–11. [Google Scholar] [CrossRef]
- Chen, J.; Qiu, J.; Ahn, C. Construction worker’s awkward posture recognition through supervised motion tensor decomposition. Autom. Constr. 2017, 77, 67–81. [Google Scholar] [CrossRef]
- Blandeau, M.; Guichard, R.; Hubaut, R.; Leteneur, S. Three-steps validation of a new wireless inertial sensor system for embedded rehabilitation of low back pain. Sensors 2021. in review. [Google Scholar]
- Hägg, G.M.; Luttmann, A.; Jäger, M. Methodologies for evaluating electromyographic field data in ergonomics. J. Electromyogr. Kinesiol. 2000, 10, 301–312. [Google Scholar] [CrossRef]
- Winkel, J.; Mathiassen, S.E. Assessment of physical workload in epidemiologic studies: Concepts, issues and operational considerations. Ergonomics 1994, 37, 979–988. [Google Scholar] [CrossRef] [PubMed]
- Silverstein, B.; Fine, L.J.; Armstrong, T.J. Hand wrist cumulative trauma disorders in industry. Br. J. Ind. Med. 1986, 43, 779–784. [Google Scholar] [CrossRef] [Green Version]
- Suurküla, J.; Hägg, G.M. Relations between shoulder/neck disorders and EMG zero crossing shifts in female assembly workers using the test contraction method. Ergonomics 1987, 30, 1553–1564. [Google Scholar] [CrossRef]
- Veiersted, K.B.; Westgaard, R.H.; Andersen, P. Electromyographic evaluation of muscular work pattern as a predictor of trapezius myalgia. Scand. J. Work Environ. Health 1993, 19, 284–290. [Google Scholar] [CrossRef] [Green Version]
- Kankaanpää, M. Back and hip extensor fatigability in chronic low back pain patients and controls. Arch. Phys. Med. Rehabil. 1998, 79, 412–417. [Google Scholar] [CrossRef]
- Roy, S.H.; De Luca, C.J.; Emley, M.; Buijs, R.J. Spectral electromyographic assessment of back muscles in patients with low back pain undergoing rehabilitation. Spine 1995, 20, 38–48. [Google Scholar] [CrossRef]
- Hermens, H.J.; Freriks, B.; Merletti, R.; Stegeman, D.; Blok, J.; Rau, G.; Disselhorst-Klug, C.; Hägg, G. European Recommendations for Surface. Roessingh Res. Dev. 1999, 8, 13–54. [Google Scholar]
- Borg, G.A. Psychophysical bases of perceived exertion. Med. Sci. Sports Exerc. 1982, 14, 377–381. [Google Scholar] [CrossRef]
- Horenstein, R.E.; Lewis, C.L.; Yan, S.; Halverstadt, A.; Shefelbine, S.J. Validation of Magneto-Inertial Measuring Units for Measuring Hip Joint Angles. J. Biomech. 2019, 91, 170–174. [Google Scholar] [CrossRef]
- Storm, F.A.; Cesareo, A.; Reni, G.; Biffi, E. Wearable Inertial Sensors to Assess Gait during the 6-Minute Walk Test: A Systematic Review. Sensors 2020, 20, 2660. [Google Scholar] [CrossRef]
- Cappelle, J.; Monteyne, L.; Van Mulders, J.; Goossens, S.; Vergauwen, M.; Van der Perre, L. Low-Complexity Design and Validation of Wireless Motion Sensor Node to Support Physiotherapy. Sensors 2020, 20, 6362. [Google Scholar] [CrossRef] [PubMed]
- Dumas, R.; Aissaoui, R.; de Guise, J.A. A 3D Generic Inverse Dynamic Method Using Wrench Notation and Quaternion Algebra. Comput. Methods Biomech. Biomed. Eng. 2004, 7, 159–166. [Google Scholar] [CrossRef]
- Dumas, R.; Chèze, L.; Verriest, J.-P. Adjustments to McConville et al. and Young et al. Body Segment Inertial Parameters. J. Biomech. 2007, 40, 543–553. [Google Scholar] [CrossRef] [PubMed]
- Dumas, R.; Robert, T.; Pomero, V.; Cheze, L. Joint and Segment Coordinate Systems Revisited. Comput. Methods Biomech. Biomed. Eng. 2012, 15, 183–185. [Google Scholar] [CrossRef] [PubMed]
- Molenaar, C.; Blandeau, M.; Gabrielli, F.; Gagnon, D.H.; Pudlo, P. Does the use of an armrest modify upper extremity muscle demands during lateral sitting transfers in manual wheelchair users living with spinal cord injury? Ann. Phys. Rehabil. Med. 2018, 61, e43. [Google Scholar] [CrossRef]
- Bland, M.J.; Altman, D.G. Statistical Methods for Assessing Agreement between Two Methods of Clinical Measurement. Lancet 1986, 327, 307–310. [Google Scholar] [CrossRef]
- Montenij, L.J.; Buhre, W.F.; Jansen, J.R.; Kruitwagen, C.L.; de Waal, E.E. Methodology of Method Comparison Studies Evaluating the Validity of Cardiac Output Monitors: A Stepwise Approach and Checklist. Br. J. Anaesth. 2016, 116, 750–758. [Google Scholar] [CrossRef] [PubMed] [Green Version]
- Ranstam, J. Methodological Note: Accuracy, Precision, and Validity. Acta Radiol. 2008, 49, 105–106. [Google Scholar] [CrossRef]
- Lin, L.I.-K. A Concordance Correlation Coefficient to Evaluate Reproducibility. Biometrics 1989, 45, 255. [Google Scholar] [CrossRef]
- Desquilbet, L. Guide Pratique de Validation Statistique de Méthodes de Mesure: Répétabilité, Reproductibilité, et Concordance; ENVA Alfort: Maisons-Alfort, ON, Canada, 2020; p. 48. [Google Scholar]
- Guichard, R.; Blandeau, M.; Leteneur, S. Localization of IMU sensors affects the estimation of soft tissue wobbling: A preliminary study. Comput. Methods Biomech. Biomed. Eng. 2021, 24 (Suppl. S1), 3. [Google Scholar]
- Koska, D.; Gaudel, J.; Hein, T.; Maiwald, C. Validation of an Inertial Measurement Unit for the Quantification of Rearfoot Kinematics during Running. Gait Posture 2018, 64, 135–140. [Google Scholar] [CrossRef]
- Wu, G.; Van Der Helm, F.C.T.; Veeger, H.E.J.; Makhsous, M.; Van Roy, P.; Anglin, C.; Nagels, J.; Karduna, A.R.; McQuade, K.; Wang, X. ISB recommendation on definitions of joint coordinate systems of various joints for the reporting of human joint motion—Part II: Shoulder, elbow, wrist and hand. J. Biomech. 2005, 38, 981–992. [Google Scholar] [CrossRef] [PubMed]
- Robert-Lachaine, X.; Mecheri, H.; Muller, A.; Larue, C.; Plamondon, A. Validation of a low-cost inertial motion capture system for whole-body motion analysis. J. Biomech. 2020, 99, 109520. [Google Scholar] [CrossRef] [PubMed]
- Robert-Lachaine, X.; Mecheri, H.; Larue, C.; Plamondon, A. Validation of inertial measurement units with an optoelectronic system for whole-body motion analysis. Med. Biol. Eng. Comput. 2017, 55, 609–619. [Google Scholar] [CrossRef] [PubMed]
- Mc Atamney, L.; Nigel Corlet, E. RULA: A survey method for the investigation of work-related upper limb disorders. Appl. Ergon. 1993, 24, 91–99. [Google Scholar] [CrossRef]
- Al Borno, M.; O’Day, J.; Ibarra, V.; Dunne, J.; Seth, A.; Habib, A.; Ong, C.; Hicks, J.; Uhlrich, S.; Delp, S. OpenSense: An open-source toolbox for Inertial-Measurement-Unit-based measurement of lower extremity kinematics over long durations. BioRxiv 2021. [CrossRef]
- Kim, E.; Freivalds, A.; Takeda, F.; Li, C. Ergonomic Evaluation of Current Advancements in Blueberry Harvesting. Agronomy 2018, 8, 266. [Google Scholar] [CrossRef] [Green Version]
- Merino, G.; da Silva, L.; Mattos, D.; Guimarães, B.; Merino, E. Ergonomic Evaluation of the Musculoskeletal Risks in a Banana Harvesting Activity through Qualitative and Quantitative Measures, with Emphasis on Motion Capture (Xsens) and EMG. Int. J. Ind. Ergon. 2019, 69, 80–89. [Google Scholar] [CrossRef]
- Roquelaure, Y.; Raimbeau, G.; Saint-Cast, Y.; Martin, Y.H.; Pelier-Cady, M.C. Occupational risk factors for radial tunnel syndrome in factory workers. Chir. Main 2003, 22, 293–298. [Google Scholar] [CrossRef] [PubMed]


| Age (Years) | Body Mass (kg) | Height (m) |
|---|---|---|
| 31.7 ± 10.5 | 73.6 ± 15.9 | 1.74 ± 0.08 |
| Parameter Name | Acceleration Norm (m/s2) | Yaw Angle (°) | Pitch Angle (°) | Roll Angle (°) |
|---|---|---|---|---|
| bias | −0.006 (0.176) | 0.224 (2.1) | 0.139 (1.599) | −0.864 (0.237) |
| lower LOA | −0.682 (0.465) | −3.180 (2.812) | −2.397 (1.458) | −4.474 (3.587) |
| upper LOA | 0.640 (0.407) | 3.628 (2.524) | 2.676 (2.200) | 2.745 (2.384) |
| precision | 0.281 (0.206) | 2.127 (1.240) | 1.578 (0.824) | 2.226 (1.691) |
| r2 | 0.768 (0.173) | 0.976 (0.028) | 0.924 (0.092) | 0.951 (0.084) |
| Lin’s CC | 0.859 (0.136) | 0.958 (0.067) | 0.908 (0.107) | 0.928 (0.121) |
| DC | DS | LD | ES | ||||||
|---|---|---|---|---|---|---|---|---|---|
| Weight | Movement | M | Sd | M | Sd | M | Sd | M | Sd |
| 20 kg | Sn | 4.648 | 0.540688 | 22.5236 | 4.213061 | 12.0361 | 3.586532 | 22.0377 | 2.895057 |
| Ps | 0.966 | 0.198473 | 10.422 | 3.084158 | 6.4182 | 2.028903 | 15.1535 | 2.592818 | |
| Pl | 0.656 | 0.144846 | 5.47851 | 1.961944 | 10.6167 | 2.199019 | 15.3425 | 2.173868 | |
| 30 kg | Sn | 6.77 | 0.560089 | 30.5888 | 5.130576 | 13.696 | 3.930682 | 25.1647 | 2.787131 |
| Ps | 1.744 | 0.291895 | 9.3448 | 2.903456 | 5.82487 | 1.767021 | 14.0036 | 2.3651873 | |
| Pl | 1.384 | 0.275521 | 4.4531 | 1.159783 | 9.7306 | 2.585124 | 14.837 | 1.968479 | |
| Muscle | Source of Variation | df | F |
|---|---|---|---|
| DC | Weight | 1 | 2.01676 |
| Movement | 2 | 26.57875 ** | |
| Weight × Movement | 2 | 3.97352 * | |
| DS | Weight | 1 | 3.44022 |
| Movement | 2 | 19.4128 ** | |
| Weight x Movement | 2 | 8.23358 ** | |
| LD | Weight | 1 | 0.04502 |
| Movement | 2 | 6.23308 ** | |
| Weight × Movement | 2 | 8.42081 ** | |
| ES | Weight | 1 | 1.08632 |
| Movement | 2 | 21.99597 ** | |
| Weight × Movement | 2 | 4.4893 * |
| Muscle | Variable | 1 | 2 | 3 | 4 | 5 | 6 |
|---|---|---|---|---|---|---|---|
| LD | 1. Sn 20kg | ||||||
| 2. Ps 20kg | 0.9162 ** | ||||||
| 3. Pl 20kg | 0.8219 ** | 0.8799 ** | |||||
| 4. Sn 30kg | 0.9903 ** | 0.9562 ** | 0.8294 ** | ||||
| 5. Ps 30kg | 0.8842 ** | 0.9954 ** | 0.8802 ** | 0.9318 ** | |||
| 6. Pl 30kg | 0.785 ** | 0.8831 ** | 0.9888 ** | 0.8042 ** | 0.8911 * | ||
| ES | 1. Sn 20kg | ||||||
| 2. Ps 20kg | 0.7427 * | ||||||
| 3. Pl 20kg | 0.6449 * | 0.8692 ** | |||||
| 4. Sn 30kg | 0.9201 ** | 0.8197 ** | 0.8452 ** | ||||
| 5. Ps 30kg | 0.6911 * | 0.9225 ** | 0.9225 ** | 0.8618 ** | |||
| 6. Pl 30kg | 0.7156 * | 0.8237 ** | 0.9197 ** | 0.8325 ** | 0.7822 ** |
Publisher’s Note: MDPI stays neutral with regard to jurisdictional claims in published maps and institutional affiliations. |
© 2022 by the authors. Licensee MDPI, Basel, Switzerland. This article is an open access article distributed under the terms and conditions of the Creative Commons Attribution (CC BY) license (https://creativecommons.org/licenses/by/4.0/).
Share and Cite
Hubaut, R.; Guichard, R.; Greenfield, J.; Blandeau, M. Validation of an Embedded Motion-Capture and EMG Setup for the Analysis of Musculoskeletal Disorder Risks during Manhole Cover Handling. Sensors 2022, 22, 436. https://0-doi-org.brum.beds.ac.uk/10.3390/s22020436
Hubaut R, Guichard R, Greenfield J, Blandeau M. Validation of an Embedded Motion-Capture and EMG Setup for the Analysis of Musculoskeletal Disorder Risks during Manhole Cover Handling. Sensors. 2022; 22(2):436. https://0-doi-org.brum.beds.ac.uk/10.3390/s22020436
Chicago/Turabian StyleHubaut, Rémy, Romain Guichard, Julia Greenfield, and Mathias Blandeau. 2022. "Validation of an Embedded Motion-Capture and EMG Setup for the Analysis of Musculoskeletal Disorder Risks during Manhole Cover Handling" Sensors 22, no. 2: 436. https://0-doi-org.brum.beds.ac.uk/10.3390/s22020436