Review of Energy in the Built Environment
by
 , , ,
, , ,
Ioannis Lampropoulos
1,* ,
,
Tarek Alskaif
1 ,
,
Wouter Schram
1,
Eelke Bontekoe
1,
Simone Coccato
2 and 
Wilfried van Sark
1
1
Copernicus Institute of Sustainable Development, Utrecht University, Princetonlaan 8a, 3584 CB Utrecht, The Netherlands
2
Information and Technology Services, Utrecht University, Heidelberglaan 8, 3584 CS Utrecht, The Netherlands
*
Author to whom correspondence should be addressed.
Smart Cities 2020, 3(2), 248-288; https://0-doi-org.brum.beds.ac.uk/10.3390/smartcities3020015
Submission received: 27 March 2020
/
Revised: 13 April 2020
/
Accepted: 14 April 2020
/
Published: 21 April 2020
(This article belongs to the Special Issue Integrated Urban Energy Systems: Focus on Real World Applications)
Abstract
:Urban environments can be key to sustainable energy in terms of driving innovation and action. Urban areas are responsible for a significant part of energy use and associated greenhouse gas emissions. The share of greenhouse gas emissions is likely to increase as global urban populations increase. As over half of the human population will live in cities in the near future, the management of energy supply and demand in urban environments will become essential. Developments such as the transformation of the electricity grid from a centralised to a decentralised system as well as the electrification of the transportation and heating systems in buildings will transform the urban energy landscape. Efficient heating systems, sustainable energy technologies, and electric vehicles will be critical to decarbonise cities. An overview of emerging technologies and concepts in the built environment is provided in this literature review on the basis of four main areas, namely, energy demand, supply, storage, and integration aspects. The Netherlands is used as a case study for demonstrating evidence-based results and feasibility of innovative urban energy solutions, as well as supportive policies.
1. Introduction
As over half of the human population will live in an urban environment in the near future [1], management of energy supply and demand will become essential. Even though cities occupy only 3% of the Earth’s land, the 5th Assessment Report of the Intergovernmental Panel on Climate Change (IPCC) shows that urban areas consume between 67% and 76% of global energy and generate about three quarters of global carbon emissions [2]. This share of global greenhouse gas (GHG) emissions is likely to increase as global urban populations increase. Global population is expected to surpass 9 billion by 2040 [3], and the United Nations projects that, by 2050, 6 billion people will live in cities (see Figure 1). Climate change poses a direct threat to future subsistence of cities, with many high-density cities being located in coastal areas, vulnerable to stormy weather and sea level rise. Failure to invest in urban resilience could force up to an estimated 77 million urban residents into poverty by 2030 in a scenario of high climate impacts and inequitable economic growth [4].
Developments such as the transformation of the electricity grid from a centralised to a decentralised system as well as the electrification of the transportation system and heating systems in buildings will transform the current urban energy landscape. Efficient heating systems, sustainable energy technologies, and electric vehicles will be critical to decarbonise cities. Currently, an increasing number of cities and communities are committing to 100% renewable energy targets, with decisive implications for (inter-)national energy policies.
1.1. Scope and Boundaries
In this paper, recent technological advances and their applications in the urban energy context are reviewed. An overview of emerging energy technologies and concepts in the built environment is provided on the basis of four main areas, namely, energy demand, supply, storage, and integration aspects. The Netherlands is used as a case study for demonstrating evidence-based results and feasibility of innovative urban energy solutions, as well as supportive policies.
A complete review of all technologies relating to energy in the built environment is impossible, therefore some boundaries have been set in this work. The focus is on emerging technologies that are expected to play a significant role in the energy transition in the short term and on electricity as an energy carrier due to its many sensible features. Electrical power can be generated from various primary energy sources in relation to geography and weather conditions; electricity is an efficient carrier at all stages from conversion to transmission and utilisation, and most of the end-uses of electrical power are pollutant-free. These features make electricity the energy carrier of choice for the future. However, in this work, next to electricity as a main energy carrier used around the world, also fuels (power-to-gas) and heat (power-to-heat) technologies are reviewed.
The topics addressed are energy demand, including the integration of electric mobility in the electricity grid, energy generation in the built environment by using photovoltaic (PV) systems, either applied or integrated in building envelopes, and combined heat and power (CHP) systems, optimisation of energy supply and demand in smart grids, and the role of energy storage technologies such as distributed battery-based energy storage systems (BESS) for building applications, underground thermal energy storage in the built environment, and power-to-gas as a seasonal energy storage technology.
1.2. Layout
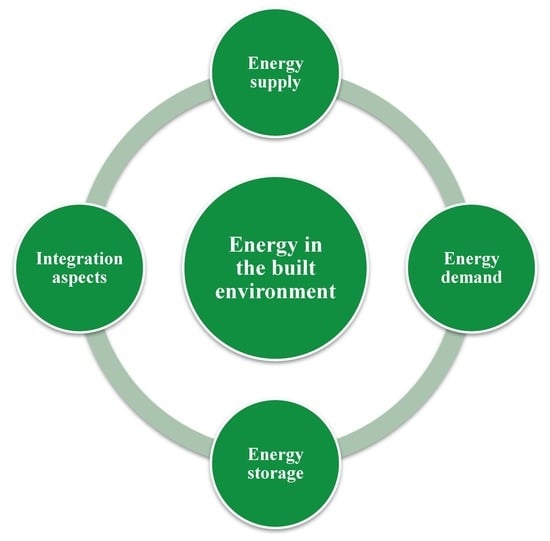
Energy in urban environments can be considered on the basis of four main areas, namely, energy demand, supply, storage, and integration aspects, as illustrated in Figure 2. The paper is structured in accordance with these four areas, as follows: energy demand is treated in Section 2, where the concepts of demand-side management (DSM), i.e., the management of resources at the customer side of the meter, and Demand Response (DR) are introduced, followed by new developments in energy efficiency in buildings and the electrification of space heating systems in buildings and the transportation system. In Section 3, an overview of distributed generation options is provided. Section 4 deals with energy storage technologies. In Section 5, integration aspects are presented, namely, smart grid and information and communication technologies (ICTs). In Section 6, the Netherlands is used as a case study for demonstrating evidence-based results and feasibility of innovative urban energy solutions, as well as supportive policies. The paper ends with a discussion in Section 7, and conclusions in Section 8.
2. Energy Demand
In this section, the focus is on energy demand in urban environments. First, the concept of DSM is introduced, followed by the emerging notions related to the electrification of heating systems in buildings and the transportation system. Note that DSM is broader in scope than either energy efficiency or load management and includes DR options such as the management of resources at the customer side of the meter, i.e., distributed generation, energy storage, controllable loads, and other on-site resources [5]. Electric Vehicles (EVs) may also be employed as energy storage/supply units. However, for classification purposes, it is a choice of the authors to present these topics in a unified chapter on energy demand and to draw the links with energy supply and storage in the subsequent sections.
2.1. Demand-Side Management (DSM)
In recent years the topic of DSM is becoming more important than ever, in parallel with the further deregulation of the electricity sector and the increasing integration of intermittent Renewable Energy Sources (RES). Nowadays, the load shape objectives under the concept of DSM can be classified into three categories: energy efficiency, self-consumption and DR (see Figure 3), in contrast with earlier categorisation in DSM, where ‘strategic load growth’ replaced self-consumption [6].
2.1.1. Demand Response (DR) Programmes
DR is a term used in economic theory to identify the short-term relationship between price and quantity when the actions and interactions of substitutes and complements are taken into account [6]. In the energy sector, DR programmes are designed to incentivise end-users to alter their short-term electricity usage patterns by scheduling in time and levelling the instantaneous power demand [6]. DR mechanisms are employed by electricity system planners, market parties, and operators as resource options for market optimisation, balancing supply and demand, and ensuring system security. DR has been recognised by academics and practitioners as a tool that allows to respond to challenges related to the intermittency of RES in a cost-effective and environmentally responsible manner. Currently, there is a growing consensus among policy makers and market participants that demand-side flexibility, through DR mechanisms, is a critical resource for achieving a low carbon and efficient electricity system [7].
Next to regulatory, technical, and economic aspects, the user behaviour is an integral part of DR mechanisms [8]. On one hand, residential users are ultimately nonprofessionals who do not have the same motivations, understanding, or technology awareness as professionals in the energy sector. They are mainly seeking a protective pricing environment and the means to avoid high risks, and various incentives can be offered to encourage voluntary participation in DR [6]. On the other hand, commercial and industrial users are mainly driven by financial incentives, and participation in DR has to account for any loss of revenue or process productivity. In this context, multidisciplinary approaches using social psychology and economic behaviour models have been proposed to overcome challenges such as price unresponsiveness, equity issues, and capital investments [9].
DR propositions are offered by intermediaries (suppliers and/or aggregators) to retail customers in the energy market in the form of optional programmes with voluntary subscription. A DR programme consists of a contractual agreement that sets the legal and technical requirements for operation and verification of DR, as well as the incentives for customers’ participation. DR programmes can be classified along two main categories [10]: incentive-based and price-based programmes. DR mechanisms employ different control schemes [6] and may also address self-consumption schemes [7].
Intermediaries such as suppliers and/or aggregators act between the consumers and/or producers, and the markets (wholesale and/or markets for ancillary services). In recent years, many Regional Transmission Organisations, Independent System Operators, and Transmission System Operators (TSOs) are structuring the rules of ancillary services markets such that DR resources can participate alongside conventional supply-side resources [6,11]. For the convenience of the reader, an overall system architecture of the physical power system and the electricity sector organisation in the European context, including a description of the main actors and their roles, can be found in [7].
2.1.2. Energy Efficiency in Buildings
New buildings represent an important opportunity to achieve lower energy requirements specifically in terms of heating intensity, however, 60% of the residential buildings that will be in use in the European Union (EU) in 2040 have already been built [12], therefore, a key policy challenge is to improve energy efficiency of the existing building stock. Without strong action to improve energy efficiency, building energy use could increase by 50% in 2050 compared to 2013 levels, whereas in the 2 °C scenario of the International Energy Agency (IEA) the energy demand could be kept almost at today’s level in 2050 [13]. The building sector accounts for almost 40% of cumulative investment in energy efficiency, nearly 60% of which supports more energy-efficient houses, appliances, and equipment [12].
The Energy Performance of Buildings Directive (EPBD) (2010/31/EU) [14] and the Energy Efficiency Directive (2012/27/EU) comprise the EU legislative framework to enhance the energy performance and efficiency of buildings. Both directives were recently amended as part of the Clean Energy for All Europeans package. The updated EPBD [15] emphasises efforts to both decarbonise and reduce energy demand in buildings and instructs member states to develop and implement strategies to make all buildings Nearly Zero Energy Buildings (NZEBs) by 2050, whereas new buildings are required to be NZEBs as of the 31 December 2020.
Retrofitting existing buildings, including the improvement of insulation and replacement of inefficient equipment, can provide significant efficiency gains. Retrofits are most effective in terms of efficiency and cost when a suite of different measures, for example, greater insulation and air sealing, as well as the replacement of electric resistance heaters with heat pumps, are implemented in parallel. This is known as a deep retrofit, which in general encompasses roof and wall insulation and double-glazed windows and can lead to a reduction in space heating energy demand of about 50% [12].
The potential of energy saving in buildings ranges significantly, depending on the employed scenario. In the World Energy Outlook 2018 [12], the New Policies Scenario (NPS) and the Sustainable Development Scenario (SDS) are employed for this purpose. The NPS reflects the policy ambitions that have been announced as of August 2018 and incorporates the commitments made in the Nationally Determined Contributions under the Paris Agreement, but does not speculate as to further evolution of these positions [12]. The SDS reflects the changes required to achieve the goals of the Paris Agreement, which are universal access to modern energy by 2030 and a significant reduction in energy-related air pollution [12]. In the NPS, energy demand in buildings in the EU is reduced annually by 0.65% to 2040, despite an increase in the number of households and building floor area, with most of the savings being attributed to an annual renovation of 2% of the building stock from 2020 onwards. Additional savings come from the replacement of old equipment, the switch to other fuels such as solar thermal for water heating, and the integration of heat pumps. In the NPS, energy demand for heating in the EU declines by 0.95% a year and the average energy intensity of space and water heating equipment is reduced by 35% in the period to 2040. The SDS assumes a higher retrofit rate of around 4% and estimates an energy demand reduction in buildings of more than 20% between 2017 and 2040, with most of the savings attributed to heating high efficiency standards for appliances [12]. Furthermore, the potential value of smart technologies for buildings, such as building automation, control systems and temperature controls, in terms of energy savings is emphasised in the EPBD [15]. As illustrated in Figure 4, smart controls can play a key role in terms of energy savings by end-uses. Smart controls could help to avoid more than 50 Mtoe of energy demand in buildings in the EU by 2040, or around 15% of energy consumption in buildings [12].
2.2. Heat Pumps in the Built Environment
Heat pumps currently account for ~5% in sales for heating requirement and ~3% in energy for heating [16]. However, heat pumps play an important role in scenarios towards a sustainable future, because instead of fossil fuels they can utilise RES as primary energy input [17]. In the new policy scenario of the IEA, heat pumps make up almost 10% of the heating equipment stock, whereas in the faster transition scenario it is 30% [16].
The basic principle of heat pumps is to supply heat by using thermal energy from a heat source and adding additional energy needed for compression and pumping [18]. The focus in this section is on the use of electricity for compression and pumping purposes. A heat pump usually comprises two heat exchangers, of which one serves as an evaporator and the other as a compressor, condenser, and expansion valve. A cold fluid is heated by being pumped through a heat source. Usually a heat pump is either air-sourced or ground-sourced. The advantage of the latter is that it is less dependent on seasonal fluctuations of ambient temperature and more energy-efficient, however it is also more expensive and is characterised by higher installation requirements [17,19]. The heated fluid is conducted through the evaporator of the heat pump, causing the refrigerant to vaporise. Electricity is used to compress the refrigerant, and subsequently the high-temperature refrigerant is condensed. The resulting heat is transferred to the heat sink, i.e., a house. The Coefficient of Performance is the ratio of heat delivered and electricity used; the average of heat pumps ranges from 3.2 to 4.5 for air-sourced heat pumps and from 4.2 to 5.2 for ground-sourced heat pumps [18].
The electrification of heating also poses challenges to the Low Voltage (LV) grid and is thus of importance for the built environment. Heating requirement coincides with the current peak non-heating electricity demand, which occurs in winter evenings in western European countries; for example, it was found that heat supply electrification could increase peak electricity demand in the UK by 20% within 15 years [20]. Another study found that a 50% penetration rate of heat pumps was estimated to result in an increase of 27.5% in peak electricity demand in the UK [21]. To some extent, this could be addressed by implementing smart heating equipment, e.g., by pre-heating houses within comfortable temperature limits before peak electricity hours; instead of 27.5%, this would lead to a 21.6% increase in peak electricity demand. This potential is limited because demand is shifted from peak hours to other hours with very high demand [21]. This implies that, for the electrification of residential heating, investments may be needed in LV grid reinforcement or integration of thermal/electrical energy storage within the built environment.
Next to managing heat pumps to limit peak demand, smart heat pumps can also have various other applications. A comprehensive review of smart heat pump applications is provided by [18]. They divide these applications into three categories: ancillary services, renewable energy integration, and operation under variable electricity prices. Ancillary services that heat pumps can provide include voltage control and provision of operating reserves. In voltage control, the active power demand of heat pumps is increased in times of under-voltage and decreased in times of over-voltage, e.g., via droop control (i.e., adjusting the compressor speed proportionally to the level of voltage violation) [22]. For provision of operating reserves, heat pumps can be pooled to operate on the Frequency Containment Reserve market. However, the potential earnings are limited, with 26 euros per household over a period of 30 weeks for a case study in the Netherlands [23]. Regarding renewable electricity integration, it was found that wind electricity supply and heat pump electricity demand match considerably, and smart control of heat pumps can foster wind energy integration even further [24]; because of the added electricity demand of heat pumps at times with potential wind electricity generation, increasing wind energy capacity becomes more attractive. Studies looking into the impact of heat pumps on PV electricity integration show that heat pumps increase self-consumption of PV-generated electricity, but to a limited extent because of the seasonal mismatch between PV electricity generation and heat pump electricity demand [17,18]. Lastly, regarding operation of heat pumps under variable electricity prices, benefits range from a 7% to 35% decrease in electricity costs, however, optimising on costs also leads to reduced energy efficiency because demand is shifted to the night and accompanying lower temperatures result in lower heat pump efficiency [18].
2.3. Integration of Electric Transport
The electrification of the transportation system is a key source of uncertainty with respect to the future electricity demand. In Figure 5, the global transport electricity demand projections in 2025 and 2040 are illustrated based on two scenarios by the Organisation for Economic Co-operation and Development (OECD) and IEA [12], i.e., the Future is Electric Scenario (FiES) and the NPS, which was introduced in Section 2.1.2. The FiES assumes widespread electrification and supporting policies for removing non-economic barriers to the deployment of electric end-use technologies [12]. Figure 5 shows a significant increase in transport electricity demand projections with respect to 2017 levels, but also significant differences among different enabling policies.
Currently, several options of battery EVs (BEVs) are available, with several manufacturers having announced plans to move towards all-electric powertrains, while designated policies further support this development, such as in France and the United Kingdom, where cut-off dates were announced after which the sales of conventional internal combustion engine (ICE) vehicles will not be allowed [12]. Electric light duty vehicles (LDVs) are becoming increasingly competitive, reaching cost parity with ICE vehicles around 2025 in many major markets, driven by declining battery costs [12]. Furthermore, concerns about air and noise pollution, especially in urban environments, promote the use of 2/3 wheelers with relatively low battery capacities, as well as electric buses, which can be facilitated due to routine trips by regular charging [12].
The environmental benefits in terms of local pollution and the relatively low cost of electricity compared to conventional fuels promote the electrification of the transportation system, but coordinated investments are required to establish the necessary charging infrastructure. New mobility services such as car sharing can further contribute to the reduction of energy demand, but the effect of autonomous vehicles might have the opposite effect by exacerbating urban sprawl [12]. In this section, the focus is on EVs and on electric public transport. Electrification projects in aviation, e.g., for short-haul flights, and in shipping, e.g., electric ferries in Norway, are left out of the scope since their technical feasibility is less certain [12].
2.3.1. Electric Vehicle (EV) Technology
EVs encompass Plug-in Hybrid Electric Vehicles (PHEVs) and BEVs, as well as fuel cell EVs, which are outside the scope of this paper. The main difference between the PHEV and the BEV is that the former also has an internal combustion engine, while the latter is fully electric. The global EV fleet has shown a large expansion in recent years, from 1.3 million EVs in 2015 to 5.1 million EVs in 2018 [25]. The displacement of cars with ICEs by EVs is expected to play an important role to reduce transport-related emissions, especially when the electricity generation mix is based more on RES [26]. Many governments have set policies in place to promote deployment of EVs, and/or set targets for future EV sales; based on both policies in place and announced policies, the global EV fleet size is expected to exceed 155 million in 2030 [25].
In an EV, a battery supplies the power needed by the electrical motor to drive the wheels. Several technical and qualitative distinctions can be made for EV charging. The first is between fast charging and slow charging. Usually, charging is considered to be fast when charging rates exceed 22 kW, and fast charging rates currently range up to 400 kW [25]. With fast charging, the conversion from the Alternate Current (AC) of the electricity grid to the Direct Current (DC) on which the battery operates often takes place in the charging station, especially for higher charging rates [27]. Slow charging, in contrast, uses the on-board converter of the EV to convert from AC to DC, where the power ranges from 3.7 kW of a regular socket to 22 kW in case of a three-phase connection. A further distinction is between uncontrolled charging and smart charging. Uncontrolled charging, also called uncoordinated charging, refers to charging that starts at the moment the user plugs the EV into a charging station, and stops when it is fully charged. Smart charging, also called coordinated charging, refers to charging in which some type of optimisation strategy, e.g., cost minimisation, is implemented [28].
An appropriate charging infrastructure is required for EVs to provide an equivalent service with ICE vehicles, but a business case for implementing charging points depends on the number of available EVs. Especially fast charging stations require frequent usage to result in a positive business case [29]. However, recent research shows that charging stations up to 50 kW can already be implemented without increasing total cost of ownership compared to ICE vehicles [30]. Next to financial barriers, governance issues exist in the potential rollout of a charging infrastructure, and an active role of local governments is recommended [31]. Another barrier to deploying an adequate charging infrastructure is related to the technical challenges of implementing charging points at the distribution level. As charging of EVs typically occurs at the LV distribution grid, the electrification of passenger vehicles poses various challenges and opportunities for the electricity grid in the built environment. In case of uncontrolled charging, the EV-charging demand peaks typically coincide with household electricity demand peaks, which can lead to congestion problems, high capacity reinforcement investment needs, less efficient power supply, and can affect power quality [32,33,34,35]. Smart charging can address this by delaying charging to off-peak hours, while taking the EV owner’s driving requirements into account. In the Netherlands, it was found that 59% of the aggregated EV demand can be delayed for more than eight hours [36]. By studying EV penetration rates of up to 20%, it was found that there was no impact from domestic EV charging on the peak electricity demand when smart charging was implemented [37]. For a 100% penetration rate of EVs in the Flemish residential grid, it was found that there was no need for upgrading the transformer capacities in case of coordinated charging [38]. The same study, using a combination of voltage droop charging and EV-based peak shaving as a charging strategy, found that voltage levels in the 100% penetration scenario were never below 0.85 p.u. in case of smart charging, with a maximum of 1.4% per week between 0.85 and 0.90 p.u., which is in line with the EN-50160 standards [39].
Numerous charging algorithms have been proposed to further increase the value of smart charging. For example, a cost minimization approach can be implemented, mostly resulting in valley-filling type of charging [40,41]. EVs can also be used to provide ancillary services to the system with smart charging; for example, an aggregation of EVs can be employed for the provision of upwards and downwards regulation, i.e., provision of balancing reserves to the TSO for frequency regulation [42]. Another use of smart charging is to increase the utilisation of renewable energy, particularly PV energy [43].
EVs could contribute further to the electricity grid by providing Vehicle-to-Grid (V2G) services, i.e., delivering power from the EV battery back to the electricity grid. V2G would increase the potential for providing ancillary services [44], open up possibilities for EVs to serve as back-up for renewable electricity generation [45], and contribute to peak shaving [46]. However, barriers to the deployment of V2G exist as currently no commercially available EVs are yet capable of delivering V2G, and V2G could hamper the lifetime of the battery of an EV [47].
2.3.2. Electric Public Transport
In the EU, transportation is responsible for around one fourth of all the GHG emissions, since over 90% of the fuel utilised for transportation is oil-based [48]. In order to achieve the ambitious goals of the Paris Agreement [49] and to improve the air quality in urban areas, it is important to consider low-carbon public transport solutions.
Shifting to urban transport systems that are less energy- and carbon-intensive depends on user behavioural aspects, which are in turn related to the available transport options. For the first time, the World Energy Outlook 2018 investigated the implications of ‘avoid’ and ‘shift’ policies on the demand for transport [12]. ‘Avoid’ policies are those that either reduce the need for mobility altogether, e.g., through more compact urban design, or provide incentives to eliminate unnecessary journeys, e.g., incentives for relocation close to the work environment. ‘Shift’ policies encourage different forms of transport such as switching from a private vehicle to public transportation, including buses and rail [12].
In [50], the authors performed a review of various performance features for three categories of electric buses (hybrid, fuel cell, and battery) and concluded that battery electric buses coupled with RES are arguably the best solution that provides zero net emissions. However, this is highly dependent on the mix of electricity generation per country. Furthermore, the driving range due to the battery could be a limiting factor for commercialization [51]. Bus transport systems are ideal to accelerate zero emission transport in urban areas due to the repetitive nature of the journeys and transport characteristics (e.g., fixed route lengths, schedules, lower congestion due to specifically designed bus lanes), while stops with regenerative breaking are another positive aspect that electric buses could add. However, electric buses will introduce many new parameters and interactions that could influence the quality of the service (e.g., system design, procurement of assets, and sensitivity to disturbance) [52].
Electric railway systems could play a key role in the sustainability plan of a country. However, in order to fully use the advantages in terms of energy consumption per transport capacity and to minimise the variable cost of energy, energy-efficient measures have to be implemented. Especially due to the high number of stops, recuperation of braking energy could have a great potential to reduce energy demand in urban rail systems. In [53], the authors made an overview of the different technologies to recover energy from braking energy in urban railways. They concluded that batteries, flywheels, and supercapacitor-based systems are the most interesting options for urban rail systems.
As can be seen in Figure 5, the rail sector currently accounts for the majority of electricity demand for transport. Electric rail, especially inter-city, offers an efficient mode of transport, particularly in countries with a high share of urban population and relatively high density [12], and this development is also supported by the further integration of RES.
3. Distributed Energy Generation
3.1. Photovoltaic (PV) Systems
PV solar energy conversion technology is based on the discovery of the PV effect by Becquerel in 1839 [54], and the first solar cell was made in 1954 by Bell Telephone Laboratories in the USA [55]. Today, various applications of PV solar cells exist, ranging from stand-alone PV systems, satellites, grid-connected PV systems, Building Applied PV (BAPV) systems, such as rooftop PV systems, Building Integrated PV (BIPV) systems, and very large systems with a power capacity of several tens of MW [56].
PV technology has evolved in the past decades into a major renewable electricity supplying technology with a total installed capacity of 600 GW [57], albeit contributing just about 3% of the global electricity demand. Investment incentives as well as support mechanisms, such as the feed-in tariff pioneered in Germany, have led to an impressive cost reduction from some 100 USD/W for a complete installed PV system in the 1970s to less than 1 USD/W today. The price development can be displayed using the experience curve approach [58,59], from which a so-called learning rate is derived of 21%, i.e., with every doubling of capacity the price decreases by 21%.
The PV market has been growing at rates of 25%–30% annually, and it is expected that growth rates will decrease to 10% or lower [60]. In order to reach a constant annual market volume of 1–3 TW, annual growth rates should remain 25%–30% beyond 2030 [61]. Such rates include replacement and recycling of PV systems after their 25-year expected lifetime. With these annual market volumes a global capacity of 25–80 TW can be realised, entering the age of terawatt of installed PV capacity [62], which is targeted in mid-century zero-emission scenarios based on deployment of 100% renewable energy generation [63,64].
At such large market volumes, the question arises whether there are any limits related to the use of critical materials in PV technologies, and how end-of-life approaches such as recycling can be effectively used. For that, we note that today’s market mainly consists of crystalline silicon (c-Si) wafer-based modules, next to a much smaller market share of so-called thin-film PV technologies such as CIGS (named after its elements, i.e., Cu, In, Ga, and Se) that use the materials copper, indium, gallium and selenium in compound form, and those that consist of cadmium and tellurium (CdTe). Material criticality has been analysed [65,66]. For c-Si PV technology the metal silver, which is used as conductive metal, has been identified as critical due to its limited abundancy, and Research and Development (R&D) is directed to replacing it with copper and/or aluminium [67]. For CIGS, indium and gallium are critical, and for CdTe, tellurium. This may limit deployment up to a terawatt level. Reuse and recycling are being developed, and processes have been successfully established [68,69], but given the present markets for recycling, a business model is not profitable yet, which is undoubtedly expected to change in the coming decades.
As solar PV systems are mostly built up from 1.6-m2-sized PV modules of 250–400 W, and inverters that convert DC power to AC power, they are very well suited for deployment in the built environment. Therefore, the number of small (1–10 kW size) residential systems is growing fast, also as a result of the attractive low cost of PV systems, while kW–MW-sized PV systems are found on commercial roofs and solar fields. In fact, the low levelised cost of electricity is lower than the retail electricity cost for all of Europe. This growth is expected to continue even when favourable support schemes such as feed-in-tariffs and net-metering are abolished. Self-consumption of PV power is enhanced by using home-sized BESS [70], which is expected to be economically attractive in the near future with decreasing battery cost.
Standard blue-coloured PV modules are not the only option anymore. Technological developments will be focused, as before, on increasing conversion efficiency and lowering cost, but also on developing options that are more aesthetically attractive. The latter is sacrificed at the expense of lower efficiencies though, but it is expected that these coloured modules will be favoured over standard facades in offices buildings [71].
Building Integrated Photovoltaic (BIPV) Systems
A BIPV system is defined as a building element that fulfils at least one essential building function besides electricity generation (e.g., protection from the sun, protection from the environment). Contrary to BAPV systems, removing a BIPV system means that it should be replaced by another building element in order to maintain a functional building [72]. In order to receive sufficient solar irradiance for the system to generate electricity, facades and roofs are ideal locations for applying BIPV systems. The multifunctional role of BIPV technology leads to substantial savings in terms of material, installation, and electricity costs [73], but also brings challenges in terms of design and regulations. Standardisation for BIPV systems was developed in EN 50583 to alleviate this challenge [74,75]. Furthermore, the integrated nature of a BIPV system has an important advantage in terms of aesthetics, leading to higher acceptance of large-scale adoption of PV technology into the built environment [71]. BIPV technology presently can be regarded as a niche in the PV field, as it only encompasses between 1% and 3% of all global cumulative installed PV capacity [71]. Nevertheless, the present EU EPBD and the so-called ‘Winter Package’ state that by 2020 all new buildings of the 28 member states should be NZEBs [14,76]. NZEB is defined as ‘the nearly zero or very low amount of energy required by the building should be covered to a very significant extent by energy from renewable sources, including energy from renewable sources produced on-site or nearby’ [76]. BIPV systems play an important role in this renewable energy production. Compared to wind or geothermal energy, solar energy is best applicable in the built environment. Further, the roof area on high-rise buildings is too small to fit enough PV modules to meet their energy demand. BIPV technology makes it possible to install PV units on façades in an aesthetic and economically viable way, such that the building’s energy demand can be met.
Figure 6 shows a classification of BIPV products where the roof systems are separated into pitched, flat, and curved roofs. Visual examples of these products can be found in the original source [77]. In [72], the reader can find a comparative analysis of different BIPV products. Regarding façade systems, a distinction can be made between cold and warm façades. In a cold façade, the BIPV system is not directly responsible for the indoor temperature of the building. For example, an insulation layer or ventilated area is present behind the PV modules. In a warm façade, also referred to as ‘Curtain wall’, the outer structure of the building envelope is directly connected with the interior of the building. In this case, the BIPV unit is actively responsible for insulation and protection against weather conditions [78]. Solar glazing is a kind of BIPV system where (semi-)transparent thin film solar cells or opaque solar cells are installed as glass units, either in façades or roofs, and can generate electricity while maintaining a certain degree of transparency and an unobstructed view of the outside. For roofing elements different systems are available: (a) full roof systems, where traditional roofing materials are completely replaced by a BIPV system; (b) in-roof mounting systems, with standard size solar modules, placed adjacent to other roofing materials; (c) alternatively, tiles, shingles, and slates can be replaced with versions that have PV cells incorporated in their structure. Further, BIPV systems are implemented as (large) metal panels or flexible membranes [79]. Contrary to the systems above, where the BIPV systems are part of the building envelope, accessories such as shading systems can also be applied. These systems are still regarded as BIPV systems because if they are removed, new products have to be installed to maintain a certain level of shading.
3.2. Wind Energy in Urban Environments
For many years, wind energy has been investigated mainly in rural areas and to a lesser extent in urban environment. The built environment requires a completely different approach when it comes to wind energy, especially in the design of wind turbines [80]. Several factors limit the development of wind energy in the urban environment. Urban areas have lower than average wind speeds compared to rural areas [81]. Furthermore, the size of the wind turbines is one of the most discouraging factors, where small wind turbines have a lower efficiency [82]. Other limiting aspects are related to the noise, the shadow flickering, and especially the constant need of non-turbulent wind, which is definitely not a characteristic of urban environments. Buildings, trees, and other wind obstacles require ad hoc strategies to cope with wind energy in urban environments. R&D is focusing on noise reduction and integration of these systems in the already present constructions, with the latest trend being in developing more reliable and cost-effective wind turbines.
From the variety of different designs, two are the main options for urban environment applications: horizontal axis wind turbines (HAWTs) and vertical axis wind turbines (VAWTs) [83]. HAWTs have a horizontal axis of rotation of the blades. These types of systems were the first wind turbines used in an urban environment. The main advantages rely on their high efficiency (close to the theoretical maximum). However, these are very sensitive to wind direction and turbulence, which require the propeller-type rotor HAWTs to be continuously redirected to the wind flow. VAWTs have a vertical axis of rotation of the blades. Four main types are available in this category: Darrieus, Gorlov, Giro Mill, and Savonius [83]. These types are gaining increasing interest as applications in the urban environment due their characteristic of being omnidirectional, i.e., these are not influenced by the wind direction as the HAWTs systems are. The generator can be positioned at the ground floor, with evident benefits regarding maintenance and control. VAWTs are produced on a smaller scale, compared to HAWTs, hence possessing an advantage when being installed in urban areas where the size of the system plays a key role. For this reason, maintenance operations are also easier to perform, and the impact on aircraft and birds is lower, compared to HAWTs [83]. In the category of VAWT, Ibis Power produces a highly suitable wind turbine for urban environments. They claim to be up to 40% more efficient than other VAWTs, easy to install, and manufactured in a variety of different sizes to reduce the aesthetic impact on the urban environment [84]. At the moment, large wind turbines already have a recyclability rate of 85% to 90%, with rotor blades representing a specific challenge due to the use of composite materials [85], and improving that is the aim for realising zero-waste wind turbines [86]. However, the environmental impact of small wind turbines installed in urban environments is mainly related to heavy metal pollution due to the use of aluminium, copper, and steel in the manufacturing process. In [87], the authors assessed the environmental impact of an installed HAWT with a rotor diameter of 1.7 m and power rating of 600 W for residential electricity generation, and they found that this impact is not considered to be significant on a global scale. Furthermore, a positive impact is also possible if the maximum output is achieved in an urban environment, and an increased use of recycled aluminium in turbine manufacturing would reduce even further the negative impact.
3.3. Cogeneration Devices for Heat and Power Applications
Cogeneration devices, also known as CHP, are technologies that can simultaneously generate electrical and thermal energy from a single energy stream such as oil, coal, natural or liquefied gas, biomass, or solar [88]. The main energy use by households in the EU is for heating (64% of final energy consumption in the residential sector in 2017, with renewables accounting for almost 25% of space heating demand), which makes cogeneration systems relevant for the built environment [89]. In the EU-28, utilising the heat rejected from conventional thermal power plants for district heating systems would result in increased energy efficiency, energy security, and a reduction of emitted GHGs [90]. Cogeneration systems are suitable for residential and small-scale commercial buildings in terms of meeting the electrical and thermal demands for space and domestic hot water heating, and potentially, absorption air conditioning [88]. Technologies suitable for urban cogeneration systems include reciprocating internal combustion engines, microturbines, fuel cells, and reciprocating external combustion Stirling engines. Fuel cell technology is further classified based on the electrolyte, such as the Alkaline Fuel Cell, the Polymer Electrolyte Membrane Fuel Cell, the Phosphoric Acid Fuel Cell, the Molten Carbonate Fuel Cell, and the Solid Oxide Fuel Cell. Technical specifications and requirements for ancillary systems vary with the fuel cell type.
In cogeneration systems, the efficiency of energy conversion increases to over 80% as compared to an average of 30%–35% for conventional fossil-fuelled electricity generation systems, which results in lower costs and GHG and other pollutant emissions (NOx, CO) when compared to the conventional methods of generating heat and electricity separately [88]. Furthermore, distributed cogeneration installations reduce the load on the transmission grid and can balance the load on the distribution level by enabling the integration of RES. Thus, distributed cogeneration can reduce the requirements for generation and transmission capacity, and compete with other generation options in the energy market. However, cogeneration units are better fitted for contemporaneous use of heat and electricity, and for energy generation close to the end-uses. Furthermore, coupling of the temperature level of the heat requirement with the cogeneration unit features must be established. CHP units have higher capital costs for the user compared to the electric boiler, and operation and maintenance are more complex tasks. Finally, next to the cost constraints, information constraints (inadequate promotion and provision of information) and technical constraints (the lack of metering arrangements in relation to the electricity distribution and the needs of the consumer) also prevent the widespread deployment of micro-CHP technologies [91].
Currently, many commercial cogeneration devices are available for residential, commercial, institutional, and small-scale industrial applications, though, apart from reciprocating internal combustion engines, which are well established, more data are required for microturbine, fuel cell, and Stirling engines, which are relatively new technologies. Reliable performance (e.g., longevity, actual efficiencies) and cost (e.g., operating and maintenance) data for these technologies are rather scarce, and this uncertainty makes difficult a comprehensive comparison among cogeneration technologies [88]. In Table 1, an overview and comparison with indicative data of cogeneration technologies is provided.
4. Energy Storage
Large-scale centralised as well as distributed small-scale energy storage technologies provide considerable options for the integration of intermittent RES and the efficient delivery of electrical power. A vision for the future is to integrate energy storage in different energy carrier forms, such as storing electricity in cooperation with thermal energy and gas storage so that large amounts of energy from fluctuating electricity generation can be stored with a high density and efficiency and low cost [93]. In this section the focus is on battery-based systems in buildings, underground thermal energy storage, and power-to-gas technology.
4.1. Distributed Energy Storage Systems for Buildings Applications
Distributed energy storage systems are essential technologies for enabling the dispatchability of RES. Different types of energy storage systems can be implemented in the built environment such as electricity storage (e.g., batteries) and heat storage [94]. At the moment, the most common forms of distributed energy storage in the built environment are BESS, where the storage medium is typically installed within the building (i.e., behind the meter) [94]. The main drivers behind the market growth of BESS are attributed to the large-scale integration of RES, the declining costs of battery storage per energy unit, and the policy developments in some countries (e.g., using batteries to phase out gas peaker plants, providing subsidies and incentive programs).
BESS can also be installed at grid or neighbourhood scales (i.e., front of the meter). Recent research demonstrates that shared or community energy storage (CES) systems can offer additional benefits due to beneficial economies of scale and optimal storage sizing and allocation [95,96].
Besides, CES supports distributed applications and energy trading in electricity markets more efficiently, since the controlling of CES is expected to be more convenient than the controlling of home-based energy storage systems (ESSs) [95,97]. CES can be defined as an ‘ESS located at the consumption level which can perform several applications with a positive impact for both end-users and the network’ [98]. Consequently, CES attracts attention, and different studies aim to capture additional benefits of CES when providing a combination of applications in the built environment [94,95,97,98,99].
In general, BESS can improve the efficiency of the power system by providing additional flexibility to TSOs and Distribution System Operators (DSOs), such as the provision of ancillary services, peak shaving, congestion management, and reduction of reserve provision from conventional units [70,100]. Figure 7 provides a taxonomy of different services and applications of BESS throughout the power system.
Recent research demonstrates that BESS can be employed for the creation of new business opportunities for aggregators by trading in different electricity sub-markets [101]. In addition, applications can be stacked in order to increase the profitability of BESS (e.g., by operating the batteries on different markets, receiving compensation for avoiding generation capacity additions, as well as transmission and distribution networks upgrade deferral) [95,99,102].
However, there are many challenges related to the future success of BESS deployment, including regulatory, technical, economic, and environmental. For instance, there is no storage definition in most current regulation frameworks. Ownership right, tariffs, and rules that recognize the value of BESS for providing stacked benefits to TSOs and DSOs remain undetermined. BESS management (e.g., operating BESS under uncertainty and considering the battery lifetime) is considered a technical challenge. Economic and environmental challenges of BESS include the relatively high investment costs, sizing problem, recyclability, and criticality of metals used to produce the batteries [94,95,99,103]. Potentially scarce or critical metals are used within the batteries [94]. Hence, the increasing demand for these raw critical metals is expected to result in increasing unit costs of production in terms of capital investments, as well as associated environmental burdens [104]. Consequently, resource utilisation is raising the concerns of different organisations, in terms of supply risks of materials and economic shortfalls [105]. A thorough comparison of the metal criticality of stationary BESS, including a wide set of criticality dimensions such as supply risk, environmental considerations, and economic importance, was conducted in [94]. The study proposed an evaluation of metal criticality in Life-Cycle Assessment methodologies by using comprehensive Life-Cycle Inventory data available for stationary BESS.
4.2. Underground Thermal Energy Storage (UTES) in the Built Environment
The seasonal offset in the demand and supply of thermal energy is the key challenge in increasing the share of RES in the heating and cooling sector [106]. Systems that use natural underground sites for storing thermal energy are called underground thermal energy storage (UTES) systems. UTES is characterized by high storage efficiencies and high storage capacities, making it highly suitable for long-term (seasonal) energy storage [107].
UTES can be distinguished as closed and open loop systems. In closed loop systems, a technical fluid (generally water) is pumped through heat exchangers into the ground. These systems are more or less independent of the permeability of the subsurface. An example of such a system is Borehole Thermal Energy Storage (BTES). Aquifer Thermal Energy Storage (ATES) is an example of an open loop system, where groundwater is exchanged with wells or underground caverns. In ATES, in the wintertime warm water is extracted from the warm well, used for heating, and the resulting cold water is injected into the cold well. Using heat pumps and low-temperature heating (<40 °C), only a few degrees temperature difference is required between the two wells. On the other hand, when there is a cooling demand, cold ground water is extracted from the cold well and used to cool the building. The resulting warm water is injected into the warm well for winter use. To sustain long-term use of ATES, a balancing of the seasonal storage of heat and cold is essential [108]. Another type of UTES is Tank Thermal Energy Storage (TTES), where heat and cold are stored in thermally stratified storage tanks. Pit Thermal Energy Storage (PTES) systems are dug pits filled with gravel and water. Naturally occurring cavities are utilised in cavern thermal energy storage systems [106]. Technical and subsurface-related aspects of the aforementioned UTES systems are compared in Table 2. A schematic representation of the most popular seasonal UTES techniques can be found in [108].
4.3. Power-To-Gas
Electricity systems based on intermittent RES face an increasing demand for flexibility to balance supply and demand. Power-to-gas technologies can provide flexibility and enhance system integration of RES, especially as seasonal energy storage technology, since the electricity surplus from RES can be converted into hydrogen by water electrolysis, which can be stored for later use with fuel cells. A review of power-to-gas pilot plants revealed that the design and sizing, control strategy, and system integration of the plants greatly influence their overall efficiency, reliability, and economics [110]. In [111], the authors developed a market model to assess the portfolio effect of combining RES-based electricity generation with electrolysis (power-to-hydrogen), and even though power-to-gas technology itself is loss-making, they found that power-to-gas particularly increases demand and hence prices in off-peak hours, which subsequently increases the profitability of renewable generation. This is an interesting approach, rather than considering the costs and benefits of power-to-gas technology in isolation. In [112], the authors compared power-to-gas with other energy storage technologies for large-scale applications ranging from residential load shifting to bulk energy storage and frequency regulation, and concluded that power-to-gas is favoured for utility scale energy storage applications where criteria such as energy portability, energy density, and suitability for seasonal storage are considered. As with fuel cells, power-to-gas is a relatively new technology and more data are required to guarantee reliable performance and cost effectiveness. Further research is required, particularly on improvement of efficiency, reliability, lifetime, and cost reduction, as well as integration with variable RES [110].
5. Integration Aspects
5.1. Smart Grid
The evolution of power systems must be seen as a continuous process of modernising existing infrastructure and of designing future systems for addressing a number of key challenges that the electricity sector is currently facing, such as the reduction of emissions, energy security, rising global demand, and promoting consumer empowerment through market transparency.
A smart grid is defined as ‘an electricity network that uses digital and other advanced technologies to monitor and manage the transport of electricity from all generation sources to meet the varying electricity demands of end-users’ [113]. Even though smart grid is a marketing term rather than a scientific term, smart grids provide an opportunity to link societal, financial, technological, and regulatory/policy objectives.
As can be seen in Figure 8, smart grids encompass a large variety of technologies, which can be attributed to the different domains of the electricity system (IEA, 2011). At the core of the smart grid are ICTs and renewable and distributed generation, which can be integrated at any point from generation to the customer side. ICT integration implies bidirectional and close to real-time communication among various devices and stakeholders to support a wide range of applications for more efficient grid operation. Wide-area monitoring and control technologies are assigned to large-scale generation facilities, the transmission grid, and at the interface with distribution grids, and involve real-time monitoring for protection, control, and automation purposes. Transmission enhancement applications improve the reliability, security, and efficiency of the transmission network. The technologies that are attributed to the domains of generation and transmission are outside the scope of this work due to their low relevance for the built environment. Distribution grid management also targets an increased reliability and security of the distribution system through real-time monitoring to manage faults, regulate the voltages, optimise the power flows, etc. Advanced metering infrastructure refers to the smart meters, which enable bilateral communication between the system users, their energy suppliers, and/or grid operators. Smart meters are fundamental in monitoring the performance and energy usage characteristics at the customer’s point of connection to the grid, and have the potential to empower consumers. EV-charging infrastructure aims to provide the means for the grid integration of EVs and can further enable smart charging and V2G applications, which are essential for the provision of flexibility to the system. Customer-side systems involve automated control systems at the customer’s premises, i.e., behind the meter, such as energy management systems (EMSs) that can integrate smart meters, efficient appliances, distributed generation, and energy storage devices. Smart technologies in buildings have the potential to contribute to increasing energy efficiency, enhancing flexibility in smart grids, and enhancing the comfort of the occupants. The Smart Readiness Indicator is currently advocated in the proposal for amending the EPBD as an indicator that could allow to assess the level of smartness of a given building [114].
One of the major challenges in the energy transition concerns a quest for flexibility. Flexibility is the capability of a power system to maintain reliable supply by modifying production or consumption in the face of rapid and large imbalances, and it is measured in terms of power available for ramping up and down, over time. The term flexibility includes electricity generation, transport, storage, trading, and end-use consumption [113]. Smart grids can optimise flexibility mechanisms in the contexts of the electricity market, system operation, and the use of grid hardware through dispatchable power plants, DSM and DR, ESSs and interconnection with adjacent markets [113].
Advancements in ICT, together with the fast deployment of distributed RES, as well as the increasing awareness of end-users towards their energy procurement and sustainability issues, have paved the way for more end-user-centric energy management solutions such as transactive energy and local energy trading systems [115,116]. These solutions can potentially play a role in increasing the self-consumption ratios, from distributed RES in buildings, both at individual and community levels. Blockchain technology is also receiving increasing attention for bilateral trading applications. In [117], the authors proposed an integrated blockchain-based energy management platform with bilateral trading for residential buildings in energy communities. Such solutions can contribute to reducing end-user energy procurement costs, as demonstrated in [115,117].
At the European level, the measures included in the Clean Energy for All Europeans package by the European Commission (EC) strongly rely on smart grid technologies to support an effective energy transition [76], by enabling flexibility in grid operation with high shares of RES, and active consumer market participation. In 2017, smart grid R&D and demonstration projects were documented in a report by the Joint Research Centre of the EC, which focused on the 28 EU Member States and assessed 950 projects, totalling around EUR 5 billion of investment [118]. The report indicated strong differences among member states in the number of projects and associated investments. Private investment appeared to be the dominant source of financing of smart grid projects, but with significant contributions from European and national funding sources, while the domains with highest investment were smart network management, DSM, and integration of distributed generation and storage [118].
PV systems, BEVs, BESS, and heat pumps are key technologies in decarbonising cities, however, this development will require integration technologies such as smart grids and ICT to enable a seamless operation [119]. Recent research results show that these technologies have substantial GHG emission reduction potential; however, a strong moderating factor is the existing electricity generation mix of a country, and the GHG emission reduction potential is highest in countries that currently have high hourly emission factors [119]. Still, another study shows that the electrification of the transportation system and heating systems in buildings, even under current carbon intensities of electricity generation, would result in reduced emissions in areas representing 95% of the global transport and heating demand [120]. Furthermore, future life-cycle emissions from EVs and heat pumps are expected to be on average lower than those of new fossil-fuelled cars and boilers, even if end-use electrification is not matched by rapid power-sector decarbonisation in almost all world regions [120]. The contribution in GHG emissions reduction of such distributed resources is expected to be even larger if their inherent flexibility is employed within the smart grid concept. A recent study on multi-objective optimisation of CES, based on day-ahead spot market prices and marginal emissions of electricity generation, shows that the simultaneous reduction of costs and emissions is possible even without hampering self-consumption of PV-generated electricity [121].
Finally, apart from smart grid operations, the further integration of data in modelling approaches can support the planning and reveal the policy complexities of urban energy systems. Research in modelling urban energy systems by using GIS approaches in combination with Building Information Modelling, and by using open-source data and models that can replicate urban features, indicates that such approaches can play a significant role in planning sustainable energy systems in cities [122], as well as in assessing the effect of different policy options [123].
5.2. Information and Communication Technologies (ICTs) in Building Energy Management Systems (EMS)
The evolution of the electricity grid is complemented by several advancements in ICT. In recent years, a large increase in the number of installed smart metering systems has taken place in Europe, triggered by the EU regulations and directives on the deployment of smart metering systems. For instance, the EU Recommendation 2012/148/EU deeply focuses on the roll-out of smart metering infrastructure, stating that at least 80% of electricity meters in EU member state buildings will be replaced by smart meters by 2020 [124].
A smart meter is a digital electric meter with advanced measurement and calculation hardware, software, calibration, and communication capabilities. It can measure and record the net electric power in buildings during short time intervals (e.g., every 10 seconds), and allow for bidirectional flow of information between a building and an energy service company [125,126]. These smart meters generate vast amounts of data, analysis of which provides insight into energy consumption and generation patterns and further enables energy management solutions and optimisation of energy flows [126]. This can provide a number of benefits to end-users and energy service providers, as well as system operators. The main advantages of smart electricity meters are summarised in Figure 9.
A smart metering system can be integrated with a Home Energy Management System (HEMS), which is a system capable of measuring and controlling the operation of all connected electric devices in a building [127]. A HEMS is an essential ICT component in the built environment for the success of other key solutions and technologies, such as DSM and energy storage. These solutions and technologies can not only reduce the energy procurement costs for end-users and improve the utilisation of local RES, but can also improve the flexibility of the power system by offering services to TSOs and DSOs, such as ancillary services and peak shaving [101]. A central coordinating HEMS can optimally balance power usage in the building by automatically (dis)charging BESS and scheduling flexible loads to operate at favourable times [128].
6. Case Study: The Netherlands
The Netherlands is used as a case study for demonstrating evidence-based results and future projections, as well as the feasibility of innovative urban energy solutions and supportive policies.
6.1. History, Current Situation, and Projections
The Dutch government has set a target to reduce the total GHG emissions to 113.8 Mton of CO2,eq in 2030, a reduction of ~49% compared to 1990 levels (see Figure 10). This target involves different sub-targets per sector (see Figure 11), based on existing policies and the Climate Agreement, which is further discussed in the following subsection. The targets and policies set by the Dutch government over the past years have significantly supported the sales of emerging energy-related technologies. In the following sections, main historical developments and projections for the Netherlands are presented for the aforementioned technologies in the areas of energy demand, energy supply, energy storage, and integration aspects.
6.1.1. Energy Demand
The built environment was responsible for ~12.5% of Dutch GHG emissions in 2015, and NZEBs are promoted in an effort to curb emissions. The definition of NZEB differs per country. In the Netherlands the NZEB definition requires that new buildings (both residential and non-residential) have a maximal demand of 25 kWh/m2/year for thermal energy and fossil fuels, with enforcement in the year 2019 for public buildings, and 2021 for private buildings [12], while the share of renewable energy (the amount of renewable energy divided by the total primary energy use, i.e., fossil- and renewable-based energy) shall meet a minimum of 50% [130].
Electrification of the heating and transportation systems is moving fast in the Netherlands. Space heating is the most dominant final energy use in buildings in the Netherlands (combined with domestic hot water, it represents >70% of the final energy demand of Dutch households), and about 54.6 Mt CO2-eq. were released by the heat production of buildings and the generation of electricity in 2010 [131]. The current most widely used heating technology in the Netherlands is a domestic gas-fired condensing boiler. In Figure 12, the number of installed heat pumps in buildings in the Netherlands is shown for the period from 2010 to 2018 [132], and, as can be seen, the majority consist of air-sourced systems, with similar shares between the residential and non-residential sectors. Since 1 July 2018, newly built houses have not been connected to the natural gas grid [133]. The ambition of the Dutch government is to make 50,000 houses per year natural-gas-free or ‘substantially energy efficient to become natural gas free on the short term’ from 2021 [134]. In 2050, all 7 million houses and 1 million office buildings in the Netherlands should be sustainable, which, according to the recently drafted Climate Agreement, entails well-insulated buildings heated by ‘sustainable heat’, using and possibly also producing clean electricity [135]. Recent R&D efforts in the built environment in the Netherlands are focused on energy efficiency measures such as improving insulation, integration of renewables (e.g., BAPV and BIPV systems) towards energy positive districts, citizen engagement and co-creation, and integration of energy storage in different forms [136].
The development of EV fleet size and market share in the period 2014–2019 is shown in Figure 13. The Dutch government has set the target of 10% of all new passenger cars to be sold with an electric powertrain and a plug in 2020, whereas the target for 2025 is 50% of all new passenger cars to be sold with an electric powertrain and a plug, and at least 30% of these vehicles (15% of the total) being fully electric, and the ambitious target for 2030 is that all new cars sold be Zero Emission Vehicles (i.e., including hydrogen fuel cell electric vehicles) [137]. As seen in Figure 13, the target for 2020 is expected to be met mainly due to the steady growth in sales of BEVs in recent years, whereas the sales of PHEVs among new cars peaked in 2015 and dropped since then as a result of changes in the tax rules [138]. The Netherlands is a densely populated country, i.e., with the highest population density in Europe for countries with an area of more than 316 km2 [139], and has a high share of urban population (91%) [140]. These conditions are favourable for intercity rails. In recent years, the Dutch state-owned railway company Nederlandse Spoorwegen (NS) has opted for a sustainable energy supply. Since 2017, all NS Dutch trains are running on sustainable energy. The electricity is generated by new wind farms owned by the Eneco energy supplier [141]. NS is the first railway company in the world to use 100% of the energy needed to power the trains from wind energy. NS consumes about 1.2 TWh of electricity each year, which is the equivalent of 1% of the Netherlands’ electricity consumption. Clearly, NS, with such agreements, influences energy suppliers to integrate more renewable energy generation in their portfolio. In 2018, many provinces and municipalities planned to invest in electric buses. Currently, the Dutch fleet of electric buses is the largest in Europe [142]. The Dutch government provides investment and incentives to support electric mobility with several incentive schemes in different municipalities that promote a variety of options ranging from electric taxis, lorries, buses, but also developing the necessary charging infrastructure, while Rijkswaterstaat (Directorate-General for Public Works and Water Management) is the first unit to replace 100 of its diesel vehicles with electric ones and plans to convert the entire fleet into electric vehicles by 2030 [142].The number of charging points for EVs in the period from 2016 to March 2020 is shown in Figure 14, illustrating a significant development in the charging infrastructure in recent years, while the fast charging locations (i.e., geographical locations containing one or more chargers with an electric power rate of >22 kW) have grown from 148 to 370 over the same period [137].
Recent R&D efforts related to EVs in the Netherlands focus on Mobility as a Service business models, including, among other options, smart charging from RES (e.g., PV-generated electricity), V2G, electric buses, and an increase in car-sharing systems [136,143]. The number of shared cars, as well as the share of EVs in car-sharing systems, has been steadily growing in the Netherlands over the period from 2016 to 2019, as shown in Table 3.
6.1.2. Energy Supply
In the Netherlands, the installed capacity of variable renewable energy generation, especially wind and solar PV systems, has been growing rapidly (see Figure 15). Since 2012, the energy policy in the Netherlands has been focused on specific technologies, wind energy being one of them. However, the focus until now has been mainly on offshore wind [82]. The PV market in the Netherlands has seen a policy-influenced development since 2000, with the net-metering scheme being the main market driver in the early development of PV energy. This has led to an economic payback period for household PV investors of about seven years. The net-metering scheme will be gradually abolished starting in 2023 and ending in 2031, ensuring this favourable economic payback time [144,145].
According to the Dutch Central Bureau of Statistics, by the end of 2015 about 1.05 GW of the total grid-connected PV capacity of 1.51 GW consisted of residential PV systems (69% of cumulative capacity), which grew to about 80% of the cumulative capacity by 2016 [145]. The Dutch solar market grew by 46% in 2018, due to an annual deployed capacity of 1.33 GW, which resulted in a Dutch cumulative total capacity of more than 4.24 GW [146]. A large part of this growth in recent years is attributed to the contribution of large-scale solar projects developed under the SDE+ scheme. The SDE+ is a (feed-in-tariff) subsidy scheme for renewable energy generation in the Netherlands, where the amounts of the subsidies are allocated for periods of 12 or 15 years, depending on the technology used and the amount of renewable energy generated [147]. At the end of 2019 an estimated PV capacity of 7 GW was installed, mostly on roofs in residential areas, and the market growth is expected to continue to reach an annual market of 4 GW from 2024 onwards [57]. Different markets are distinguished: utility scale PV markets with >10 MW park scale are expected to grow by 1 GW per year. The residential market is also expected to have a 1-GW installed capacity in 2024. Most growth is expected to take place in the commercial sector (~2 GW). Based on this, it is expected that 24 GW PV energy will be installed by 2024. In a recent roadmap on PV systems and applications, a 237-GW PV potential is identified to be realised mid-century, of which about 30% is expected to be floating PV systems [148].
The market development of BIPV systems in the Netherlands has also seen an acceleration in recent years (see Figure 16), supported by the Stroomversnelling initiative and the ‘BENG’ regulation, with a projected installed capacity of 350 MWp in 2020 (Folkerts, 2015). Stroomversnelling is a nonprofit organisation that innovates in the field of energy transition in houses and neighbourhoods, which started as an initiative among four building companies and six housing corporations to renovate 10,000 dwellings in the social housing sector to NZEBs [149]. BENG (which stands for Bijna Energie Neutraal Gebouw, the Dutch abbreviation of NZEB) is the Dutch implementation of the NZEB directive [150].
6.1.3. Energy Storage
Over the past decade, experimentation with BESS in the Netherlands was often initiated by DSOs, such as in the case of a lithium–ion BESS (with a nominal capacity of 230 kWh) integrated in a LV distribution system with residential customers and PV generation in Etten-Leur, in the Netherlands [153], which was developed and commissioned by Enexis DSO to enable field-testing and research of distributed energy storage technologies in LV distribution systems. In 2018, a 3 MW/2.8 MWh BESS was completed in the Johan Cruijff Arena in Amsterdam, which is claimed to be the largest energy storage system powered by 148 second-life/reused batteries from EVs, enabling applications such as Uninterruptible Power Supply (UPS), grid stability by balancing the energy demand and supply, peak shaving to reduce the grid strain during peak demand hours, and maximising the utilisation of the energy generated by the 4200 PV panels installed on the roof of the Arena [154].
The option of converting the surplus RES generation into hydrogen as a medium for energy storage is also considered. In a recent review on power-to-gas projects producing hydrogen or renewable substitute natural gas, the authors concluded that the market implementation of power-to-gas technology for various electrolysis and methanation technologies, is underway concerning cost (~500 EUR/kWel in 2050) and installed capacity [155]. Global project allocation is taking place mostly in central Europe and especially in Germany, Denmark, and the Netherlands, with the Netherlands planning to increase their capacity until 2022 up to 12 MWel [155].
The implementation of UTES has also seen a rapid increase since the late 1990s in the Netherlands, with a total energy use of 5759 TJ and total installed capacity of 2105 MW in 2015 [156], as shown in Figure 17. Looking specifically into the global spatial distribution of ATES projects, the Netherlands is a world market leader with 2500 implemented ATES projects, followed by 220 projects in Sweden and 55 projects in Denmark [106].
6.1.4. Integration Aspects
The Dutch government has put emphasis on the importance of smart grid pilots and integration of renewable energy [157]. In a 2017 inventory of smart grid projects in the EU, the Netherlands was ranked in the 8th position with 58 demonstrations and 66 R&D projects, and in the 7th position in terms of associated investments (EUR 166 million in demonstrations, and EUR 43 million in R&D projects, with EUR 27 million coming from national investment, EUR 58 million from EC funds, and EUR 124 million from private funds), while the domains with highest investment were the smart network management, DSM, integration of distributed generation and storage, and e-mobility [118]. Infrastructure for charging EVs is expected to grow further, and by 2023 the Dutch DSOs anticipate smart charging for 1 million cars to enable efficient utilisation of the existing networks and defer upgrades [142].
Regarding the rollout of smart meters, the Third Energy Package provided that implementation of smart metering may be subject to an economic assessment of long-term costs and benefits to the market and individual consumers. In the Netherlands, a positive Cost–Benefit Analysis (CBA), was conducted in 2005, and revised in 2010 (Net Present Value (NPV): EUR 770 million) [158]. In the Netherlands, the expected diffusion rate of smart meters by 2020 is 100%, which accounts for 7.6 million smart electricity meters [159]. Currently, more than 5 million households are equipped with a smart meter, and before the end of 2020 every household will be offered a smart meter, with the DSOs being the responsible parties for the implementation of the smart metering systems [160].
Regarding the net-metering scheme, which was originally scheduled to be replaced in 2020, the Dutch government recently decided to maintain its current conditions for residential PV systems until the end of 2023, with plans to gradually phase them out by 2031. With the net-metering scheme in place, there is no financial incentive for prosumers to store the surplus of PV-generated electricity. By the moment that the scheme will be abolished, PV energy is expected to have reached grid parity, and the gradual phase-out is also expected to create opportunities for energy storage technologies by encouraging self-consumption. Residential PV installations supported by the net-metering scheme accounted for about 550 MW (38% of the solar market in 2018) [145].
6.2. The Climate Agreement
This section includes an analysis of the Proposal for the Outlines of the Climate Agreement (Voorstel voor hoofdlijnen van het Klimaatakkoord: VHKA) by the Planbureau voor de Leefomgeving (PBL), i.e., The Netherlands Environmental Assessment Agency, which is the national research institute that advises the Dutch government on environmental policy and spatial planning issues [129]. The talks to reach a Climate Agreement took place at five sectoral tables with the participation of the government, business, and social parties. These sectoral tables were: (1) Mobility, (2) Electricity, (3) Built environment, (4) Industry, and (5) Agriculture and land use. For our purpose, in the following we focus on the first three sectoral tables. The main points for the Climate Agreement, based on the analysis in [129], are as follows:
- The proposal cannot yet be calculated. The expected effect of the VHKA cannot yet be determined in terms of expected environmental effects, expected costs, burden sharing, spatial effects, and labour market effects. The various technical and behavioural measures that have been identified aim at reducing national GHG emissions. However, how citizens and businesses can be stimulated to actually implement these measures still remains an open question. Policy instruments and binding agreements still have to be worked out in cases where there are different options for achieving the same goal, and the primacy lies mainly with the government.
- From a technical point of view, the proposed measures offer sufficient potential to meet the emission reduction targets, however the instrumentation still has to be elaborated. The proposed measures that have been identified by the sectoral tables have, from a technical point of view, sufficient emission reduction potential to meet the targets per sector in 2030. However, this does not guarantee their successful implementation, since the views on the policy to be developed and stakeholder agreements are generally elaborated, and strong incentives are required to encourage realisation by those involved.
- The elaboration of the required instrumentation is an ongoing and complex process. The method of organisation, choices between coercion or stimulation, the funding approach, the resulting burden sharing, and the affordability for citizens and businesses, as well as the effects on public finances, still remain a complex puzzle. The cabinet included cost effectiveness as one of the frameworks for the Climate Agreement.
- The proposed measures are broadly in line with a cost-effective approach. The national additional costs of the proposed technical measures compared to the reference scenario amount to roughly EUR 3–4 billion in the year 2030. This amount consists of the annual change in the required additional investments of around EUR 80–90 billion and the annual operating costs and benefits, including the benefits for avoided energy demand. Although the proposals do not add up to the cheapest way of achieving the target by 2030, the more expensive measures seem appropriate in view of the ongoing transition in the following period. The aforementioned costs are offset by benefits from avoided GHG emissions and any other prosperity benefits, such as improving air quality. These benefits are not identified in the present analysis, but, according to various studies, far outweigh the costs internationally.
- The costs for end-users and government are still unknown. Amounts from a national cost methodology cannot be compared with amounts from a government or consumer perspective. To determine this, it is necessary to have insight into the intended policy instruments. The effects of the proposals on burden-sharing, public finances, and affordability for citizens and businesses can therefore not be determined at this time.
- Cross-links require consistent elaboration. Due to the structure in the five negotiating sectoral tables, insufficient focus has been placed on the cross-links, which are crucial for reaching a consistent agreement. Sometimes actions are needed at one table to achieve reductions at another table, or measures influence each other. For instance, references to energy carriers other than electricity receive little consideration in the proposal, e.g., gas in the form of methane or hydrogen, liquid transport fuels, hot water. The target outlines the demand for green gas and heat for heating networks in the built environment, biofuels in traffic and hydrogen in industry. Proposals for their production and delivery are, however, still largely missing. This also applies to biomass, an important raw material for green fuels. On the basis of the proposals, the demand for sustainable biomass could become so large that it is uncertain whether the supply will be sufficient, and the proposals aimed at increasing that offer are still lacking.
- Attention to the required short-term efforts for innovation helps the transition in the long term. The emission target of a 49% reduction in 2030 compared to 1990 is a starting point in thinking about the Climate Agreement, but the pursuit of a 95% reduction in 2050 also plays a role. The VHKA already offers some contours for a transition agreement. Innovations at system level are crucial for achieving the required transition to a climate-neutral society at the lowest possible costs. Such innovations require preparations in the form of demonstration projects, infrastructure, legislative changes, training, new responsibilities and partnerships, and government-focused CO2 reduction.
Reflection per Sectoral Table
The transition is already visible in the electricity system in the form of increased wind and solar energy capacity (see Figure 15). The proposals of the Electricity sectoral table are aimed at strengthening further the implementation of these technologies. This development also makes the energy transition an important area of attention for spatial policy. The North Sea will play a central role in this, for instance, in terms of offshore wind and floating PV systems. The implicit proposal that additional residential demand for electricity must be accompanied by the same amount of additional generation of renewable electricity means that electrification on the demand side leads to the transfer of emissions to the electricity system. However, due to the interconnected European system and electricity market, a growth of renewable electricity generation in the Netherlands does not lead one-to-one to GHG emissions reduction in the Netherlands, and developments abroad can have a major impact on emissions in the Netherlands. It therefore seems advisable, in connection with guaranteeing the agreements, to make explicit whether this international dynamic should be accommodated within the agreement. The most important bottleneck seems to be the development after 2025. The proposal suggests that through strong price reductions for wind and solar energy, further growth after 2025 can also take place without price support from the SDE+ scheme, and its successor SDE++. However, the PBL considers it unlikely that the desired growth will be achieved without an alternative policy. The EUR 200 million that is still available for stimulating renewable electricity generation in 2030 is therefore not expected to be sufficient to realise these ambitions. Partly from a market security perspective, it therefore seems advisable not to postpone the preparation of alternative instruments until 2021. This set of instruments should possibly be able to respond to the aforementioned international dynamics and the need for adjustable capacity.
The Mobility sectoral table mapped out a multitude of possible technical measures and policy instruments, but has not yet proposed desirable choices among them. The transition to zero-emission road traffic, the use of green fuels (wider than biofuels), and payments for the use of motorways can make a major contribution to achieving the emission reduction requirement for mobility in 2030. However, each of these three proposals has its own practical risks with regard to market, technical, and political preconditions. Adjustments to mobility behaviour can be a cost-effective approach, but the effects on other aspects such as accessibility, road safety, and quality of life must also be taken into account. These developments must also lay the foundation for the transition to 2050. The possible costs of the Dutch government policy, in addition to the final instrument choices, also depend on the approach followed by the EU.
The approach of the Built Environment sectoral table affects the Dutch people more directly. The proposed package of measures provides a stimulus for a coherent policy approach and makes a strong appeal to homeowners, tenants, corporations, and owners of utility buildings to make decisions focused on sustainability. The effort to increase the price incentives and reduce costs is expected to encourage the parties individually to take measures in the proposed direction. However, a common approach is sought through agreements per district, whereas elaboration of the proposal must ensure that the policy incentives that individual decision makers are confronted with are in line with what is jointly desired. The aforementioned parties also need clarity on the technical approach, timing of home improvement, burden-sharing and freedom of choice. Since not everything can happen at the same time, the elaboration of instruments should also take into account the possible emergence of undesirable differences between neighbourhoods that are quickly dealt with through the neighbourhood approach and those that will only take action towards sustainability later. The extent to which the proposals in individual cases or for certain groups can lead to undesirable situations also requires further attention in the implementation.
7. Discussion
Power is about geography and weather, and these two aspects determine to a large extent where the energy comes from and how energy is used. Accurate forecasting methods for energy demand and supply are thus needed. When looking into buildings’ final energy demand by end-use, space heating continues to dominate building energy use in OECD countries, while cooking and water heating are prominent end-uses in non-OECD countries [13]. An important element of the urban energy transition relates to the role of the energy consumers. Consumers increasingly need to be empowered, especially considering that products and markets have become more complex, with an increasing flow of information, and new requirements in consumers’ decision-making in liberalised market environments. Active users at the demand-side can contribute to helping solve the challenges of electricity systems and receive significant benefits for their participation. A significant barrier for realising this potential is insufficient consumer engagement and awareness regarding their own energy consumption. Smart meters, data analytics, and gamification techniques [125,161] can increase awareness and conceivably lead to behavioural change. However a danger can accompany data protection, privacy, and security. European rules protect the personal data of consumers [162], while the EC has produced guidance on data protection and privacy for data controllers and investors in smart grids [163], and is also working on new rules for the secure exchange of data to access market information [164]. Furthermore, the EC, alongside the Energy Expert Cyber Security Platform, is preparing a strategy on cyber security for the energy sector under the Directive on Security of Network and Information Systems [165].
The design of user-centric energy systems requires multidisciplinary socio-technical research to address equity issues. In October 2019, the User-Centred Energy Systems Technology Collaboration Programme was launched by the IEA [166]. Among the different annexes and goals, one aim is to identify hard-to-reach energy users, to engage them in emerging energy concepts while meeting access, equity, and energy service needs. Hard-to-reach energy users are defined as those who are ‘…hard to engage or motivate in behaviour change, energy efficiency and demand response interventions…’ [166]. Within this initiative by the IEA, equity means ‘expanding all programmes and policies to ensure the inclusion and participation of individuals in vulnerable or underserved communities, such as minorities, women, indigenous and low-income people, and formerly incarcerated persons’ [166]. Surveys have already been conducted and the first findings from social research are expected to be published in the course of 2020, and we advise the reader to follow the updates in [166]. Furthermore, a review of equity measurement can be found in [167], where the authors have documented efforts to define, collect, analyse, and report on equity in the clean energy industry. EU strategies for a low carbon built environment include the electrification of heating systems in buildings through heat pumps [168], and electrification of transport, which combines vehicles with efficient powertrains and the opportunity of using RES [169]. Furthermore, the characteristics of a city determine the most effective policy opportunities for creating sustainable urban energy systems. For instance, energy related CO2 emissions decrease with increasing the number of individuals per household, while the transport energy use decreases with increasing population density [13]. Thus, policies could target the planning of more compact residential structures and urban environments, and the integration of geographical data in modelling approaches can provide support in this direction. Regarding energy supply technologies, large technical potential exists for electricity from urban rooftop PV and BIPV units and district heat generation from municipal solid waste [13]. The contribution of urban rooftop PV systems to urban electricity needs varies across regions, depending on local resource conditions and competition with alternative generation options, but small cities with fewer than 100,000 inhabitants account for almost 40% of the technical potential for urban rooftop PV systems [13]. Electricity networks are at the heart of decarbonising cities, and a huge growth in urban energy networks is foreseen with almost doubling of urban distribution network lengths by 2050 [13]. Integration of smart grids with other energy networks is expected to further increase resilience, sustainability, and cost efficiency of the energy system [93].
In the Netherlands, realised emission reduction in 2016, compared to the 1990 level, has been 11.8% according to the Annual European Union GHG inventory 1990–2016 and the Inventory Report 2018 of the European Environment Agency [129]. It is rather uncertain whether the reduction target of 49% of GHG emissions by 2030, compared to 1990 levels, according to the national Climate Agreement, will be met. According to the Proposal for the Outlines of the Climate Agreement [129], for each sector there are several technical options, challenges, and legal and/or regulatory issues to reach the climate goals in 2030 and 2050. Relating to energy in the built environment, the most relevant sectors are the built environment, inland mobility, and electricity generation. Technical options include deep insulation measures, electrification of heating systems, and the development of district heating systems. Challenges concern mainly the materialisation of the theoretical potential of these technologies in real-world conditions, the establishment of the necessary workforce with the appropriate expertise and technical skills, as well as the coordination between the different levels, i.e., from (inter)city level down to the neighbourhood and household level. Legal and regulatory issues concern the discontinuation of gas supply and ownership transfer (to the individual or linked to the neighbourhood level). For inland mobility (road passenger, freight, rail, etc.), the short-term technical options focus on electrification of the transport sector (EVs for passenger cars) and the use of biofuels, while the option of hydrogen-fuelled vehicles is a long-term option due to technical and economic issues related to the technology development. Challenges face the development of the technical options and the political acceptance of volume measures. Legal and regulatory concerns must be considered regarding the EU (fleet-average) emission standards and the sustainability aspects of biofuels.
For electricity generation there are several technical options with the focus placed on (offshore) wind and PV measures, as well as the integration of energy storage and DSM measures. The main challenge is to maintain the pace of PV and wind energy development and to incentivise the development of energy storage and the roll-out of DSM measures. The legal and regulatory issues concern whether the market liberalisation alone is sufficient for delivering the power system transition, the coordination at EU level, the establishment of novel tariff structures (for supporting DR and self-consumption), and how to enable the necessary investments in the monopolistic segments of grid operation by TSOs and DSOs.
8. Conclusions
Urban environments can be key to sustainable energy, and drive innovation and action. Efficient heating systems, sustainable energy technologies, better public transport, and electric vehicles will be critical to decarbonise cities. Strategies to enable low-carbon urban systems must take into account the particular energy patterns and governance models of a city. Co-creation with citizens, industry, national and local governments is required, as well as the need for international co-operation. Increased momentum to achieve the urban sustainable energy transition will require greater need for (intergovernmental) coordination and delegation. In modelling urban energy systems, next to top-down approaches, there is a need for more bottom-up approaches (from the device and user level up to the building, district, and system levels) in determining the potential of different urban energy options The integration of geographical data in modelling approaches could be of assistance in visualising the potential of different technological options, not only for planning purposes but also for supporting effective policy making. Furthermore, there is a need for defining the cross-links between sectors, such as energy generation, mobility, and transport, and the built environment, and determining potential trade-offs. Eventually, there is a need for unified frameworks that can address all the different technologies and concepts to support urban planning and policy making.
In the Netherlands, like in many other countries, for each sector there are several technical options, challenges, and legal or regulatory issues to reach the climate goals in 2030 and 2050. The proposed measures are still subject to adjustments, and even after a final Climate Agreement has been reached circumstances or insights may change, which may require to adjust the measures or instruments needed. Guaranteeing the agreements is of course important, but we also require agreements on how and when a mechanism comes into effect that makes adjustments possible. Overall, the main challenges are mainly of a governance and political nature. Even though there are several techno-economic pathways to enable a net-zero emission built environment by 2050, what is lacking is the institutional and political support to enable this transition.
Author Contributions
Conceptualisation, I.L.; Data Curation, All authors; Writing-Original Draft Preparation, I.L.; Writing-Review & Editing, All authors; Visualisation, I.L. All authors have read and agreed to the published version of the manuscript.
Funding
This research received no external funding.
Acknowledgments
This work is partially supported by the Integrated and Replicable Solutions for Co-Creation in Sustainable Cities (IRIS) project, which received funding from the EU Horizon 2020 research and innovation program under grant agreement No 774199; the PV-Prosumers4Grid Project, which received funding from the EU Horizon 2020 research and innovation programme under grant agreement No 764786; and the research project A Blockchain-based platform for peer-to-peer energy transactions between Distributed Energy Resources (B-DER), Netherlands Enterprise Agency (Rijksdienst voor Ondernemend Nederland: RVO) within the Dutch Topsector Energy framework, project number: 1621404. This paper is inspired by the course Energy in the Built Environment (GEO4-2522), and we would like to thank all the colleagues at the Copernicus Institute of Sustainable Development who have contributed to the development of the course material, and the many students who enrolled in the course and have provided very useful feedback.
Conflicts of Interest
The authors declare no conflicts of interest.
References
- United Nations. The 2017 Revision of World Population Prospects. United Nations, Department of Economic and Social Affairs, Population Division, 2017. Available online: https://population.un.org/wpp/ (accessed on 15 September 2018).
- Seto, K.C. Human settlements, infrastructure, and spatial planning. In Climate Change 2014: Mitigation of Climate Change; Contribution of Working Group III to the Fifth Assessment Report of the Intergovernmental Panel on Climate Change: Geneva, Switzerland, 2014. [Google Scholar]
- United Nations. World Population Prospects: The 2017 Revision, Key Findings and Advance Tables; United Nations, Department of Economic and Social Affairs, Population Division: New York, NY, USA, 2017. [Google Scholar]
- World Bank. Investing in Urban Resilience: Protecting and Promoting Development in a Changing World; The World Bank: Washington, DC, USA, 2015. [Google Scholar]
- CIGRÉ. Demand Side Integration; CIGRÉ Working Group C6.09: Paris, France, 2011. [Google Scholar]
- Lampropoulos, I.; Kling, W.L.; Ribeiro, P.F.; van den Berg, J. History of demand side management and classification of demand response control schemes. In Proceedings of the IEEE Power & Energy Society General Meeting, Vancouver, BC, Canada, 21–25 July 2013. [Google Scholar]
- Lampropoulos, I.; van den Broek, M.; van Sark, W.; van der Hoofd, E.; Hommes, K. Enabling Flexibility from Demand-side Resources through Aggregator Companies. In Smart Cities in the Mediterranean; Springer: Berlin, Germany, 2017; pp. 333–353. [Google Scholar]
- Lampropoulos, I.; Vanalme, G.M.; Kling, W.L. A methodology for modeling the behavior of electricity prosumers within the smart grid. In Proceedings of the IEEE PES Innovative Smart Grid Technologies Conference Europe, Gothenberg, Sweden, 11–13 October 2010. [Google Scholar]
- Gyamfi, S.; Krumdieck, S.; Urmee, T. Residential peak electricity demand response—Highlights of some behavioural issues. Renew. Sustain. Energy Rev. 2013, 25, 71–77. [Google Scholar] [CrossRef] [Green Version]
- Albadi, M.H.; El-Saadany, E.F. A summary of demand response in electricity markets. Electr. Power Syst. Res. 2008, 78, 1989–1996. [Google Scholar] [CrossRef]
- Lampropoulos, I.; van den Broek, M.; van Sark, W.; van der Hoofd, E.; Hommes, K. A System Perspective to the Deployment of Flexibility through Aggregator Companies in the Netherlands. Energy Policy 2018, in press. [Google Scholar] [CrossRef]
- IEA. World Energy Outlook 2018; Organisation for Economic Co-operation and Development (OECD)/International Energy Agency (IEA): Paris, France, 2018. [Google Scholar]
- IEA. Energy Technology Perspectives: Towards Sustainable Urban Energy Systems. Available online: https://www.iea.org/media/etp/etp2016/ETP2016_Webinar_ALL.pdf (accessed on 2 June 2016).
- European Union. Directive 2010/31/EU of the European Parliament and of the Council of 19 May 2010 on the energy performance of buildings. Off. J. Eur. Union 2010, 153, 13–35. [Google Scholar]
- European Union. Directive (EU) 2018/844 of the European Parliament and of the Council of 30 May 2018 Amending Directive 2010/31/EU on the Energy Performance of Buildings and Directive 2012/27/EU on Energy Efficiency. Off. J. Eur. Union 2018, 75–91. [Google Scholar]
- IEA. Perspectives for the Clean Energy Transition; International Energy Agency: Paris, France, 2019. [Google Scholar]
- Litjens, G.B.M.A.; Worrell, E.; Sark, W.G.J.H.M.V. Energy & Buildings Lowering greenhouse gas emissions in the built environment by combining ground source heat pumps, photovoltaics and battery storage. Energy Build. 2018, 180, 51–71. [Google Scholar]
- Fischer, D.; Madani, H. On heat pumps in smart grids: A review. Renew. Sustain. Energy Rev. 2017, 70, 342–357. [Google Scholar] [CrossRef] [Green Version]
- Hepbasli, A.; Akdemir, O. Energy and exergy analysis of a ground source (geothermal) heat pump system. Energy Convers. Manag. 2004, 45, 737–753. [Google Scholar] [CrossRef]
- Staffell, I.; Pfenninger, S. The increasing impact of weather on electricity supply and demand. Energy 2018, 145, 65–78. [Google Scholar] [CrossRef]
- Eggimann, S.; Hall, J.W.; Eyre, N. A high-resolution spatio-temporal energy demand simulation to explore the potential of heating demand side management with large-scale heat pump diffusion. Appl. Energy 2019, 236, 997–1010. [Google Scholar] [CrossRef]
- Dallmer-Zerbe, K.; Fischer, D.; Biener, W.; Wille-Haussmann, B.; Wittwer, C. Droop controlled operation of heat pumps on clustered distribution grids with high PV penetration. In Proceedings of the 2016 IEEE International Energy Conference, ENERGYCON, Leuven, Belgium, 4–8 April 2016. [Google Scholar]
- Posma, J.; Lampropoulos, I.; Schram, W.; van Sark, W. Provision of Ancillary Services from an Aggregated Portfolio of Residential Heat Pumps on the Dutch Frequency Containment Reserve Market. Appl. Sci. 2019, 9, 590. [Google Scholar] [CrossRef] [Green Version]
- Hedegaard, K.; Münster, M. Influence of individual heat pumps on wind power integration-Energy system investments and operation. Energy Convers. Manag. 2013, 75, 673–684. [Google Scholar] [CrossRef] [Green Version]
- IEA. Global EV Outlook 2019; International Energy Agency: Paris, France, 2019. [Google Scholar]
- Knez, M.; Zevnik, G.K.; Obrecht, M. A review of available chargers for electric vehicles: United States of America, European Union, and Asia. Renew. Sustain. Energy Rev. 2019, 109, 284–293. [Google Scholar] [CrossRef]
- Schroeder, A.; Traber, T. The economics of fast charging infrastructure for electric vehicles. Energy Policy 2012, 43, 136–144. [Google Scholar] [CrossRef]
- Daina, N.; Sivakumar, A.; Polak, J.W. Modelling electric vehicles use: A survey on the methods. Renew. Sustain. Energy Rev. 2017, 68, 447–460. [Google Scholar] [CrossRef] [Green Version]
- Madina, C.; Zamora, I.; Zabala, E. Methodology for assessing electric vehicle charging infrastructure business models. Energy Policy 2016, 89, 284–293. [Google Scholar] [CrossRef] [Green Version]
- Bauer, G.S.; Phadke, A.; Greenblatt, J.B.; Rajagopal, D. Electrifying urban ridesourcing fleets at no added cost through efficient use of charging infrastructure. Transp. Res. Part C: Emerg. Technol. 2019, 105, 385–404. [Google Scholar] [CrossRef]
- Lopez-Behar, D.; Tran, M.; Mayaud, J.R.; Froese, T.; Herrera, O.E.; Merida, W. Putting electric vehicles on the map: A policy agenda for residential charging infrastructure in Canada. Energy Res. Soc. Sci. 2019, 50, 29–37. [Google Scholar] [CrossRef]
- Mwasilu, F.; Justo, J.J.; Kim, E.K.; Do, T.D.; Jung, J.W. Electric vehicles and smart grid interaction: A review on vehicle to grid and renewable energy sources integration. Renew. Sustain. Energy Rev. 2014, 34, 501–516. [Google Scholar] [CrossRef]
- Sundström, O.; Binding, C. Flexible charging optimization for electric vehicles considering distribution grid constraints. IEEE Trans. Smart Grid 2012, 3, 26–37. [Google Scholar] [CrossRef]
- Yong, J.Y.; Ramachandaramurthy, V.K.; Tan, K.M.; Mithulananthan, N. A review on the state-of-the-art technologies of electric vehicle, its impacts and prospects. Renew. Sustain. Energy Rev. 2015, 49, 365–385. [Google Scholar] [CrossRef]
- Brinkel, N.B.; Gerritsma, M.K.; Alskaif, T.A.; Lampropoulos, I.; van Voorden, A.M.; Fidder, H.A.; van Sark, W.G. Impact of rapid PV fluctuations on power quality in the low-voltage grid and mitigation strategies using electric vehicles. Electr. Power Energy Syst. 2020, 118, 105741. [Google Scholar] [CrossRef]
- Gerritsma, M.K.; AlSkaif, T.A.; Fidder, H.A.; Sark, W.G.v. Flexibility of Electric Vehicle Demand: Analysis of Measured Charging Data and Simulation for the Future. World Electr. Veh. J. 2019, 10, 14. [Google Scholar] [CrossRef] [Green Version]
- Qian, K.; Zhou, C.; Allan, M.; Yuan, Y. Modeling of load demand due to EV battery charging in distribution systems. IEEE Trans. Power Syst. 2011, 26, 802–810. [Google Scholar] [CrossRef]
- Leemput, N.; Geth, F.; van Roy, J.; Delnooz, A.; Buscher, J.; Driesen, J. Impact of electric vehicle on-board single-phase charging strategies on a flemish residential grid. IEEE Trans. Smart Grid 2014, 5, 1815–1822. [Google Scholar] [CrossRef]
- NEN-EN. 50160-Voltage Characteristics of Electricity Supplied by Public Electricity Networks; NEN-EN: Delft, The Netherlands, 2010. [Google Scholar]
- Al-Awami, A.T.; Sortomme, E. Coordinating vehicle-to-grid services with energy trading. IEEE Trans. Smart Grid 2012, 3, 453–462. [Google Scholar] [CrossRef]
- Wu, X.; Hu, X.; Moura, S.; Yin, X.; Pickert, V. Stochastic control of smart home energy management with plug-in electric vehicle battery energy storage and photovoltaic array. J. Power Sources 2016, 333, 203–212. [Google Scholar] [CrossRef] [Green Version]
- Sortomme, E.; El-Sharkawi, M.A. Optimal charging strategies for unidirectional vehicle-to-grid. IEEE Trans. Smart Grid 2011, 2, 119–126. [Google Scholar] [CrossRef]
- van der Kam, M.; van Sark, W. Smart charging of electric vehicles with photovoltaic power and vehicle-to-grid technology in a microgrid; a case study. Appl. Energy 2015, 152, 20–30. [Google Scholar] [CrossRef] [Green Version]
- Hoogvliet, T.W.; Litjens, G.B.M.A.; Sark, W.G.J.H.M.V. Provision of regulating- and reserve power by electric vehicle owners in the Dutch market. Appl. Energy 2017, 190, 1008–1019. [Google Scholar] [CrossRef]
- Drude, L.; Junior, L.C.P.; Rüther, R. Photovoltaics (PV) and electric vehicle-to-grid (V2G) strategies for peak demand reduction in urban regions in Brazil in a smart grid environment. Renew. Energy 2014, 68, 443–451. [Google Scholar] [CrossRef]
- Wang, Z.; Wang, S. Grid Power Peak Shaving and Valley Filling Using Vehicle-to-Grid Systems. IEEE Trans. Power Deliv. 2013, 28, 1822–1829. [Google Scholar] [CrossRef]
- Habib, S.; Kamran, M.; Rashid, U. Impact analysis of vehicle-to-grid technology and charging strategies of electric vehicles on distribution networks—A review. J. Power Sources 2015, 277, 205–214. [Google Scholar] [CrossRef]
- E.U. Statistical Pocketbook 2017-EU Transport in Figures; Publications Office of the European Union: Brussels, Belgium, 2017. [Google Scholar]
- Rhodes, C.J. The 2015 paris climate change conference: COP21. Sci. Prog. 2016, 99, 97–104. [Google Scholar] [CrossRef]
- Mahmoud, M.; Garnett, R.; Ferguson, M.; Kanaroglou, P. Electric buses: A review of alternative powertrains. Renew. Sustain. Energy Rev. 2016, 62, 673–684. [Google Scholar] [CrossRef]
- Beckers, C.J.; Besselink, I.J.; Frints, J.J.; Nijmeijer, H. Energy Consumption Prediction for Electric City Buses. Paper presented at 13th ITS European Congres, Eindhoven, The Netherlands; 2019. [Google Scholar]
- Kok, R.; Groot, D.R.; van Zyl, S.P.; Wilkins, S.; Smokers, M.R.T.; Spreen, S.J. Towards Zero-Emissions Bus Transport; TNO: The Hague, The Netherlands, 2017. [Google Scholar]
- González-Gil, A.; Palacin, R.; Batty, P. Sustainable urban rail systems: Strategies and technologies for optimal management of regenerative braking energy. Energy Convers. Manag. 2013, 75, 374–388. [Google Scholar] [CrossRef]
- Becquerel, E. Mémoire sur les effets électriques produits sous l’influence des rayons solaires. Comptes Rendus de L´Academie des Sciences 1839, 9, 561–567. [Google Scholar]
- Chapin, D.M.; Fuller, C.S.; Pearson, G.L. A New Silicon p-n Junction Photocell for Converting Solar Radiation into Electrical Power. J. Appl. Phys. 1954, 25, 676. [Google Scholar] [CrossRef]
- IEA. Trends 2018 in Photovoltaic Applications—Survey Report of Selected IEA Countries between 1992 and 2017; International Energy Agency, Photovoltaic Power Systems Programma (IEA-PVPS): Paris, France, 2018. [Google Scholar]
- Solar Power Europe. Global Market Outlook for Solar Power. Available online: http://www.solarpowereurope.org/wp-content/uploads/2019/05/SolarPower-Europe-Global-Market-Outlook-2019-2023.pdf (accessed on 30 October 2019).
- Louwen, A.; van Sark, W. Photovoltaic solar energy. In Technological Learning in the Transition to a Low-Carbon Energy System; Elsevier: Amsterdam, The Netherlands, 2020; in press. [Google Scholar]
- Louwen, A.; van Sark, W.; Faaij, A.P.; Schropp, R.E. Re-assessment of net energy production and greenhouse gas emissions avoidance after 40 years of photovoltaics development. Nat. Commun. 2016, 7, 1–9. [Google Scholar] [CrossRef]
- Vartiainen, E.; Masson, G.; Breyer, C.; Moser, D.; Medina, E.R. Impact of weighted average cost of capital, capital expenditure, and other parameters on future utility-scale PV levelised cost of electricity. Prog. Photovolt. 2019, in press. [Google Scholar] [CrossRef] [Green Version]
- Hoffmann, W.; Metz, A. Modules at a price of 10 $ct/Wp–dream or reality? New approach for future cost and price predictions. In Proceedings of the 36th European Photovoltaic Solar Energy Conference, Marseille, France, 9–13 September 2019. [Google Scholar]
- Haegel, N.M.; Margolis, R.; Buonassisi, T.; Feldman, D.; Froitzheim, A.; Garabedian, R.; Green, M.; Glunz, S.; Henning, H.M.; Holder, B.; et al. Terawatt-scale photovoltaics: Trajectories and challenges, Coordinating technology, policy, and business innovations. Science 2017, 356, 141–143. [Google Scholar] [CrossRef] [PubMed]
- Bogdanov, D.; Farfan, J.; Sadovskaia, K.; Aghahosseini, A.; Child, M.; Gulagi, A.; Oyewo, A.S.; Barbosa, L.D.S.N.S.; Breyer, C. Radical transformation pathway towards sustainable electricity via evolutionary steps. Nat. Commun. 2019, 10, 1–16. [Google Scholar] [CrossRef] [PubMed] [Green Version]
- Ram, M.; Bogdanov, D.; Aghahosseini, A.; Gulagi, A.; Oyewo, A.S.; Child, M.; Caldera, U.; Sadovskaia, K.; Farfan, J.; Barbosa, L.S.N.S.; et al. Global Energy System Based on 100% Renewable Energy–Power, Heat, Transport and Desalination Sectors; Lappeenranta University of Technology and Energy Watch Group: Berlin, Germany, 2019. [Google Scholar]
- Elshkaki, A. Materials, energy, water, and emissions nexus impacts on the future contribution of PV solar technologies to global energy scenarios. Sci. Rep. 2019, 9, 1–19. [Google Scholar] [CrossRef] [PubMed]
- Haxel, G.B.; Hedrick, J.B.; Orris, G.J. Rare Earth Elements-Critical Resources for High Technology. USGS Fact Sheet 087-02. 2002. Available online: https://pubs.usgs.gov/fs/2002/fs087-02/fs087-02.pdf (accessed on 10 April 2020).
- VDMA. International Technology Roadmap for Photovoltaic (ITRPV) Results 2018 Including Maturity Report 2019; VDMA: Frankfurt, Germany, 2019. [Google Scholar]
- Deng, R.; Chang, N.L.; Ouyang, Z.; Chong, C.M. A techno-economic review of silicon photovoltaic module recycling. Renew. Sustain. Energy Rev. 2019, 109, 532–550. [Google Scholar] [CrossRef]
- PV CYCLE. PV CYCLE. 2020. Available online: http://www.pvcycle.org (accessed on 10 April 2020).
- Schram, W.L.; Lampropoulos, I.; van Sark, W. Photovoltaic systems coupled with batteries that are optimally sized for household self-consumption: Assessment of peak shaving potential. Appl. Energy 2018, 223, 69–81. [Google Scholar] [CrossRef]
- Scognamiglio, A. Building-Integrated Photovoltaics (BIPV) for Cost-Effective Energy-Efficient Retrofitting. In Cost-Effective Energy-Efficient Building Retrofitting; Woodhead Publishing: Sawston, UK; Cambridge, UK, 2017; pp. 169–197. [Google Scholar]
- Tripathy, M.; Sadhu, P.K.; Panda, S.K. A critical review on building integrated photovoltaic products and their applications. Renew. Sustain. Energy Rev. 2016, 61, 451–465. [Google Scholar] [CrossRef]
- Tabakovic, M.; Fechner, H.; van Sark, W.; Louwen, A.; Georghiou, G.; Makrides, G.; Loucaidou, E.; Ioannidou, M.; Weiss, I.; Arancon, S.; et al. Status and Outlook for Building Integrated Photovoltaics (BIPV) in Relation to Educational needs in the BIPV Sector. Energy Procedia 2017, 111, 993–999. [Google Scholar] [CrossRef]
- CENELEC. European Standard EN 50583-1 Photovoltaics in Buildings-Part 1: BIPV Modules; CENELEC: Brussels, Belgium, 2016. [Google Scholar]
- CENELEC. European Standard EN 50583-2 Photovoltaics in buildings-Part 2: BIPV Systems; CENELEC: Brussels, Belgium, 2016. [Google Scholar]
- European Commission. Clean Energy for All Europeans, Communication from the Commission to the European Parliament, the Council, the European Economic and Social Committee, the Committee of the Regions and the European Investment Bank; European Commission: Brussels, Belgium, 2016. [Google Scholar]
- Frontini, F.; Bonomo, P.; Chatzipanagi, A.; Verberne, G.; van den Donker, M.; Sinapis, K.; Folkerts, W. BIPV Product Overview for Solar Façades and Roofs-BIPV Status Report 2015; SUPSI-SEAC: Eindhoven, The Netherland; Lugano, Switzerland, 2015. [Google Scholar]
- Roberts, S.; Guariento, N. Building Integrated Photovoltaics: A Handbook; Walter de Gruyter GmbH: Berlin, Germany, 2009. [Google Scholar]
- Zanetti, I.; Bonomo, P.; Frontini, F.; Saretta, E.; Donker, M.v.d.; Vossen, F.; Folkerts, W. Building Integrated Photovoltaics: Product Overview for Solar Building Skins; SUPSI-SEAC: Eindhoven, The Netherland; Lugano, Switzerland, 2017. [Google Scholar]
- van Bussel, G.; Mertens, S. EACWE4—The Fourth European & African Conference on Wind Engineering; Academy of Sciences of the Czech Republic: Prague, Czechia, 2010. [Google Scholar]
- Mertens, S. Wind energy in urban areas: Concentrator effects for wind turbines close to buildings. Refocus 2002, 3, 22–24. [Google Scholar] [CrossRef]
- Rezaeiha, A.; Montazeri, H.; Blocken, B. Urban Wind Energy Potential in the Netherlands—An Exploratory Study; RVO, TKI Urban Energy: Utrecht, The Netherlands, 2018. [Google Scholar]
- Ishugah, T.F.; Li, Y.; Wang, R.Z.; Kiplagat, J.K. Advances in wind energy resource exploitation in urban environment: A review. Renew. Energy 2014, 37, 613–626. [Google Scholar] [CrossRef]
- Ibis Power; VDW Turbine. Ibis Power. Available online: https://ibispower.eu/vdw-turbine/ (accessed on 1 March 2020).
- WindEurope. Circular Economy: Blade Recycling Is a Top Priority for The Wind Industry. WindEurope. 12 February 2020. Available online: https://windeurope.org/newsroom/news/blade-recycling-a-top-priority-for-the-wind-industry/ (accessed on 10 March 2020).
- ETIPWind Executive Committee. How Wind is Going Circular; ETIPWind: Brussels, Belgium, 2019. [Google Scholar]
- Allen, S.R.; Hammond, G.P.; McManus, M.C. Energy analysis and environmental life cycle assessment of a micro-wind turbine. Proc. Inst. Mech. Eng. Part A J. Power Energy 2008, 222, 669–684. [Google Scholar] [CrossRef]
- Onovwiona, H.I.; Ugursal, V.I. Residential cogeneration systems: Review of the current technology. Renew. Sustain. Energy Rev. 2006, 10, 389–431. [Google Scholar] [CrossRef]
- Eurostat. Energy Consumption in Households. 28 October 2019. Available online: https://ec.europa.eu/eurostat/statistics-explained/index.php/Energy_consumption_in_households. (accessed on 1 March 2020).
- Colmenar-Santos, A.; Rosales-Asensio, E.; Borge-Diez, D.; Blanes-Peiró, J.-J. District heating and cogeneration in the EU-28: Current situation, potential and proposed energy strategy for its generalisation. Renew. Sustain. Energy Rev. 2016, 62, 621–639. [Google Scholar] [CrossRef]
- Simader, G.R.; Krawinkler, R.; Trnka, G. Micro CHP Systems: State-of-the-Art; Austrian Energy Agency: Vienna, Austria, 2006. [Google Scholar]
- U.S. EPA. Catalog of CHP Technologies Section 2. Technology Characterization Reciprocating Internal Combustion Engines; U.S. Environmental Protection Agency (EPA): Washington, DC, USA, 2015.
- ETIP SNET. Vision 2050-Integrating Smart Networks for the Energy Transition: Serving Society and Protecting the Environment. June 2018. Available online: https://www.etip-snet.eu/wp-content/uploads/2018/06/VISION2050-DIGITALupdated.pdf (accessed on 1 March 2020).
- Terlouw, T.; AlSkaif, T.; Bauer, C.; van Sark, W. Optimal energy management in all-electric residential energy systems with heat and electricity storage. Appl. Energy 2019, 254, 113580. [Google Scholar] [CrossRef]
- Parra, D.; Maciej, S.; Daniel, I.S.; Stuart, A.N.; Andreas, A.; Jörg, W.; Travis, O.; Rodrigues, L.; Gillott, M.; Zhang, X.; et al. An interdisciplinary review of energy storage for communities: Challenges and perspectives. Renew. Sustain. Energy Rev. 2017, 79, 730–749. [Google Scholar] [CrossRef]
- Zhao, D.; Wang, H.; Huang, J.; Lin, X. Virtual Energy Storage Sharing and Capacity Allocation. IEEE Trans. Smart Grid 2020, 11, 1112–1123. [Google Scholar] [CrossRef]
- Terlouw, T.; AlSkaif, T.; Bauer, C.; van Sark, W. Multi-objective optimization of energy arbitrage in community energy storage systems using different battery technologies. Appl. Energy 2019, 239, 356–372. [Google Scholar] [CrossRef]
- Parra, D.; Norman, S.A.; Walker, G.S.; Gillott, M. Optimum community energy storage system for demand load shifting. Appl. Energy 2016, 174, 130–143. [Google Scholar] [CrossRef]
- van der Stelt, S.; AlSkaif, T.; van Sark, W. Techno-economic analysis of household and community energy storage for residential prosumers with smart appliances. Appl. Energy 2018, 209, 266–276. [Google Scholar] [CrossRef]
- Katsanevakis, M.; Rodney, A.S.; Junwei, L. Aggregated applications and benefits of energy storage systems with application-specific control methods: A review. Renew. Sustain. Energy Rev. 2017, 75, 719–741. [Google Scholar] [CrossRef] [Green Version]
- Lampropoulos, I.; Alskaif, T.; Blom, J.; van Sark, W. A framework for the provision of flexibility services at the transmission and distribution levels through aggregator companies. Sustain. Energy Grids Netw. 2019, 17, 100187. [Google Scholar] [CrossRef] [Green Version]
- Lampropoulos, I.; Garoufalis, P.; van den Bosch, P.P.; Kling, W.L. Hierarchical predictive control scheme for distributed energy storage integrated with residential demand and photovoltaic generati. IET Gener. Transm. Distrib. 2015, 9, 2319–2327. [Google Scholar] [CrossRef] [Green Version]
- Terlouw, T.; Zhang, X.; Bauer, C.; Alskaif, T. Towards the determination of metal criticality in home-based battery systems using a Life Cycle Assessment approach. J. Clean. Prod. 2019, 221, 667–677. [Google Scholar] [CrossRef]
- Frenzel, M.; Kullik, J.; Reuter, M.A.; Gutzmer, J. Raw material ‘criticality’—Sense or nonsense? J. Phys. D Appl. Phys. 2017, 50, 123002. [Google Scholar] [CrossRef]
- National Research Council. Minerals, Critical Minerals, and the U.S. Economy; National Academy of Sciences: Washington, DC, USA, 2008. [Google Scholar]
- Fleuchaus, P.; Godschalk, B.; Stober, I.; Blum, P. Worldwide application of aquifer thermal energy storage—A review. Renew. Sustain. Energy Rev. 2018, 94, 861–876. [Google Scholar] [CrossRef]
- Lee, K.S. Underground Thermal Energy Storage. In Underground Thermal Energy Storage; Springer London: London, UK, 2013; pp. 15–26. [Google Scholar]
- Bloemendal, M.; Olsthoorn, T.; Boons, F. How to achieve optimal and sustainable use of the subsurface for Aquifer Thermal Energy Storage. Energy Policy 2014, 66, 104–114. [Google Scholar] [CrossRef]
- Lund, R.; Jensen, L.L. The Potential of Implementing Thermal Energy Storage in an Energy System with a High Share of Wind Power; Aalborg University: Aalborg, Denmark, 2013. [Google Scholar]
- Gahleitner, G. Hydrogen from renewable electricity: An international review of power-to-gas pilot plants for stationary applications. Int. J. Hydrog. Energy 2013, 38, 2039–2061. [Google Scholar] [CrossRef]
- Lynch, M.; Devine, M.T.; Bertsch, V. The role of power-to-gas in the future energy system: Market and portfolio effects. Energy 2019, 185, 1197–1209. [Google Scholar] [CrossRef]
- Walker, S.B.; Mukherjee, U.; Fowler, M.; Elkamel, A. Benchmarking and selection of Power-to-Gas utilizing electrolytic hydrogen as an energy storage alternative. Int. J. Hydrog. Energy 2016, 41, 7717–7731. [Google Scholar] [CrossRef]
- IEA. Technology Roadmap Smart Grids; International Energy Agency: Paris, France, 2011. [Google Scholar]
- E.C. Consultation on the Establishment of a Smart Readiness Indicator for Buildings. 28 August 2019. Available online: https://ec.europa.eu/energy/en/consultations/consultation-establishment-smart-readiness-indicator-buildings (accessed on 1 March 2020).
- Wang, H.; Huang, J. Incentivizing Energy Trading for Interconnected Microgrids. IEEE Trans. Smart Grid 2018, 9, 2647–2657. [Google Scholar] [CrossRef] [Green Version]
- Nunna, H.S.K.; Amanbek, Y.; Satuyeva, B.; Doolla, S. A decentralized transactive energy trading framework for prosumers in a microgrid cluster. In Proceedings of the IEEE PES GTD Grand International Conference and Exposition Asia (GTD Asia), Bangkok, Thailand, 19–23 March 2019. [Google Scholar]
- van Leeuwen, G.; AlSkaif, T.; Gibescu, M.; van Sark, W. An integrated blockchain-based energy management platform with bilateral trading for microgrid communities. Appl. Energy 2020, 263, 114613. [Google Scholar] [CrossRef]
- Gangale, F.; Vasiljevska, J.; Covrig, F.; Mengolini, A.; Fulli, G. Smart Grid Projects Outlook 2017: Facts, Figures and Trends in Europe; EUR 28614 EN; Publications Office of the European Union: Luxembourg, 2017. [Google Scholar] [CrossRef]
- Schram, W.; Louwen, A.; Lampropoulos, I.; van Sark, W. Comparison of the Greenhouse Gas Emission Reduction Potential of Energy Communities. Energies 2019, 12, 4440. [Google Scholar] [CrossRef] [Green Version]
- Knobloch, F.; Hanssen, S.V.; Lam, A.; Pollitt, H.; Salas, P.; Chewpreecha, U.; Huijbregts, M.A.; Mercure, J.F. Net emission reductions from electric cars and heat pumps in 59 world regions over time. Nat. Sustain. 2020. [Google Scholar] [CrossRef]
- Schram, W.; Alskaif, T.; Lampropoulos, I.; Henein, S.; van Sark, W. On the trade-off between Environmental and Economic Objectives in Community Energy Storage Operational Optimization. IEEE Trans. Sustain. Energy 2020, in press. [Google Scholar] [CrossRef]
- Alhamwi, A.; Medjroubi, W.; Vogt, T.; Agert, C. GIS-based urban energy systems models and tools: Introducing a model for the optimisation of flexibilisation technologies in urban areas. Appl. Energy 2017, 191, 1–9. [Google Scholar] [CrossRef]
- Kausika, B.B.; Dolla, O.; van Sark, W.G. Assessment of policy based residential solar PV potential using GIS-based multicriteria decision analysis: A case study of Apeldoorn, The Netherlands. Energy Procedia 2017, 134, 110–120. [Google Scholar] [CrossRef]
- Council of the European Union. Commission Recommendation 2012/148/EU on Preparations for the Roll-Out of Smart Metering Systems; Council of the European Union: Brussels, Belgium, 2012; pp. 9–22. [Google Scholar]
- AlSkaif, T.; Lampropoulos, I.; van den Broek, M.; van Sark, W. Gamification-based framework for engagement of residential customers in energy applications. Energy Res. Soc. Sci. 2018, 44, 187–195. [Google Scholar] [CrossRef]
- Ma, Z.; Xie, J.; Li, H.; Sun, Q.; Si, Z.; Zhang, J.; Guo, J. The role of data analysis in the development of intelligent energy networks. IEEE Netw. 2017, 31, 88–95. [Google Scholar] [CrossRef] [Green Version]
- Zhou, B.; Li, W.; Chan, K.W.; Cao, Y.; Kuang, Y.; Liu, X.; Wang, X. Smart home energy management systems: Concept, configurations, and scheduling strategies. Renew. Sustain. Energy Rev. 2016, 61, 30–40. [Google Scholar] [CrossRef]
- AlSkaif, T.; Luna, A.; Zapata, M.G.; Guerrero, J.; Bellalta, B. Reputation-based joint scheduling of households appliances and storage in a microgrid with a shared battery. Energy Build. 2017, 138, 228–239. [Google Scholar] [CrossRef] [Green Version]
- Hekkenberg, M.; Koelemeijer, R. Analyse van Het Voorstel voor Hoofdlijnen van het Klimaatakkoord (In Dutch), Analysis of the Main Points of the Climate Agreement (Translation in English); PBL: The Hague, The Netherlands, 2018. [Google Scholar]
- Lente-akkoord. Woningbouw Volgens BENG-Do’s en don’ts Voor Bijna Energieneutraal Bouwen; Lente-akkoord: Voorburg, The Netherlands, 2017. [Google Scholar]
- Klaassen, R.E.; Patel, M.K. District heating in the Netherlands today: A techno-economic assessment for NGCC-CHP (Natural Gas Combined Cycle combined heat and power). Energy 2013, 54, 63–73. [Google Scholar] [CrossRef]
- CBS. Warmtepompen; aantallen, thermisch vermogen en energiestromen (In Dutch), Heat Pumps; Numbers, Thermal Power and Energy Flows (Translated in English). Centraal Bureau voor de Statistiek (CBS), Statistics Netherlands. 14 January 2020. Available online: https://opendata.cbs.nl/#/CBS/nl/dataset/82380NED/table (accessed on 10 April 2020).
- RVO. Aardgasvrij; Rijksdienst voor Ondernemend Nederland (RVO)-Netherlands Enterprise Agency: The Hague, The Netherlands, 2020; Available online: https://www.rvo.nl/onderwerpen/duurzaam-ondernemen/duurzame-energie-opwekken/aardgasvrij (accessed on 1 March 2020).
- VVD; CDA; D66; ChristenUnie. Vertrouwen in de Toekomst-Regeerakkoord 2017–2021 (Coalition Agreement: Confidence in the Future). 1 January 2019. Available online: https://www.rijksoverheid.nl/documenten/publicaties/2017/10/10/regeerakkoord-2017-vertrouwen-in-de-toekomst (accessed on 14 April 2020).
- Government of the Netherlands. Klimaatakkoord. Afspraken in Sectoren-Gebouwde Omgeving (Climate Agreement. Appointments in Sectors-Built Environment). 1 January 2019. Available online: https://www.klimaatakkoord.nl/gebouwde-omgeving/documenten/publicaties/2019/06/28/klimaatakkoord-hoofdstuk-gebouwde-omgeving (accessed on 14 April 2020).
- IRIS Smart Cities Consortium. The 5 IRIS Transition Tracks. Project Web-Site, 2020. Available online: https://irissmartcities.eu/content/5-iris-transition-tracks (accessed on 1 March 2020).
- RVO. Cijfers Elektrisch Vervoer (In Dutch), Electric Transport Figures (Translation in English); Rijksdienst voor Ondernemend Nederland (RVO)-Netherlands Enterprise Agency: The Hague, The Netherlands, April 2020; Available online: https://www.rvo.nl/onderwerpen/duurzaam-ondernemen/energie-en-milieu-innovaties/elektrisch-rijden/stand-van-zaken/cijfers (accessed on 10 April 2020).
- Deuten, S.; Vilchez, J.J.G.; Thiel, C. Analysis and testing of electric car incentive scenarios in the Netherlands and Norway. Technol. Forecast. Soc. Chang. 2020, 151, 119847. [Google Scholar] [CrossRef]
- Wordatlas, 2019. Available online: https://www.worldatlas.com/articles/european-countries-by-population-density.html (accessed on 14 April 2020).
- World Bank. Urban Population (% of Total Population); The World Bank Group: Washington, DC, USA, 27 October 2019; Available online: https://data.worldbank.org/indicator/SP.URB.TOTL.in.zs (accessed on 10 April 2020).
- Nederlandse Spoorwegen. Green Energy for Train, Bus and Station. Available online: https://www.ns.nl/en/about-ns/sustainability/climate-neutral/green-energy-for-train-bus-and-station.html (accessed on 14 April 2020).
- RVO. Electric Transport in the Netherlands-2018 Highlights; Rijksdienst voor Ondernemend Nederland (RVO)-Netherlands Enterprise Agency: The Hague, The Netherlands, 2018. [Google Scholar]
- Smart Solar Charging. Smart Solar Charging Regio Utrecht. Project Web-Site. 2020. Available online: https://smartsolarcharging.eu/en/ (accessed on 1 March 2020).
- Londo, M.; Matton, R.; Usmani, O.; van Klaveren, M.; Tigchelaar, C.; Brunsting, S. Alternatives for current net metering policy for solar PV in the Netherlands: A comparison of impacts on business case and purchasing behaviour of private homeowners, and on governmental costs. Renew. Energy 2020, 147, 903–915. [Google Scholar] [CrossRef]
- Bellini, E. Netherlands to Maintain Current Net-Metering Conditions until 2023. 30 October 2019. Available online: https://www.pv-magazine.com/2019/04/26/netherlands-to-maintain-current-net-metering-conditions-until-2023/ (accessed on 14 April 2020).
- Dutch New Energy. Dutch Solar Trend Report 2019. 30 October 2019. Available online: https://www.dutchnewenergy.com/trend-reports/dutch-solar-trend-report-2019/ (accessed on 14 April 2020).
- RVO. SDE+ Publications. 30 October 2019. Available online: https://english.rvo.nl/subsidies-programmes/sde-publications (accessed on 14 April 2020).
- Folkerts, W.; van Sark, W.; de Keizer, C.; van Hooff, W.; van den Donker, M. Roadmap PV Systemen en Toepassingen, Commissioned by the Netherlands Enterprise Agency (RVO) in collaboration with the TKI Urban Energy. 2017.
- Stroomversnelling. Stroomversnelling. 2020. Available online: https://stroomversnelling.nl/ (accessed on 1 March 2020).
- RVO. Energieprestatie-BENG. 25 October 2019. Available online: https://www.rvo.nl/onderwerpen/duurzaam-ondernemen/gebouwen/wetten-en-regels/nieuwbouw/energieprestatie-beng (accessed on 14 April 2020).
- CBS. Renewable Electricity; Production and Capacity. 4 March 2020. Available online: https://opendata.cbs.nl/statline/#/CBS/en/dataset/82610ENG/table (accessed on 7 April 2020).
- Folkerts, W. BIPV Marktontwikkeling in Nederland. 2015. Available online: http://publications.tno.nl/publication/34635171/kNgFcC/folkerts-2015-BIPV.pdf (accessed on 14 April 2020).
- de Groot, R.J.W.; van Overbeeke, F.; Schouwenaar, A.J.M.; Slootweg, J.G. Smart storage in the Enexis LV distribution grid. In Proceedings of the International Conference on Electricity Distribution, Stockholm, Sweden, 10–13 June 2013. [Google Scholar]
- BAM. Integrated Report 2018; Royal BAM Group nv: Bunnik, The Netherlands, 2019. [Google Scholar]
- Thema, M.; Bauer, F.; Sterner, M. Power-to-Gas: Electrolysis and methanation status review. Renew. Sustain. Energy Rev. 2019, 112, 775–787. [Google Scholar] [CrossRef]
- Agterberg, F. Startdocument Roadmap Bodemenergie; RVO: The Hague, The Netherlands, 2016. [Google Scholar]
- Gercek, C.; Schram, W.; Lampropoulos, I.; van Sark, W.; Reinders, A. A Comparison of Households’ Energy Balance in Residential Smart Grid Pilots in the Netherlands. Appl. Sci. 2019, 9, 2993. [Google Scholar] [CrossRef] [Green Version]
- European Commission. Benchmarking Smart Metering Deployment in the EU-27 with a Focus on Electricity; European Commission: Brussels, Belgium, 2014. [Google Scholar]
- European Commission. Commission Staff Working Document. Cost-Benefit Analyses and State of Play of Smart Metering Deployment in the EU-27; SWD 189 final; European Commission: Brussels, Belgium, 2014. [Google Scholar]
- Netbeheer Nederland. Slimme Meter. 30 October 2019. Available online: https://www.netbeheernederland.nl/consumenteninformatie/slimmemeter (accessed on 14 April 2020).
- Lampropoulos, I.; Alskaif, T.; van den Broek, M.; van Sark, W.; van Oostendorp, H. A Method for Developing a Game-Enhanced Tool Targeting Consumer Engagement in Demand Response Mechanisms; Mediterranean Cities and Island Communities; Springer: Cham, Switzerland, 2019; pp. 213–235. [Google Scholar]
- European Union. Regulation (EU) 2016/679 of the European Parliament and of the Council of 27 April 2016 on the Protection of Natural Persons with Regard to the Processing of Personal Data and on the Free Movement of such Data, and Repealing Directive 95/46/EC. 27 April 2016. Available online: https://eur-lex.europa.eu/legal-content/EN/TXT/?uri=uriserv:OJ.L_.2016.119.01.0001.01.ENG&toc=OJ:L:2016:119:TOC (accessed on 14 April 2020).
- European Union. 2014/724/EU: Commission Recommendation of 10 October 2014 on the Data Protection Impact Assessment Template for Smart Grid and Smart Metering Systems. 10 October 2014. Available online: https://eur-lex.europa.eu/legal-content/EN/TXT/?uri=uriserv:OJ.L_.2014.300.01.0063.01.ENG (accessed on 14 April 2020).
- European Union. Proposal for a Directive of the European Parliament and of the Council on Common Rules for the Internal Market in Electricity (Recast). 23 February 2017. Available online: https://eur-lex.europa.eu/legal-content/EN/TXT/?qid=1516725378661&uri=CELEX:52016PC0864R(01) (accessed on 14 April 2020).
- European Union. Directive (EU) 2016/1148 of the European Parliament and of the Council of 6 July 2016 Concerning Measures for a High Common Level of Security of Network and Information Systems across the Union. 6 July 2016. Available online: https://eur-lex.europa.eu/legal-content/EN/TXT/?uri=uriserv:OJ.L_.2016.194.01.0001.01.ENG&toc=OJ:L:2016:194:TOC#PP2Contents (accessed on 14 April 2020).
- IEA. User-Centred Energy Systems; IEA: Paris, France, 2020; Available online: https://userstcp.org/ (accessed on 10 April 2020).
- Levin, E.; Palchak, E.; Stephenson, R. The State of Equity Measurement: A Review of Practices in the Clean Energy Industry; Vermont Energy Investment Corporation (VEIC): Vermont, OH, USA, 2019. [Google Scholar]
- European Commission. Communication from the Commission to the European Parliament, the Council, the European Economic and Social Committee and the Committee of the Regions-An EU Strategy on Heating and Cooling; European Commission: Brussels, Belgium, 2016. [Google Scholar]
- European Commission. Electrification of the Transport System—Studies and Reports; European Commission: Brussels, Belgium, 2017. [Google Scholar]
Figure 1.
World population (in millions) at mid-year residing in rural and urban areas, based on historical estimates and median projections of the United Nations [1].
Figure 1.
World population (in millions) at mid-year residing in rural and urban areas, based on historical estimates and median projections of the United Nations [1].

Figure 2.
The main four areas of energy in the built environment, namely, energy supply, demand, storage, and integration aspects.
Figure 2.
The main four areas of energy in the built environment, namely, energy supply, demand, storage, and integration aspects.

Figure 3.
Demand-side management and load shape objectives.

Figure 4.
Energy savings by end-use from smart controls in the European Union (EU) by 2040, according to the New Policies Scenario (NPS), adapted from [12].
Figure 4.
Energy savings by end-use from smart controls in the European Union (EU) by 2040, according to the New Policies Scenario (NPS), adapted from [12].

Figure 5.
Global transport electricity demand in the Future is Electric (FiES) and New Policies Scenarios (NPS), adapted from [12].
Figure 5.
Global transport electricity demand in the Future is Electric (FiES) and New Policies Scenarios (NPS), adapted from [12].

Figure 6.
Building Integrated Photovoltaic (BIPV) classification into façades, pitched, flat, and curved roofs. Adapted from [77].
Figure 6.
Building Integrated Photovoltaic (BIPV) classification into façades, pitched, flat, and curved roofs. Adapted from [77].

Figure 7.
Taxonomy of battery-based energy storage systems (BESS)-related services and applications.
Figure 7.
Taxonomy of battery-based energy storage systems (BESS)-related services and applications.

Figure 8.
Smart grid technologies. Adapted from [113].
Figure 8.
Smart grid technologies. Adapted from [113].

Figure 9.
The main advantages of smart metering systems.

Figure 10.
Dutch greenhouse gas emissions: 1990–2015 and 2030 target. Adapted from [129].
Figure 10.
Dutch greenhouse gas emissions: 1990–2015 and 2030 target. Adapted from [129].

Figure 11.
Dutch greenhouse gas emissions per sector (Mton CO2,eq). Adapted from [129].
Figure 11.
Dutch greenhouse gas emissions per sector (Mton CO2,eq). Adapted from [129].

Figure 12.
Number of installed heat pumps in buildings in the Netherlands. Source: [132].
Figure 12.
Number of installed heat pumps in buildings in the Netherlands. Source: [132].

Figure 13.
Development of passenger electric vehicle (EV) fleet size and market share in the Netherlands. Source: [137].
Figure 13.
Development of passenger electric vehicle (EV) fleet size and market share in the Netherlands. Source: [137].

Figure 14.
Number of charging points for electric vehicles (EV) in the Netherlands. Source: [137].
Figure 14.
Number of charging points for electric vehicles (EV) in the Netherlands. Source: [137].

Figure 15.
PV and wind-energy market development in the Netherlands between 2000 and 2018. Source: [151].
Figure 15.
PV and wind-energy market development in the Netherlands between 2000 and 2018. Source: [151].

Figure 16.
BIPV projected market development in the Netherlands in terms of installed capacity. Adapted from [152].
Figure 16.
BIPV projected market development in the Netherlands in terms of installed capacity. Adapted from [152].

Figure 17.
Total energy use and total installed capacity of underground thermal energy storage (UTES) in the Netherlands. Adapted from [156].
Figure 17.
Total energy use and total installed capacity of underground thermal energy storage (UTES) in the Netherlands. Adapted from [156].


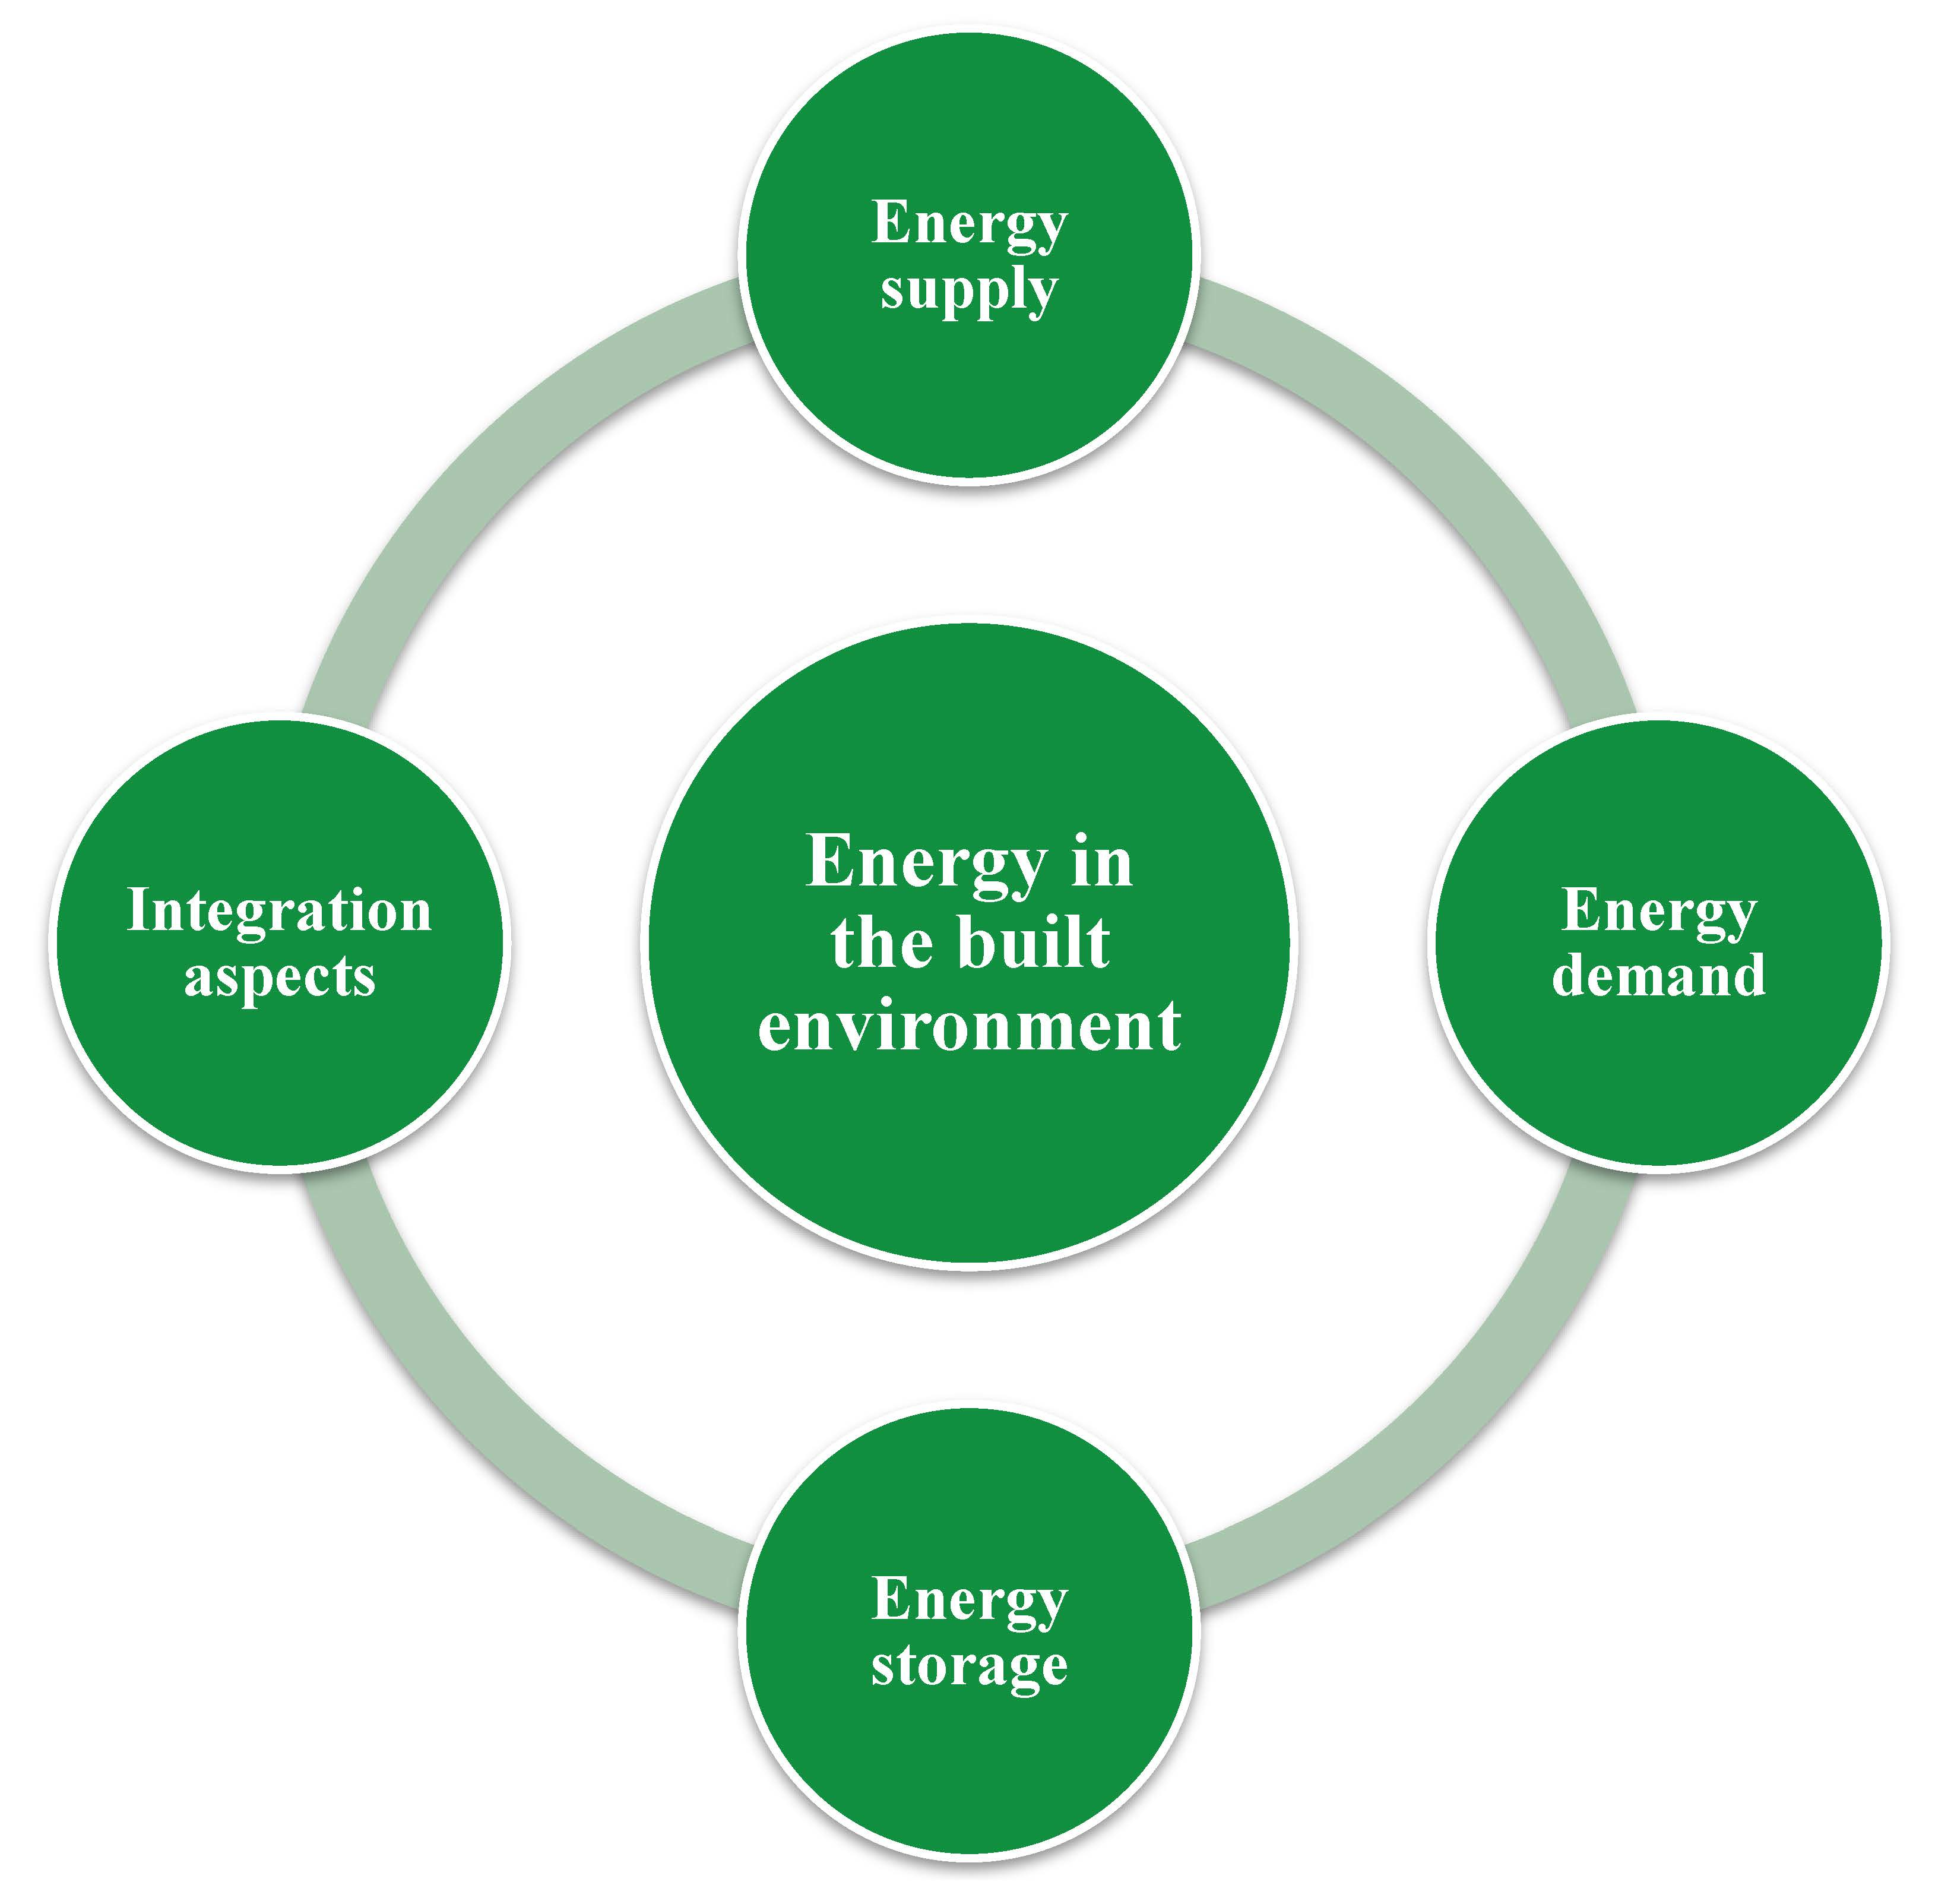
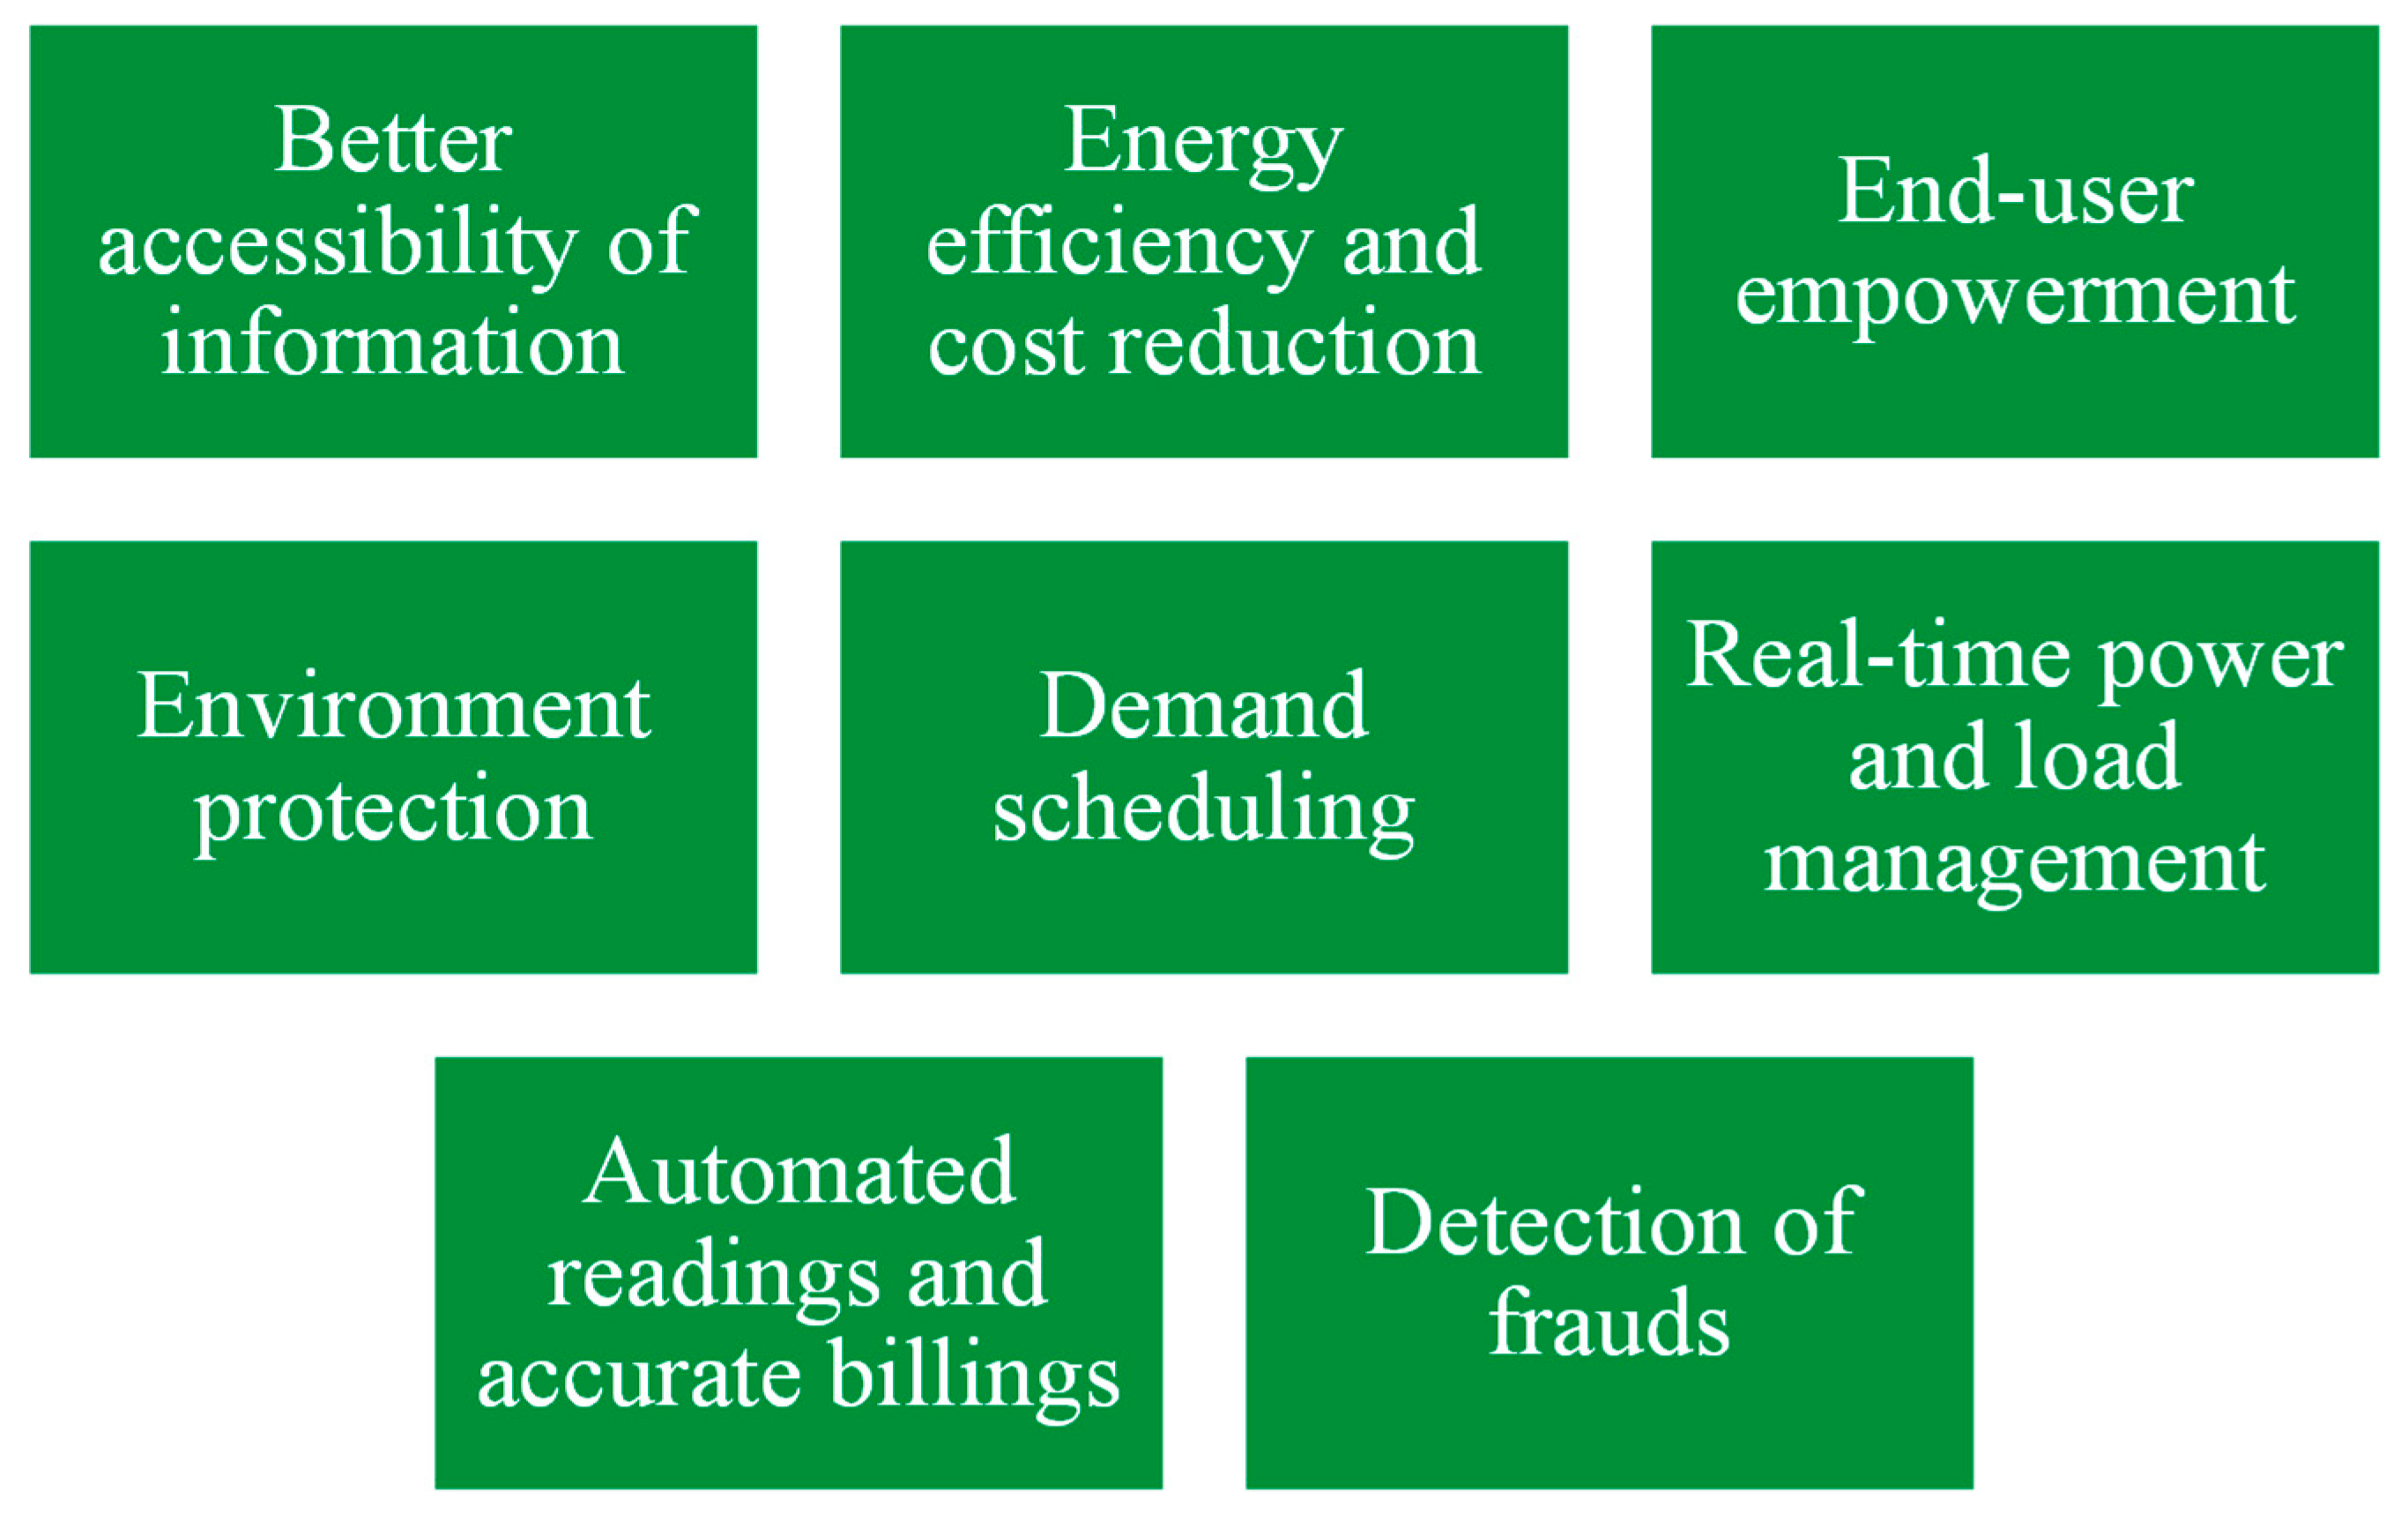
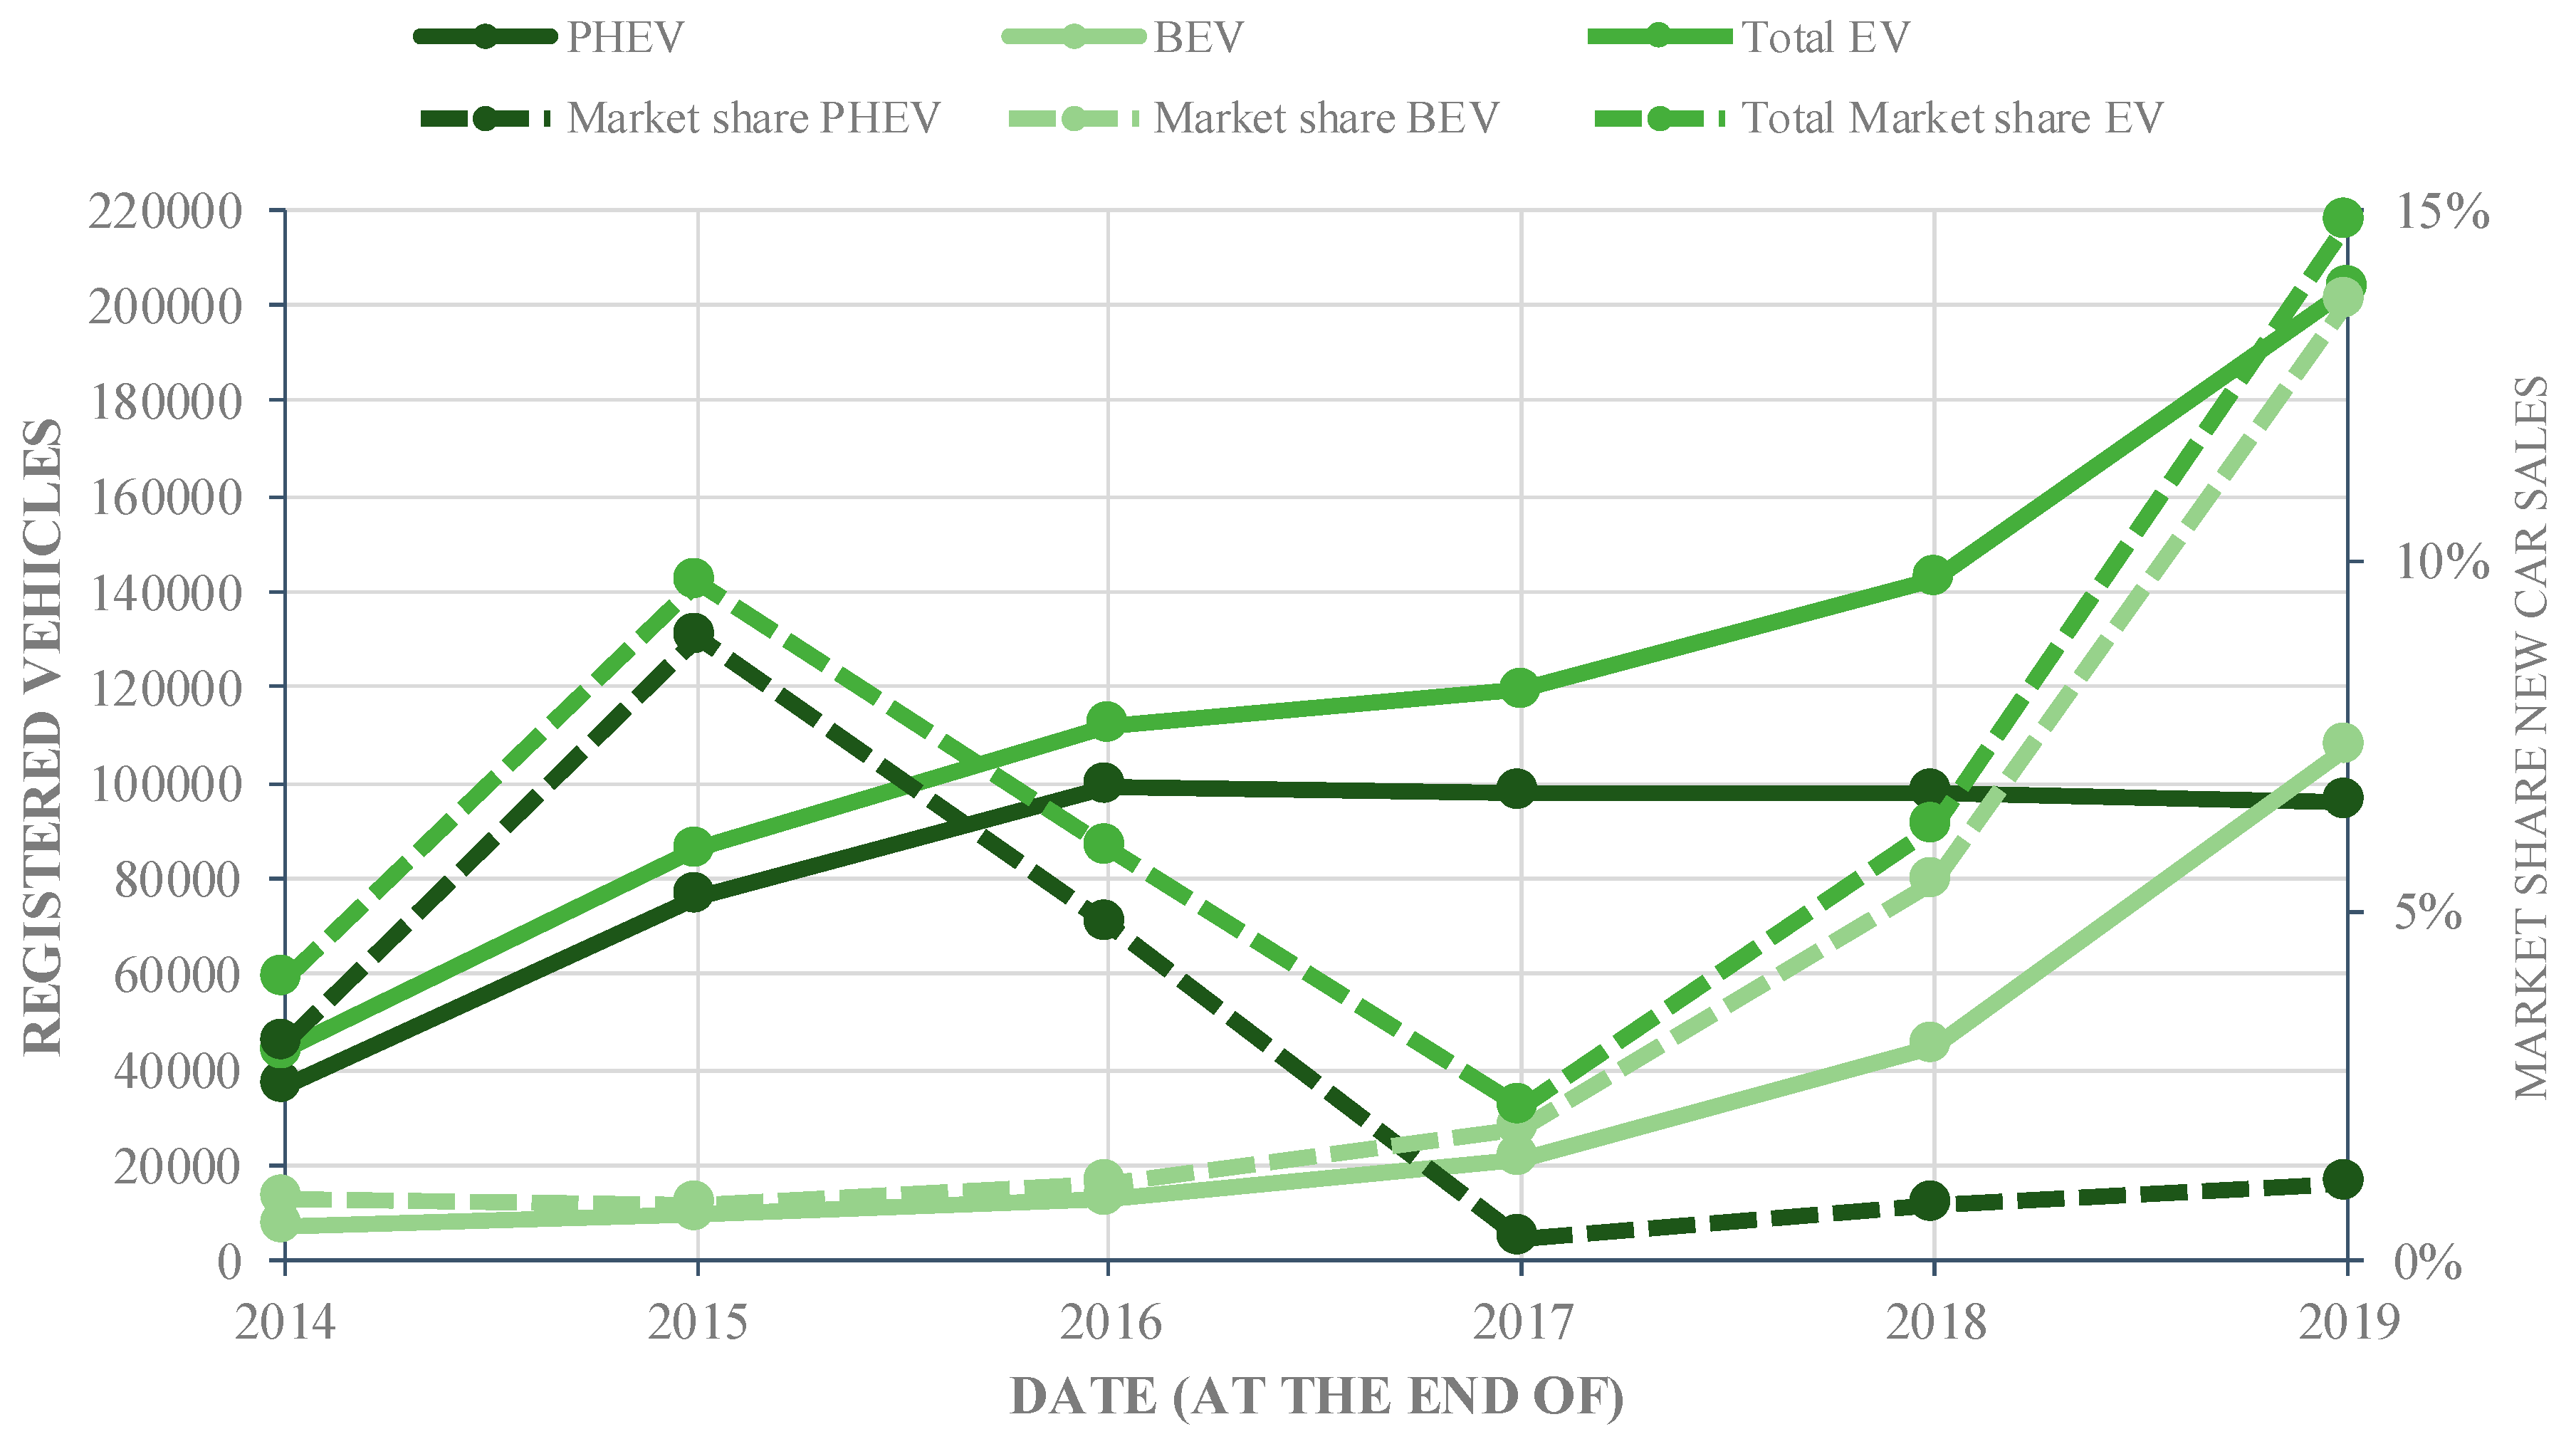
| Cogeneration System | Size (kWel) | Annual Average Availability (%) | Power to Heat Ratio | Periodic Maintenance/Servicing Frequency/Requirements | Performance | Costs | Availability of Demonstrated Performance Data | |||||
|---|---|---|---|---|---|---|---|---|---|---|---|---|
| Electrical Efficiency (%) | Overall Efficiency (%) | Emissions (CO, NOx, Particulates) | Emissions (CO2) | Maintenance | Installed Costs/Average Cost Investment (€/kWel) | Operation and Maintenance Costs (EUR/kWhel) | ||||||
| Reciprocating internal combustion engine | 3–20∙103 | 87–98 | 0.51–1.19 | High | Medium (25–45) | 65–92 | High | High | High | Low (340–2500) | 0.0075–0.038 | High |
| Micro-turbine | 15–300 | 90–95 | 0.47–0.65 | Medium/Low | Low (15–30) | 65–90 | Medium | Medium | High | Medium (900–2500) | 0.006–0.21 | Medium |
| Stirling engine | 3–1.5∙103 | 85–90 | 1.2–1.7 | Low | Low (22–40) | 65–95 | Medium | Medium | Low | Medium (~2500–4500) | 0.0065 | Medium/Low |
| Fuel Cell | 1–250 (or up to 11∙103 in demonstration) | ~96 | 0.77–1.95 | Medium/Low | 30–70 | 65–90 | Low | Low | Medium/Low | High (3684–5789) | 0.024–0.045 | Low |
Table 2.
Comparison of seasonal underground thermal energy storage (UTES) concepts (+++ high; ++ moderate; + low) adapted from [106,109].
| TTES | PTES | ATES | BTES | |
|---|---|---|---|---|
| Storage medium | Water | Water/gravel | Groundwater and aquiver material | Material surrounding the boreholes |
| Capacity (MWh) | 60–400 | 600–80,000 | 11,000 | 34,000 |
| Efficiency (%) | 95 | 80–95 | 60–95 | 60–95 |
| Specific investment cost (EUR/MWh]) | 900–4000 | 400–800 | 200 | 400 |
| Subsurface requirements | + | + | +++ | +++ |
| Required pre-investigation | + | + | +++ | ++ |
| Maximum storage capacity (kWh/m3) | +++ | +++ | ++ | + |
| Space requirement | +++ | +++ | + | + |
| Maintenance | + | + | +++ | + |
| Environmental interaction | + | + | +++ | ++ |
Table 3.
Overview of shared cars in the Netherlands [137].
Table 3.
Overview of shared cars in the Netherlands [137].
| Year | 2016 | 2017 | 2018 | 2019 |
|---|---|---|---|---|
| Shared cars (all fuels) | 25,128 | 30,697 | 41,191 | 51,149 |
| People sharing cars | - | - | 400,000 | 515,000 |
| Share of electric cars (BEVs and PHEVs) in total number of shared cars | 4.5% | 4.1% | 6.4% | 6.8% |
© 2020 by the authors. Licensee MDPI, Basel, Switzerland. This article is an open access article distributed under the terms and conditions of the Creative Commons Attribution (CC BY) license (http://creativecommons.org/licenses/by/4.0/).
Share and Cite
MDPI and ACS Style
Lampropoulos, I.; Alskaif, T.; Schram, W.; Bontekoe, E.; Coccato, S.; van Sark, W. Review of Energy in the Built Environment. Smart Cities 2020, 3, 248-288. https://0-doi-org.brum.beds.ac.uk/10.3390/smartcities3020015
AMA Style
Lampropoulos I, Alskaif T, Schram W, Bontekoe E, Coccato S, van Sark W. Review of Energy in the Built Environment. Smart Cities. 2020; 3(2):248-288. https://0-doi-org.brum.beds.ac.uk/10.3390/smartcities3020015
Chicago/Turabian StyleLampropoulos, Ioannis, Tarek Alskaif, Wouter Schram, Eelke Bontekoe, Simone Coccato, and Wilfried van Sark. 2020. "Review of Energy in the Built Environment" Smart Cities 3, no. 2: 248-288. https://0-doi-org.brum.beds.ac.uk/10.3390/smartcities3020015