A System Dynamics Model to Assess the Effectiveness of Governmental Support Policies for Renewable Electricity

1
College of Resources and Environmental Engineering, Ludong University, Yantai 264025, China
2
Institute of Geographic Sciences and Natural Resources Research, Chinese Academy of Sciences, 11A Datun Road, Anwai, Chaoyang District, Beijing 100101, China
*
Author to whom correspondence should be addressed.
Sustainability 2019, 11(12), 3426; https://0-doi-org.brum.beds.ac.uk/10.3390/su11123426
Submission received: 6 March 2019
/
Revised: 16 May 2019
/
Accepted: 30 May 2019
/
Published: 21 June 2019
(This article belongs to the Special Issue Locally Available Energy Sources and Sustainability)
Abstract
:China’s support policy for renewable electricity belongs to a feed-in tariffs scheme. With the rapid development of renewable electricity industries, this set of policies brought about a heavy fiscal burden for the government. The exploration of whether current support policy provided excessive subsidies for renewable electricity is of great practical significance. We hold an idea that the internalization of positive externality is the only criterion for the government to support the development of a renewable electricity industry. The problem of whether the current policy provides excessive subsidies for renewable electricity industry can be solved by assessing whether its positive externality is internalized, as renewable electricity industry has a characteristic of externality. Our study object is an assumed biomass power plant in Jingning County, Gansu Province. A system dynamics model was built. Applying the environmental cost accounting method and net present value analysis method, we connected the techno-economic analysis of the biomass power plant with the measurement of positive externality of biomass power generation together. In this system dynamics model, we developed an indicator to reveal whether the subsidies provided by governmental policies can compensate the positive externality generated by the assumed biomass power plant. This study mainly draws the following conclusions: Firstly, China’s current support policy does provide excessive subsidies for the renewable power industry. The subsidies received by biomass power plants from the government are higher than the positive externality generated by them; secondly, the positive externality measurement of the biomass power industry is influenced by many regional factors; thirdly, without governmental policy support, biomass power plants cannot compete with traditional power companies; fourthly, as biomass power generation is concerned, the current price subsidy intensity is about US$0.0132 higher per kWh than a reasonable level. Furthermore, the parameters frequently applied in the calculation of the prices of pollutant emission reduction in Chinese research papers are relatively small, which is only half of their actual values. Jingning County, situated in inland west-northern China, lacks typicality. There is a limitation in judging whether the government’s support policy for renewable electricity is reasonable through a feasibility analysis of investment in a biomass power generation project. This may be the main drawback of this study.
1. Introduction
1.1. Background and Literature Review
In order to expand the market share of renewable electricity, many countries in the world have implemented policies to encourage the development of renewable energy industries [1,2]. Price-based feed-in tariff (FIT) and market-based renewable portfolio standards (RPSs) schemes are the two most frequently-used support schemes [3,4]. Countries which have implemented FIT schemes include Germany, Denmark, and Spain; they set fixed prices or a price premium over the market price of electricity for a specified time period [5]. The RPS scheme is represented by the UK, the US, and Australia, which require electricity producers to acquire a certain percentage of renewable electricity. Tradable green certificates (TGCs) are issued for all renewable electricity produced.
At present, renewable electricity production in China is supported by the FIT scheme. Under this scheme, the installed renewable energy capacity has significantly increased. The portion of the FIT higher than the market price coming from the Renewable Energy Development Fund (introduced by the government) has created a great financial burden on the government [6]. According to the relevant research, the financial gap of the Renewable Energy Development Fund had reached US$18.13 billion by 2018 [7].
According to the Chinese government plan [8], China’s renewable energy policy will ultimately transform from an FIT scheme to an RPS scheme, which means that the subsidy funds that renewable electricity producers had received from the government before will mainly come from the TGC market in the future.
It is known that the reason that the FIT scheme for renewable energy has brought a heavy fiscal burden on to China’s government is the higher subsidy intensity. Thus, a question has arisen: What kind of subsidy intensity is rational?
The current theoretical research related to the FIT focuses on assessing its effectiveness. Scholars have usually discussed effectiveness from the aspects of social welfare, technological innovation, and installation growth of renewable energy [9]. Scholars have seldom paid attention to the rationality and accuracy of the FIT subsidy intensity.
Compared with traditional fossil energy, renewable energy is conducive to environmental protection and resource conservation—namely, it has positive externalities. Positive externality refers to the beneficial effects of economic activities of one economic entity on other economic entities; the recipients of positive externalities do not need to pay any cost [10]. The internalization of positive externality transforms the external benefits generated by the positive externality maker into private benefits of the positive externality maker in different ways [11]. It can solve the social optimal supply shortage caused by a lack of incentives, thus overcoming the efficiency loss caused by positive externalities and re-achieving the Pareto optimality [10]. Compared with traditional power, renewable electricity has positive externalities. It can increase social benefits and reduce pollutant emissions. According to the principle of modern economics, there is a phenomenon of insufficient resource allocation in industries with positive externalities. The internalization of positive externalities is the fundamental way to solve this type of problem. That the government formulates policies to support the development of renewable electricity is a form of the internalization of positive externality.
The positive externality of renewable electricity is the main reason why the government provides a subsidy to encourage its development. Biomass power generation is a classic type of renewable energy, for convenience, we take it as an example to demonstrate our research route.
Generally speaking, biomass power generation can be viewed as a type of agricultural circular economy [12]. The question of how to scientifically determine the subsidy intensity of biomass power generation is equivalent to the question of how to regulate the development of a circular economy accurately.
A circular economy has obvious positive externalities [13,14]. Despite the academic disagreement over the impact of the development of a recycling economy on the performance of a business, most scholars approve of the viewpoint that the development of a circular economy needs the support of the government [15,16]. Many countries have begun to pay more attention to the role of the circular economy in achieving sustainable development [17,18].
The internalization of externalities is an effective way to promote the sustainable development of industries with external characteristics. Therefore, whether the externalities have been compensated for can provide a reference standard for evaluating the effect of regional transformation from a traditional economy to a circular economy, and can provide a quantitative standard for evaluating the developmental performance of a regional circular economy, as long as the externality of the circular economy can be monetized. After decades of attempts, scholars have successfully established a method for an environmental economic loss assessment, based on the market value approach; although the assessment of environmental losses is a very difficult problem [11,19]. The application of environmental loss assessment techniques and methods has led to the development of relevant empirical studies [20,21]. Research on the measurement of economic losses caused by environmental pollution in China has also achieved rich results [22,23].
At present, scholars in the field of environmental management have studied the rationality and optimization of industrial policies from the perspective of the quantitative measurement of externalities [24,25]. For example, Ding et al. (2008) [26] proposed a reverse logistics investment valuation model to calculate the number of subsidies the government needs in order to provide theoretical guidance and a decision-making basis for the government to regulate and control an enterprise’s investment in environmental protection projects or technologies through the implementation of incentive policies. Ding et al. (2014) [13] built a quantitative assessment model of the internalization of externalities with a life cycle assessment and net present value analysis to explore the reasonable subsidy space and promote the development of new energy vehicles.
Relatively speaking, there have been few achievements in the study of the internalization of externalities from the perspective of green products or enterprises. This type of study is in its infancy.
Present studies have paid attention to the negative environmental externalities of economic activities, while few scholars have focused on the positive externalities of a circular economy in the social and environmental fields.
China supports the development of a circular economy, but its support for a circular economy lacks a scientific standard of judgment [9]. In the field of biomass power generation, China has formulated detailed supportive policies, including tax breaks and price subsidies. However, whether the government’s support policy for biomass power generation is reasonable is a problem to which few scholars have paid close attention.
1.2. Comprehensive Utilization of Agricultural By-Products
An important component of the development of an agricultural circular economy is to comprehensively utilize agricultural by-products. According to estimates, the dry weight of apple tree branches pruned per hectare ranges from 2.4 to 6.6 tons every year [27,28]. For primary apple production areas, an apple tree branch is an important type of agricultural by-product; the total production of apple tree branches is quite substantial, and has considerable potential utilization value. However, in practice, the resource utilization of apple tree branches has not caught people’s attention. Currently, apple tree branches are used mainly as firewood for cooking or heating (as is the case for straw, also), which not only produces waste but also pollutes the environment. In some apple production areas, apple tree branches are smashed and bagged to produce edible fungus [29,30]. Few apple production regions use apple tree branches as feedstock for biomass power generation. These regions are apt to obtain a type of clean energy named biogas, by building methane-generating pits and constructing an industrial circular economy chain, named “grass-livestock-biogas-fruit,” centered on biogas [31,32]. In rural areas, biogas is an important kind of clean energy, which generally uses livestock excrement as feedstock. This is the reason why the development of biogas utilization typically accompanies the development of livestock breeding industries. The sustainable utilization of biogas cannot be separated from livestock excrement (having a high heating value) as the fill for a methane-generating pit. Both apple orchard management and livestock breeding belong to a labor-intensive industry; however, it is difficult for an orchard operator to undertake the dual work of both managing orchards and caring for livestock, as rural labor is insufficient when viewed against the backdrop of rapid urbanization. For instance, the areas of apple tree cultivation in Jingning County of the Gansu Province account for 68.7% of the total area of arable lands, reaching 707 km2 in 2016, which was the largest area of such cultivation in China [33]. The agricultural distribution pattern in Jingning County is divided into the south, mainly the apple orchard industry, and the north, which is primarily the grain growing industry [34]. In the southern part of the county, most farmed arable lands are used to plant apple trees, and it is difficult for the owners of livestock to breed livestock due to the lack of crop straw as fodder. There are almost no large livestock operations among the local fruit farming communities.
In 2015, we conducted a questionnaire survey of over 500 local fruit farmers. The results indicated that 66.5% of the households of the respondents did not breed any large livestock, such as pigs, cattle, and sheep; 32% of them had methane-generating pits; and 40% of the respondents thought that the main factor that hampered the improvement of biogas utilization efficiency was the lack of feedstock with a high heating value, such as cattle excrement. The survey results are in accordance with the research conclusions of local scholars. For example, Wang and Yan (2015) pointed out that, with an increase in the number of rural migrant farmers who had left for urban jobs, rural areas were dominated by the remaining elders and children, with a lack of skilled young and post-adolescent laborers. Meanwhile, with the promotion of industrial products, such as electric cookers in rural areas, the advantage of biogas in cooking has continuously weakened, and most people have begun to ignore the management and maintenance required for methane-generating pits. Thus, the utilization rate of biogas has decreased yearly [35].
In summary, there are two aspects to the problem of comprehensive utilization of agricultural by-products in the main apple tree production areas. On the one hand, influenced by many factors (such as insufficient manpower), small-scale livestock breeding and management are out of place, and the utilization rate of methane-generating pits is low. Enthusiasm for the building of new methane-generating pits is not high, and the circular economy model of “grass-livestock-biogas-fruit” does not work well in primary apple production areas. On the other hand, affected by traditional habits and development concepts, a large number of apple tree branches are treated as firewood and are burned directly for heating and cooking, which wastes resources and contaminates the environment.
This study explores the feasibility of generating power using apple tree branches as fuel inputs to replace biogas in the primary apple production areas using a case study in Jingning County, Gansu Province. We analyze the economic and environmental benefits, in order to provide theoretical guidance for the promotion of a circular economy model of “apple-biomass power generation-organic fertilizer” in the primary apple production areas and evaluate the reasonableness of the governmental support policy, based on an assessment of the positive externality of biomass power generation. Meanwhile, this study also builds a dynamic system model which can help to ascertain more accurately the subsidy intensity conducive to improving the efficiency of governmental support policies for the development of industries with positive externalities.
1.3. Basic Conditions of Jingning County
Located in the northern latitudes 35°01′~35°45′ and eastern longitudes 105°20′~105°05′, Jingning County belongs to a typical hilly-gully area in the Loess Plateau and is one of 18 arid counties in the central Gansu Province with an annual rainfall of only 423.6 mm. The total population of Jingning County is 48.78 million, and it has an arable land area of approximately 98,000 hm2, where 93% of the ploughed land is located on the slope of a hill or ditch [36]. Jingning County has 22.4 million poor people in rural areas. The poverty rate, which is the proportion of poor people to all people in the rural areas, reached 59.6% in 1986 [37]. Based on the concept of poverty alleviation through agricultural industrialization, Jingning County’s poverty alleviation plan prioritized the development of apple cultivation supplemented by grain planting from 1986 to 2002, and the county gradually formed a spatial production pattern of “north grain and south apple” [34]. As of 2015, the total area of apple orchards in the entire county reached 707 km2 (of which, fruiting orchards accounted for nearly 50%), the total weight of apple products reached 0.6 million tons, and the total earnings reached US$0.3778 billion. The income from apple sales accounts for 80% of the rural per capita net income in Jingning County. By 2018, the poverty rate in Jingning County had dropped to 13.32% [38].
The samples of apple tree branches used in this study, which cover the main apple varieties in Jingning County, were collected from the towns of Chengchuan and Weirong. All samples were first dried and smashed, and then the heating values of the dry weights were measured through a microcomputer oxygen bomb calorimeter. The measurement process of every sample was repeated three times. The ash content was measured with a dry ash method. The ash-free heating value equals the heating value of dry weight/(1-ash content). The mathematical analysis adopted the t-test. Compared with crop straw and other high-energy plants, apple tree branches have obvious advantages with regards to the heating value of the dry weight and the ash-free heating value (see Table 1).
The ash-free heating value of apple tree branches in Jingning County reaches 18.23 MJ/kg, which is higher than the average value for terrestrial plants globally (17.79 MJ/kg) [41]. Compared with wheat, maize, and other crop straws, apple tree branches have the characteristics of higher heating values and lower ash contents. Research has shown that there is a significant correlation between the ash content and heating value of the dry weight [41]. Under the fixed conditions of the generating efficiency of a biomass power generation plant, apple tree branches are one of the most desired feedstocks.
The total area of apple cultivation in Jingning County was 707 km2 in 2016. We calculated that the range of the annual total amount of apple branches is from 0.16 to 0.47 million tons. With an increase in the age of the apple tree, the annual total production of apple tree branches will reach its peak value, of more than 0.4 million tons, in approximately 10 years. Meanwhile, Jingning County also has many straw resources; their output reached 0.55 million tons in 2012, of which maize straw accounted for 66.30% and wheat straw accounted for 23.15% [42].
In the eastern developed regions of China, the biomass fuel cost of a biomass power plant is approximately US$0.068/kWh, which accounts for nearly 70% of the total cost [43]. In 2013, the biomass power generation capacity in China reached 7790.02 MW, of which the total scale of Eastern China, Central China, and South China accounted for 77.65% [44].
For economically developed regions in China, biomass resources are relatively rare, and the price of biomass feedstock is boosted when biomass power plants compete for the purchase of biomass fuel. At present, the purchase price of biomass fuel is basically between 30.22–52.89 US$ per ton, but the price in Jingning County was between 30.22–45.34 US$ per ton in 2012, which is obviously lower than that of China’s eastern regions; additionally, the biomass feedstock sold in rural markets accounts for only 4% of the total production [23].
The results of the questionnaire given to fruit farmers in Jingning County in 2015 showed that over 95% of the respondent fruit farmers used apple tree branches—pruned down in the process of managing orchards—for heating and cooking; only very few fruit farmers directly burned them. In summary, the biomass feedstock market in Jingning County has not yet been exploited at present.
2. Methodology
2.1. Positive Externalities of Biomass Power Generation
An externality is an activity that imposes involuntary costs or benefits on others or an activity whose effects are not completely reflected in its market price [45]. According to this definition, the positive externality of a circular economy, which does not include the economic benefits of a circular economy because it can be reflected in the market price of the production, is embodied primarily in positive environmental and social benefits. We calculated the externality produced by biomass power generation as Equation (1):
where Et is the positive externality produced by biomass power generation in t year, Est is the social benefits in t year, and Eet is the positive environmental externality in t year.
Et = Est + Eet,
2.1.1. The Calculation of Social Benefits
Social benefits include two components. One component is the benefits of an employment increase, and another component is farmers’ increased incomes from biomass sales. The other is increased income from biomass sales.
The construction and operation of biomass power plants can create jobs, thus transforming some farmers into workers. In China, the income level of industrial workers is higher than that of farmers. Compared with farmers’ income levels, the fact that the project of building biomass power plants increases jobs is equal to the increase of social income.
In Jingning County, fruit farmers often use apple branches for heating or cooking. We assumed that this part of the energy consumption gap is supplemented by electricity after the peasants sell their apple branches, which means that the fruit farmers must purchase the same amount of energy (electricity) to satisfy their cooking and heating needs, and this part of the payment in the past has not been a requirement. Therefore, fruit farmers’ incomes from biomass sales should be subtracted from this portion of the expenditure, leaving the remainder as a part of the positive externalities of biomass power generation.
Social benefits can be calculated by Equation (2):
where Ebst is the increased income from biomass sales in t year, Eeit is the benefits of an employment increase in t year, and these two indicators can be calculated by Equations (3) and (4):
where W is the average wage of employees working in a biomass power plant; N is the number of employees employed by the biomass power plant; R is the urbanization rate of the study area; I is the average urban income; and i is the rural average income; C is the weight of biomass sold by a fruit farmer; P1 is the price of the biomass; L is the lower heating value of the biomass; E is the combustion efficiency of a farmer’s kitchen range; and P2 is the price of rural electricity.
Est = Ebst + Eeit,
Ebst = C∗P1 − C∗L∗E/3.6∗P2,
Eeit = N(W − (I∗R + i∗(1 − R)),
2.1.2. The Calculation of Positive Environmental Externality
Compared with coal-fired electricity, biomass power is cleaner; emissions of the major pollutant and greenhouse gases, such as SO2, NOX, CO, and CO2, can be decreased drastically. Therefore, it can be said that the positive environmental externality of biomass power generation is the reduction of negative environmental externality; its measurement can be converted into a market price accounting for the pollutants’ emissions reduction. the positive environmental externality can be calculated by Equation (5):
where Eet is the positive environmental externality in t year, EMe is the effective emission reduction of eth pollutants of biomass power generation compared with on-grid electricity, and Pe is the market price of the environmental loss generated by the eth pollutant. In this study, the main pollutants included four types: SO2, NOX, CO, and CO2. The calculation of these pollutants’ parameters is very complicated, and the process of these parameters’ calculation is presented in detail in Section 2.5.6, Section 2.5.7 and Section 2.5.8.
2.2. Government’s Fiscal Subsidy
China’s feed-in tariff, similar to that of many nations in the world, has been enforced in the development of biomass power generation. At present, as far as biomass power generation is concerned, the unified purchase price of the State Grid Corporation of China is US$0.1133/kWh, while that of desulfurized coal-fired electricity ranges approximately from US$0.0408/kWh to US$0.0710/kWh. As far as desulfurized coal-fired electricity in Gansu Province is concerned, the purchase price of the State Grid Corporation of China is about US$0.0453/kWh, then the price subsidy intensity for biomass power generation is US$0.068/kWh.
Meanwhile, judging by the “Catalogue of Preferential Value-added Tax Policies for Products and Labor Services Generated from the Comprehensive Utilization of Resources” published by the Ministry of Finance of the People’s Republic of China and State Administration of Taxation in 2015, the tax rebate ratio of biomass power generation is 100%. According to the “Enforcement Regulations of Enterprise Income Tax Law of the People ‘s Republic of China,” published by the State Council of the People’s Republic of China in 2007, the income tax on biomass power generation can be calculated as less than 10% because of the nature of the comprehensive utilization of resources; all corporate income taxes of corporations involved in biomass power generation are exempted in the first three years of their operational period, and 50% of corporate income taxes are exempted from the fourth to the sixth year. According to the support policy mentioned above and the gap between the prices in biomass power and desulfurized coal-fired electricity, the fiscal subsidy provided by the government can be calculated.
Therefore, besides the price subsidy, the subsidies obtained by biomass power generation plants because of the government’s support policies is composed of two parts: Income tax exempted and value-added tax exempted. Because all the value-added tax has been exempted, the value-added tax exempted can be calculated by Equation (6):
where Vt is the value-added tax exempted, To is the output tax, and Ti is the input tax.
Income tax exempted can be calculated by Equation (7):
where It is the income tax exempted in t year, Pt is the current year’s profit of a biomass power plant, and at is a coefficient of the current year’s profit, which is equal to 90% from 2019 to 2024 and 0% after 2024. r is the income tax rate, and bt is a coefficient of the income tax rate, which is equal to 100% from 2019 to 2021, 50% from 2022 to 2024, and 0% after 2024.
In conclusion, the government’s fiscal subsidies for biomass power generation are composed of three parts: The price subsidy, income tax exempted, and value-added tax exempted. It can be calculated by Equation (8):
where FSt is the government’s fiscal subsidy in t year, Bt is the electricity generated by a biomass power plant in t year, Pt is the price subsidy of biomass power, and Vt and It are the value-added tax exempted and income tax exempted in t year.
2.3. The Method to Judge Whether the Positive Externality Has Been Internalized
The economic theory of the externality tells us that industries with positive externalities will be underdeveloped. To promote the development of industries with positive externalities, it is necessary for the government to provide some support policies for the purpose of eliminating their positive externalities and achieving the promotion of the development of these industries. The essence of this kind of behavior of the government is called the internalization of externalities. Theoretically, the government’s support should be equivalent to the positive externalities. In sum, whether the government’s fiscal subsidy has matched the positive externality of biomass power generation can be judged by Equation (9):
where Q is the indicator of externality internalization, Eet is the positive environmental externalities of biomass power generation in t year, Est is the social benefits in t year, and FSt is the government’s fiscal subsidy in t year. We can say that the positive externality of biomass power generation has been internalized when the value of Q is equal to zero in 2039. The degree of externality internalization depends on the difference between Q and zero.
2.4. Six Scenarios of Analysis
As far as a planned biomass power plant is concerned, its operational circumstances are not stable, the market price of biomass fuels will fluctuate, and the governmental support policy can be variable. Moreover, it is not known whether the planned biomass power plant can be absorbed into the project of Clean Development Mechanism (CDM), which is one of the three flexible mechanisms to achieve partial emission reduction commitments abroad under Kyoto Protocol. Registered as a CDM project in the UN CDM Executive Board, the CO2 emission reductions generated by the project can be sold in the regional carbon trading market. Thus, our analysis was based on several scenarios (see Table 2) to simulate possible practical situations. We analyzed the conditions that made the biomass power plant project feasible for every scenario.
Every scenario depicts the specific management environment of a biomass power plant. By comparing the conditions that can maintain the normal operation of a biomass power plant without a loss, the rationality of the government’s support policy based on the idea of internalizing the positive externality of biomass power generation can be discussed.
2.5. Biomass Power Generation Technologies in the Designed Project and its Parameters
2.5.1. Biomass Power Generation Technologies
Many commercially proven power generation technologies which can use biomass as a fuel input are available. These technologies can generally be classified into three types: Biomass combustion, anaerobic digestion, and biomass gasification technologies [46]. Among these, the direct combustion of biomass for power generation is the most mature and common form of biomass power generation. Around the globe, over 90% of the biomass used for energy purposes goes through the combustion route. We did not consider anaerobic digestion as a feasible biomass generation technology, because the main biomass we used to generate power is composed of apple tree branches, which is not a feedstock used to produce biogas, in general. Although gasification technologies are commercially available, more work, such as R&D(Research and Development) and demonstrations, should be conducted to promote their widespread commercial use, as only approximately 373 MWth (megawatt-thermal) of the installed large-scale gasification capacity was in use in 2010, with only two additional projects totaling 29 MWth planned for the period up to 2016 [46]. The direct combustion of biomass is also a popular technology which has been adopted by China’s biomass power generation plants. To discuss the economic and technological feasibility of biomass power generation using apple tree branches as a fuel input, a techno-economic analysis of a 30 MW biomass-fired power plant is provided.
2.5.2. Data Collection
Processing Equipment and Design Parameters of the 30 MW Biomass-Based Steam Power Plant
Currently, the main technologies for biomass power generation include water-cooled vibrating grate combustion technology and fluidized bed combustion technology. The former, which was developed by BWE—a famous corporation whose business is to produce industrial boiler in Denmark, adopts the grate-firing method in which the fuel can be diffused equally and burned with a vibrating grate, and the clinker is discharged at the terminal part of the boiler [47]. This method is an effective solution to inefficiency, and corrosive tail gas and clinker agglomeration. Thus, we assumed that the project of biomass power generation using apple tree branches as a fuel input would employ the water-cooled vibrating grate combustion technology.
To reduce the import cost of a water-cooled vibrating grate boiler, Chinese corporations have pursued domestically manufactured equipment by actively cooperating with BWE—a Danish boiler manufacturer. At present, many corporations, such as the Jinan Boiler Group Co., Ltd. and the Hangzhou Boiler Group Co., Ltd., manufacture their own water-cooled vibrating grate boilers and supply their products to domestic biomass power generation plants [48].
The operating principle of biomass direct combustion power generation technology can be depicted as follows: The biomass is sent directly into the boiler as a fuel input, after which high-temperature and high-pressure steam, produced by the boiler, pushes the steam turbine to drive a dynamo, which generates electricity. Table 3 lists the boiler and turbine data.
Structure of the Total Investment and Financial Costs of the 30 MW Biomass Power Plant
The registered capital of the designed project, which accounts for 20% of the total investment, is approximately US$9.10 million. The remaining 80% of the investment will be loaned from a bank whose lending rate is 5.94%. The long-term loan amount is US$36.40 million with a repayment period of 13 years, of which the grace period is 2 years, and the repayment method is the average capital plus interest. The operation period of the biomass power generation project is from 2019 to 2039.
2.5.3. Mathematical Equations Used to Evaluate the Requirement of Biomass Fuel
In this study, the available biomass fuels include apple tree branches, wheat straw, and maize straw. The former is designated as the main biomass fuel, while the other two types are auxiliary fuels, used only when apple tree branches cannot be sufficiently supplied.
The calorific value of the dry weight cannot be used to evaluate the biomass requirement under boiler conditions in the process of biomass power generation. Cheng Xuyun et al. (2013) found that the lower heating value (LHV) has an intimate relationship with the structure of biomass fuel, which involves the mass fractions of moisture, ash, volatile matter, and fixed carbon. The LHV can be estimated from industrial analysis indices as follows [49]:
where M, V, A, and C are the percentages of moisture, volatile matter, ash, and fixed carbon, respectively, accounting for straw biomass based on industrial analysis conditions; the unit of LHV is KJ/g.
The annual biomass requirement is also influenced by the structure of the biomass fuel. The requirements of the biomass fuel vary with the fraction of the moisture content in the biomass and the system efficiency of the equipment used for biomass power generation. We assumed that the biomass would be processed before consumption, and its mass fraction of moisture content is in accordance with the conditions under which the LHV is estimated. The following equation is used to estimate the annual biomass requirement (Mf) [50]:
where Mf, E, LHV, and indicate the annual biomass requirement, energy demand, lower heating value, and combustion efficiency, respectively.
2.5.4. Net Present Value (NPV)
The method of net present value (NPV) is employed to judge whether a project is economically feasible. The net cash flow, which is the basis of an analysis of the net present value, is computed according to the item structure of the cash flow of the construction project, as shown in Figure 1.
The net earnings of each year in the lifetime of the project are discounted to year zero with the selected rate to satisfy the marginal average rate of return (MARR), and the investment is deducted from the sum of the present net earnings. This value of the NPV can be computed by the following equation [52]:
where S is the initial investment, CF is the cash flow, r is the discount rate, and T is the economic life of the plant.
2.5.5. Internal Rate of Return (IRR) and Payback Period (PBP)
The definition the internal rate of return (IRR) is the discount rate that makes the NPV equal zero over the lifetime of the project, and it can be computed by Equation (13):
The payback period (PBP) is the number of years that the project takes to recover its total investment (TI) through earnings after interest and tax (EAIT). The PBP can be computed by Equation (14) [53]:
2.5.6. Emission Reductions by Displaced Energy
Compared with a coal-fired power plant, biomass power generation is considered to be a cleaner energy source, which reduces emissions, such as CO2 and SO2, as the biomass always releases these emissions during a biological degradation process, even though it is not used as biomass fuel to generate power. The amount of emissions that can be reduced by the displaced energy can be estimated as follows [54]:
where ERd is theoretical emission reduction of pollutants of biomass power generation compared with on-grid electricity, in fact the value of ERd is equal to the pollutants’ emission amount generated by traditional electricity’s production; E is the amount of electricity generated by the biomass power plant; PC is the share of coal in China’s primary energy consumption; PP and PN indicate the shares of petroleum and natural gas in China’s primary energy consumption, respectively; and EFc, EFp, and EFg indicate the emission factors of coal, petroleum oil, and natural gas, respectively. These emission factors are shown in Table 4.
In China, the consumption structure of its primary energy has varied rapidly in recent years. The 2015 Chinese energy consumption share is shown in Table 5.
2.5.7. Emissions from the Transportation of Biomass Raw Materials (ET)
Emissions from the transportation of biomass raw materials can be calculated using the following Equation (16):
where ET is the total emissions from the transportation of biomass raw materials; M is the weight of biomass fuel that must be transported; D is the distance that the biomass fuel needs to be transported; T is the tortuous coefficient of country roads; EF is the emission factor of diesel-based transportation; and TT is the truck load per trip.
We assume that the transportation vehicles from rural households to temporary storage stations are light-duty vehicles and that the transportation vehicles from temporary storage stations to biomass power plants are heavy-duty vehicles. The overall average emission factors are shown in Table 6.
2.5.8. Effective Emissions Reduction from Biomass Power Plants
In reality, the biomass power generation can also bring about pollutant emissions which should be subtracted from ERd. Thus, the effective emissions reduction from a biomass power plant (EMe) can be evaluated using Equation (17):
where EMe is the effective emission reduction of biomass power generation, ERd is the theoretical emission reduction of pollutants of biomass power generation compared with on-grid electricity; E is the amount of electricity generated by the biomass power plant; Eb is the emission factors of pollutants; and ET is the emissions from biomass transportation.
The life cycle GHG (greenhouse gas) emission intensity of biomass power is 0.045 kg CO2 e/kWh [56]; the emission factors of other emissions of a biomass power plant, including CO, SO2, and NOx, are 0.0080332 kg/kWh, 0.0000228 kg/kWh, and 0.0008626 kg/kWh, respectively [57]; ET were calculated using Equation (16).
2.6. System Dynamics and the BEP-SD Model
The system dynamics method, which was first founded in the 1950s [58], was applied to construct a circular economy systemic analysis model. This method has been widely used in the study of many complex systems of the economy, society, and ecology [59,60], and is characterized by quantifiability and controllability. It can reveal the dynamic changes, feedback, delays, and other processes of a system. Thus, this method has an obvious advantage in analyzing, improving, and managing systems characterized by a long developmental cycle and complex feedback effects [61].
The system dynamics model is generally composed of three types of variables: Level variable, rate variable, and auxiliary variable. The level variable is a cumulative variable which is like a water pool, it represents the status of the system and is always put in a rectangle. The rate variable makes the level variable change, which represents the rate at which the level variable changes. The auxiliary variable is the intermediate variable used to describe the information transfer and transformation process between the level variable and rate variable in the decision-making process. In addition, a constant is also often used in building a system dynamics model. The arrow direction indicates the causal relationship between variables.
To distinguish whether the construction of a biomass power generation plant is economically feasible and whether the China biomass power generation support policy is rational, the bioenergy-effect-policy system dynamics (BEP-SD) model, which is centered around biomass power generation using apple branches as a fuel, is constructed to quantitatively simulate various flows in the agricultural circular economy system of Jingning County, simulate their effects and long-run trends, and detect the system defects before providing some suggestions to improve the final system performance. According to the logical framework narrated above, the causal loop of the BEP-SD model was designed, as shown in Figure 2.
For the convenience of narration, we broke down the BEP-SD model into four subsystems: (1) Consumption of biomass fuel, (2) positive externalities, (3) fiscal subsidy, and (4) net present value. The consumption of a biomass fuel subsystem mainly includes one level variable, one rate variable, and 27 auxiliary variables. This subsystem simulates the growth process of the apple tree branches consumed by the biomass power generation plant and analyzes the cost of the biomass fuel (see Figure 3).
The positive externalities subsystem involves one level variable, one rate variable, and 37 auxiliary variables. The operation of a biomass power generation plant generates some positive effects, such as economic growth, employment increases, and pollution reduction. This subsystem mainly analyses the positive environmental externalities relating to the environmental benefits generated by using biomass power to replace coal-fired power, such as emission reductions of CO2, SO2, NOx, and CO. We mainly focus here on the environmental benefits generated by the emissions reductions of CO2, SO2, and NOx (see Figure 4).
The fiscal subsidy subsystem involves three level variables, four rate variables, and 45 auxiliary variables. This subsystem simulates the process of fiscal subsidy generation and depicts the gap between the fiscal subsidy and positive environmental externalities. It is used to judge the rationality of the governmental support policy for the development of biomass power (see Figure 5).
The net present value subsystem involves two level variables, two rate variables and eight auxiliary variables. This subsystem is designed to compute the net present value of the project through which we judge whether the project of building a 30 MW biomass power plant using apple tree branches as biomass fuel is feasible (see Figure 6).
The BEP-SD is employed to analyze the interaction mechanisms among the different subsystems and the feedback relationships between the parameters of the model, thereby demonstrating and simulating the development of a biomass power plant quantitatively and dynamically.
In an allusion to the price fluctuations of biomass power and biomass fuel and the technological changes in biomass power generation, this study applied a scenario analysis to discuss the economic feasibility of a biomass power plant project. The project has positive externalities, and the internalization of these externalities is the theoretical basis of the governmental support policy for the development of biomass power generation. At present, China’s unified on-grid price for biomass power is US$0.1133/kWh, which is approximately US$0.0529/kWh higher than the desulphurization benchmarking feed-in tariff; this higher part of the price can be regarded as an approximate compensation for the externalities. This study explores the rational space of the biomass power support policy and proposes policy recommendations by comparing the positive externalities generated by biomass power generation and the governmental subsidies for the development of biomass power.
3. Results and Discussion
3.1. Demand Analysis of Biomass Fuel
We assume that 70% of the total apple tree branches in Jingning County can be purchased ultimately in the rural market accompanied by an increase in the availability of apple tree branches; this amount will be nearly 0.11 million tons in the next few years. With an increase in the age of the apple trees, the available apple tree branches will increase yearly, and the highest available amount will reach 0.28 million tons, plus approximately 0.38 million tons of crop straw every year. These biomass resources can ensure the required biomass fuel inputs for the planned biomass power generation plant.
Based on the assumption that the planned biomass power plant will operate with a full load, we simulated the consumption trends of the biomass fuel in the planned biomass power plant (see Figure 7). The requirements of the apple tree branches and other biomass are within the scope of the supply capacity of Jingning County. To illustrate the relationship between the biomass price and the economic feasibility of the assumed project, the biomass price is marked in the figure legend; for example, scenario I 49 indicates that all data presented in the figure are calculated based on an assumption that the biomass price is US$49/ton in scenario I.
Accompanied by an increase in the consumption of apple tree branches, the fuel cost of the project descends gradually as the LHV of apple branches is higher than for other biomasses, such as maize, wheat straw, and other crop straws. We made this conclusion under the assumption that the prices of apple branches and other biomass will not be raised with the building of the biomass power plant. As with biomass fuel, other crop straw biomass serve as substitutes for apple branches, and crop straw in the rural markets of Jingning County accounts for only 4% of the total scale; thus, this judgment is reliable.
3.2. Economic Feasibility Analysis of the Project of Building a 30 MW Biomass Power Plant
According to the NPV method, the project is economically feasible if the value of the NPV is larger than zero by the last year of its operation period. Thus, we can judge whether the planned project is economically feasible by analyzing which price for the biomass fuel makes the NPV larger than zero by 2039 when the indices of the IRR, the price of biomass power, the generating efficiency of the biomass power plant, and the other conditions of a plant’s normal operations are fixed (see Table 2). The NPV values would be less than zero and the assumed project will not be economically feasible if the prices of biomass fuel are larger than the prices listed in Table 7.
In the six scenarios, scenario I and scenario II are practical and feasible as the prices of crop straw (e.g., wheat and maize straw) were between US$30.22 and US$45.34 in 2012, which are less than those in scenario I and scenario II. The PBP is less than eight years, which is within the acceptable range, indicating that the planned biomass power plant is economically feasible (see Table 8).
As far as the cost of biomass power plant is concerned, the cost of biomass fuel accounts for about 60% of the total cost. So, to some extent, the price of biomass fuel seals the fate of biomass power plants. From scenario III to scenario VI, the prices of biomass fuels are far less than the prices that the market would accept (see Table 7), especially scenario V and scenario VI, whose prices are only US$0.0453/kWh, and there are no support policies for the investors in biomass power to help them decrease the cost of biomass fuel. We conclude that the biomass power generation project is not economically feasible without a support policy for biomass power generation and higher prices compared with fossil-based power.
3.3. Sensitivity Analysis of Profitability of Biomass Power Generation Project
3.3.1. The Influence of the Fluctuation of Biomass Price
Biomass fuel cost accounts for about 60% of the total cost of the biomass power generation project (Figure 8), and the fluctuation of the biomass price exerts an important impact on the profitability of the biomass power generation project.
According to the judgment standard of the net present value method, the project has investment value when the accumulated after-tax net present value is larger than zero at the end of the project. Obviously, in the project operation period, the earlier the accumulated after-tax NPV exceeds zero, the stronger the profitability of the project. In Figure 9, there is a trend that the profitability of the biomass power generation project declines together with the rise of the biomass fuel price under the backdrop of scenario I. When the price of biomass fuel is US$35/ton, it needs less than nine years for the indicator value of the accumulated after-tax net present value to exceed zero; when the price of biomass fuel is US$40/ton and US$45/ton, this time will be shorter than 11 and 14 years, respectively; and when biomass fuel prices are above US$50/ton, biomass power generation projects will lose investment attractiveness for industrial capital, as shown in Figure 9.
3.3.2. The Influence of Governmental Price Subsidy Intensity
Among the policy tools that the government uses to support renewable electricity development, the price subsidy occupies a very important position, as shown in Figure 10.
The governmental price subsidy intensity for the development of renewable electricity exerts an important impact on the profitability of the biomass power generation project. In Figure 11, scenarioI40-1 means that the price of biomass is US$40/ton, and governmental price subsidy intensity is US$0.068/kWh; from scenario I40-2 to scenario I40-4, the prices of all types of biomass are US$40/ton, but the governmental price subsidy intensity is US$0.0604/kWh, US$0.0529/kWh, and US$0.0453/kWh, respectively.
There is an obvious trend in Figure 11 that the profitability of the biomass power generation project declines rapidly together with the decline of the governmental price subsidy intensity. The indicator value of the accumulated after-tax net present value can be greater than zero in less than 11 years as the price subsidy intensity is US$0.068/kWh; as the price subsidy intensity is US$0.0604/kWh, it will take less than 14 years. However, as the subsidy intensity is US$0.0529/kWh and US$0.0453/kWh, the biomass power generation project loses its investment value.
3.4. Analysis of the Present Support Policy of Biomass Power Generation
3.4.1. To What Extent has the Positive Externality of Biomass Power Generation Been Internalized?
As mentioned before, the indicator value of Q (see Equation (9)) can help us judge whether the positive externality of biomass power generation has been internalized by the government’s policy. For convenience, Q is replaced by another variable named the “accumulated difference between fiscal subsidy and positive externalities” in the system dynamics model, whose definition is the accumulated difference value that the fiscal subsidy is subtracted from the positive externality from 2019 to 2039.
The indicator value of the accumulated difference between the positive externalities and fiscal subsidy should be close to zero at the end of the project operation period if the positive externality was internalized completely. However, its values in scenario I49 and scenario II 54 in 2039 are US$−140,729,000 and US$−113,399,000, respectively, which are much lower than zero. Therefore, we can draw a conclusion that the subsidies provided by government policies far exceeds the positive externalities generated by the biomass power generation project.
The evolution trend of “difference between the fiscal subsidy and the positive externalities,” which is far less than zero (see Figure 12), indicates that the fiscal subsidy far exceeds the positive externalities generated by biomass power generation. We can infer that the biomass power generation project is not economically feasible without the support of the government because the positive externalities of the biomass power generation project are not compensated.
The curves in Figure 12 present a similar developing trend, which indicates that the indicator’s values are small from 2019 to 2024, and become bigger gradually after 2025. Because the value of positive externality of biomass power generation is relatively stable, the value of “difference between the fiscal subsidy and the positive externalities” mainly depends on the value of the fiscal subsidy. Therefore, the indicator curves in Figure 12 illustrate that the support intensity of the government’s policy is larger in the first six years, and then its support intensity becomes weak, so the values of this indicator in the two scenarios will grow bigger and bigger.
3.4.2. Analysis of the Structure of Positive Externality and Fiscal Subsidy
The positive externality of biomass power generation mainly includes six items. According to their values by descending order, the list of these six items is the environmental value of SO2 emission reduction, increased income from biomass sales, environmental value of NOx emission reduction, benefit of CDM which is equal to the environmental value of CO2 emission reduction, benefits of employment increase, and environmental value of CO emission reduction (see Figure 13).
Among them, the benefits of employment increase and increased income from biomass sales is a social benefit, which accounts for approximately 23% of the positive externality of biomass power generation.
In Figure 13, the environmental value of CO emission reduction is negative, which means that the emission level of CO for the biomass power plant is higher than traditional power.
Compared with the income tax exempted and value-added tax exempted, the price subsidy holds a large proportion of the government’s fiscal subsidy, which can explain why the biomass power plant cannot operate economically without it from scenario IV to scenario VI (see Figure 10).
3.4.3. The Reasonable Governmental Price Subsidy Intensity and Prices of Pollutant Emission Reduction
From the previous analysis, we know that biomass power generation has a positive external effect. According to the theory of externality, the internalization of externality is an effective tool for optimizing resource allocation. Therefore, the reasonable government subsidy intensity should ensure that the net present value of biomass power generation projects is exactly equal to zero. The rational price subsidy intensity, which is that value that can make the indicator value of accumulated after-tax NPV equal to zero, is easy to calculate when the biomass price is set.
We calculated the reasonable price subsidy intensity when the biomass price is US$35, US$40, and US$45 per ton. The average value of the price subsidy intensity in these three scenarios is US$0.0548/kWh, which is US$0.0132 lower than the current price subsidy intensity. However, the values of accumulated after-tax NPV are still smaller than zero in these scenarios, as shown in Table 9.
What conclusion can we draw from this situation? Positive externality includes two parts, one is social benefits, and the other is positive environmental externalities. The indicator parameters, which are included in the calculation of social benefits, come from a market survey and are reliable. The quantities of the emission reduction of biomass power generation are reliable too. Thus, the only points that can arouse our suspicion are the prices of pollutant emission reduction. A reasonable inference is that the values of these indicators are smaller than their actual values. In order to obtain the actual values of these indicators, we promoted their values in the same proportion. These parameters can be calculated by Equation (9), where Eet can be replaced by E’et:
where E′et is the positive environmental externality whose prices of the pollutant emission reduction are enhanced in the same proportion as a. The prices of the pollutant emission reduction that can make the value of the “accumulated difference between fiscal subsidy and positive externalities” close to zero are listed in Table 10 when the biomass price is US$35, US$40, and US$45, respectively.
The prices of the pollutant emission reduction listed in Table 6 are much larger than the corresponding values from scenario I to scenario VI. The latter is less than half of the former.
There is a huge controversy about the market value of pollutant emissions reduction. These indicators have a wide range of values. These parameters produced by our calculation may provide a useful reference for related research in the field of sustainability.
3.5. The Explanation of the Fiscal Burden Imposed by Renewable Electricity Policy
Renewable electricity subsidies are mainly derived from renewable energy surcharges for traditional power, which can be viewed as a type of Pigou tax. It was reported that the renewable electricity generated by biomass power plants reached US$64.7 billion kWh. According to our research result that the current price subsidy intensity is US$0.0132 higher than a reasonable level, among the governmental fiscal burden produced by its renewable electricity support policies, there is about US$0.854 billion that can be attributed to an unreasonable price subsidy intensity in the field of biomass power generation, which accounts for 4.7% of the total amount [62], and is about two times the proportion that biomass power generation accounts for of the total installed capacity of renewable electricity. We can infer that the scale of the positive externality of renewable electricity we calculated is approximately accurate. As far as biomass power generation is concerned, the government’s financial burden imposed by renewable electricity policy should be partly attributed to the fact that the tax rate of renewable energy surcharges imposed on traditional power is relatively low.
3.6. The Limitation of this Research
3.6.1. The Uncertainty of this Research
In general, the generation efficiency of biomass power generation equipment will improve with the development of technological innovation, and its price will decline. These factors will reduce the total cost of the biomass power generation project, and thus improve the feasibility of the project. It will also affect the governmental support policies for the development of renewable electricity. At the same time, along with socioeconomic development, the gap between urban and rural labor prices tends to narrow, and the negative environmental externalities of traditional power will also decline due to technological progress; these factors will lead to a reduction in the positive externalities of biomass power generation, which in turn will affect the governmental subsidy intensity for the development of renewable electricity, thereby reducing the investment feasibility of a biomass power generation project.
3.6.2. The Issue of Monetization Assessment of the Positive Environmental Externality
A monetization assessment of the positive environmental externality of biomass power generation is a complicated process. The value of the positive environmental externality depends on many parameters. Among these parameters, the most significant parameter is the market value of the environmental loss per unit of pollutant emission, namely the market price of pollutants. The value of this parameter varies greatly from region to region. The same is true for the calculation of social benefits of the positive externalities of biomass power generation. In comparison, the calculation process of the government’s financial subsidies is relatively simple, and there are few different viewpoints on the calculation results. The degree of internalization of the positive externality of biomass power generation mainly depends on the accuracy of the positive externality’s calculation results, which is the reason why a monetization assessment of the scale of positive externality is one of the hot spots of academic debate.
4. Conclusions
Based on our research and analysis, we conclude the following:
- (1)
- According to the established system dynamics model, the positive externalities of biomass power generation are influenced by many factors, such as the biomass market price, market price of pollutant emission reduction, labor wage, and so on. These factors have obvious regional differences. Subsidies for biomass power generation based on externalities’ internalization should also reflect these differences, so as to adapt to local conditions. If the subsidy policy of biomass power generation is one-size-fits-all, it will inevitably lead to over-development of biomass power generation enterprises in areas where the externality scale is relatively small.
- (2)
- From the current policy environment for biomass power generation, building a biomass power plant using apple branches as the primary biomass fuel is economically feasible, and the assumed biomass power plant has a larger profit margin. The price of biomass fuel, which accounts for 60% of the total cost of biomass power, has a significant impact on whether a biomass power generation project can be profitable. Because of the lower price of biomass fuel, projects of biomass power generation have broad market prospects in areas of western China with an abundance of biomass power fuel.
- (3)
- It is difficult for a biomass power generation project to be profitable without governmental support policies. Comparing the scale of the positive externalities of biomass power generation with the scale of government subsidies, we believe that the scale of government subsidies exceeds the positive externalities that biomass power generation can generate. As far as biomass power generation is concerned, the current price subsidy intensity is about US$0.0132 higher per kWh than the reasonable level. Furthermore, our study results indicate that the parameters frequently applied in the calculation of the prices of a pollutant emission reduction in Chinese research papers is relatively small, which would be only half of their actual values.
- (4)
- The Chinese government should maintain their policy support intensity for the development of biomass power generation. China’s support policy should be adjusted so that the subsidies that enterprises could receive from the government are as close as possible to the externalities that biomass power generation can generate. Whether renewable electricity policy brings about a fiscal burden for the government is not a correct criterion to judge the rationality of this policy. The scientific criterion is whether this policy can internalize the positive externality of renewable electricity. Accurate monetization measurement of the positive externalities generated by biomass power generation is still a key question.
Supplementary Materials
The following are available online at https://0-www-mdpi-com.brum.beds.ac.uk/2071-1050/11/12/3426/s1, File 1: Explanation of equations and Parameters of Bioenergy-effect-policy System Dynamics model that make the biomass power generation project economically feasible.
Author Contributions
H.Y. and S.D., conceived the research idea and designed general framework of the research. Y.Y. and H.Y. built SD model, analyzed the data, and wrote the paper.
Funding
This study was funded by the Social Science Planning Project of Shandong Province (No. 18CSJJ14) andResearch Startup Fund of Ludong University (No. LB2017028), the National Natural Science Foundation of China (No. 41301642).
Conflicts of Interest
The authors declare no conflict of interest.
Nomenclature
| at | coefficient of current year profit |
| bt | coefficient of income tax rate |
| Bt | electricity generated by biomass power plant in t year |
| CDM | clean development mechanism |
| CF | cash flow |
| Ebst | increased income from biomass sales in t year |
| Eb | emission factors of pollutants |
| Eet | positive environmental externality in t year |
| Eeit | benefits of employment increase in t year |
| Est | social benefits in t year |
| Et | positive externality produced by biomass power generation in t year |
| EAIT | earnings before interest and tax |
| EFB | empty fruit bunch |
| EMe | effective emission reduction of eth pollutants of biomass power generation compared with on-grid electricity |
| ERd | theoretical emission reduction of pollutants of biomass power generation compared with on-grid electricity |
| ET | total emissions from the transportation of biomass raw materials |
| FIT | feed-in tariff |
| FSt | government’s fiscal subsidy in t year |
| GHG | greenhouse gas |
| It | income tax exempted in t year |
| IRR | Internal rate of return |
| LHV | lower heating value |
| Mf | annual biomass requirement |
| NPV | net present value |
| Pe | market price of the environmental loss generated by the eth pollutant |
| Pt | current year profit of biomass power plant |
| PBP | payback period |
| Q | indicator of externality internalization |
| RPS | renewable portfolio standards |
| S | initial investment |
| To | output tax |
| Ti | input tax |
| TGCs | tradable green certificates |
| TI | total investment |
| TT | truck load per trip |
| Vt | value-added tax exempted |
References
- Benato, A.; Macor, A. Italian Biogas Plants: Trend, Subsidies, Cost, Biogas Composition and Engine Emissions. Energies 2019, 12, 979. [Google Scholar] [CrossRef]
- Kern, F.; Kivimaa, P.; Martiskainen, M. Policy packaging or policy patching? The development of complex energy efficiency policy mixes. Energy Res. Soc. Sci. 2017, 23, 11–25. [Google Scholar] [CrossRef] [Green Version]
- Kwon, T.H. Is the renewable portfolio standard an effective energy policy? Early evidence from South Korea. Util. Policy 2015, 36, 46–51. [Google Scholar] [CrossRef]
- Kwon, T.H. Rent and rent-seeking in renewable energy support policies: Feed-in tariff vs. renewable portfolio standard. Renew. Sustain. Energy Rev. 2015, 44, 676–681. [Google Scholar] [CrossRef]
- García-Alvarez, M.T.; Cabeza-García, L.; Soares, I. Analysis of the promotion of onshore wind energy in the EU: feed-in tariff or renewable portfolio standard? Renew. Energy 2017, 111, 256–264. [Google Scholar] [CrossRef]
- Zhang, Y.Z.; Zhao, X.G.; Ren, L.Z.; Zuo, Y. The development of the renewable energy power industry under feed-in tariff and renewable portfolio standard: A case study of China’s wind power industry. J. Clean. Prod. 2017, 168, 1262–1276. [Google Scholar] [CrossRef]
- Chinairn. China’s Renewable Energy Generation Subsidy Gap has Exceeded 120 Billion CNY in 2018. Available online: http://www.chinairn.com/news/20180613/143748101.shtml (accessed on 13 June 2018).
- National Energy Administration. Notice on the Implementation of Renewable Energy Electricity Portfolio Standards. Available online: www.nea.gov.cn/2018-11/15/c_137607356.htm (accessed on 15 November 2018).
- Dong, S.C. Feed-in tariff vs. renewable portfolio standard: An empirical test of their relative effectiveness in promoting wind capacity development. Energy Policy 2012, 42, 476–485. [Google Scholar] [CrossRef]
- Wang, B. Study on the Ways and Performance of Internalization of Positive Externalities. Southeast Acad. Res. 2002, 2, 158–165. [Google Scholar]
- Wang, J.N. Environmental Economics: Theory, Method and Policy; Tsinghua University Press: Beijing, China, 1994. [Google Scholar]
- Meng, C.; Gao, W. Establishing Support and Incentive Mechanism to Promote the Development of Agricultural Circular Economy. Farmer’s Daily, 7 May 2013. [Google Scholar]
- Ding, H.P.; He, M.F.; Deng, C. Lifecycle approach to assessing environmental friendly product project with internalizing environmental externality. J. Clean. Prod. 2014, 66, 128–138. [Google Scholar] [CrossRef]
- Dong, S.C.; Yu, H.L.; Li, Y.; Li, Z.H.; Li, F.; Li, F.J. Analysis of Driving Factors of Development of China’s Industrial Circular Economy. Chin. J. Popul. Resour. Environ. 2016, 26, 27–34. [Google Scholar]
- Ci, F.Y. Study on Formation Mechanism, Structure and Optimization Countermeasures of Regional Cyclic Innovation System. Morden Econ. Res. 2016, 7–8. [Google Scholar] [CrossRef]
- Zhu, T.; Gao, S. Thinking on the key link of institutional system of ecological civilization construction. Environ. Prot. 2014, 16, 11–12. [Google Scholar]
- EMF. Towards the Circular Economy: Opportunities for the Consumer Goods Sector. Available online: https://www.ellenmacarthurfoundation.org/publications/towards-the-circular-economy-vol-2-opportunities-for-the-consumer-goods-sector (accessed on 20 February 2019).
- Murray, A.; Skene, K.; Haynes, K. The Circular Economy: An Interdisciplinary Exploration of the Concept and Application in a Global Context. J. Bus. Eth. 2017, 1403, 369–380. [Google Scholar] [CrossRef]
- Picasso, E.; Escobar, M.B.; Harris, M.S.; Tanco, F. Measuring the externalities of urban traffic improvement programs. Habitat Int. 2016, 55, 10–16. [Google Scholar] [CrossRef]
- Delucchi, M.A.; Murphy, J.J.; McCubbin, D.R. The health and visibility cost of air pollution: A comparison of estimation methods. J. Environ. Manag. 2002, 64, 139–152. [Google Scholar] [CrossRef]
- Quah, E.; Boon, T.L. The economic cost of particulate air pollution on health in Singapore. J. Asian. Econ. 2003, 14, 73–90. [Google Scholar] [CrossRef]
- Hao, J.M.; Li, J.; Duan, L.; He, K.B.; Dai, W.N. Valuation of forest damage cost from SO2 emission: A case study in Hunan province. Environ. Sci. 2002, 6, 1–5. [Google Scholar]
- Yang, J.X.; Li, H.Q. Investigation and thinking on crop straws in Jingning County. Gansu Agric. 2013, 13, 56–57. [Google Scholar]
- Nguyen, T.L.T.; Laratte, B.; Guillaume, B.; Hua, A. Quantifying environmental externalities with a view to internalizing them in the price of products, using different monetization models. Res. Conserv. Recycl. 2016, 109, 13–23. [Google Scholar] [CrossRef]
- Zhao, X.L.; Cai, Q.; Ma, C.B.; Hu, Y.A.; Luo, K.Y.; Li, W. Economic evaluation of environmental externalities in China’s coal-fired power generation. Energy Policy 2017, 102, 307–317. [Google Scholar] [CrossRef]
- Ding, H.P.; Liu, L.; Fang, O.Y. Analysis of social cost internalization and investment valuation of reverse logistics. In Proceedings of the 2008 IEEE International Conference on Service Operations and Logistics, and Informatics, Beijing, China, 12–15 October 2008; pp. 2278–2283. [Google Scholar]
- Li, S.Y. Study on Apple Pruning Branches as Biomass Source and Renewable Energy in Shaanxi Province. Master’s Thesis, Northeast A&F University, Yangling, China, 2009. [Google Scholar]
- Liang, L.Y. Study and Promotion of Cultivating Shii—Take Using Branches of Fruit Tree as Substrate in Weibei Highland; Northwest A&F University: Yangling, China, 2006. [Google Scholar]
- Fan, H.X. Research and Popularization of Ecological Recycling Economy Model of “Fruits, Livestock and Methane” in Jingning County. Xiandai Hortic. 2013, 18, 22. [Google Scholar]
- Lu, X.S.; Wang, G.H. Lingbao city develop circular economy of apple industry vigorously. Farmer’s Daily, 20 December 2007. [Google Scholar]
- An, K.C. Experience of Development of Circular Economy Centering on Fruit Industry in Luochuan County. In Proceedings of the 2006 Annual Meeting of China Association of Agricultural Science Societies, Beijing, China, 23–26 July 2006; pp. 270–271. [Google Scholar]
- Lü, T.X. Reflections on the Development of Rural Biogas Transformation in Jingning County. Mod. Landsc. Archit. 2015, 23, 18–30. [Google Scholar]
- Wang, X.H. Existing Problems and Measures of development of Apple Industry in Jingning County. Developing 2016, 10, 20. [Google Scholar]
- Ma, F.P.; Han, X.F. Study on development mode of participatory and village-based poverty alleviation in Jingning County. Anhui Agric. Sci. Bull. 2013, 19, 5–6. [Google Scholar]
- Wang, J.H.; Yan, W.G. Suggestions on Changing the Way of Rural Energy Development in Jingning County. Agric. Sci.-Technol. Inf. 2015, 24, 95–96. [Google Scholar]
- Propaganda Department of Jingning County Party Committee. One Industry One County in Order to Get Rid of Poverty and Achieve Rich; Propaganda Department of Jingning County Party Committee: Lishui, China, 2013.
- Compiling Committe of Jingning County Annals. Jingning County Annals 1986–2002; Zhonghua Book Company: Beijing, China, 2005. [Google Scholar]
- Jingning County Party Committee Office. General situation of Jingning County. Available online: http://www.gsjn.gov.cn/wap/zjjn/jngk/ (accessed on 9 March 2019).
- Jiang, W.Q.; Zhou, Z.Y.; Qin, Y.; Zou, L.N.; Yan, S.Y.; Li, X.Z.; Tian, F.Y. Study on heating value of forages and crop straws in Tibetan Autonomous Region. Pratacultural Sci. 2010, 2707, 147–153. [Google Scholar]
- Ning, Z.L.; Chen, H.J.; Wang, Z.N.; Zhang, Z.W.; Qiu, Y.J. A study on the dynamic change of gross caloric value and ash content of the several tall grasses. Acta Pratacul. Sin. 2010, 192, 241–247. [Google Scholar]
- Whittaker, R.H. Communities and Ecosystems; Science Press: Beijing, China, 1997. [Google Scholar]
- Yang, D.H.; Li, H.L. Environmental pollution loss accounting based on damage and cost- the case of Shandong Province. China Ind. Econ. 2010, 7, 125–135. [Google Scholar]
- Zhan, D.C.; Han, B. Investigation Report of Biomass Power Generation Plants and Generation Cost Research. 2011. Available online: https://wenku.baidu.com/view/aa5becc4aa00b52acfc7ca9d.html (accessed on 8 February 2019).
- Fang, X.J. Grid-connected biomass power generation amounts to 35.6 billion kWh last year. China Energy News, 26 May 2014. [Google Scholar]
- Samuelson, P.A.; Nordhaus, W.D. Economics, 16th ed.; Huaxia Press: Beijing, China, 1999. [Google Scholar]
- IRENA. Biomass for Power Generation, Renewable Energy Technologies: Cost Analysis Series, 1. IRENA Secretariat: Abu Dhabi, UAE. Available online: https://www.irena.org/DocumentDownloads/Publications /RE_Technologies_Cost_Analysis-BIOMASS.pdf (accessed on 22 June 2016).
- He, Z.C.; Yuan, Z.L. Analysis and research of various technical routes of crop straw power generation. Energy Res. Util. 2008, 2, 29–33. [Google Scholar]
- Liu, Y. Design and Application of Biomass Boiler Burning Control Scheme. Master’s Thesis, North China. Electric Power University, Beijing, China, 2012. [Google Scholar]
- Cheng, X.Y.; Niu, Z.Y.; Yan, H.M.; Liu, M.Y. Building of Heating Value Model of Straw Biomass Based on Industrial Analysis Indexes; Transactions of the Chinese Society of Agricultural Engineering: Beijing, China, 2013. [Google Scholar]
- Verma, V.; Bram, S.; Delattin, F.; Laha, P.; Vandendael, I.; Hubin, A.; De Ruyck, J. Agro-pellets for domestic heating boilers: Standard laboratory and real life performance. Appl. Energy 2012, 90, 17–23. [Google Scholar] [CrossRef]
- Xie, Y.L.; Peng, D.S.; Xu, H.W. Application of System Dynamics in Financial Evaluation of Construction Projects; Metallurgical Industry Press: Beijing, China, 2010. [Google Scholar]
- Malek, A.; Hasanuzzaman, M.; Rahim, N.A.; Al Turki, Y.A. Techno-economic analysis and environmental impact assessment of a 10 MW biomass-based power plant in Malaysia. J. Clean. Prod. 2017, 141, 502–513. [Google Scholar] [CrossRef]
- Nishitani, K.; Kaneko, S.; Fujii, H.; Komatsu, S. Effects of the reduction of pollution emissions on the economic performance of firms: An empirical analysis focusing on demand and productivity. J. Clean. Prod. 2010, 19, 1956–1964. [Google Scholar] [CrossRef]
- Dean, J.M. Does trade liberalization harm the environment? A new test. Can. J. Econ. 2002, 35, 819–842. [Google Scholar] [CrossRef]
- Cai, H.; Xie, S.D. Determination of Emission Factors from Motor Vehicles Under Different Emission Standards in China; Acta Scientiarum Naturalium Universitatis Pekinensis: Beijing, China, 2010; Volume 46, pp. 319–326. [Google Scholar]
- WNA.Comparison of Lifecycle GHG Emissions for Various Electricity Generation Sources. World Nuclear Association Report, London, UK. Available online: www.worldnuclear.org/ World-Nuclear-Association/Publications/Reports/Lifecycle-GHGEmissions-of-Electricity-Generation (accessed on 10 October 2015).
- Ye, X. Study on Characteristics of Pollutants Emission from Non-Road Mobile Source and Biomass Boilers on Real Work Conditions. Master’s Thesis, South China University of Technology, Guangzhou, China, 2018. [Google Scholar]
- Forrester, J.W. Industrial dynamics: A major breakthrough for decision makers. Harv. Bus. Rev. 1958, 36, 37–66. [Google Scholar]
- Chang, Y.C.; Hong, F.W.; Lee, M.T. A system dynamic based DSS for sustainable coral reef management in Kenting coastal zone, Taiwan. Ecol. Model. 2008, 211, 153–168. [Google Scholar] [CrossRef]
- Wang, Y.Q.; Zhang, X.S. A dynamic modeling approach to simulating socioeconomic effects on landscape changes. Ecol. Model. 2001, 140, 141–162. [Google Scholar] [CrossRef]
- Tao, Z.P. Scenarios of China’s oil consumption per capita (OCPC) using a hybrid Factor Decomposition-System Dynamics (SD) simulation. Energy 2010, 35, 168–180. [Google Scholar] [CrossRef]
- Wang, J. The Installed Capacity of Biomass Power Generation reached 12.14 Million kWh. China Electric Power News, 15 July 2017. [Google Scholar]
Figure 1.
Item structure of the cash flow of a construction project [51].
Figure 1.
Item structure of the cash flow of a construction project [51].

Figure 2.
The causal loop of the bioenergy-effect-policy system dynamics (BEP-SD) model.

Figure 3.
Subsystem of the consumption of biomass fuel.

Figure 4.
Subsystem of positive externalities.

Figure 5.
Subsystem of the fiscal subsidy.

Figure 6.
Subsystem of the net present value.

Figure 7.
Consumption trends of biomass fuels in a biomass power plant.

Figure 8.
Ratio of fuel cost to total cost in scenario I.

Figure 9.
Sensitivity of profitability of the biomass power project to biomass price fluctuations.

Figure 10.
The structure of the governmental fiscal subsidy.

Figure 11.
The influence of the governmental price subsidy intensity on the profitability of the project.
Figure 11.
The influence of the governmental price subsidy intensity on the profitability of the project.

Figure 12.
Difference between the fiscal subsidy and positive externalities in scenario I and scenario II.
Figure 12.
Difference between the fiscal subsidy and positive externalities in scenario I and scenario II.

Figure 13.
Items of positive externalities in scenario I.


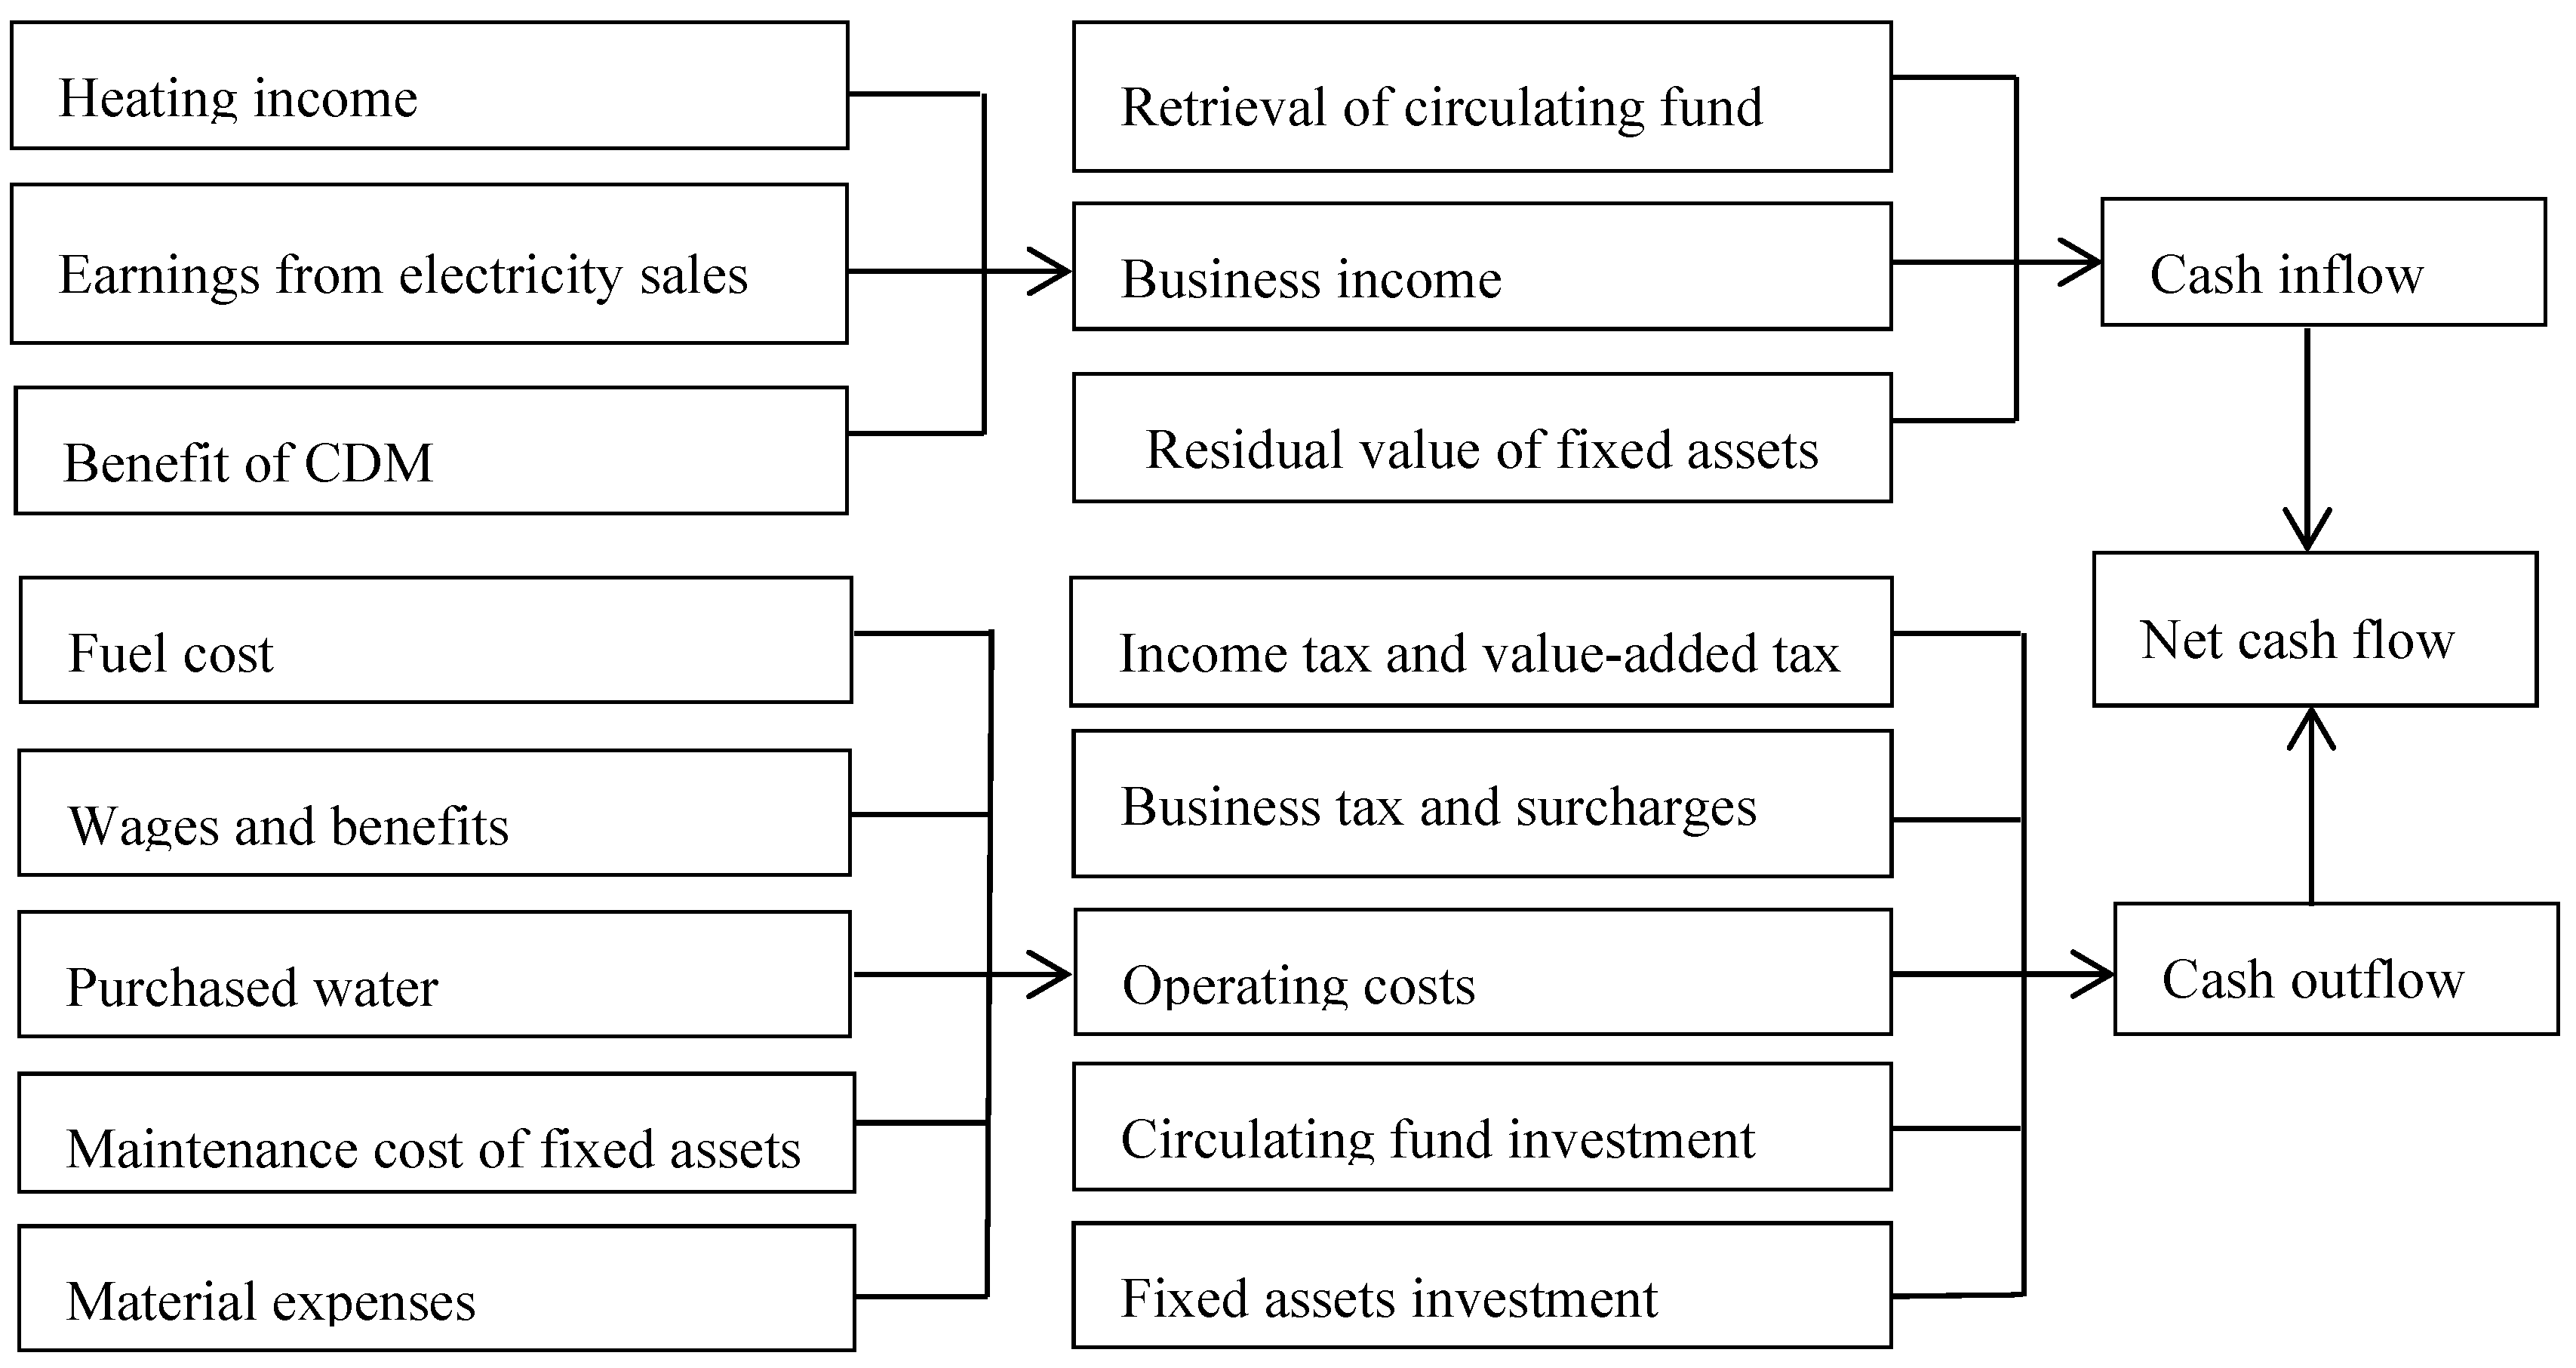
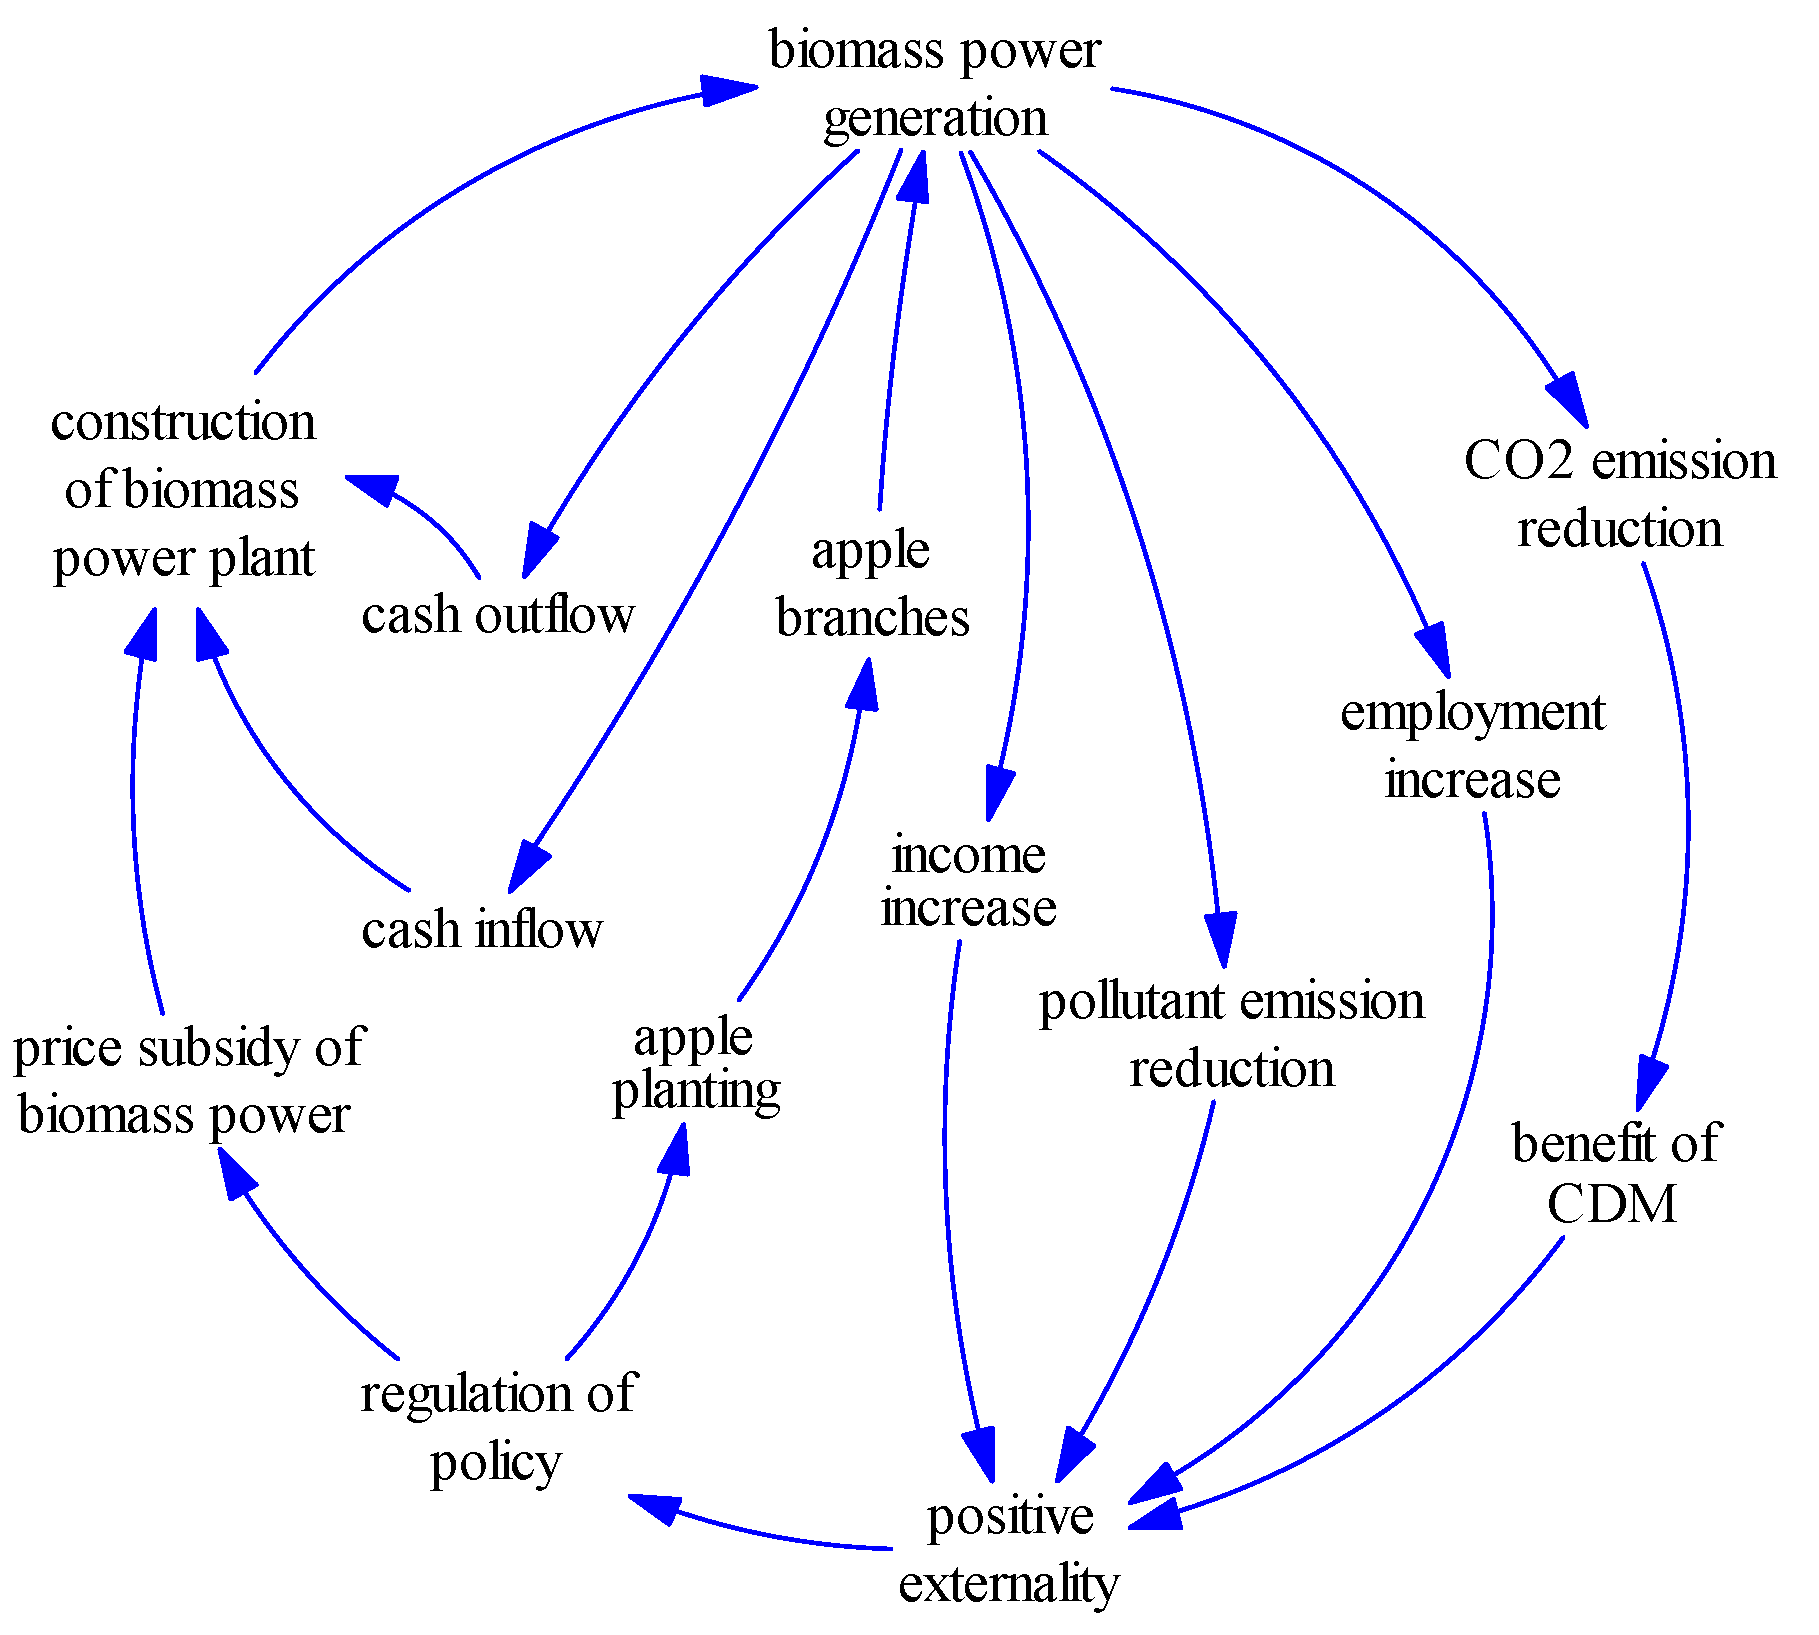
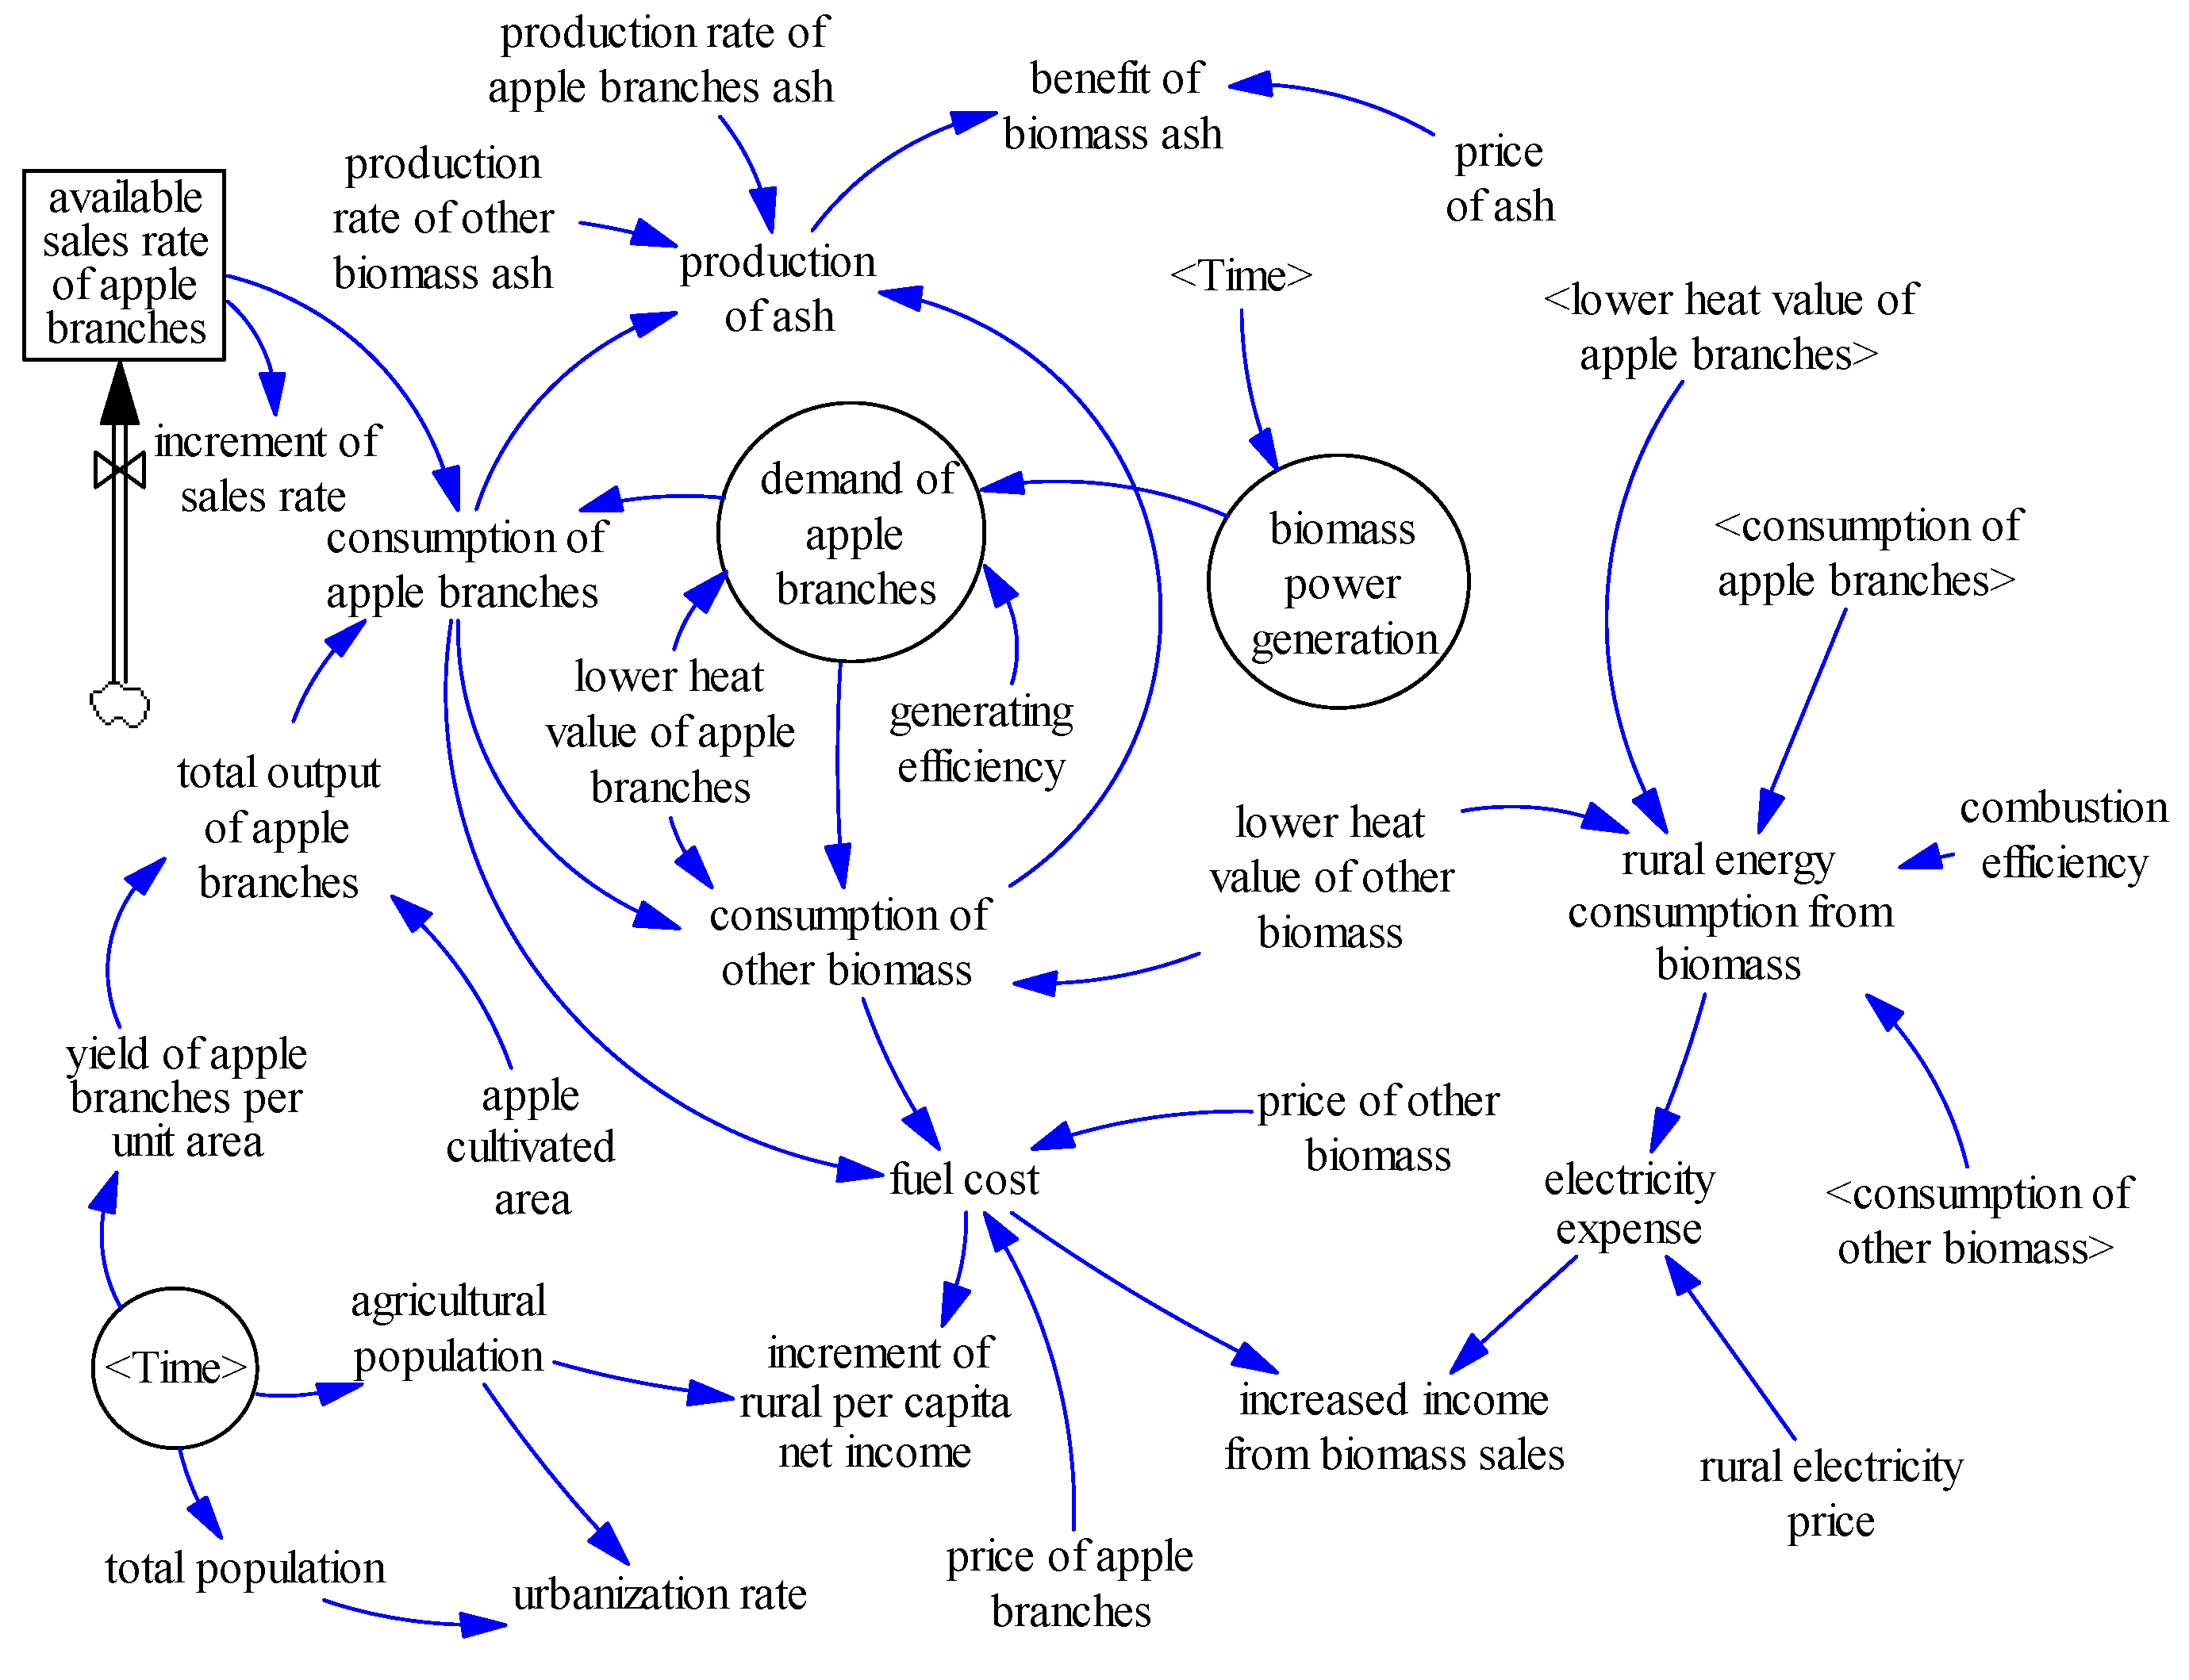
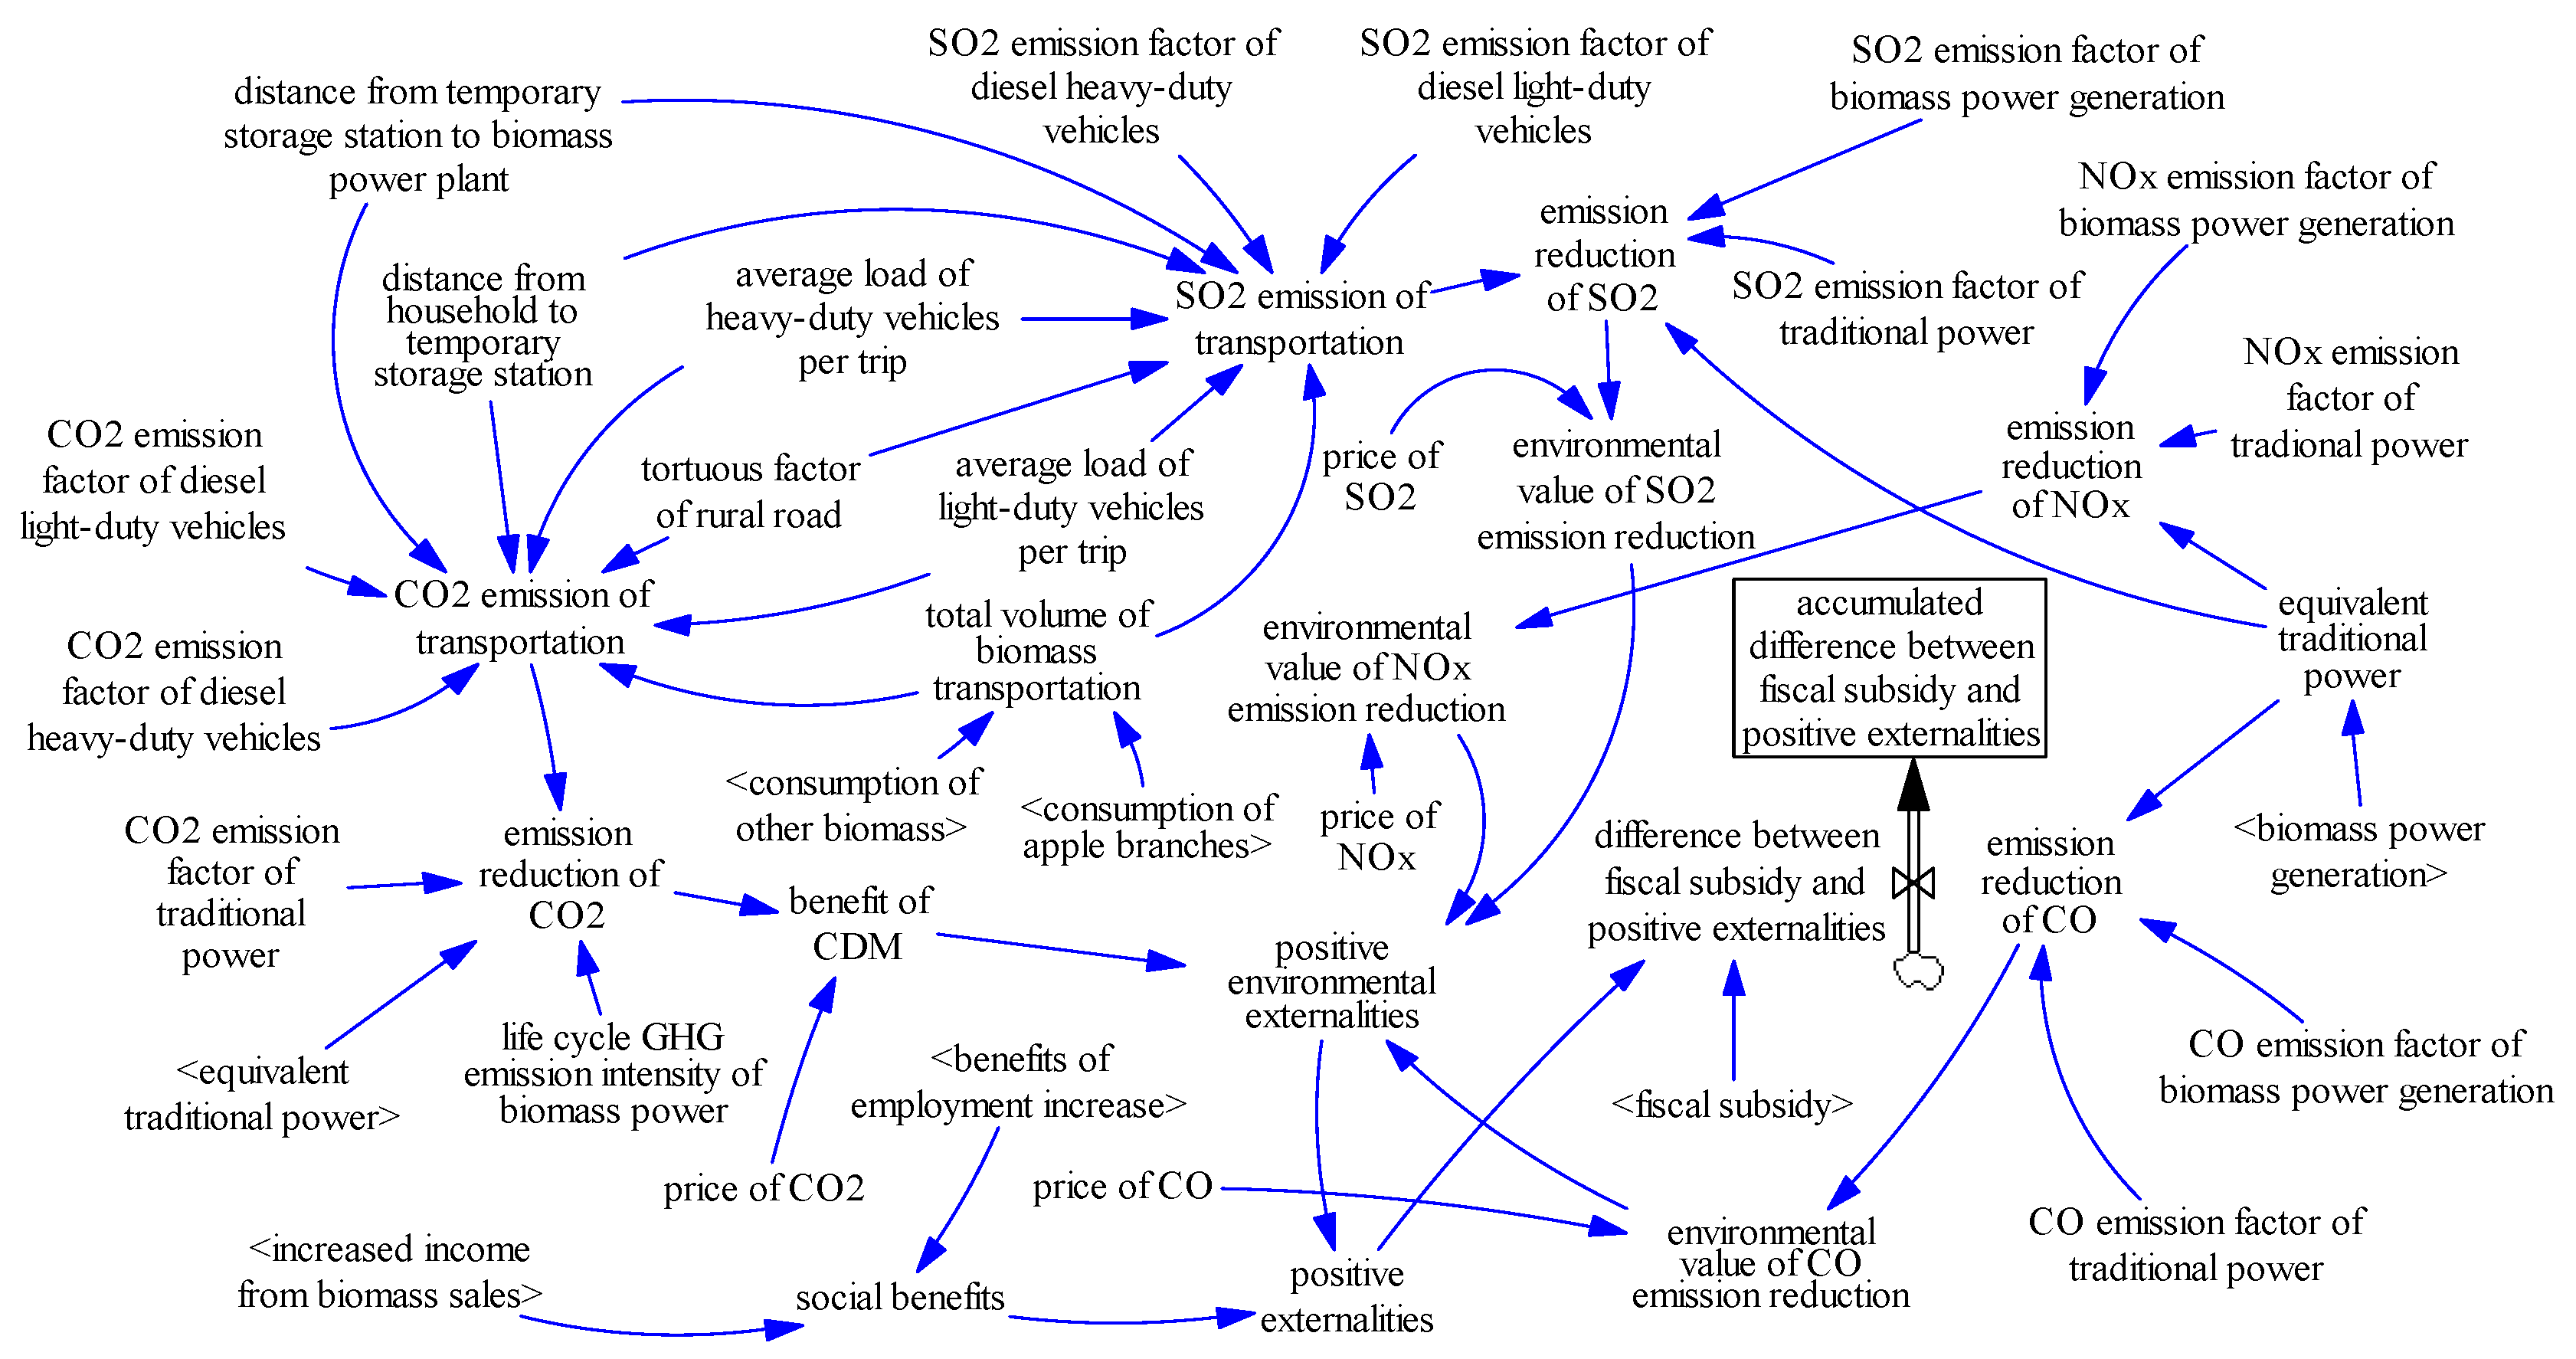
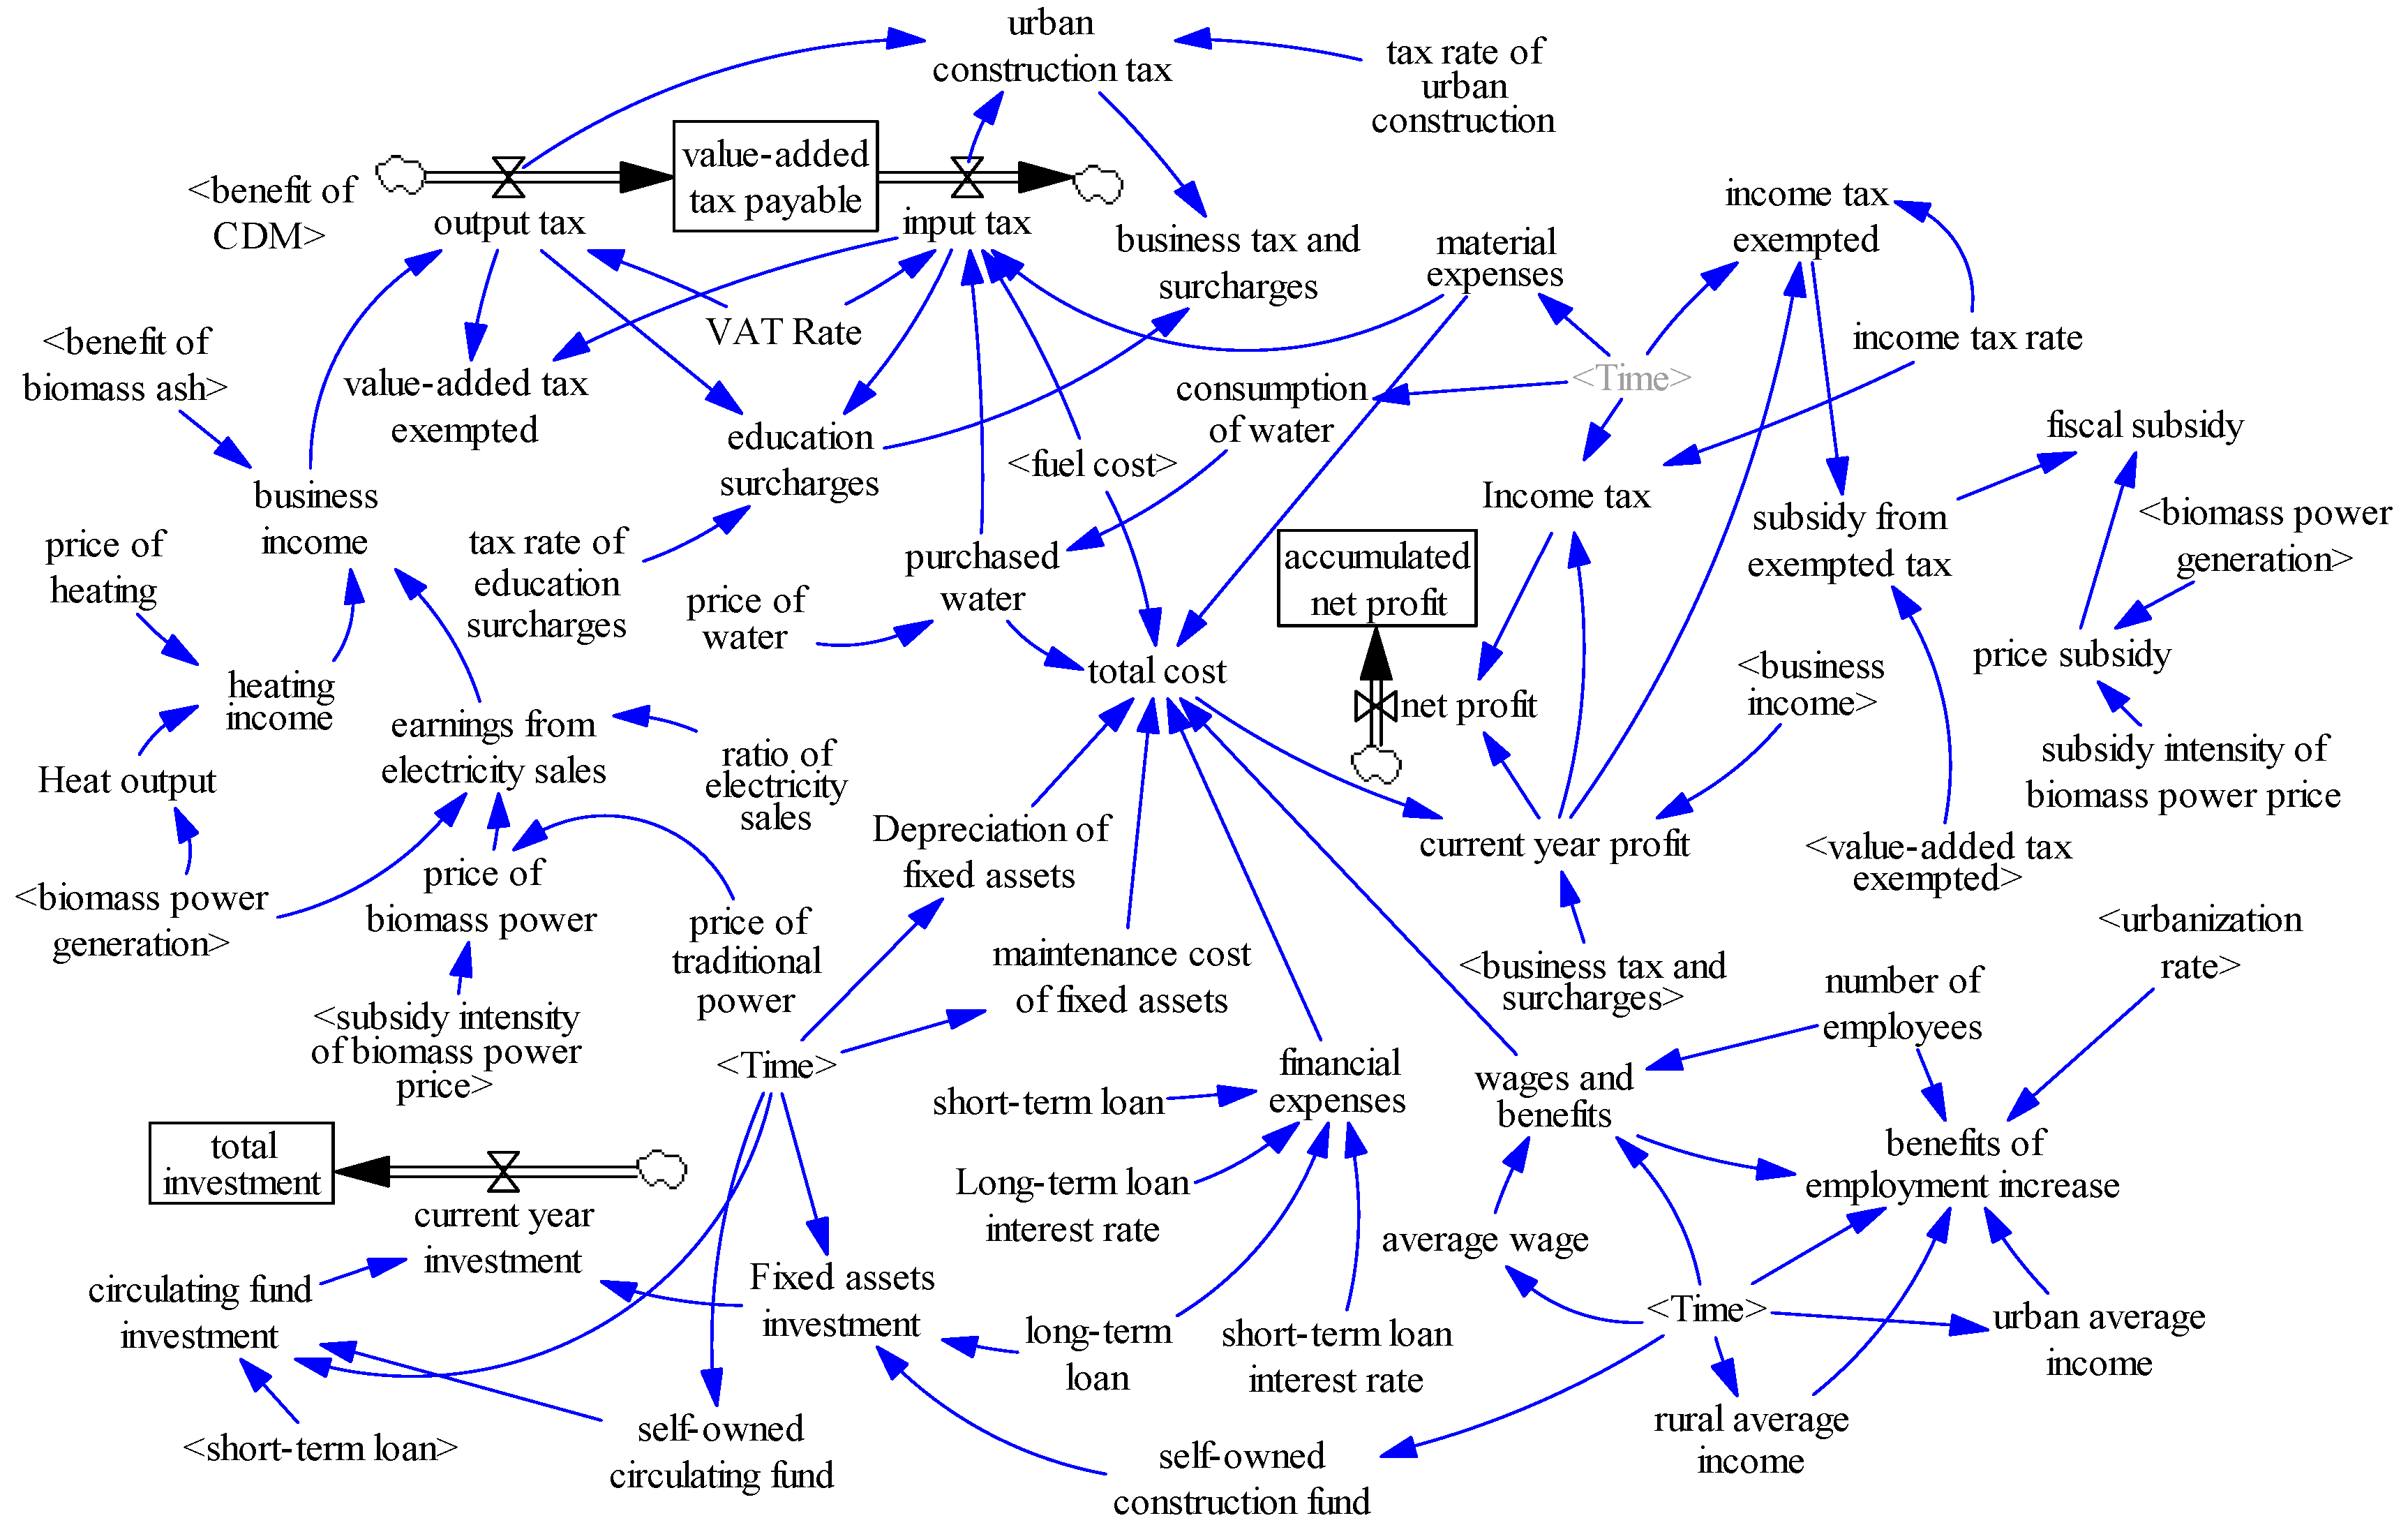
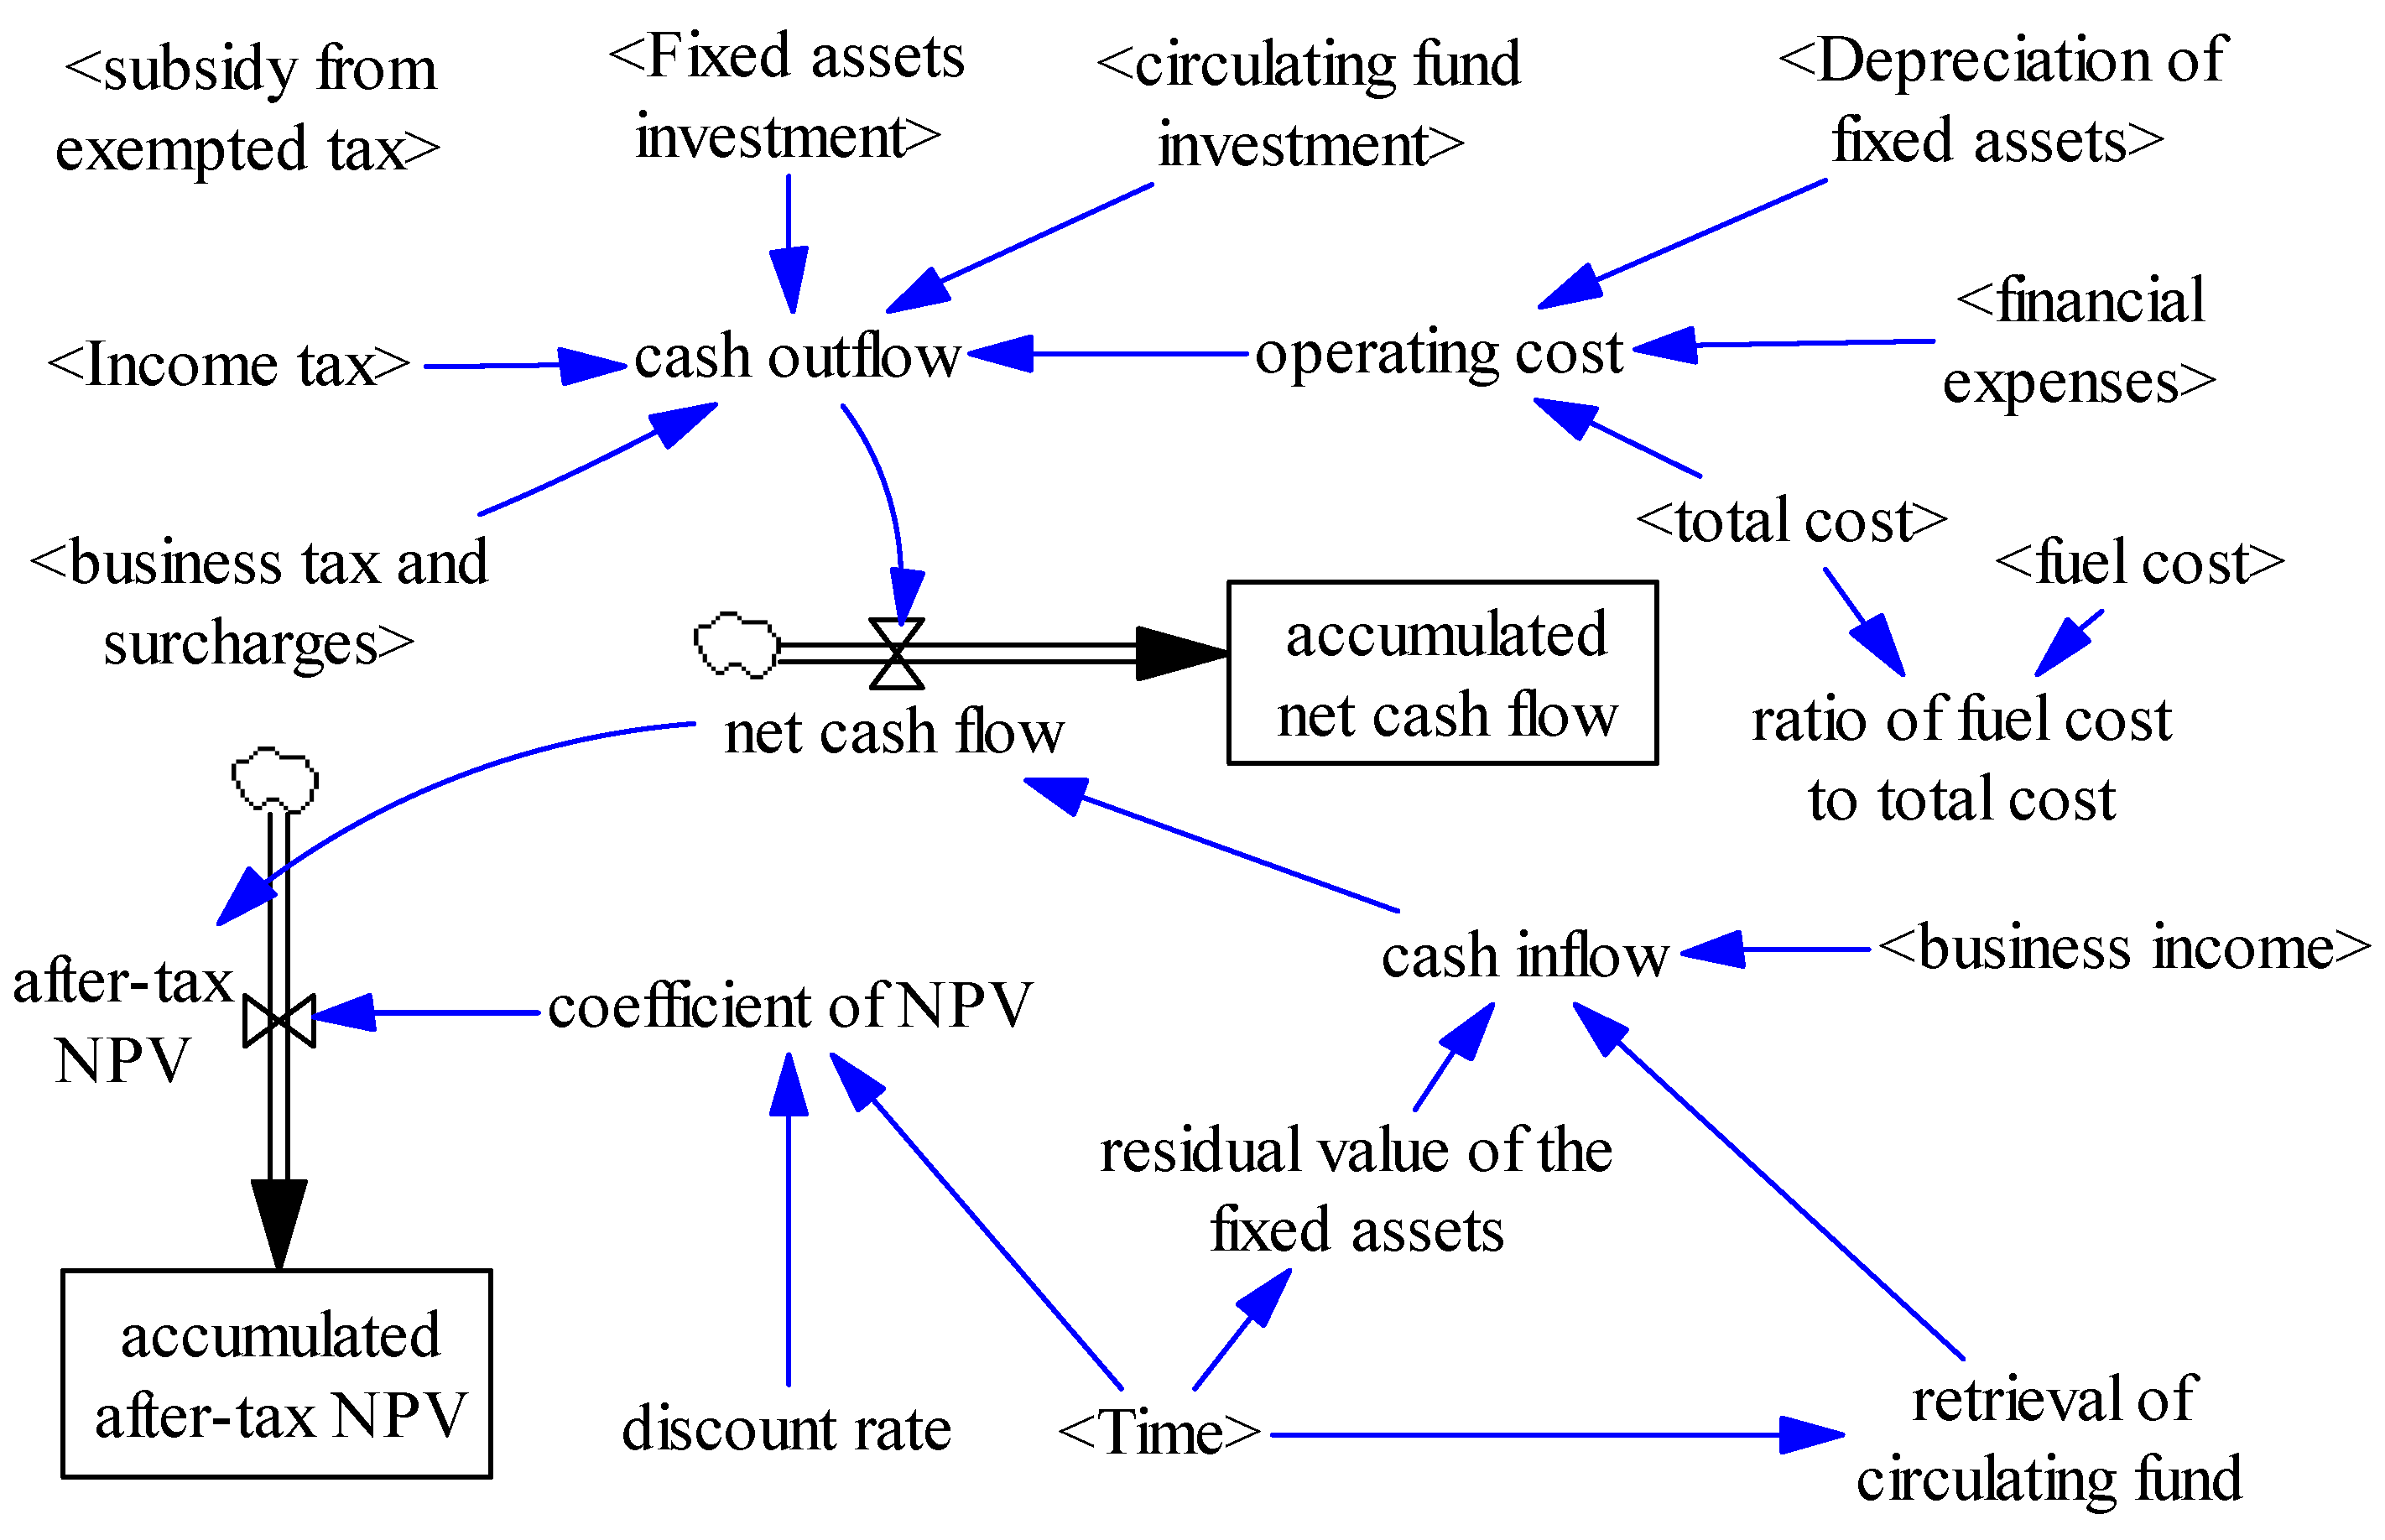
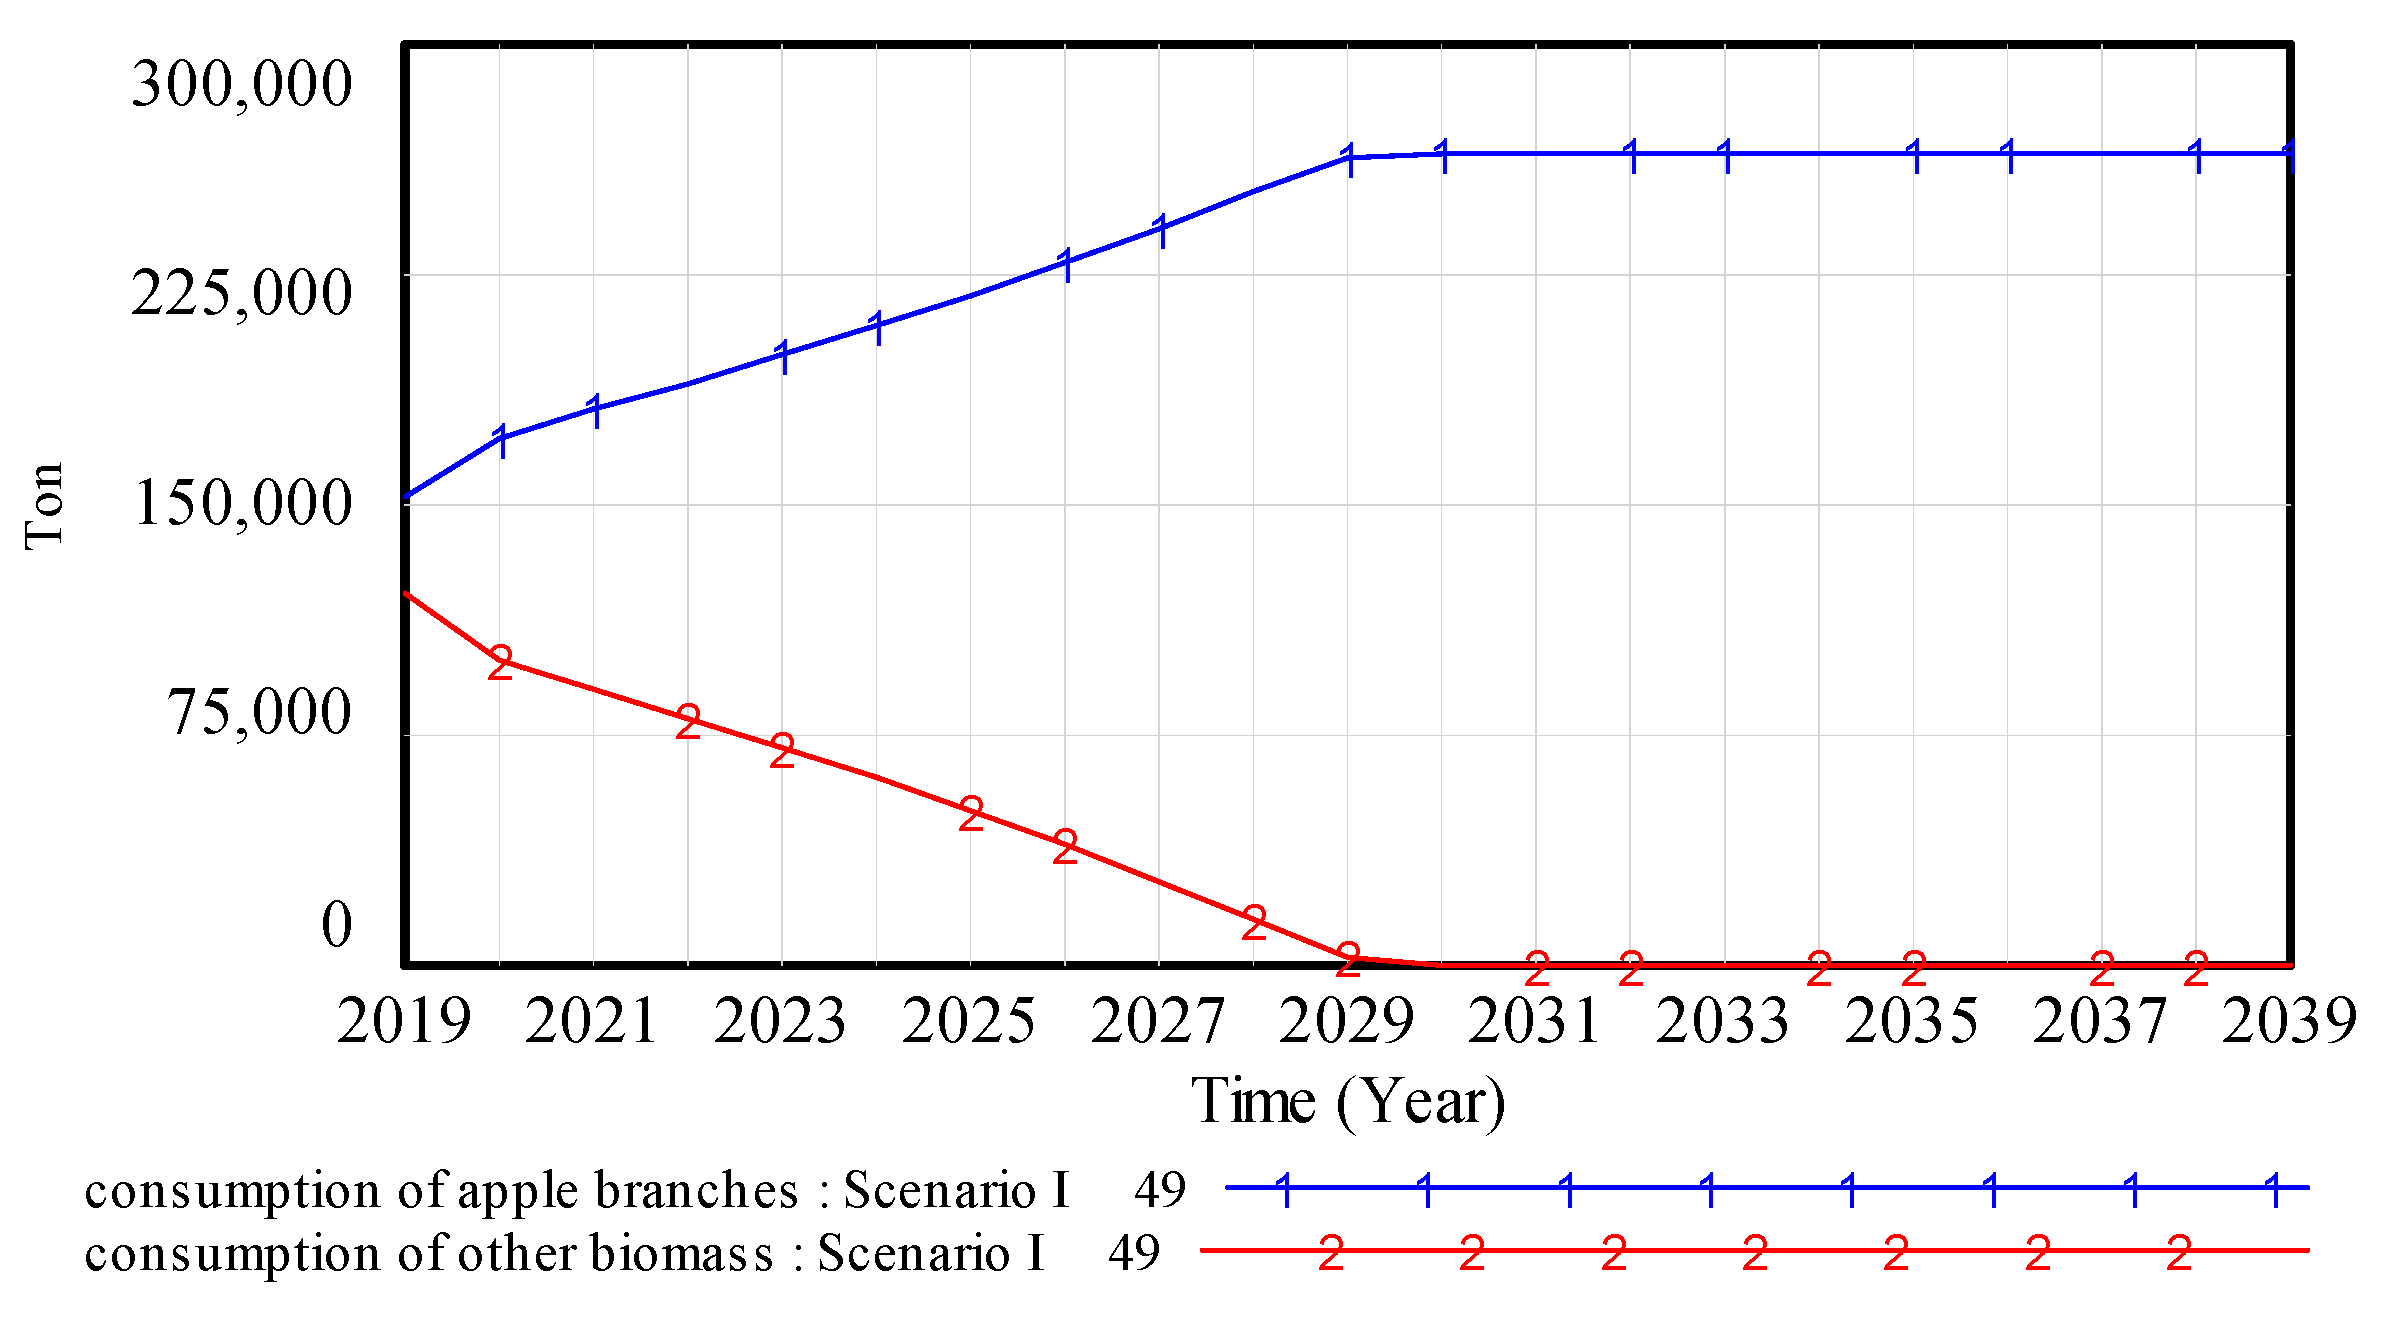
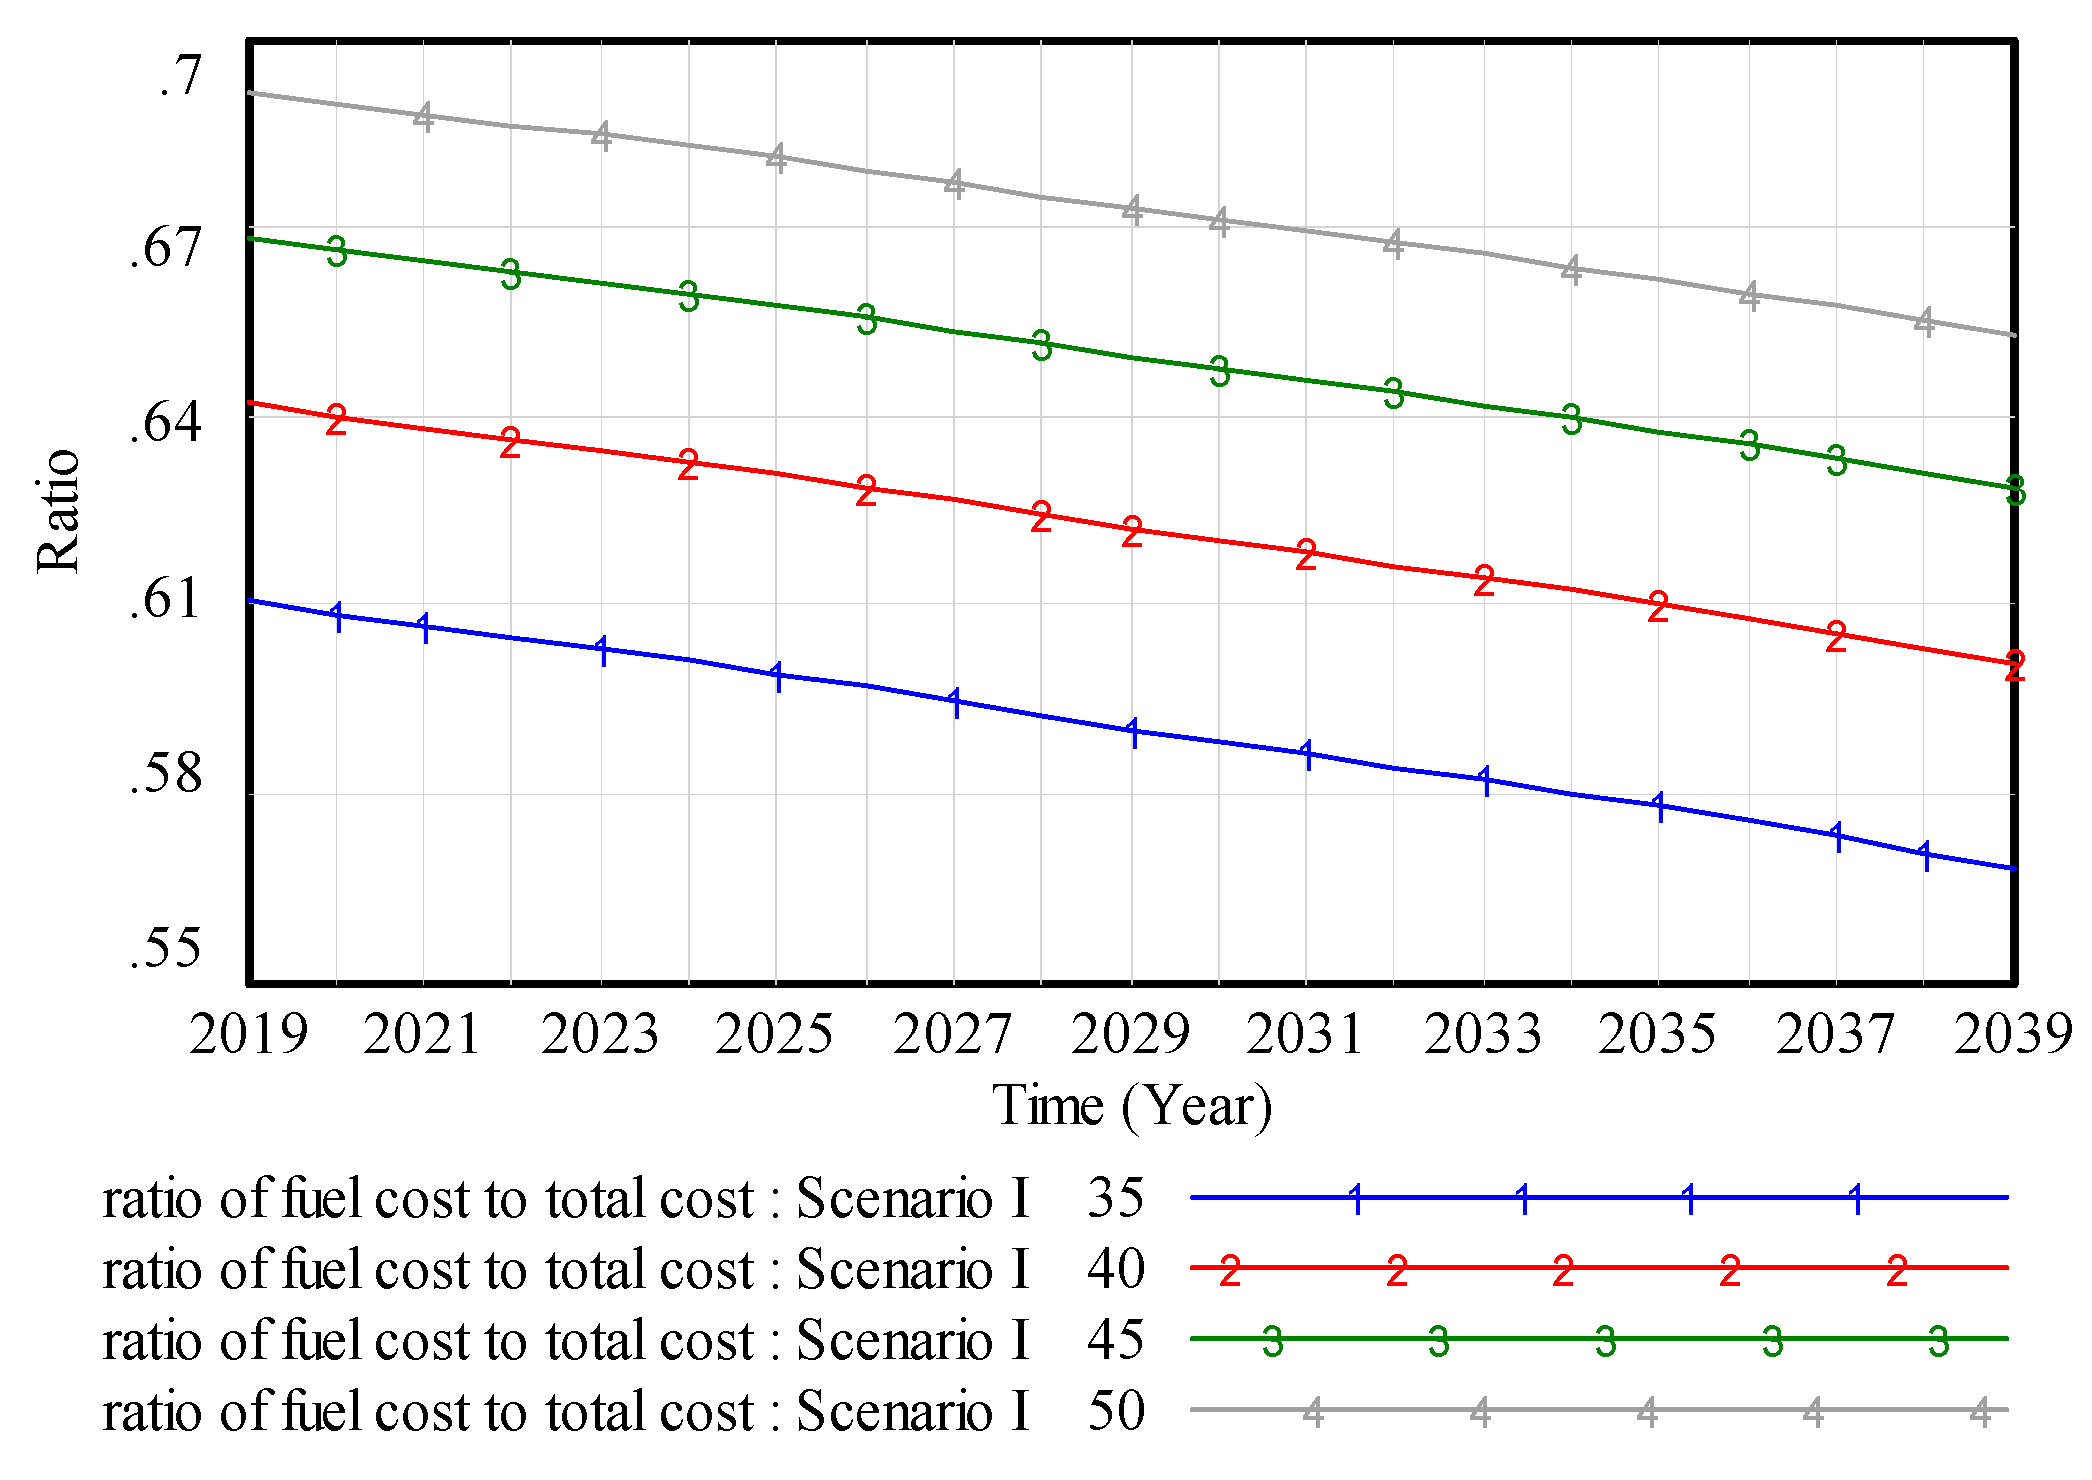
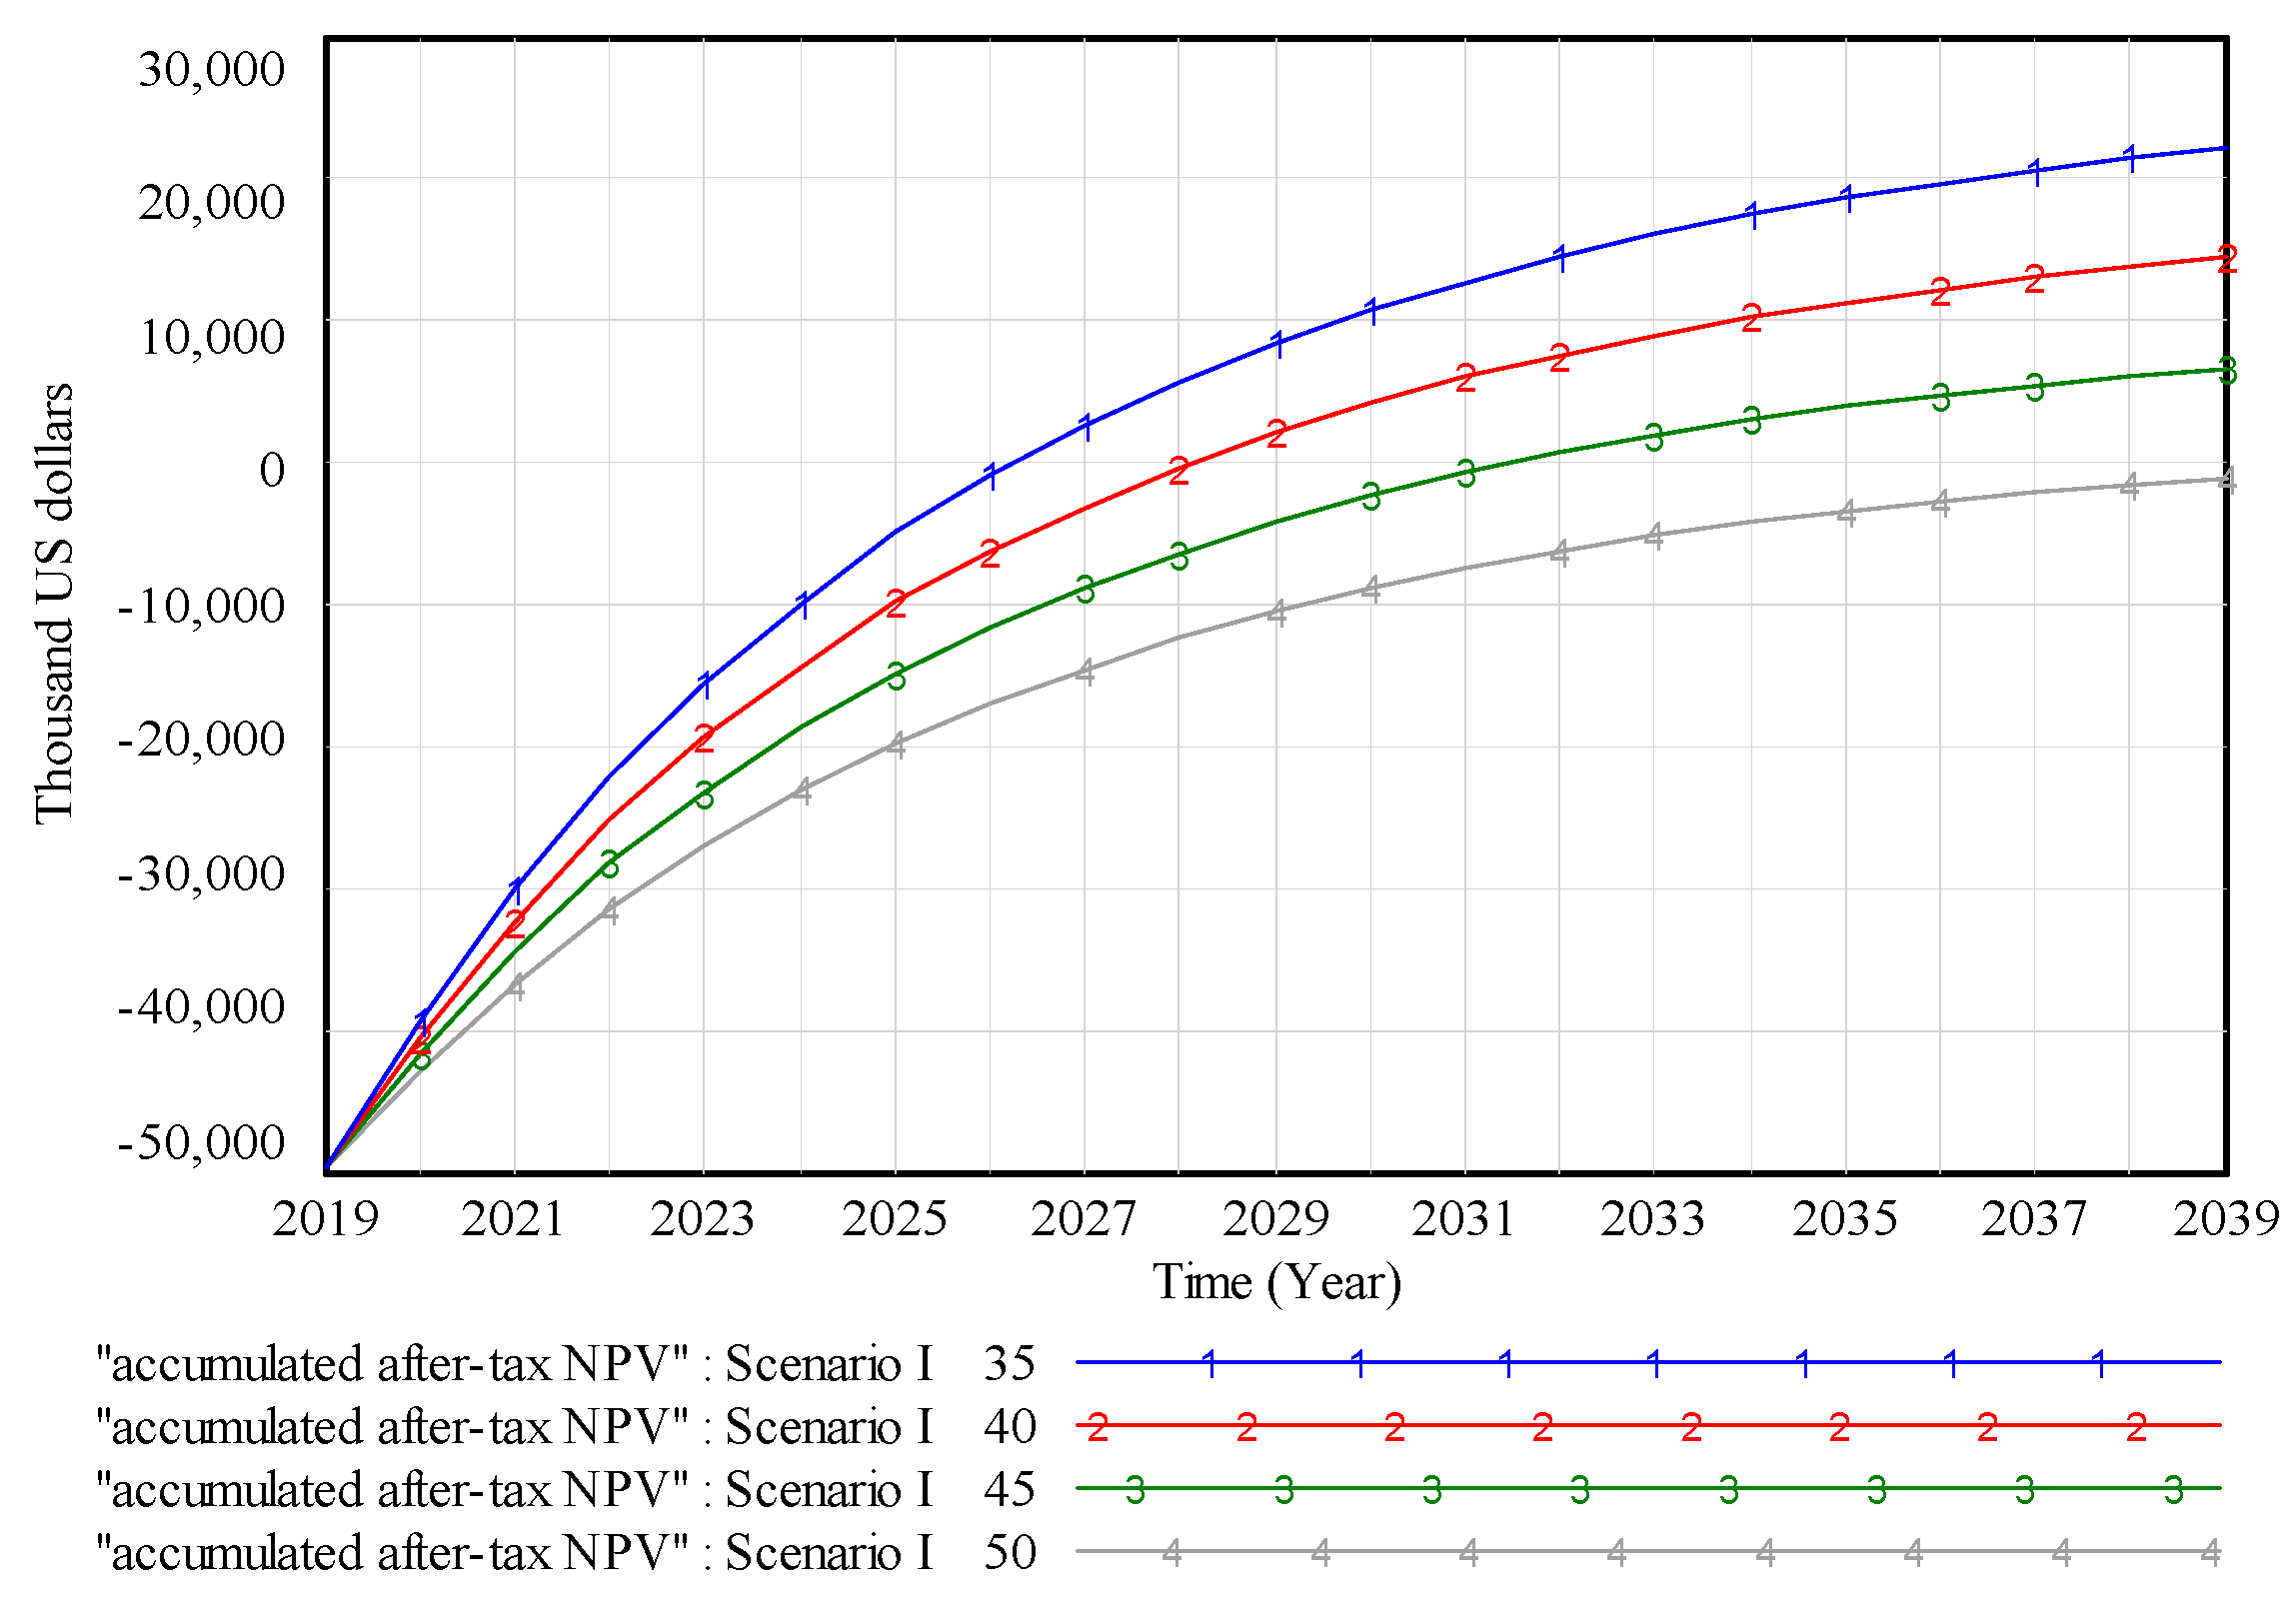
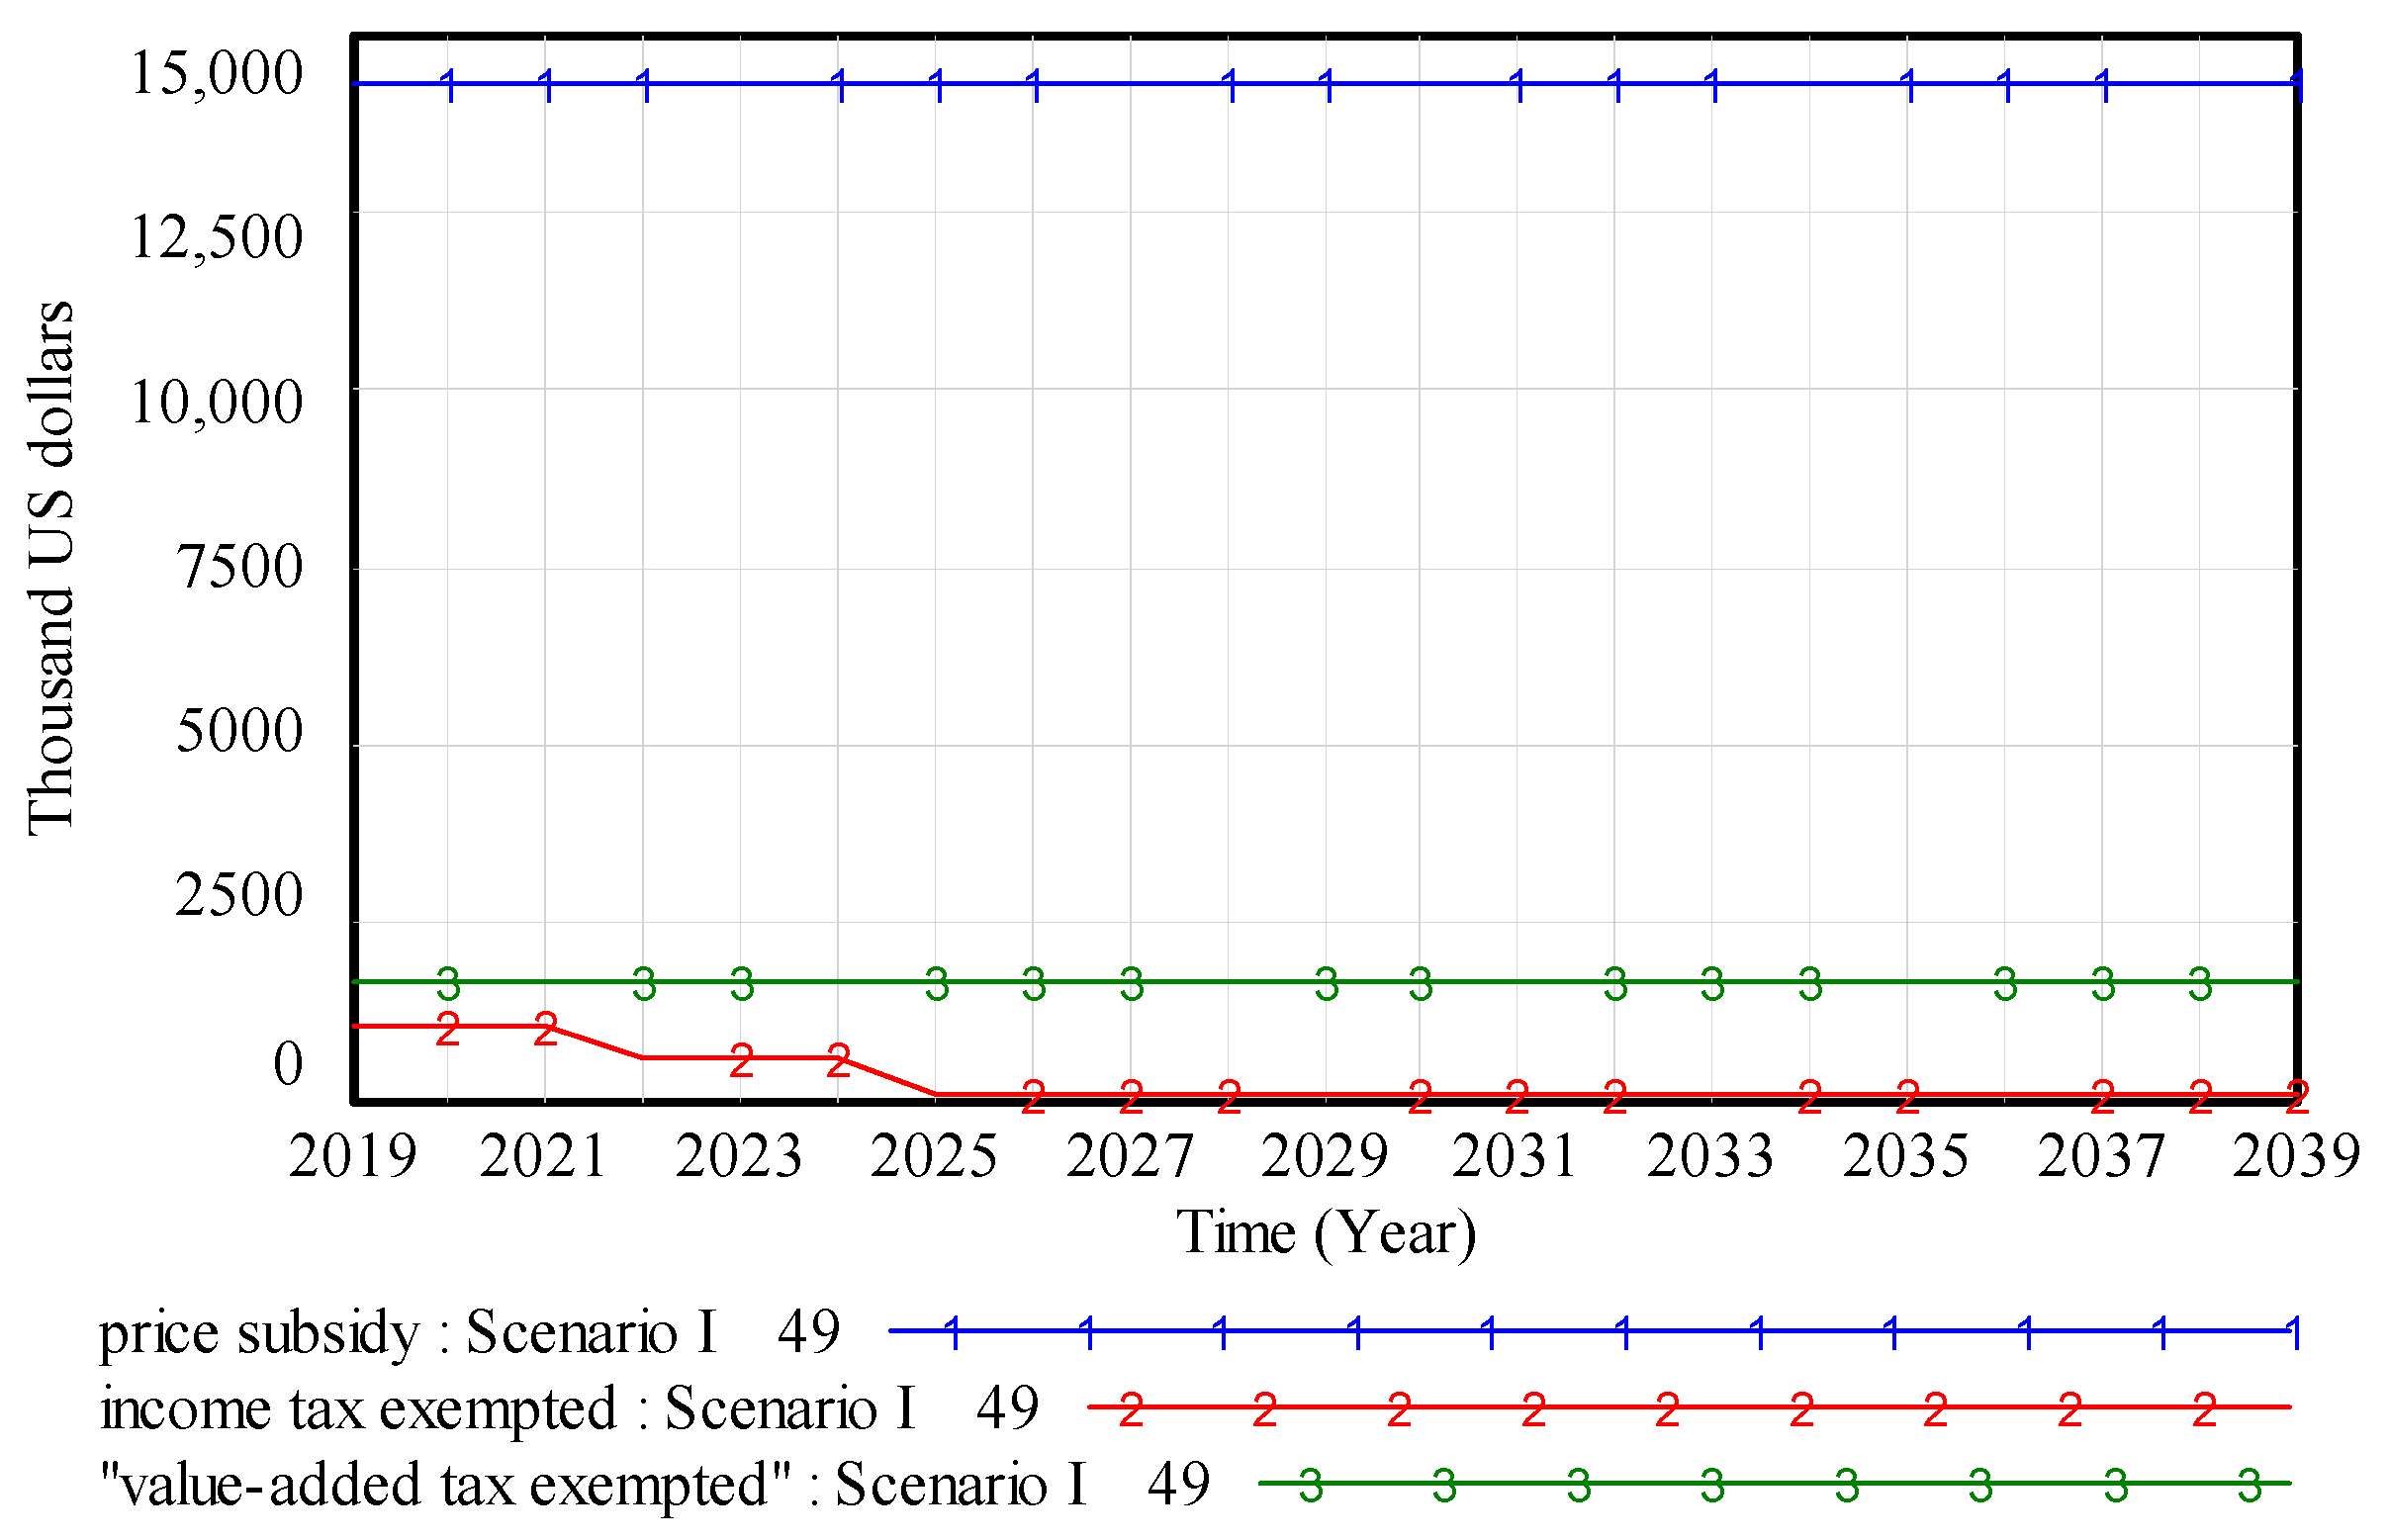
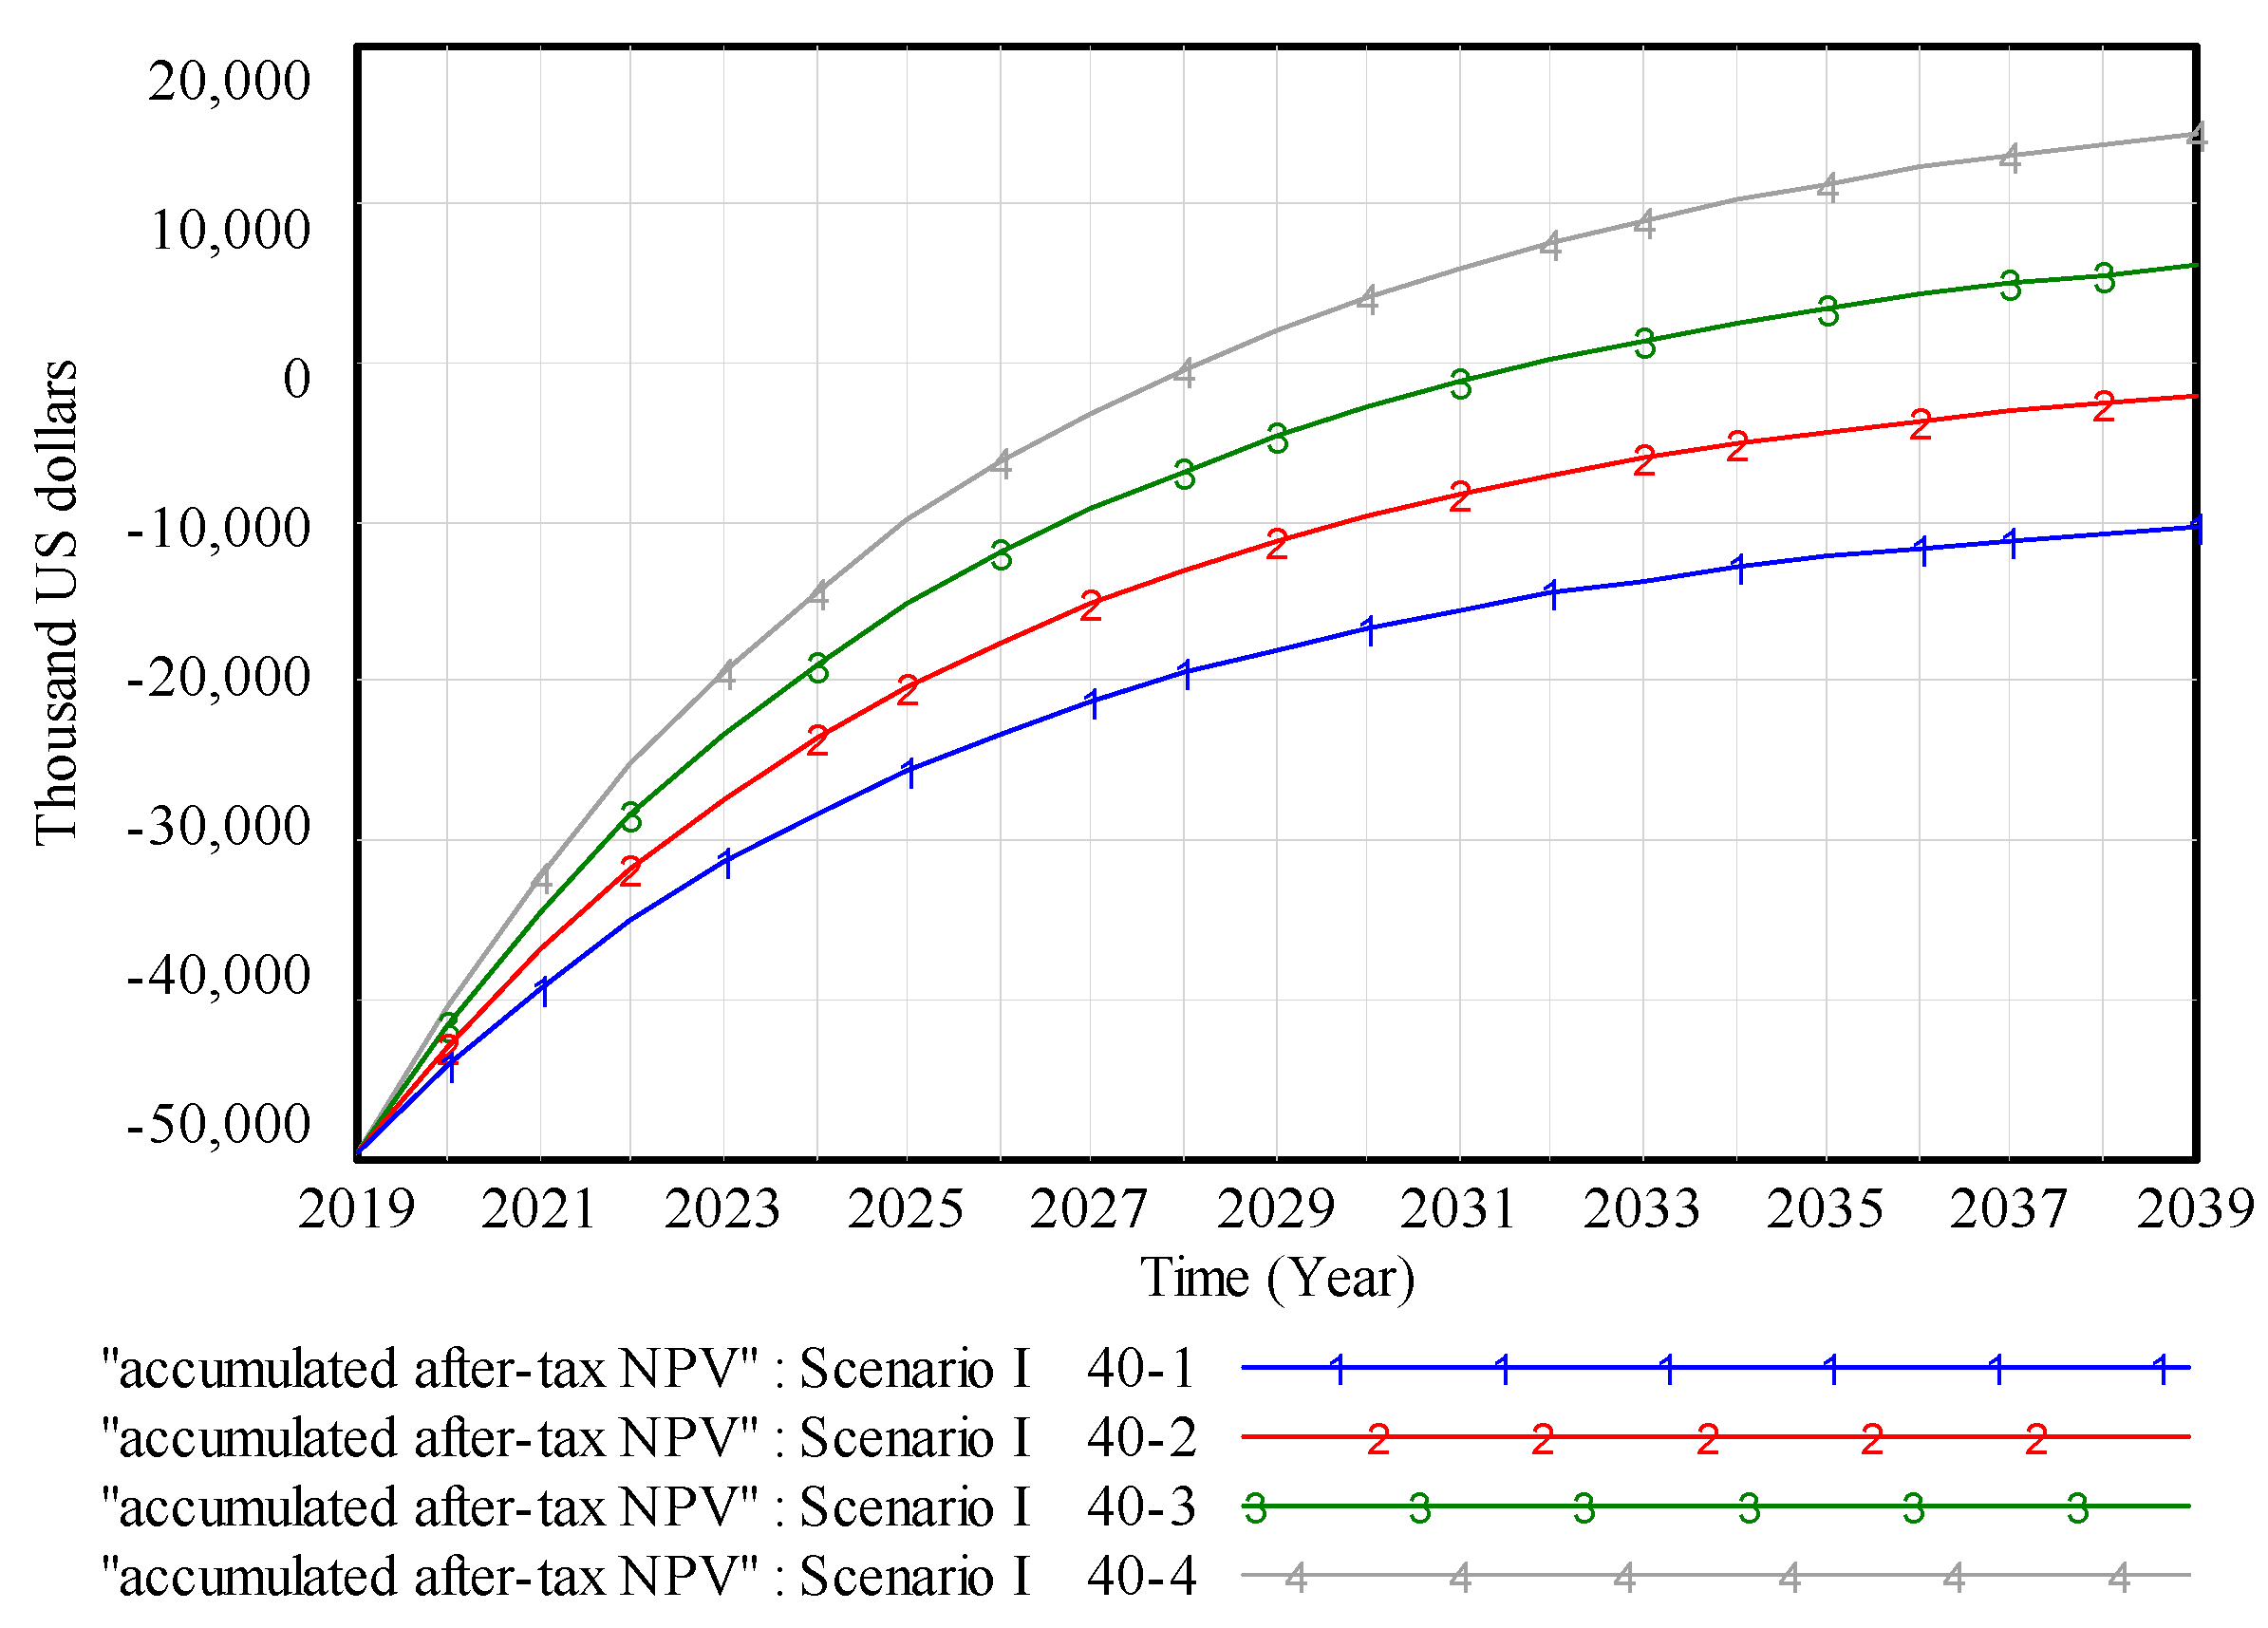
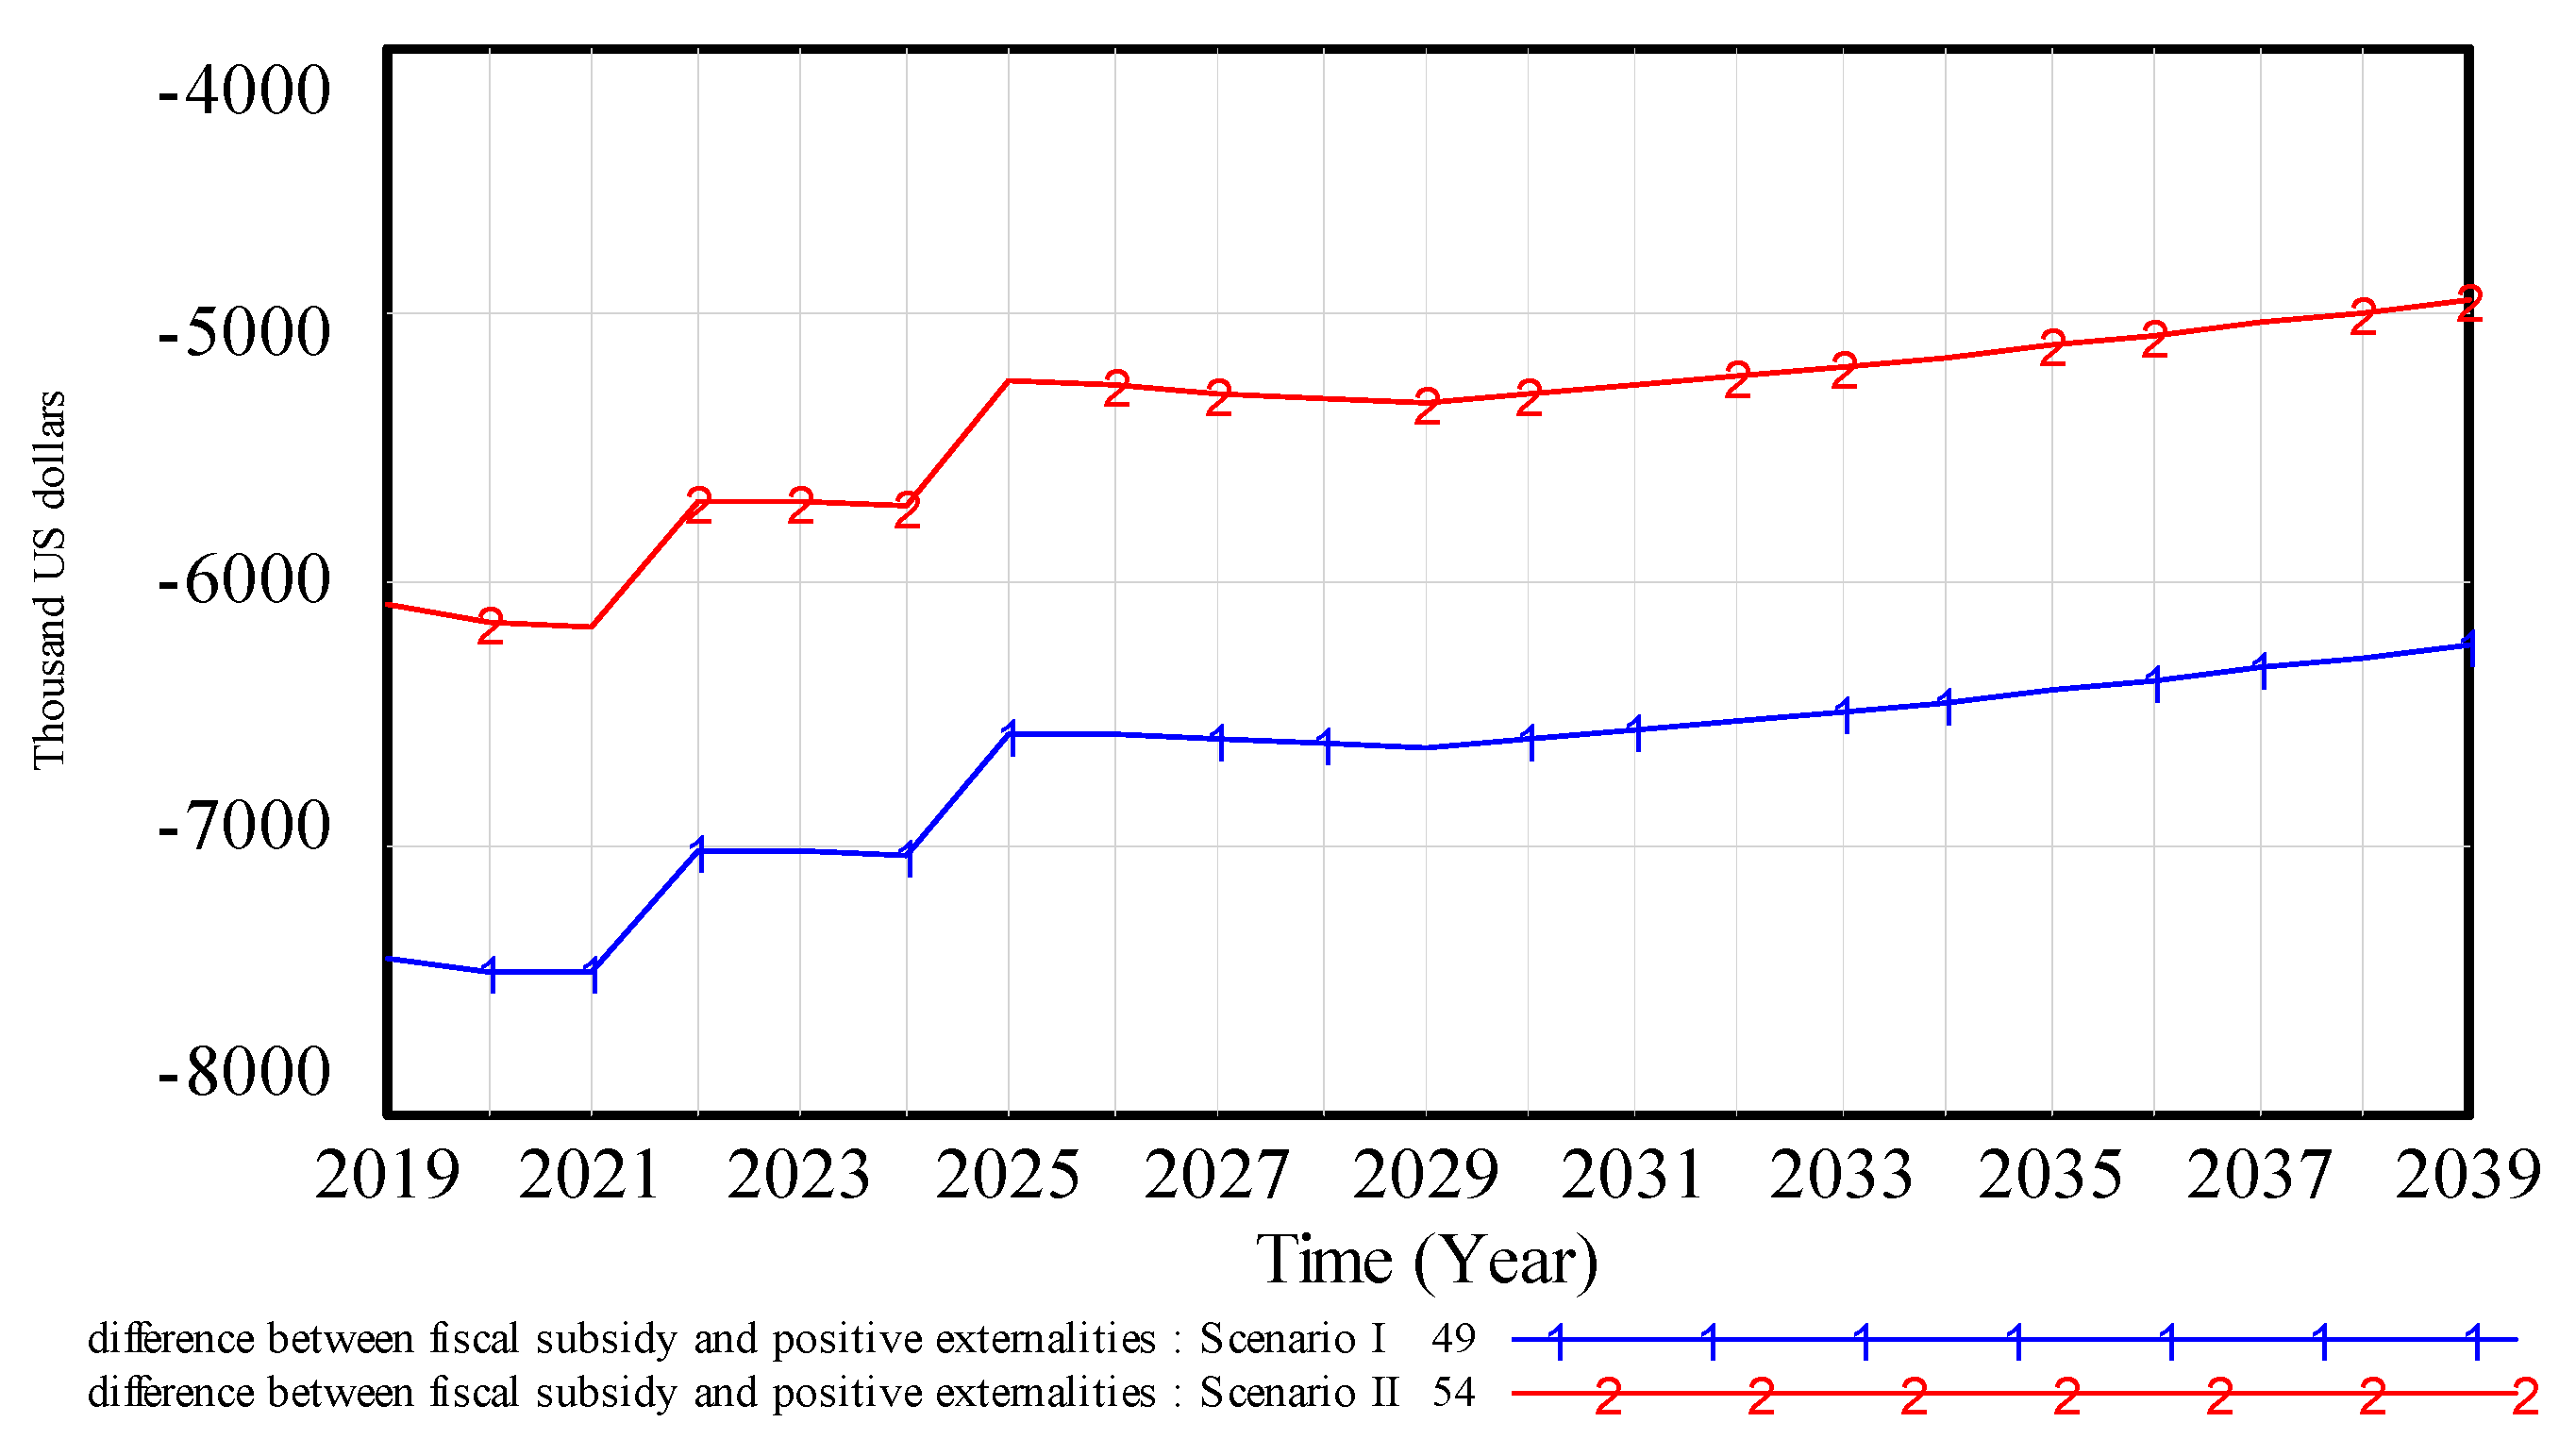
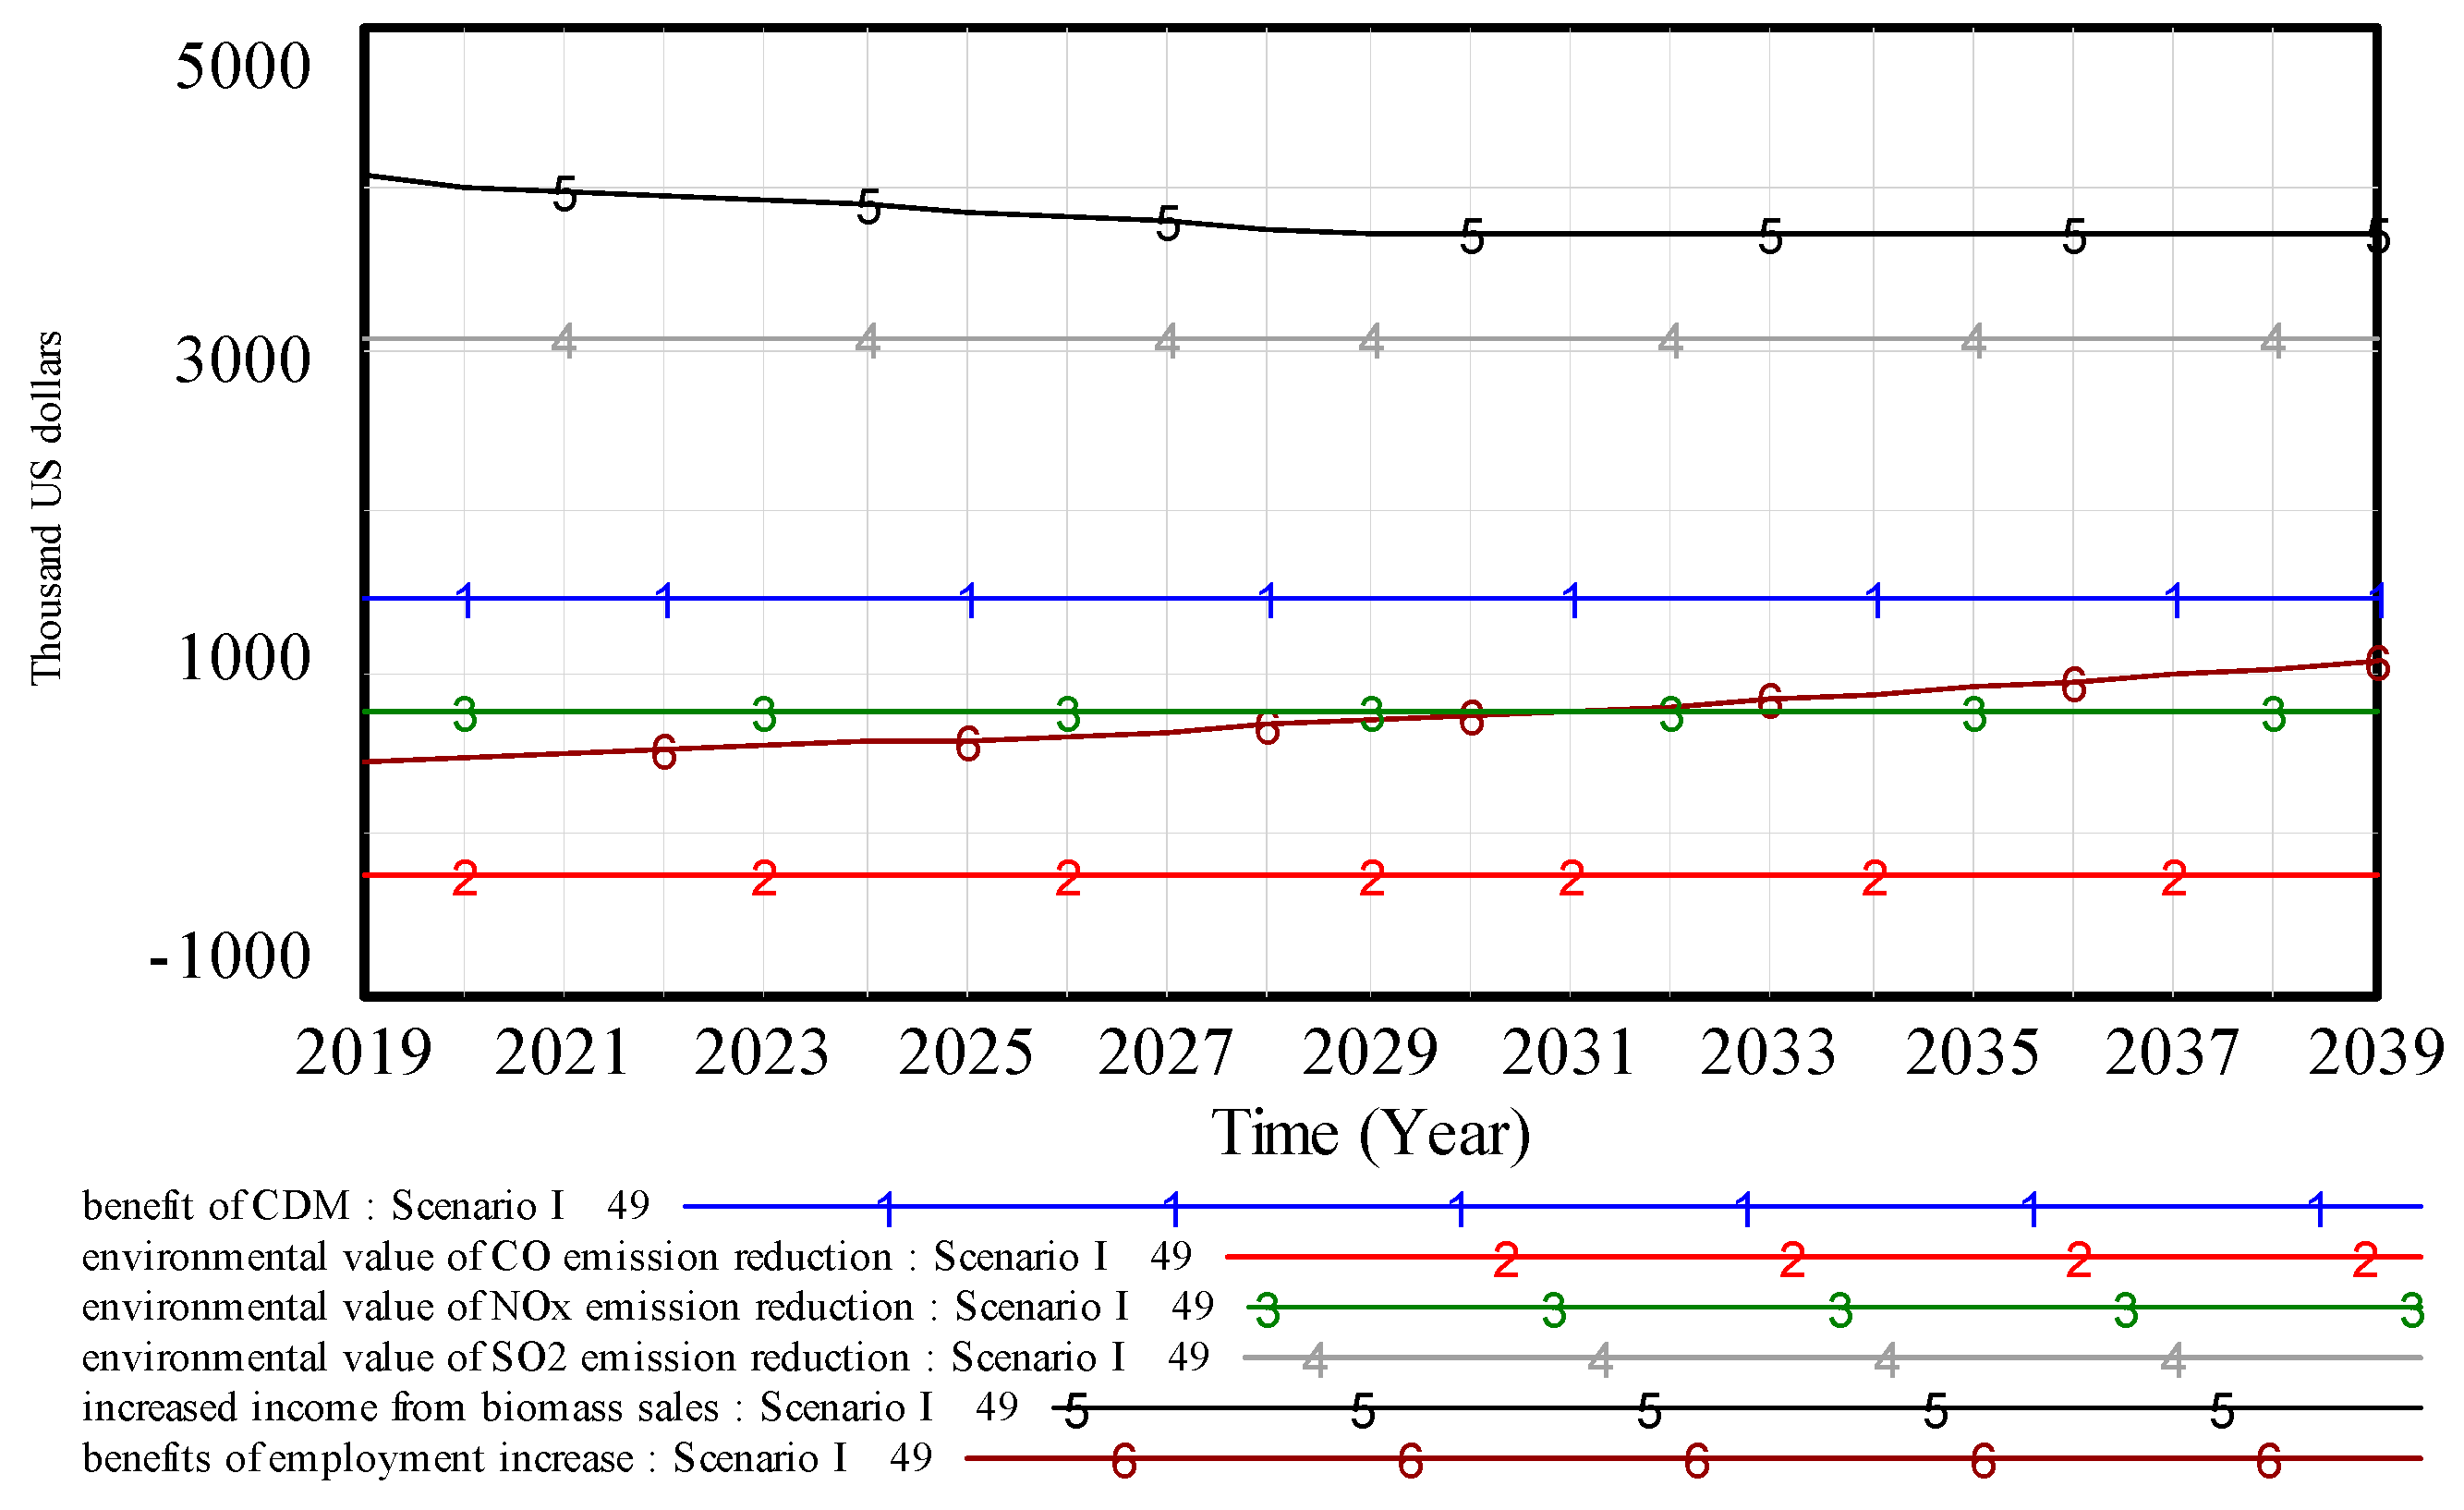
Table 1.
Comparison of heating values of apple tree branches with other biomass fuels.
| Index | Unit | Apple Tree Branches | Wheat Straw | Maize Straw | Reed |
|---|---|---|---|---|---|
| Dry weight heating value | MJ/kg | 17.78 | 16.89 | 16.56 | 17.22 |
| Ash content | % | 2.47 | 4.21 | 6.07 | 7.89 |
| Ash-free heating value | MJ/kg | 18.23 | 17.63 | 17.63 | 18.72 |
Table 2.
Several scenarios for the operation of a biomass power plant.
| Index | Scenario | |||||
|---|---|---|---|---|---|---|
| I | II | III | IV | V | VI | |
| Price of biomass fuel (US$/ton) | variable | variable | variable | variable | variable | variable |
| Price of biomass power (US$/kWh) | 0.1133 | 0.1133 | 0.0453 | 0.0453 | 0.0453 | 0.0453 |
| CDM | no | yes | no | yes | yes | no |
| Support policy | yes | yes | yes | yes | no | no |
Table 3.
Specifications of the boiler and turbine of the 30 MW plant.
| Item | Value | Unit |
|---|---|---|
| Boiler capacity | 130 | t/h |
| Capacity of the turbine | 30 | MW |
| Steam requirement as per manufacturer | 3.8 | t/MWh |
| Steam required for full capacity (30 MW) | 114 | t/h |
| Pressure of steam | 93 | bar |
| Temperature of steam | 540 | °C |
| Heat required to produce 1 ton of steam at 93 bar and 540 °C | 2.34 | GJ/t |
| Boiler efficiency | 92 | % |
| Hours of operation | 7000 | h/y |
Table 4.
Emission factors of several fuels [52].
Table 4.
Emission factors of several fuels [52].
| Fuels | Emission Factors (Unit: t/MWh) | |||
|---|---|---|---|---|
| CO2 | SO2 | NOX | CO | |
| Coal | 1.1800 | 0.0190 | 0.0052 | 0.0002 |
| Petroleum oil | 0.8500 | 0.0164 | 0.0025 | 0.0002 |
| Natural gas | 0.5300 | 0.0005 | 0.0009 | 0.0005 |
| Renewable | 0 | 0 | 0 | 0 |
Table 5.
Chinese energy consumption share in 2015 (unit: %).
| Country | Coal Power | Petroleum Power | Gas Power | Renewable Power |
|---|---|---|---|---|
| China | 64 | 18.1 | 5.9 | 12 |
Table 6.
Emission factors (EF) of diesel vehicles.
| Pollutant | Unit | Emissions Standards | EFt | |
|---|---|---|---|---|
| Diesel Light-Duty Vehicles (Average Mass Lower Than 3.5 t) | Diesel Heavy-Duty Vehicles (Average Mass Higher Than 12 t) | |||
| CO2 | t/km | EU III | 0.356 × 10⁻³ | 0.932 × 10⁻³ |
| NOX | t/km | EU III | 1.400 × 10⁻⁶ | 8.400 × 10⁻⁶ |
| CO | t/km | EU III | 0.700 × 10⁻⁶ | 2.600 × 10⁻⁶ |
| SO2 | t/km | EU III | 0.100 × 10⁻⁶ | 0.300 × 10⁻⁶ |
Data source: Determination of emission factors from motor vehicles under different emission standards in China [55].
Table 7.
Conditions that make the project economically feasible.
| Index | Scenario | |||||
|---|---|---|---|---|---|---|
| I | II | III | IV | V | VI | |
| Price of biomass (US$/ton) | 49.2 | 54.7 | 1.3 | 6.8 | −7.5 | −13.0 |
| PBP (year) | 7.4 | 7.4 | 7.3 | 7.3 | 7.5 | 7.5 |
| IRR (%) | 14 | 14 | 14 | 14 | 14 | 14 |
| NPV in 2039 (103 US$) | 174.1 | 78.1 | 190.5 | 94.5 | 38.3 | 95.8 |
Table 8.
Two scenarios that can generate a higher economic efficiency.
| Index | Scenario I | Scenario II | ||||
|---|---|---|---|---|---|---|
| Price of biomass (US dollars/ton) | 30.2 | 37.8 | 45.3 | 30.2 | 45.3 | 52.9 |
| PBP (year) | 4.8 | 5.6 | 6.6 | 4.4 | 5.8 | 7.0 |
| IRR (%) | 14 | 14 | 14 | 14 | 14 | 14 |
| NPV (103 US$) | 29,505 | 17,773 | 6195 | 37,900 | 14,589 | 2857 |
Table 9.
The reasonable governmental price subsidy intensity.
| Indicators | Biomass Price (US$/Ton) | ||
|---|---|---|---|
| 35 | 40 | 45 | |
| Subsidy intensity (US$/kWh) | 0.0477 | 0.0548 | 0.0619 |
| Accumulated after-tax NPV (103 US$) | 25.297 | 25.649 | 25.978 |
| Accumulated difference between fiscal subsidy and positive externalities (103 US$) | −161,026 | −194,200 | −227,373 |
Table 10.
Parameters that make the biomass power generation project economically feasible. (Equations and Parameters shows in Supplementary Materials).
Table 10.
Parameters that make the biomass power generation project economically feasible. (Equations and Parameters shows in Supplementary Materials).
| Indicators | Biomass Price (US$/Ton) | ||
|---|---|---|---|
| 35 | 40 | 45 | |
| Price of CO2 (US$) | 14.74 | 15.00 | 15.21 |
| Price of CO (US$) | 335.84 | 340.90 | 345.72 |
| Price of NOx (US$) | 2687.99 | 2727.22 | 2765.74 |
| Price of SO2 (US$) | 2154.49 | 2181.78 | 2212.60 |
| Subsidy intensity (US$/kWh) | 0.0477 | 0.0548 | 0.0619 |
| Accumulated after-tax NPV (103 US$) | 25.297 | 25.649 | 25.978 |
| Accumulated difference between fiscal subsidy and positive externalities in 2039 (103 US$) | −15.8525 | −7.2754 | 5.2422 |
© 2019 by the authors. Licensee MDPI, Basel, Switzerland. This article is an open access article distributed under the terms and conditions of the Creative Commons Attribution (CC BY) license (http://creativecommons.org/licenses/by/4.0/).
Share and Cite
MDPI and ACS Style
Yu, H.; Yan, Y.; Dong, S. A System Dynamics Model to Assess the Effectiveness of Governmental Support Policies for Renewable Electricity. Sustainability 2019, 11, 3426. https://0-doi-org.brum.beds.ac.uk/10.3390/su11123426
AMA Style
Yu H, Yan Y, Dong S. A System Dynamics Model to Assess the Effectiveness of Governmental Support Policies for Renewable Electricity. Sustainability. 2019; 11(12):3426. https://0-doi-org.brum.beds.ac.uk/10.3390/su11123426
Chicago/Turabian StyleYu, Huilu, Youning Yan, and Suocheng Dong. 2019. "A System Dynamics Model to Assess the Effectiveness of Governmental Support Policies for Renewable Electricity" Sustainability 11, no. 12: 3426. https://0-doi-org.brum.beds.ac.uk/10.3390/su11123426
Note that from the first issue of 2016, this journal uses article numbers instead of page numbers. See further details here.