A Methodology of Partner Selection for Sustainable Industry-University Cooperation Based on LDA Topic Model

1
Department of Industrial Management Engineering, Korea University, Seoul 02841, Korea
2
Division of Software Convergence, Cheongju University, Chungbuk 28503, Korea
*
Author to whom correspondence should be addressed.
Sustainability 2019, 11(12), 3478; https://0-doi-org.brum.beds.ac.uk/10.3390/su11123478
Submission received: 25 May 2019
/
Revised: 18 June 2019
/
Accepted: 21 June 2019
/
Published: 25 June 2019
(This article belongs to the Section Economic and Business Aspects of Sustainability)
Abstract
:In today’s knowledge-based society, industry-university cooperation (IUC) is recognized as an effective tool for technological innovation. Many studies have shown that selecting the right partner is essential to the success of the IUC. Although there have been a lot of studies on the criteria for selecting a suitable partner for IUC or strategic alliances, there has been a problem of making decisions depending on the qualitative judgment of experts or staff. While related works using patent analysis enabled the quantitative analysis and comparison of potential research partners, they overlooked the fact that there are several sub-technologies in one specific technology domain and that the applicant’s research concentration and competency are not the same for every sub-technology. This study suggests a systematic methodology that combines the Latent Dirichlet Allocation (LDA) topic model and the clustering algorithm in order to classify the sub-technology categories of a particular technology domain, and identifies the best college partners in each category. In addition, a similar-patent density (SPD) index was proposed and utilized for an objective comparison of potential university partners. In order to investigate the practical applicability of the proposed methodology, we conducted experiments using real patent data on the electric vehicle domain obtained from the Korean Intellectual Property Office. As a result, we identified 10 research and development sectors wherein Hyundai Motor Company (HMC) focuses using LDA and clustering. The universities with the highest values of SPD for each sector were chosen to be the most suitable partners of HMC for collaborative research.
1. Introduction
In modern society, knowledge and technology play key roles in promoting national development and economic growth. It is natural that the competition between companies for the prior occupation of superior technologies has been intensifying. In this highly industrialized society, technological innovations for sustainable development are essential for businesses to compete in global markets. However, as technology becomes more complex, it is so difficult for a company to achieve innovation through its individual effort alone because it does not have all the needed skills and capabilities [1].
Industry-university cooperation (IUC), a form of open innovation, has gained much attention as an effective alternative to bring about technological innovation and growth [2,3,4,5,6]. In the past, companies have tended to perceive the relationships with universities as sponsorships that provided basic knowledge or specific problem solving in return for funding [7]. On the other hand, in today’s knowledge-based economy, corporate recognition of universities has turned into partnership that enables the long-term exchange of new ideas and innovation capabilities, as well as complementary expertise [7,8]. Nowadays, a variety of industry-university cooperation (IUC) activities such as joint research and development (R&D), education and training, production support, knowledge or technology transfer, and the exchange of human resources and information, etc. have been carried out [9].
Industry-university cooperation (IUC) is well known for its potential to yield mutual benefits [10]. In cooperation with universities, companies can acquire and utilize basic and original technologies that are difficult to develop by themselves. Firms can also strengthen their competitiveness by entering into technology transfer agreements with universities or hiring competent human resources from universities. University researchers can also take advantage of corporate funding to gain a stable research opportunity. IUC is a good chance for them to produce visible results by applying knowledge accumulated through research. Interaction with corporate practitioners enriches the experience of university researchers and can lead to employment at times. Because of the advantages mentioned above, governments of major countries have made a lot of efforts to promote IUC.
Industry-university cooperation has been a popular research topic for decades. The mainstream of the research has attempted to identify factors having a significant effect on the performance of IUC and to classify them into several categories [11,12,13,14,15]. For example, Cederholm (2015) classified the success factors of IUC with the following categories; contextual factors, organizational factors, and process factors. The contextual factors include selecting partners, geographical proximity, and objectives. The organizational factors are formalization and agreement, commitment, and resources and skills. The process factors contain management skills, communication, and relationships and trust [14]. Meanwhile, Rybnicek and Konigsgruber (2018) practiced a systematic review of the literature on the factors affecting IUC and presented the significant factors in four categories, namely institutional factors, relationship factors, output factors, and framework factors [15]. Although the categories for classification differ from one scholar to another, but the basic factors included in them are usually in common. This kind of research contributed to recognizing the factors influencing the result of IUC or other types of strategic alliance, which gave us deeper understanding on which factors we should carefully consider when coordinating IUC and what are probably more important than others.
Partner selection, together with other factors, has been identified as an important determinant of the success of IUC. Lambe and Spekman (1997) emphasized that the success of an alliance is largely dependent on smart partner selection. It was also pointed out that poor partner selection might have harmful effects on the alliance. Because potential partners have different interests and capabilities, it is crucial to choose whom to collaborate with when initiating collaborations [14,16,17,18]. There are several criteria of selecting partners to cooperate with presented by previous research. Thune (2011) and Barnes et al. (2002) stressed the openness of the firm that means whether a company is willing to share information, technology and expertise with its partners [14,17,19]. Reputation can also be a criterion for partner selection [14,19] as companies prefer a university with competent and experienced senior researchers. In addition, if the whole organization of the potential partner has stability and the culture fit within the project should be considered [14,17]. It is clear that these criteria help us to select partners in coordinating IUC. However, evaluating and comparing the overall attributes of potential partners is difficult and time-consuming. The lack of a systematic methodology for selecting cooperation partners, except for the qualitative criteria mentioned above, is a limitation of previous studies.
Likewise, in carrying out research and development (R&D) collaboration, the proper partner selection is recognized as a core factor affecting its performance [20,21]. A number of corporate managers pay attention to universities as the partners of joint R&D [22]. However, it is a problem that the existing process of seeking R&D partners has been based on expert opinions, human relationships, online communities, etc. [21,23]. Not only with respect to time and efforts, these methods have several limitations that the source of information is very limited in scope and the result is probably dependent on the qualitative judgement of experts [21,23,24]. Despite many previous studies, we still have questions about identifying and determining a partner for joint R&D, such as “Where can we get information about potential partners?” and “How can we find a certain appropriate partner compared to others?” These are the research questions we focus on in this study.
To overcome this limitation and to answer the above-mentioned questions, an available source of information and a quantitative and systematic methodology for R&D partner selection are required. There are a few prior studies that used patent data to search potential partners to collaborate with. Patents are public documents where all related information is standardized and can be easily accessed through public and commercial databases [23]. Since most technology-intensive companies today apply for patent filings to protect the rights of their own invention, patent analysis allows us to evaluate and compare technologies owned by applicants in a particular domain. Patent data provide us not only bibliometric information like citation relationship between documents, but textual information about the detailed description of technologies. Thanks to the recent advancement in text mining techniques, it is possible for us to let a machine automatically distincguish the semantic differences between patent documents using various statistical methods. Therefore, it is reasonable to utilize patent data as a source of information for analyzing and comparing technologies owned by various applicants including companies, universities, and research institutes.
Thus, several previous studies used patent analysis as a way of selecting partners in IUC, especially for joint R&D. Jeon et al. (2011) estimated the textual similarity between a certain target patent and the others in a set of patent documents [23]. They presented the assignees of the patents with high cosine similarity to the target as potential partners for cooperation. This proposed method is advantageous in that it is easy for practitioners to apply and intuitively understand the result since it simply estimates the document similarities based on the co-occurrence of particular words. It assumes that if the frequencies of particular word combinations are similar, the subject of the document will be similar as well. However, since the subject of a document is usually expressed with varied words, it is risky to determine the topic of a document by the occurrence of specific words. In addition, companies and university applicants in general apply a number of patents to construct a portfolio, so it is difficult to judge the degree of technological similarity by a single document.
Park et al. (2015) proposed a systematic framework for exploring R&D partners using patent information based on technological similarity [21]. The study utilized bibliographic coupling analysis (BCA) to check the linkage of patentees based on patent bibliographic information. It also used latent semantic analysis (LSA) to evaluate the technological similarity based on textual information. It contributed to visualizing the relationship among different assignees by representing R&D collaboration state map and numerically evaluating semantic similarity of technologies between assignees by using the result of LSA. Compared to an approach that simply takes into account frequency of specific terms, LSA has the advantage of better reflecting the semantic differences of the text by analyzing the inherent topic structure of documents. However, there are still some shortcomings in this research. In general, global companies apply patent filings in various fields, so there might be a few categories in a specific domain of technology. Even though we carry out a patent analysis from a target domain, the researchers’ expertise and competence differ according to sub-fields in the domain. The existing method of partner selection has difficulty in reflecting the differences in research direction and competence among partner candidates at a sub-category level. In other words, we need a methodology that can recognize the various subordinate technologies that exist in one specific domain and suggest appropriate partners reflecting the differences in research direction among the candidates for each sub-technology.
Therefore, the main purpose of this study is to propose a new systematic methodology to suggest the most suitable partner for each R&D field that a certain company focuses on through quantitative evaluation using patent data. The research question we try to address here is “how can we find the best partners among the various candidates for the collaboration in the research field of a specific company?” Relative studies using patent data enabled objective and quantitative assessment of technological similarity and comparison at individual patent or applicant levels. However, the methodologies of the previous research based on term frequencies or the number of co-occurrences of words could not sufficiently reflect the semantic differences of patent documents. Although the methodology using LSA was improved in that it considered the differences in semantics, it is still unable to distinguish the subdivisions of a specific technology domain and identify the best partner in each of them. In order to overcome these limitations, we propose a systematic methodology of R&D partner selection for IUC based on patent analysis, which combined latent Dirichlet allocation (LDA) and a clustering algorithm. The LDA topic model is used to convert each patent document collected from a specific technology domain into a topic-based probability vector, and then we can classify the sub-technology automatically by clustering the patents positioned in the vector space. We also propose a numerical indicator of similar patent density (SPD) as a part of the methodology of optimal partner selection for R&D collaboration in IUC.
More specifically, the overall procedures of R&D partner selection in the proposed methodology are as follows. The first step is to choose a company and a target technology domain in which the joint research is to be conducted. Second, patents published or registered in a certain period of time in the target domain are required to be collected through a patent search in a database (DB). Third, the unstructured text data in the collected patents are preprocessed and transformed into a structured format. Fourth, an LDA model is applied to the structured data. When doing this, the number of appropriate topics should be determined according to quantitative indicators. In the process of applying the LDA, we construct a vector space based on the probability of appearance of each topic in the patent documents. As a result of this, each patent document is assigned a coordinate on the vector space with the number of topics as its dimension. Fifth, clustering is performed for a subset of patent data of a certain applicant. In this study, each patent cluster identified in the topic-based vector space is regarded as a subordinate technology that is included in a target domain, which is a distinction from the preceding research. For each patent cluster created herein, the central position, number of included patents, frequent topics, frequent terms, etc. can be understood and compared in detail. In the last step, for patents held by universities or research institutes, each of which is a candidate for joint research, a quantitative indicator called “similar-patent density” is calculated. This is an indicator that has been newly proposed in this study and is based on the distance (or similarity) at which each patent is located from each technology cluster. The value of the similar-patent density (SPD) can be used to automate the enterprise–university matching process. Let us assume that several sub-technologies are defined such that they represent each topic-based cluster identified above. It is possible to calculate the SPD of candidate universities from the center of each cluster. The higher the value of the SPD corresponding to a university, the closer its R&D domain is to the cluster considered as a sub-technology. That is, a university or research institute with the highest value of SPD for each sub-technology can be identified and chosen as the partner of joint research for the sub-technology.
The proposed methodology is designed to help the practitioners of enterprises who coordinate joint research with academia to identify and choose appropriate partners. It is expected to make it easier for companies to identify researchers who have sufficient competence and experience in a target domain in which they compete. Compared to the existing methodologies using patent analysis, it is a contribution of the proposed methodology that it can automatically classify the sub-technologies of a specific technology domain and then identify the optimal partner for each based on the quantitative index named SPD. The combination of the LDA topic model and clustering and the introduction of the SPD index is a unique contribution of this research. The proposed methodology is expected to make corporate practitioners understand not only the position of their research domain, but also that of the university researchers, and to evaluate the research similarity between them. It also provides quantified indicators that can serve as a basis for scientific and rational decision making.
In Section 2, the theoretical background of this study is explained. Section 3 describes the proposed methodology for industry–university matching for appropriate partner selection. A set of procedures that constitute the proposed methodology are described in detail. In Section 4, we design and conduct an experiment to verify the applicability of the proposed methodology and derive the results.
2. Literature Review on Methodology
2.1. Latent Dirichlet Allocation (LDA)
The methodology of R&D partner selection for IUC proposed in this study is based on a text mining technique called latent Dirichlet allocation (LDA). It is a type of topic model which is used to statistically model the process of document generation by considering the topic as a potential variable that is not visibly exposed in textual data [9]. The LDA model takes into consideration the probability distribution of topics and conditional probability distribution of terms for each topic and is named LDA because the former and latter are both assumed to follow a Dirichlet distribution, where the values of the parameters are different from each other.
LDA is a topic model introduced by Blei et al. (2003) [25] which models the process of generating a document with latent topics that are not visibly exposed in the text of the document. In the LDA topic model, each document is generated by selecting a distribution over topics and then selecting each word in the document from a topic selected according to this distribution (Griffiths and Steyvers [26]).
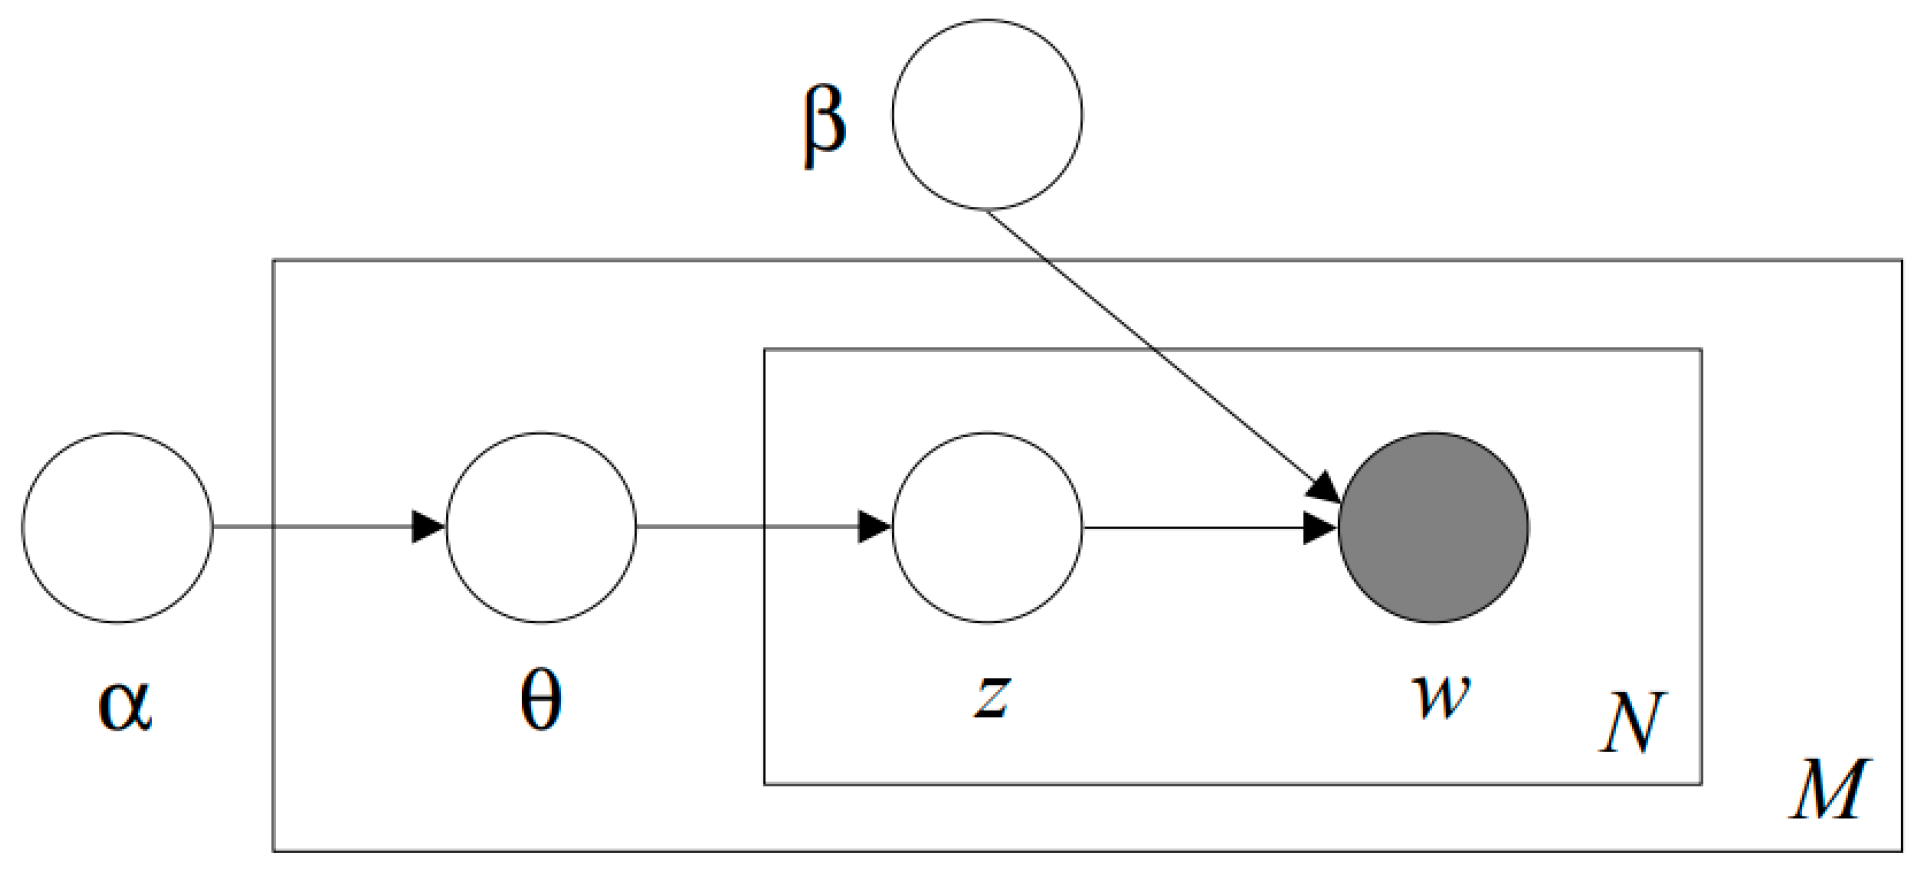
Figure 1 presents a Bayesian plate model of the LDA algorithm introduced by Blei et al. (2003) [25]. They defined the notations required for the LDA as follows:
- A document is a sequence of N words denoted by , where is the nth word in the sequence.
- A corpus is a collection of M documents denoted by .
They also mentioned that LDA assumes the following generative process for each document in a corpus .
- (1)
- Choose
- (2)
- Choose .
- (3)
- For each of the N words :
- (a)
- Choose a topic
- (b)
- Choose a word from , a multinomial probability conditioned on the topic .
There are several simplifying assumptions in this model mentioned by Blei et al. (2003) [25]. First, the dimensionality k of the Dirichlet distribution (and thus the dimensionality of the topic variable z) is assumed known and fixed. Second, the word probabilities are parameterized by a matrix where , treated as a fixed quantity to be estimated. Third, the Poisson assumption is not critical and more realistic document length distributions can be used as needed.
When the LDA was first proposed by Blei, et al. (2003) [25], the parameter of the Dirichlet distribution was estimated through variational inference. Recently, parameter estimation through Gibbs sampling has become widely used. Using LDA, each document can be represented as a vector on the vector space where each dimension indicates a topic identified through LDA. For these topic-based vectors. All the entries of these topic-based vectors have a positive value because they are probabilities that each topic occurs in each document. Becker, et al. (2003) [27] dealt with evaluating the similarity of documents on the basis of cosine similarity between the topic-based vectors. We also used the cosine distance between topic-based vectors to cluster patent documents in this study.
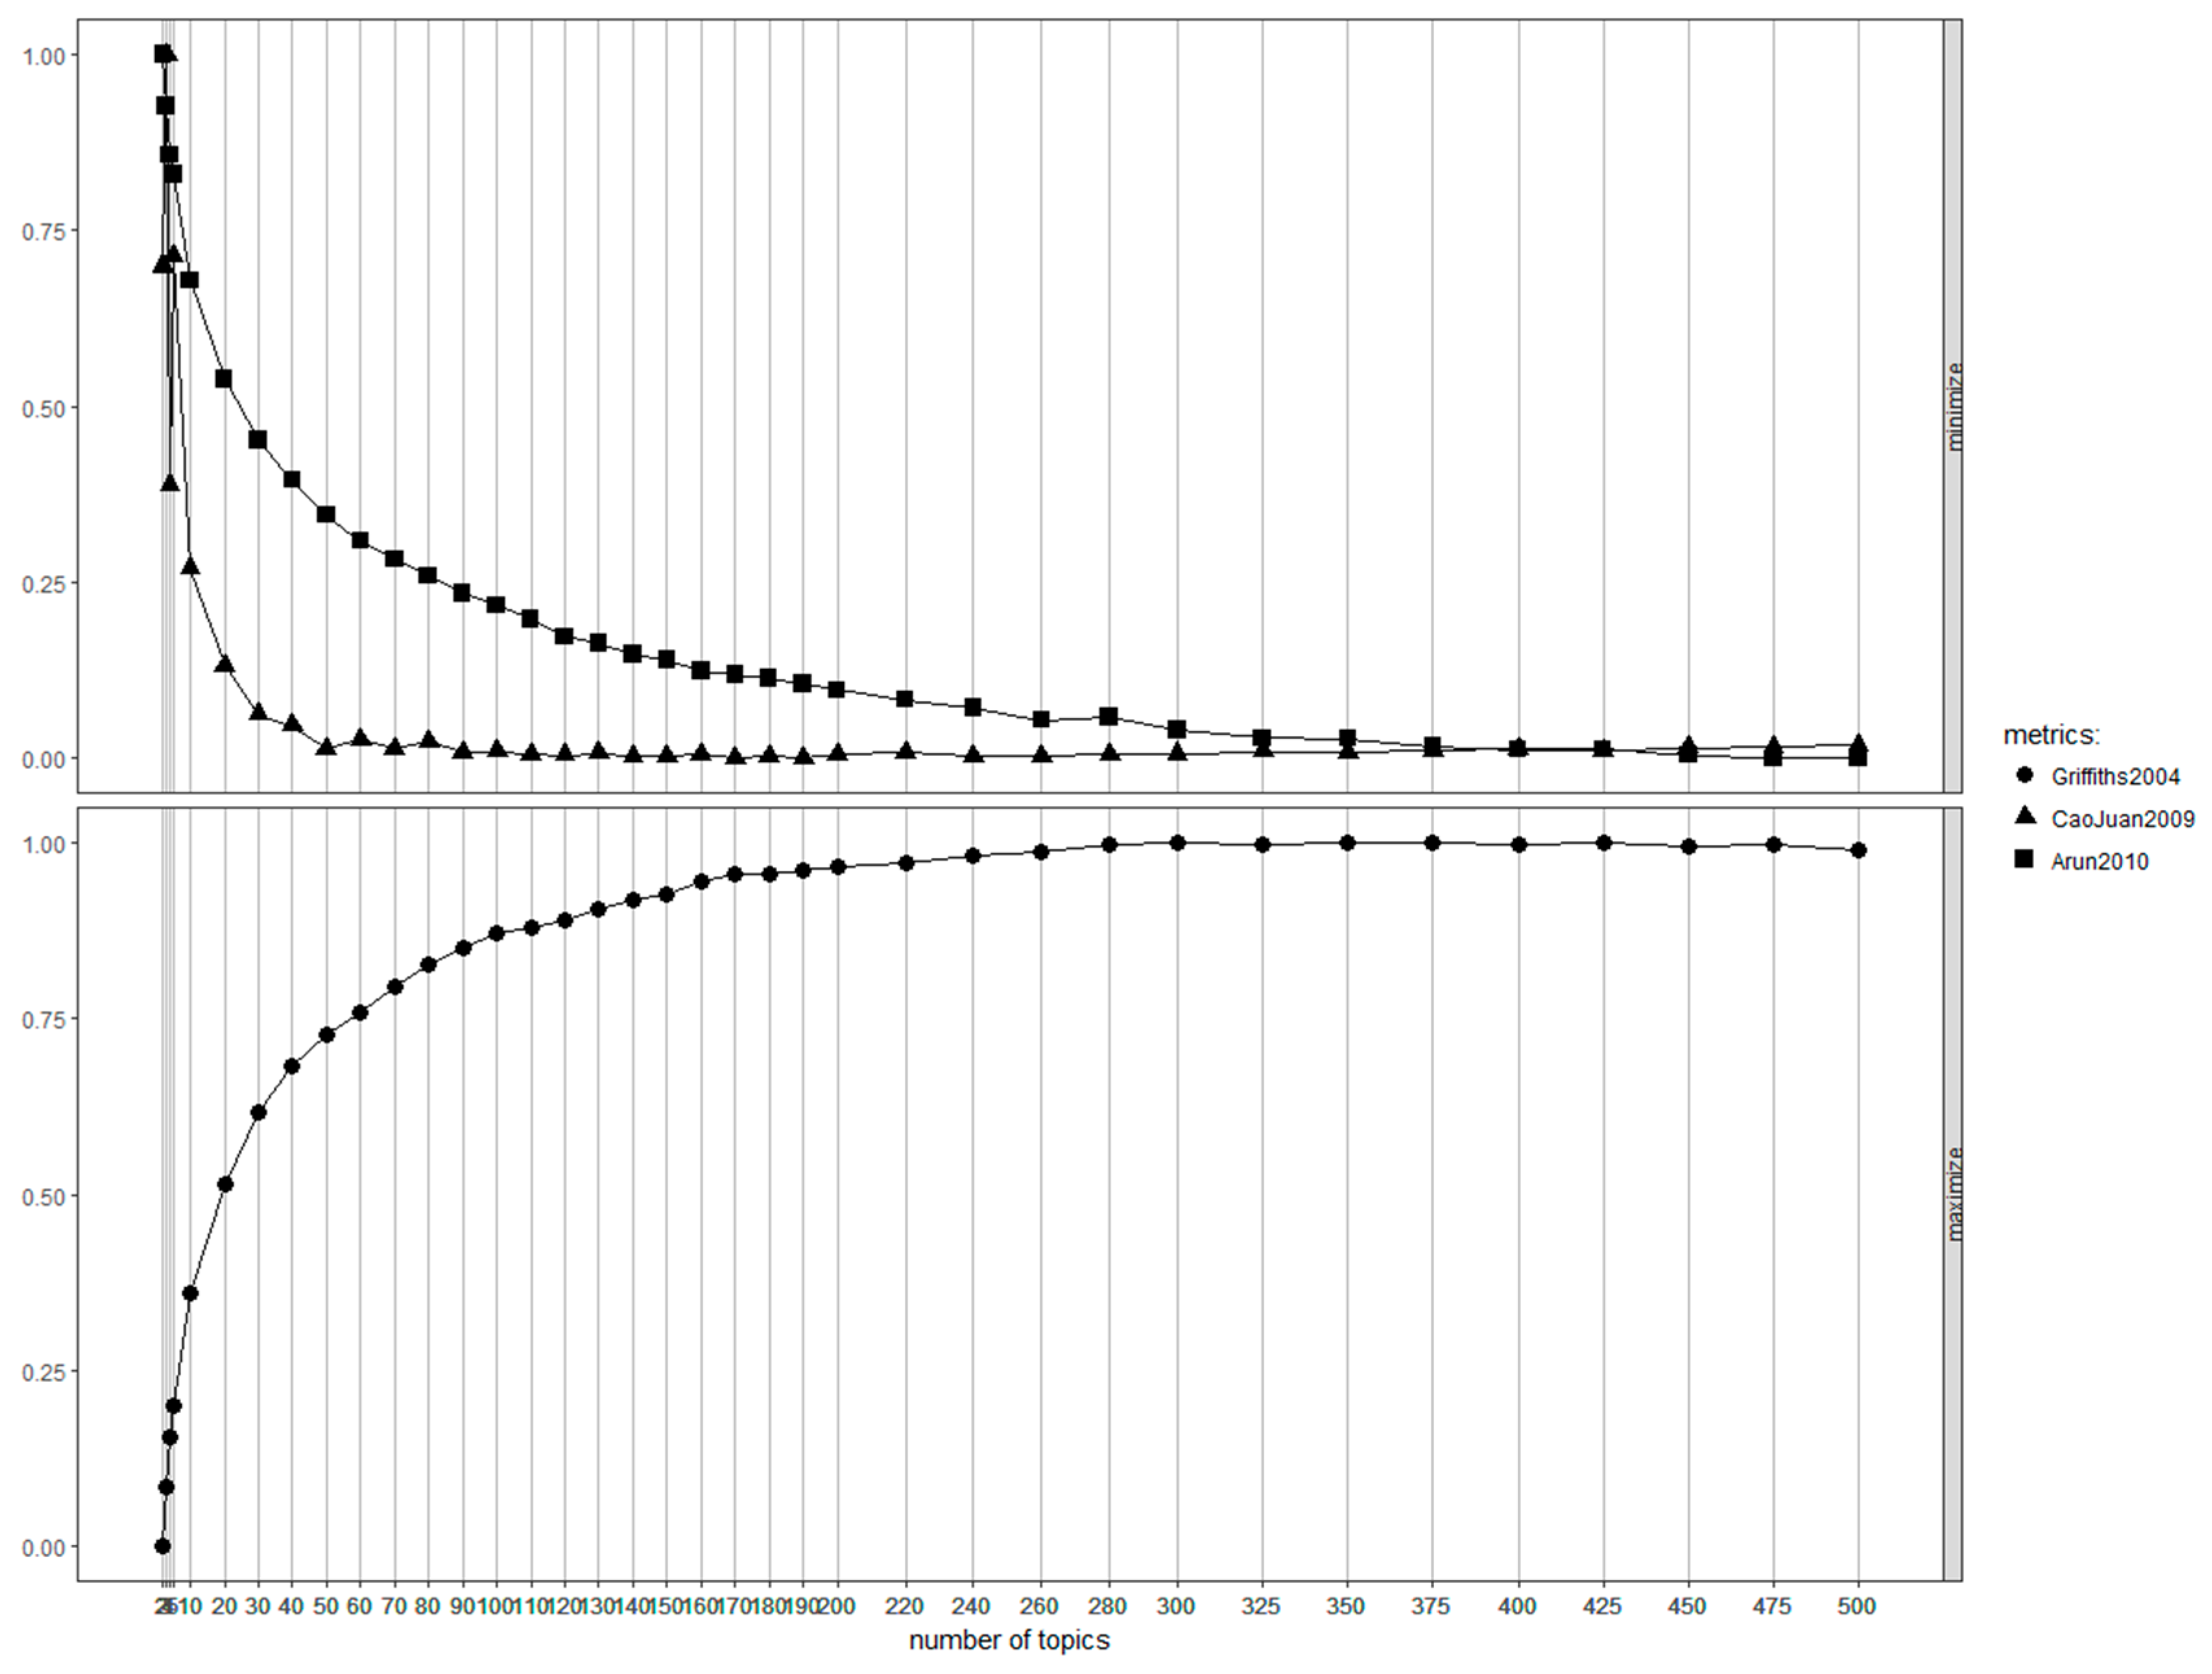
In common with the fact that determining the optimal number of clusters is very important in clustering algorithms, it is also crucial to determine the optimal number of topics in the LDA [28]. If the number of topics is too large, the computational complexity increases, and the interpretation of the results becomes unclear. As previous research related to this issue, Griffiths and Steyvers [26], Cao et al. (2009) [29], and Arun et al. (2010) [30] studied how to determine the optimal topic number. Their approaches were implemented in an R package named “ldatuning” which has been widely used recently. For practical experiments, we have been noticed that the Arun’s metric tends to produce the smallest number of topics when applying LDA to patent document data.
2.2. Patent Analysis Using LDA
Patent analysis is one of the fields where various studies on the application of text mining are carried out [23,24,31,32,33,34,35,36]. Especially, there have been several previous studies that applied the LDA to a patent analysis, where the topics extracted by applying the LDA to patent documents were defined as sub-technologies in a specific field of technology [34,35,36]. They defined the sub-technologies based on the words that frequently occur in each topic. However, it is necessary to recognize that there is a shortcoming regarding the topic driven by the LDA as a single technology. In general, applying the LDA algorithm to hundreds or thousands of patent documents produces a large number of appropriate topics. In fact, some previous studies have considered each of the topics extracted through the LDA as sub-technologies [34,35,36]. If you consider every single topic as a sub-technology of a certain domain, then the technology will be over-fragmented beyond need.
2.3. Clustering Algorithm and Its Use
In order to overcome the limitation of over-fragmentation, in this study, the sub-technologies are defined in a different manner from that of the aforementioned studies. Our approach is to combine LDA and clustering. Cluster analysis or clustering is a method of classifying entities in a way that the things with similar attributes are grouped in the same category called “cluster”. Naturally, heterogeneous entities are assigned to different clusters. It is common to use the mathematical distance between entities calculated from their numerical attributes as a degree of similarity. The clustering methodology can be classified into hierarchical clustering and non-clustering clustering. There are several variations according to the way of calculating the distance between entities. They are widely used in patent analysis to define technology categories [31].
In this study, clustering is used as follows. We first achieve topic vectors by applying the LDA to the patent documents. When there are K topics, each patent document can be positioned in a coordinate in the k-dimensional vector space. Then, clustering is performed on the topic vectors corresponding to the patents held by the specific applicant, thereby identifying the sub-technology clusters. The individual topic clusters produced are considered as sub-technologies of a target domain where we collected patent raw data. Defining sub-technologies through these procedures can be a more realistic and reasonable alternative compared to the previous approach.
3. Proposed Methodology
The proposed methodology of matching an enterprise with universities for joint research is based on LDA, clustering, and the similar-patent density (SPD), which is a newly introduced index in this study. The procedure of the matching for the R&D partner selection is as follows:
- (1)
- To choose a company and a target technology domain in which the company carries out R&D.
- (2)
- To collect a set of patent documents including in the target domain.
- (3)
- To preprocess textual information included in the patents and transform the unstructured text data into a quantitative structure.
- (4)
- To apply the LDA model into the structured data.
- (a)
- To determine the optimal number of topics (K).
- (b)
- To produce the topic-based vector space , where represents the probability of the i-th topic occurrence.
- (c)
- To position each patent document into the vector space which produce topic vectors.
- (5)
- To conduct clustering for the patent data of a target company.
- (a)
- To assign patent data of a target company to the clusters in a topic-based vector space, each of which is considered as a sub-technology constituting the target domain.
- (b)
- To calculate the center, average distance and maximum distance for each technology cluster.
- (c)
- To identify the main topics and frequent terms for each cluster to define and classify sub-technologies.
- (6)
- To calculate the similar-patent density (SPD) of each university corresponding to each cluster.
- (7)
- To select candidates with the higest value of SPD as the optimal R&D partners for each cluster (sub-technology).
Firstly, the target domain of a technology wherein a company intends to conduct R&D is selected.
Secondly, related patent data is collected from a patent DB. It is necessary to understand the search rules for the DB and create a search query that follows them in order to appropriately collect the relavant data. In addition to patent DBs used by patent offices of major countries such as USPTO, EPO, JPO, KIPO, and SIPO, private DB services such as Total Patent and WIPS can be used. In general, noise patents among the data are collected through a search query. It is preferable to reasonably remove the noise data because it distorts the results of the analysis.
Thirdly, as the collected patent documents comprise unstructured text data, it is necessary to convert them into a structured format in order to apply a statistical algorithm. According to the bag-of-words model, the document Term Matrix is constructed by counting the occurrence frequency of each term included in the entire corpus. The document constituting each row is regarded as an observation, and the term constituting each column is regarded as a feature. In general, the document term matrix has a very high sparsity as the number of features is larger than the number of observations. It is reasonable to compute the term frequency of each word in the entire corpus and exclude the words that are too low in the frequency. It is also common to calculate the term frequency-inverse document frequency (TF-IDF) weights for each word and eliminate the words that are too low in value. Words having a low value of TF-IDF are considered to be so common in most documents that they decrease the classification and clustering performance.
Fourthly, the LDA algorithm is applied to the structured data. At this step, the optimal number of topics is required to be determined. The methodologies presented in the previous studies, such as Griffiths et al. (2004) [26], Cao et al. (2009) [29], and Arun et al. (2010) [30], are implemented in the “ldatuning” package of software R. Assuming the optimal number of topics estimated is and applying the LDA model to given data, each document can be expressed as a k-dimensional vector containing the appearance probability of each topic as its element. That is, a topic-based vector space can be obtained, and each patent document can be located in the vector space. When there are patent documents in a target domain, the topic vector of the i-th document can be represented as , where indicates the probability that the k-th topic occurs in the i-th document.
Fifthly, for the patent data corresponding to a specific company located on the topic-based vector space, K-means clustering is conducted. Each cluster generated here can be regarded as a subordinate technology group in which the company performs R&D in the target domain. In general, a company conducts R&D in various sectors and concentrates its research capabilities in specific sectors that reflect the latest trends in the market. Therefore, it is meaningful to identify the subordinate technology clusters belonging to the target domain and to determine the characteristics of each cluster and compare them. When there are patent documents in the collected data and the optimal number of clusters is , each of them is assigned to one of the clusters.
For each cluster, the center position average distance and maximum distance can be calculated. In addition, we can also identify the number of patents, and main topics and terms that frequently appear for further analysis. We can represent as the j-th cluster and as the average cosine distance of from its center, and as the maximum cosine distance of .
Lastly, for each cluster, the similar-patent density (SPD) of each university applicant is calculated, which is a newly-proposed metric in this study. We defined two different SPD, one of which is the SPD within average distance and the other is the SPD within maximum distance. The average and maximum distance represent and defined above, respectively. Thus, the SPD within the average distance of a patent assignee for is defined as the number of its patents of which cosine distance from the center of is shorter than . Similarly, the SPD within the maximum distance of an assignee for is defined as the number of its patents whose cosine distance is shorter than . We can identify college applicants with the highest SPD values as the best R&D partners of a target company for each sub-technology cluster.
4. Experimental Study
In order to verify the applicability of the proposed methodology in Section 3, experiments are conducted using actual patent data. The technology domain to be tested is the electric vehicle sector. Specific information regarding the data is presented in Section 4.1, and Section 4.2 presents the experimental results according to the procedure of the proposed methodology.
4.1. Data Description
Electric vehicle (EV) technology was chosen as a target domain because it has recently been actively developed due to environmental problems such as fine dust. We collected patent documents corresponding to the following search scope from WIPS, a private patent DB service. Among the patents that were filed in the Korean Intellectual Property Office (KIPO) from July 2011 to June 2016, the ones disclosed or registered as of April 2018 were selected for the experiment. The total number of patents collected was 4225 and there were 830 different patent applicants in this field. The following table lists (Table 1) the major applicants (enterprises/universities) in this field and the number of patents possessed by them. Hyundai Motors is the parent company of Kia Motors, and these two companies file a number of patent applications together.
4.2. Experimental Results
Using the collected patent documents, the experiment was conducted according to the procedure of the proposed methodology. From the 4225 patent documents, the texts in the Title, abstract, and representative claims were extracted to construct the corpus. In the preprocessing, number, punctuation, vacant space, and stop words were eliminated and the words were stemmed. Then, a document-term-matrix (DTM) was generated and 7912 unique words were included for 4225 observations. In order to reduce the dimension, we removed the words appearing less than five times in the entire corpus. In addition, the weights of the TF-IDF were calculated for every remaining term in order to exclude words that were in the lower 15% quintile. As a result of generating the DTM again, the number of words included in the DTM was reduced to 2361.
The following step is used to apply the LDA topic model to the generated DTM. In this step, it is necessary to determine the appropriate number of topics in a reasonable manner. Figure 2 represents the optimal number of topics estimated using three different metrics. The metric based on Arun et al. (2010) [30] indicates that the optimal number of topics is 30. Thus, by applying the LDA model using 30 topics, we obtained the vectors consisting of the probability of appearance of each topic corresponding to each document. That is, the probability vector corresponding to each patent document is positioned in the topic-based vector space of 30 dimensions.
Among all the data thus positioned in the vector space, a subset of the patents belonging to a specific company who intends to conduct joint research is extracted. The clustering is performed only with the subset of the data to identify the subordinate technologies for which the company practices R&D. For the experiment, we selected the patents held by Hyundai Motors Company (HMC), the top applicant in the domain of electric vehicle technology in the Korean Intellectual Property Office. As a result of conducting k-means clustering and creating a scree plot in terms of within sum-of-squares, the elbow point was recognized when the number of clusters was 10. Therefore, we assigned the patent documents of HMC to 10 different clusters. Each cluster represents a sub-technology group in which HMC performs R&D in the EV domain. Table 2 shows the number of patents included, major topics, and the probability of occurrence for each sub-technology cluster. The blue-colored cells indicate the most likely topic to appear in each cluster.
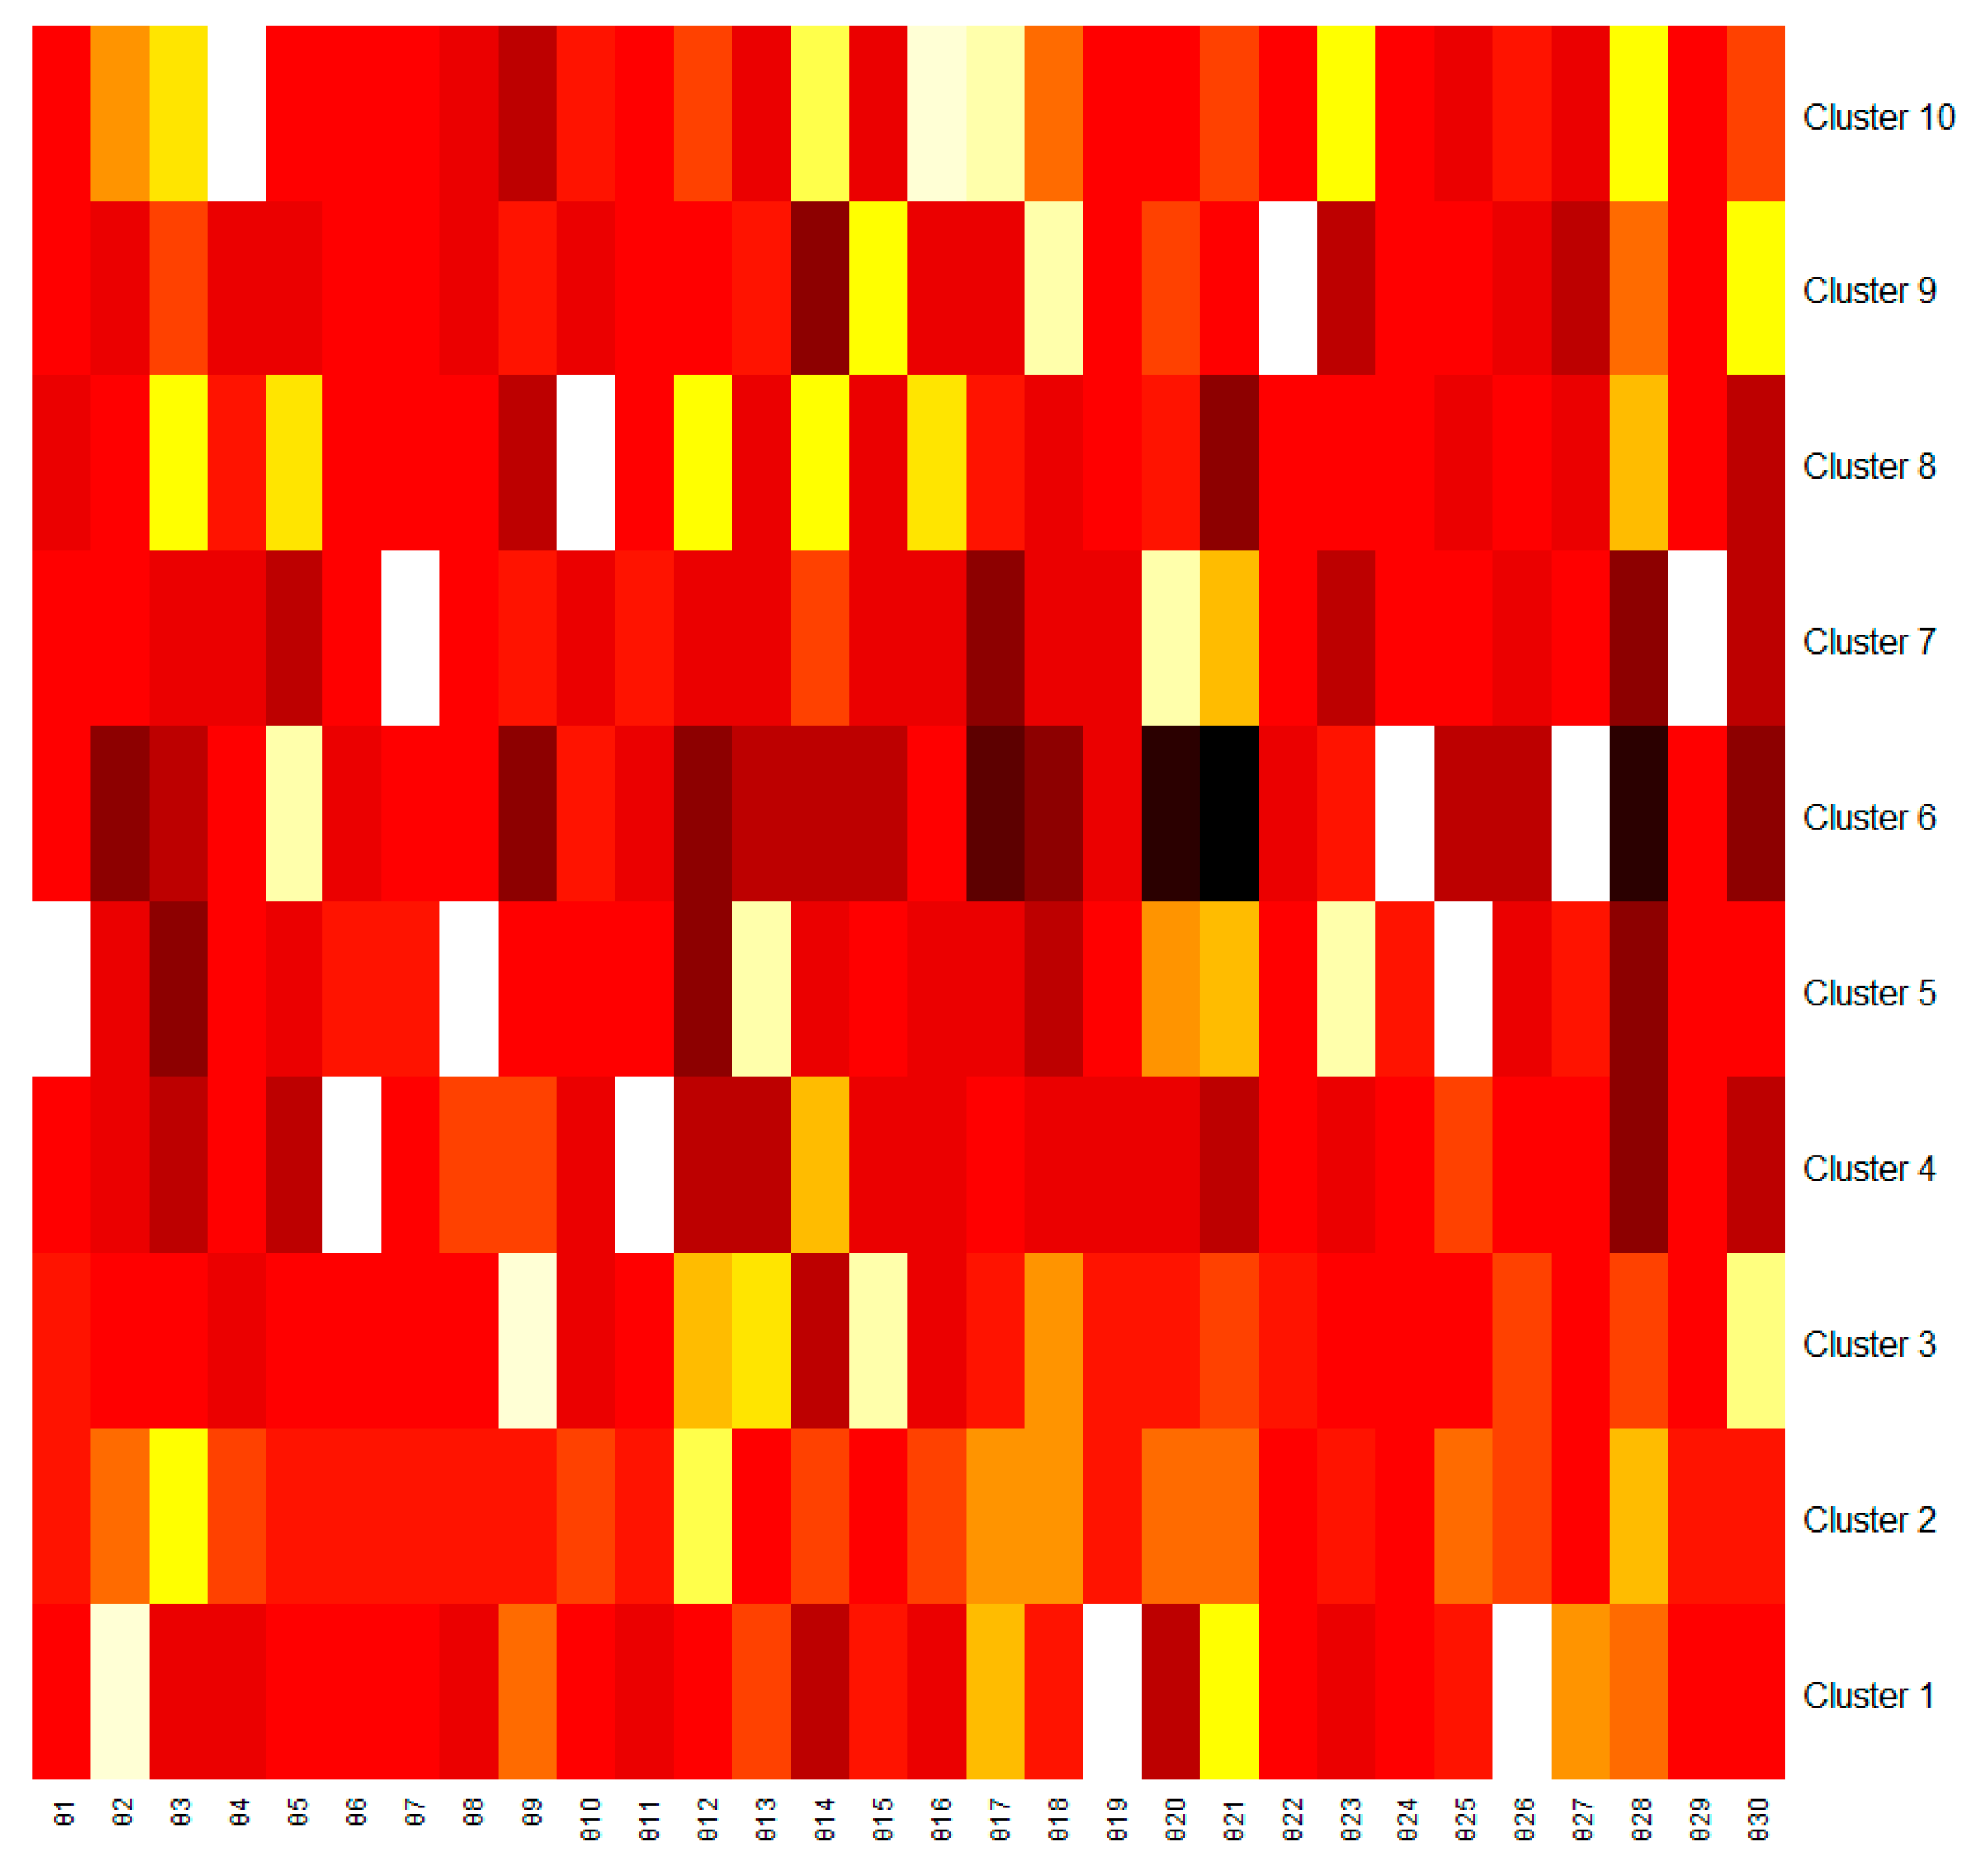
In order to compare the probability distribution of topics in the center of clusters, a heat map was represented in Figure 3. The brighter the color of the cell corresponding to each topic, the higher the probability of occurrence for the clusters.
For the next step, we identified the top words with high probability of occurrence for the main topics in cluster. Each word is represented as its reduced format after stemming. Seeing these results, we defined each technology cluster according to its contents, as shown in Table 3.
Table 4 shows the average and maximum of the cosine distance of the patents from the center of the cluster in which they were included, where and are the average and the maximum cosine distance corresponding to the j-th cluster, respectively.
The following table lists (Table 5) the university applicants with high values of similar-patent density for each technology cluster. It can be said that the university researchers with the greatest value in this measure are the best R&D candidate partners of the HMC for each sub-technology. Korea Advanced Institute of Science and Technology (KAIST) was evaluated as the best candidate for collaborative research with Hyndai Motors in the majority of technology clusters. Kookmin University and Korea Aerospace University (KAU) were also included in the top three candidates in the majority of clusters. In the case of cluster 8, Jeju National University and Chosun University were evaluated as more suitable candidates than KAIST.
5. Conclusions
This study was conducted to propose an effective alternative to the selection of appropriate partners, which was identified as a key factor for the success of industry-university cooperation (IUC), especially industry-university joint research. Previous research has enabled quantitative analysis and comparison of potential R&D partners by using patent analysis. However, it is a problem that they overlooked the facts that there are several subordinate technologies in a particular technology domain and that the research capability and concentration of a company are not same for every sub-domain. In this study, we tried to overcome this limitation by proposing a new methodology that combines latent Dirichlet allocation (LDA), which is a type of topic modeling, and clustering to introduce a new index called similar-patent density (SPD). It is designed to automatically classify sub-technologies of a specific technology domain and select the best partner for each sub-technology. In order to investigate the practical applicability of the proposed methodology, we conducted experiments using real data concerning the electric vehicle domain obtained from the Korean Intellectual Property Office (KIPO). In our experiments, we identified 10 R&D sectors using LDA and clustering from the patent data of Hyundai Motors Company (HMC), a top applicant in the electric vehicle domain in KIPO. In addition, university researchers with the highest estimated similar-patent density for each sector were found to be the most suitable partners for HMC for collaborative research. As a result, Korea Advanced Institute of Science & Technology (KAIST), Kookmin University, and Korea Aerospace University (KAU) ranked in the top of most sectors.
6. Discussion
The modern technology market has many convergence technologies that combine several technical factors, so there are various limitations in understanding technology through a simple analysis method of the past. This study aims to produce a better answer to the research question “How can we find the best partner in planning a joint research in a specific technology domain?” In this process, we reviewed related studies and diagnosed the existing problems. This study contributed to automatically classifying the sub-technology categories that constitute a particular domain and finding the best partner for each category by reflecting the difference between the applicants recognized in the textual information of patent documents. The combination of the LDA topic model and clustering, and the introduction of a new index called SPD, is a unique contribution of this research. However, if the number of topics increases, the complexity of the analysis may increase due to the increase in the number of dimensions of the data. In addition, a topic vector with a high number of dimensions makes it difficult to visualize the analysis results. Therefore, it is necessary to study how to reduce the number of dimensions while minimizing loss of information.
Author Contributions
J.K., J.L., and S.P. conceived and designed the experiments; D.J. participated in the data to confirm the validity of this study; and J.K. wrote the paper and performed the entire research steps. In addition, J.K., J.L., D.J., and S.P. have cooperated with each other in revising the paper.
Funding
This research was supported by the Basic Science Research Program through the NRF of Korea funded by the Ministry of ICT & Future Planning (NRF-2017R1A2B1010208).
Conflicts of Interest
The authors declare no conflict of interest.
References
- Ivascu, L.; Cirjaliu, B.; Draghici, A. Business model for the university-industry collaboration in open innovation. Procedia Econ. Financ. 2016, 39, 674–678. [Google Scholar] [CrossRef]
- Hall, B.H. University-Industry Research Partnerships in the United States; EUI working papers; European University Institute: Florence, Italy, 2004. [Google Scholar]
- Miteve, N.; Venters, W. Reflexive evaluation of an academic-industry research collaboration: Can mode 2 management research be achieved? J. Manag. Stud. 2009, 46, 733–754. [Google Scholar] [CrossRef]
- Guan, J.; Zaho, Q. The Impact of University Industry Collaboration Networks on Innovation in Nanobiopharmacuticals. Technol. Forecast. Soc. 2013, 80, 1271–1286. [Google Scholar] [CrossRef]
- Iqbal, A.M.; Khan, A.S.; Senin, A.A. Reinforcing the National Innovation System of Malaysia Based on University-Industry Research Collaboration: A System Thinking Approach. Int. J. Manag. Sci. Bus. Res. 2015, 4, 6–15. [Google Scholar]
- Iqbal, A.M.; Khan, A.S.; Parveen, S.; Senin, A.A. Evaluating National Innovation System of Malaysia based on University-Industry Research Collaboration: A System Thinking Approach. Asia. Soc. Sci. 2015, 11, 45. [Google Scholar]
- Santoro, M.D.; Betts, S.C. Making Industry—University Partnerships Work. Res. Technol. Manag. 2012, 45, 42–46. [Google Scholar] [CrossRef]
- Jacob, M.; Hellstrom, T.; Adler, N.; Norrgren, F. From sponsorship to partnership in academy-industry relations. R&D Manag. 2000, 30, 255–262. [Google Scholar] [CrossRef]
- Seppo, M.; Lilles, A. Indicators Measuring University-Industry Cooperation. 2012. Available online: https://ojs.utlib.ee/index.php/TPEP/article/view/782 (accessed on 22 June 2019).
- Han, Z. Managing Foreign Research and Development in the People’s Republic of China: The New Think-Tank of the World; Chandos Publishing: Oxford, UK, 2008; pp. 70–71. [Google Scholar]
- Rajalo, S.; Vadi, M. University–industry innovation collaboration: Reconceptualization. Technov 2017, 62, 42–54. [Google Scholar] [CrossRef]
- Galati, F.; Bigliardi, B.; Petroni, A.; Marolla, G. Which factors are perceived as obstacles for the growth of Italian academic spin-offs? Techno.l Anal. Strateg. Manag. 2017, 29, 84–104. [Google Scholar] [CrossRef]
- Kaklauskas, A.; Banaitis, A.; Ferreira, F.; Ferreira, J.; Amaratunga, D.; Lepkova, N.; Ubarte, I.; Banaitiene, N. An evaluation system for university-industry partnership sustainability: Enhancing options for entrepreneurial universities. Sustainability 2018, 10, 119. [Google Scholar] [CrossRef]
- Cenderholm, G. Success Factors in University-Industry Collaborations. Master’s Thesis, School of Business, Economics, and Law, University of Gothenburg, Gothenburg, Sweden, 2015. [Google Scholar]
- Rybnicek, R.; Konigsgruber, R. What makes industry-university collaboration succeed? A systematic review of the literature. J. Bus. Econ. 2018, 89, 221–250. [Google Scholar] [CrossRef]
- Lambe, C.J.; Spekman, R.E. The Bases of Alliance-Derived Sustainable Advantage: Relationship and Resources. Available online: http://0-connection-ebscohost-com.brum.beds.ac.uk/c/proceedings/6853754/bases-alliance-derived-sustainable-competitive-advantage-relationship-resources (accessed on 22 June 2019).
- Barnes, T.; Pashby, I.; Gibbons, A. Effective university industry interaction: a multi-case evaluation of collaborative R&D project. Eur. Manag. J. 2002, 20, 282–285. [Google Scholar] [CrossRef]
- Mora-Valentin, E.M.; Montoro-Sanchez, A.; Guerras-Martin, L.A. Determining factors in the success of R&D cooperative agreements between firms and research organizations. Res. Policy 2004, 33, 17–49. [Google Scholar] [CrossRef]
- Thune, T. Success factors in higher education-industry collaboration: A case study of collaboration in the engendering field. Tert. Educ. Manag. 2011, 17, 31–50. [Google Scholar] [CrossRef]
- Ireland, R.D.; Hitt, M.A.; Vaidyanath, D. Alliance Management as a Source of Competitive Advantage. J. Manag. 2002, 28, 413–446. [Google Scholar] [CrossRef]
- Park, I.; Jeong, Y.; Yoon, B.; Mortara, L. Exploring potential R&D collaboration partners through patent analysis based on bibliographic coupling and latent semantic analysis. Technol. Anal. Strateg. Manag. 2015, 27, 759–781. [Google Scholar] [CrossRef]
- Manotungvorapun, N.; Gerdsri, N. From literature to practice: Selection criteria for industry-university partners. In Proceedings of the 2016 Portland International Conference on Management of Engineering and Technology (PICMET), Honolulu, HI, USA, 4–8 September 2016; pp. 420–428. [Google Scholar]
- Jeon, J.; Lee, C.; Park, Y. How to Use Patent Information to Search Potential Technology Partners in Open-Innovation. J. Intellect. Prop. Rights 2011, 16, 385–393. [Google Scholar]
- Lee, S.; Geum, Y.; Yoon, B.; Kim, M.; Shin, J. Strategic Partner Selection for Collaborative R&D: Literature-based Technology Intelligence. In Proceedings of the R&D Management Conference, Manchester, UK, 2010; Available online: https://www.researchgate.net/profile/Youngjung_Geum/publication/228866709_Strategic_partner_selection_for_collaborative_RD_Literature-based_technology_intelligence/links/09e41510620c050201000000/Strategic-partner-selection-for-collaborative-R-D-Literature-based-technology-intelligence.pdf (accessed on 22 June 2019).
- Blei, D.M.; Ng, A.Y.; Jordan, M.I. Latent dirichlet allocation. J. Mach. Learn. Res. 2003, 3, 993–1022. [Google Scholar]
- Griffiths, T.L.; Steyvers, M. Finding Scientific Topics. PNAS 2004, 101, 5228–5235. [Google Scholar] [CrossRef]
- Becker, J.; Kuropka, D. Topic-based vector space model. In Proceedings of the 6th International Conference On Business Information Systems, Colorado Springs, CO, USA, 2003; pp. 7–12. Available online: http://www.kuropka.net/files/TVSM.pdf (accessed on 25 June 2019).
- Blei, D.M. Probabilistic topic models. Commun. ACM 2012, 55, 77–84. [Google Scholar] [CrossRef] [Green Version]
- Cao, J.; Xia, T.; Li, J.; Zhang, Y.; Tang, S. A density-based method for adaptive LDA model selection. Neurocomputing 2009, 72, 1775–1781. [Google Scholar] [CrossRef]
- Arun, R.; Suresh, V.; Veni Madhavan, C.E.; Narasimha Murthy, M.N. On Finding the Natural Number of Topics with Latent Dirichlet Allocation: Some Observations. In Advances in Knowledge Discovery and Data Mining; Springer: Berlin, Heidelberg, 2010; pp. 391–402. [Google Scholar]
- Kim, J.; Choi, J.; Park, S.; Jang, D. Patent keyword extraction for sustainable technology management. Sustainability 2018, 10, 1287. [Google Scholar] [CrossRef]
- Kim, S.; Jang, D.; Jun, S.; Park, S. A novel forecasting methodology for sustainable management of defense technology. Sustainability 2015, 7, 16720–16736. [Google Scholar] [CrossRef]
- Martino, J. Technology Forecasting for Decision Making, 3rd ed.; McGraw-Hill: New York, NY, USA, 1993; pp. 93–96. [Google Scholar]
- Kim, J.; Lee, J.; Kim, G.; Park, S.; Jang, D. A hybrid method of analyzing patents for sustainable technology management in humanoid robot industry. Sustainability 2016, 8, 474. [Google Scholar] [CrossRef]
- Kim, G.; Park, S.; Jang, D. Technology Analysis from Patent Data Using Latent Dirichlet Allocation. In Soft Computing in Big Data Processing; Springer: Cham, Switzerland, 2014; pp. 71–80. [Google Scholar]
- Lee, H.; Kang, P. Identifying core topics in technology and innovation management studies: A topic model approach. J. Technol. Transf. 2017. [Google Scholar] [CrossRef]
Figure 1.
Bayesian plate model of LDA algorithm introduced by Blei et al. (2003) [25].
Figure 1.
Bayesian plate model of LDA algorithm introduced by Blei et al. (2003) [25].

Figure 2.
Several metrics used for determining the optimal number of topics.

Figure 3.
Heat map representing the probability of topics in each cluster.


Table 1.
Top 10 patent applicants in the EV domain.
| Companies | Universities | ||
|---|---|---|---|
| Applicant | Number of Patents | Applicant | Number of Patents |
| Hyundai Motors Co./KIA Motors Co. | 1097 | Korea Advanced Institute of Science and Technology (KAIST) | 145 |
| LG Electronics Inc. | 181 | Kookmin University | 39 |
| LSIS Co., Ltd. | 158 | Korea Aerospace University (KAU) | 29 |
| Hyundai Mobis Co., Ltd. | 108 | Jeju National University | 19 |
| Hanon Systems | 75 | Hanyang University | 9 |
| Toyota Jidosha Kabushiki Kaisha | 64 | Korea University | 8 |
| LG Chem, LTD. | 58 | Myungji University | 8 |
| Continental Automotive | 49 | Chosun University | 8 |
| Honda Motor Co., Ltd. | 40 | Pohang University of Science and Technology (POSTECH) | 6 |
| Hyundai Wia Corporation | 39 | Seoul National University | 5 |
Table 2.
Main topics and their probability of occurrence for each technology cluster.
| Cluster Index | Number of Patents | Main Topics & Probability of Occurrences | |
|---|---|---|---|
| Topic (Index) | Probability | ||
| 1 | 131 | 19 | 0.15 |
| 26 | 0.11 | ||
| 2 | 0.08 | ||
| 9 | 0.05 | ||
| 27 | 0.05 | ||
| Etc. | 0.56 | ||
| 2 | 118 | 3 | 0.05 |
| 28 | 0.05 | ||
| 12 | 0.04 | ||
| 10 | 0.04 | ||
| 18 | 0.04 | ||
| Etc. | 0.77 | ||
| 3 | 97 | 15 | 0.13 |
| 9 | 0.12 | ||
| 30 | 0.06 | ||
| 13 | 0.05 | ||
| 18 | 0.04 | ||
| Etc. | 0.60 | ||
| 4 | 84 | 6 | 0.25 |
| 11 | 0.18 | ||
| 9 | 0.04 | ||
| 14 | 0.04 | ||
| 8 | 0.04 | ||
| Etc. | 0.46 | ||
| 5 | 150 | 1 | 0.14 |
| 8 | 0.12 | ||
| 23 | 0.07 | ||
| 25 | 0.07 | ||
| 13 | 0.06 | ||
| Etc. | 0.55 | ||
| 6 | 72 | 24 | 0.40 |
| 5 | 0.10 | ||
| 27 | 0.10 | ||
| 10 | 0.04 | ||
| 23 | 0.03 | ||
| Etc. | 0.35 | ||
| 7 | 62 | 7 | 0.21 |
| 29 | 0.20 | ||
| 20 | 0.05 | ||
| 9 | 0.03 | ||
| 21 | 0.03 | ||
| Etc. | 0.47 | ||
| 8 | 113 | 10 | 0.20 |
| 16 | 0.07 | ||
| 5 | 0.07 | ||
| 3 | 0.05 | ||
| 14 | 0.05 | ||
| Etc. | 0.56 | ||
| 9 | 96 | 22 | 0.26 |
| 15 | 0.09 | ||
| 18 | 0.08 | ||
| 30 | 0.05 | ||
| 9 | 0.04 | ||
| Etc. | 0.49 | ||
| 10 | 109 | 16 | 0.11 |
| 4 | 0.11 | ||
| 17 | 0.06 | ||
| 28 | 0.05 | ||
| 23 | 0.05 | ||
| Etc. | 0.61 | ||
Table 3.
Result of cluster definition considering main topics and their frequent terms.
| Cluster Definition | Top 3 Topics | Top Words with High Probability of Occurrence for Each Topic | |
|---|---|---|---|
| Topic | Prob. | ||
| (1) EV Battery System | 19 | 0.15 | Wheel, front, rear, frame, right, steer, left |
| 26 | 0.11 | Materi, secondari, activ, anod, layer, lithium | |
| 2 | 0.08 | Batteri, cell, pack, manag, bms, lamin | |
| (2) EV Electric Parts & Mode-switching | 3 | 0.05 | Mode, level, limit, electron, compon, initi |
| 28 | 0.05 | Number, distanc, calcul, distribut, box, rout | |
| 12 | 0.04 | Magnet, coil, feed, field, core, induct | |
| (3) EV Sensors & Energy Control | 15 | 0.13 | Signal, detect, sensor, sens, driver, malfunct |
| 9 | 0.12 | Fuel, water, tank, gas, pipe, flow | |
| 30 | 0.06 | Energy, amount, sotrag, discharg, collect, accumul | |
| (4) EV Engine & Air Control | 6 | 0.25 | Engin, start, intern, combust, machin, idl |
| 11 | 0.18 | Air, temperatu, heater, port, inlet, duct | |
| 9 | 0.04 | Fuel, water, tank, gas, pipe, flow | |
| (5) Hybrid EV Fuel Control & Mechanical Part | 1 | 0.14 | Line, pressur, oil, pump, valv, fluid |
| 8 | 0.12 | Gear, rotat, element, first, planetari, ratari | |
| 23 | 0.07 | Process, load, block, integr, cut, pattern | |
| (6) Environment Recognition & Adaptive Control | 24 | 0.40 | Measure, section, monitor, area, sound, light |
| 5 | 0.10 | Current, switch, convert, invert, phase, capacitor | |
| 27 | 0.10 | Member, portion, contact, insert, end, insul | |
| (7) EV Body & Running Control | 7 | 0.21 | Bodi, plate, lower, cover, upper, support, top |
| 29 | 0.20 | Mean, posit, guid, lock, transfer, movement | |
| 20 | 0.05 | Torq, speed, pedal, acceler, rate, target | |
| (8) EV Mechanical & Electric Parts | 10 | 0.20 | Hous, rotor, stator, wind, combin, inner |
| 16 | 0.07 | Cool, heat, exchang, water, flow, refriger | |
| 5 | 0.07 | Current, switch, convert, invert, phase, capacitor | |
| (9) EV Charging System | 22 | 0.26 | Termin, connector, bus, cabl, wire, plug |
| 15 | 0.09 | Signal, detect, sensor, sens, driver, malfunct | |
| 18 | 0.08 | Charg, charger, park, fill, recharg, station | |
| (10) EV Heat & Drive Control | 16 | 0.11 | Cool, heat, exchang, water, flow, refriger |
| 4 | 0.11 | Clutch, brake, transmiss, shift, regen, actuat | |
| 17 | 0.06 | Shaft, input, gear, rotat, axi, transmiss | |
Table 4.
The number of patents and cosine distance of each cluster from its center.
| Cluster Index | Number of Patents Included | Cosine Distance from the Center | |
|---|---|---|---|
| Average (ADj) | Maximum (MDj) | ||
| 1 | 131 | 0.24 | 0.48 |
| 2 | 118 | 0.28 | 0.42 |
| 3 | 97 | 0.26 | 0.49 |
| 4 | 84 | 0.21 | 0.51 |
| 5 | 150 | 0.31 | 0.63 |
| 6 | 72 | 0.08 | 0.36 |
| 7 | 62 | 0.23 | 0.85 |
| 8 | 113 | 0.18 | 0.40 |
| 9 | 96 | 0.16 | 0.53 |
| 10 | 109 | 0.36 | 0.72 |
Table 5.
Top 3 Candidate Partners of Hyundai Motors for Each Cluster.
| Cluster No. | Average Cosine Distance | Top 3 Candidate Partners | Similar-Patent Density (SPD) | |
|---|---|---|---|---|
| Within Average Distance | Within Maximum Distance | |||
| 1 | 0.60 | Korea Advanced Institute of Science & Technology (KAIST) | 4 | 32 |
| 0.56 | Kookmin Univ. | 2 | 8 | |
| 0.55 | Korea Aerospace Univ. (KAU) | 1 | 6 | |
| 2 | 0.48 | KAIST | 5 | 47 |
| 0.42 | Kookmin University | 4 | 22 | |
| 0.43 | KAU | 3 | 14 | |
| 3 | 0.54 | KAIST | 15 | 32 |
| 0.50 | Kookmin Univ. | 6 | 16 | |
| 0.49 | KAU | 5 | 13 | |
| 4 | 0.55 | KAIST | 12 | 20 |
| 0.66 | KAU | 1 | 6 | |
| 0.68 | Jeju National Univ. | 1 | 5 | |
| 5 | 0.54 | KAIST | 17 | 90 |
| 0.56 | Kookmin Univ. | 4 | 24 | |
| 0.57 | KAU | 2 | 17 | |
| 6 | 0.77 | KAIST | 4 | 8 |
| 0.68 | Jeju National Univ. | 1 | 3 | |
| 0.76 | KAU | 1 | 2 | |
| 7 | 0.67 | KAIST | 7 | 140 |
| 0.63 | Myungji Univ. | 1 | 8 | |
| 0.59 | POSTECH | 1 | 6 | |
| 8 | 0.50 | Jeju National Univ. | 3 | 6 |
| 0.44 | Chosun Univ. | 3 | 4 | |
| 0.67 | KAIST | 2 | 7 | |
| 9 | 0.64 | KAIST | 12 | 29 |
| 0.58 | Kookmin Univ. | 5 | 13 | |
| 0.60 | KAU | 3 | 8 | |
| 10 | 0.60 | KAIST | 10 | 117 |
| 0.52 | Kookmin Univ. | 5 | 35 | |
| 0.51 | Jeju National Univ. | 5 | 17 | |
© 2019 by the authors. Licensee MDPI, Basel, Switzerland. This article is an open access article distributed under the terms and conditions of the Creative Commons Attribution (CC BY) license (http://creativecommons.org/licenses/by/4.0/).
Share and Cite
MDPI and ACS Style
Kang, J.; Lee, J.; Jang, D.; Park, S. A Methodology of Partner Selection for Sustainable Industry-University Cooperation Based on LDA Topic Model. Sustainability 2019, 11, 3478. https://0-doi-org.brum.beds.ac.uk/10.3390/su11123478
AMA Style
Kang J, Lee J, Jang D, Park S. A Methodology of Partner Selection for Sustainable Industry-University Cooperation Based on LDA Topic Model. Sustainability. 2019; 11(12):3478. https://0-doi-org.brum.beds.ac.uk/10.3390/su11123478
Chicago/Turabian StyleKang, Jiho, Junseok Lee, Dongsik Jang, and Sangsung Park. 2019. "A Methodology of Partner Selection for Sustainable Industry-University Cooperation Based on LDA Topic Model" Sustainability 11, no. 12: 3478. https://0-doi-org.brum.beds.ac.uk/10.3390/su11123478
Note that from the first issue of 2016, this journal uses article numbers instead of page numbers. See further details here.