Article

Spatio-Temporal Pattern in the Changes in Availability and Sustainability of Water Resources in Afghanistan

by
Mohammad Naser Sediqi
1,
Mohammed Sanusi Shiru
1,2,*,
Mohamed Salem Nashwan
1,3,
Rawshan Ali
4,5,*,
Shadan Abubaker
6,
Xiaojun Wang
7,8,
Kamal Ahmed
1,
Shamsuddin Shahid
1,
Md. Asaduzzaman
9 and
Sayed Mir Agha Manawi
1
1
School of Civil Engineering, Faculty of Engineering, Universiti Teknologi Malaysia (UTM), Johor Bahru 81310, Malaysia
2
Department of Environmental Sciences, Faculty of Sciences, Federal University Dutse, Dutse P.M.B. 7156, Nigeria
3
Faculty of Engineering and Technology, Arab Academy for Science, Technology and Maritime Transport (AASTMT), Cairo 2033 - Elhorria, Egypt
4
Department of Petroleum, Koya Technical Institute, Erbil Polytechnic University, Erbil 44001, Kurdistan, Iraq
5
College of Hydraulic and Environmental Engineering, China Three Gorges University, Yichang 443002, China
6
Department of Environmental Engineering, College of Engineering, Knowledge University, Erbil 44001, Kurdistan, Iraq
7
State Key Laboratory of Hydrology-Water Resources and Hydraulic Engineering, Nanjing Hydraulic Research Institute, Nanjing 210029, China
8
Research Center for Climate Change, Ministry of Water Resources, Nanjing 210029, China
9
Department of Engineering & Design, Staffordshire University, Stoke-on-Trent ST4 2DE, UK
*
Authors to whom correspondence should be addressed.
Sustainability 2019, 11(20), 5836; https://0-doi-org.brum.beds.ac.uk/10.3390/su11205836
Submission received: 19 September 2019 / Revised: 16 October 2019 / Accepted: 18 October 2019 / Published: 21 October 2019
(This article belongs to the Special Issue Sustainability of Water Resources in the Developing Cities)

Abstract

:
Water is gradually becoming scarce in Afghanistan like in many other regions of the globe. The objective of this study was to evaluate the spatial changes in the availability and sustainability of water resources in Afghanistan. The Terrestrial Water Storage (TWS) data of the Gravity Recovery and Climate Experiment (GRACE) satellite obtained from three different institutes, having 1° × 1° spatial resolution for the period 2002–2016 was used for this purpose. Sen’s slope method was used to assess the rate of change, and the Modified Mann–Kendall test was used for the evaluation of the significance of trends in TWS. After, the concept of reliability–resiliency–vulnerability (RRV) was used for assessing the spatial distribution of sustainability in water resources. The results revealed a significant decrease in water availability in the country over the last 15 years. The decrease was found to be highest in the central region where most of the population of the country resides. The reliability in water resources was found high in the northeast Himalayan region and low in the southwest desert; resilience was found low in the central region, while vulnerability was found high in the south and the southeast. Overall, the water resources of the country were found most sustainable in the northeast and southwest and least in the south and the central parts. The maps of water resource sustainability and the changes in water availability produced in the present study can be used for long-term planning of water resources for adaptation to global changes. Besides, those can be used for the management of water resources in a sustainable and judicious manner.

1. Introduction

One of the challenges faced by many countries around the globe today is attaining adequate water supply considering both increasing human water demands and looming climate-related changes. It has been projected that half of the population of the world may be faced with clean water shortage by 2080 [1]. Estimates by the Intergovernmental Panel on Climate Change (IPCC) show that by 2050, 2 billion people will not have access to clean supplies of water, which will double the number of people already lacking access to consistent safe supplies of water. Most parts of Asia will likely be more affected by water scarcity due to the fast rise in temperature and alteration in precipitation pattern [2,3,4]. The situation will be aggravated by groundwater pollution [5] and continuous increase in population and lesser coping capabilities to climate change [6,7,8,9].
Climate change has significant impacts on several sectors including agriculture, health, water resources, energy, and industry among others. Of these, the water resources sector will be the most affected by the variability of the climate, and this will subsequently impact other sectors [10,11,12,13] causing severe economic loses. The dynamism of climatic variables has been reported in many studies, particularly, changes in rainfall [14,15,16,17,18,19] and temperature [20,21,22,23,24]. This has aggravated the risks of disasters including droughts which may further compound the water resources issue across the globe [25,26,27], including over-abstraction, which would increase in the near future [28,29,30] particularly with an expected increase of the impacts of climate change [31,32]. As a finite resource, the supply of fresh water is difficult to increase and thus, it is paramount to prudently manage the limited water resources to meet the ever-increasing demand of growing population and developing economies [33,34,35]. This is particularly crucial in the Himalayas and nearby regions where water held as ice and snow in mountainous areas is melting faster due to climate change [36,37]. This will leave less available water during the dry seasons. Afghanistan, a semi-arid to arid nation receives between 200–500 mm rainfall per year and often faces prolonged droughts [38]. The 2017 Global Adaptation Index ranked Afghanistan as the 11th most vulnerable country worldwide to climate change [39]. Water availability for the purpose of irrigation in Afghanistan is dependent on effective rainfall as well as the availability of surface and groundwater resources, which in turn depend on the spatial and temporal distribution and amount of rainfall [40]. Although nearly half of the country has an arid climate, it is estimated that Afghanistan possesses 76 billion m3 of potential water resources of which 20 billion cubic meters is groundwater [41]. Around 98% of the 20 billion m3 of annual water is used for agriculture [42], and the rest is used for domestic and industrial purposes. Three billion-m3 of the total water usage is extracted from groundwater. This figure is expected to increase to 8 billion m3 by the projected increase of water requirement of the domestic and irrigation use. Nearly 20% of Afghanistan’s irrigated land uses Karizes and shallow wells to extract groundwater. Due to the recent decreasing trend in the groundwater levels [43], 70% of Karizes and shallow wells are drying out [40,44]. Furthermore, 80% of the population of the country gets their income from agricultural practices and cattle herding [45]. This implies that changes in water resources will significantly affect the agricultural sector. For efficient management of water resources and development of scientifically validated management tools, spatiotemporal variability information is crucial. Such information assists in the establishment of water mass balances which can aid sustainable water resource use most importantly in semi-arid and arid environments of the country where water resource is scarcer.
Few studies on climate change and droughts, which are the main trigger for water scarcity, have been conducted in Afghanistan [46,47]. No study on spatial and temporal changes and sustainability in water resources has been conducted so far. However, studies conducted in regions around Afghanistan have shown changes in the availability of water due to climate change. Ahmed, Shahid [48] assessed the changing characteristics of water resources over the period of 2002–2016 in Pakistan and observed a significant aquifer storage decrease over the study period. The areas where agricultural practices are more intense were found to have a greater decline in groundwater level as a result of overexploitation of the resource for irrigation purposes. The spatiotemporal trend in water storage during 2003–2008 was assessed by [34] in the Tangnaihai basin in China. Their study revealed that the water storage changes are more in the western part than in the eastern part, and the trend of water storage is increasing in annual scale at the rate of 0.5 mm/month. Though Afghanistan is in the same region with the aforementioned countries, Pakistan and China, a local assessment of the spatiotemporal changes in total water resources for the country is crucial due to geological and climatic variations across the region. In addition, this is paramount for the country for the development of sustainable water resource management and adaptation strategies under a changing climate.
Terrestrial water storage (TWS) is the total land and subsurface water [49]. It represents all water in river, lakes, ice, soil, and groundwater and indicates the total water available at a location. Collecting data from all forms of water available in a region is very difficult and almost impossible in developing countries. Gravity Recovery and Climate Experiment (GRACE) satellite provides information on TWS at a resolution of 1° × 1° and gives the opportunity to assess and monitor the availability of the total amount of water in any region of the world. In the present study, GRACE TWS data was used for assessing the changes in water availability and spatial distribution of water sustainability in Afghanistan. Sen’s slope method was employed for assessing the rate of change in TWS and Modified Mann–Kendall (MMK) test was used for the evaluation of the significance of trends in TWS for the period 2002–2016. The reliability–resiliency–vulnerability (RRV) concept was employed in assessing the sustainability in water resources. The RRV concept has been used for assessing sustainability against the risk of natural or anthropogenic hazards [36,37,50]. The concept of RRV for the assessment of sustainability in water resources against hydrological disasters like droughts has not been explored and implemented in a number of studies [51,52,53]. However, the concept has been used to assess sustainability in total water resources. The concept was applied on TWS anomaly data of GRACE for the period 2002–2016 obtained from three different institutes, which allowed to assess uncertainty in sustainability estimated using GRACE TWS. The proposed method in this study is expected to be replicated in other regions for assessment of total water sustainability. The reliability, resiliency, vulnerability, and sustainability maps of total water resources produced in this study can be of use in adaptation and mitigation measures planning for achievement of sustainable water resources management for Afghanistan.

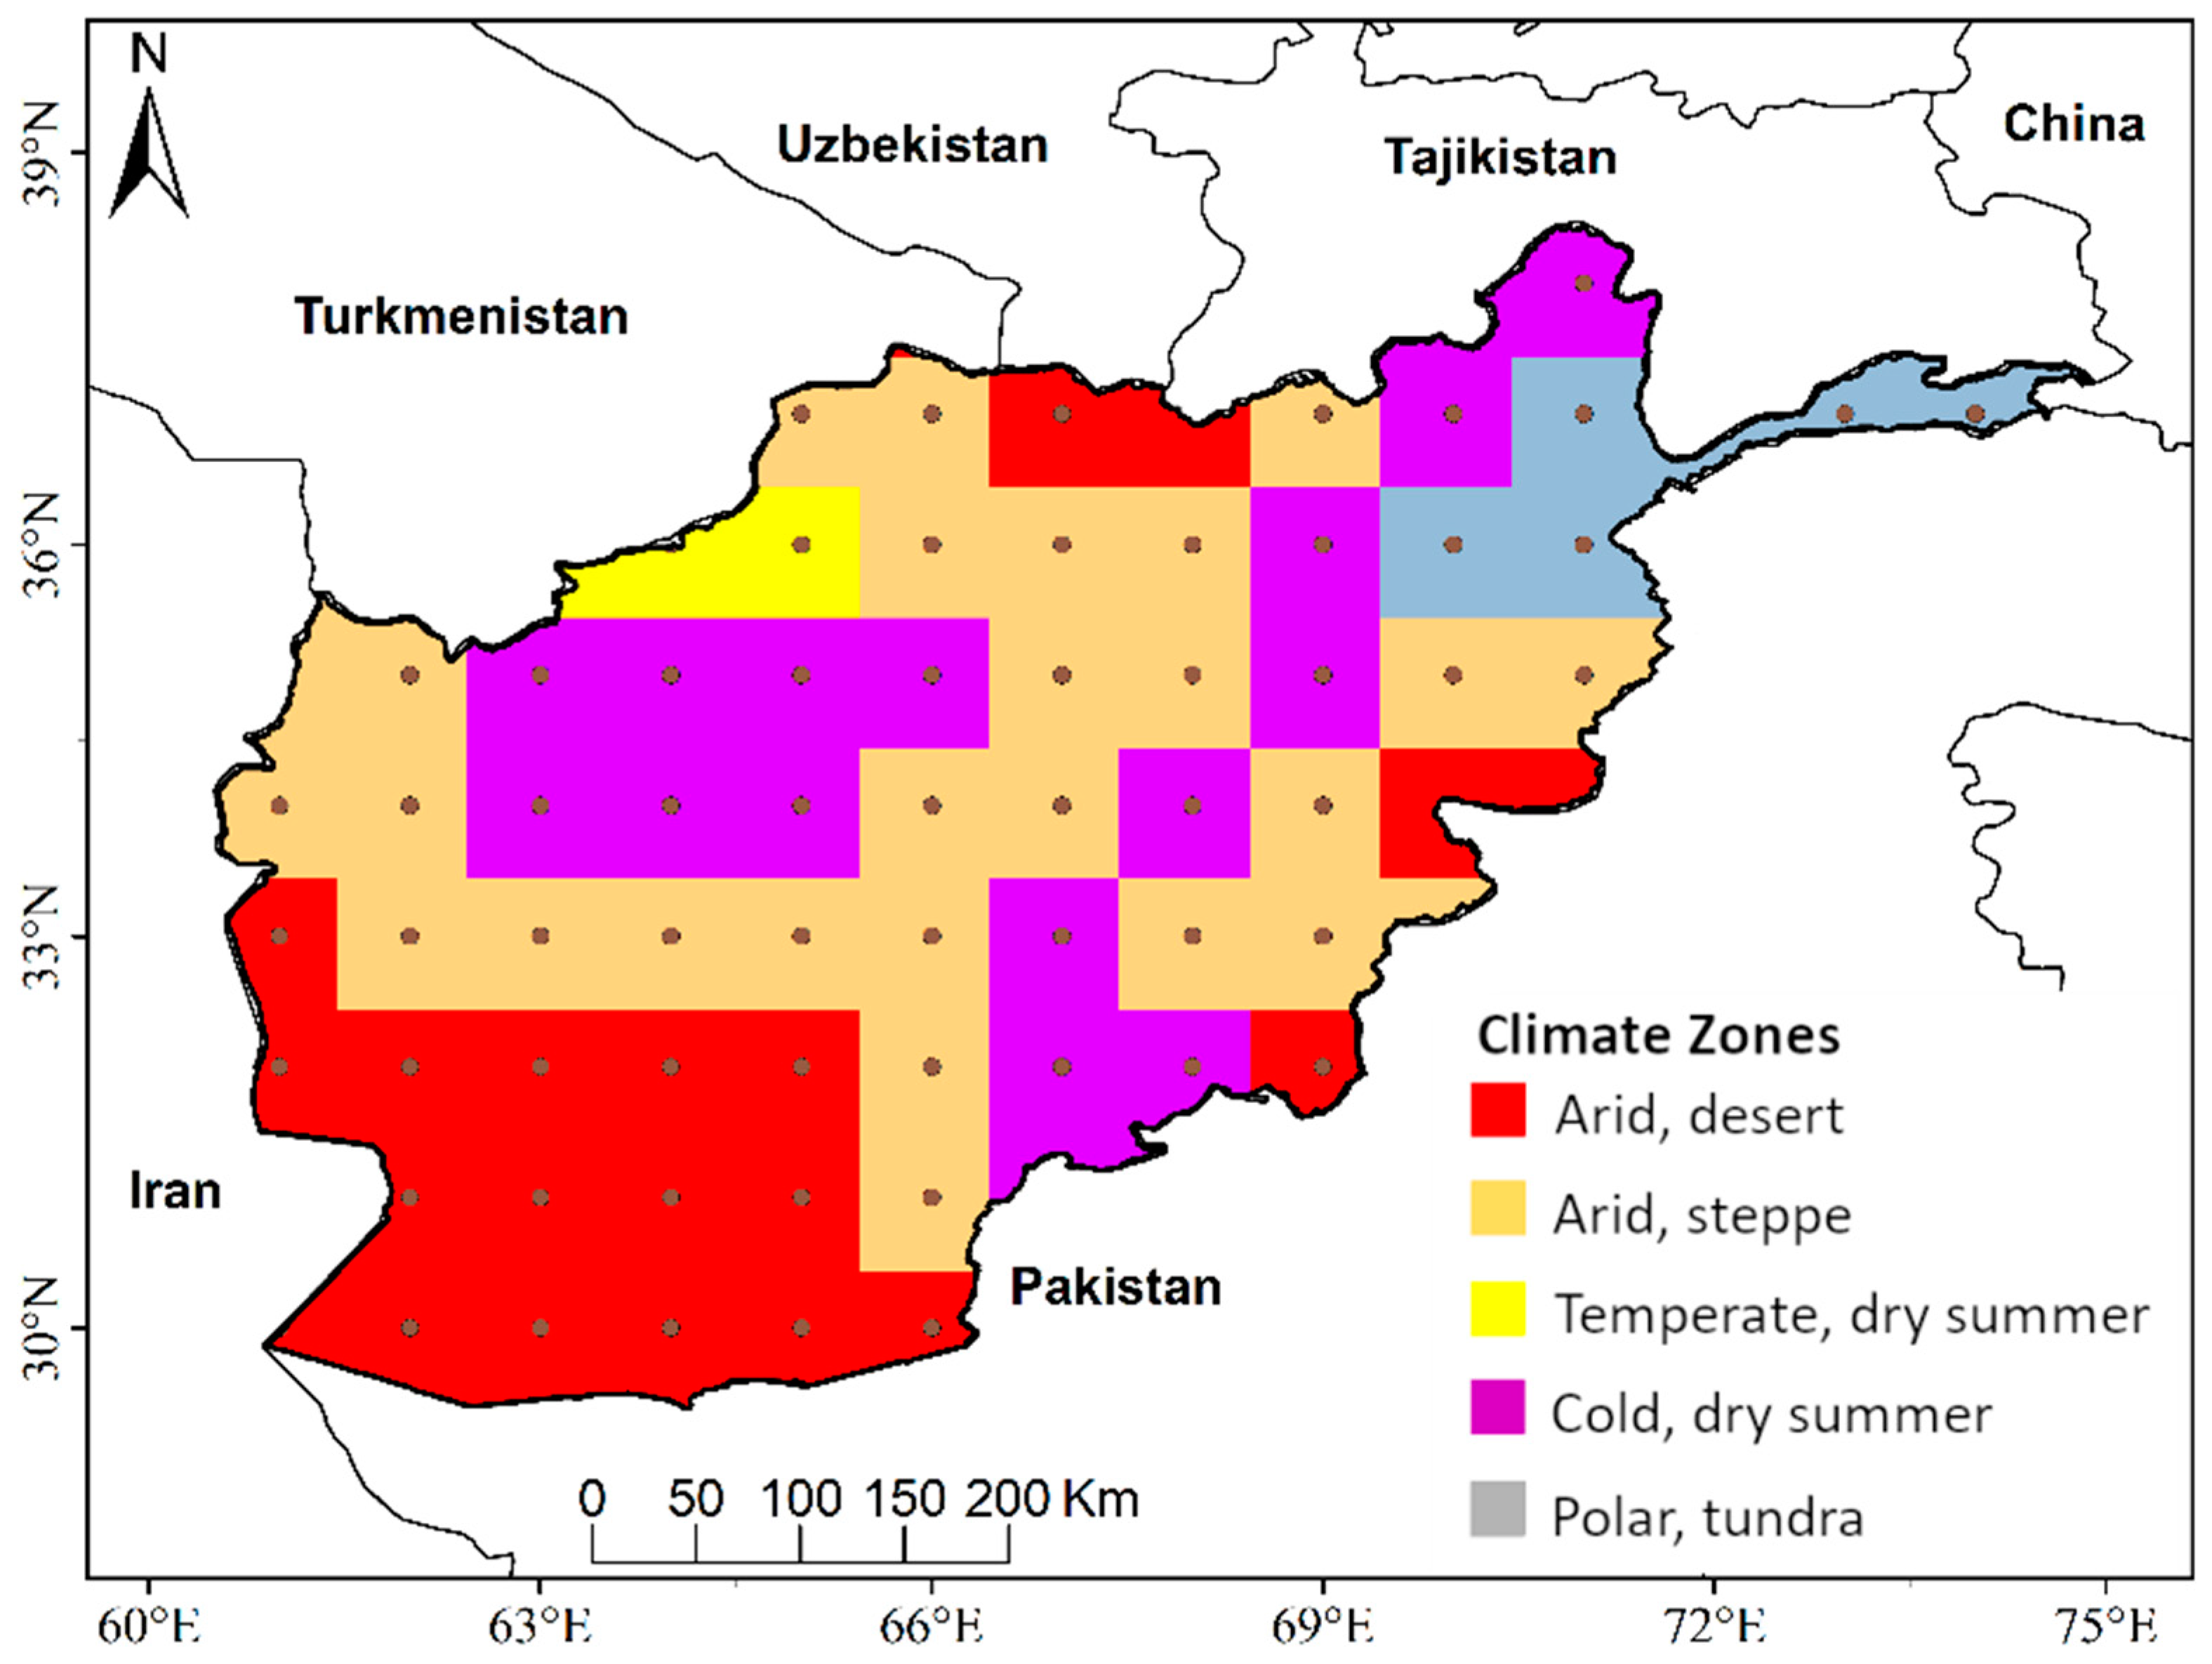
2. Study Area and Datasets

Afghanistan, bounded by geographical coordinates 29°35′ N–38°40′ N latitude and 60°31′ E–74°55′ E longitude, is located within the southwest area of Central Asia (Figure 1). It is bordered by Uzbekistan, Tajikistan, and Turkmenistan in the north; to the west by Iran; Pakistan to the southeast; and China in the northeast. Afghanistan’s territory covers 652 thousand km2. The topography of the country is highly undulating with 75% are occupied by mountains. The country has a population of 34 million, out of which more than 70% live in rural areas [54].
The climate of Afghanistan is subtropical and continental, in which summers are hot and sunny while winters are often cold and relatively rainy. The climate zones of the country are five according to Köppen–Geiger climate classification: arid desert, arid steppe, temperate dry summer, cold dry summer, and polar tundra (Figure 1). The annual average of total rainfall of the country is 300 mm. However, the differences in rainfall are substantial and vary according to the altitude and area. The south is very dry, covered mostly by desert, and because of altitude, many areas are cold. Because of the part effects of the Indian monsoon, the Far East is relatively rainy even during the summer. This area also experiences a broad range of variations in temperature. The mean temperature in July on the plains is of the range 0–8 °C with the absolute minimum temperature ranging from −20 to −25 °C. The mean temperatures in July on the plains range from 24 to 32 °C with a 45 °C absolute maximum temperature [30].
A major challenge facing hydrological studies in many parts of the globe is the inadequacy/unavailability of long records of terrestrial water monitoring [11,55,56]. To address this, the satellite-based TWS monitoring data of GRACE has gained popularity in use in recent years [57]. GRACE provides the change in TWS relative to the time-mean of the base period (2003–2007). The GRACE satellites measure the gravitational field of the Earth. The monthly change in observed gravity is mainly caused by the change in the surface mass of Earth which is indeed mainly caused by the change in water storage [58]. In order to filter out the noise while preserving the real geophysical signal, two methodologies have been used, the spherical harmonic and the mass concentration blocks (mascons) data versions. There are three GRACE solutions derived from the standard spherical harmonic approach (JPL, CSR, and GFZ) [58,59,60,61,62] and two from the mascon approach (GSFC, JPL, and CSR) [63,64,65,66]. Studies revealed analysis of TWS anomaly of different GRACE solutions yield difference in results for GRACE solutions derived using different approaches [67,68]. However, studies also revealed a high correlation in GRACE mascons and spherical harmonics solutions (rank correlation coefficients mostly >0.9) [69]. The present study is limited to three GRACE solutions (JPL, CSR, and GFZ) derived from the standard spherical harmonic approach. The description of the data is provided in Table 1. The use of GRACE data from three sources would help to understand the uncertainty in TWS in the study area.
The GRACE data are available for the period April 2002 to December 2016 with some missing monthly values. The missing data were estimated through linear interpolation of values. In the present study, data from 85 grid points were used to cover entire Afghanistan. The locations of the grids are shown in Figure 1.

3. Methodology

3.1. Procedure

The changes in water availability and sustainability were assessed between the period 2002 and 2016 for the study area. The procedure used for the assessment is given as follows.
  • The GRACE TWS anomaly data with a spatial resolution of 1° × 1° was extracted for 85 grid points of Afghanistan for 2002 to 2016 period.
  • Estimation of the mean TWS for each year for the preparation of the annual time series of the TWS at each of the grid points.
  • The estimation of the trends in TWS was conducted using Sen’s slope and the modified Mann-Kendall (MMK) test was used for the assessment of the significance in change.
  • The RRV concept was employed for assessing the TWS reliability, resiliency, and vulnerability at each of the grid points.
  • The results were analyzed for understanding the factors causing the changes in terrestrial water sustainability in Afghanistan.
Details of the method are provided in the following sections.

3.2. Assessment of Trends in Water Availability

The trends in TWS of Afghanistan were assessed in order to understand the changes in total water availability in the country. The magnitue of the changes in TWS was estimated using Sen’s slope [70] while the significance of the changes was estimated by the modified Mann–Kendall (MMK) trend test [71]. In the Sen’s slope method, time series (Qmed) changes are computed as the median of N slopes estimated from consecutive two points of the series as follows.
Q m e d =   { Q | N + 1 2 |   i f   N   i s   o d d Q | N 2 | +   Q | N + 2 2 | 2   i f   N   i s   e v e n
The significance of the trend in TWS was assessed using the MMK test. The classical Mann-Kendall test statistic (S) for a time series, x with n number of data points is calculated as follows,
S = k = 1 n 1 . i = k + 1 n s i g n   ( x i   x k )
where
s i g n   ( x i   x k ) =   {   + 1             w h e n   ( x i   x k ) > 0       0               w h e n   ( x i   x k ) = 0 1             w h e n   ( x i   x k ) < 0
The significance of the trend is calculated by using Z statistics as follows,
Z = { S 1 V a r   ( S )     w h e n   S > 0 0                             w h e n   S = 0 S 1 V a r   ( S )     w h e n   S < 0
where V a r   ( S ) is the variance of S.
In the MMK test [72], the significant trend estimated using the MK test is firstly removed from the time series. Then, equivalent normal variants of rank (Ri) of the de-trended series is estimated as,
Z i =   ϕ 1   ( R i n + 1 )
where, ϕ 1 is the inverse standard normal distribution function. The correlation matrix of self-similarity of the time series or the Hurst coefficient (H) is derived by using the following equation:
C n ( H ) =   [ ρ | j i | ] ,     f o r   i = 1 : n ;   j = 1 : n  
ρ l =   1 2   ( | l + 1 | 2 H   2 | l | 2 H + | l 1 | 2 H )
where, ρ l is the autocorrelation function of lag l for a given H. The value of H is obtained using maximum log likelihood function. The significance level of H is determined by using mean and standard deviation for H = 0.5. If H is found significant, the biased estimate of the variance of S is calculated for given H as,
V ( S ) H =   i < j k < l 2 π   s i n 1   ( ρ | j i | ρ | i l | ρ | j k | + ρ | i k | ( 2 2 ρ | i j | ) ( 2 2 ρ | k l | ) ) .  
The bias in estimation of V ( S ) H is removed using a bias correction factor, B as below:
V ( S ) H = V ( S ) H × B
where B is a function of H. The significance of MMK test is computed using Equation (4) by replacing V ( S ) with V ( S ) H .

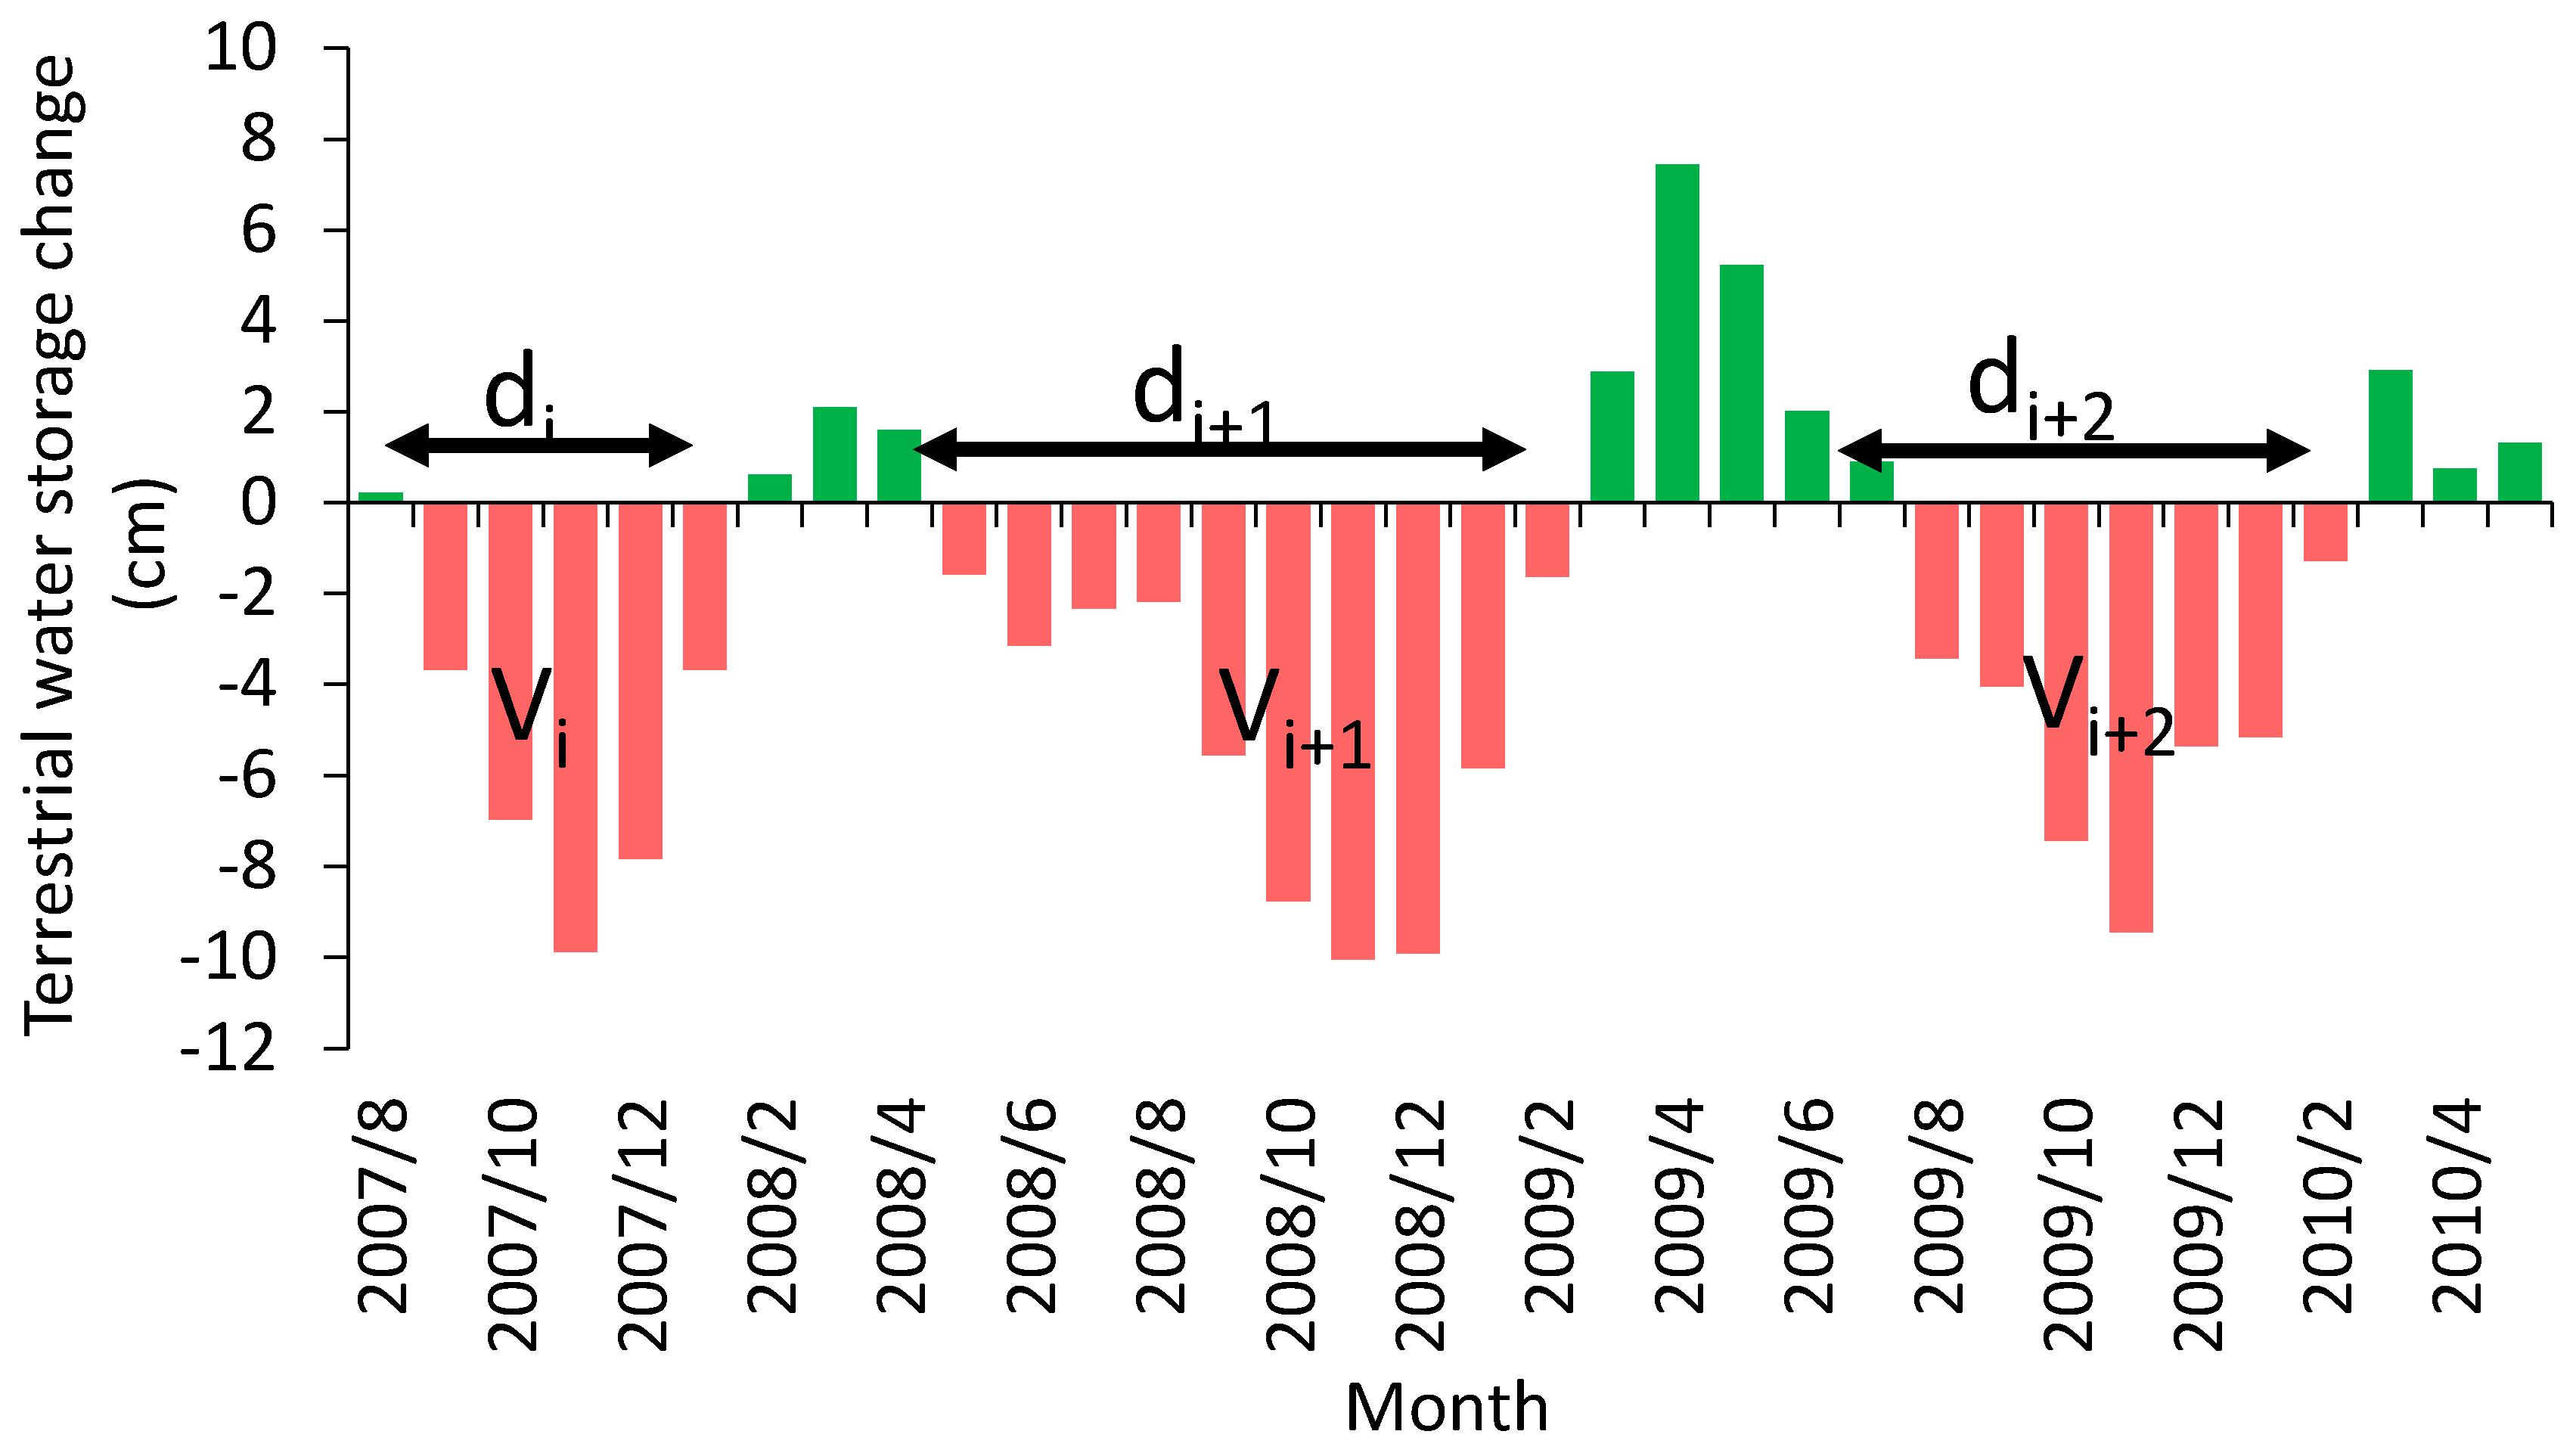
3.3. Assessment of Sustainability in Water Resources

Sustainability (S) is considered a function of the resiliency, reliability, and vulnerability of TWS in this study. It is calculated as [50]:
S = [ R e l i a b i l i t y   ×   R e s i l i e n c y   ×   ( 1 D i m e n s i o n l e s s   V u l n e r a b i l i t y ) ] ( 1 3 )
The estimation of the reliability, resiliency, and vulnerability was done using the standardized TWS anomaly data. In this study, a threshold of −1 which defines the declination of TWS below one standard deviation from the mean was considered.
The reliability of TWS is defined as how often it falls below the normal conditions [57,73]. The resiliency is the possibility of the TWS to regain its normal level after an event, i.e., after a drop, while the vulnerability is the measure of the magnitude or extent of an event. Division of vulnerability by the demand gives the dimensionless vulnerability. The reliability, resiliency, and the dimensionless vulnerability are calculated based on this concept.
R e l i a b i l i t y = 1 j = 1 M d ( j ) T
R e s i l i e n c y = ( 1 M j = 1 M d ( j ) ) 1
D i m e n s i o n l e s s   V u l n e r a b i l i t y = 1 M j = 1 M v ( j ) D e m a n d
V u l n e r a b i l i t y = 1 M j = 1 M v ( j )
M in Equations (11)–(14) is a representation of the total number of TWS negative changes, d is the event duration, T is the number of time intervals, and v is the vulnerability. In this study, the demand was considered −1, and expectations are that TWS should not go below the one standard deviation from the mean. The details of the method are illustrated in Figure 2.

3.4. Assessment of the Spatial Patterns of the Changes

There is variation in sustainability and relating parameters over space and time [74,75]. In order to better understand the changes of these parameters, analysis of the spatial water sustainability is required. However, there is a need for information from several locations or sites for such analysis particularly over a large area [43]. ArcGIS 10.4 is an important tool which has the ability to provide varying ways of displaying an event spatially on a map [76,77]. In this present study, thus, the changes in TWS, reliability, vulnerability, resiliency, and sustainability are given for each GRACE grid point by the use of map symbology (e.g., points) of ArcGIS for the preparation of the maps. The magnitudes of the changes are represented by different colours in order to understand the magnitude of the changes.

4. Results

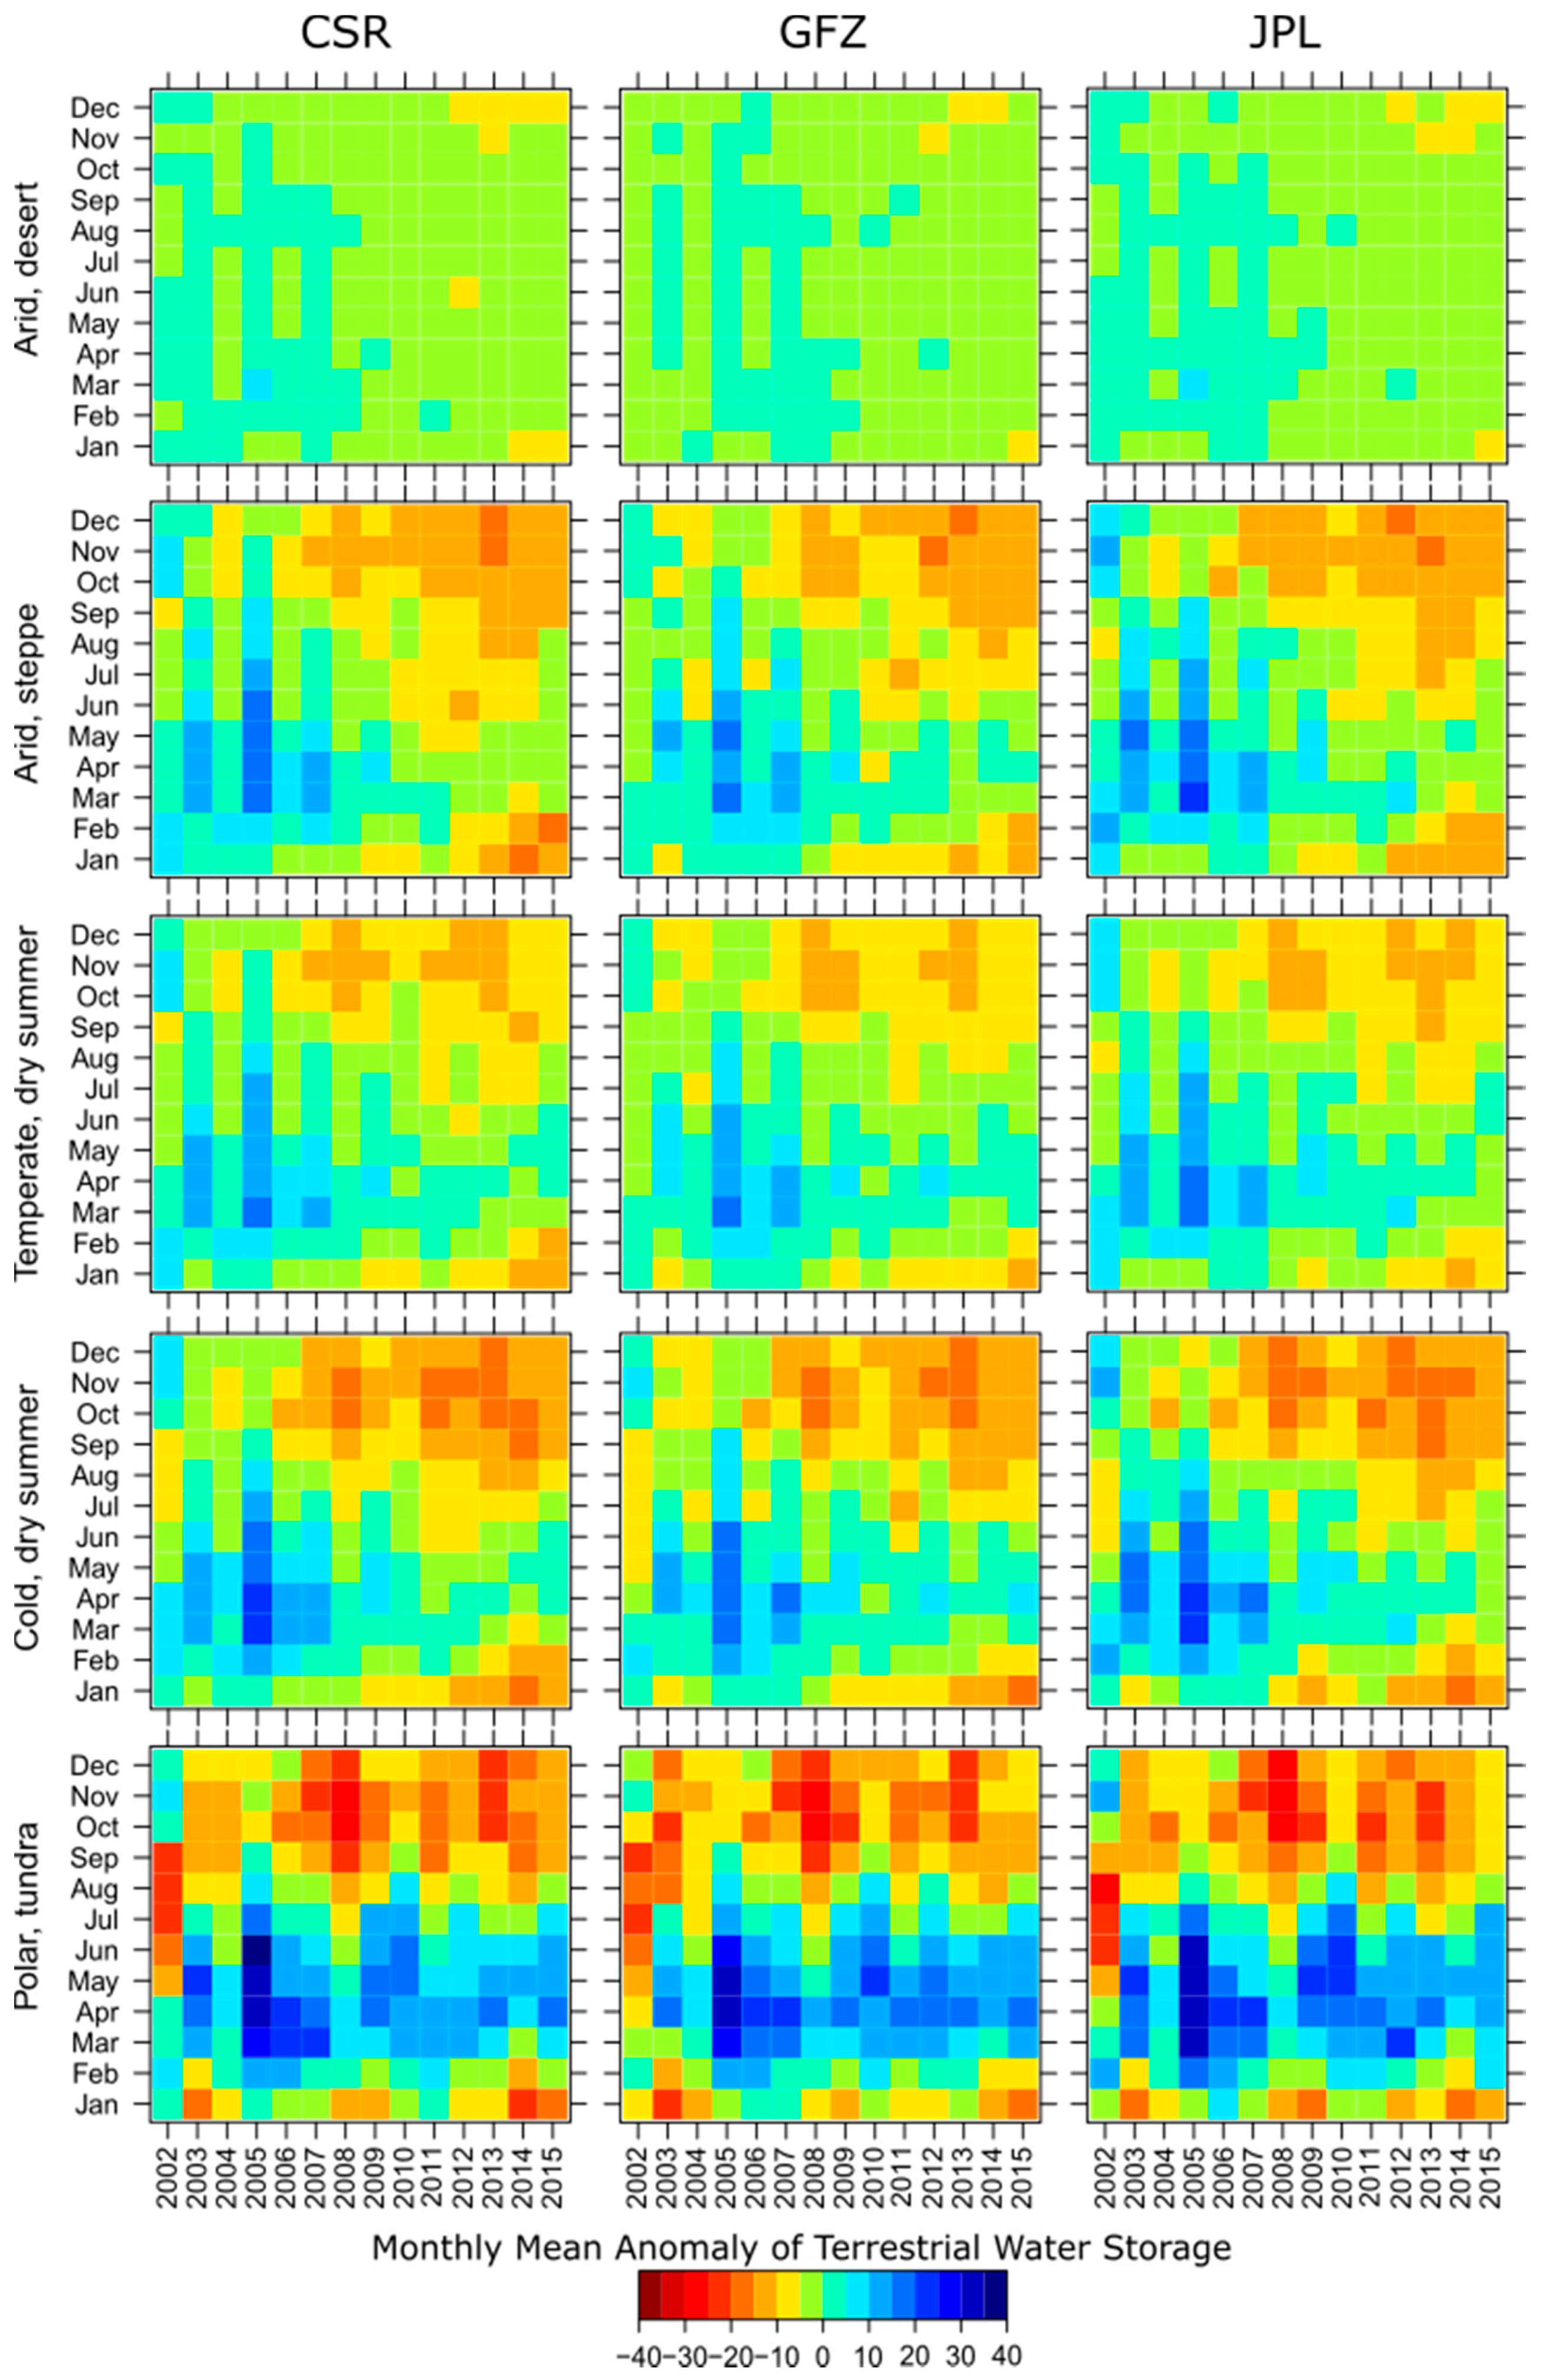
4.1. Monthly and Yearly Temporal Pattern in Terrestrial Water Mean Storage

The monthly anomalies of the TWS gridded data of the five climate zones of Afghanistan were averaged and presented as level plots in Figure 3. The figure is prepared using the data from three GRACE solutions (CSR, GFZ, and JPL). Overall, the three solutions clearly revealed a similar pattern in variations of TWS among months and years over each climatic zone. A monthly cycle of a positive and negative anomaly of TWS was observed in the polar, tundra climate zone of Afghanistan during 2002–2015 ranging between 40 cm to −35 cm. The positive anomaly of TWS was mainly observed from February to July, and it was negative in the rest of the year. The same cycle was observed in the early years for other climate zones (arid, desert; arid, steppe; temperature, dry summer; and cold, dry summer). However, the period of the negative anomaly of TWS has become longer in these four climate zones especially for arid, desert climate zone and the positive anomaly of TWS became rare in recent years. The negative anomaly of TWS has become more intense in recent years reaching −25 cm in November and December.
Precipitation in winter is the cause of positive TWS in winter and post-winter periods. The use of water for agriculture and other purposes causes a gradual decrease in TWS in the following months. Longer period of negative TWS in recent years means more water is abstracted or less precipitation in winter. The less amount of water or overuse of water causes rapid exhaustion of water resources and a negative anomaly of TWS for a longer period in a year.

4.2. Spatial Patterns of Terrestrial Water Storage

Temporal variability of TWS provides an understanding of reliability in water resources. The spatial patterns in the variability of TWS anomaly estimated by the three GRACE solutions are presented in Figure 4. The variability values are divided into five classes, and they range from 0.00 to 20.86. High variability in TWS indicates less reliability in water resources and vice versa. The figures show that variability is low in the southern regions and high in the northeast while most of the central regions also have high values in the range of 4.16 to 7.56. Overall, the regions in the arid climate have the lowest variability while the highest variability was observed in the polar tundra climate in the range of 11.45 to 20.86. It can be observed that all solutions have more or less similar patterns with minor differences.

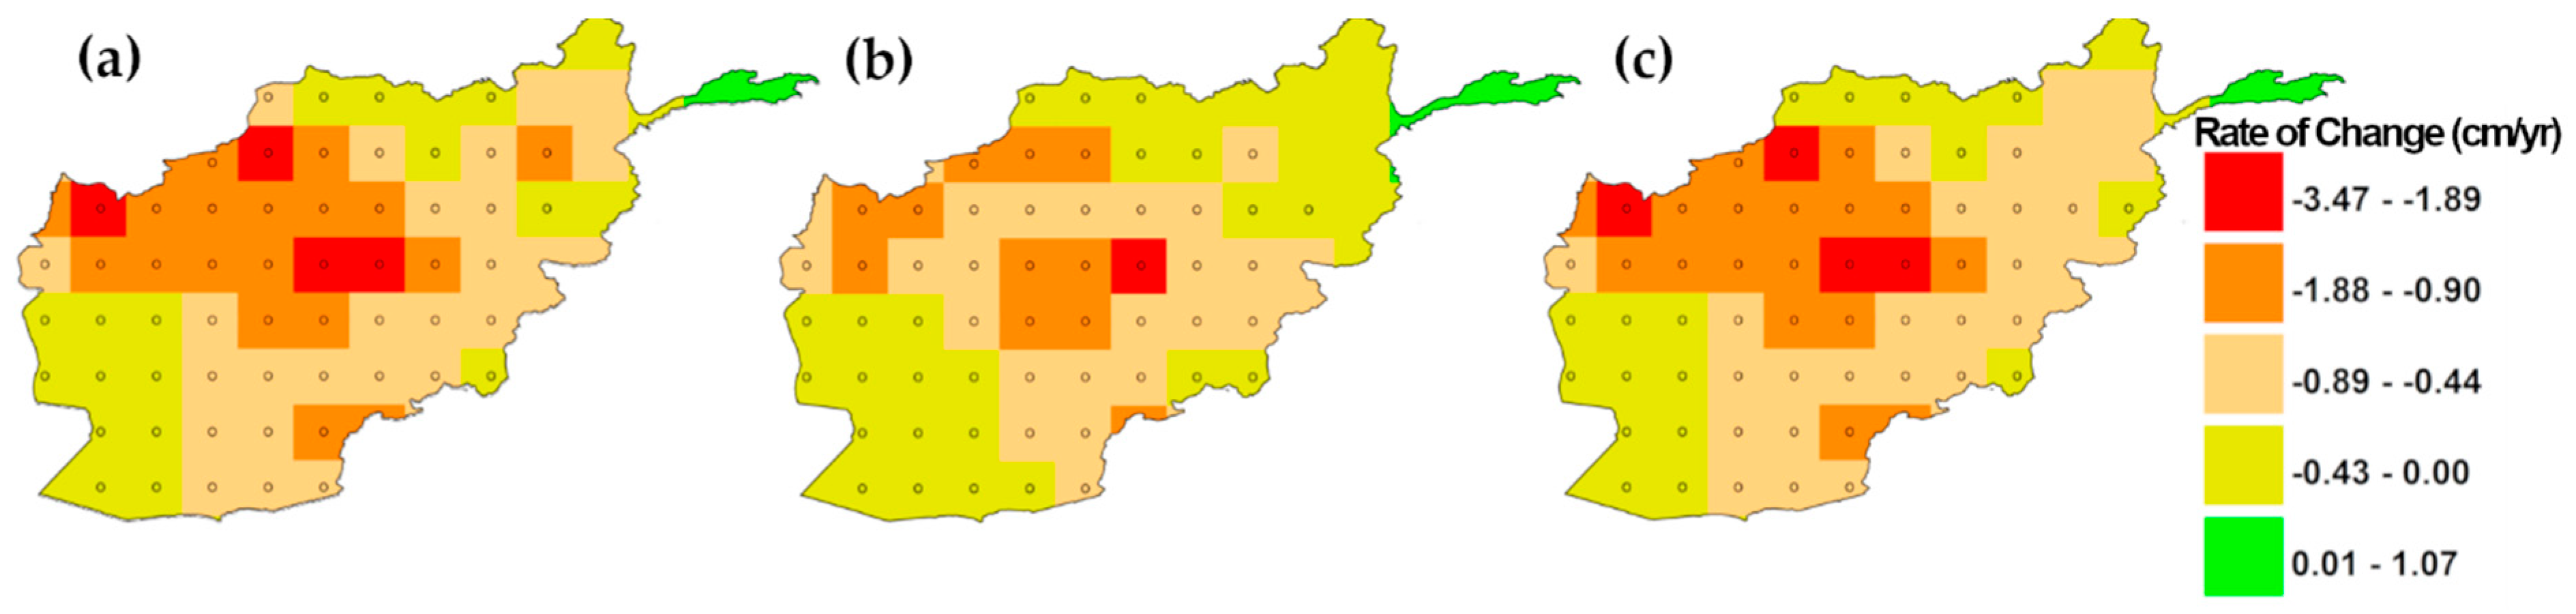
4.3. Trends in the Terrestrial Water Storage

The spatial patterns of the changes in TWS estimated using the CSR, GFZ, and JPL GRACE solutions are presented in Figure 5. Using Sen’s slope, the rates of change were estimated and presented using different colors. If the rate of change was found significant at a grid point using the MMK test at the 95% level of confidence, a node symbol was added at the location of the grid point in the map. The rate of change was divided into five classes ranging from 0.01 to −3.47. The figure showed that most of the area has negative change while a small area in the northeast has positive change. The figure shows a significant decrease in water resources in most of Afghanistan by all the three GRACE solutions. The highest significant decrease was found in the central region at a rate of −3.47 to −1.89 cm/year. The same can be noticed in all solutions. The southwest region of Afghanistan (arid, desert climate) has a significant decreasing change in the range of −0.43 to 0.00 cm/year by the three solutions. The northwest region (temperate, and cold dry summer) has a decreasing TWS at a rate of −1.88 to −0.44 cm/year. The TWS in the southeast regions (cold, dry summer and arid, steppe climate) was decreasing at a rate ranges between −0.89 and 0.00 cm/year.

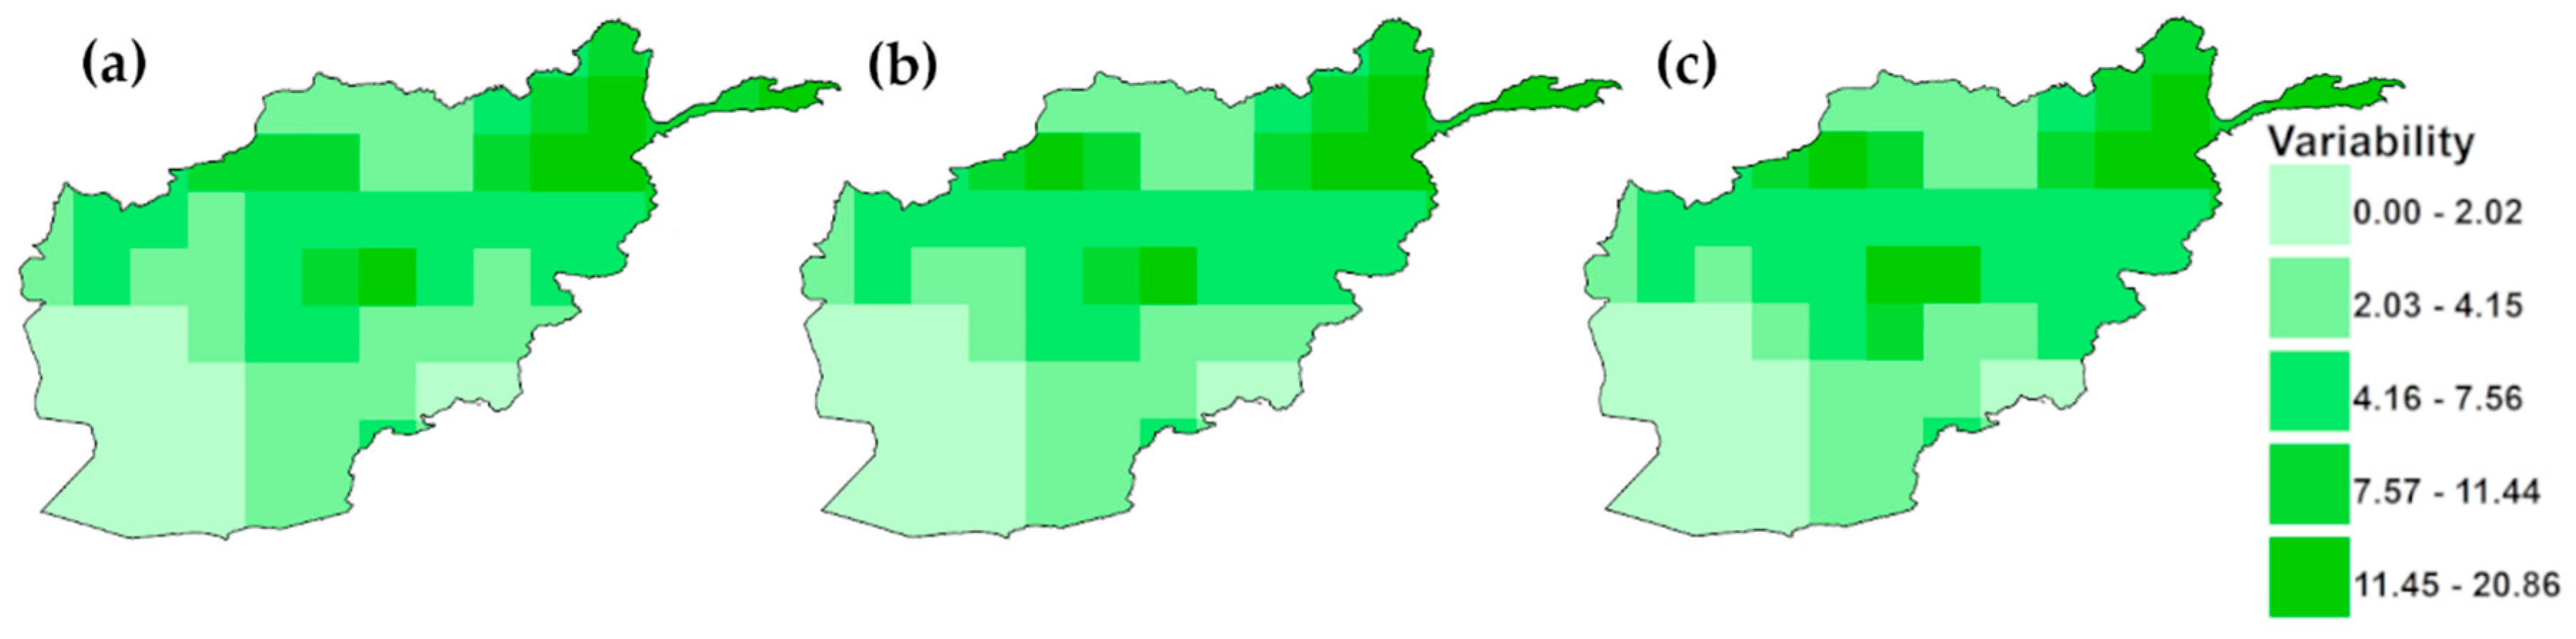
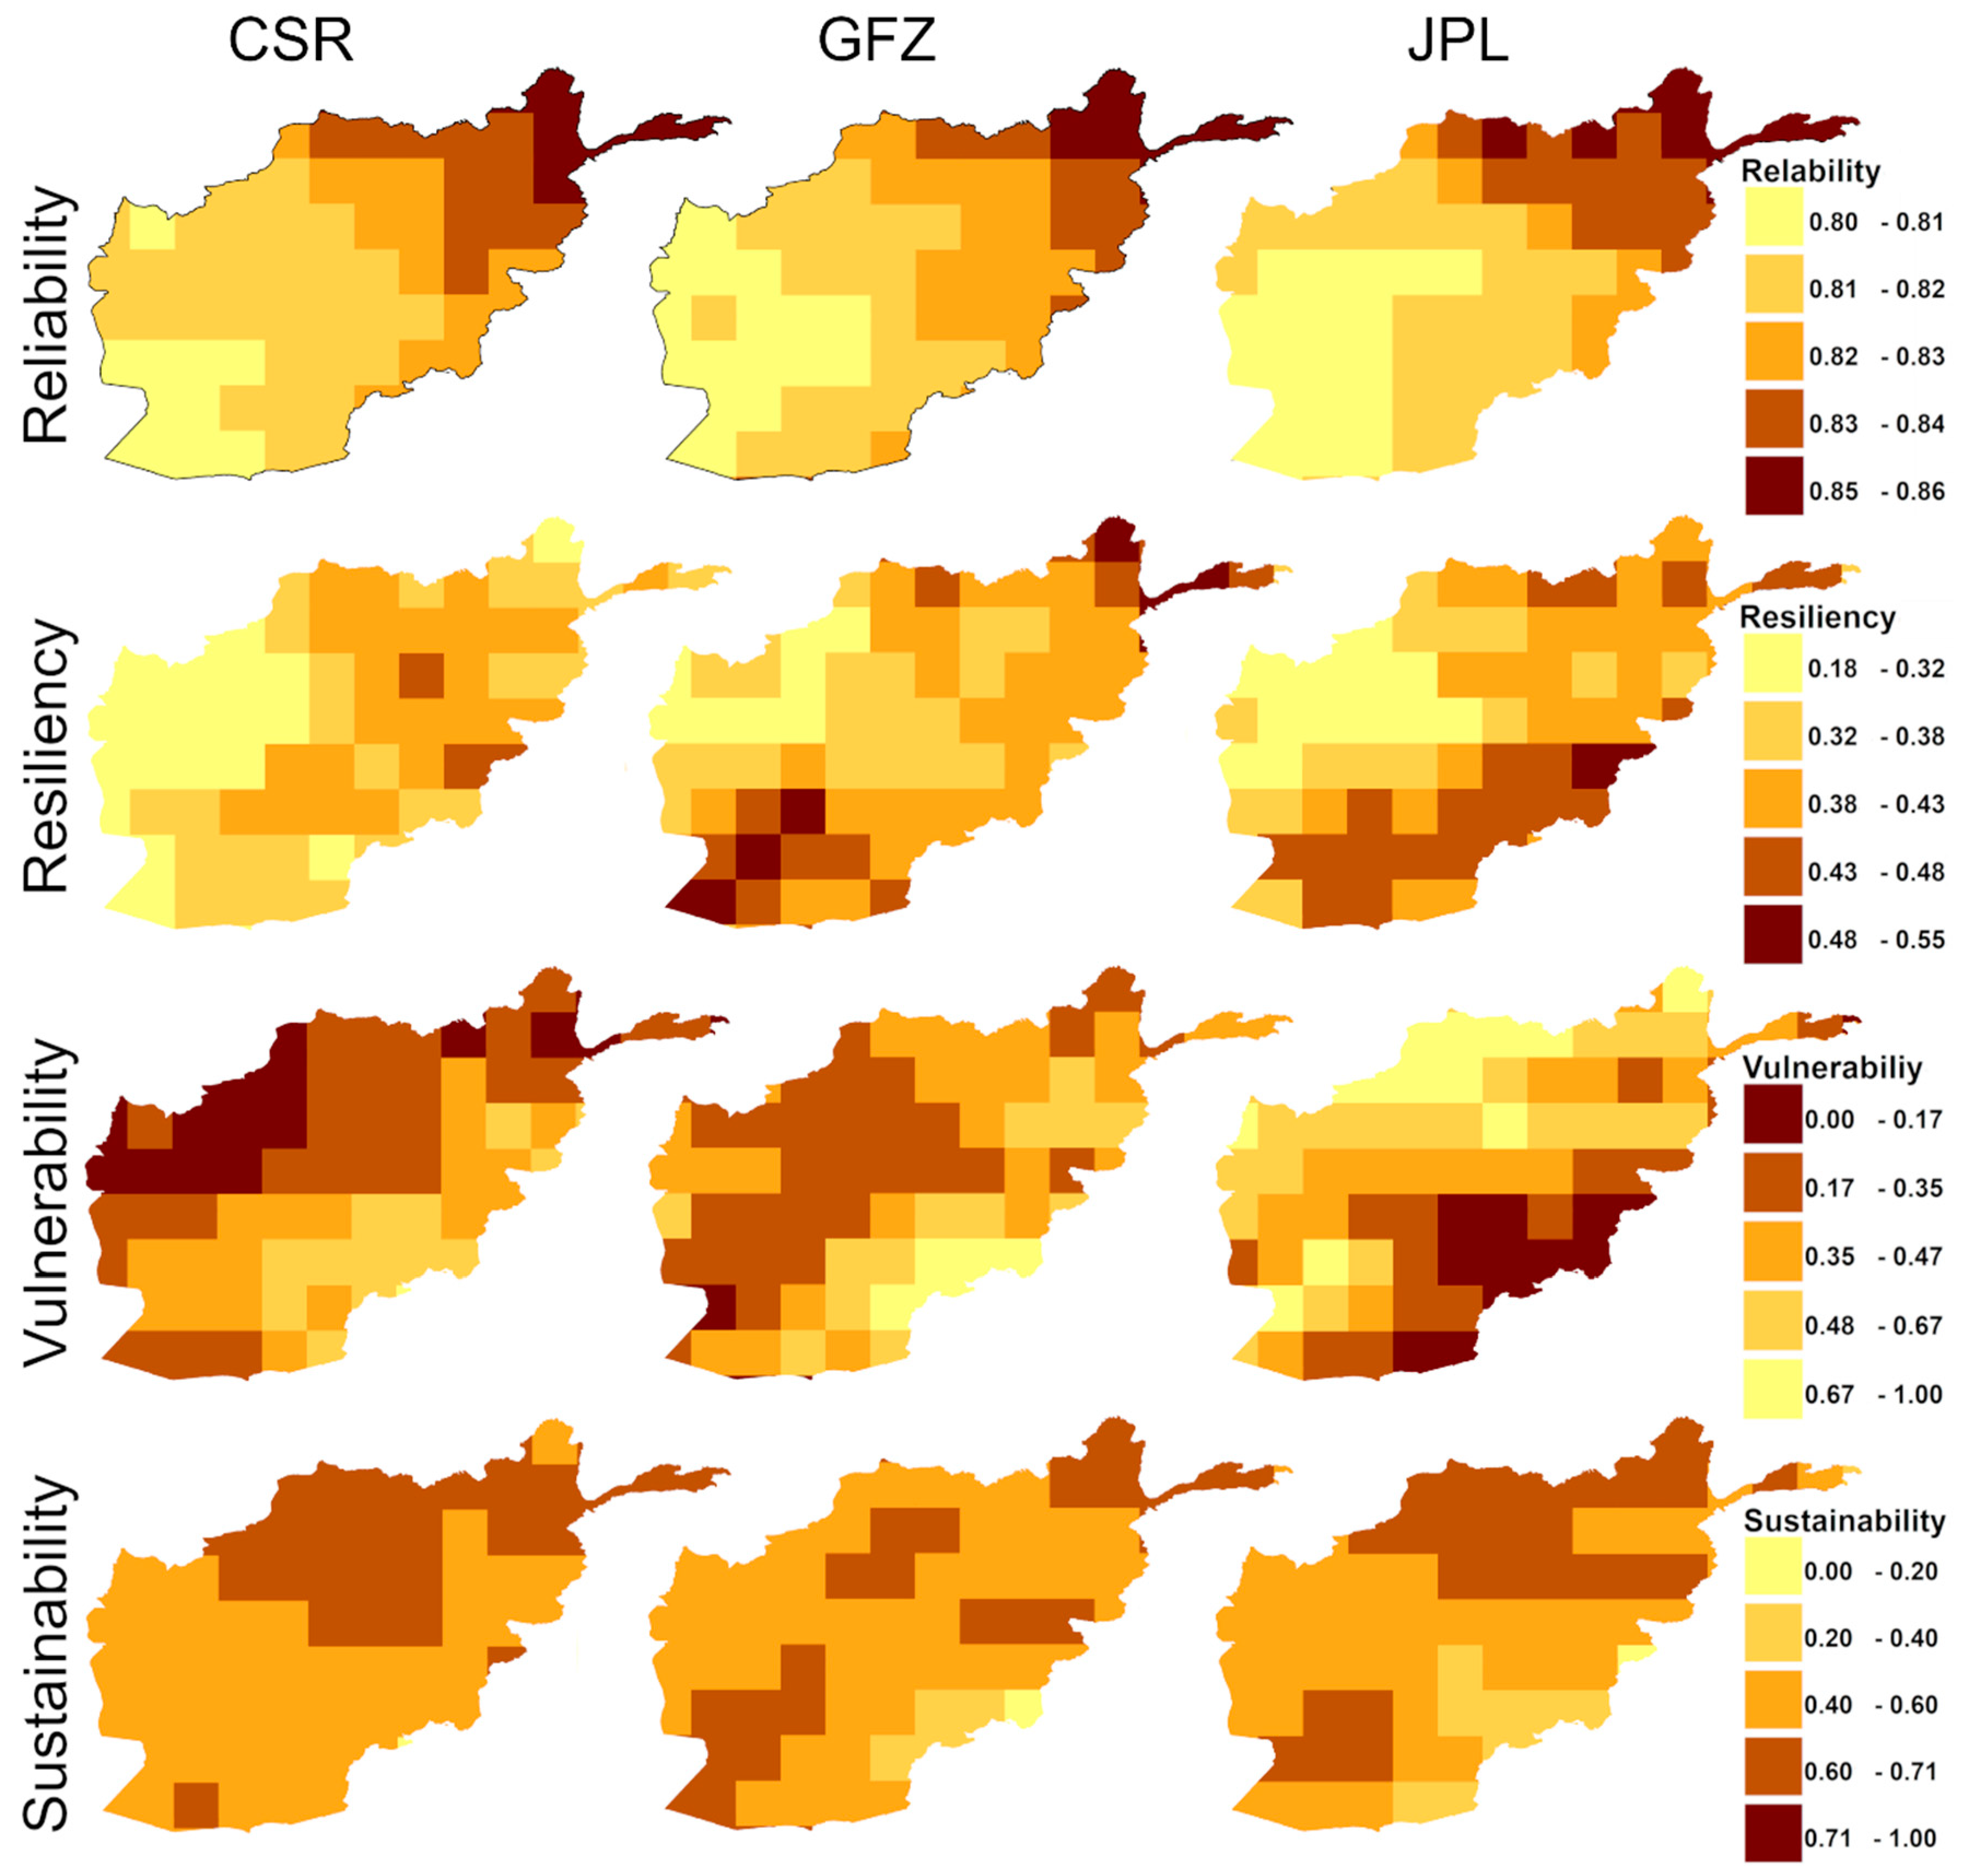
4.4. Reliability, Resiliency, Vulnerability, and Sustainability

The reliability, resiliency, vulnerability, and sustainability index of TWS were calculated at each grid point of GRACE and presented in Figure 6. The maps prepared using TWS data of different GRACE solutions are given in different columns in the figure. Consistence results were observed in estimated reliability from all the solutions. Overall, the reliability values estimated using the three solutions were high (0.80–0.86). The highest value of reliability was observed in the northeast region (polar, tundra climate) (0.86) and the least in the southwest and west regions (0.80). In the case of resiliency in TWS, large spatial variation was observed in a range between 0.18 and 0.55. The difference in the spatial pattern in resiliency was also observed among the GRACE solutions. The CSR showed a bit different spatial pattern of resiliency than GFZ and JPL especially in the northeast and west areas of Afghanistan. However, the grids in the northwest area showed the lowest resiliency values (0.18–0.32) for all the three solutions. Furthermore, the three solutions showed a common value of resiliency in the north and the east area (0.38–0.43). The highest value of resiliency (0.48–0.55) was observed in the south for CSR and JPL GRACE solutions. The spatial distribution of vulnerability in total water storage revealed that the northeast and central regions of the country has the least vulnerable areas as they have the lowest vulnerability values of 0.00–0.35. In contrast, the southeast and east regions are the most vulnerable.
The sustainability maps obtained through integration of reliability, resiliency, and vulnerability maps are presented in the bottom row of Figure 6. Inconsistency in sustainability in water resources was observed for different GRACE solutions. Overall, the estimated values of sustainability index by the three solutions were found in a range between 0.40 and 0.60 at most of the regions of Afghanistan. The GFZ and JPL provided more or less similar sustainable values while CSR showed a somewhat different pattern. However, all the solutions showed the highest sustainability (0.60–0.71) in the north and northeast of the country. The least sustainable regions having values of 0.0 to 0.40 were observed in the southeast by GFZ and JPL. However, CSR showed a moderate sustainability index in the southeast. Overall, it can be remarked that water resources in the northeast and southwest regions are more sustainable and in the southeast region less sustainable.

5. Discussion

This study reveals that the CSR, GFZ, and JPL GRACE solutions TWS data are similar in patterns in the different months of the years considered in the study. In the arid desert climatic region, there was a sudden change in the positive TWS anomaly after 2008 to a negative one till 2016, which occurred for all the months except for few. The lesser changes in the TWS anomaly in this area are probably due to there being fewer inhabitants due to its aridity. In the mountainous Polar Regions of the country, the influence of the changes in the seasons on TWS anomaly can be observed. For example, TWS is observed to shift from negative to positive after the temperatures rise in spring (March to May) and snowmelt occurs. After the snowmelt, a drastic decline in water storage is observed from the summer season (June to August) to the end of autumn (November). A generally negative trend in TWS anomaly was observed for the other regions for all the three solutions indicating that water storage generally decreased over the study period in Afghanistan.
The spatial patterns of the variability of the TWS for the three solutions also showed that the arid area where rainfall is lower and less inhabited has lower variability in TWS. Contrary to this, the northeast and the central parts of the country, which get snow, have the highest variability in TWS in the country. This may be due to higher water use in the region [78]. The spatial distribution of croplands of Afghanistan [79] is shown in Figure 7. The figure shows croplands are mostly located in the north and northeast of the country while there are almost no croplands in the southwest [80]. Agriculture is the major user of water resources in the country. About 98% of the water in Afghanistan is used for agriculture. TWS was found to vary more in the north where there is more agricultural activity. It can be inferred that higher withdrawal of water for agriculture in the north and northeast have made the TWS highly variable in the region.
The rate of change of trends of the TWS estimated by the use of Sen’s slope showed that aside from the far northeast area of the country, the observed changes were negative. These negative changes in TWS were significant for almost the entire country except for part of the northeast. This indicates that total water resources in the country are declining with time. Obtained results were analyzed along with the rainfall and temperature trends of the country to understand the causes of declination in water resources. The trends in the annual total precipitation and the annual mean of daily temperature are presented in Figure 8. The gridded Global Precipitation Climatology Center (GPCC) precipitation and Climate Research Unit (CRU) temperature for 1961–2010 period were used for this purpose. The colors in the maps are used to show the rate of change per decade while the plus and minus symbols are used to show the significance of the changes. The figures show that the temperature of the entire country except in a small patch in the southwest is increasing significantly. The rate of temperature rise is high in the west (0.14 °C/decade) where the annual mean temperature is high and low in the north (<0.06 °C/decade) where the annual mean temperature is lower. It means that temperature is increasing more in regions of high temperature and less in low-temperature region. The spatial distribution of precipitation trends show an increase at a few locations in the northeast and a decrease in the southeast.
Declination of TWS in different regions of Afghanistan can be justified with the trends in climate. Higher evapotranspiration due to rises in temperature and no change in precipitation have caused a reduction in TWS in most parts of the country. This is accelerated due to the higher use of water for agriculture. Declination in TWS was higher in the north where there is more agricultural activity. Besides, large declination of TWS was found at Kabul which may be due to higher abstraction of water for residential and commercial activities. The agricultural activities in the southwest are very limited. However, declination of TWS in the region may be due to the decrease in rainfall as shown in Figure 8. Even though water withdrawal for agricultural purposes is high in the northeast, there were no significant changes in TWS due to an increase in precipitation in the region. The results indicate that climate change plays a significant role in the declination of water resources in Afghanistan. Sustainable management of water resources through prudent use of this precious resource is very important for the country to combat climate change.
The RRV analysis revealed that the reliability of water is highest in the polar; tundra region followed by the central arid steppe and the cold; dry summer regions. The least observed reliability occurred at the southwestern arid area. Resiliency in water resources was estimated to be highest at the southwestern arid and the north-eastern polar, tundra areas by the GFZ and the JPL solution, while the CSR solution shows the highest resiliency in the cold dry summer area. The vulnerability in water resources was highest in the northeast and the south-east of the country while the least vulnerable area was the north-west region of temperate, dry summer and cold, and dry summer areas. The sustainability of water resources in Afghanistan was observed to be least in the south-east area where the vulnerability was highest for the GFZ and the JPL solutions. Sustainability was observed to be highest in the north-central and northeast for the CSR solution. For the GFZ and the JPL solutions, the sustainability of water resources was highest in the northeast and the south-west parts of the country. Increasing rainfall in the northeast and less use of water in the southwest probably made the region more sustainable in water resources.
The sustainability map obtained using CSR was found to be somewhat different from the one obtained using GFZ and JPL. The raw GRACE data are processed using complex inverse models which require to consider many parameters and solution approaches. This causes a difference in results obtained using different GRACE solutions. Jing, Zhang [68] assessed the trends and the variations of different GRACE solutions over Tibetan Plateau and found a different magnitude of change in CSR TWS anomaly than in the JPL and GFZ TWS anomaly. Scanlon, Zhang [69] also showed differences in water storage trends in different GRACE products in different major river basins of the world. The differences in results obtained using different GRACE solutions give a presumption of the uncertainty in TWS changes in Afghanistan.
Overall, the study revealed that human activities such as overexploitation of water for agriculture (in the north) and for domestic purposes (in the central region) have caused a declination of TWS in Afghanistan. Excessive use of water for irrigation has made the TWS highly variable and reduced sustainability in water resources of the country. Besides the human pressure, the changes in climate are also playing a role in declination of sustainability in water resources of Afghanistan.
The findings from this present study corroborate the findings of few studies conducted in the nearby countries, such as [34,43,48,76] which showed a generally decreasing trend in the water storage and increasing aridity [81,82] in the Central Asia region. This emphasizes how important it is to conserve and improve water resources management in the region, particularly for Afghanistan where more populace would need the resource for irrigation purposes in the future as the population continues to grow and the climate continues to change.

6. Conclusions

A study was conducted to map the spatial patterns of terrestrial water storage changes from three spherical harmonic GRACE solutions (CSR, GFZ, and JPL) and assessment of sustainability in water resources over Afghanistan for the period 2002 to 2016. The changes in available water were estimated using Sen’s slope. MMK was used to verify the significance of trends at a 95% level of confidence. The results of the study showed positive TWS mainly from February to July and negative in the rest of the year. The yearly variations showed that negative anomaly of TWS has been more intense in recent years. The results also showed that variability of TWS is low in the southern regions and high in the northeast while most of the central regions have a value of 4.16 to 7.56. Trend analysis showed that the southwest region has a significant decreasing change in the range of −0.43 to 0.00 cm/year. The TWS was found more sustainable in the eastern regions. Overall, all GRACE solutions showed more or less similar results. Therefore, it can be concluded with confidence that water resources in Afghanistan are decreasing with time. Although the information on the water use activities is unavailable in Afghanistan, the low sustainability in water resources in intense agriculture area indicates overexploitation may be the main cause of water stress in the region. Climate change may also play a role in the declination of water resources in the country. High rise in temperature and almost no change in precipitation may be the cause of declination of water resources in many regions. The present study was limited to GRACE spherical solutions. Further work can be conducted to assess the uncertainties in the TWS sustainability using the GRACE mascon solutions.

Author Contributions

M.N.S., X.W., S.S., and M.A. conceptualized the idea. M.S.S. and M.S.N. collected data and pre-processed. M.N.S., K.A., and S.M.A.M. analyzed the data and prepared results. M.S.S., R.A., and S.A. interpreted the results. All contributed to writing the article.

Funding

This research was funded by Young Top-Notch Talent Support Program of National High-level Talents Special Support Plan. The research was also supported by research grant number: 19H.44 of the Universiti Teknologi Malaysia.

Conflicts of Interest

The authors declare no conflict of interest. The funders had no role in the design of the study; in the collection, analyses, or interpretation of data; in the writing of the manuscript; or in the decision to publish the results.

References

  1. Morrison, J.; Morikawa, M.; Murphy, M.; Schulte, P. Water Scarcity & Climate Change: Growing Risks for Business and Investors; Pacific Institute: Oakland, CA, USA, 2009. [Google Scholar]
  2. Ahmed, K.; Shahid, S.; Chung, E.S.; Ismail, T.; Wang, X.J. Spatial distribution of secular trends in annual and seasonal precipitation over Pakistan. Clim. Res. 2017, 74, 95–107. [Google Scholar] [CrossRef]
  3. Nashwan, M.S.; Shahid, S. Spatial distribution of unidirectional trends in climate and weather extremes in Nile river basin. Theor. Appl. Climatol. 2019, 137, 1181–1199. [Google Scholar] [CrossRef]
  4. Hadi Pour, S.; Abd Wahab, A.K.; Shahid, S.; Wang, X. Spatial Pattern of the Unidirectional Trends in Thermal Bioclimatic Indicators in Iran. Sustainability 2019, 11, 2287. [Google Scholar] [CrossRef]
  5. Shahid, S. A study by groundwater pollution vulnerability using DRASTC/GIS, West Bengal, India. J. Environ. Hydrol. 2000, 8, 1–9. [Google Scholar]
  6. Shahid, S.; Wang, X.-J.; Harun, S.B.; Shamsudin, S.B.; Ismail, T.; Minhans, A. Climate variability and changes in the major cities of Bangladesh: observations, possible impacts and adaptation. Reg. Environ. Chang. 2016, 16, 459–471. [Google Scholar] [CrossRef]
  7. Wang, X.; Zhang, J.; Wang, J.; He, R.; ElMahdi, A.; Liu, J.; Wang, X.; King, D.; Shahid, S. Climate change and water resources management in Tuwei river basin of Northwest China. Mitig. Adapt. Strateg. Glob. Chang. 2014, 19, 107–120. [Google Scholar]
  8. Wang, X.J.; Zhang, J.Y.; Ali, M.; Shahid, S.; He, R.M.; Xia, X.H.; Jiang, Z. Impact of climate change on regional irrigation water demand in Baojixia irrigation district of China. Mitig. Adapt. Strateg. Glob. Chang. 2016, 21, 233–247. [Google Scholar] [CrossRef]
  9. Ahmed, K.; Shahid, S.; Harun, S.b.; Wang, X.-J. Characterization of seasonal droughts in Balochistan Province, Pakistan. Stoch. Environ. Res. Risk Assess. 2016, 30, 747–762. [Google Scholar] [CrossRef]
  10. Nashwan, M.S.; Ismail, T.; Ahmed, K. Non-stationary analysis of extreme rainfall in peninsular Malaysia. J. Sustain. Sci. Manag. 2019, 14, 17–34. [Google Scholar]
  11. Ahmed, K.; Shahid, S.; Nawaz, N. Impacts of climate variability and change on seasonal drought characteristics of Pakistan. Atmos. Res. 2018, 214, 364–374. [Google Scholar] [CrossRef]
  12. Shiru, M.S.; Shahid, S.; Chung, E.-S.; Alias, N. Changing characteristics of meteorological droughts in Nigeria during 1901–2010. Atmos. Res. 2019, 223, 60–73. [Google Scholar] [CrossRef]
  13. Alamgir, M.; Mohsenipour, M.; Homsi, R.; Wang, X.; Shahid, S.; Shiru, M.S.; Alias, N.E.; Yuzir, A. Parametric Assessment of Seasonal Drought Risk to Crop Production in Bangladesh. Sustainability 2019, 11, 1442. [Google Scholar] [CrossRef]
  14. Sa’adi, Z.; Shahid, S.; Ismail, T.; Chung, E.S.; Wang, X.J. Distributional changes in rainfall and river flow in Sarawak, Malaysia. Asia Pac. J. Atmos. Sci. 2017, 53, 489–500. [Google Scholar] [CrossRef]
  15. Salman, S.A.; Shahid, S.; Ismail, T.; Chung, E.-S.; Al-Abadi, A.M. Long-term trends in daily temperature extremes in Iraq. Atmos. Res. 2017, 198, 97–107. [Google Scholar] [CrossRef]
  16. Khan, N.; Shahid, S.; Ismail, T.B.; Wang, X.J. Spatial distribution of unidirectional trends in temperature and temperature extremes in Pakistan. Theor. Appl. Climatol. 2019, 136, 899–913. [Google Scholar] [CrossRef]
  17. Nashwan, M.S.; Shahid, S.; Rahim, N.A. Unidirectional trends in annual and seasonal climate and extremes in Egypt. Theor. Appl. Climatol. 2019, 136, 457–473. [Google Scholar] [CrossRef]
  18. Nashwan, M.S.; Shahid, S.; Wang, X.-J. Uncertainty in Estimated Trends Using Gridded Rainfall Data: A Case Study of Bangladesh. Water 2019, 11, 349. [Google Scholar] [CrossRef]
  19. Gado, T.A.; El-Hagrsy, R.M.; Rashwan, I.M.H. Spatial and temporal rainfall changes in Egypt. Environ. Sci. Pollut. Res. 2019, 1–15. [Google Scholar] [CrossRef]
  20. Wang, X.-J.; Zhang, J.-Y.; Yang, Z.-F.; Shahid, S.; He, R.-M.; Xia, X.-H.; Liu, H.-W. Historic water consumptions and future management strategies for Haihe River basin of Northern China. Mitig. Adapt. Strateg. Glob. Chang. 2015, 20, 371–387. [Google Scholar] [CrossRef]
  21. Iqbal, Z.; Shahid, S.; Ahmed, K.; Ismail, T.; Nawaz, N. Spatial distribution of the trends in precipitation and precipitation extremes in the sub-Himalayan region of Pakistan. Theor. Appl. Climatol. 2019, 137, 2755–2769. [Google Scholar] [CrossRef]
  22. El Kenawy, A.M.; Hereher, M.E.; Robaa, S.M. An Assessment of the Accuracy of MODIS Land Surface Temperature over Egypt Using Ground-Based Measurements. Remote Sens. 2019, 11, 2369. [Google Scholar] [CrossRef]
  23. Nashwan, M.S.; Shahid, S. Symmetrical uncertainty and random forest for the evaluation of gridded precipitation and temperature data. Atmos. Res. 2019, 230, 104632. [Google Scholar] [CrossRef]
  24. Ahammed, S.J.; Homsi, R.; Khan, N.; Shahid, S.; Shiru, M.S.; Mohsenipour, M.; Ahmed, K.; Nawaz, N.; Alias, N.E.; Yuzir, A. Assessment of changing pattern of crop water stress in Bangladesh. Environ. Dev. Sustain. 2019, 1–19. [Google Scholar] [CrossRef]
  25. Shahid, S.; Pour, S.H.; Wang, X.; Shourav, S.A.; Minhans, A.; Ismail, T.b. Impacts and adaptation to climate change in Malaysian real estate. Int. J. Clim. Chang. Strateg. Manag. 2017, 9, 87–103. [Google Scholar] [CrossRef]
  26. Salem, G.S.A.; Kazama, S.; Shahid, S.; Dey, N.C. Impacts of climate change on groundwater level and irrigation cost in a groundwater dependent irrigated region. Agric. Water Manag. 2018, 208, 33–42. [Google Scholar] [CrossRef]
  27. Shiru, M.S.; Shahid, S.; Shiru, S.; Chung, E.S.; Alias, N.; Ahmed, K.; Dioha, E.C.; Sa’adi, Z.; Salman, S.; Noor, M. Challenges in water resources of Lagos mega city of Nigeria in the context of climate change. J. Water Clim. Chang. 2019. [Google Scholar] [CrossRef]
  28. Dey, N.C.; Saha, R.; Parvez, M.; Bala, S.K.; Islam, A.K.M.S.; Paul, J.K.; Hossain, M. Sustainability of groundwater use for irrigation of dry-season crops in northwest Bangladesh. Groundw. Sustain. Dev. 2017, 4, 66–77. [Google Scholar] [CrossRef]
  29. Atef, S.S.; Sadeqinazhad, F.; Farjaad, F.; Amatya, D.M. Water conflict management and cooperation between Afghanistan and Pakistan. J. Hydrol. 2019, 570, 875–892. [Google Scholar] [CrossRef]
  30. Qutbudin, I.; Shiru, M.S.; Sharafati, A.; Ahmed, K.; Al-Ansari, N.; Yaseen, Z.M.; Shahid, S.; Wang, X. Seasonal Drought Pattern Changes Due to Climate Variability: Case Study in Afghanistan. Water 2019, 11, 1096. [Google Scholar] [CrossRef]
  31. Sa’adi, Z.; Shiru, M.S.; Shahid, S.; Ismail, T. Selection of general circulation models for the projections of spatio-temporal changes in temperature of Borneo Island based on CMIP5. Theor. Appl. Climatol. 2019, 1–21. [Google Scholar] [CrossRef]
  32. Shiru, M.S.; Shahid, S.; Chung, E.-S.; Alias, N.; Scherer, L. A MCDM-based framework for selection of general circulation models and projection of spatio-temporal rainfall changes: A case study of Nigeria. Atmos. Res. 2019, 225, 1–16. [Google Scholar] [CrossRef]
  33. Salem, G.S.A.; Kazama, S.; Komori, D.; Shahid, S.; Dey, N.C. Optimum Abstraction of Groundwater for Sustaining Groundwater Level and Reducing Irrigation Cost. Water Resour. Manag. 2017, 31, 1947–1959. [Google Scholar] [CrossRef]
  34. Xu, M.; Ye, B.S.; Zhao, Q.D. Terrestrial Water Storge Changes in the Tangnaihai Basin Measured by GRACE during 2003-2008, China. Appl. Mech. Mater. 2013, 316–317, 520–526. [Google Scholar] [CrossRef]
  35. Girotto, M.; Rodell, M. Chapter Two—Terrestrial water storage. In Extreme Hydroclimatic Events and Multivariate Hazards in a Changing Environment; Maggioni, V., Massari, C., Eds.; Elsevier: Amsterdam, The Netherlands, 2019; pp. 41–64. [Google Scholar]
  36. Hazbavi, Z.; Sadeghi, S.H.; Gholamalifard, M. Land cover based watershed health assessment. AGROFOR Int. J. 2018, 3, 47–55. [Google Scholar] [CrossRef]
  37. Maity, R.; Sharma, A.; Nagesh Kumar, D.; Chanda, K. Characterizing Drought Using the Reliability-Resilience-Vulnerability Concept. J. Hydrol. Eng. 2013, 18, 859–869. [Google Scholar] [CrossRef]
  38. Schimann, P. Water Shortage in Afghanistan: An Approach of the Problem; Report from UNHCS/HABITAT Workshop; UNHCS/HABITAT: Islamabad, Pakistan, 2000. [Google Scholar]
  39. Chen, C.; Noble, I.; Hellmann, J.; Coffee, J.; Murillo, M.; Chawla, N. University of Notre Dame Global Adaptation Index Country Index Technical Report; ND-GAIN: South Bend, IN, USA, 2015. [Google Scholar]
  40. Qureshi, A.S. Water Resources Management in Afghanistan: The Issues and Options; IWMI: Lahore, Pakistan, 2002; Volume 49. [Google Scholar]
  41. Klemm, W.; Shobair, S. Agriculture Sector Study-Irrigation and Water Resources Report; FAO: Rome, Italy, 1996. [Google Scholar]
  42. Mahmoodi, S.M. Integrated Water Resources Management for Rural Development and Environmental Protection in Afghanistan. J. Dev. Sustain. Agric. 2008, 3, 9–19. [Google Scholar]
  43. Mack, T.J.; Chornack, M.P.; Taher, M.R. Groundwater-level trends and implications for sustainable water use in the Kabul Basin, Afghanistan. Environ. Syst. Decis. 2013, 33, 457–467. [Google Scholar] [CrossRef] [Green Version]
  44. Banks, D.; Soldal, O. Towards a policy for sustainable use of groundwater by non-governmental organisations in Afghanistan. Hydrogeol. J. 2002, 10, 377–392. [Google Scholar] [CrossRef]
  45. Sarhadi, W.A.; Fahim, S.A.; Tangutan, K. Sustainable agricultural development in Afghanistan. J. Dev. Sustain. Agric. 2014, 9, 41–46. [Google Scholar]
  46. Muhammad, A.; Jha, S.K.; Peter, F.R. Drought Characterization for a Snow-Dominated Region of Afghanistan. J. Hydrol. Eng. 2017, 22, 05017014. [Google Scholar] [CrossRef]
  47. Iqbal, M.W.; Donjadee, S.; Kwanyuen, B.; Liu, S.-Y. Farmers’ perceptions of and adaptations to drought in Herat Province, Afghanistan. J. Mt. Sci. 2018, 15, 1741–1756. [Google Scholar] [CrossRef]
  48. Ahmed, K.; Shahid, S.; Demirel, M.C.; Nawaz, N.; Khan, N. The changing characteristics of groundwater sustainability in Pakistan from 2002 to 2016. Hydrogeol. J. 2019, 1–12. [Google Scholar] [CrossRef]
  49. Thomas, B.F.; Caineta, J.; Nanteza, J. Global Assessment of Groundwater Sustainability Based On Storage Anomalies. Geophys. Res. Lett. 2017, 44, 11–445. [Google Scholar] [CrossRef]
  50. Lu, H.; Kang, Y.; Liu, L.; Li, J. Comprehensive groundwater safety assessment under potential shale gas contamination based on integrated analysis of reliability–resilience–vulnerability and gas migration index. J. Hydrol. 2019, 578, 124072. [Google Scholar] [CrossRef]
  51. Asefa, T.; Clayton, J.; Adams, A.; Anderson, D. Performance evaluation of a water resources system under varying climatic conditions: Reliability, Resilience, Vulnerability and beyond. J. Hydrol. 2014, 508, 53–65. [Google Scholar] [CrossRef]
  52. Goharian, E.; Burian Steven, J.; Lillywhite, J.; Hile, R. Vulnerability Assessment to Support Integrated Water Resources Management of Metropolitan Water Supply Systems. J. Water Resour. Plan. Manag. 2017, 143, 04016080. [Google Scholar] [CrossRef] [Green Version]
  53. Ali, R.; Kuriqi, A.; Abubaker, S.; Kisi, O. Long-Term Trends and Seasonality Detection of the Observed Flow in Yangtze River Using Mann-Kendall and Sen’s Innovative Trend Method. Water 2019, 11, 1855. [Google Scholar] [CrossRef]
  54. Zhiltsov, S.S.; Zhiltsova, M.S.; Medvedev, N.P.; Slizovskiy, D.Y. Water Resources of Central Asia: Historical Overview. In Water Resources in Central Asia: International Context; Zhiltsov, S.S., Zonn, I.S., Kostianoy, A.G., Semenov, A.V., Eds.; Springer International Publishing: Berlin/Heidelberg, Germany, 2018; pp. 9–24. [Google Scholar]
  55. Nashwan, M.S.; Shahid, S.; Chung, E.-S. Development of high-resolution daily gridded temperature datasets for the central north region of Egypt. Sci. Data 2019, 6, 138. [Google Scholar] [CrossRef]
  56. Nashwan, M.S.; Shahid, S.; Wang, X. Assessment of Satellite-Based Precipitation Measurement Products over the Hot Desert Climate of Egypt. Remote Sens. 2019, 11, 555. [Google Scholar] [CrossRef]
  57. Ahmed, K.; Shahid, S.; bin Harun, S.; Ismail, T.; Nawaz, N.; Shamsudin, S. Assessment of groundwater potential zones in an arid region based on catastrophe theory. Earth Sci. Inform. 2014, 8, 539–549. [Google Scholar] [CrossRef]
  58. Wahr, J.; Molenaar, M.; Bryan, F. Time variability of the Earth’s gravity field: Hydrological and oceanic effects and their possible detection using GRACE. J. Geophys. Res. Solid Earth 1998, 103, 30205–30229. [Google Scholar] [CrossRef]
  59. Landerer, F.W.; Swenson, S.C. Accuracy of scaled GRACE terrestrial water storage estimates. Water Resour. Res. 2012, 48. [Google Scholar] [CrossRef]
  60. Swenson, S.; Wahr, J. Post-processing removal of correlated errors in GRACE data. Geophys. Res. Lett. 2006, 33. [Google Scholar] [CrossRef]
  61. Jacob, T.; Wahr, J.; Pfeffer, W.T.; Swenson, S. Recent contributions of glaciers and ice caps to sea level rise. Nature 2012, 482, 514–518. [Google Scholar] [CrossRef]
  62. Swenson, S.; Chambers, D.; Wahr, J. Estimating geocenter variations from a combination of GRACE and ocean model output. J. Geophys. Res. Solid Earth 2008, 113. [Google Scholar] [CrossRef] [Green Version]
  63. Watkins, M.M.; Wiese, D.N.; Yuan, D.-N.; Boening, C.; Landerer, F.W. Improved methods for observing Earth’s time variable mass distribution with GRACE using spherical cap mascons. J. Geophys. Res. Solid Earth 2015, 120, 2648–2671. [Google Scholar] [CrossRef]
  64. Wiese, D.N.; Landerer, F.W.; Watkins, M.M. Quantifying and reducing leakage errors in the JPL RL05M GRACE mascon solution. Water Resour. Res. 2016, 52, 7490–7502. [Google Scholar] [CrossRef]
  65. Save, H.; Bettadpur, S.; Tapley, B.D. High-resolution CSR GRACE RL05 mascons. J. Geophys. Res. Solid Earth 2016, 121, 7547–7569. [Google Scholar] [CrossRef]
  66. Luthcke, S.B.; Sabaka, T.J.; Loomis, B.D.; Arendt, A.A.; McCarthy, J.J.; Camp, J. Antarctica, Greenland and Gulf of Alaska land-ice evolution from an iterated GRACE global mascon solution. J. Glaciol. 2013, 59, 613–631. [Google Scholar] [CrossRef]
  67. Xie, X.; Xu, C.; Wen, Y.; Li, W. Monitoring Groundwater Storage Changes in the Loess Plateau Using GRACE Satellite Gravity Data, Hydrological Models and Coal Mining Data. Remote Sens. 2018, 10, 605. [Google Scholar] [CrossRef]
  68. Jing, W.; Zhang, P.; Zhao, X. A comparison of different GRACE solutions in terrestrial water storage trend estimation over Tibetan Plateau. Sci. Rep. 2019, 9, 1765. [Google Scholar] [CrossRef] [PubMed]
  69. Scanlon, B.R.; Zhang, Z.; Save, H.; Wiese, D.N.; Landerer, F.W.; Long, D.; Longuevergne, L.; Chen, J. Global evaluation of new GRACE mascon products for hydrologic applications. Water Resour. Res. 2016, 52, 9412–9429. [Google Scholar] [CrossRef]
  70. Sen, P.K. Estimates of the regression coefficient based on Kendall’s tau. J. Am. Stat. Assoc. 1968, 63, 1379–1389. [Google Scholar] [CrossRef]
  71. Hamed, K.H. Trend detection in hydrologic data: The Mann–Kendall trend test under the scaling hypothesis. J. Hydrol. 2008, 349, 350–363. [Google Scholar] [CrossRef]
  72. Hamed, K.H. Exact distribution of the Mann–Kendall trend test statistic for persistent data. J. Hydrol. 2009, 365, 86–94. [Google Scholar] [CrossRef]
  73. Shahid, S.; Wang, X.J.; Moshiur Rahman, M.; Hasan, R.; Harun, S.B.; Shamsudin, S. Spatial assessment of groundwater over-exploitation in northwestern districts of Bangladesh. J. Geol. Soc. India 2015, 85, 463–470. [Google Scholar] [CrossRef] [Green Version]
  74. Pour, S.H.; Shahid, S.; Chung, E.-S.; Wang, X.-J. Model output statistics downscaling using support vector machine for the projection of spatial and temporal changes in rainfall of Bangladesh. Atmos. Res. 2018, 213, 149–162. [Google Scholar] [CrossRef]
  75. Nashwan, M.S.; Ismail, T.; Ahmed, K. Flood susceptibility assessment in Kelantan river basin using copula. Int. J. Eng. Technol. 2018, 7, 584–590. [Google Scholar] [CrossRef] [Green Version]
  76. Iqbal, N.; Hossain, F.; Lee, H.; Akhter, G. Satellite Gravimetric Estimation of Groundwater Storage Variations Over Indus Basin in Pakistan. IEEE J. Sel. Top. Appl. Earth Obs. Remote Sens. 2016, 9, 3524–3534. [Google Scholar] [CrossRef]
  77. Umar, H.A.; Abdul Khanan, M.F.; Umar, D.A.; Shiru, M.S.; Isma’il, M.; Mohd Salleh, M.R.; Abdul Rahman, A.; Ahmad, A.; Okoli, E.A. Mapping potential habitats for arthropod vectors of trypanosomiasis infection in Northern Nigeria: An introductory synthesis. Int. Arch. Photogramm. Remote Sens. Spatial Inf. Sci. 2018, XLII-4/W9, 147–152. [Google Scholar] [CrossRef]
  78. Walters, S.A.; Groninger, J.W. Water distribution systems and on-farm irrigation practices: limitations and consequences for Afghanistan’s agricultural productivity. Water Int. 2014, 39, 348–359. [Google Scholar] [CrossRef]
  79. Milbrandt, A.; Overend, R. Assessment of Biomass Resources in Afghanistan; National Renewable Energy Lab. (NREL): Golden, CO, USA, 2011. [Google Scholar]
  80. Maletta, H.E. Arable land tenure in Afghanistan in the post-Taliban era. Afr. Asian Stud. 2007, 6. [Google Scholar] [CrossRef]
  81. Ahmed, K.; Shahid, S.; Wang, X.; Nawaz, N.; Khan, N. Spatiotemporal changes in aridity of Pakistan during 1901–2016. Hydrol. Earth Syst. Sci. 2019, 23, 3081–3096. [Google Scholar] [CrossRef]
  82. Pour, S.H.; Wahab, A.K.A.; Shahid, S. Spatiotemporal changes in aridity and the shift of drylands in Iran. Atmos. Res. 2019, 104704. [Google Scholar] [CrossRef]
Figure 1. The geographical position of Afghanistan and the GRACE grid points over the country.
Sustainability 11 05836 g001
Figure 2. Terrestrial water storage anomaly data for a grid point (longitude: 69.50 and latitude: 35.50) used in the present study for defining reliability, resiliency, and vulnerability of terrestrial water resources.
Sustainability 11 05836 g002
Figure 3. The monthly mean anomaly of terrestrial water storage at the different climate zones (rows) of Afghanistan estimated by the CSR, GFZ, and JPL solutions of GRACE (columns).
Sustainability 11 05836 g003
Figure 4. Variability of terrestrial water storage estimated using GRACE data of (a) CSR; (b) GFZ; and (c) JPL solutions.
Sustainability 11 05836 g004
Figure 5. The spatial distribution in the rate of change of terrestrial water storage (cm/year) estimated using Sen’s slope for (a) CSR; (b) GFZ; and (c) JPL solutions. The color ramp presents the Sen’s slope rate of change results and the node symbol indicates the significant rate of change estimated using modified Mann–Kendall test.
Sustainability 11 05836 g005
Figure 6. The spatial distribution of the reliability, resiliency, vulnerability, and sustainability (rows) of terrestrial water storage estimated using the CSR, GFZ, and JPL GRACE solutions (columns) during 2002–2016.
Sustainability 11 05836 g006
Figure 7. The spatial distribution of croplands in Afghanistan.
Sustainability 11 05836 g007
Figure 8. Spatial distribution in the trends of (a) annual total precipitation and (b) annual average of daily temperature in Afghanistan.
Sustainability 11 05836 g008
Table 1. Description of the Gravity Recovery and Climate Experiment (GRACE) data used in the present study.
GRACE SolutionLaboratoryResolution
CSRCenter for Space research, the University of Texas at Austin1° × 1°
GFZHelmholtz Centre POTSDAM, GFZ German Research Centre for Geosciences.1° × 1°
JPLJet Propulsion Laboratory, California Institute of Technology, USA1° × 1°

