Simulation-Based Analysis of the Effect of Significant Traffic Parameters on Lane Changing for Driving Logic “Cautious” on a Freeway


Department of Transport Technology and Economics, Budapest University of Technology and Economics, Stoczek u. 2, H-1111 Budapest, Hungary
*
Author to whom correspondence should be addressed.
Sustainability 2019, 11(21), 5976; https://0-doi-org.brum.beds.ac.uk/10.3390/su11215976
Submission received: 1 August 2019
/
Revised: 23 October 2019
/
Accepted: 24 October 2019
/
Published: 28 October 2019
(This article belongs to the Special Issue Road Traffic Engineering and Sustainable Transportation)
Abstract
:Lane changing of traffic flow is a complicated and significant behavior for traffic safety on the road. Frequent lane changing can cause serious traffic safety issues, particularly on a two-lane road section of a freeway. This study aimed to analyze the effect of significant traffic parameters for traffic safety on lane change frequency using the studied calibrated values for driving logic “conscious” in VISSIM. Video-recorded traffic data were utilized to calibrate the model under specified traffic conditions, and the relationship between observed variables were estimated using simulation plots. The results revealed that changes in average desired speed and traffic volume had a positive relationship with lane change frequency. In addition, lane change frequency was observed to be higher when the speed distribution was set large. 3D surface plots were also developed to show the integrated effect of specified traffic parameters on lane change frequency. Results showed that high average desired speed and large desired speed distribution coupled with high traffic volume increased the lane change frequency tremendously. The study also attempted to develop a regression model to quantify the effect of the observed parameters on lane change frequency. The regression model results showed that desired speed distribution had the highest effect on lane change frequency compared to other traffic parameters. The findings of the current study highlight the most significant traffic parameters that influence the lane change frequency.
1. Introduction
The Global Status Report on Road Safety stated that the number of annual road traffic deaths has reached 1.35 million [1]. Although 90% of these deaths are centered in low- and middle-income countries, traffic accidents in WHO’s European Region cause at least 120,000 deaths and injure 2.4 million people each year [2]. European roads have been stated as the safest in the world, with a 19% reduction in road fatalities over the last six years. While attaining the strategic target of halving the number of road deaths between 2010 and 2020, which is still an acute challenge, it is worth aiming to save every single life [3]. The Road Safety Action Program (2014–2016) was incorporated into the Hungarian Transport Strategy, which also sets targets to decrease the number of road fatalities by 50% between 2010 and 2020 [4]. However, according to the Hungarian Central Statistical Office data, there were 625 road fatalities in 2017, a 2.9% rise compared to 2016 [5]. The situation analysis of the Road Safety Action Program declares that most of the accidents are caused by human-related factors, and tackling them is therefore the most dynamic objective of road safety initiatives [4]. Some previous studies have estimated human factors to be the sole or primary causal factor in approximately 90% of road traffic accidents [6,7,8,9].
Frequent lane-changing behavior has an adverse effect on traffic efficiency under advanced traffic demand [10]. Li et al. [11] examined the aggressive lane-changing behavior of fast vehicles and the consequences of different lane-changing behavior with the proposed symmetric two-lane cellular automaton. The act of changing lanes was observed as one of the most common causes of accidents in the United states. Also, according to official statistics, at least 33% of all road crashes occur when vehicles change lanes or veer off the road [12].
Previous studies have shown accidents to be “multicausal” events as they are considered to be a failure of the complex interactions between driver behavior, traffic, vehicle design, road geometry, and environmental conditions [13,14]. Another research [15] found that crash occurrence had a substantial correlation with the average speed, the standard deviation of speed at the upstream loop detector station, the variance in the average speed at the upstream and downstream loop detector stations, and traffic volume. Therefore, it is difficult to detect a single causal factor that can be held responsible for an accident occurrence [16].
A recent research [17] showed that, despite the influence of various factors, speed variance is particularly worth noting as it has been frequently reported as a critical risk factor in estimating crash risk on expressways. Some studies have found both speed and speed variance to be significant factors for predicting crash frequency [18,19]. Elvik [20] reviewed 13 studies that assessed the effects of speed variance on crash rates based on loop detector data. Although almost all of these studies observed that a large variance in speed increased the risk of crashes, numerical estimations of the effect varied significantly. It is also possible that variations in speed between following vehicles on a road as well as between the lanes of a roadway affects accident risk [21,22,23]. However, the finding [24] that effects of speed changes tend to be higher on rural roads and motorways than on roads in built-up areas roads suggests that the initial speed is a significant factor. This was confirmed in a re-analysis of the data [25] that presented that the effect of a specified relative change in speed on the number and severity of crashes is greater when the initial speed is higher.
Two mathematical models—the power model and the exponential model—describe the relationship between the mean speed of traffic and road safety, defined as the number of fatalities and the number of injury accidents, with high accuracy [26]. One limitation of both the power model and the exponential model is that they only consider changes in average speed and therefore disregard possible changes in the shape of the speed distribution [27]. However, speed dispersion is recommended to proactively measure road safety because it presents a consistent assessment of microscopic potential risks [28]. Moreover, the effects of speed and speed variations seem to be related to other traffic variables, such as traffic flow [29,30].
Other than speed, traffic volume is one of the most studied factors in crash rate predictions [31,32]. Traffic volume, speed, and density are the three main parameters used for the characterization of traffic conditions [33]. Traffic conditions with high volume and high speed variation within the same lane represent conditions with lower levels of service and therefore unstable flow. These conditions can create higher crash risk because of the limited space between vehicles [13,30].
Microscopic simulation models are finding increased application in the evaluation of safety performance and crash prediction. Before these models can be applied, they must be calibrated based on real-world traffic conditions. The main purpose of calibration is to ensure that parameter inputs in the simulation model produce the best estimates of safety performance. Previous studies have focused on the accuracy and reproducibility of simulated output but not the ability of the performance measure to reflect actual crashes. However, with an accurate estimate of the crash potential index (CPI) from a simulation, it would be possible to compare simulated safety performance with observed crashes [34]. The process of developing a microsimulation model starts with an existing condition model and then transitions into the development of various scenarios representing future-year alternatives [35]. Microscopic traffic simulation-based safety analysis provides fast, safe, and cost-effective means of evaluating traffic safety compared to field implementation and testing [36,37,38]. Some previous studies have utilized video data to obtain important information to calibrate several traffic safety parameters [34,39]. The effectiveness of a calibration process as well as the preceding considerations can be best evaluated by performing “controlled” experiments in which all the model inputs are known [40].
The VISSIM model can be applied to examine various traffic scenarios for varying roadway and traffic conditions. A microsimulation model, VISSIM is suitable for simulating and studying heterogeneous traffic flow in expressways to a satisfactory extent [41]. The VISSIM model is used to generate traffic flow for a wide range, from lower to higher levels, and to investigate the number of lane changes in multilane highways [39].
The lane-changing phenomenon is considered as an act of driving maneuver that moves a vehicle from one lane to another when both lanes have the same direction of travel [42]. The actual lane-changing logic in VISSIM is utilized to choose if it is possible to change to the desired neighbor lane or not. The desired lane is an effect of the lane selection process for any free or mandatory lane changes based on gap acceptance. A free lane change considers a lane change of a vehicle to obtain speed advantages or more space [43]. Some previous studies have focused on the relationship between speed variations and crash rates or crash risk [19,31,44,45,46,47], while other studies have examined the number of lane changes under different traffic flow parameters to analyze the capacity of multilane roads [39,48,49,50]. However, these studies lacked research specifically regarding the identification and quantification of significant traffic parameters that affect lane changing using real data by considering lane changing as one of the essential subjects of sustainable traffic safety.
This study aimed to estimate the effect of significant traffic parameters for traffic safety on lane changing using VISSIM for a two-lane road section of a freeway. We utilized calibrated model data for driving logic “conscious” to estimate the relationship between specified traffic parameters and lane change frequency. Furthermore, 3D surface plots were developed to analyze the integrated effect of observed variables on lane change frequency. We also attempted to develop a regression expression to quantify the effect of observed traffic parameters on lane change frequency. The study recommends that there should be more focus on traffic parameters that significantly influence lane changing in order to enhance traffic safety.
The paper is organized as follows. The need for analyzing the effect of significant traffic safety parameters on lane changing has already been described in this section. The method used, including video data collection and presentation of simulation parameters, is detailed in Section 2. Analysis of the effect of traffic parameters on lane change frequency as well as 3D surface plots and regression model results are presented in Section 3, Section 4 provides the conclusions and discusses future works.
2. Materials and Methods
2.1. Video Data Analysis
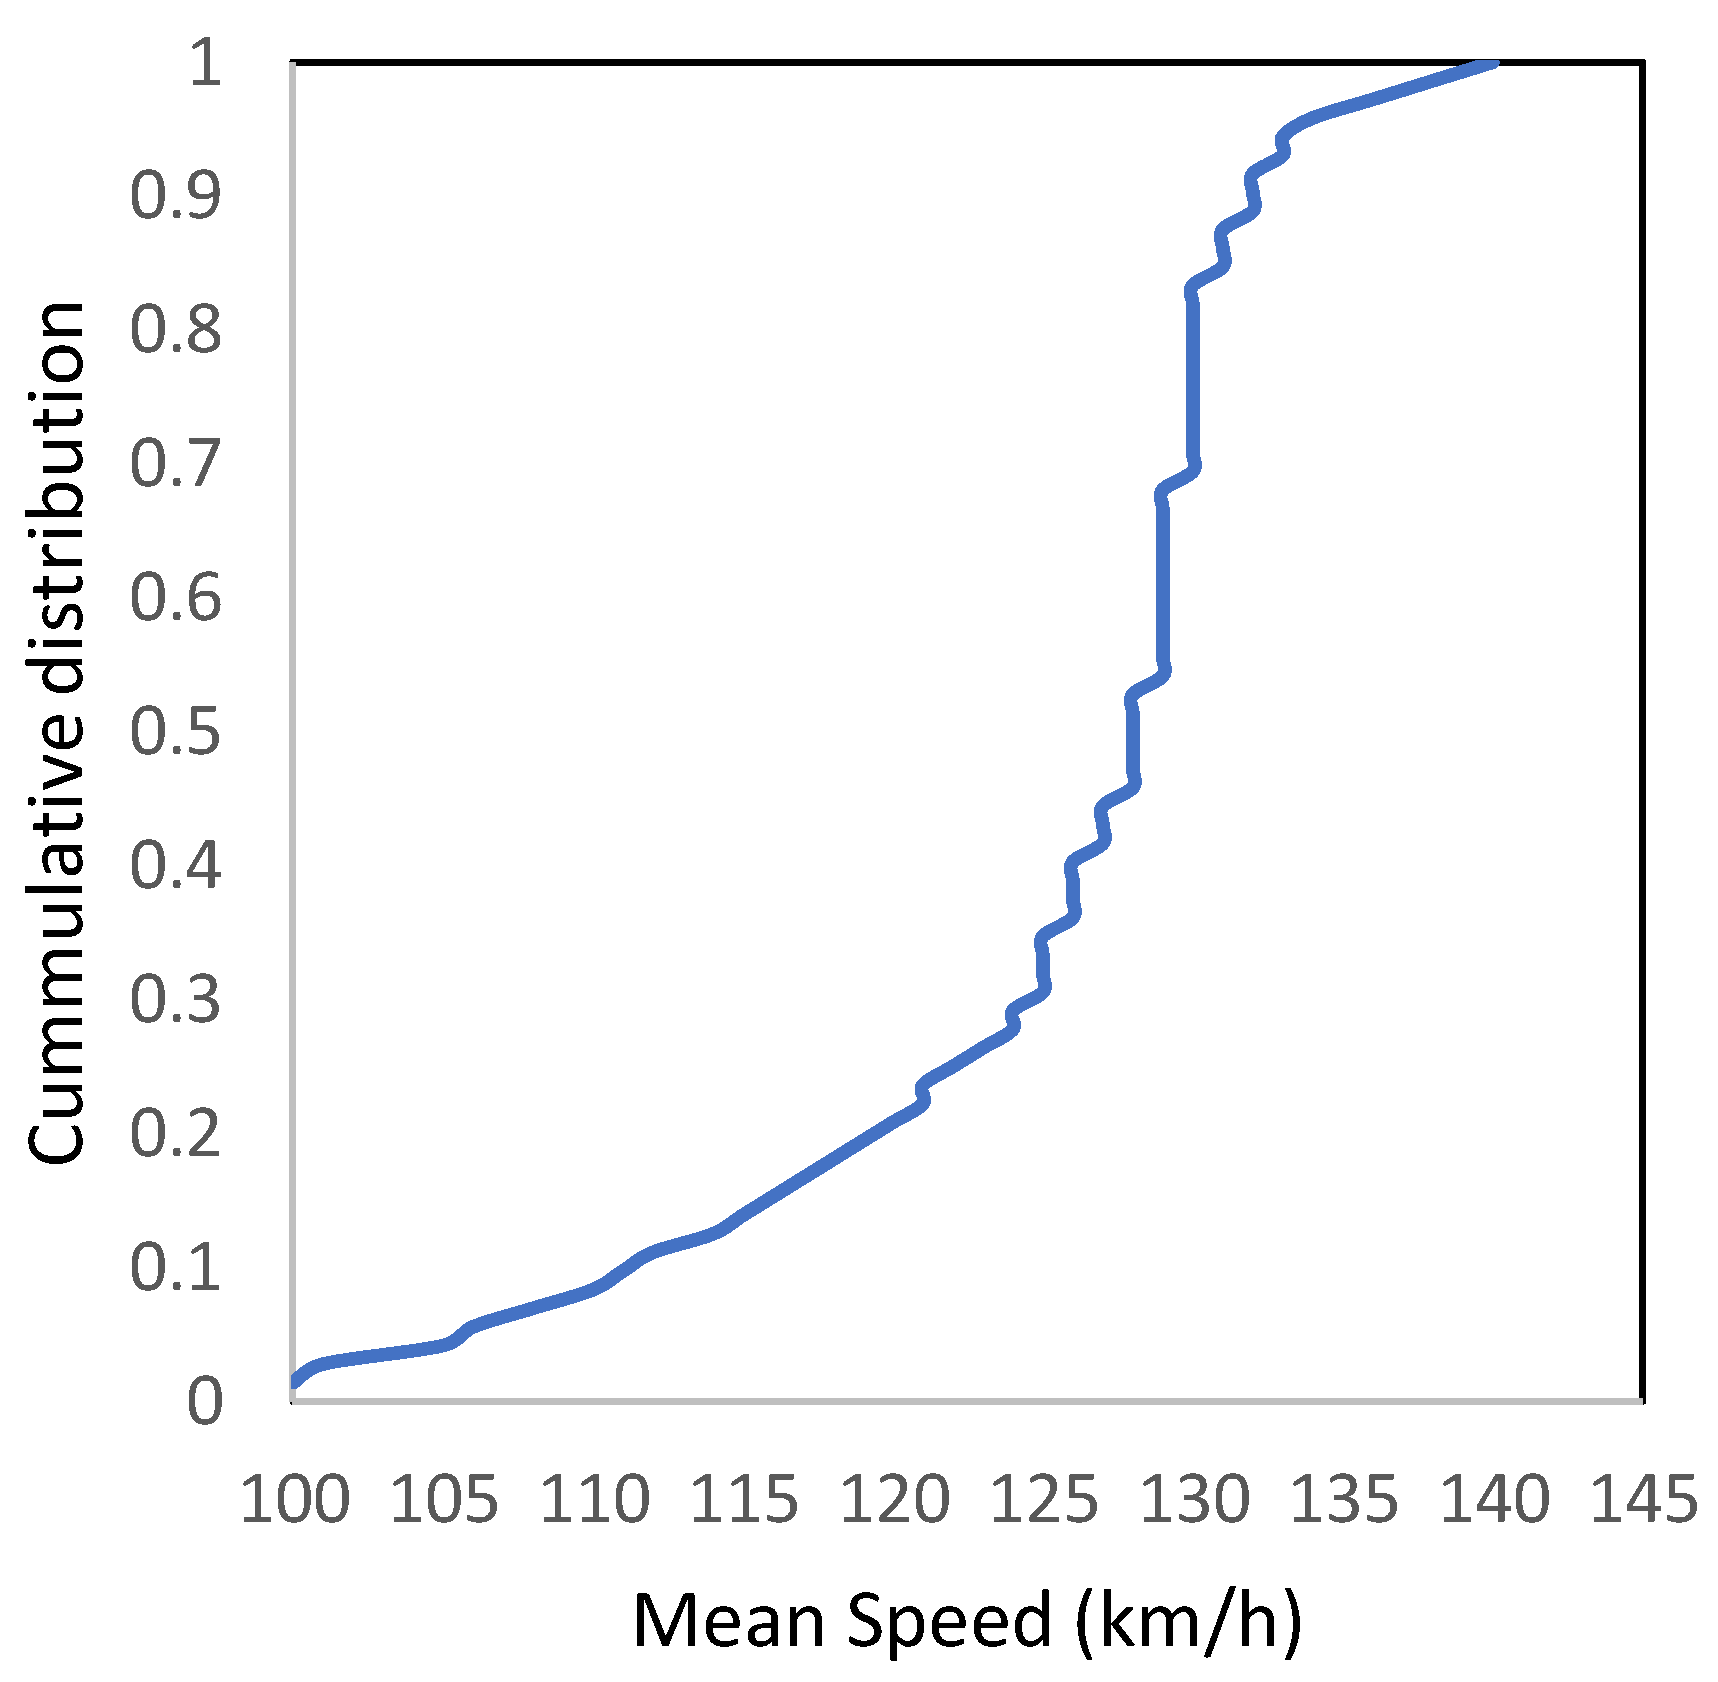
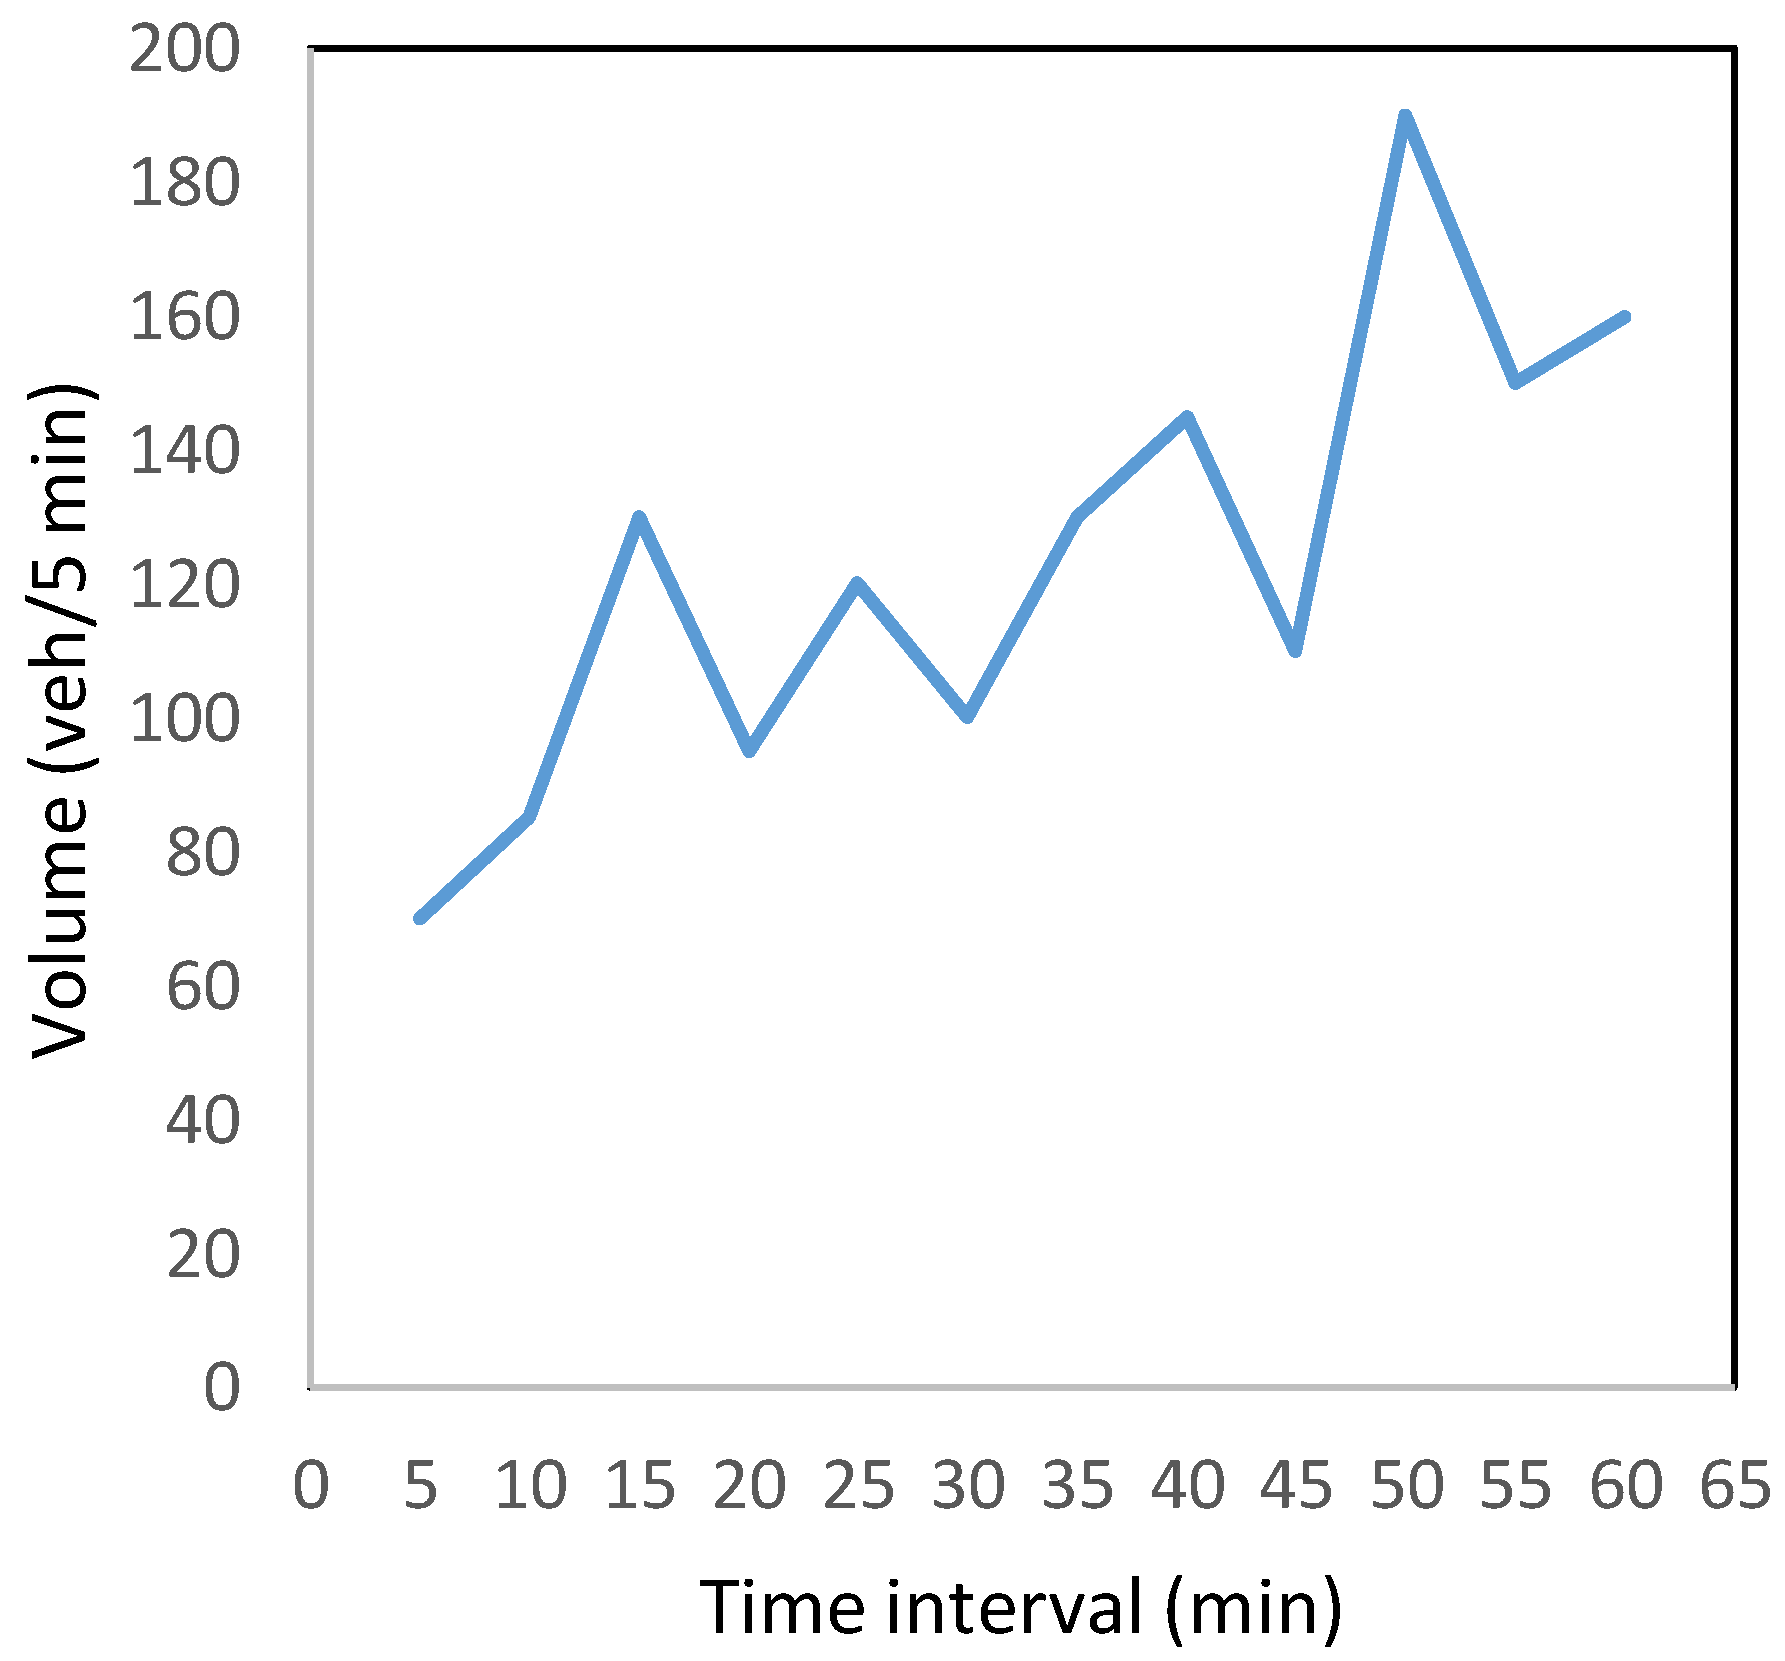
Video data analysis was performed using CarCam to collect real traffic data on a two-lane road section near Budapest. The road was approximately 5 km long (M1 motorway, Hungary) in one direction of travel. Video data collection was performed for 4 hours from 7 a.m. to 9 a.m. and 3 p.m. to 5 p.m. on a typical weekday under clear weather conditions. The collected video data were then extracted with the help of semiautomated data extraction software to get the mean speed of cars and traffic volume at each 5 min interval. First, the results of video data analysis were utilized to measure the mean speed by measuring the time taken by a vehicle to cross the longitudinal section of 30 m using a software program. The plot results showed that most of the vehicles were travelling at varying speeds with dispersion between 100 and 140 km/h, as shown in Figure 1. Second, the results of video data analysis were utilized to measure the traffic volume on a specified road section for the stated period. The plot results showed that traffic volume varied significantly in different time intervals. However, it helped to obtain information about the minimum (960 veh/hr) and maximum (2280 veh/hr) traffic counts for simulation analysis purposes, as shown in Figure 2.
2.2. VISSIM Simulation
We wanted to utilize a microscopic simulation method to analyze the lane change frequency of cars on a two-lane road section of a freeway, that is, one direction of a road section under various specified traffic conditions. We chose the VISSIM software as a simulation tool for analysis of the effect of different traffic parameters on lane changing due to its powerful multimodel modeling capabilities. PTV VISSIM was first developed in 1992 by PTV Planung Transport Verkehr AGin Karlsruhe, Germany, based on the continuous effort of Wiedemann regarding car-following behavior [39]. VISSIM is the most advanced and commonly used microscopic traffic simulation software [51]. VISSIM is a behavior-based and time-step simulation model program. The software has three basic mechanisms: traffic flow models, traffic control models, and a data analysis package. It can be useful to analyze different transportation problems, such as freeway operations, dynamic traffic assignments, the interaction of different transportation modes, signal prioritization and optimization, traffic management strategies, pedestrian flows, etc. [52]. A previous study also concluded that the VISSIM simulation environment is well suited for freeway studies involving complex interactions with few and well-reasoned modifications to reproduce driver behavior parameters [53].
For the development of the base model, a 5 km road network with straight and twisty links was used to efficiently utilize the available PTV licensed software (VISSIM 11) space. The width of the road section was set at 7 m, with each lane being 3.5 m wide. The road networks in VISSIM can be designed either as lane-oriented or space-oriented, i.e., vehicles can change anywhere in the road without lane restrictions. Any number of vehicle types can be designed and overtaking of vehicles can be allowed on both the sides [54]. On a two-lane road link, we employed only cars as a “vehicle type” in the VISSIM model and used the right-side rule, which allows overtaking of vehicles in the left lane. It must be noted that there is a permanent overtaking ban for vehicles over 3.5 tons on certain two-lane sections of the Hungarian motorway network [55]. The simulation data was extracted for 3600 s, and the option “lane changes evaluation active” was selected to record lane change data. Lane change frequency was evaluated as the number of lane changes per hour (n/h). The important information about simulation parameters is tabulated in Table 1.
We applied the Wiedemann 99 model, which is suitable for freeways with no merging areas, to observe the effect of significant traffic parameters on lane changing for driving logic “cautious”. The Wiedemann 99 car-following model was developed in 1999 to offer greater control of the car-following characteristics for freeway modeling in VISSIM. The Wiedemann 99 model consists of 10 calibration parameters, all labeled with a “CC” prefix [39,56]. The car-following logic controls the way a vehicle interacts with other vehicles at four modes of driving: free-driving, approaching a vehicle, following a vehicle, and braking. Similarly, the lane-changing logic controls the way a vehicle interacts with others during the processes of lane selection, merging to traffic, and diverging from traffic [57]. We considered calibrated values of the car-following model as suggested by a recent study for driving logic “cautious” [58]. Most European drivers have been observed as “cautious” about driving characteristics, which can affect the driving style and road safety, as analyzed in previous studies [59,60]. Table 2 provides a description with the default and calibrated values for each of the “CC” parameters associated with the Wiedemann 99 model.
In VISSIM, the lane-changing behavior is controlled by a set of factors for local calibration of VISSIM models. Accordingly, VISSIM lane-changing behavior is characterized by maximum and accepted deceleration rates for the merging (own) and trailing vehicle. Driver aggressiveness can be controlled by modifying the maximum and accepted deceleration rates as well as the reduction rate of the deceleration value as the vehicle approaches its merge point [35]. We further considered the calibrated values of lane change as suggested by a recent study for driving logic “cautious”, as shown in Table 3.
Based on the above measures, we considered the following:
- (1)
- Effect of average desired speed on lane change frequency;
- (2)
- Effect of desired speed distribution on lane change frequency;
- (3)
- Effect of traffic volume on lane change frequency.
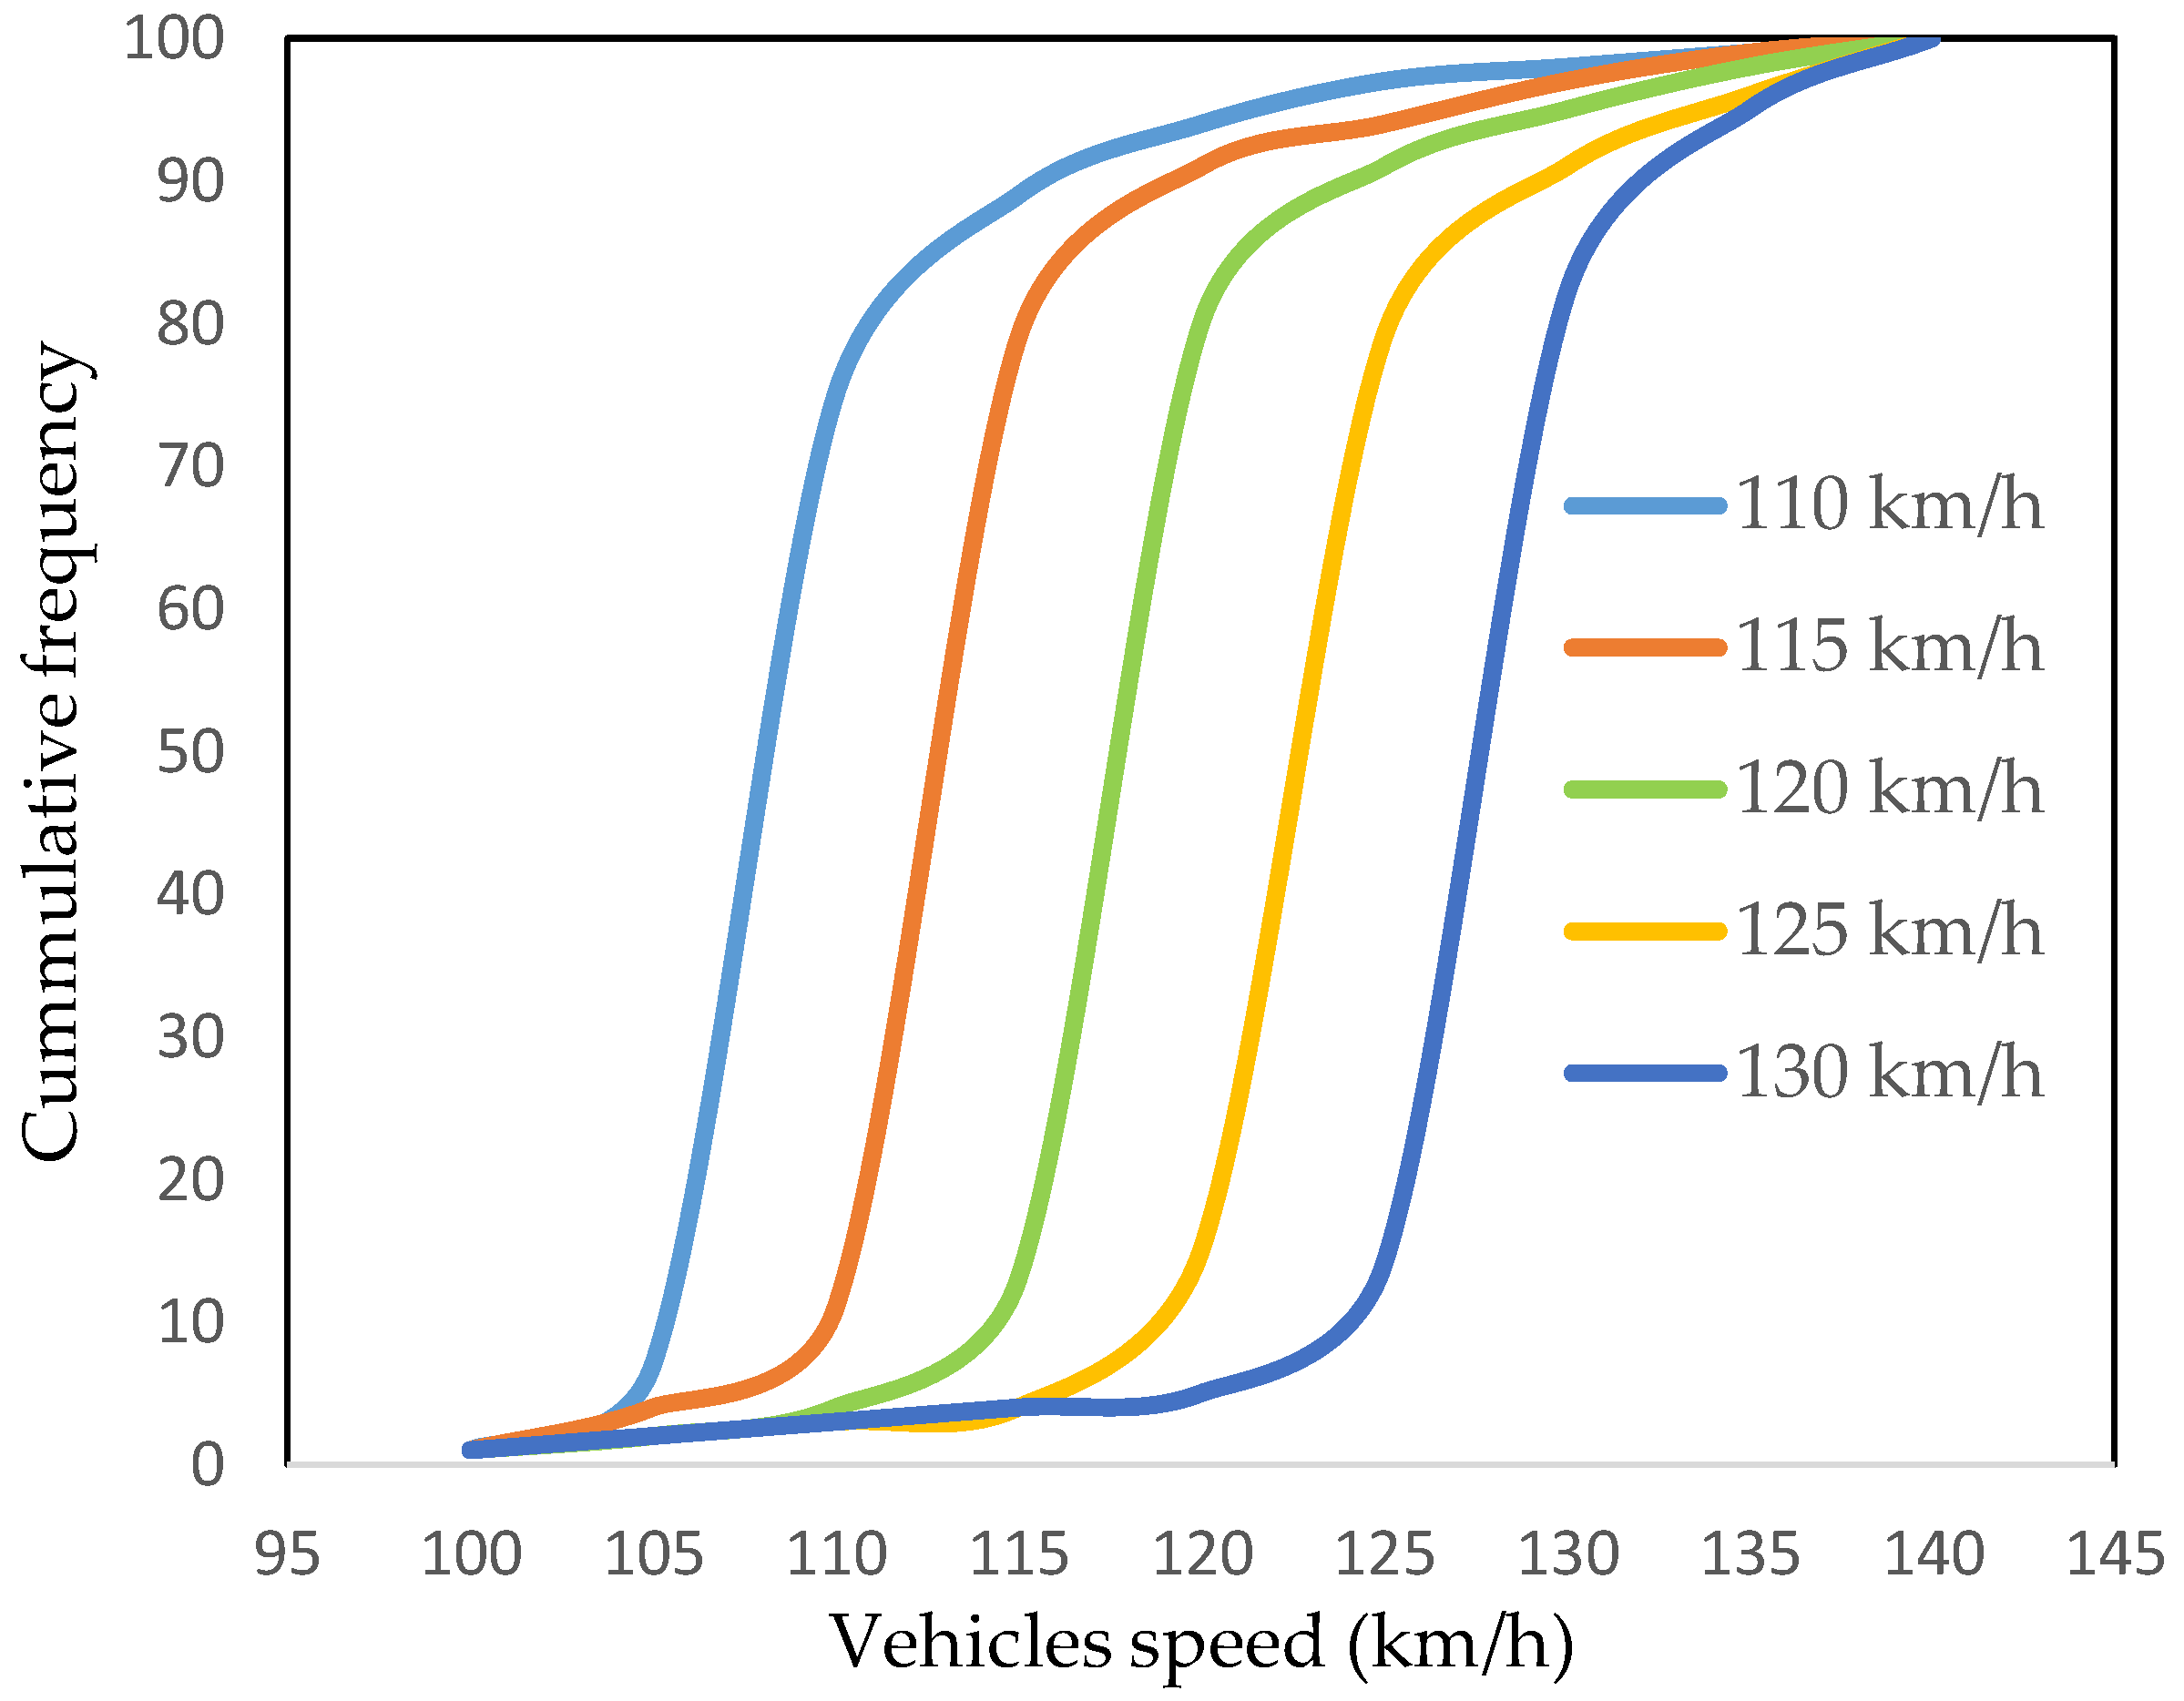
We first considered simulating the effect of average desired speed variation on lane change frequency. Previous studies have noticed that changes in speed affects serious crashes substantially more than less serious crashes, with most data related to rural roads and motorways [13,61]. In the past 20 years, nearly all countries have either increased or decreased their speed limits on the motorway network. In addition, the speed limits in Hungary outside built-up areas were increased from 120 to 130 km/h on motorways and from 100 to 110 km/h on motor roads (semimotorways) in 2001 [24]. Based on observed video speed data, the average speed in this study varied from 110 to 130 km/h with a wider range (110, 115, 120, 125, and 130 km/h) to measure their effect on lane changing for road safety. In London, the noncompliance level (the level of noncompliance with the speed limit) ranges from 4% to 73%, while the noncompliance level ranges from 2% to 82% outside London [17]. The speed range for each simulated average speed was given as an input in the model, as shown in Figure 3.
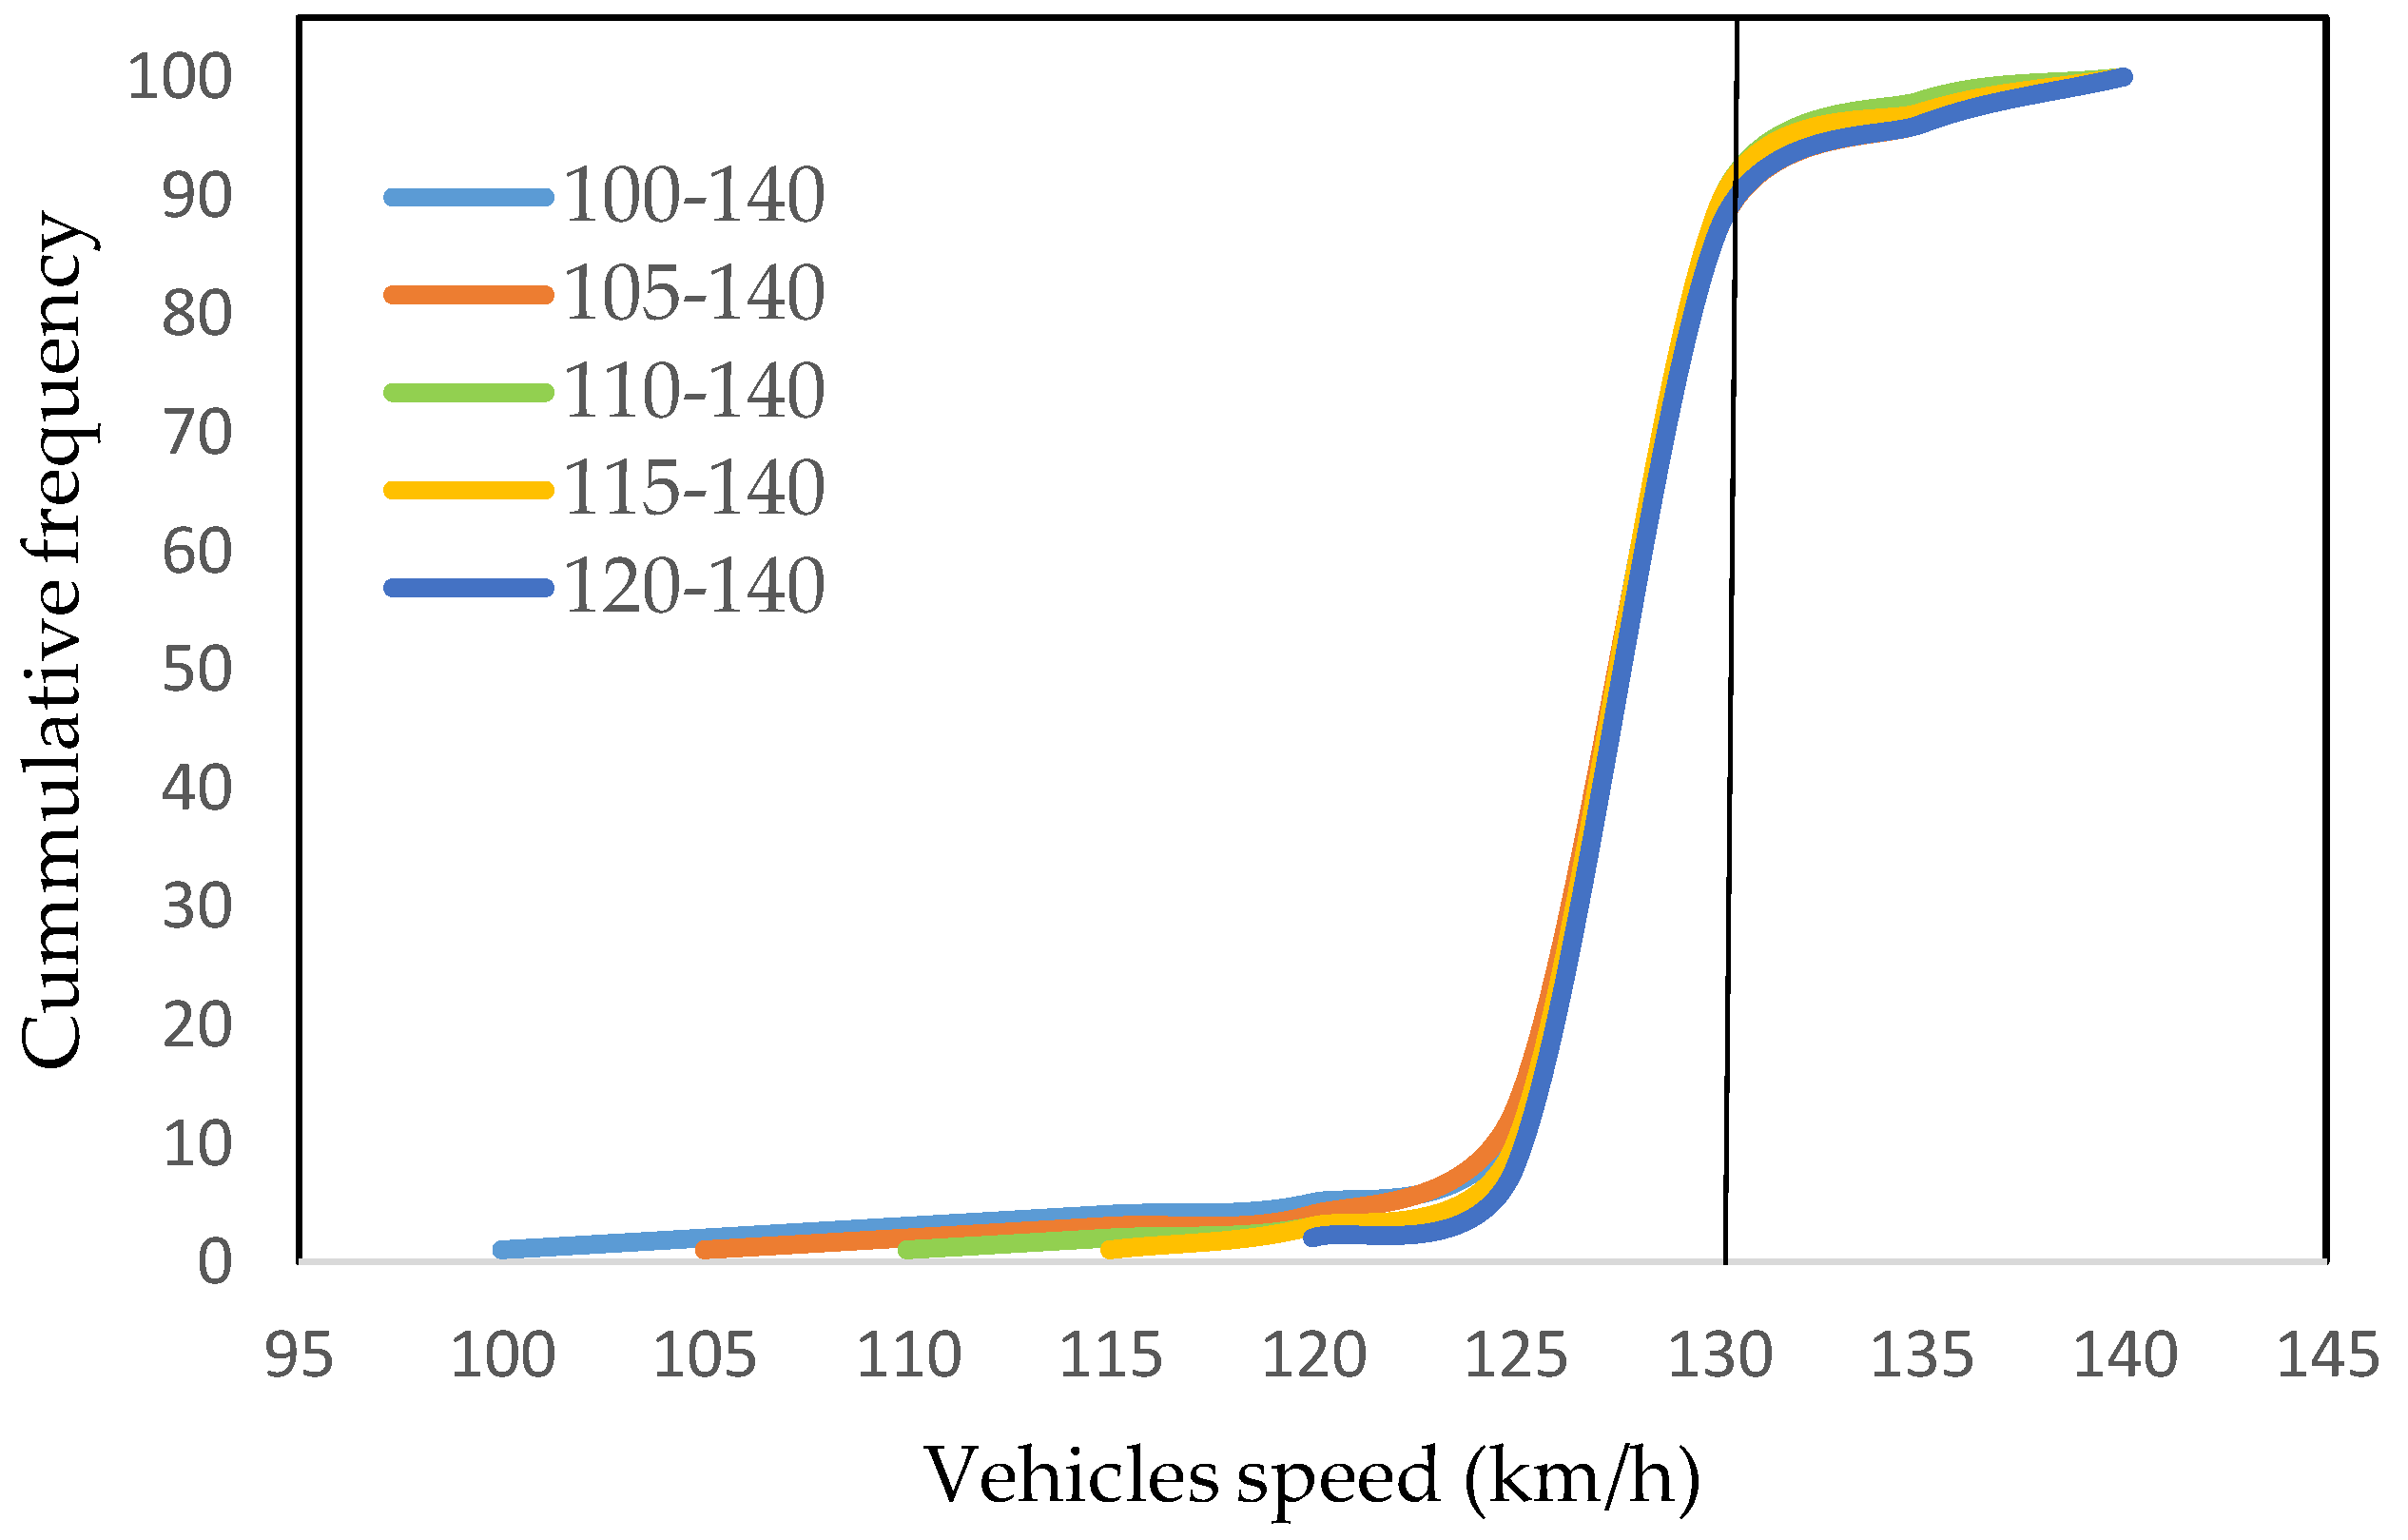
We further simulated the effect of desired speed distribution on lane change frequency for a freeway by maintaining the average speed at 130 km/h. The distribution function of desired speeds is a particularly important parameter as it has an impact on lane change frequency. VISSIM provides the opportunity to distribute the percentage of speed values over smaller to larger limits. In VISSIM, the desired speed is a significant parameter that has a great influence on travelling speeds, which is explained as a distribution rather than a fixed value [62]. The speed distribution represents the proportion of vehicles driving at or below certain speeds. It is also likely to use the speed distribution to specify how the speed of all vehicles varies [27]. A previous study stated that high-risk drivers exceed the speed limit by at least 25 km/h, so the “desired speed distribution” of the vehicles that represent speeding drivers was set as 120–150 km/h [63]. We considered real speed data (Figure 1) to analyze the effect of different speed distributions on lane changing for road safety. The largest speed distribution was set between 100 and 140 km/h with higher speed variations of traffic flow, and some other speed distributions were also set to comprehensively analyze the effect of speed distribution on lane changing. Accordingly, the smallest speed distribution was set between 120 and 140 km/h with lower speed variations of traffic flow. The maximum and minimum values of the speeds and the dispersion between these values were defined for an average speed of 130 km/h (freeway) in the model, as shown in Figure 4.
The VISSIM simulation was also used to measure the effect of designated traffic volume on lane change frequency. Traffic volume was set for each simulation, which defined the number of vehicles in a specific period for the two-lane road section of the freeway. A previous study noticed that traffic volume is one of the most influential parameters to model driving behavior [52]. Lane change behavior of vehicles characterizes macroscopic traffic flow behavior and significantly affects operational characteristics on the highway [39]. Another study observed the effect of hourly traffic volume on crash incident rate, with the lowest rate being when traffic flowed at a rate of 1000–1500 vehicles/h, while crash rates increased when traffic increased to a level of 3000 vehicles/h [64]. We measured the effect of traffic volume on lane changing by considering real traffic data (Figure 2). For VISSIM simulation, the traffic volume of cars varied from 1000 to 3000 vehicles per hour with an interval of 500 vehicles per hour, which is approximate to real observed traffic data.
3. Results
Modeling of lane changing for road safety was done by changing the values of the model parameters from the default setting to driving logic “conscious” with basic field input data, such as desired speed and traffic volume (veh/hr) as per field observation. We analyzed the effect of various traffic parameters on lane change frequency based on VISSIM simulation data. Simulations were run based on specified traffic data to measure lane change frequency, and the results are tabulated in Table 4. Simulations were run three times for each traffic scenario, and the average value was used to validate the output results, such as the number of lane changes. This is similar to a previous study, which performed the generation of different parameter combinations with three replicates for each case study [65]. Lane change frequency was measured as the number of lane changes per hour (n/h). It is important to specify that we considered a traffic volume of 2500 vehicles per hour to measure the effect of average desired speed and desired speed distribution on lane change frequency. The analysis was initiated by measuring the effect of average desired speed variance on lane change frequency. Results showed that lane change frequency increased with the increase in average desired speed. After that, we analyzed the effect of speed distribution on lane change frequency for the freeway. Results showed high lane change frequency for larger speed variation between predefined speed limits. Large variations in speed between vehicles on a two-lane road can give rise to conflicts, which in turn can lead to lane changing risk. Moreover, we investigated the effect of traffic volume on lane change frequency for the freeway. Traffic volume input was varied from low to higher levels, and simulation runs were performed for one hour. The simulation considered the speed limit of cars as 130 km/h (freeway). Results showed that lane change frequency increased with the increase in traffic volume.
Considering the above simulation results, we analyzed the relationship between designated traffic parameters and lane change frequency. Polynomial curves (second degree) were found to better fit the relationship between observed traffic parameters (average desired speed, desired speed distribution, traffic volume) and lane change frequency. Furthermore, the equation of each curve was placed in plots to represent the relationship between a dependent variable (lane change frequency) and the independent variable. The R-squared (R2) value was also calculated, which can be defined as the percentage of variation in the response variable that is explained by the model. The higher the R2 value, the better the model fits the data.
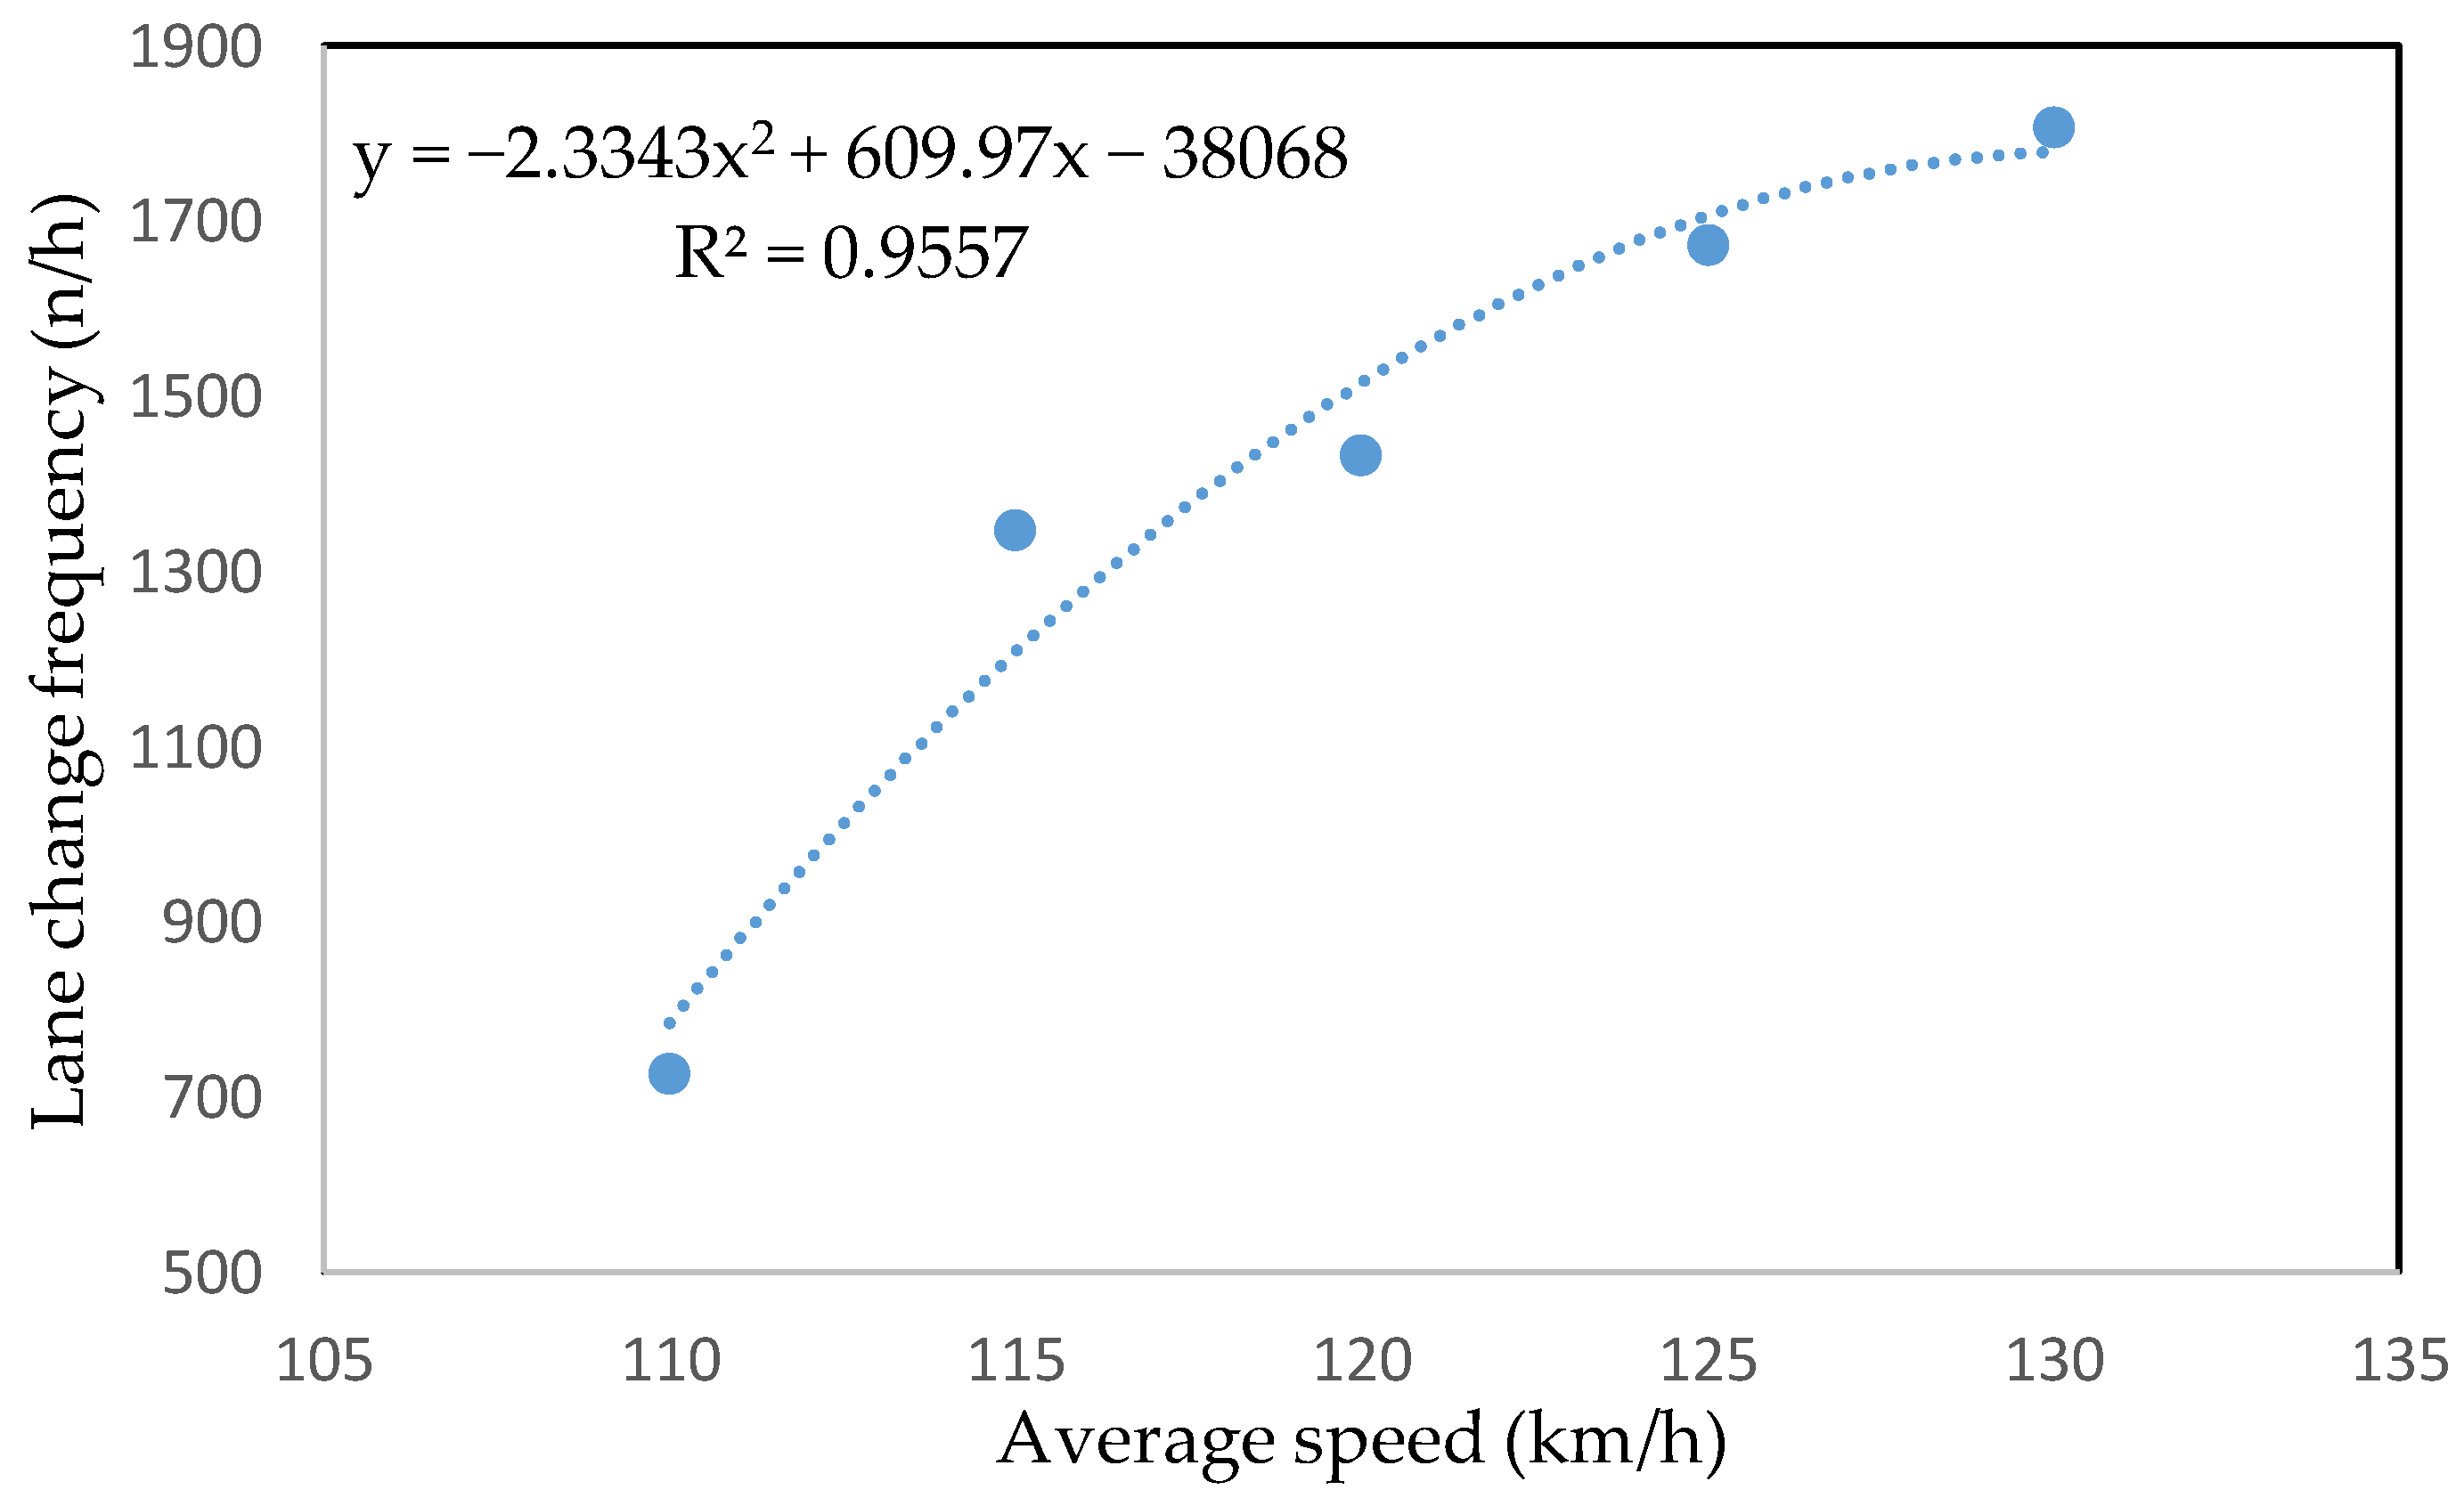
3.1. Effect of Average Desired Speed on Lane Change Frequency
Lane change frequency was measured for each simulation, with the average desired speed varying from 110 to 130 km/h with an interval of 5 km/h. Each observed average speed was simulated under a specified speed range (Figure 3). The relationship between average desired speed (km/h) and lane change frequency (n/h) is plotted in Figure 5. It can be seen that there was a positive relationship between the two variables, with lane change frequency increasing with the increase in average desired speed of cars. The results can be explained by the fact that high-speed conditions can cause frequent overtaking maneuvers [66]. A previous study showed that, after the implementation of higher speed limit, the number of injury crashes, as compared to the control, rose significantly on 130 km/h roads but not on 110 km/h roads [62].
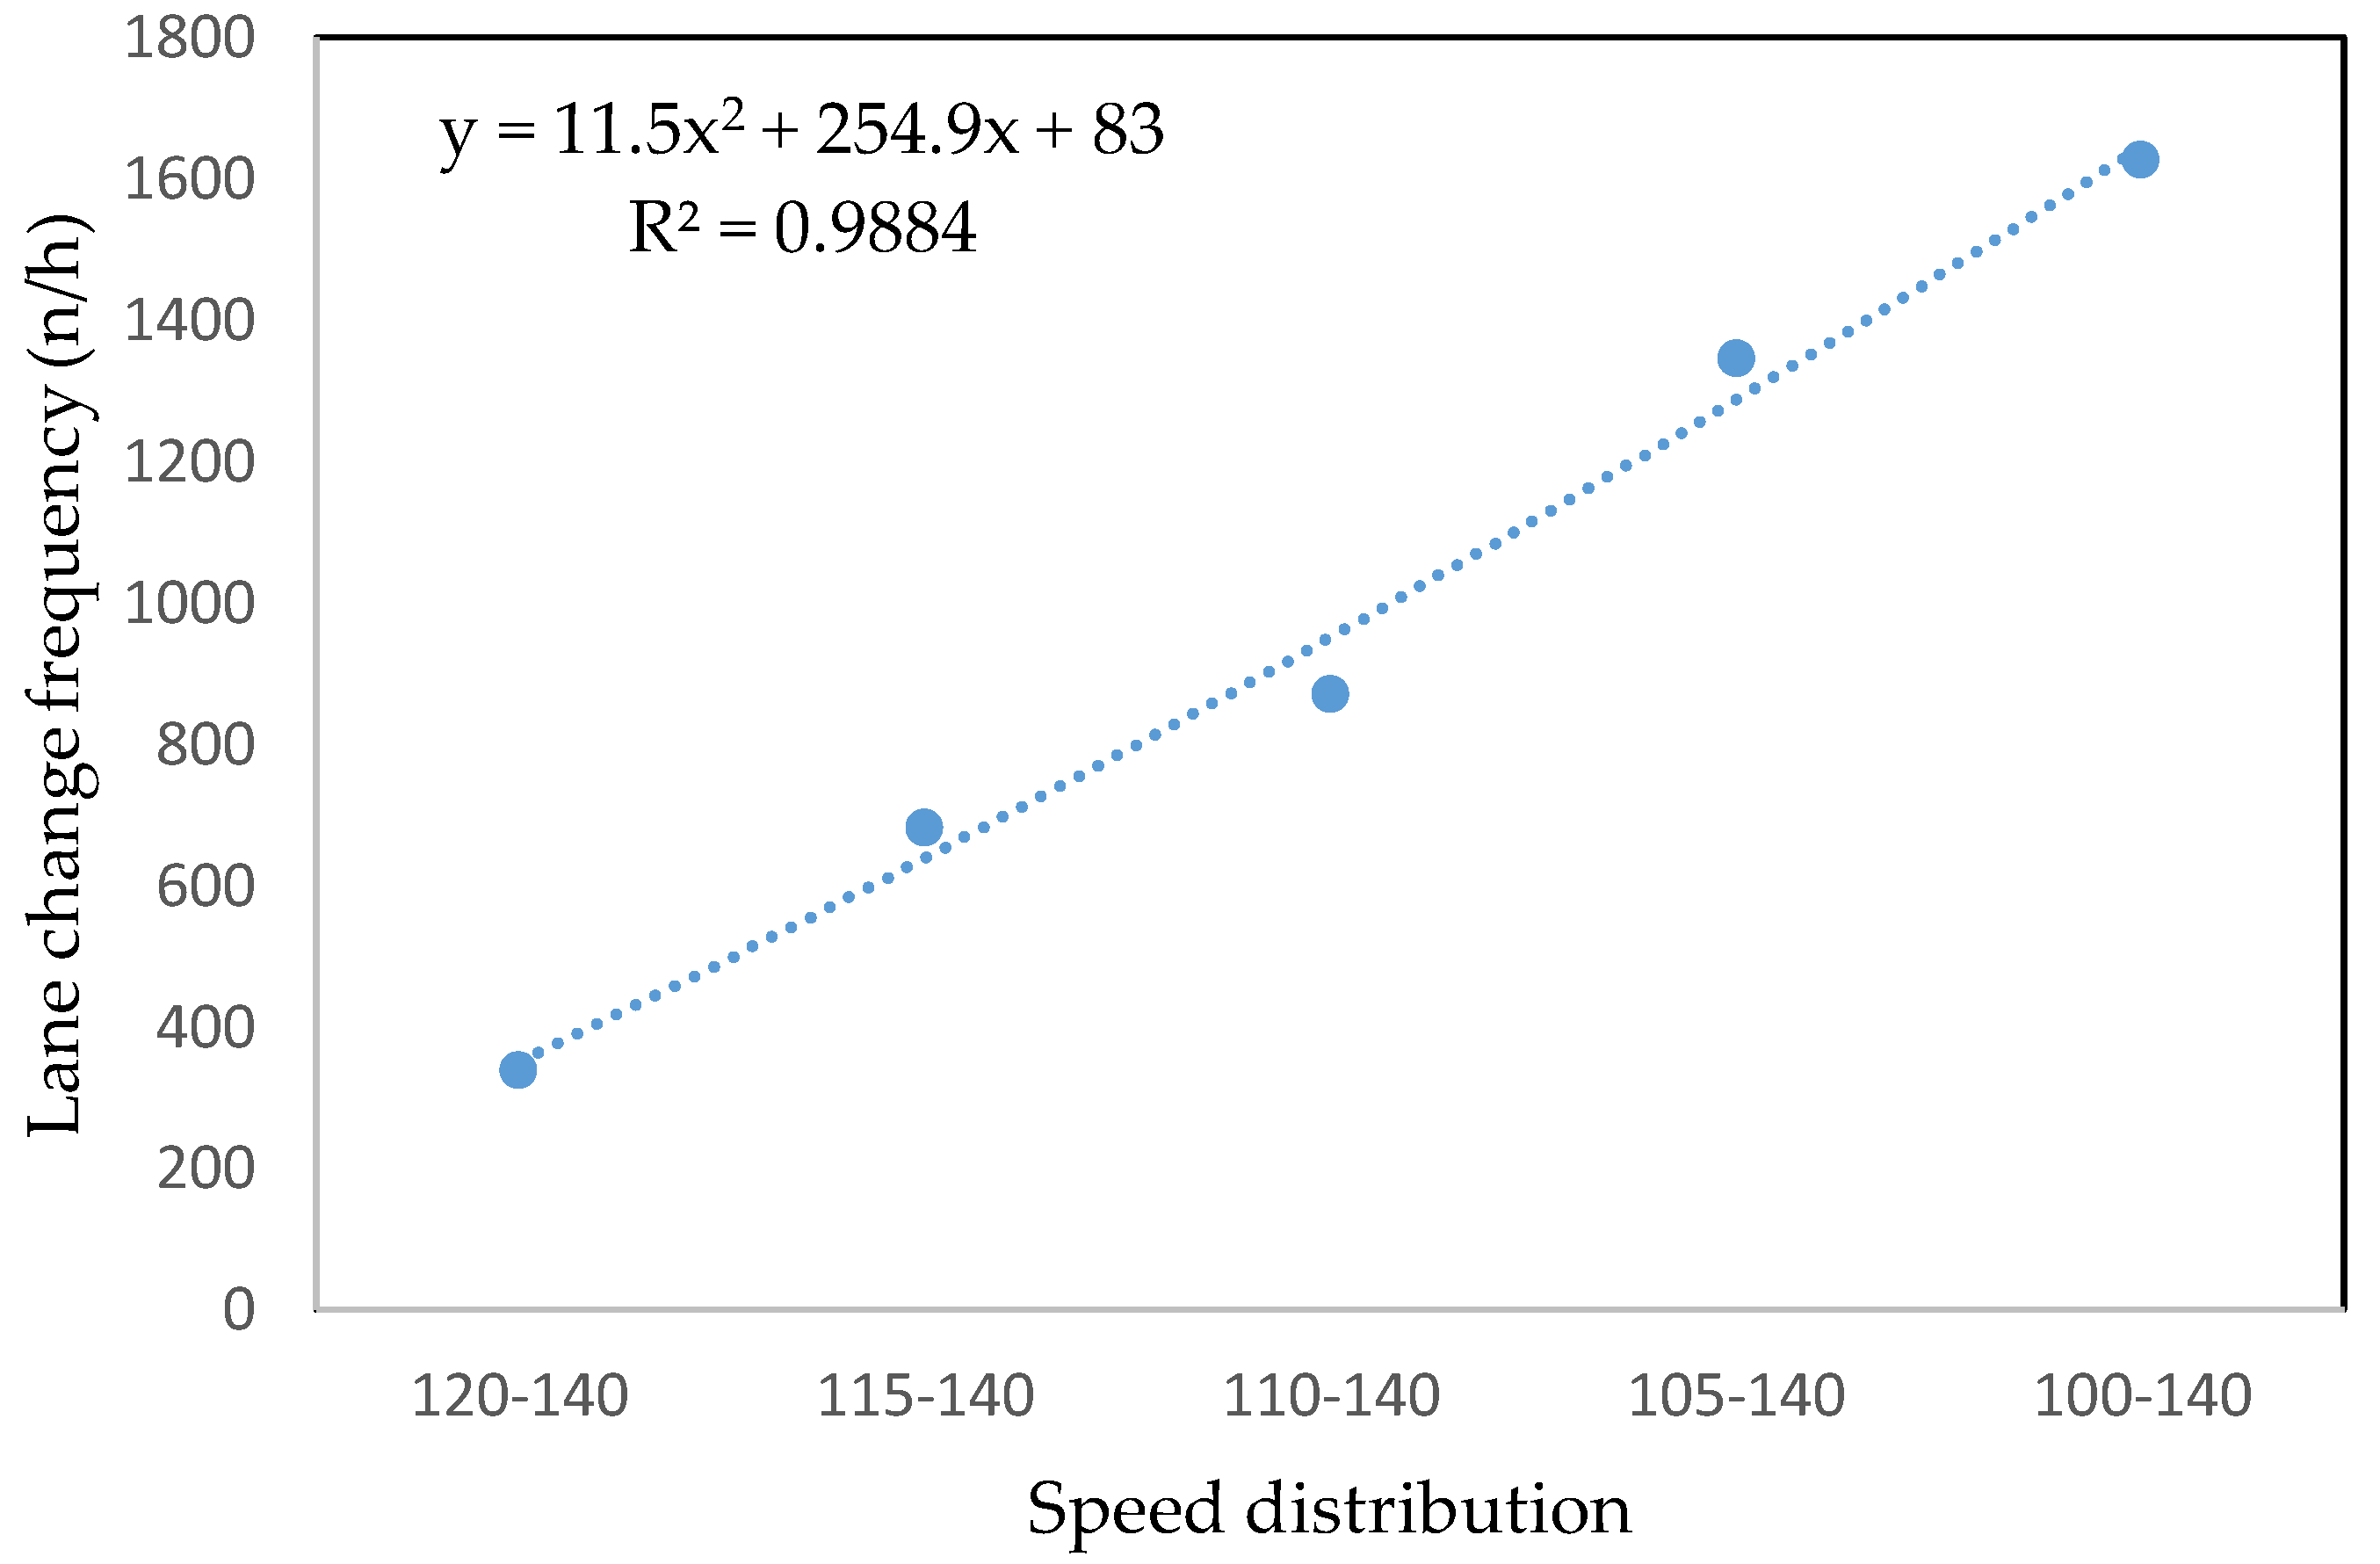
3.2. Effect of Desired Speed Distribution on Lane Change Frequency
The effect of speed distribution on lane change frequency was analyzed, and the results are plotted in Figure 6. All speed distribution data were set by maintaining an average speed at 130 km/h (freeway) (Figure 4). A previous study on displacement of speed distribution showed larger displacements for higher speeds [67]. The plot results showed higher lane change frequency for large speed dispersion and lower lane change frequency for small speed dispersion between predefined limits. In other words, when speed distribution was high, the examined vehicles tended to change lanes frequently due to the difference in speeds between vehicles. Some previous studies have found speed variations to be positively related to crashes [44,45,47,68].
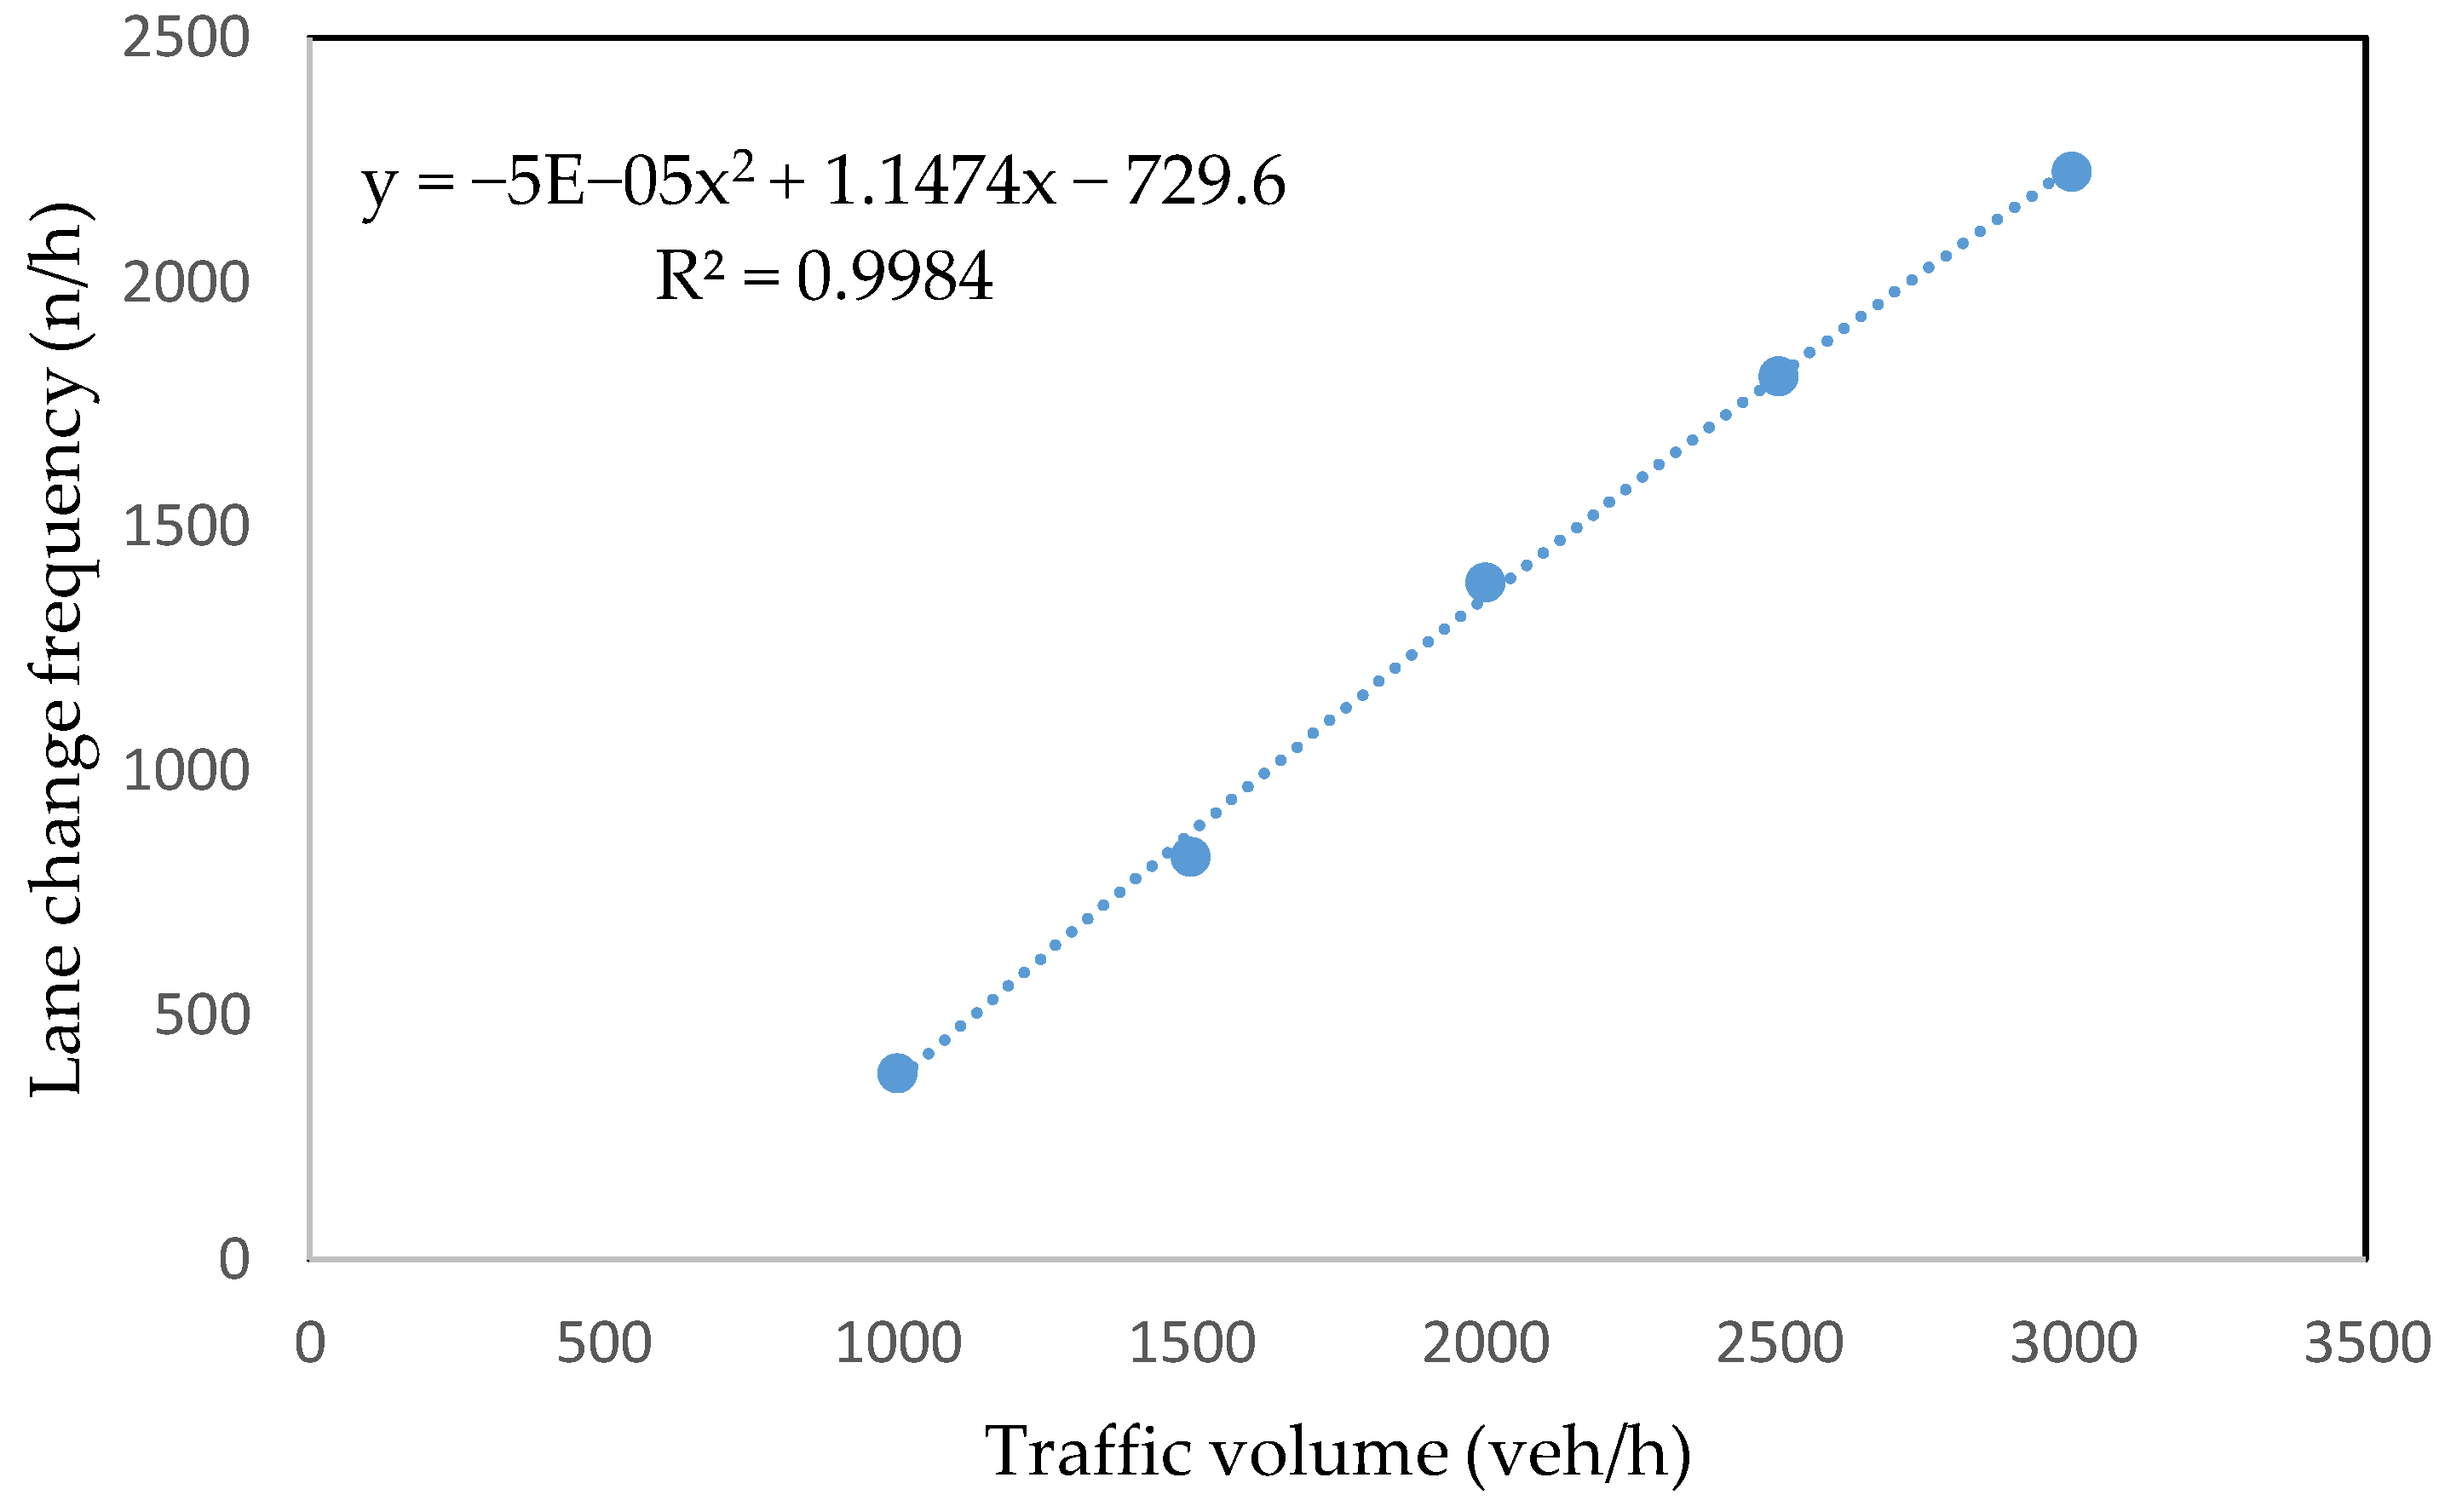
3.3. Effect of Traffic Volume on Lane Change Frequency
We observed the relationship between traffic volume and lane change frequency, as shown in Figure 7. Lane change frequency was measured for each simulation, with the traffic volume varying from 1000 to 3000 vehicles per hour with an interval of 500 vehicles per hour. Speed distribution was set in such a way that all simulated vehicles were moving on the road section within the speed limit (130 km/h). The plot results showed a positive relationship between the two variables, with lane change frequency increasing with the increase in traffic volume. When the number of vehicles increased in a specified period, more vehicles tended to change lanes for overtaking purposes. A previous study [11] had also found a positive correlation between risk factor and traffic flow efficiency in lower traffic demand.
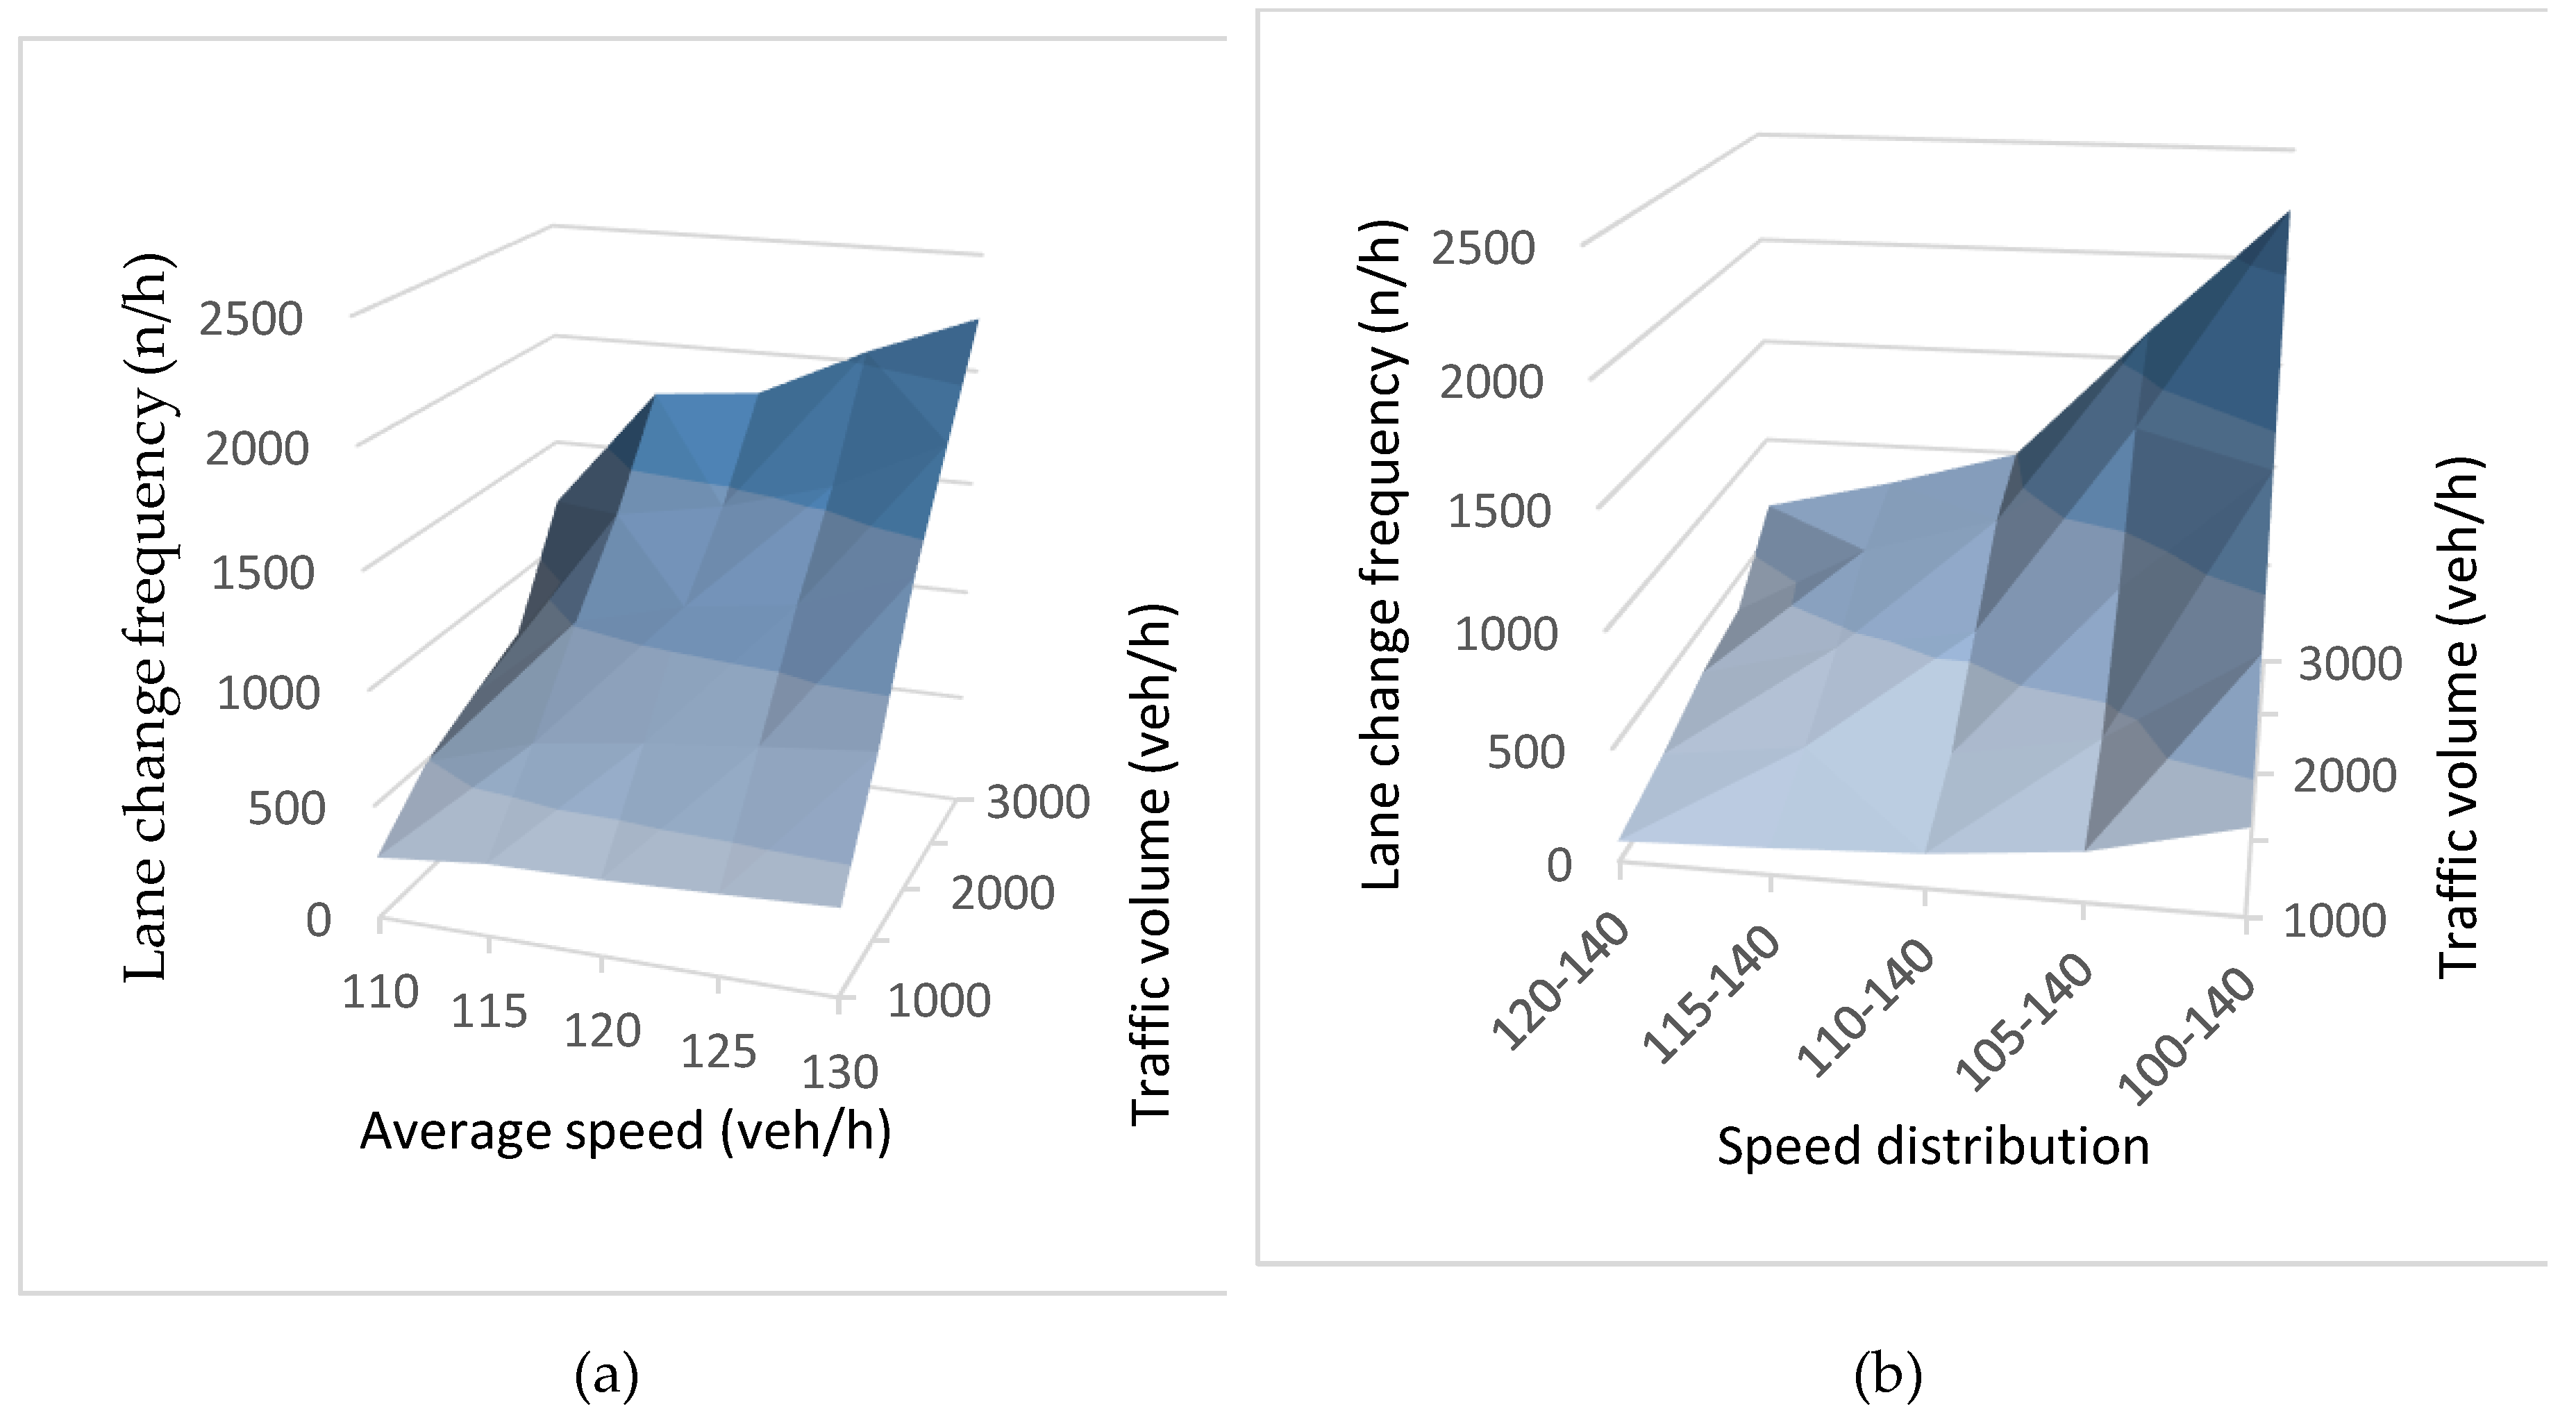
3.4. 3D Surface Plots and Regression Model
Previous model [66] results showed that the impact of speed on crashes was associated with volume and between-lane speed variations, which complicated its interpretation. Based on a similar concept, we analyzed the impact of speed (average desired speed and desired speed distribution) on lane change frequency in connection with traffic volume. 3D surface plots were developed to simultaneously observe changes in the shape of lane change frequency with the change in specified traffic parameters, as shown in Figure 8. Figure 8a presents a 3D surface plot to show the impact of the average desired speed on lane change frequency when associated with traffic volume. Figure 8b presents a 3D surface plot to show the impact of desired speed distribution on lane change frequency when associated with traffic volume. The results showed the highest lane change frequency for both cases due to the combined effect of the observed parameters. Xu et al. [30] found that high-speed variance in high-density traffic flow leads to higher crash risk.
Finally, we attempted to develop a regression model between lane change frequency and specified traffic parameters based on observed simulation data. Lane change frequency (LCF) was set as a dependent variable, while the independent variables were average desired speed (ADS), desired speed distribution (DSD), and traffic volume (TV). The regression model was developed based on simulation data, and coefficient results were utilized to quantify the effect of traffic parameters on lane change frequency, as shown in Equation (1). The results of this model showed that desired speed distribution had the most significant effect on lane change frequency due to high coefficient values (positive). A previous study [69] found that speed distribution had a vital role in road safety. Subsequently, the average desired speed also had a high effect on lane change frequency with a high coefficient value. However, traffic volume had a small effect on lane change frequency due to a small coefficient value.
The results of regression analysis are presented in Table 5. The standard error (SE) is also presented, which represents the average distance that the observed values fall from the regression line. The smaller the standard error, the more representative the sample will be of the overall sample size. The statistical significance of the effect depends on the p-value, i.e., if the p-value is larger than the selected significance level α, the effect is not statistically significant; however, if the p-value is less than or equal to α, then the effect for that particular term is statistically significant. The α value was set as 0.05 in the regression analysis. The results of the model showed that all observed parameters were statistically significant with p-values less than 0.05. Moreover, adjusted R2 was calculated, which represents the percentage of the variation in the response variable that is explained by the model, adjusted for the number of predictors in the model relative to the number of observations.
4. Discussion
Identification of the main traffic characteristics causing frequent lane changing could improve our understanding of lane-changing risk and help to develop more effective road safety strategies for freeways. The results of the present study showed that observed traffic parameters had a major impact on lane change frequency. Furthermore, lane change frequency was more greatly affected due to the integrated effect of specified traffic parameters. The regression model results showed that desired speed distribution had the highest effect on lane change frequency. Improvements in drivers’ compliance with speed limits and speed management/enforcement strategies can play a vital role in enhancing traffic safety. Regarding the impact of speed changes in speed distribution, several studies have confirmed that speed cameras and vehicle-to-vehicle communication (V2V) systems are effective in reducing both mean speed and excessive speeding [70,71]. However, this study only considered the driving logic “cautious” in the VISSIM model for traffic characteristics close to the real data, such as speed limits, traffic volume, and overtaking rules. Further research can be performed to apply the VISSIM model for other driving logics, such as “all knowing”, to analyze lane changing. Finally, lane change frequency should be analyzed in the context of the average traffic speed of traffic flow exceeding the speed limit.
5. Conclusions
This study evaluated the effect of significant traffic parameters on lane changing for a two-lane road section of a freeway. We utilized a traffic simulation software with calibration of the model for driving logic “cautious” to estimate the impact of designated traffic parameters on lane change frequency. The traffic parameters considered in this study were average desired speed, desired speed distribution, and traffic volume. First, VISSIM simulation was performed to measure the effect of average desired speed variation on lane change frequency. The measured simulation data were used to plot the relationship between the average desired speed and lane change frequency. The plot results showed a positive relationship between average desired speed variation and lane change frequency, with lane change frequency increasing with the increase in average desired speed under a predefined speed range. Subsequently, the effect of desired speed distribution on lane change frequency was analyzed. The simulation results showed higher lane change frequency when speed dispersion was set large and lower lane change frequency when speed distribution was set small. Furthermore, the effect of traffic volume variation on lane change frequency was analyzed. The simulation plot results showed a positive relationship between traffic volume and lane change frequency, with lane change frequency increasing with the increase in traffic volume. Based on the simulated data, 3D surface plots were developed between speed (average desired speed and desired speed distribution), traffic volume, and lane change frequency. The plot results showed the integrated effect of the observed parameters on lane change frequency, which was higher than the individual effect. Finally, a regression model was developed between the dependent variable (lane change frequency) and the independent variables (average desired speed, desired speed distribution, and traffic volume) to quantify the effect of traffic parameters on lane change frequency. The regression model results showed that desired speed distribution had the most significant impact on lane change frequency compared to the other observed variables. Overall, the results of this study could help to identify and quantify the effect of significant traffic parameters on lane changing by considering the modern technology of automated vehicles for sustainable traffic safety. Further research can be performed in VISSIM to explore whether changing the significant traffic parameters with diverse distributions for a higher number of lanes has a significant positive effect on lane changing.
Author Contributions
Conceptualization, J.J. and D.F.; methodology, J.J. and D.F.; software, D.F.; validation, D.F.; formal analysis, D.F.; investigation, J.J.; data curation, D.F.; writing—original draft preparation, D.F.; writing—review and editing, D.F. and J.J.; supervision, J.J.
Funding
This research received no external funding.
Conflicts of Interest
The authors declare no conflict of interest.
References
- World Health Organization (WHO). The Global Status Report on Road Safety 2018; WHO: Geneva, Switzerland, 2018. [Google Scholar]
- World Health Organization (WHO). Global Status Report on Road Safety 2009; WHO: Geneva, Switzerland, 2009. [Google Scholar]
- Valette, L. Road Safety: New Statistics Call for Fresh Efforts to Save Lives on EU Roads; European Commission Press Release: Brussels, Belgium, 2016. [Google Scholar]
- OECD/ITF. Road Safety Annual Report; OECD: Paris, France; ITF: London, UK, 2016. [Google Scholar]
- KSH. Road Accidents Involving Personal Injury (2001–2017); KSH: Budapest, Hungary, 2018. [Google Scholar]
- NHTSA (National Highway Traffic Safety Administration). National Motor Vehicle Crash Causation Survey; U.S. Department of Transportation: Washington, DC, USA, 2008.
- Evans, L. Traffic Safety; Science Serving Society, Inc.: Bloomfield Hills, MI, USA, 2004. [Google Scholar]
- Choi, E.H. Crash Factors in Intersection-Related Crashes: An On-Scene Perspective; NHTSA Technical Report: DOT HS 811 366; U.S. Department of Transportation, National Highway Traffic Safety Administration: Washington, DC, USA, 2010.
- Papaioannou, P. Driver behavior, dilemma zone and safety effects at urban signalised intersections in Greece. Accid. Anal. Prev. 2007, 39, 147–158. [Google Scholar] [CrossRef] [PubMed]
- Wang, J.; Ding, J.X.; Shi, Q.; Kühne, R.D. Lane-changing behavior and its effect on energy dissipation using full velocity difference model. Int. J. Mod. Phys. C 2016, 27, 1650013. [Google Scholar] [CrossRef]
- Li, X.; Jia, B.; Gao, Z.; Jiang, R. A realistic two-lane cellular automata traffic model considering aggressive lane-changing behavior of fast vehicle. Phys. A Stat. Mech. Appl. 2006, 367, 479–486. [Google Scholar] [CrossRef]
- BERNARD Law group. Accidents Nationwide Associated with Lane-Changing. 2017. Available online: https://www.4injured.com/blog/accidents-lane-changing-risks/ (accessed on 1 August 2019).
- Elvik, R.; Christensen, P.; Amundsen, A. Speed and Road Accidents: An Evaluation of the Power Model; TØI Report Number: 740/2004; Institute of Transport Economics: Oslo, Norway, 2004. [Google Scholar]
- Park, S.; Ritchie, S.G. Exploring the relationship between freeway speed variance, lane changing, and vehicle heterogeneity. In Proceedings of the Paper Sub-Mitted to the 83rd Annual Meeting of the Transportation Research Board, Washington, DC, USA, 11–15 January 2004; pp. 11–15. [Google Scholar]
- Pirdavani, A.; De Pauw, E.; Brijs, T.; Daniels, S.; Magis, M.; Bellemans, T.; Wets, G. Application of a rule-based approach in real-time crash risk prediction model development using loop detector data. Traffic Inj. Prev. 2015, 16, 786–791. [Google Scholar] [CrossRef]
- Quddus, M. Exploring the Relationship Between Average Speed, Speed Variation, and Accident Rates Using Spatial Statistical Models and GIS. J. Transp. Saf. Secur. 2013, 5, 27–45. [Google Scholar] [CrossRef]
- Xu, C.; Wang, X.; Yang, H.; Xie, K.; Chen, X. Exploring the impacts of speed variances on safety performance of urban elevated expressways using GPS data. Accid. Anal. Prev. 2019, 123, 29–38. [Google Scholar] [CrossRef]
- Levy, D.T.; Asch, P. Speeding, Coordination, and the 55-MPH Limit: Comment. Am. Econ. Rev. 1989, 79, 913–915. [Google Scholar]
- Tanishita, M.; Wee, B. Impact of vehicle speeds and changes in mean speeds on per 2 vehicle-kilometer traffic accident rates in Japan. IATSS Res. 2016, 41, 107–112. [Google Scholar] [CrossRef]
- Elvik, R. Towards a General Theory of the Relationship Between Exposure and Risk; TØI Report No: 1316/2014; Institute of Transport Economics: Oslo, Norway, 2014. [Google Scholar]
- Garber, J.J.; Gadiraju, R. Factors Affecting Speed Variance and its Influence on Accidents. Transp. Res. Rec. 1989, 1213, 64–71. [Google Scholar]
- Kweon, Y.J.; Kockelman, K.M. Spatially disaggregate panel models of crash and injury counts: The effect of speed limits and design. In Proceedings of the 83rd Transportation Research Board Annual Meeting, National Research Council, Washington, DC, USA, 11–15 January 2004. [Google Scholar]
- Lave, C.A. Speeding, Coordination, and the 55 MPH Limit. Am. Econ. Rev. 1985, 75, 1159–1164. [Google Scholar]
- The International Transport Forum. Speed and Crash Risk; OECD: Paris, France, 2018. [Google Scholar]
- Elvik, R. A re-parameterisation of the Power Model of the relationship between the speed of traffic and the number of accidents and accident victims. Accid. Anal. Prev. 2013, 50, 854–860. [Google Scholar] [CrossRef] [PubMed] [Green Version]
- Elvik, R.; Vadeby, A.; Hels, T.; Van Schagen, I. Updated estimates of the relationship between speed and road safety at the aggregate and individual levels. Accid. Anal. Prev. 2019, 123, 114–122. [Google Scholar] [CrossRef] [PubMed]
- Vadeby, A.; Forsman, A. Changes in speed distribution: Applying aggregated safety effect models to individual vehicle speeds. Accid. Anal. Prev. 2017, 103, 20–28. [Google Scholar] [CrossRef] [PubMed]
- Qu, X.; Kuang, Y.; Oh, E.; Jin, S. Safety evaluation for expressways: A comparative study for macroscopic and microscopic indicators. Traffic Inj. Prev. 2014, 15, 89–93. [Google Scholar] [CrossRef]
- Abdel-Aty, M.A.; Pemmanaboina, R. Calibrating a Real-Time Traffic Crash-Prediction Model Using Archived Weather and ITS Traffic Data. IEEE Trans. Intell. Transp. Syst. 2006, 7, 167–174. [Google Scholar] [CrossRef]
- XU, C.; Liu, P.; Wang, W.; Zhang, Y. Real-time identification of traffic conditions prone to injury and non-injury crashes on freeways using genetic programming. J. Adv. Transp. 2016, 50, 701–716. [Google Scholar] [CrossRef] [Green Version]
- Aarts, L.; van Schagen, I. Driving speed and the risk of road crashes: A review. Accid. Anal. Prev. 2006, 38, 215–224. [Google Scholar] [CrossRef]
- Garber, N.; Ehrhart, A. Effect of Speed, Flow, and Geometric Characteristics on Crash Frequency for Two-Lane Highways. Transp. Res. Rec. J. Transp. Res. Board 2000, 1717, 76–83. [Google Scholar] [CrossRef]
- Fi, I.; Galuska, J. Traffic analysis of two-lane highways. Period. Polytech. Civ. Eng. 2011, 55, 169–176. [Google Scholar] [CrossRef]
- Cunto, F.; Saccomanno, F.F. Calibration and validation of simulated vehicle safety performance at signalized intersections. Accid. Anal. Prev. 2008, 40, 1171–1179. [Google Scholar] [CrossRef]
- TEOpS 16-20. Traffic Engineering, Operations & Safety Manual. 2019. Available online: https://wisconsindot.gov/dtsdManuals/traffic-ops/manuals-and-standards/teops/16-20.pdf (accessed on 25 October 2019).
- Ozbay, K.; Bartin, B.; Yang, H. Derivation and Validation of New Simulation-Based Surrogate Safety Measure. Transp. Res. Rec. J. Transp. Res. Board 2008, 2083, 105–113. [Google Scholar] [CrossRef] [Green Version]
- Park, B.B.; Schneeberger, J.D. Microscopic simulation model calibration and validation, case study of VISSIM simulation model for a coordinated actuated signal system. Transp. Res. Rec. 2003, 1856, 185–192. [Google Scholar] [CrossRef]
- Gettman, D.; Head, L. Surrogate Safety Measures from Traffic Simulation Models. Transp. Res. Rec. 2003, 1840, 104–115. [Google Scholar] [CrossRef] [Green Version]
- Srikanth, S.; Mehar, A.; Praveen, K.G.N.V. Simulation of Traffic Flow to Analyze Lane Changes on Multi-Lane Highways under Non-Lane Discipline. Period. Polytech. Transp. Eng. 2017, 66, 1–14. [Google Scholar] [CrossRef]
- Ciuffo, B.; Punzo, V.; Torrieri, V. Comparison of Simulation-Based and Model-Based Calibrations of Traffic-Flow Microsimulation Models. Transp. Res. Rec. J. Transp. Res. Board 2008, 2088, 36–44. [Google Scholar] [CrossRef]
- Bains, M.S.; Ponnu, B.; Arkatkar, S.S. Modeling of Traffic Flow on Indian Expressways using Simulation Technique. Procedia Soc. Behav. Sci. 2012, 43, 475–493. [Google Scholar] [CrossRef] [Green Version]
- Lee, S.E.; Olsen, E.C.B.; Wierwille, W.W. A Comprehensive Examination of Naturalistic Lane Changes; Final Report: DOT HS 809 702; National Highway Traffic Safety Administration: Washington, DC, USA, 2004. [Google Scholar]
- Fellendorf, M.; Vortisch, P. Microscopic Traffic Flow Simulator VISSIM. In Fundamentals of Traffic Simulation, International Series in Operations Research & Management Science; Barceló, J., Ed.; Springer: New York, NY, USA, 2010. [Google Scholar]
- Ma, Z.; Zhang, H.; I-Jy Chien, S.; Wang, J.; Dong, C. Predicting expressway crash frequency using a random effect negative binomial model: A case study in China. Accid. Anal. Prev. 2017, 98, 214–222. [Google Scholar] [CrossRef]
- Potts, I.B.; Harwood, D.W.; Richard, K.R. Relationship of Lane Width to Safety on Urban and Suburban Arterials. Transp. Res. Rec.: J. Transp. Res. Board 2007, 2023, 63–82. [Google Scholar] [CrossRef] [Green Version]
- Wang, X.; Yuan, J. Safety impacts study of roadway network features on suburban highways. China J. Highw. Transp. 2017, 30, 106–114. [Google Scholar]
- Wang, X.; Zhou, O.; Quddus, M.; Fan, T.; Fang, S. Speed, speed variation and crash relationships for urban arterials. Accid. Anal. Prev. 2018, 113, 236–243. [Google Scholar] [CrossRef] [Green Version]
- Mehar, A.; Chandra, S.; Velmurugan, S. Passenger car units at different levels-of-service for capacity analysis of multilane divided highways. ASCE J. Transp. Eng. USA 2013, 140, 81–88. [Google Scholar] [CrossRef]
- Knoop, V.L.; Hoogendoorn, S.P.; Yasuhiro, S.; Buisson, C. Quantifying the number of lane changes in traffic: Empirical analysis. Transportation Research Records. J. Transp. Res. Board 2012, 2278, 31–41. [Google Scholar] [CrossRef]
- Jin, W.L. Macroscopic characteristics of lane-changing traffic. Transportation Research Record. J. Transp. Res. Board 2010, 2188, 55–63. [Google Scholar] [CrossRef]
- Chunying, G. Microscopic simulation system VISSIM and its application to road and transportation. Highway 2005, 8, 118–121. [Google Scholar]
- Al-Ahmadi, H.M.; Jamal, A.; Reza, I.; Assi, K.J.; Ahmed, S.A. Using Microscopic Simulation-Based Analysis to Model Driving Behavior: A Case Study of Khobar-Dammam in Saudi Arabia. Sustainability 2019, 11, 3018. [Google Scholar] [CrossRef]
- Gomes, G.; May, A.; Horowitz, R. Calibration of VISSIM for a Congested Freeway; California PATH Research Report, UCB-ITS-PRR-2004-4; Institute of Transportation Studies, University of California: Berkeley, CA, USA, 2004. [Google Scholar]
- Siddharth, S.M.P.; Ramadurai, G. Calibration of VISSIM for Indian Heterogeneous Traffic Conditions. Procedia Soc. Behav. Sci. 2013, 104, 380–389. [Google Scholar] [CrossRef] [Green Version]
- Nagy, E.; Sandor, Z. Overtaking ban for heavy goods vehicle in Hungary on the National motorway network. Pollack Period. Int. J. Eng. Inf. Sci. 2012, 7, 83–95. [Google Scholar] [CrossRef]
- Planning Transport Verkehr (PTV). VISSIM User’s Manual; Version 5.4; PTV Group: Karlsruhe, Germany, 2012. [Google Scholar]
- Planning Transport Verkehr (PTV). VISSIM User Manual; Version 5.30; PTV Group: Karlsruhe, Germany, 2009. [Google Scholar]
- Sukennik, P. CoExist, PTV Vissim Extension—New Features and Improvements; PTV Group: Karlsruhe, Germany, 2018. [Google Scholar]
- Eboli, L.; Mazzulla, G.; Pungillo, G. How drivers’ characteristics can affect driving style. In Proceedings of the 20th EURO Working Group on Transportation Meeting, EWGT 2017, Budapest, Hungary, 4–6 September 2017. [Google Scholar]
- SARTRE 3 Report. European Drivers and Road Risk; Institut national de recherche sur les transports et leur sécurité: Arcueil, France, 2004. [Google Scholar]
- Nilsson, G. Traffic Safety Dimensions and the Power Model to Describe the Effect of Speed on Safety; Bulletin 221; Lund Institute of Technology, Department of Technology and Society, Traffic Engineering: Lund, Sweden, 2004. [Google Scholar]
- Zhang, C.; Liu, S.; Ogle, J.; Zhang, M. Micro-simulation of Desired Speed for Temporary Work Zone with a New Calibration Method. Promet Traffic Transp. 2016, 28, 49–61. [Google Scholar] [CrossRef] [Green Version]
- AAA. Aggressive Driving: Research Update; AAA Foundation for Traffic Safety: Washington, DC, USA, 2009. [Google Scholar]
- Martin, J.L. Relationship between crash rate and hourly traffic flow on interurban motorways. Accid. Anal. Prev. 2002, 34, 619–629. [Google Scholar] [CrossRef]
- Gallelli, V.; Iuele, T.; Vaiana, R.; Vitale, A. Investigating the Transferability of Calibrated. Microsimulation Parameters for Operational Performance Analysis in Roundabouts. Hindawi J. Adv. Transp. 2017, 2017, 3078063. [Google Scholar]
- Choudhary, P.; Imprialou, M.; Velaga, N.R.; Choudhary, A. Impacts of speed variations on freeway crashes by severity and vehicle type. Accid. Anal. Prev. 2018, 121, 213–222. [Google Scholar] [CrossRef] [PubMed] [Green Version]
- Montella, A.; Imbriani, L.L.; Marzano, V.; Mauriello, F. Effects on speed and safety of Point-to-Point speed enforcement systems: Evaluation on the urban motorway A56 Tangenziale di Napoli. Accid. Anal. Prev. 2015, 75, 164–178. [Google Scholar] [CrossRef] [PubMed]
- Wang, J.; Gao, C.; Zhu, Z.; Yan, X. Multi-lane Changing Model with Coupling Driving Intention and Inclination. Promet Traffic Transp. 2017, 29, 185–192. [Google Scholar] [CrossRef] [Green Version]
- Hassan, H.M.; Shawkya, M.; Kishta, M.; Gariba, A.M.; Al-Harthei, H.A. Investigation of drivers’ behavior towards speeds using crash data and self-reported questionnaire. Accid. Anal. Prev. 2017, 98, 348–358. [Google Scholar] [CrossRef] [PubMed]
- Soole, D.W.; Watson, B.C.; Fleiter, J.J. Effects of average speed enforcement on speed compliance and crashes: A review of the literature. Accid. Anal. Prev. 2013, 54, s46–s56. [Google Scholar] [CrossRef] [PubMed]
- Farooq, D.; Juhasz, J. Simulation Analysis of Contributing Factors to Rider Visibility Issues for Car-Motorcycle Accidents. Period. Polytech. Transp. Eng. 2019, 1–7. Available online: https://www.researchgate.net/publication/332441297_Simulation_Analysis_of_Contributing_Factors_to_Rider_Visibility_Issues_for_Car-Motorcycle_Accidents (accessed on 25 October 2019).
Figure 1.
Real speed data.

Figure 2.
Real traffic volume data.

Figure 3.
Speed range for nominated average speeds.

Figure 4.
Speed distribution profile for a freeway (130 km/h).

Figure 5.
Effect of average speed variation on lane change frequency.

Figure 6.
Effect of desired speed distribution on lane change frequency.

Figure 7.
Effect of traffic volume on lane change frequency for a freeway.

Figure 8.
3D surface plots.


Table 1.
Simulation parameters.
| Simulation Parameters | |
|---|---|
| Number of lanes | 2 |
| Lane change frequency | n/h (number of lane changes per hour) |
| Length of road section | 5 km |
| Simulation period | 3600 s |
| Vehicle type | Cars |
| Road type | Freeway |
| Simulation model | Wiedemann 99 model |
Table 2.
Wiedemann 99 model parameters [58].
Table 2.
Wiedemann 99 model parameters [58].
| VISSIM Code | Description | Default Values | Calibrated Values (Cautious) |
|---|---|---|---|
| CC0 | Standstill distance: Desired distance between lead and following vehicle at v = 0 mph | 1.5 m | 1.5 m |
| CC1 | Headway Time: Desired time in seconds between lead and following vehicle | 0.90 s | 1.5 s |
| CC2 | Following variation: Additional distance over safety distance that a vehicle requires | 4 m | 0 m |
| CC3 | Threshold for entering “following” state: Time in seconds before a vehicle starts to decelerate to reach safety distance (negative) | −8 s | −10 s |
| CC4 | Negative “following” threshold: Specifies variation in speed between lead and following vehicle | −0.35 | −0.1 |
| CC5 | Positive “following” threshold: Specifies variation in speed between lead and following vehicle | 0.35 | 0.1 |
| CC6 | Speed dependency of oscillation: Influence of distance on speed oscillation | 11.44 | 0 |
| CC7 | Oscillation acceleration: Acceleration during the oscillation process | 0.25 m/s2 | 0.1 m/s2 |
| CC8 | Standstill acceleration: Desired acceleration starting from standstill | 3.5 m/s2 | 3.5 m/s2 |
| CC9 | Acceleration at 80 mph: Desired acceleration at 80 mph | 1.5 m/s2 | 1.5 m/s2 |
Table 3.
Lane change parameters [58].
Table 3.
Lane change parameters [58].
| Parameters | Default Values | Calibrated Values (Cautious) | ||
|---|---|---|---|---|
| Own | Trailing Vehicle | Own | Trailing Vehicle | |
| Maximum deceleration | −4 | −3 | −3.5 | −2.5 |
| −1 m/s2 per distance | 100 | 100 | 80 | 80 |
| Accepted deceleration | −1 | −1 | −1 | −1 |
Table 4.
Effect of traffic parameters on lane change frequency.
| Average Speed (km/h) | Lane Change Frequency (n/h) | Speed Distribution | Lane Change Frequency (n/h) | Traffic Volume (veh/h) | Lane Change Frequency (n/h) |
|---|---|---|---|---|---|
| 110 | 728 | 120–140 | 340 | 1000 | 382 |
| 115 | 1347 | 115–140 | 684 | 1500 | 826 |
| 120 | 1434 | 110–140 | 872 | 2000 | 1386 |
| 125 | 1674 | 105–140 | 1347 | 2500 | 1808 |
| 130 | 1808 | 100–140 | 1628 | 3000 | 2228 |
Table 5.
Regression analysis results.
| Coefficients | Standard Error | p-Value | |
|---|---|---|---|
| Average desired speed | 31.36 | 3.09 | 0.00 |
| Desired speed distribution | 220.8 | 43.81 | 0.00 |
| Traffic volume | 0.67 | 0.030 | 0.00 |
| Intercept | −4487.28 | 383.26 | 0.00 |
| Adjusted R2 | 92% | ||
© 2019 by the authors. Licensee MDPI, Basel, Switzerland. This article is an open access article distributed under the terms and conditions of the Creative Commons Attribution (CC BY) license (http://creativecommons.org/licenses/by/4.0/).
Share and Cite
MDPI and ACS Style
Farooq, D.; Juhasz, J. Simulation-Based Analysis of the Effect of Significant Traffic Parameters on Lane Changing for Driving Logic “Cautious” on a Freeway. Sustainability 2019, 11, 5976. https://0-doi-org.brum.beds.ac.uk/10.3390/su11215976
AMA Style
Farooq D, Juhasz J. Simulation-Based Analysis of the Effect of Significant Traffic Parameters on Lane Changing for Driving Logic “Cautious” on a Freeway. Sustainability. 2019; 11(21):5976. https://0-doi-org.brum.beds.ac.uk/10.3390/su11215976
Chicago/Turabian StyleFarooq, Danish, and Janos Juhasz. 2019. "Simulation-Based Analysis of the Effect of Significant Traffic Parameters on Lane Changing for Driving Logic “Cautious” on a Freeway" Sustainability 11, no. 21: 5976. https://0-doi-org.brum.beds.ac.uk/10.3390/su11215976
Note that from the first issue of 2016, this journal uses article numbers instead of page numbers. See further details here.