Article

Overcoming the Main Barriers of Circular Economy Implementation through a New Visualization Tool for Circular Business Models

Department of Industrial Engineering, University of Bologna, 47121 Forlì, Italy
*
Author to whom correspondence should be addressed.
Sustainability 2019, 11(23), 6614; https://0-doi-org.brum.beds.ac.uk/10.3390/su11236614
Submission received: 12 October 2019 / Revised: 7 November 2019 / Accepted: 14 November 2019 / Published: 22 November 2019

Abstract

:
There is a huge gap between the broad concept of circular economy (CE) and its practical implementation in the industrial sector due to several types of barriers, which shall be led back to the lack of consistent and precise information about resources, products, and processes. Without a proper information flow, it is impossible to quantify circular initiatives, both in comparison with the actual linear situation or with circular alternative opportunities. A proper quantification of circular initiatives allows the assessment of economic, environmental and social benefits and the preventative identification of potential barriers and relative solutions, monitoring the risk associated with circular investments and supporting the decision-making process. This paper describes a new tool to ensure the quantification of circular initiatives and the method to define it. It is a new Circular Business Model (CBM) visualization tool, which overcomes the main limitations of the existing models able to explain CE concepts but not to boost its practical implementation in industry. The new CBM visualization tool can be adopted in every industrial sector to highlight circular opportunities that are still hidden or unexploited or to select the best CE strategy. The proposed CBM visualization tool differs from the previous diagrams in two main characteristics: (i) the possibility to quantify resource flows and important indicators representing energy consumption, environmental and social impact, and (ii) the focus, which is not only on the product, but on the whole system, involving also the process, the company and the entire supply chain. The methodology to adopt and adapt the proposed model to different scales is described in detail. To provide a practical example, the model was qualitatively applied to a generic technical product to highlight its potential in the identification and quantification of circular activities.

1. Introduction

Since the early 2000s, several efforts have concentrated on the transition from the traditional linear production (‘take–make–use–dispose’) to a Circular Economy (CE), proposed as a promising strategy for both dealing with the current environmental issues and providing socio-economic benefits [1]. According to the Circular Economy action plan [2], adopted by the European Commission in 2015, in a CE the ‘value of products, materials and resources is maintained in the economy for as long as possible, and the generation of waste minimised…to develop a sustainable, low carbon, resource efficient and competitive economy’. It makes it necessary to completely rethink the way of producing and consuming, and to transform waste into value-added products, with the final aims of slowing, narrowing and closing the resource loop. This transition necessarily involves the entire supply chain—from production to consumption, repair and remanufacturing, waste management, and secondary raw materials feeding back into the economy—and requires complete changes in the way companies generate value, which is how they do business. Consequently, increasing organization sustainability does not only require new products, technologies and processes, but also new business models [3,4,5]. Business model innovation has an important role in substantially changing the value-chain to enhance sustainability, efficiency, and productivity, and obtain a green supply chain [6,7].
In this research field, a temporal evolution can be noted [8,9,10]. The conceptual frameworks of innovative and sustainable business models based on CE are not new, but were mainly developed between 2008 and 2013 [11,12,13,14], while methods and tools for implementing these models emerged in 2016 and 2017 [15,16,17,18,19]. The natural next step consists of practical implementation, validation and consolidation of CE concepts and methodologies. However, although CE strategies have been consolidated and well-known for many years, the process is not straightforward. In fact, there is a big gap between CE business model design and implementation, which means that promising ideas are not further developed, concepts are not fully implemented and innovative business models fail in the market [20,21,22]. Several challenges and factors, both internal and external, influence this situation. The main existing barriers to CE model adoption can be divided in different categories, as shown in Table 1 [23,24,25,26].
The uncertainties and the risks associated with the implementation of a circular business model are related to the CE model framework, which is by nature networked. In fact, the idea of closing material loops does not involve only a single company and its boundaries, but it requires the participation of a system of business models that act together. Since in a CE context the stakeholders are interdependent but independent, collaboration, communication and coordination are complex. In particular, in the actual situation, the difficult interaction between the involved actors can cause unpredictable flows, which have a direct effect on material quantity, quality and timing, affecting the value chain of a company [13,36,37]. Consequently, to effectively implement a CE strategy, a network of information and feedback information is fundamental. Information is the instrument of ensuring that businesses in the network can develop new opportunities or further exploit the existing relationships to use resources efficiently, eliminate waste and, at the same time, to build competitive advantages [38,39]. The technological support offered by the tools of the Fourth Industrial Revolution can play a key role in providing valuable data about resource condition, material and energy flows and under-used assets [40,41]. With the sharing of upgraded and corresponding information, companies and end-users can detect new ways to create value in the Circular Economy paradigm. Continuous and real-time data collection, processing and information exchanges, generated by the Industry 4.0 technologies, have the potential to effectively unlock CE concept implementation [42,43]. Knowledge of the information, such as resource condition, location and availability, helps the already well-established circular practices (e.g., performance optimization, predictive maintenance and remanufacturing) to perform better and with increased flexibility. Moreover, information exchange makes the circular practices accessible to a broader range of companies and consumers [44,45,46].
The lack of these data has limited the implementation of CE strategies to only a few business functions or with other partners in the same supply chain due to consolidated relationships. Data availability allows the identification of concealed or unexplored opportunities, since the collected data allow three main activities: (i) the quantification of the potential of new sustainable strategies; (ii) the identification in advance of the probable barriers and (iii) the provision of indications about suitable solutions to both implement these strategies and overcome the limitations. The result is a considerable reduction of the risk of investment within the circular economy and its greater diffusion [46,47,48]. In fact, to be successful, any business must prove itself able to capture and create value and generate economic benefits.
Reliable and consistent information can be integrated in an effective method to map and capture new opportunities, which is the use of a Circular Business Model (CBM) visualization tool. The model of a business is a simpler replication of how an organization creates, delivers and captures value and contains its main proposition, functions, elements and frameworks. A business model describes not only the internal activities within the company, but also extends the network between the actors in the supply chain and the partners. Visualization is a specific method to express a business model, which implies a further reduction of the complexity of the business structures and their relationships, without losing information, but facilitating the decisions, the communication and the generation of new ideas and promoting innovation. In general, a business model visualization tool improves understanding and helps to process complex data, information and experiences. The insertion of data and information in a visualization tool allows an immediate monitoring of results, ensuring that models are performing as intended [49,50,51,52,53]. CBMs are business models designed on the CE paradigm, characterized by a new approach to generate economic value and devise products and services, since they strive for: (i) employing fewer materials and resources for products and/or services; (ii) extending their life; and (iii) closing the loop with the recovery of waste value, maintaining and/or improving company’s competitiveness. These actions require a set of return flows that makes their visualization more complex [54]. However, due to the importance of the CBM visualization, some diagrams that explain CE and circular initiatives already exist [55,56,57,58,59]. They are appropriate to introduce and diffuse the CE concept. Moreover, some CBM decision-support tools have been proposed in literature to check the sustainability level of companies, compare linear and circular opportunities and make the transition towards CE easier, but the great effort required by these tools to be adopted in practice was also recognized [9]. Consequently, to effectively activate the natural next step, consisting of practical implementation, validation and consolidation of CE concepts and methodologies, a new strengthened CE business model diagram, which integrates the conceptual simplicity of the first mentioned diagrams [55,56,57,58,59] with the potential objectives of the second tools [9], could be necessary. The availability of a proper visualization tool for CE can be useful for a decision-making activity, above all when more organizational functions and stakeholders are involved [60].
In this paper, a new circular business model visualization tool is proposed, starting from the already available diagrams and analyzing their strengths and weaknesses. The main objective is to develop and provide an easy and intuitive tool, based on a graphical methodology, which had to be completed with systematized information, to take a snapshot of the actual situation and identify the further steps to shift to a new, enhanced and more sustainable business model based on CE concepts. The tool could be adapted to different industrial contexts and sizes (companies, supply chains, industrial sectors and areas, Countries) with the aim of measuring their actual situation, highlighting all the opportunities to be developed, identifying and evaluating the suitable solutions and estimating the output of their implementation. The tool aims to define and systematize the type and the format of information necessary to assess a circularity level. It means to ensure that all the initiatives and their impacts can be compared to each other.
The paper is structured in four sections. The last part of Section 1 introduces the most widespread CBM visualization tools and their features. Section 2 presents the research methodology that aims to define the characteristics of a new CBM visualization tool able to boost the implementation of circular economy. Section 3 presents the results, which consists of the descriptive construction of the new proposed CBM visualization tool, and the discussion about the main results. Section 4 describes the main conclusions, recapping the use of the new tool to identify and measure unexplored circular initiatives.

1.1. Background: Review of CBM Visualization Tools

Research on CBM has rapidly grown in the last years and provides methodological support for guiding CBM innovation. However, no systematization of the methodological support is available. To systematize the state-of-the-art about available approaches supporting CBM implementation, some researchers have collected and classified several studies in literature, containing conceptual frameworks, methods, tools, best practices, and challenges related to CBMs [9,54].
In this paper, the attention is focused on tools for CBM innovation, and particularly on visualization tools. To support the increasing attention to business models, researchers and practitioners have developed visualization tools as a method to explain underlying knowledge or to design, innovate, build and analyze a business model. Visualizing how one element influences the other in a business model means to turn hidden relationships into explicit opportunities, which are clearer to discuss. Different categories of visualization tools exist and combine different elements such as color, position, texture, form, pictures and diagrams [51,61,62]. Visualization tools for CBMs are the most applied instruments in the phase of design and test of CBM concepts and initiatives, since they are instruments able to fit with collaborative requirements of CE, ensuring a proper visualization and consideration of numerous stakeholders beyond the firm-centric view. Due to their functions, CBM visualization tools are often used by practitioners to understand, explore and communicate. For this reason, grey literature, produced by consultants, experts and sectorial consortiums, is incorporated in the state-of-the art. Within the traditional scientific publications, Pieroni et al. [54] have classified tools focused on visualization of CBM concepts in nine categories and Rosa et al. [9] have identified four types of decision-support tools. These studies are the references to collect the existing CBM visualization tools, which will be the basis to design the new one.
The proposed new CBM visualization tool has two main objectives: (i) an immediate communication about the CE concepts and (ii) being a decision-support instruments for checking the actual circularity level of companies, identifying new circular opportunities and make the transition towards CE easier. To ensure the first objective, the representation in diagram, with icons and arrows, is taken as reference. For the second objective, since CE is networked by nature, to exploit its maximum potential, the new tool strives to consider and represent all the actors in the supply chain. The state-of-the-art about CBM visualization tools does not consider instruments based on canvas format, which, in some cases, was adapted to the topic to help the company in creating specific value propositions better suited for circular economy, since they innovate the application of an existing and consolidated visual tool (the Business Model Canvas), but not the tool itself [63].
In this section, the CBM visualization tools, which are in line with the two features responding to the paper objectives, are analyzed to highlight their characteristics. From the analysis of the literature (grey and peer-reviewed), five CBM visualization tools are considered and listed in order of diffusion, from the most widespread to the lesser ones. The survey can be considered exhaustive, since the numerous versions of CE visualization tools available in the literature typically derive from the selected ones. For example, tools developed in [64,65,66,67,68] derive from the Ellen MacArthur Foundation diagram and tolls in [69,70,71] are similar to Accenture tool. In [72], authors use a framework derived from Accenture model and explain the networks with a diagram that has the same visual elements of Reike’s model, such as in [73,74].

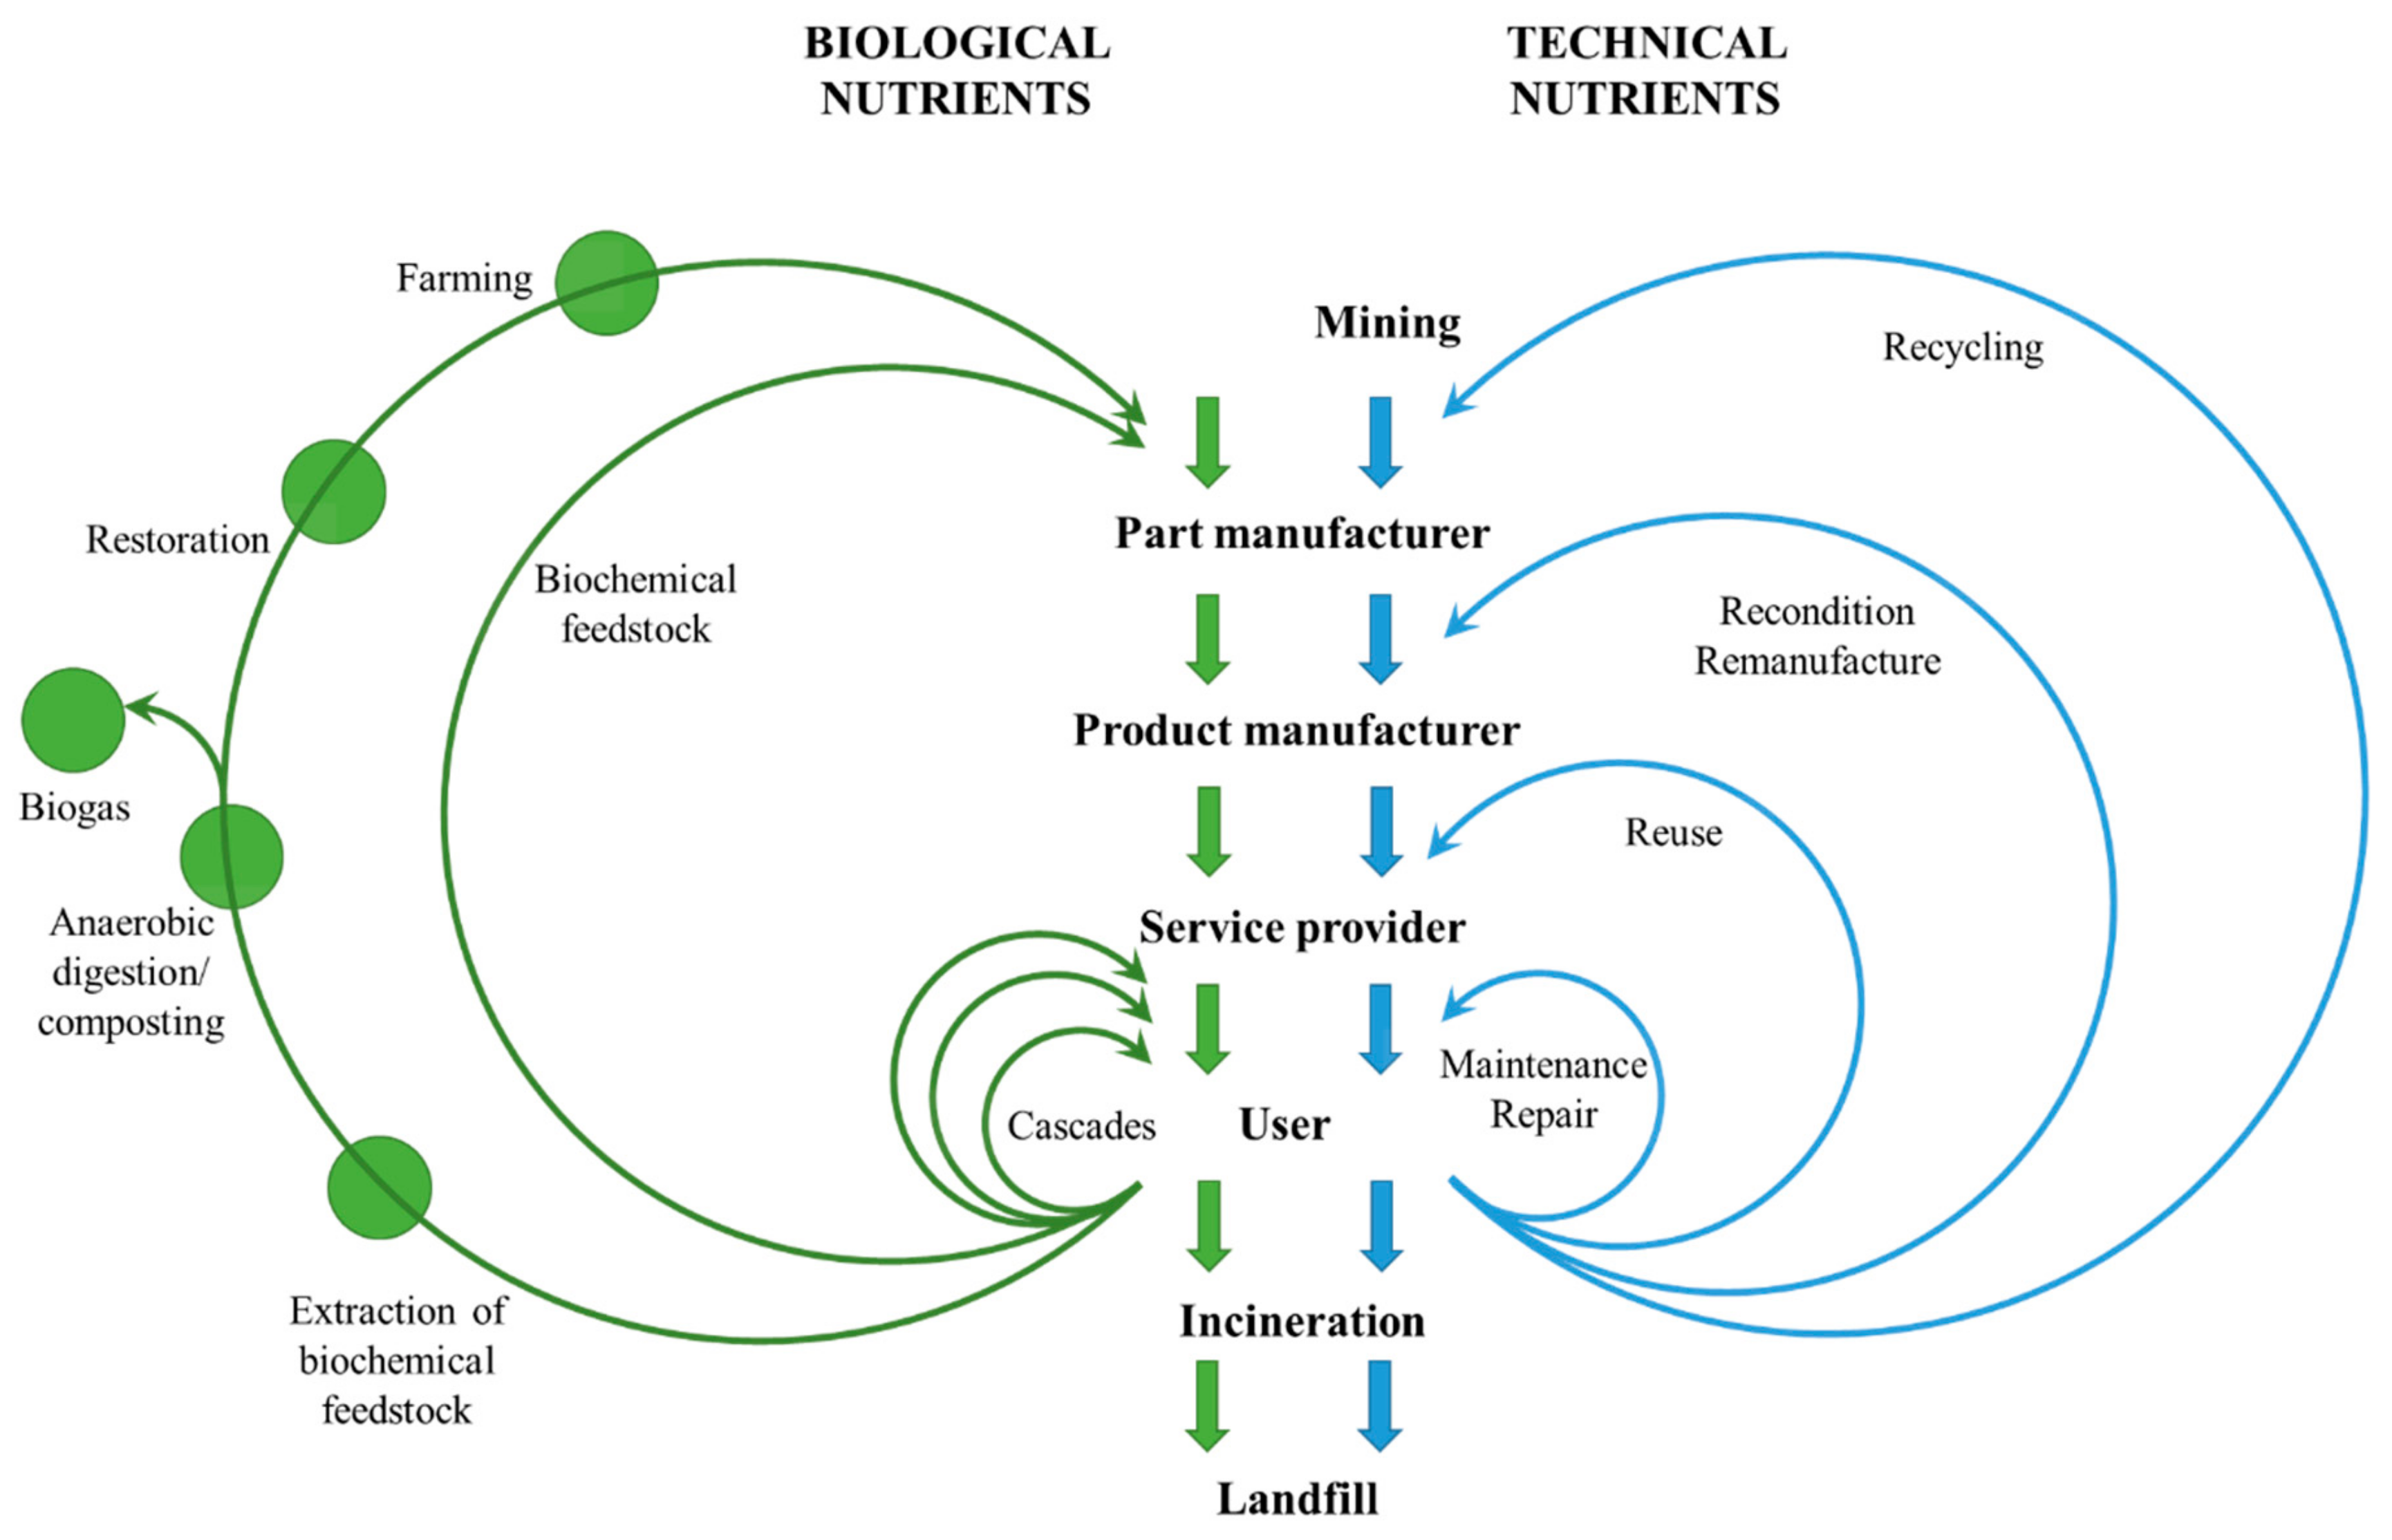
1.1.1. Ellen MacArthur Foundation Model

The most famous and widespread CBM archetype is the Ellen MacArthur Foundation (EMA Foundation) diagram, shown in Figure 1 [55]. This model is characterized by the division between biological and technical materials, which, with their cycles, provide the scheme with a particular shape, also called “CE butterfly diagram”. In particular, according to this model, the circular economy concept is based on natural principles: it takes insights from living systems, characterized by adaptability and resilience, and follows the cascading of materials. Table 2 summarizes the fundamental principles of the EMA Foundation model.
The fundamental principles are the basis for four sources of value creation (called ‘power’). According to the power of the inner circle, “the closer the system gets to direct reuse (e.g., the perpetuation of its original purpose), the larger the cost savings should be in terms of material, labor, energy…” [55]. The second value creation source is based on the power of circling longer: it is necessary to guarantee by design a greater durability to extend the lifecycle of the product or to enable more consecutive cycles. The source called power of cascaded use across industries involves the use of by-products (discarded materials) as new resources, which replace raw materials for other applications. Finally, there is the power of pure, non-toxic, or at least easier to separate inputs and designs to anticipate some end-of-life strategies from the material choice.

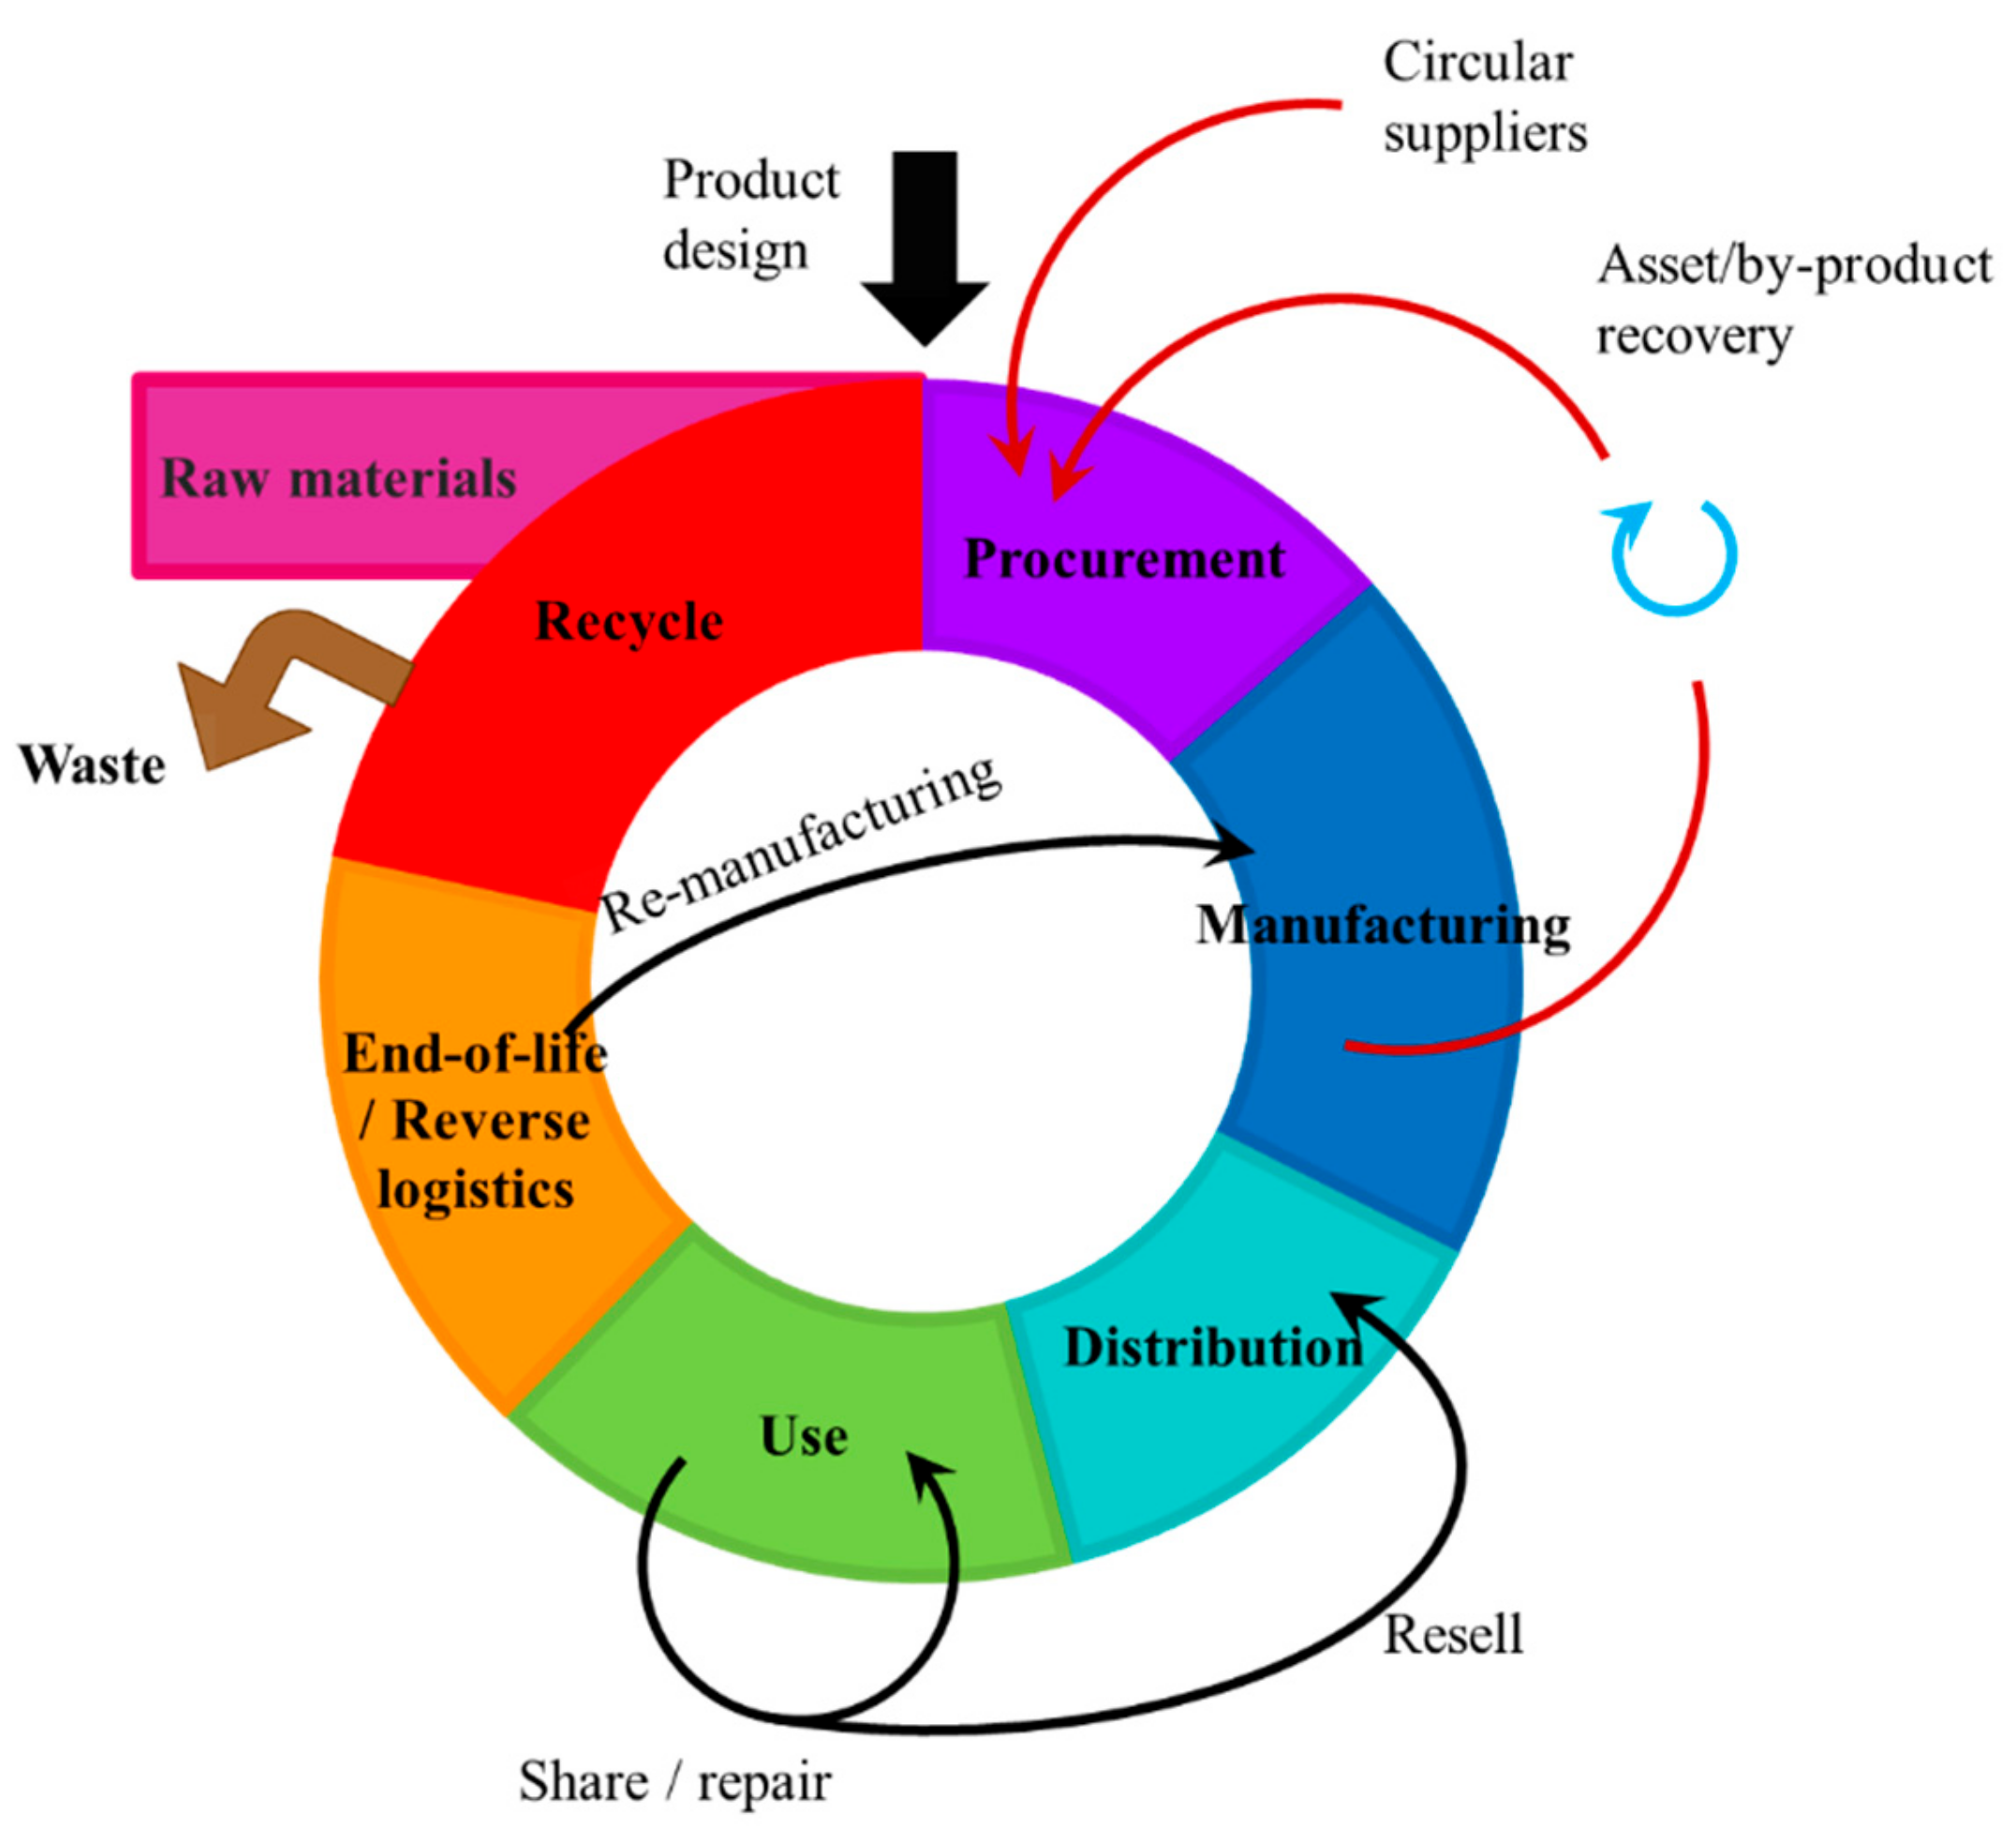
1.1.2. Accenture Model

The second model, considered as a reference, is the one used by the consulting Company Accenture [56]. The main idea of this diagram is to provide a fully circular visualization of the product life-cycle, as shown in Figure 2. The structure of this model is widely used and reworked in the literature to explain and diffuse the big concept of circular economy. The framework of this model is orientated to product design—to decrease the raw material inlet and product end-of-life—to recover resources and decrease waste [75].
Compared to other diagrams that use the same structure, in the Accenture model, the CE implementation is supported by five business models with distinct characteristics, which can be used singly or in a combined way. These underlying business models are explained in Table 3.

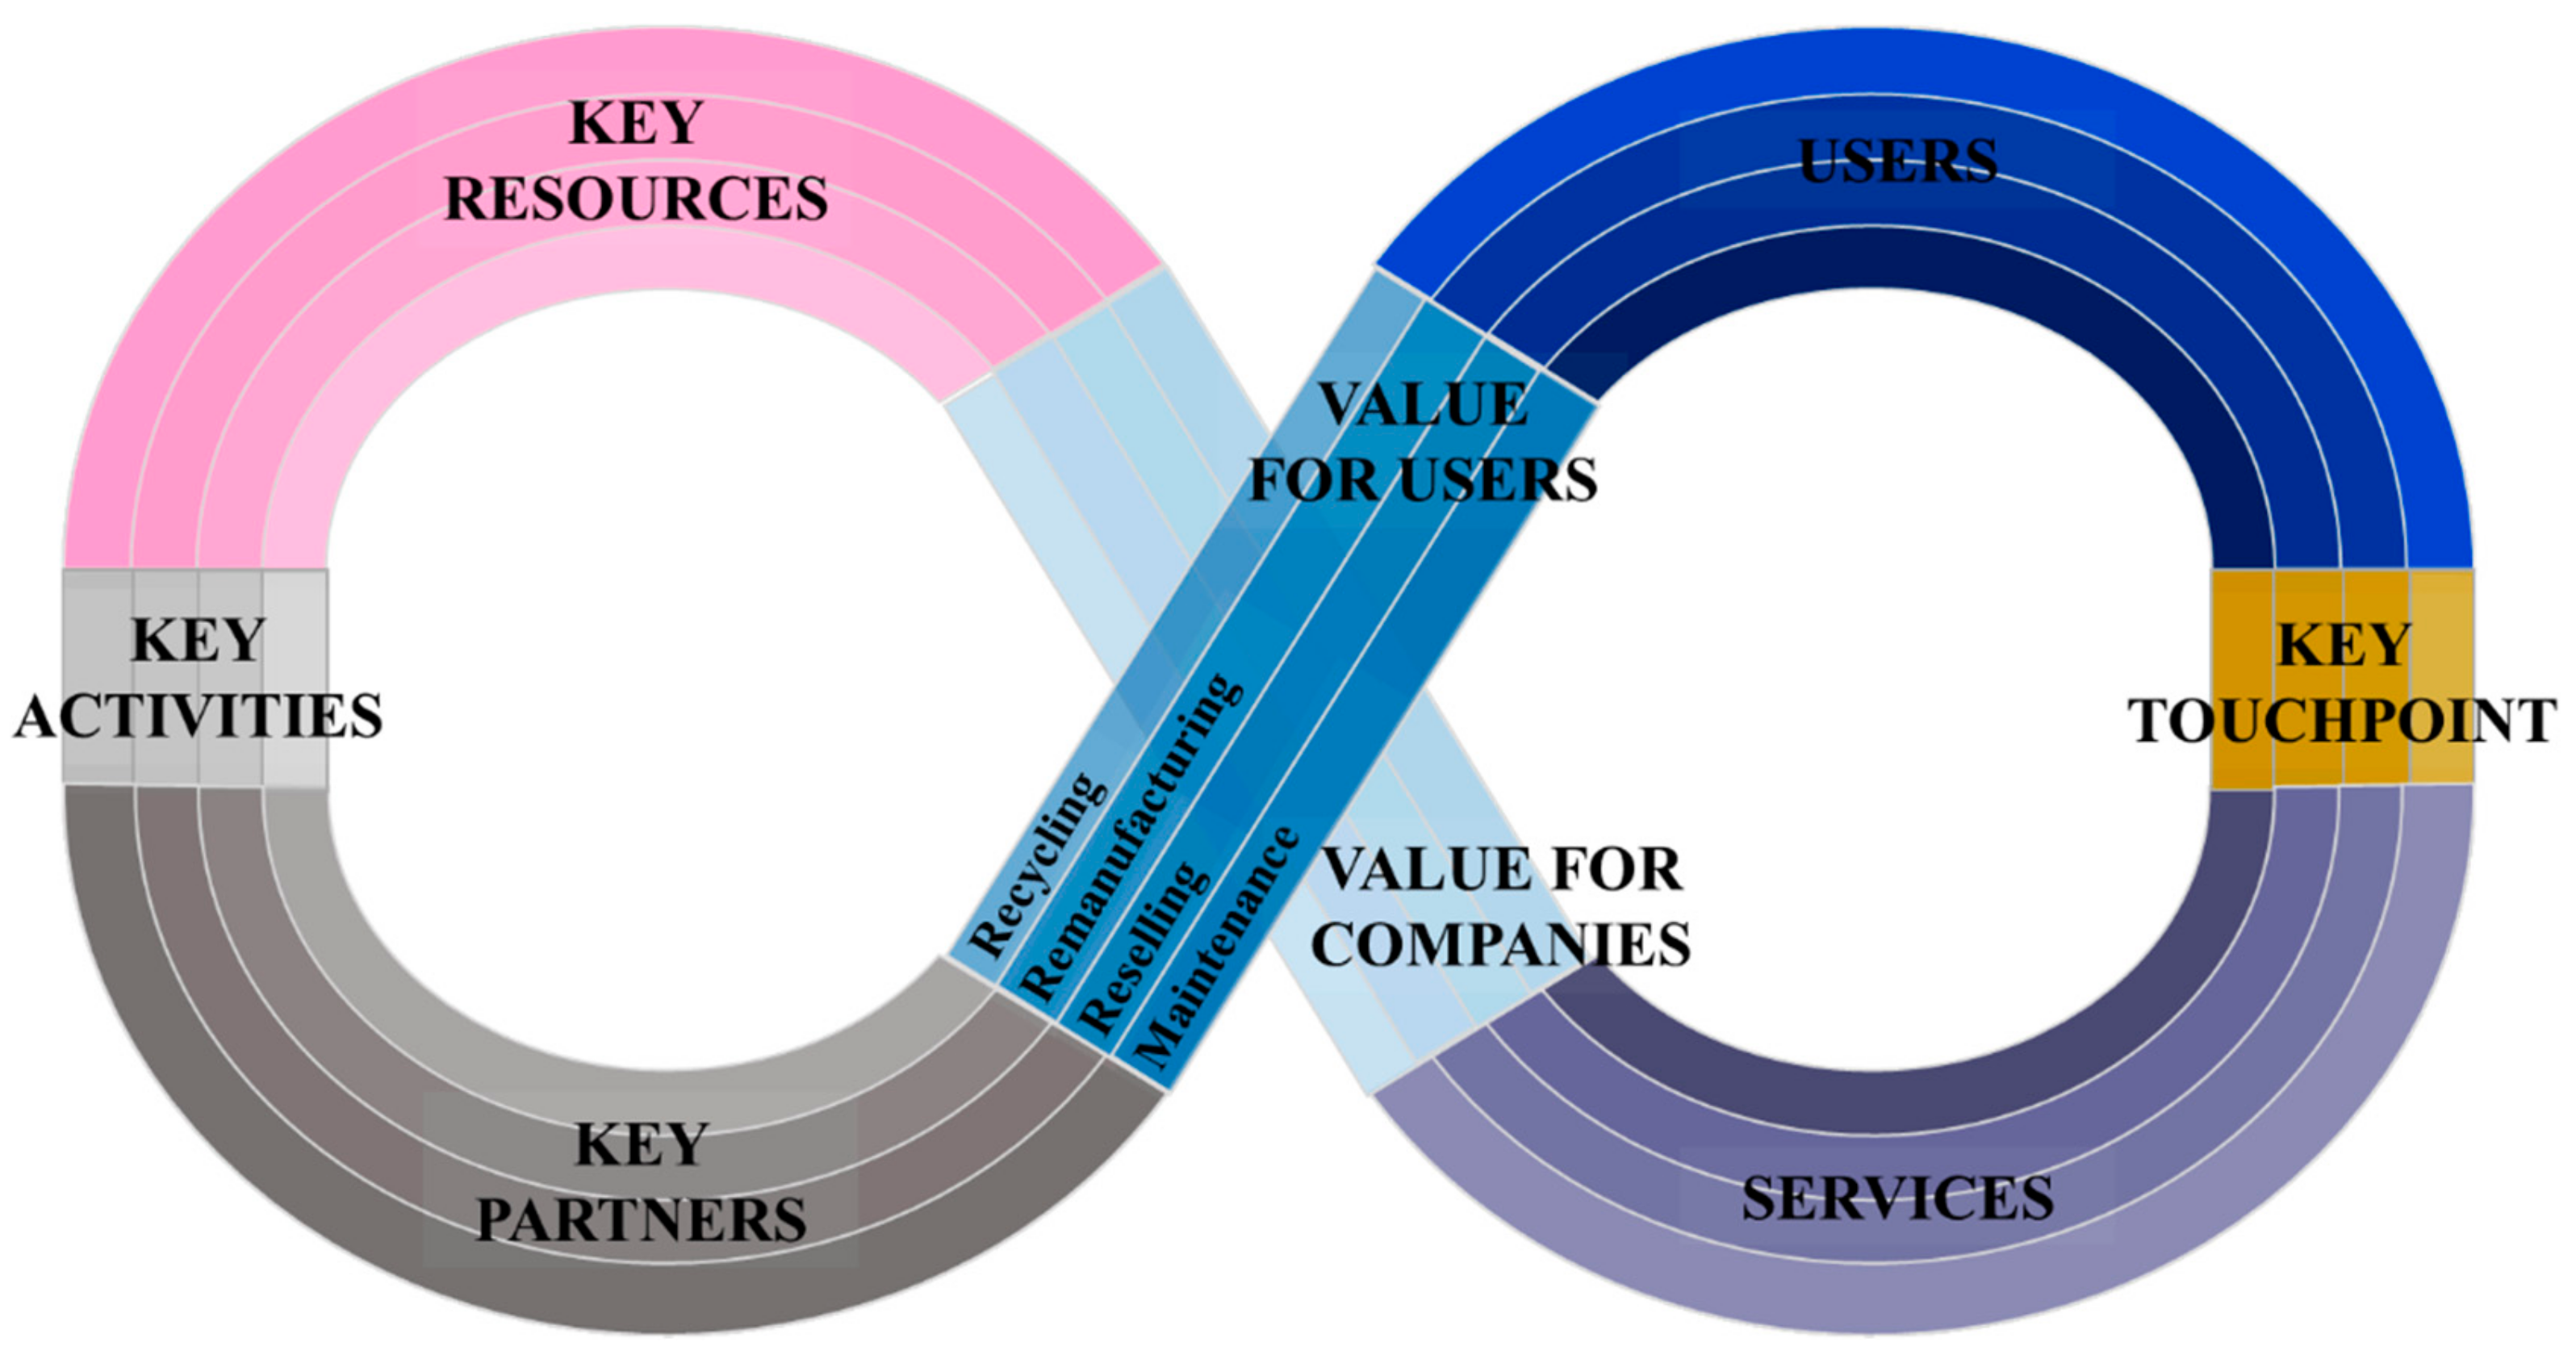
1.1.3. MoonFish Model

The third available CE diagram was developed by MoonFish, a result of the TU Delft master course ‘Strategic Value of Design’. It is based on the concept that CE aims to create an economic model in which waste does not exist [57]. In the MoonFish concept, CE implementation requires two main activities: a design and an optimization of products that must be easily repaired, disassembled and reused, and a strong relationship between companies and users. The aim is to construct cycles able to return the intrinsic value of products back to the company. According to the EMA Foundation, shorter and inner cycles involve fewer efforts and offer more potential for saving materials, labor and energy. Creating a network of collaborations, the partners enter into the process to ensure the implementation of these cycles. In particular, MoonFish defined four types of cycle, as shown in Table 4. The benefits of the model are: for the users, the availability of products characterized by an improved longevity and lower maintenance costs; for the companies, an improvement in margin and cost-competitiveness, creating sustainable values for their future.
The basic concept of this model derives from the elaboration of the EMA Foundation diagram, but the framework is completely different. In fact, to emphasize the ongoing process of circular business, which never ends, the MoonFish CE diagram is characterized by the structure of the infinity symbol (shown in Figure 3). Moreover, the diagram is structured as a Business Model Canvas, since it can be used to map the different partners and components that are involved in the business and then to identify opportunities for the future [76].

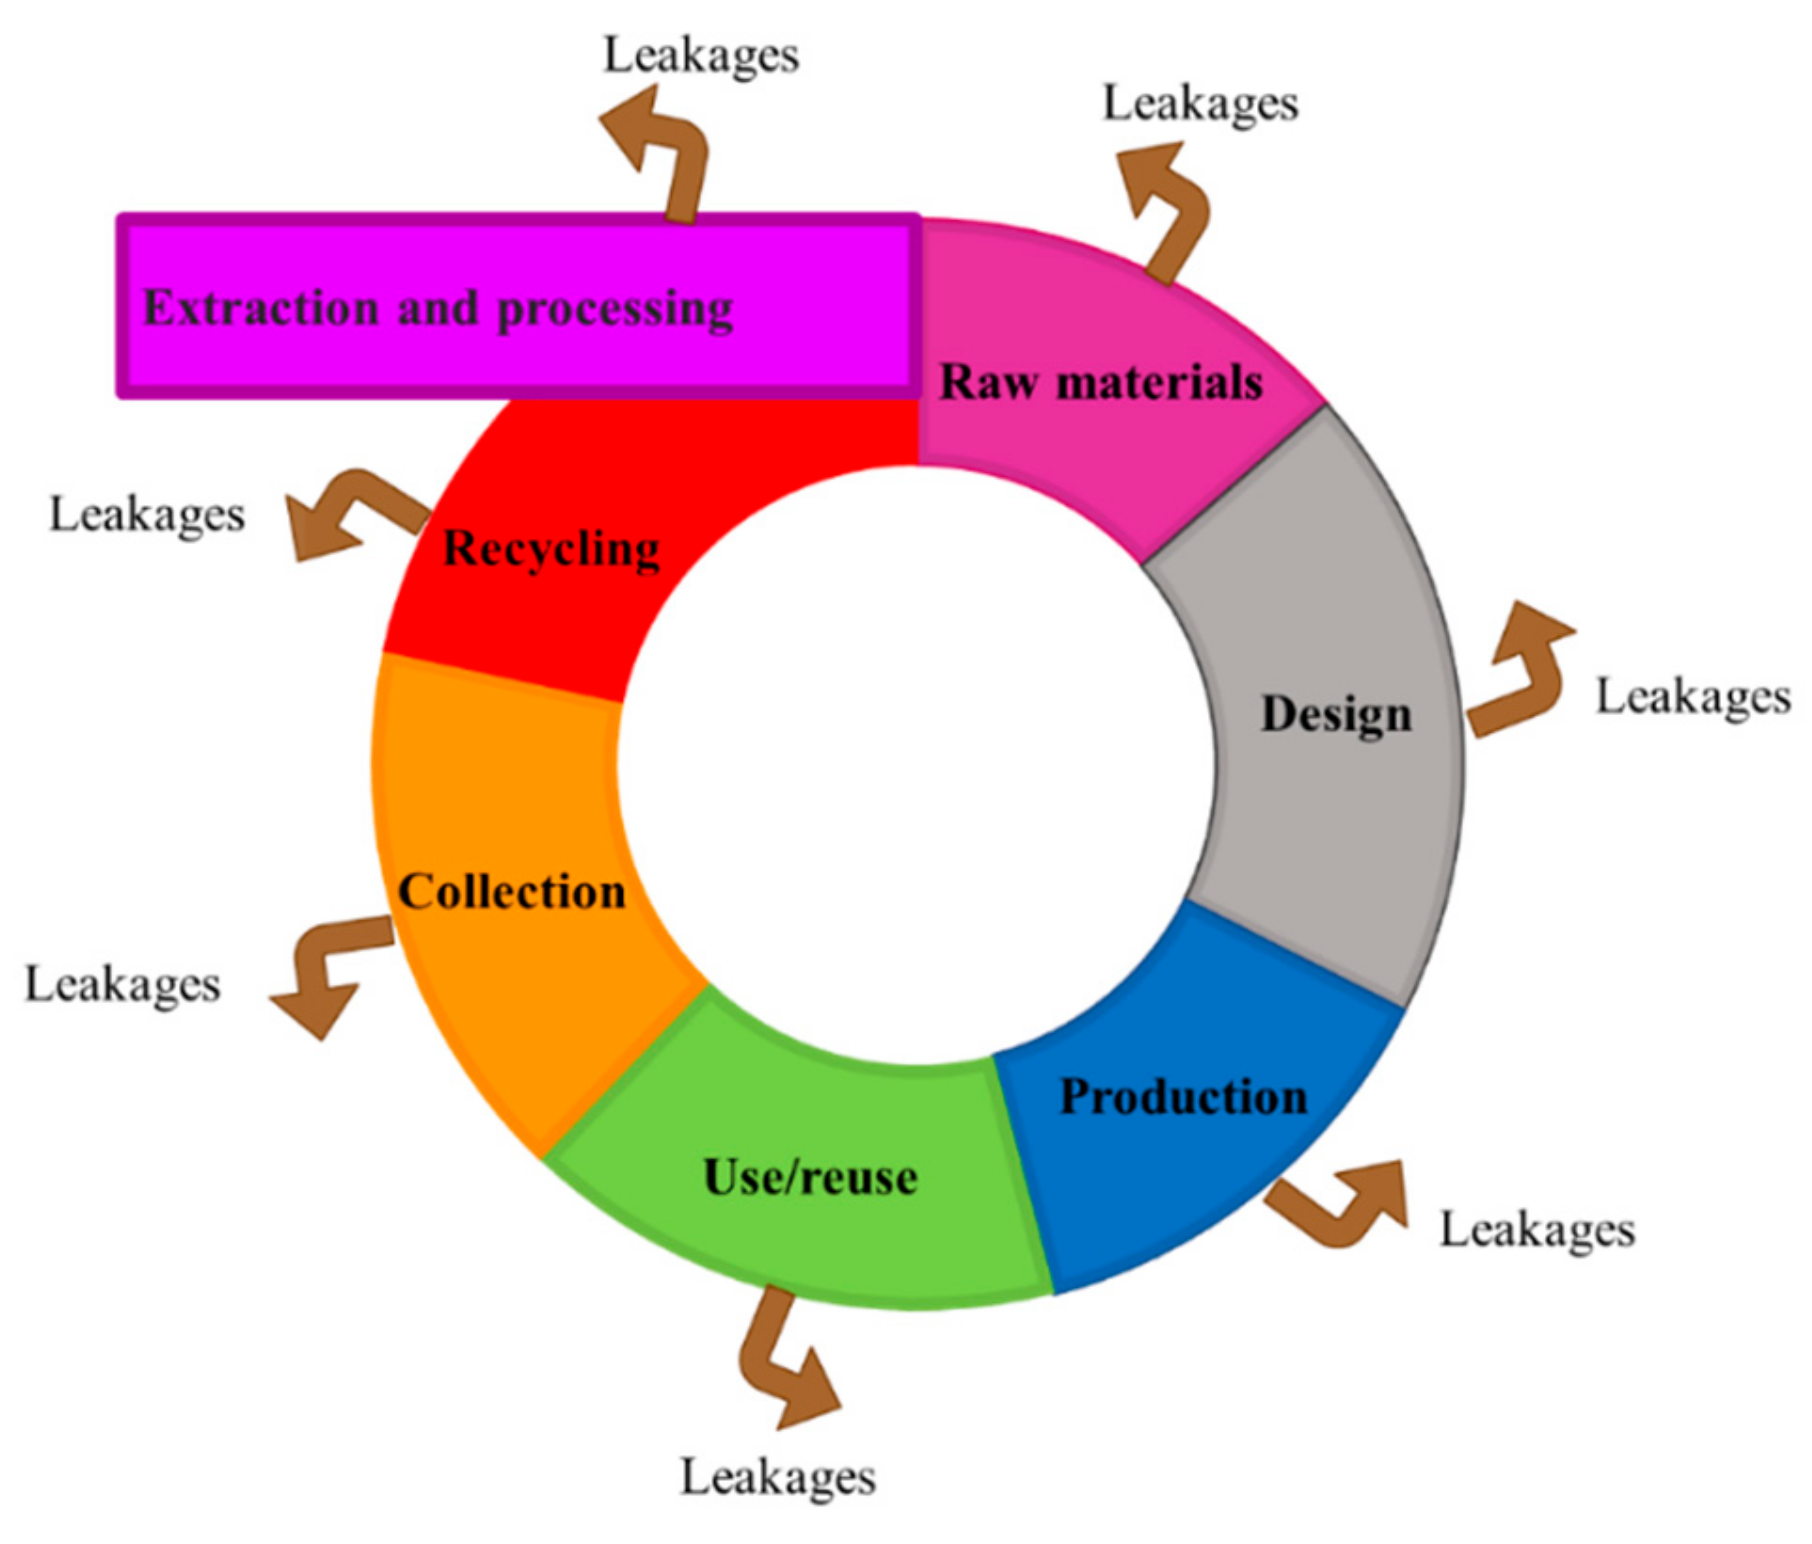
1.1.4. EIT Raw Materials Model
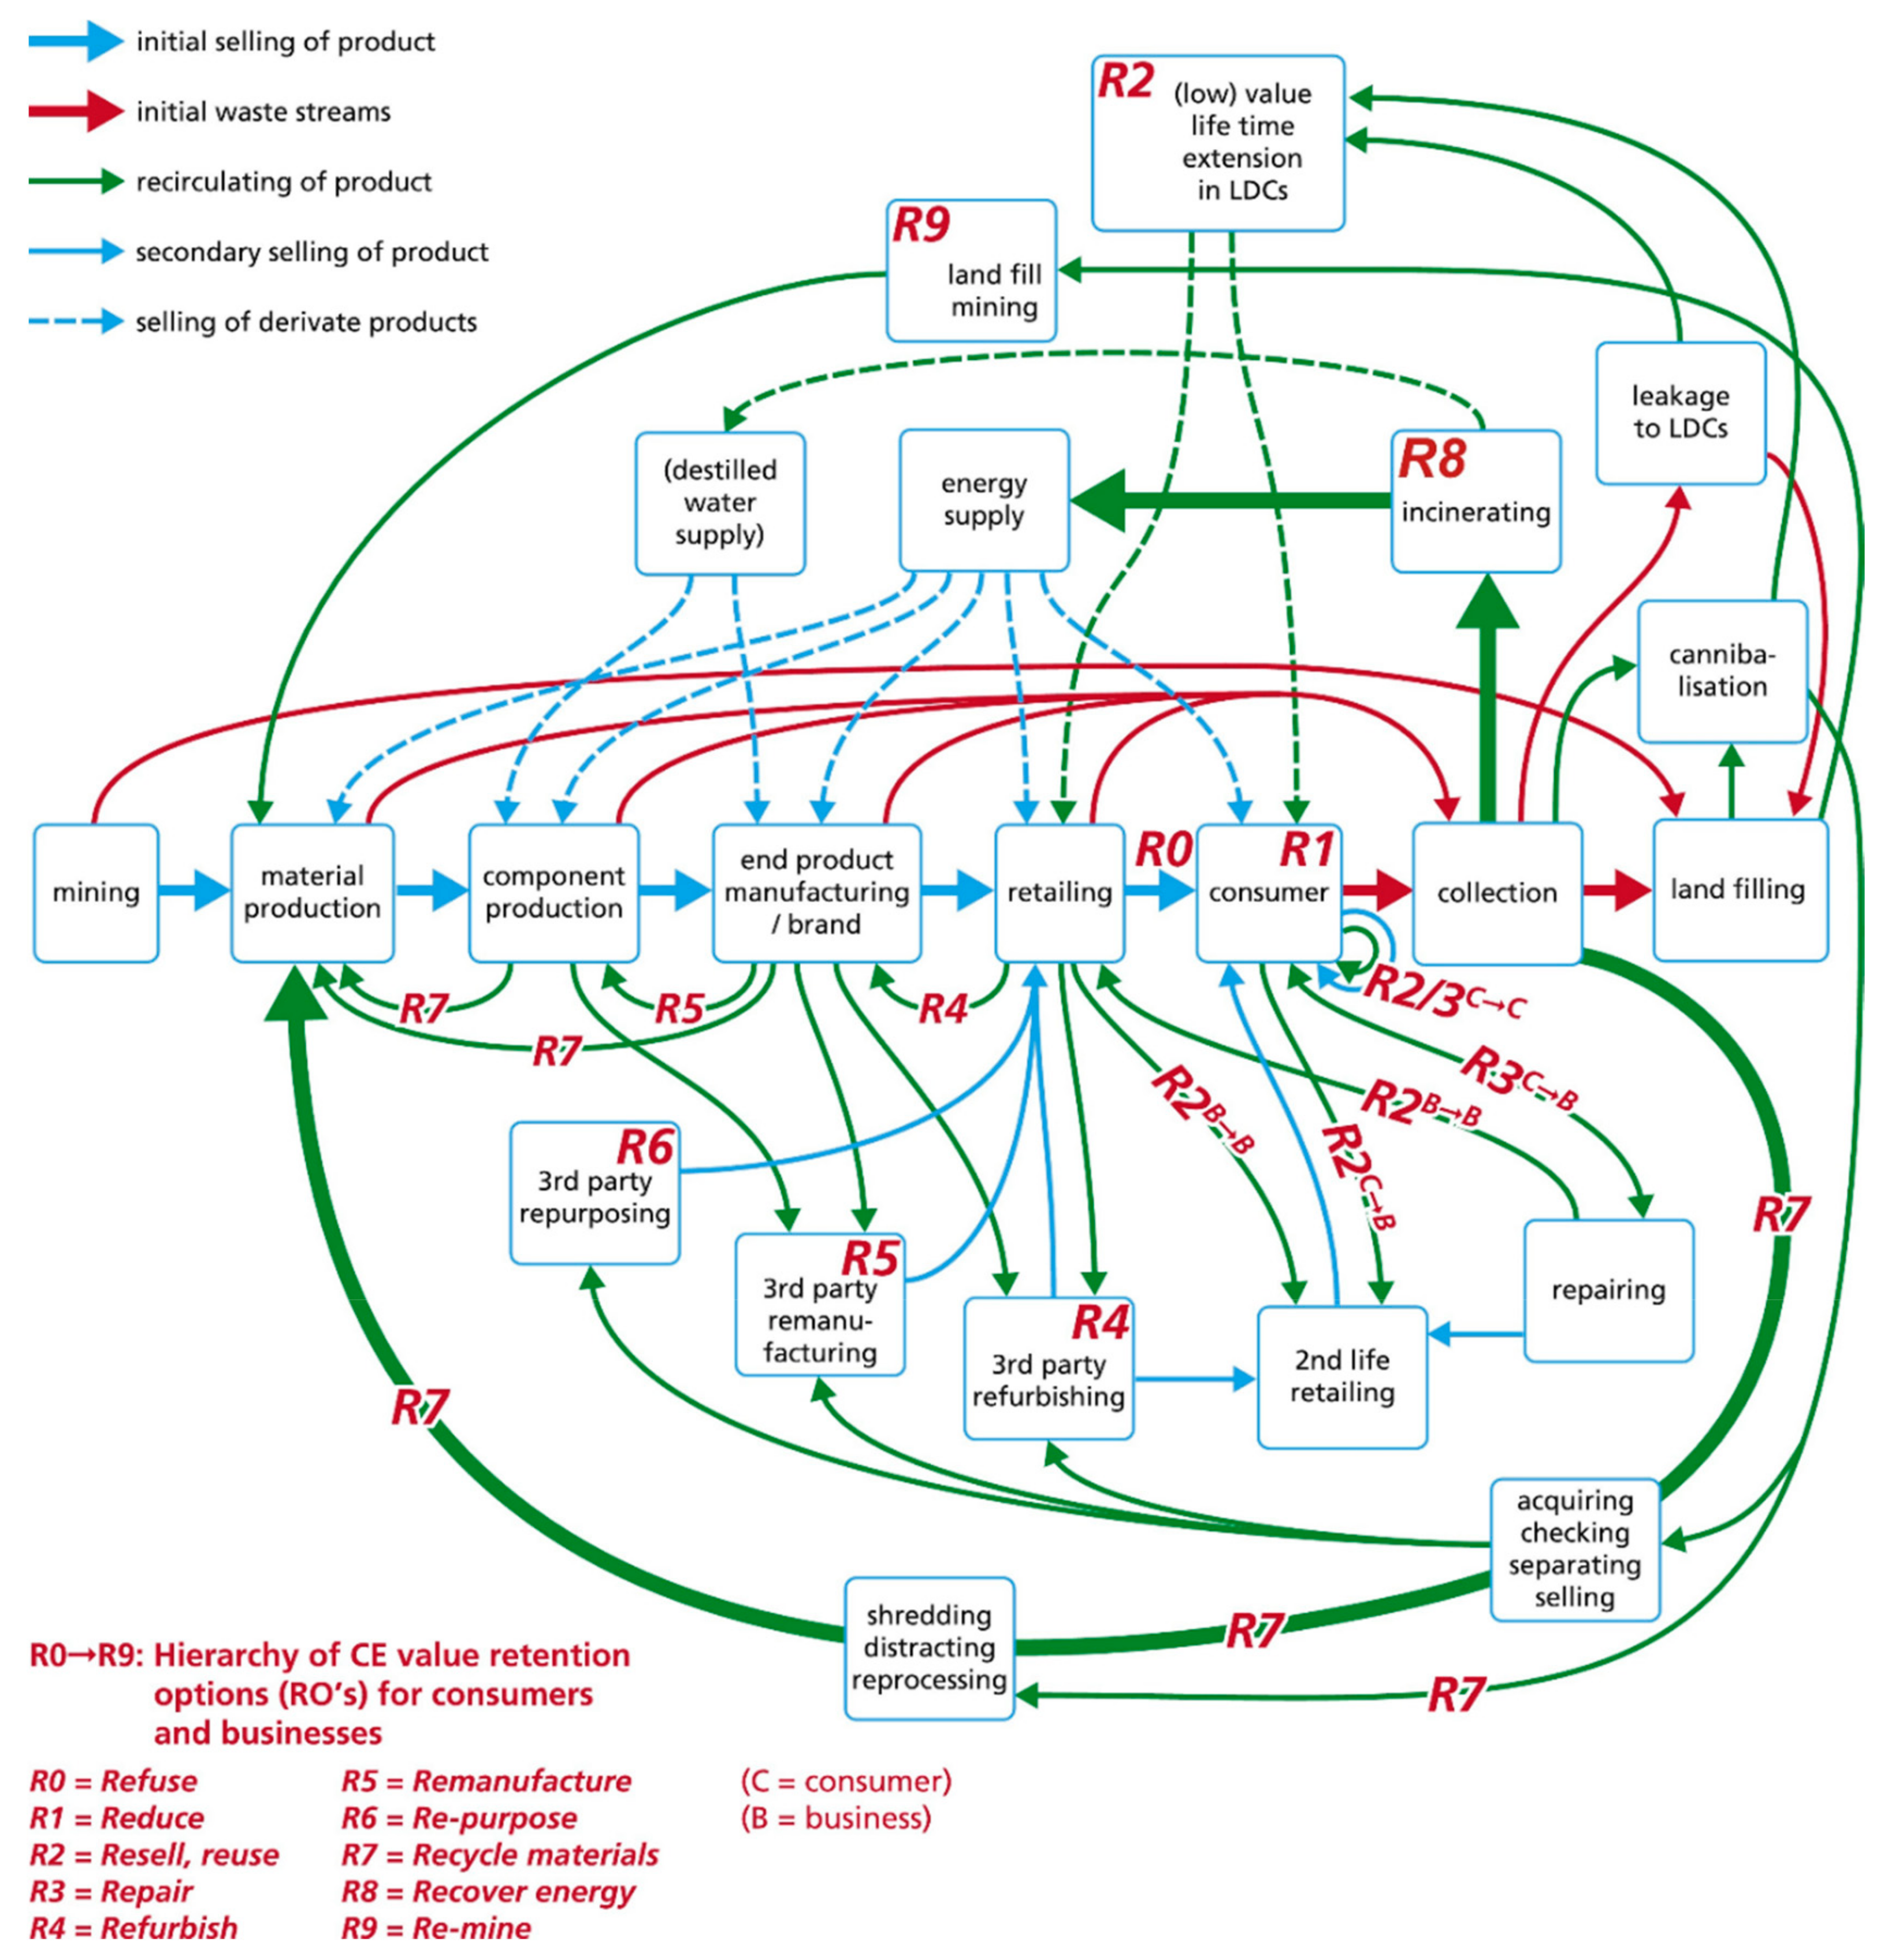
The fourth diagram is used by EIT Raw Materials as a figure that represents the challenge to close the material loops (Figure 4) [58]. The general framework of the diagram is similar to the one proposed by the Company Accenture, since the main concept to express is the toned for a radical shift to circular thinking, where products at the end-of-life must be considered as resources for new cycles. The diagram was selected for the analysis because, compared to the previously described models, it is the diagram that considers the presence of waste in each stage of the supply chain.

1.1.5. Reike Model

The last model analyzed derives from a scientific publication [59]. Reike’s work aims to provide clarity about the circular economy and the efforts to achieve a more sustainable model with a special focus on practical implementation. The model recognizes 10 resource value retention options (ROs): some of these have already been applied, such as energy recovery and recycling, while others are partially unexplored (remanufacturing, refurbishing, and repurposing). This model was inserted in the review of CBM archetypes since it demonstrates the complexity of the circular economy implementation in the real situation and ‘how far we are’ from circularity. Figure 5 shows the CBM structure provided by Reike.

2. Materials and Methods

When one or more new or existing business models are evaluated and compared, practitioners (e.g., design entrepreneurs, managers, R&D personnel…) must be able to fully visualize, analyze and estimate all the elements and requirements, to have an overview on the main benefits and risks of a potential innovation. Due to the complex and numerous elements required in a CE (knowledge, expertise, technologies, internal and external relationships…), it is difficult to standardize the CBM evaluation process. Consequently, it is difficult for practitioners to explore, replicate or improve circular initiatives since they cannot collect comparable elements to evaluate benefits and risks in different scenarios. Starting from the need to evaluate and compare innovation focused on CE, the overall objective of this paper is the definition of a new CBM visualization tool, able to provide a standardization of the elements to be evaluated to overcome the main barriers of CE and boost its practical implementation. The methodology used for this purpose consists of four main phases, which aim to provide a practical response to the described need, integrating literature research in relation to different questions.
(i)
Definition of the characteristics, selected by literature, which are seen by the authors as fundamental for a CBM visualization tool. This phase responds to the question Q1: what are the fundamental elements that must be visualized in a tool for CBM evaluation?
(ii)
Gap analysis on the CBM visualization tool available in the literature. This phase responds to the question Q2: what are the existing tools that fits these characteristics and what are the missing aspects?
(iii)
Definition of tools and methods to be inserted to overcome the main drawbacks of the current models. This phase responds to the question Q3: are there methods, techniques, and tools that can be used and integrated to cover previous gaps?
(iv)
Qualitative application of the new CBM visualization tool to the supply chain of a generic ‘technical’ product. This phase finally provides all the information to use the developed tool.
Figure 6 shows a qualitative flowchart of the methodological approach used for the development of the new CBM visualization tool.

2.1. Fundamental Characteristics of a CBM Visualization Tool

The conceptual development of the new CBM visualization tool began with a review of the literature, which resulted in the identification of a key set of features to be necessarily fulfilled. To provide a complete visualization of all the operation involved in business, the consolidated and widespread Business Model Canvas (BMC) was the reference. In fact, in BMC, each building block describes the most important factors to be considered during the development of a new business model. Taking into consideration the building blocks of BMC, which are general but fundamental, other specific aspects have been analyzed to be applied on a strengthened visualization tool developed for business models based on Circular Economy. In particular, literature research has been conducted, focusing on the following aspects. (i) Understandability, replication of reality and versatility are fundamental features to respond the scopes and represent the elements of a generic visualization tool [51,62,77,78]. Moving into specific details of CBM topics, there are two main gaps that the new tool could address. (ii) The first is derived by the great diffusion of CE concepts in literature, defined with a myriad of words and terms [59,79,80]. Consequently, a feature in the tool should provide a visual framework that aims to fix all these concepts and definitions regarding CE and to standardize the evaluation process to shift to circular business models. (iii) The second gap, identified by literature, is the necessity to quantify and measure circular initiatives [81,82,83,84,85,86], as mentioned in Section 1.
After this analysis, there are six main characteristics that are seen by the authors as fundamental for a CBM visualization tool, to make it able to facilitate an effective implementation of circular initiatives in practice, and these are explained in the following sections.

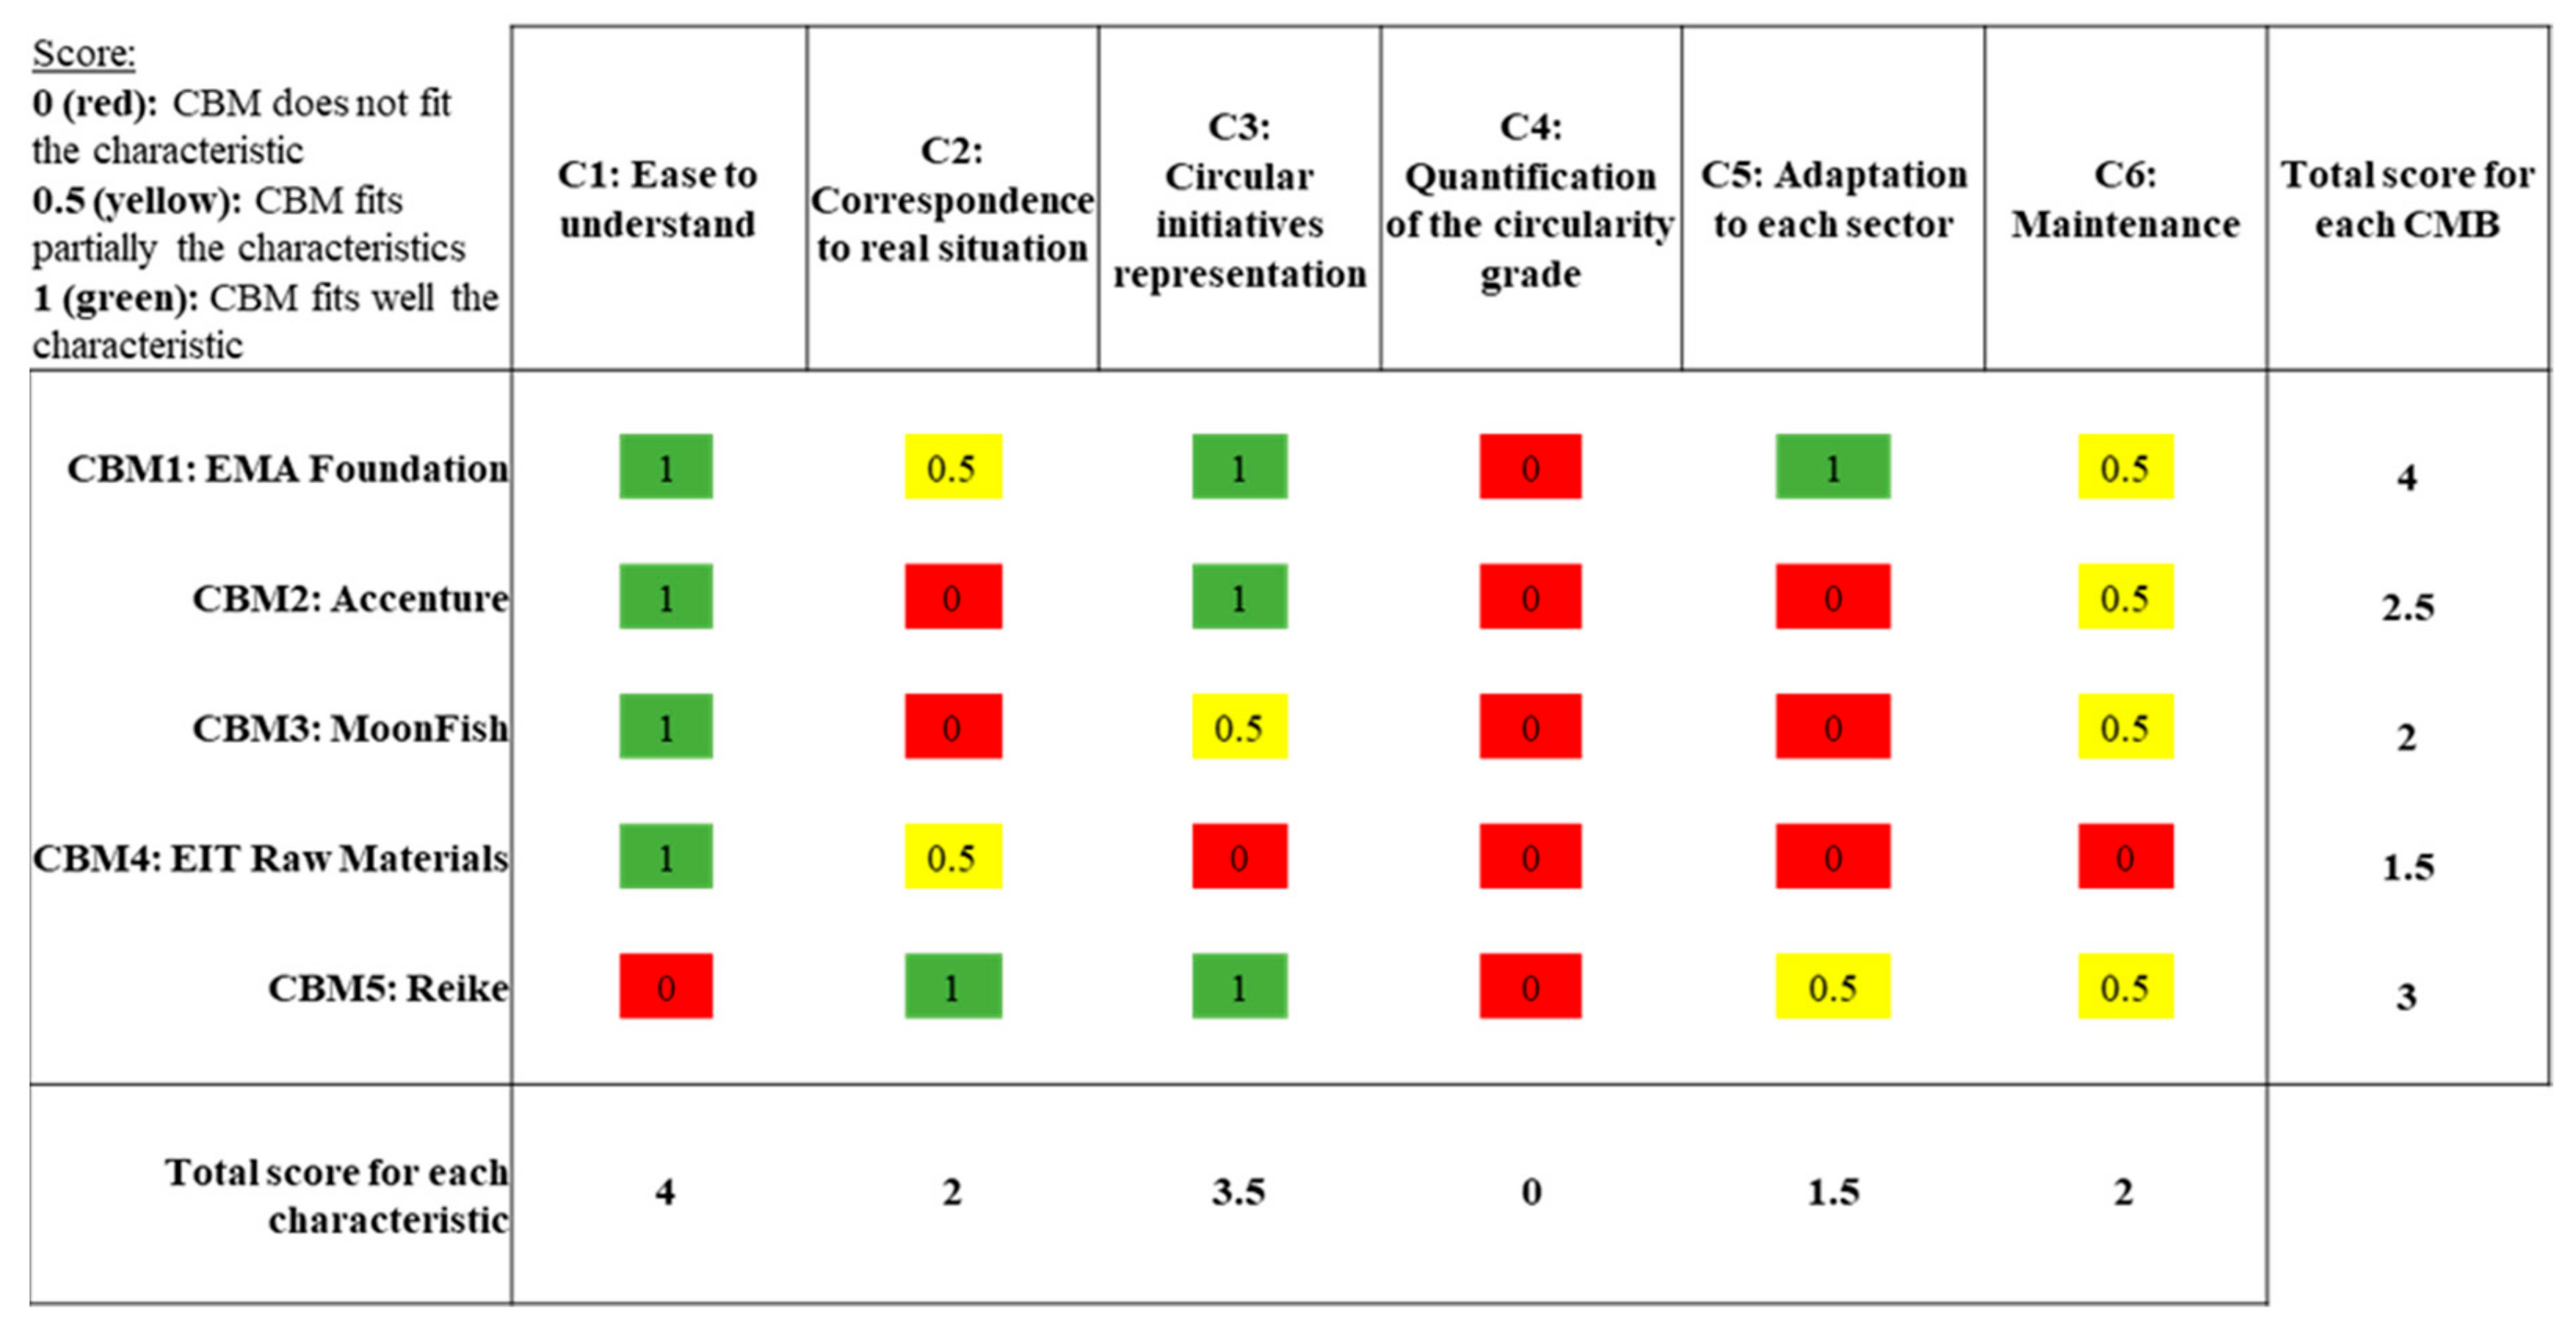
2.1.1. C1: Ease of Understanding

One of the main characteristics that a CBM visualization tool should have is ease of understanding. A business model includes details about business inputs, dependencies, target consumers and value proposition, and creation. The number of activities, partners and interdependencies in a company portfolio determines the complexity of the business [87]. In circular and sustainable BMs, the complexity can be greater since the boundaries of circular initiatives are large and not so clear (think of relationships in a sharing economy) [88]. A CBM visualization tool must integrate the complex concepts of a business model and ‘translate’ them into a graphical structure, making the BM more concrete and providing a practical perspective about the relationships between the elements [89]. Therefore, the ease of understanding for a CBM visualization tool means a clear and intuitive structure and simple identification of the BM concepts, functions and elements. This characteristic is also pursued by the structure of BMC, where building blocks, in an ordered form, can be easily recognized by the user, encouraging a nonlinear and interactive thinking practice.
In the Reike model, the high number of involvement elements and the complex connections between each stage of a product life-cycle are highlighted at the cost of losing simplicity of understanding. Consequently, for the viewer—who could be a BM strategist—understanding where his company is located in the scheme is not immediate. Moreover, the identification of the patterns could not be possible with just the model and without an analytic description. Surely, for the other CBM visualization tools considered in this paper, the broad concepts of CE and circular opportunities are clear at a glance.

2.1.2. C2: Correspondence to Real Situations

To effectively be intuitive and clear, the CBM visualization tool has to correspond to the real situation, without losing its simplicity. This means that the graphical visualization must be consistent with the phenomenon that it represents. This characteristic overcomes the traditional approach, visible also in the most widespread CBM archetypes, which tends to express only the concepts at the basis of the Circular Economy. An accurate representation of the operational context is especially useful to identify potential barriers and inefficiencies, while the visualization of CE concepts could cover limitations for the implementation of a certain circular initiatives or overestimate its benefits [90,91]. Consequently, adding this further step in a CBM diagram anticipates the identification of three building blocks in BMC, which are key activities, key partners and key resources.
In the first three analyzed models (EMA Foundation, Accenture and MoonFish), the situation represented by the model is different to the reality. Their limitation is related to the typical approach of the existing CBM archetypes that are mainly focused on the product. In fact, all the defined CE strategies (e.g., recycling, refurbishment, sharing) start from the end-of-life of a product, after the use phase, when it has already become waste. The result is the visualization of a model that does not correspond to the real situation of the actual production and consumption systems. In fact, it is not realistic to consider that the entire quantity of resources that enter into the cycle (in the mining/material manufacturing stage) reach the end user (in other forms), since each stage of the circular model (e.g., production and distribution) involves resource inlet, product outlet and leakages (waste/wastage), derived from the transformation process [92]. These leakages, similarly to products at the end of their life, are not completely reused, recovered or recycled, but are often disposed of as waste. These concepts are well evident in the EIT Raw Materials and Reike’s models that are closer to the actual economic context. Moreover, the first models do not consider that the CE does not involve only the transformation of waste into new resources, but also the opportunity to prevent the creation of leakages. It really means reducing the raw material flow and the energy inlet in the production processes, through the increased capacity to recover wastages along the entire value chain.

2.1.3. C3: Useful Representation of Circular Initiatives

A CBM visualization tool has to contain all the opportunities to shift to an effective circular economy and close the loop of resources (included energy). Companies must be able to promptly recognize new business development solutions and compare strengths and weaknesses to their actual business models [89,93]. These opportunities are the ‘principles’ in the EMA Foundation models, the ‘underlying business models’ in the Accenture archetype and the ‘value retention options’ in Reike’s one. In the MoonFish diagram, some circular initiatives are possible only between two consecutive stages. In the EIT Raw Materials model, circular strategies are not represented. The insertion of these potential circular strategies allows the viewer to evaluate new or not previously considered connections with other stages in his or other supply chains. It means that, in a BMC, the insertion of this feature addresses the selection of channels and customer(/supplier) relationships with the aim to close the loop.
The best opportunity is characterized by minimum efforts (in terms of resources, costs, time and labor), minimum negative impact and significant positive value. These outputs should not refer only to the company, but should be extended to a network of stakeholders, considering also the environmental and the social aspects [37,94].

2.1.4. C4: Quantification of the Circularity Grade of the Initiatives

For a practical implementation of characteristic C3, a further fundamental feature that a CBM visualization must have is the possibility to quantify the circularity grade of the initiatives. It is the second main limitation of the existing CBM visualization tools: the missing opportunity to quantify, measure and hence compare circular initiatives surely limits the possibility to identify new ideas and implement circular activities. Companies usually employ a great number of indicators and tools for the measurement of their operations, since the collected information helps in the decision-making. To cover this aspect, several initiatives on national and international levels have recently focused on the definition of KPIs (Key Performance Indicators) to efficiently estimate the transition from a linear to a circular economy, basing the evaluation on the products or on the companies [95,96,97]. Eurostat, OCSE, Granta, and EMA Foundation are only a few studies that have the objective of measuring circularity. Nevertheless, to date, the estimation of circular initiatives through indicators has not been inserted in the CBM archetype [98,99]. To evaluate these KPIs, the quantification of resource flows for each phase of the product life-cycle is necessary and must be inserted in the CBM archetypes. Adding this characteristic in the tool allows for addressing important building blocks in the BMC that are revenue streams and cost structure.
The evaluation of the circularity grade of the initiatives, through resource flow quantification and indicator calculation, allows the advance estimation of benefits and the identification of the possible technological and non-technological barriers. With this information, companies are able to evaluate the risk of any investment in sustainable innovation and consider suitable solutions for the application of circular strategies.

2.1.5. C5: Adaptation of the Model to Every Product and Industrial Sector

Another fundamental feature for CBM visualization tool is the possibility to be easily adapted to every product and industrial sector. In this way, the model can be used to develop innovative CBMs without limitations in value proposition and customer segment, as in the case of BMC. The requirement of being able to adapt to all products and sectors is a novelty for CE diagrams. The CBM archetypes proposed by Accenture, MoonFish and EIT Raw Materials cannot represent for example bio-based products, since they cannot be reintroduced in the same circle at the end of their life, but only disposal might be possible. Only the EMA Foundation model considers the difference between the pathways of biological and technical materials, but this clear distinction does not accurately reflect the real situation. In fact, biological and technical materials can be linked in some points of the value chain—for example, for bio-based product transport and storage. Moreover, the distinction between the two material typologies is not always strictly defined: for example, biomaterials can be transformed into polymers that are not biodegradable and require the same management as a technical product [100,101].

2.1.6. C6: Insertion of Maintenance as a Stage of the Product Life-Cycle

The last significant characteristic of a CBM visualization tool is the inclusion of maintenance in the cycle as a specific phase of the product life-cycle. It derives from considerations about the engagement of proper stakeholders for a behavioral change towards CE. In a BMC, this step is considered in the key partners’ part. Maintenance is therefore a key partner/stage to effectively close the loop. In the existing diagrams, maintenance is often considered as a circular initiative that acts during the product’s use to repair components and restore its initial conditions. Surely, maintenance is a fundamental operation in the CE model, since it allows the extension of the product life. Extending the life-cycle of a product means reducing the needs for raw materials for new production. Moreover, maintenance actions help to collect information about the condition of the product and support the decision-making about the necessity to replace or refurbish it, allowing the possibility to shift to innovative and more sustainable products [85,86,102]. This is the typical approach of the existing CBM visualization tools, where the attention mainly focused on the product makes strategies, such as maintenance, repairing and remanufacturing, useful to provide products with an extended or a second life.
Nevertheless, maintenance can be further exploited. In particular, it can act as a specific stage in the product-life cycle that can be carried out by an actor other than the user. Maintaining a failed/rejected product allows the regeneration of the entire product, some of its components or, finally, some of its materials. The recovered resources can be reinserted in the same cycle at previous stages or in other value chains. Consequently, maintenance is able to convert a possible flow of waste into new resources. The output of the maintenance stage is more valuable than the output of the recycling phase, since, during product maintenance, it is possible to identify the technical features of materials and components, allowing the selection of the proper destination. Moreover, maintenance operations aim to restore the initial physical-chemical properties of resources. On the contrary, since recycling takes place after the collection of various materials, which can be characterized by different features, the derived resources often have less quality and fewer properties than the single treated waste [47,84,86].

2.2. Gap Analysis

A gap analysis is presented in this paragraph to evaluate the existing CBM visualization tools in relation to the identified characteristics. The aim is to evaluate the ability of the current tools not only to explain and circulate CE concepts, but also to boost its implementation in practical actions. A numeric score and a color code is assigned to assess how the specific CBM archetype fits the features, selecting from three types of rating to keep the evaluation simple: a score of 1, corresponding to the green color, indicates that the characteristic is well represented by the CBM; a score of 0.5, represented by the yellow color, means that the CBM partially complies with the required characteristics; a score of 0, in red color, indicated a mismatch between the characteristic and the CBM. The scoring process is based on the previously described considerations. The final score is calculated, both for each CBM visualization tool and for each characteristic, as the sum of the single scores. Figure 7 lists the available CBM visualization tools and analyzes them in relation to the six described characteristics, providing the results of the gap analysis.
Based on the six characteristics identified by the authors as fundamental for a CBM, this means that a significant gap exists between all the available CBM visualization tools and the necessity to quantify the circularity grade of strategies and initiatives: feature C4 obtained a total score of 0 since none of the analyzed CBM visualization tools makes it possible to measure circularity. Another relevant gap is related to the capacity of the CBMs to adapt to varying industrial sectors (feature C5 with a score of 1.5), since most of the available tools typically refer to ‘technical’ products. The insertion of maintenance as a specific stage in the product life-cycle has a score of 2, but none of the analyzed CBM visualization tools obtained the maximum score. Ease of understanding has the highest score (4), attained by the majority of cases. This was an expected result since the most famous CBM visualization tools aim to make the broad concept of CE accessible to a large community.
Considering the single visualization tool in relation to the six features, the EMA foundation model proves to be the most complete (with a score of 4), while the EIT Raw Materials model has the lowest score (1.5), since it does not fit a large number of the defined characteristics.

2.3. Tools and Methods to Overcome the Main Gaps of the Current Models

To overcome the gaps identified in the existing CBM representations, a series of tools and methodologies was adapted and implemented to achieve the six characteristics. In particular, six tools were used. They address different features, as summarized in Table 5. Some approaches, such as waste hierarchy, MFA (Material Flow Analysis), KPI evaluation, design for X and digitalization, have been selected from literature since they are able to differently promote, enable and/or assess Circular Economy [13,98,103,104,105] and they are combined with other methods for a proper visualization, such as supply chain structure and color code, which ensure an immediate communication about CE concepts [59,106].

2.3.1. Supply Chain Structure

On the implementation level, literature demonstrates that CE initiatives require cooperation across a wide range of stakeholders, both internal and external to the supply chain [107], and the integration of CE concept into supply chain management can provide advantages for sustainability [1]. In many visualizations in literature, the structure of supply chain is often represented since it helps to connect, with several arrows, networks and relationships with different stakeholders [59,108]. Moreover, a supply chain map is useful to provide clear understanding of the material flows from upstream to downstream of the supply chain [109]. It is usual, even if not all supply chains and not all companies in a supply chain are equal, since it is possible to identify some key actors/companies that typically make up the supply chain structure. A clear definition and division of roles and locations of actors in the supply chain simplifies the identification of the existing and potential relationships, interdependencies and collaborations. Consequently, the distinction of the supply chain stages is one of the main features used to select the survey of existing CBM visualization tools and it is retained also in the new CE model as an element able to ensure the ease of understanding (feature C1). However, to address feature C2 providing correspondence to the real situation, the leakages have to be considered in each stage of the supply chain. Table 6 summarizes the main actors involved in a generic supply chain with the explanation of the main input and output flows deriving from their core business activities. Characteristic C5 related to the adaptation to each sector is ensured by the selection of the proper stages. For example, for ‘technical’ materials, all the stages indicated in Table 6 are typically present, with the insertion of maintenance that addresses also feature C6. For ‘biological’ materials, assembling and maintenance are not involved.

2.3.2. Waste Hierarchy

Each generic stage of the supply chain can have one or more flows, both in input and output. Referring to output flows, it is possible to classify them adopting the same levels as the waste hierarchy, which is the second tool used to obtain a new CBM visualization tool with the identified characteristics. Waste hierarchy is a consolidated method to prioritize initiatives of CE, which aims to create value-added from waste, separating it into high quality resources [103,113,114]. This tool addresses features C1, C2, C3 and C5, since it enables a simplified visualization of a complex scenario, which can be adapted to each sector, and it provides different solutions to manage the available flows. In particular, each generic stage can have five outflows, which can be sent to as many or more nodes, in the same or in other cycles/supply chains. The output flows are related to the waste management options ranked in the waste hierarchy, according to what is best for the environment [115,116,117]. Table 7 lists and described these options, starting from the most valuable flow.
The concept of hierarchy is adapted also for input flows, which are no longer waste. In input, each generic stage can have three typologies of flows, which can derive from three or more nodes. The sum of the three input flows enters the considered stage of the supply chain to be transformed or prepared for sale. These flows are listed from the least valuable to the most valuable in Table 8.

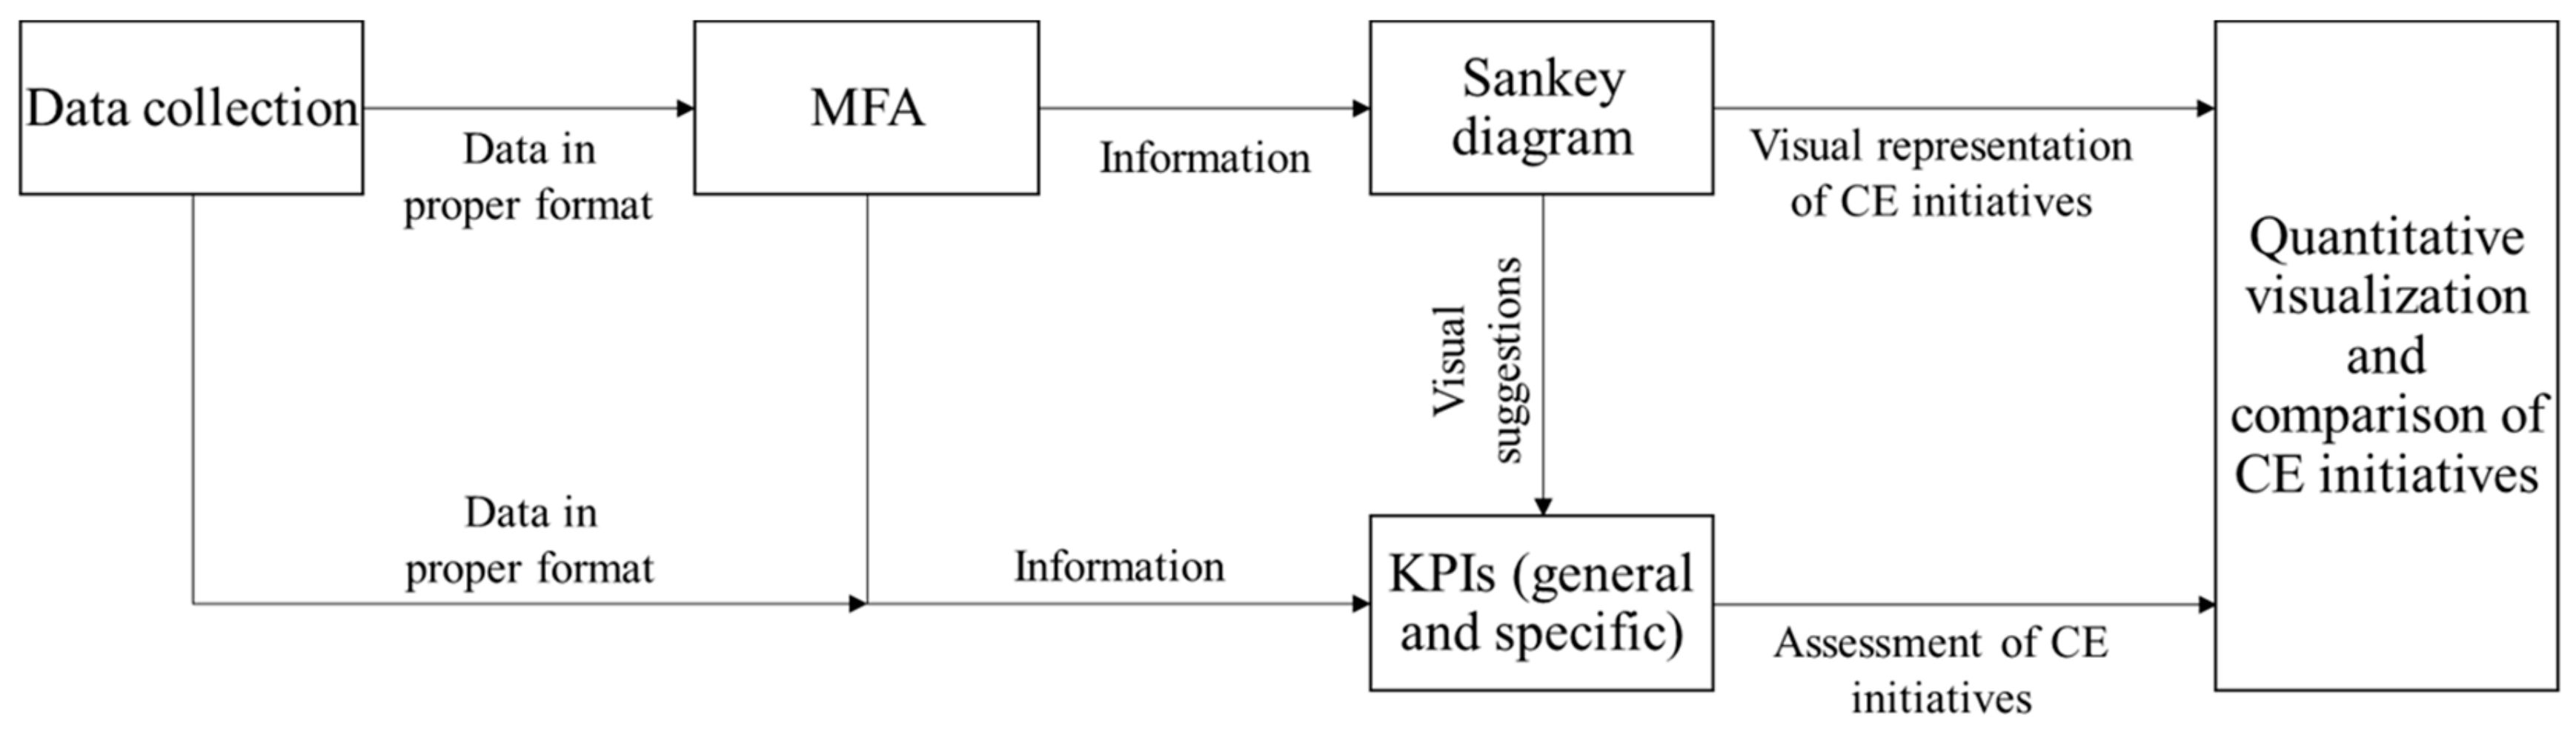
2.3.3. Quantification Methods: Material Flow Analysis, Sankey Diagram and Circular KPIs

Material Flow Analysis (MFA) and Sankey Diagram are two instruments widely exploited in the literature to describe and quantify different typologies of material flows. The two methods are integrated to mainly address the necessity to quantify the circular initiatives (feature C4). MFA is a consolidated approach: its use is quite common to assess CBMs and some interesting examples exist demonstrating its validity for the topic [104,120,121,122]. In practice, MFA is ‘a systematic assessment of the flows and stocks of materials within a system defined in space and time’ [123]. MFA can be related to different ‘objects’: it can refer to substances, materials, products, but also to entire sectors and regions, allowing the identification of the actors managing the flows [75]. MFA can be useful for a new CBM visualization tool since: (i) MFA reduces the system complexity while maintaining basic elements for decision-making; (ii) it guarantees the quantitative assessment of relevant flows, checking mass balance, sensitivities and uncertainties; (iii) it uses the results as a basis for managing resources and waste and their impact on the environment.
The MFA method is able to establish an inventory for the second useful tool, which is the Sankey diagram. This diagram is a specific type of flow diagram, characterized by arrows/bands that have a width proportional to the corresponding flow quantity. This means that the Sankey Diagram allows the representation of MFA results in a reproducible, understandable and transparent way. It provides an immediate visual impact on the major flows and gives information about the already existing or potential transfers of resources and about the relationship between certain nodes in the visualization.
The combination of the two methods is useful to express the complexity of circular economy, maintaining a simple visualization structure and an ease of understanding. In particular, the two methods can be integrated in a new CBM visualization tool, representing each stage of the supply chain as a rectangular box where the height is proportional to the corresponding resource flow. According to the mass balance, the total resource flow inlet and outlet of a stage must be the same. The total flow (both in input and output) is derived from the sum of one or more flows described in Section 2.3.2. Similarly, each flow is represented by an arrow with a width proportional to the relative quantity.
Some frameworks based on MFA with Sankey diagram have been already developed to extract indicators for CE, but often these indicators are not defined or are mainly focused on materials and products [120,124,125]. Consequently, the quantification is completed by the insertion of some indicators, which represent the basis of the circularity of a process. This is another fundamental element that aims to overcome one of the limitations of the existing diagrams, focused only on the product. The objective of these indicators is to consider how a product impacts on the surrounding environment: in fact, even if a final product could be considered circular, since it could be recovered in all aspects (meaning that it can completely serve a useful purpose by replacing other resources in the material cycle), the process to produce, distribute and/or consume it may not be circular [126,127]. Consequently, some basic indicators are inserted in the diagram to measure the process and the company activities too. These indicators are under development by a great number of studies [95,120], also conducted by the authors of this paper, and they will be further deal with in detail in subsequent studies. This paper provides some suggestions about the subjects of the indicators and their possible measurement, starting from other indicators used in the literature also for other purposes. The suggested indicators, which will require further analysis for their more precise definition and application, are:
energy efficiency: this is associated with the ability to exploit as much useful power out of the minimum input energy as possible to produce products and services, avoiding that part of it that becomes waste, i.e., the part of energy dissipated in the process. Energy is another important resource included in circular initiatives, so its use has to be monitored and optimized. One indicator that can measure the energy efficiency of a process is the so-call “energy intensity”, often used to define the big energy-consuming companies, or to measure the energy inefficiency of an economy. In the case of a company, it is calculated as the ratio between the total energy consumption during a period (kWh) and the turnover obtained by the company in the same period (€). It is measured in kWh/€. It measures the ability of a company to conserve energy consumption in products and services that generate revenue, reducing energy loss [128];
the renewable energy indicator: this represents the percentage of energy in a process that derives from renewable energy sources in relation to the total energy consumption of a company or process. Renewable energy resources determine a focal role in upholding low-carbon or GHG principles, one of the main issues for the loop closing, as demonstrated with the choice of the next indicator [84,129];
carbon footprint: this is a consolidated indicator to measure the total amount of greenhouse gases produced by a process, typically expressed as emission of carbon dioxide equivalent. To convert this information into a KPI, the carbon footprint of a company, process or business activity can be associated with the relative turnover. Similarly to energy efficiency, turnover can be used as an attractive denominator, since it is obligatory in annual reports and represents the value of the total sales of products and/or services. Consequently, a company’s carbon intensity, which is the carbon emissions (ton of CO2 equivalent) per unit of turnover (€), is measured in tons of CO2 equivalent/€. It is necessarily related to the previous indicators and allows their completeness and integration: in fact, low-carbon emission depends on both the energy efficiency of the process and the use of renewable energy [130];
social impact: this represents the change delivered for people by an organization’s actions, improving opportunities above all for disadvantaged people and strengthening communities. The social aspect has an important role in the circular economy; in fact, society can not only receive benefits from this new economic paradigm, but it can also be relevant for CE implementation. The main factors that contribute to the determination of the social impact are often different, complex and qualitative; consequently, several methods and approaches suggest indications for its measurements, but a general KPI has not yet been defined. However, since the social impact can be a valid tool to support business strategies and decisions, it is important to define an indicator able to measure and compare the circular activities and initiatives. Social impact is therefore also introduced in the model [131].
Figure 8 shows a qualitative flowchart of quantification methods integrated that will be integrated in the new CBM visualization tool.

2.3.4. Color Code

Color mapping is relevant in visualization tools, and the selection of the proper color scale to represent some data and information is not trivial [132]. To support the intuitiveness of the visualization (feature C1) and rapidly identify possible underlying models and their potential (feature C3), specific colors are selected to differentiate the value of flows and resources in the model. In particular, the light blue flows represent the raw materials (primary and/or secondary), the green flows characterize the final products and, finally, the grey flows symbolize waste/wastage.

2.3.5. Design for X

Design for X is an approach that aims to ensure specific requirements (within the “X” domain) for the product starting from the design phase. Design is a fundamental phase in the life-cycle of a product or service and the adoption of Design for X approaches and guidelines can really contribute to the implementation of CE [104,133,134,135]. More precisely, the “X” domain represents a specific activity, feature or goal that must be considered in advance, during the design phase, to proactively manage the issues that may become problems in the subsequent production phases [136,137,138]. Some of the existing CBM visualization tools (Accenture and EIT Raw Materials models) insert design as a specific stage of the supply chain, recognizing its important role within CE. Surely, the design phase acts at the beginning of the supply chain, but often in one or more stages (e.g., manufacturing and assembling), while its effect can be reversed in other stages further down the supply chain. Consequently, the authors prefer to insert the design for X approach representing its effect on various supply chain stages. Design for X mainly addresses feature C3, since it enables some circular initiatives. Four “X” domains are recognized as useful for circularity and are described in Table 9.

2.3.6. Digitalization and Intelligent Assets

The effect of digitalization and intelligent asset implementation is adopted as an additional tool to create a more complete CBM visualization tool. Table 10 summarizes some of the main instruments and methods, typical of the Fourth Industrial Revolution, which can be exploited to achieve an effective CE [139,140,141,142]. The insertion of the effect of intelligent assets in a CBM visualization tool addresses feature C3, since the suggested technologies can boost circular initiatives [47,143,144,145].

3. Results

Starting from the review of the literature on available CBMs and considering the results of the gap analysis, the tools identified as instruments to address the six features are inserted in a visualization tool able, not only to describe the concepts and the strategies of the Circular Economy, but also to facilitate the implementation of real CE activities. To understand how the CBM visualization tool is constructed and then to provide information to adapt it to specific applications at different levels (products, supply chains, industrial areas, Countries), the new model is applied to the supply chain of a generic ‘technical’ product (according to EMA Foundation definition). In particular, the qualitative approach is explained in detail without a quantitative correspondence, which will be possible for those who implement the model having collected the relative information.
In particular, in this section, the visualization of the elements that compose the new CBM visualization tool, deriving from the previous methodology, are explained. A generic ‘technical’ product is the reference product. The results consist of a visualization model for each single stage of the supply chain of the product and then it is expanded to its entire supply chain.

3.1. Model of a Single Stage in the Supply Chain

As anticipated, each stage of the supply chain, and hence of the product life-cycle, is represented as a rectangular box where its height is proportional to the total input flow, corresponding to the amount of resources necessary to produce a unit or a specific number of final products (e.g., a batch), as in Figure 9. The input flows can derive from three sources as described in Section 2.3.2. During the transformation process, only a part of the input resources become a final product with a value, while the remaining part is necessarily waste or wastage. The ratio between the valuable output and the total input resources can be used to evaluate the efficiency of the process corresponding to the analyzed stage. To improve the efficiency of the single stage, i.e., acting on the most valuable level of the waste hierarchy (reduction), an approach like design for X and/or intelligent assets can be applied. Their selection depends on the role of the considered stage in the supply chain. The waste/wastage part can be managed in different ways and graphically subdivided into four flows according to waste hierarchy.
The color code is applied for easier comprehension of the model. The transformation process, typically of the manufacturing or assembling stage, converts primary or secondary raw materials to final products: it is expressed with a gradual change of color in the stage box, passing from light blue to green. The final products become raw materials for the next phase or can be reused in previous stages without any further transformation: this stage corresponds to a shift from green to light blue. The waste flows can be sent to the landfill and the flow remains grey, or can be converted to secondary raw materials (or energy) for previous stages, shifting from grey to light blue.
The input/output flows represent all the cases that can occur, not in a specific stage, but in every phase of the production life-cycle. Consequently, the module illustrated in Figure 9 can be adapted to every company in the value chain of a product that belongs to every industrial sector (mining, mechanical, textile, food industries are some examples). According to a specific sector, a specific product and a specific stage in the product value chain, the extent of the different flows can vary, and hence the width of the arrows (in the example, they are qualitative). The indicators are inserted at the base of the visualization model to complete the evaluation of the circularity of the stage.
This stage can represent a single company, which can evaluate its actual situation and compare it with a potential circular action to be exploited or identify new opportunities. The main characteristic that makes the new CBM visualization tool different from all the existing models is the possibility to quantify the circularity grade of initiatives to have an estimatory tool of comparison that supports the decision-making.

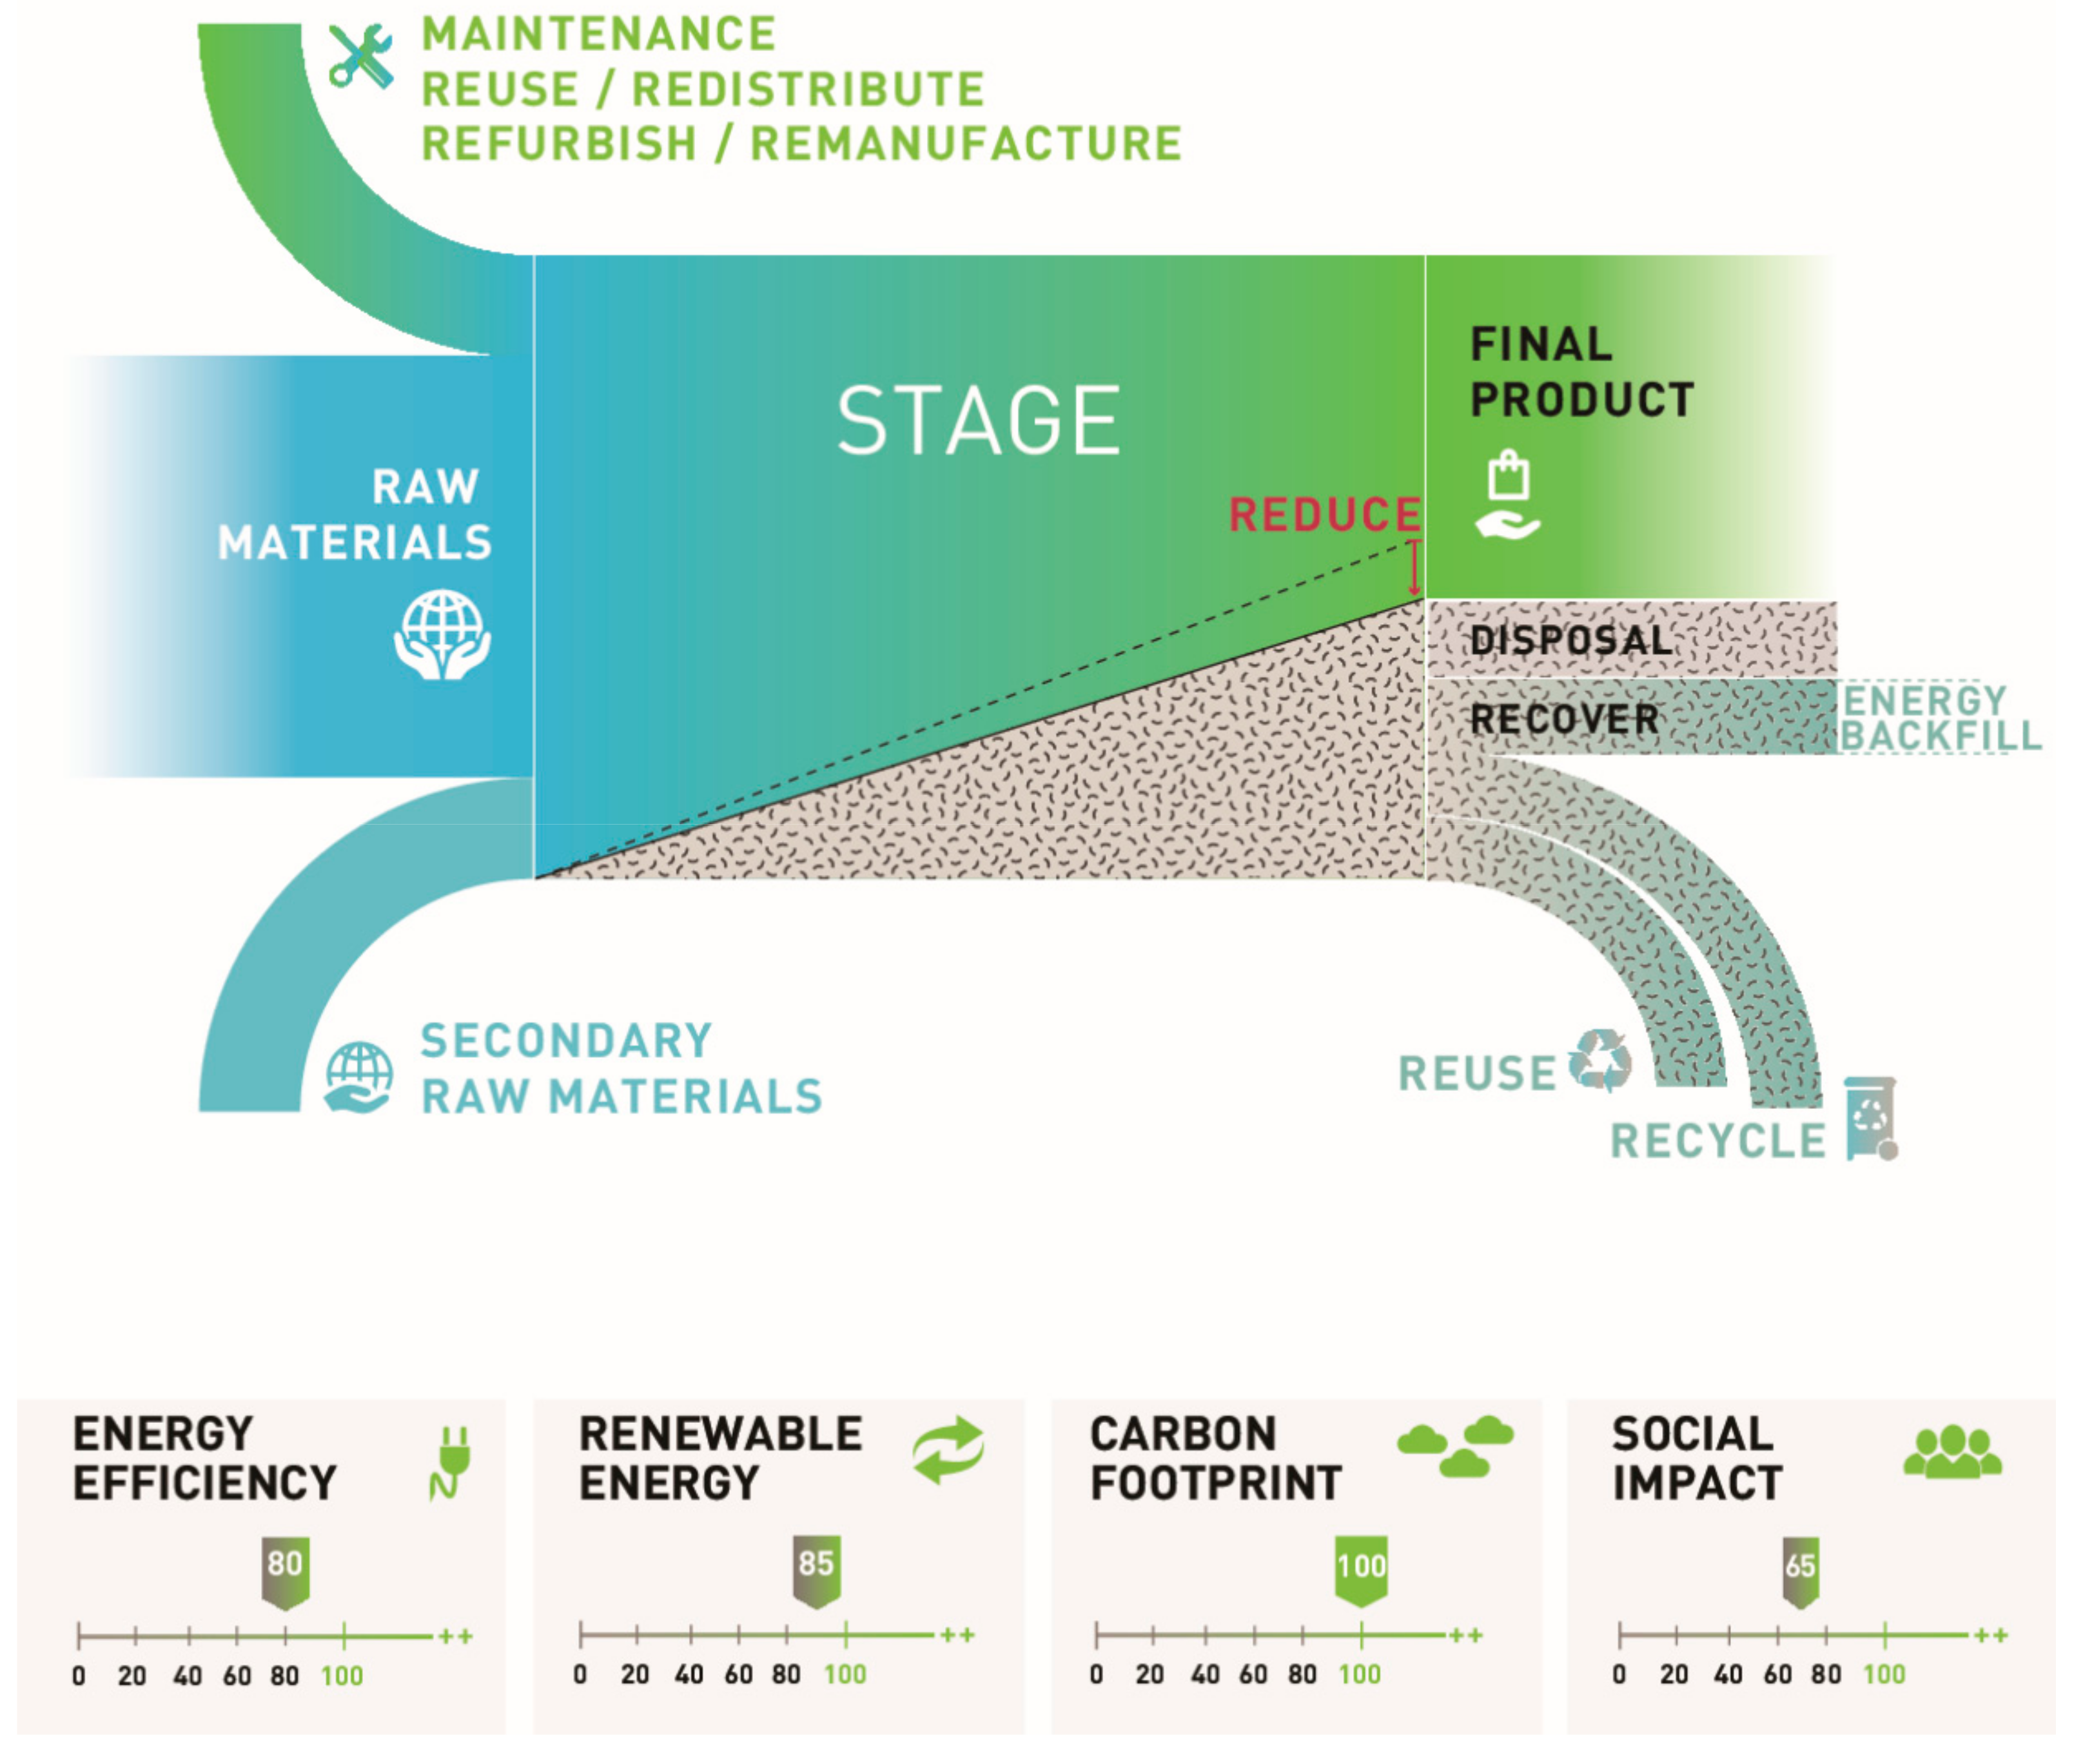
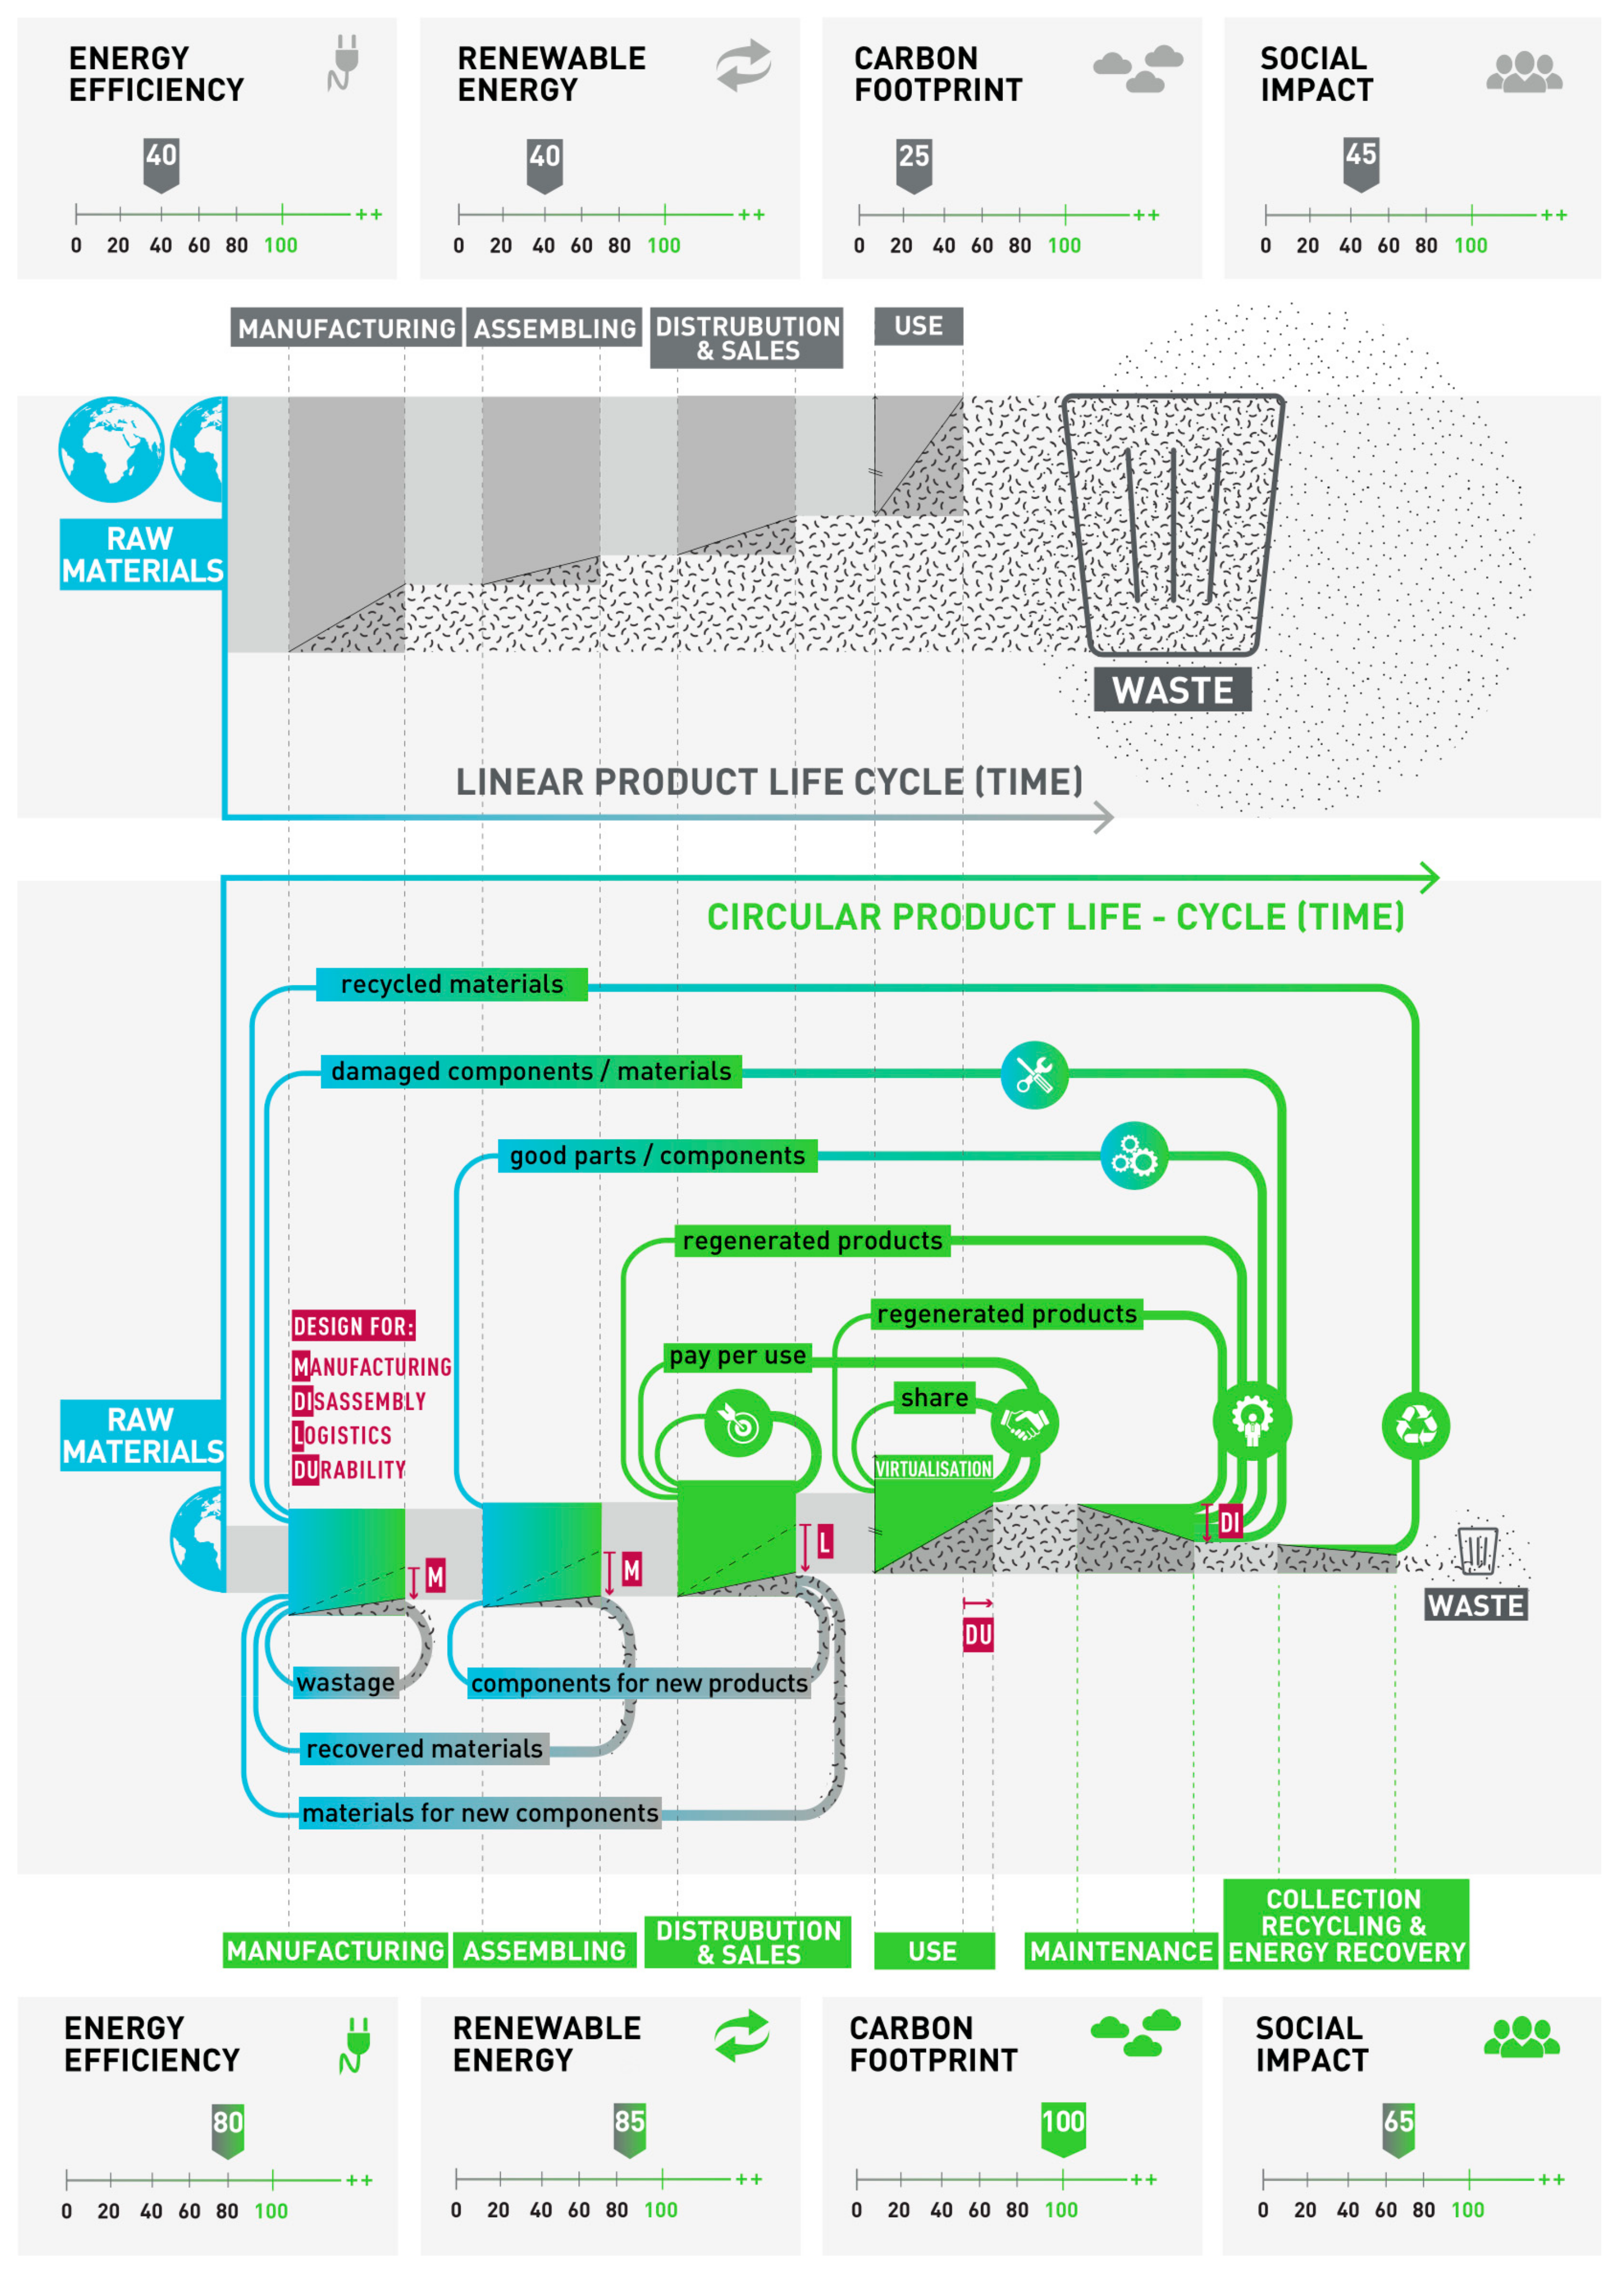
3.2. Model of the Entire Supply Chain

The model is then extended to the entire supply chain of a ‘technical’ product. To provide indications for the comparison of different scenarios, the new CBM visualization tool is developed for two extreme situations, as shown in Figure 10: the linear business model before the introduction of any type of circular initiatives, and a complete circular business model (but maintaining the correspondence with the real situation), where the leakages are used in the most valuable ways to minimize as much as possible both the extraction of new raw materials and the waste in landfills. Surely, the implementation of a complete circular business model is possible only with the support of proper policy and regulations. In fact, actually, some circular initiatives are limited by legislative constraints, above all when waste reuse is involved. Once again, the use of the new CBM visualization tool can highlight and measure available opportunities to provide indications for more appropriate regulations, which can favor CE applications maintaining a high level of quality.
To construct the two diagrams, the use stage is the reference. In particular, the width of the use stage is the same for the linear and the circular models: in this way, the production of the same quantity of final products for the consumers is considered and it is possible to compare the necessary resources for the two cases. In particular, starting from the quantity of resources necessary for a specific production and considering the leakages in all stages and the potential recirculation, it is possible to obtain the amount of raw materials extracted from natural reserves. Moreover, considering the part of waste recovered in any possible form, according to waste hierarchy, it is possible to also quantify the flow of waste that arrives at the disposal point.
In the linear model, the quantity of primary raw materials from the environment is extremely high. It was estimated that, in the actual scenario, the population consumes the resources that are available in one and a half worlds, and this data was inserted in the diagram [146,147]. Moreover, the resources can be considered waste starting from extraction. In particular, a part of waste is generated within each stage of the product life-cycle since every process is characterized by inefficiency. These inefficiencies could be very high if no circular initiatives are applied. Consequently, a significant part of resources becomes waste during transformation, and it means that they do not develop into final products. Moreover, at the end of the use stage, the ‘consumed’ product is disposed of; consequently, the remaining part of extracted resources also becomes waste. This means that the total flow of resources in input in the first stage (the manufacturing stage in the case of technical products) corresponds to the flow that becomes waste. Since the leakages in all the phases, as well as the product after use, are sent to the landfill in the extreme linear case that the grey color is used for all the stages in the diagram. In the visualization tool, since every arrow width is proportional to the corresponding resource flow, it is possible to provide information about the quantification of extracted resource use, process efficiency, and disposed waste both for each stage and for the entire supply chain associated with a specific product or a specific category of products. Moreover, the associated indicators can also be evaluated. In aiming to explain how to construct the CBM visualization tool, the example in this paper is qualitative, and the arrow width and the indicators do not therefore correspond to a real case.
In the circular model, the raw materials necessary to produce the same quantity of products are considerably reduced in the whole supply chain, through the recirculation of both waste as secondary raw materials and the reuse of products and components. Similarly, since a great part of resources is recovered in different ways in each stage, the resources that become waste and are sent for disposal are considerably reduced.
According to the EMA Foundation diagram, the process of production, distribution, and consumption of a product in the new visualization tool is maintained linear. This choice is supported by three reasons. The first is that in concrete terms the process for making a product consists of sequential operations and phases in a linear relationship between resource inputs and transformations to obtain a final product. These phases are often implemented by several different actors and companies. The second reason for the linear structure is linked to the aim to highlight the presence of leakages. In fact, the product process is still linear since in each phase some waste/wastage is unavoidable. This is the limitation that makes the available models different from the real economic situation. The EIT Raw Materials model recognizes the inevitable generation of waste during each stage of the product life-cycle, but also its representation is only partially correct. In fact, the waste generated by stages is different, both in quantity and in typology and typically the majority of waste goes to the landfill, making the activities of sorting and recycling more difficult. The third reason is linked to the insertion of the time dimension, represented along the x-axis.
In particular, in the proposed new CBM visualization tool, the CE principles, described in the already existing models, are all considered and represented in a new way, to provide a more real vision of the CE model, ensuring the achievement of the six characteristics and overcoming the identified gaps. The patterns and the circular initiatives are able to close the loop through the reduction of leakages and avoiding the leakages and the products becoming waste. The adoption of these CE initiatives, not only at the end of the use phase, but also in each operation of the product life-cycle, makes it possible to implement the most valuable pattern defined by the EMA Foundation, which is the inner circle.
Through the implementation of circular initiatives, approaches such as design for X and digitalization and intelligent assets, each stage of the supply chain is characterized by a reduction of primary raw materials in input and waste sent to disposal in output. Table 11 summarizes which of the previous initiatives, tools, and approaches act in the specific stages of the supply chain.
It must be noted that also the circular initiatives are characterized by efficiency, which determines some leakages also during their implementation. This aspect is represented in the visualization tool with different widths of the circular flows. More precisely, when a specific flow is recovered from a stage in different forms (output flow) and is reinserted in the same stage or in previous stages as an input flow, the quantity that effectively re-enters the stage is lower than the recovered output quantity.
Both for the linear and the circular supply chains, it is possible to evaluate some KPIs, and, particularly the proposed indicators, to compare not only the products, but the entire supply chain and the sector in which it is inserted. The presence of the indicators in the visualization tool makes it possible to measure the benefits of the transition to a CE business model.
Another difference between linear and circular models is the product life-cycle duration. The life-time of a product in its supply chain (from raw material extraction to waste sending to disposal) can be expressed along the x-axis of the CBM visualization tool. In particular, the length of the stage and supply chain is exploited to represent the time duration. This means that the life of the product in a circular supply chain is characterized by an extended life.
The proposed new CBM visualization tool allows an immediate and effective comparison between the extreme linear and the extreme circular situation, which are easily measurable. In particular, the main results of shifting to a circular economy are:
  • a significant reduction of primary raw materials derived from the environment;
  • a significant reduction of waste sent to landfill;
  • the extension of the life-cycle of resources and products (the time expressed in the x-axis is greater in the circular case) and
  • the revalorization of resources and products at the end of their life.
All these effects are expressed in the EU definition of circular economy, which is expressed in a simple visualization form to overcome the main issues related to a complex system.

4. Discussion

Since the tool ‘forces’ the user to collect and insert specific data and to exclude other information that could be misguided, preventing an appropriate assessment of circular initiatives, the deriving results can be considered reliable and can be used as baseline to compare the evaluated situation with other opportunities in the same context or sector. It means that the tool facilitates the replication or the improvement of practical implementation of CE by focusing on the relevant elements to be considered and evaluated. In fact, terminology, methods, models and KPIs to implement and assess CE are often very different and suitable only for the specific application. Consequently, their replicability or further development are limited.
Moreover, the generality of the tool, provided by the use of consolidated and widespread methods (e.g., waste hierarchy, MFA…), makes the tool itself scalable on different levels and adaptable for different needs. In fact, in this paper, a single stage represents a company and more stages constitute an entire value chain, but nothing prevents the users to consider the stage as a phase of an industrial process and the combination of more stages as the relationship among operational functions of one company. On the other hand, on a greatest size, the tool can represent and industrial district, consisting of more actors that cover the same function in the supply chain (e.g., competitors or parallel providers). The strong requirement to make available some specific data and information calls for a great effort in the first application of the tool in a specific company, sector or district, but this process demands to deeply think about the implications of some choices (e.g., the strict need to use critical raw materials and the opportunity to analyze their replacement). This process, integrated in a visual structure, allows a rapid identification of critical gaps, such as limiting relationships with suppliers and customers, legislative barriers and social aspects, and missing aspects, such as knowledge of the waste streams and expertise to valorize them. These points are the priority issues on which the efforts must be addressed. In fact, without having idea on limiting aspects, it is impossible to clearly evaluate a CE innovation and analyze some solutions to overcome them, increasing the risks and further limiting the benefits deriving from CE implementation.

5. Conclusions

A new CBM visualization tool that describes the complexity of circular business models, maintaining the simplicity of representation, has been developed. The aim of the new CBM visualization tool is to boost practical CE implementation and find new potential circular opportunities, already undiscovered or unexploited, through the systematization of the collection of data and information (in a proper format) to assess Circular Economy. The great variety of definitions, elements and underlying models about CE, and the use of different data to measure circularity, makes it difficult to compare circular initiatives. Consequently, as a first aspect, the new CBM visualization tool is useful to create aligned concepts about CE and standardize the necessary ‘building blocks’ to evaluate. Moreover, the construction and the use of the new model is simple and can be adapted to any product, company, supply chain and industrial area: precise data on resources, energy, labor, and costs must be collected and inserted in the new CBM visualization. In this way, after the first application of the tool in a specific industrial sector or for a specific actor in the supply chain, the main data and elements to use it will be already set and available to replicate its use in comparable situations. Therefore, practitioners are provided with a baseline, complete overview that can be useful to identify, replicate and/or improve circular initiatives, avoiding efforts (time and costs) for less valuable solutions and reducing the risk of investment.
To demonstrate the power of this visualization tool, the authors are already working on its implementation in several Italian companies (in plastics and fashion sectors), industrial districts, different in typology of products and services, in size and in business model, in order to both quantify the resource flow and define some relevant indicators. The final objective is to map the actual situation, highlight the potential solutions based on CE concept and create a network of expertise to implement these solutions, guaranteeing economic, social, and environmental benefits for all the involved stakeholders. It will require a detailed knowledge of the involved sectors, processes and products and a precise collection of data to fill the model. The availability of necessary information in the right formats is not often guaranteed and could be not so easy. Consequently, the quantification of flows and indicators about the case studies under development will be treated with great attention. However, after the first development of the tool in these analyzed cases studies, the setup of the model will be accessible for the entire operation field, as guideline for an easier reproduction in similar contexts.

Author Contributions

All authors contributed equally to all aspects of the research presented in this paper. More specifically, A.B. has identified the research objectives to overcome the main gaps in the actual state-of-the-art, coordinating the research group. A.B. revised the CBM visualization tool, providing strong and robust suggestions to improve it. M.P. has suggested the methodology to use to identify the main gaps of other tools to highlight the novelty of the proposed model. J.R. had developed the conceptualization of the main features of the new tool and their representation as visualization method.

Funding

This research received no external funding.

Conflicts of Interest

The authors declare no conflict of interest.

References

  1. Farooque, M.; Zhang, A.; Thürer, M.; Qu, T.; Huisingh, D. Circular supply chain management: A definition and structured literature review. J. Clean. Prod. 2019, 228, 882–900. [Google Scholar] [CrossRef]
  2. European Commission. Communication from the Commission to the European Parliament, the Council, the European Economic and Social Committee and the Committee of the Regions Closing the loop-An EU action plan for the Circular Economy. Available online: https://eur-lex.europa.eu/resource.html?uri=cellar:8a8ef5e8-99a0-11e5-b3b7-01aa75ed71a1.0012.02/DOC_1&format=PDF (accessed on 21 November 2019).
  3. Geissdoerfer, M.; Savaget, P.; Bocken, N.M.P.; Hultink, E.J. The Circular Economy—A new sustainability paradigm? J. Clean. Prod. 2017, 143, 757–768. [Google Scholar] [CrossRef]
  4. De Pádua Pieroni, M.; Pigosso, D.C.A.; McAloone, T.C. Sustainable Qualifying Criteria for Designing Circular Business Models. Procedia CIRP 2018, 69, 799–804. [Google Scholar] [CrossRef]
  5. Ranta, V.; Aarikka-Stenroos, L.; Mäkinen, S.J. Creating value in the circular economy: A structured multiple-case analysis of business models. J. Clean. Prod. 2018, 201, 988–1000. [Google Scholar] [CrossRef]
  6. Bocken, N.M.P.; Schuit, C.S.C.; Kraaijenhagen, C. Experimenting with a circular business model: Lessons from eight cases. Environ. Innov. Soc. Transit. 2018, 28, 79–95. [Google Scholar] [CrossRef]
  7. Manninen, K.; Koskela, S.; Antikainen, R.; Bocken, N.; Dahlbo, H.; Aminoff, A. Do circular economy business models capture intended environmental value propositions? J. Clean. Prod. 2018, 171, 413–422. [Google Scholar] [CrossRef]
  8. Ghisellini, P.; Cialani, C.; Ulgiati, S. A review on circular economy: The expected transition to a balanced interplay of environmental and economic systems. J. Clean. Prod. 2016, 114, 11–32. [Google Scholar] [CrossRef]
  9. Rosa, P.; Sassanelli, C.; Terzi, S. Towards Circular Business Models: A systematic literature review on classification frameworks and archetypes. J. Clean. Prod. 2019, 236, 117696. [Google Scholar] [CrossRef]
  10. Mas-Tur, G.C. The Influence of the Circular Economy: Exploring the Knowledge Base. Sustainability 2019, 11, 4367. [Google Scholar] [CrossRef]
  11. Lüdeke-Freund, F. Towards a Conceptual Framework of Business Models for Sustainability. In Proceedings of the ERSCP-EMSU conference, Delft, The Netherlands, 25–29 October 2010; p. 28. [Google Scholar]
  12. Degrowth, Steady State Economics and the Circular Economy: Three Distinct Yet Increasingly Converging Alternative Discourses to Economic Growth for Achieving Environmental Sustainability and Social Equity. In World Economic Association Sustainability Conference 2012. Available online: http://sustainabilityconference2012.worldeconomicsassociation.org/wp-content/uploads/WEASustainabilityConference2012_Charonis_Alternative-Discoursesto-Economic-Growth.pdf (accessed on 1 October 2019).
  13. Antikainen, M.; Valkokari, K. A Framework for Sustainable Circular Business Model Innovation. Technol. Innov. Manag. Rev. 2016, 6, 8. [Google Scholar] [CrossRef]
  14. Scheepens, A.E.; Vogtländer, J.G.; Brezet, J.C. Two life cycle assessment (LCA) based methods to analyse and design complex (regional) circular economy systems. Case: Making water tourism more sustainable. J. Clean. Prod. 2016, 114, 257–268. [Google Scholar] [CrossRef]
  15. Roome, N.; Louche, C. Journeying Toward Business Models for Sustainability: A Conceptual Model Found Inside the Black Box of Organisational Transformation. Organ. Environ. 2016, 29, 11–35. [Google Scholar] [CrossRef]
  16. Geissdoerfer, M.; Savaget, P.; Evans, S. The Cambridge Business Model Innovation Process. Procedia Manuf. 2017, 8, 262–269. [Google Scholar] [CrossRef]
  17. Joyce, A.; Paquin, R.L. The triple layered business model canvas: A tool to design more sustainable business models. J. Clean. Prod. 2016, 135, 1474–1486. [Google Scholar] [CrossRef]
  18. Haanstra, W.; Toxopeus, M.E.; van Gerrevink, M.R. Product Life Cycle Planning for Sustainable Manufacturing: Translating Theory into Business Opportunities. Procedia CIRP 2017, 61, 46–51. [Google Scholar] [CrossRef]
  19. Levänen, J.; Lyytinen, T.; Gatica, S. Modelling the Interplay Between Institutions and Circular Economy Business Models: A Case Study of Battery Recycling in Finland and Chile. Ecol. Econ. 2018, 154, 373–382. [Google Scholar] [CrossRef]
  20. Lieder, M.; Rashid, A. Towards circular economy implementation: A comprehensive review in context of manufacturing industry. J. Clean. Prod. 2016, 115, 36–51. [Google Scholar] [CrossRef]
  21. Geissdoerfer, M.; Morioka, S.N.; de Carvalho, M.M.; Evans, S. Business models and supply chains for the circular economy. J. Clean. Prod. 2018, 190, 712–721. [Google Scholar] [CrossRef]
  22. Suárez-Eiroa, B.; Fernández, E.; Méndez-Martínez, G.; Soto-Oñate, D. Operational principles of circular economy for sustainable development: Linking theory and practice. J. Clean. Prod. 2019, 214, 952–961. [Google Scholar] [CrossRef]
  23. Sousa-Zomer, T.T.; Magalhães, L.; Zancul, E.; Cauchick-Miguel, P.A. Exploring the challenges for circular business implementation in manufacturing companies: An empirical investigation of a pay-per-use service provider. Resour. Conserv. Recycl. 2018, 135, 3–13. [Google Scholar] [CrossRef]
  24. Ritzén, S.; Sandström, G.Ö. Barriers to the Circular Economy—Integration of Perspectives and Domains. Procedia CIRP 2017, 64, 7–12. [Google Scholar] [CrossRef]
  25. De Jesus, A.; Mendonça, S. Lost in Transition? Drivers and Barriers in the Eco-innovation Road to the Circular Economy. Ecol. Econ. 2018, 145, 75–89. [Google Scholar] [CrossRef]
  26. Van Barneveld, J.; van der Veen, G.; Enenkel, K.; Mooren, C.; Talman-Gross, L.; Eckartz, K.; Ostertag, K.; Duque-Ciceri, N.; Fischer, T.; Gama, M.; et al. Regulatory Barriers for the Circular Economy: Lessons from Ten Case Studies; Technopolis Group: Amsterdam, The Netherlands, 2016. [Google Scholar]
  27. De los Rios, I.C.; Charnley, F.J.S. Skills and capabilities for a sustainable and circular economy: The changing role of design. J. Clean. Prod. 2017, 160, 109–122, 174. [Google Scholar] [CrossRef]
  28. Accenture strategy. Circular Advantage. Innovative Business Models and Technologies to Create Value in a World without Limits to Growth. 2014. Available online: https://www.accenture.com/t20150523T053139__w__/us-en/_acnmedia/Accenture/Conversion-Assets/DotCom/Documents/Global/PDF/Strategy_6/Accenture-Circular-Advantage-Innovative-Business-Models-Technologies-Value-Growth.pdf (accessed on 21 November 2019).
  29. Rizos, V.; Behrens, A.; van der Gaast, W.; Hofman, E.; Ioannou, A.; Kafyeke, T.; Flamos, A.; Rinaldi, R.; Papadelis, S.; Hirschnitz-Garbers, M.; et al. Implementation of Circular Economy Business Models by Small and Medium-Sized Enterprises (SMEs): Barriers and Enablers. Sustainability 2016, 8, 1212. [Google Scholar] [CrossRef]
  30. Van Buren, N.; Demmers, M.; van der Heijden, R.; Witlox, F. Towards a Circular Economy: The Role of Dutch Logistics Industries and Governments. Sustainability 2016, 8, 647. [Google Scholar] [CrossRef]
  31. Linder, M.; Williander, M. Circular Business Model Innovation: Inherent Uncertainties: Circular Business Model Innovation. Bus. Strat. Environ. 2017, 26, 182–196. [Google Scholar] [CrossRef]
  32. Roos, G. Business Model Innovation to Create and Capture Resource Value in Future Circular Material Chains. Resources 2014, 3, 248–274. [Google Scholar] [CrossRef]
  33. Korhonen, J.; Honkasalo, A.; Seppälä, J. Circular Economy: The Concept and its Limitations. Ecol. Econ. 2018, 143, 37–46. [Google Scholar] [CrossRef]
  34. Witjes, S.; Lozano, R. Towards a more Circular Economy: Proposing a framework linking sustainable public procurement and sustainable business models. Resour. Conserv. Recycl. 2016, 112, 37–44. [Google Scholar] [CrossRef]
  35. Bianchini, A.; Benci, A.; Pellegrini, M.; Rossi, J. Supply chain redesign for lead-time reduction through Kraljic purchasing portfolio and AHP integration. Benchmarking 2019, 26, 1194–1209. [Google Scholar] [CrossRef]
  36. Ellen MacArthur Foundation. Intelligent Assets: Unlocking the Circular Economy Potential. Ellen MacArthur Found. 2016, 1–74. Available online: https://www.ellenmacarthurfoundation.org/publications/intelligent-assets (accessed on 21 November 2019).
  37. Bocken, N.; Boons, F.; Baldassarre, B. Sustainable business model experimentation by understanding ecologies of business models. J. Clean. Prod. 2019, 208, 1498–1512. [Google Scholar] [CrossRef]
  38. De Camargo Fiorini, P.; Jabbour, C.J.C. Information systems and sustainable supply chain management towards a more sustainable society: Where we are and where we are going. Int. J. Inf. Manag. 2017, 37, 241–249. [Google Scholar] [CrossRef] [Green Version]
  39. Su, C.-J.; Huang, S.-F. Real-time big data analytics for hard disk drive predictive maintenance. Comput. Electr. Eng. 2018, 71, 93–101. [Google Scholar] [CrossRef]
  40. Ellen MacArthur Foundation. Intelligent Assets: Unlocking the Circular Economy Potential. Appendix: Selected Case Studies. Ellen MacArthur Found. 2016, 1–25. Available online: https://www.ellenmacarthurfoundation.org/assets/downloads/publications/EllenMacArthurFoundation_Intelligent_Assets_Case_Studies_1002016.pdf (accessed on 21 November 2019).
  41. Baldassarre, F.; Ricciardi, F.; Campo, R. The Advent of Industry 4.0 in Manufacturing Industry: Literature Review and Growth Opportunities. In Proceedings of the Dubrovnik International Economic Meeting (DIEM 2017), Scientific Conference on Managing Business Growth in a Volatile Environment, Dubrovnik, Croatia, 12–14 October 2017. [Google Scholar]
  42. Mendoza-Fong, J.; García-Alcaraz, J.; Jiménez Macías, E.; Ibarra Hernández, N.; Díaz-Reza, J.; Blanco Fernández, J. Role of Information and Communication Technology in Green Supply Chain Implementation and Companies’ Performance. Sustainability 2018, 10, 1793. [Google Scholar] [CrossRef] [Green Version]
  43. Bressanelli, G.; Adrodegari, F.; Perona, M.; Saccani, N. Exploring How Usage-Focused Business Models Enable Circular Economy through Digital Technologies. Sustainability 2018, 10, 639. [Google Scholar] [CrossRef] [Green Version]
  44. Jagadish, H.V. Big Data and Science: Myths and Reality. Big Data Res. 2015, 2, 49–52. [Google Scholar] [CrossRef]
  45. Jabbour, C.J.C.; de Jabbour, A.B.L.S.; Sarkis, J.; Filho, M.G. Unlocking the circular economy through new business models based on large-scale data: An integrative framework and research agenda. Technol. Forecast. Soc. Chang. 2019, 144, 546–552. [Google Scholar] [CrossRef]
  46. Tseng, M.-L.; Tan, R.R.; Chiu, A.S.F.; Chien, C.-F.; Kuo, T.C. Circular economy meets industry 4.0: Can big data drive industrial symbiosis? Resour. Conserv. Recycl. 2018, 131, 146–147. [Google Scholar] [CrossRef]
  47. Bianchini, A.; Pellegrini, M.; Rossi, J.; Saccani, C. Theoretical model and preliminary design of an innovative wet scrubber for the separation of fine particulate matter produced by biomass combustion in small size boilers. Biomass Bioenergy 2018, 116, 60–71. [Google Scholar] [CrossRef]
  48. European Commission. Moving towards a circular economy with EMAS—Best practices to implement circular economy strategies (with case study examples); European Union: Publications Office of the European Union: Luxembourg, 2017. [Google Scholar]
  49. Baden-Fuller, C.; Morgan, M.S. Business Models as Models. Long Range Plan. 2010, 43, 156–171. [Google Scholar] [CrossRef]
  50. Bocken, N.; Short, S.; Rana, P.; Evans, S. A value mapping tool for sustainable business modelling. Corp. Gov. 2013, 13, 482–497. [Google Scholar] [CrossRef]
  51. Beha, F.; Göritz, A.; Schildhauer, T. Business Model Innovation: The Role of Different Types of Visualizations. In Proceedings of the XXVI ISPIM Conference—Shaping the Frontiers of Innovation Management, Budapest, Hungary, 14–17 June 2015. [Google Scholar]
  52. Tsolakis, N.; Srai, J.S. Mapping supply dynamics in renewable feedstock enabled industries: A systems theory perspective on ‘green’ pharmaceuticals. Oper Manag Res 2018, 11, 83–104. [Google Scholar] [CrossRef] [Green Version]
  53. Nußholz, J.L.K. A circular business model mapping tool for creating value from prolonged product lifetime and closed material loops. J. Clean. Prod. 2018, 197, 185–194. [Google Scholar] [CrossRef]
  54. Pieroni, M.P.P.; McAloone, T.C.; Pigosso, D.C.A. Business model innovation for circular economy and sustainability: A review of approaches. J. Clean. Prod. 2019, 215, 198–216. [Google Scholar] [CrossRef]
  55. Ellen MacArthur Foundation, Toward the Circular Economy. Opportunities for the consumer goods sector. Ellen MacArthur Found. 2013, 1–112. Available online: https://www.ellenmacarthurfoundation.org/publications/towards-the-circular-economy-vol-2-opportunities-for-the-consumer-goods-sector (accessed on 21 November 2019).
  56. Ghosh, S.; Eckerle, K.; Morrison, H. Turning Waste into Value with Your Supply Chain. Available online: https://www.accenture.com/nl-en/_acnmedia/pdf-49/accenture-full-circle-pov.pdf (accessed on 7 October 2019).
  57. Moonfish-Creating Sustainable Value for the Future. Available online: https://strategicvalueofdesign.org/2014/06/17/creating-sustainable-value-for-the-future/ (accessed on 7 October 2019).
  58. Eit Raw Materials Innovation Themes. Design of Products and Services for the Circular Economy. Available online: https://eitrawmaterials.eu/innovation-themes/ (accessed on 7 October 2019).
  59. Reike, D.; Vermeulen, W.J.V.; Witjes, S. The circular economy: New or Refurbished as CE 3.0?—Exploring Controversies in the Conceptualization of the Circular Economy through a Focus on History and Resource Value Retention Options. Resour. Conserv. Recycl. 2018, 135, 246–264. [Google Scholar] [CrossRef]
  60. Teng, W.C.; Fong, K.L.; Shenkar, D.; Wilson, J.A.; Foo, D.C.Y. Piper diagram–A novel visualisation tool for process design. Chem. Eng. Res. Des. 2016, 112, 132–145. [Google Scholar] [CrossRef]
  61. Täuscher, K.; Abdelkafi, N. Visual tools for business model innovation: Recommendations from a cognitive perspective. Creat. Innov. Manag. 2017, 26, 160–174. [Google Scholar] [CrossRef] [Green Version]
  62. Osterwalder, A.; Pigneur, Y.; Clark, T. Business Model Generation: A Handbook for Visionaries, Game Changers, and Challengers; Wiley: Hoboken, NJ, USA, 2010; ISBN 978-0-470-87641-1. [Google Scholar]
  63. Joyce, A. Managing Complexity; Springer Proceedings in Business and Economics; Springer International Publishing: Cham, Switzerland, 2017. [Google Scholar]
  64. Mentink, B. Circular Business Model Innovation. Master’s Thesis, Delft University of Technology & Leiden University, Leiden, The Netherlands, 2014. [Google Scholar]
  65. Weetman, C. A Circular Economy Handbook for Business and Supply Chains: Repair, Remake, Redesign, Rethink; Kogan Page Publishers: New York, NY, USA, 2016. [Google Scholar]
  66. Sustainn, 2017. Circularity Canvas: Methodology to Outline Circular Business Models. Available online: http://www.wearesustainn.com/en/2017/03/circularity-canvasmethodology-circular-business-models/ (accessed on 7 October 2019).
  67. Achterberg, E.; Hinfelaar, J.; Bocken, N. Master Circular Business with the Value Hill. Circle Economy. 2016. Available online: https://www.circle-economy.com/wp-content/uploads/2016/09/finance-white-paper-20160923.pdf (accessed on 7 October 2019).
  68. Parajuly, K.; Wenzel, H. Potential for circular economy in household WEEE management. J. Clean. Prod. 2017, 151, 272–285. [Google Scholar] [CrossRef]
  69. Van Renswoude, K.; Wolde, A.; Joustra, D.J. Circular Business Models–Part 1: An Introduction to IMSA’s Circular Business Model Scan; IMSA: Amsterdam, The Netherlands, 2015. [Google Scholar]
  70. Aminoff, A.; Valkokari, K.; Kettunen, O. Mapping Multidimensional Value(s) for Co-creation Networks in a Circular Economy. In Collaboration in a Hyperconnected World. PRO-VE 2016; Afsarmanesh, H., Camarinha-Matos, L., Lucas Soares, A., Eds.; IFIP Advances in Information and Communication Technology, 480; Springer: Cham, Switzerland, 2016; pp. 629–638. [Google Scholar] [CrossRef] [Green Version]
  71. O’Dea, K. How Packaging Plays in the Circular Economy. 2015. Available online: https://www.greenbiz.com/article/how-circular-economy-plays-out-packaging (accessed on 7 October 2019).
  72. Geisendorf, S.; Wolf, P. The Circular Economy: Building an Economy on the Template of Nature. 2019. Available online: https://theconversation.com/the-circular-economy-building-an-economy-on-the-template-of-nature-115663 (accessed on 7 October 2019).
  73. Liu, Z.; Adams, M.; Cote, R.P.; Geng, Y.; Li, Y. Comparative study on the pathways of industrial parks towards sustainable development between China and Canada. Resour. Conserv. Recycl. 2016, 128, 417–425. [Google Scholar] [CrossRef]
  74. Sauter, E.M.; Witjes, M. Linked Spatial Data for a Circular Economy. Exploring its potential through a Textile Use Case, 1–6. 2017. Available online: http://ceur-ws.org/Vol-2044/paper10/paper10.html (accessed on 7 October 2019).
  75. Kalmykova, Y.; Sadagopan, M.; Rosado, L. Circular economy—From review of theories and practices to development of implementation tools. Resour. Conserv. Recycl. 2018, 135, 190–201. [Google Scholar] [CrossRef]
  76. Lewandowski, M. Designing the Business Models for Circular Economy—Towards the Conceptual Framework. Sustainability 2016, 8, 43. [Google Scholar] [CrossRef] [Green Version]
  77. Vuong, J.; Kaur, S.; Heinrich, J.; Ho, B.K.; Hammang, C.J.; Baldi, B.F.; O’Donoghue, S.I. Versus—A tool for evaluating visualizations and image quality using a 2AFC methodology. Vis. Inform. 2018, 2, 225–234. [Google Scholar] [CrossRef]
  78. Kirchherr, J.; Reike, D.; Hekkert, M. Conceptualizing the circular economy: An analysis of 114 definitions. Resour. Conserv. Recycl. 2017, 127, 221–232. [Google Scholar] [CrossRef]
  79. Korhonen, J.; Nuur, C.; Feldmann, A.; Birkie, S.E. Circular economy as an essentially contested concept. J. Clean. Prod. 2018, 175, 544–552. [Google Scholar] [CrossRef]
  80. Kravchenko, M.; McAloone, T.C.; Pigosso, D.C.A. Implications of developing a tool for sustainability screening of circular economy initiatives. Procedia CIRP 2019, 80, 625–630. [Google Scholar] [CrossRef]
  81. Svensson, N.; Funck, E.K. Management control in circular economy. Exploring and theorizing the adaptation of management control to circular business models. J. Clean. Prod. 2019, 233, 390–398. [Google Scholar] [CrossRef]
  82. Sehnem, S.; Chiappetta Jabbour, C.J.; Farias Pereira, S.C.; de Sousa Jabbour, A.B.L. Improving sustainable supply chains performance through operational excellence: Circular economy approach. Resour. Conserv. Recycl. 2019, 149, 236–248. [Google Scholar] [CrossRef]
  83. Bianchini, A.; Pellegrini, M.; Rossi, J.; Saccani, C. A new productive model of circular economy enhanced by digital transformation in the Fourth Industrial Revolution-An integrated framework and real case studies. In Proceedings of the 23rd Summer School Francesco Turco, Palermo, Italy, 12–14 September 2018; pp. 221–227. [Google Scholar]
  84. Bianchini, A.; Rossi, J.; Antipodi, L. A procedure for condition-based maintenance and diagnostics of submersible well pumps through vibration monitoring. Int. J. Syst. Assur. Eng. Manag. 2018, 9, 999–1013. [Google Scholar] [CrossRef]
  85. Bianchini, A.; Pellegrini, M.; Rossi, J. Maintenance scheduling optimization for industrial centrifugal pumps. Int. J. Syst. Assur. Eng. Manag. 2019, 10, 848–860. [Google Scholar] [CrossRef]
  86. Snihur, Y.; Tarzijan, J. Managing complexity in a multi-business-model organization. Long Range Plan. 2018, 51, 50–63. [Google Scholar] [CrossRef]
  87. Guyader, H.; Piscicelli, L. Business model diversification in the sharing economy: The case of GoMore. J. Clean. Prod. 2019, 215, 1059–1069. [Google Scholar] [CrossRef]
  88. Fielt, D.E. Conceptualising Business Models: Definitions, Frameworks and Classifications. J. Bus. Models 2013, 1, 21. [Google Scholar]
  89. Havemo, E. A visual perspective on value creation: Exploring patterns in business model diagrams. Eur. Manag. J. 2018, 36, 441–452. [Google Scholar] [CrossRef]
  90. Bocken, N.M.P.; Short, S.W.; Rana, P.; Evans, S. A literature and practice review to develop sustainable business model archetypes. J. Clean. Prod. 2014, 65, 42–56. [Google Scholar] [CrossRef] [Green Version]
  91. Chaudhary, K.; Vrat, P. Circular economy model of gold recovery from cell phones using system dynamics approach: A case study of India. Environ. Dev. Sustain. Accepted. [CrossRef]
  92. Guzzo, D.; Trevisan, A.H.; Echeveste, M.; Costa, J.M.H. Circular Innovation Framework: Verifying Conceptual to Practical Decisions in Sustainability-Oriented Product-Service System Cases. Sustainability 2019, 11, 3248. [Google Scholar] [CrossRef] [Green Version]
  93. Guldmann, E. Best Practice Examples of Circular Business Models; The Danish Environmental Protection Agency: Copenhagen, Denmark, 2016; pp. 1–56. [Google Scholar]
  94. Parchomenko, A.; Nelen, D.; Gillabel, J.; Rechberger, H. Measuring the circular economy-A Multiple Correspondence Analysis of 63 metrics. J. Clean. Prod. 2019, 210, 200–216. [Google Scholar] [CrossRef]
  95. Mesa, J.; Esparragoza, I.; Maury, H. Developing a set of sustainability indicators for product families based on the circular economy model. J. Clean. Prod. 2018, 196, 1429–1442. [Google Scholar] [CrossRef]
  96. Busu, M.; Trica, C.L. Sustainability of Circular Economy Indicators and Their Impact on Economic Growth of the European Union. Sustainability 2019, 11, 5481. [Google Scholar] [CrossRef] [Green Version]
  97. Di Maio, F.; Rem, P.C.; Baldé, K.; Polder, M. Measuring resource efficiency and circular economy: A market value approach. Resour. Conserv. Recycl. 2017, 122, 163–171. [Google Scholar] [CrossRef]
  98. Huysman, S.; De Schaepmeester, J.; Ragaert, K.; Dewulf, J.; De Meester, S. Performance indicators for a circular economy: A case study on post-industrial plastic waste. Resour. Conserv. Recycl. 2017, 120, 46–54. [Google Scholar] [CrossRef]
  99. European Environmental Agency. The Circular Economy and the Bioeconomy Partners in Sustainability; European Environmental Agency: Publications Office of the European Union: Luxembourg, 2018. [Google Scholar]
  100. Leipold, S.; Petit-Boix, A. The circular economy and the bio-based sector—Perspectives of European and German stakeholders. J. Clean. Prod. 2018, 201, 1125–1137. [Google Scholar] [CrossRef]
  101. Chilamkurti, N.; Torabi, T.; Elhdad, R. Ontology-based framework for maintenance activity analysis and support: A case study for petroleum plant. Int. J. Syst. Assur. Eng. Manag. 2014, 5, 84–98. [Google Scholar] [CrossRef]
  102. Pires, A.; Martinho, G. Waste hierarchy index for circular economy in waste management. Waste Manag. 2019, 95, 298–305. [Google Scholar] [CrossRef]
  103. Sassanelli, C.; Rosa, P.; Rocca, R.; Terzi, S. Circular economy performance assessment methods: A systematic literature review. J. Clean. Prod. 2019, 229, 440–453. [Google Scholar] [CrossRef]
  104. Nogueira, A.; Ashton, W.S.; Teixeira, C. Expanding perceptions of the circular economy through design: Eight capitals as innovation lenses. Resour. Conserv. Recycl. 2019, 149, 566–576. [Google Scholar] [CrossRef]
  105. Silva, S.; Sousa Santos, B.; Madeira, J. Using color in visualization: A survey. Comput. Graph. 2011, 35, 320–333. [Google Scholar] [CrossRef]
  106. Masi, D.; Day, S.; Godsell, J. Supply Chain Configurations in the Circular Economy: A Systematic Literature Review. Sustainability 2017, 9, 1602. [Google Scholar] [CrossRef] [Green Version]
  107. Hasanaj, M.; Jansson, A. Supply Chain Management–A Way to Achieve Circular Economy. Master’s Thesis, Chalmers University of Technology, Gothenburg, Sweden, 2018. [Google Scholar]
  108. Nasir, M.H.A.; Genovese, A.; Acquaye, A.A.; Koh, S.C.L.; Yamoah, F. Comparing linear and circular supply chains: A case study from the construction industry. Int. J. Prod. Econ. 2017, 183, 443–457. [Google Scholar] [CrossRef]
  109. Hugos, M. Essentials of Supply Chain Management, 4th ed.; John Wiley & Sons Inc.: Hoboken, NJ, USA, 2018. [Google Scholar]
  110. Taghikhah, F.; Voinov, A.; Shukla, N. Extending the supply chain to address sustainability. J. Clean. Prod. 2019, 229, 652–666. [Google Scholar] [CrossRef]
  111. Mensah, A.O.; Peprah, J.; Nduro, K. Significance of actors in the maize supply chain for senior high schools in Kumasi. Eur. J. Logist. Purch. Suppl. Chain Manag. 2015, 3, 1–17. [Google Scholar]
  112. Hollins, O.; Lee, P.; Sims, E.; Bertham, O.; Symington, H.; Bell, B.; Pfaltzgraff, L.; Sjögren, P. Towards a Circular Economy–Waste Management in the EU; European Union: Brussels, Belgium, 2017. [Google Scholar]
  113. Ferrari, K.; Gamberini, R.; Rimini, B. The waste hierarchy: A strategic, tactical and operational approach for developing countries. the case study of mozambique. Int. J. SDP 2016, 11, 759–770. [Google Scholar] [CrossRef] [Green Version]
  114. DEFRA. Guidance on Applying the Waste Hierarchy. 2011. Available online: https://assets.publishing.service.gov.uk/government/uploads/system/uploads/attachment_data/file/69403/pb13530-waste-hierarchy-guidance.pdf (accessed on 21 November 2019).
  115. Hahladakis, J.N.; Iacovidou, E. Closing the loop on plastic packaging materials: What is quality and how does it affect their circularity? Sci. Total Environ. 2018, 630, 1394–1400. [Google Scholar] [CrossRef]
  116. European Commission. 2011/753/EU: Commission Decision of 18 November 2011 establishing rules and calculation methods for verifying compliance with the targets set in Article 11(2) of Directive 2008/98/EC of the European Parliament and of the Council (notified under document C (2011) 8165). Available online: https://eur-lex.europa.eu/legal-content/EN/TXT/HTML/?uri=CELEX:32011D0753&from=EN (accessed on 21 November 2019).
  117. García-Barragán, J.F.; Eyckmans, J.; Rousseau, S. Defining and Measuring the Circular Economy: A Mathematical Approach. Ecol. Econ. 2019, 157, 369–372. [Google Scholar] [CrossRef]
  118. Velenturf, A.P.M.; Archer, S.A.; Gomes, H.I.; Christgen, B.; Lag-Brotons, A.J.; Purnell, P. Circular economy and the matter of integrated resources. Sci. Total Environ. 2019, 689, 963–969. [Google Scholar] [CrossRef]
  119. Moraga, G.; Huysveld, S.; Mathieux, F.; Blengini, G.A.; Alaerts, L.; Van Acker, K.; de Meester, S.; Dewulf, J. Circular economy indicators: What do they measure? Resour. Conserv. Recycl. 2019, 146, 452–461. [Google Scholar] [CrossRef]
  120. Walmsley, T.G.; Ong, B.H.Y.; Klemeš, J.J.; Tan, R.R.; Varbanov, P.S. Circular Integration of processes, industries, and economies. Renew. Sustain. Energy Rev. 2019, 107, 507–515. [Google Scholar] [CrossRef]
  121. Pauliuk, S. Critical appraisal of the circular economy standard BS 8001:2017 and a dashboard of quantitative system indicators for its implementation in organizations. Resour. Conserv. Recycl. 2018, 129, 81–92. [Google Scholar] [CrossRef]
  122. Brunner, P.H.; Rechberger, H. Practical Handbook of Material Flow Analysis; Advanced methods in resource and waste management; CRC/Lewis: Boca Raton, FL, USA, 2004; ISBN 978-1-56670-604-9. [Google Scholar]
  123. De Wit, M.; Hoogzaad, J.; Ramkumar, S.; Friedl, H.; Douma, A. The Circularity Gap Report: An analysis of the circular state of the global economy. Circle Economy. Available online: https://www.greengrowthknowledge.org/resource/circularity-gap-report-analysis-circular-state-global-economy (accessed on 21 November 2019).
  124. Mayer, A.; Haas, W.; Wiedenhofer, D.; Krausmann, F.; Nuss, P.; Blengini, G.A. Measuring Progress towards a Circular Economy: A Monitoring Framework for Economy-wide Material Loop Closing in the EU28: Progress towards a Circular Economy in the EU28. J. Ind. Ecol. 2019, 23, 62–76. [Google Scholar] [CrossRef] [PubMed] [Green Version]
  125. Steinmann, Z.J.N.; Huijbregts, M.A.J.; Reijnders, L. How to define the quality of materials in a circular economy? Resour. Conserv. Recycl. 2019, 141, 362–363. [Google Scholar] [CrossRef]
  126. Velte, C.J.; Wilfahrt, A.; Müller, R.; Steinhilper, R. Complexity in a Life Cycle Perspective. Procedia CIRP 2017, 61, 104–109. [Google Scholar] [CrossRef]
  127. Deloitte. Global Manufacturing Competitiveness Index. Deloitte 2016. Available online: https://www.fastenernewsdesk.com/11142/global-manufacturing-competitiveness-index/ (accessed on 21 November 2019).
  128. Barragán-Escandón, A.; Terrados-Cepeda, J.; Zalamea-León, E. The Role of Renewable Energy in the Promotion of Circular Urban Metabolism. Sustainability 2017, 9, 2341. [Google Scholar] [CrossRef] [Green Version]
  129. PostEurop. GHG inventory standard for the postal sector. PostEurop 2010, 1–91. [Google Scholar]
  130. Robinson, S. Social circular economy. Oppor. People Planet Profit 2017, 1–44. [Google Scholar]
  131. Silva, S.; Madeira, J.; Santos, B.S. There is More to Color Scales than Meets the Eye: A Review on the Use of Color in Visualization. In Proceedings of the 11th International Conference Information Visualization (IV ’07), Zurich, Switzerland, 4–6 July 2007; pp. 943–950. [Google Scholar]
  132. Bovea, M.D.; Pérez-Belis, V. Identifying design guidelines to meet the circular economy principles: A case study on electric and electronic equipment. J. Environ. Manag. 2018, 228, 483–494. [Google Scholar] [CrossRef]
  133. De Jabbour, A.B.L.S.; Luiz, J.V.R.; Rojas, O.; Luiz, R.C.; Jabbour, C.J.C.; Ndubisi, N.O.; De Oliveira, J.H.C.; Junior, H.F. Circular economy business models and operations management. J. Clean. Prod. 2019, 235, 1525–1539. [Google Scholar]
  134. Halstenberg, F.A.; Lindow, K.; Stark, R. Leveraging Circular Economy through a Methodology for Smart Service Systems Engineering. Sustainability 2019, 11, 3517. [Google Scholar] [CrossRef] [Green Version]
  135. Baptista, A.J.; Peixoto, D.; Ferreira, A.D.; Pereira, J.P. Lean Design-for-X Methodology: Integrating Modular Design, Structural Optimization and Ecodesign in a Machine Tool Case Study. Procedia CIRP 2018, 69, 722–727. [Google Scholar] [CrossRef]
  136. Arnette, A.N.; Brewer, B.L.; Choal, T. Design for sustainability (DFS): The intersection of supply chain and environment. J. Clean. Prod. 2014, 83, 374–390. [Google Scholar] [CrossRef]
  137. Gebisa, A.W.; Lemu, H.G. Design for manufacturing to design for Additive Manufacturing: Analysis of implications for design optimality and product sustainability. Procedia Manuf. 2017, 13, 724–731. [Google Scholar] [CrossRef]
  138. Pålsson, H.; Pettersson, F.; Winslott Hiselius, L. Energy consumption in e-commerce versus conventional trade channels - Insights into packaging, the last mile, unsold products and product returns. J. Clean. Prod. 2017, 164, 765–778. [Google Scholar] [CrossRef]
  139. Smidfelt Rosqvist, L.; Winslott Hiselius, L. Online shopping habits and the potential for reductions in carbon dioxide emissions from passenger transport. J. Clean. Prod. 2016, 131, 163–169. [Google Scholar] [CrossRef]
  140. Todeschini, B.V.; Cortimiglia, M.N.; Callegaro-de-Menezes, D.; Ghezzi, A. Innovative and sustainable business models in the fashion industry: Entrepreneurial drivers, opportunities, and challenges. Bus. Horiz. 2017, 60, 759–770. [Google Scholar] [CrossRef]
  141. Schaefer, D.; Cheung, W.M. Smart Packaging: Opportunities and Challenges. Procedia CIRP 2018, 72, 1022–1027. [Google Scholar] [CrossRef]
  142. Camacho-Otero, J.; Boks, C.; Pettersen, I.N. User acceptance and adoption of circular offerings in the fashion sector: Insights from user-generated online reviews. J. Clean. Prod. 2019, 231, 928–939. [Google Scholar] [CrossRef]
  143. Romero, D.; Noran, O. Towards Green Sensing Virtual Enterprises: Interconnected Sensing Enterprises, Intelligent Assets and Smart Products in the Cyber-Physical Circular Economy. IFAC-Pap. 2017, 50, 11719–11724. [Google Scholar] [CrossRef] [Green Version]
  144. Ford, S.; Despeisse, M. Additive manufacturing and sustainability: An exploratory study of the advantages and challenges. J. Clean. Prod. 2016, 137, 1573–1587. [Google Scholar] [CrossRef]
  145. Global Footprint Network. Global Footprint Network annual report 2013. Glob. Footpr. Netw. 2013, 1–276. Available online: https://www.footprintnetwork.org/content/images/article_uploads/GFN_AR_2013_final.pdf (accessed on 21 November 2019).
  146. Farjana, S.H.; Huda, N.; Parvez Mahmud, M.A.; Saidur, R. A review on the impact of mining and mineral processing industries through life cycle assessment. J. Clean. Prod. 2019, 231, 1200–1217. [Google Scholar] [CrossRef]
  147. Turner, C.; Moreno, M.; Mondini, L.; Salonitis, K.; Charnley, F.; Tiwari, A.; Hutabarat, W. Sustainable Production in a Circular Economy: A Business Model for Re-Distributed Manufacturing. Sustainability 2019, 11, 4291. [Google Scholar] [CrossRef] [Green Version]
  148. Urbinati, A.; Chiaroni, D.; Toletti, G. Managing the Introduction of Circular Products: Evidence from the Beverage Industry. Sustainability 2019, 11, 3650. [Google Scholar] [CrossRef] [Green Version]
Figure 1. Adapted by Authors from EMA Foundation CE diagram that illustrates the biological and technical material cycle (in the upper part) and the underlying circular patterns that can create more value from resources [55].
Sustainability 11 06614 g001
Figure 2. Adapted by Authors from Accenture CE diagram that illustrates the full circle proposed by the consulting Company to turn waste into value within the supply chain. Adapted from Source: [56].
Sustainability 11 06614 g002
Figure 3. Adapted by Authors from MoonFish CE diagram, with the infinity structure, inspired by Osterwalder & Pigneur’s Business Model Canvas [62] and the Ellen MacArthur Foundation’s Butterfly model [57].
Sustainability 11 06614 g003
Figure 4. Adapted by Authors from EIT Raw Materials CE diagram, used to explain the challenge to design products and services to obtain the closing of material loops. Adapted from Source: [58].
Sustainability 11 06614 g004
Figure 5. Reike’s CBM archetype, based on the mapping of the CE Retention Options to close the loops. Source: [59].
Sustainability 11 06614 g005
Figure 6. Flowchart of the methodology used in this study.
Sustainability 11 06614 g006
Figure 7. Gap analysis on available CBM visualization tools: a score (0, 0.5 or 1) is given to evaluate how each model fits the six identified characteristics. The total score is the sum of the single scores.
Sustainability 11 06614 g007
Figure 8. Flowchart of the quantification methods used in this study.
Sustainability 11 06614 g008
Figure 9. Representation of a generic stage according to the new proposed CE visualization tool, where material flow analysis (MFA) and Sankey diagram concepts are combined to obtain a quantification of the process and the circular initiatives (divided into arrows for the input and output flows). The width of the rectangular box and of each arrow is proportional to the real flow. The quantitative value of the indicators is symbolic since further analysis is necessary for their precise quantification.
Sustainability 11 06614 g009
Figure 10. The new visualization tool applied to the whole supply chain of a technical material. The diagram quantifies the resource flows in two cases: the extreme linear business model (upper part of the figure) and the extreme circular one (lower part). The main circular initiatives are introduced in the CE model to highlight the potential opportunities in the supply chain. Some KPIs, as described in Section 2.3.3, are also inserted in the graph to compare the two situations. The quantitative value of the indicators is symbolic since further analysis is necessary for their precise quantification.
Sustainability 11 06614 g010
Table 1. Categorization of the main internal and external barriers that limit the practical implementation of Circular Business Models.
Barrier CategoryChallenges
Internal Process [23,27,28]
  • Organizational capabilities necessary for implementing circular business across different organizational functions;
  • efforts in terms of business strategy definition and company structure;
  • need for new organizational competences (e.g., team motivation, organizational culture, participation…).
Technical [24,29,30,31,32,33]
  • Need for technical and technological know-how and expertise;
  • adoption of specific technologies (e.g., recycling technologies) for the redesign of circular products and production systems maintaining the same quality level;
  • development of methodologies and procedures for dissemination of innovation without excessive delay between design and diffusion phases.
Market [21,29,34,35]
  • Stakeholder relationship: compatibility with partner business models; lack of supply network support; geographical dispersion, poor services and infrastructures, conflict of interest within companies and misaligned profit-share along supply chain;
  • customer acceptance: specific restrictions, rigidity in customer behaviours and business routines.
Institutional, regulatory and social [32]
  • Misaligned incentives;
  • complexity of regulations, lacking conducive legal system and poor institutional framework.
Economic and financial [29,31]
  • Need for high long-term investments;
  • costly management and planning processes due to more complex practices.
Table 2. The concepts of the Circular Economy according to the Ellen MacArthur Foundation. Source: [55].
PrincipleDescription
Design out wasteBiological and technical materials must be designed by intention to be returned to the ecosystem (biological) or recovered, refreshed and upgraded (technical) → no waste.
Build resilience through diversityProduction systems must be flexible thanks to some characteristics such as modularity, versatility and adaptivity for the use of several different inputs.
Shift to renewable energy sourcesRenewable energies will be able to feed all the systems since the threshold energy levels will be reduced by a restorative, circular economy.
Think in systemEffectiveness of the global system overcome the efficiency optimization of a single part, in order to make the elements less vulnerable to unpredictable changing circumstances.
Think in cascadesExtracting values from resources to use them in other applications at a different level.
Table 3. Five underlying models that characterize the Circular Economy according to Accenture. Source: [56].
Underlying Business ModelDescription
Circular suppliesReplacement of single-life and scarce inputs with renewable, bio-based or fully recyclable resources./Removal of inefficiencies with an increased cutting of waste.
Resource recoveryRecovery of the value of products and by-products to supply other cycles: recycling and new technologies to transform waste in new resources, with the same or greater value.
Product life extensionThe value of waste is maintained and improved by repairing, upgrading, remanufacturing or remarketing products.
Sharing platformsCollaboration among consumers (individuals or organizations) to share products, reducing their underutilization and improving their productivity.
Product-as-a-serviceThis is an alternative to the classic product purchase: the products are paid for according to their use and can be used by several consumers.
Table 4. Four cycles defined by MoonFish that embed the value of the Circular Economy. Source: [57].
CycleDescription
MaintenanceIt is a service offered by the producers to implement the inner cycle.
Re-sellingIt acts when a product can be used again for the same purpose, limiting its enhancement or change.
Refurbishing/RemanufacturingIt is applied to a non-working product to restore its good operating conditions.
It is applied in components in good conditions to build new products.
RecyclingIt consists of the reincorporation of used-up products into the cycle in the form of input material.
Table 5. Identification of the characteristics that were addressed by the tools to be inserted in the CBM visualization tool.
ToolC1C2C3C4C5C6
Supply chain structureXX XX
Waste hierarchyXXX X
Quantification methods: MFA + Sankey Model + circular KPIsX X
Color codeX X
Design for X X
Digitalization and intelligent assets X
Table 6. Typical stages present in a generic supply chain: resource inputs and outputs and description of the main activities are explained. Source: [1,110,111,112].
Supply Chain StageCore ActivitiesInput FlowOutput FlowLeakages
ManufacturingTransformation processRaw materialsComponents/parts; bio-based productRejects; non-compliance
AssemblingAssembling of n parts into a final productComponents/partsFinal products; waste/wastageDamaged/wrong parts
Distribution & SalesStoring inventoryFinal products; bio-based productsSold final products (including bio-based)Unsold, damaged, waste products
UseUse and consumption of final productsFinal products; bio-based productsEnd-of-life final products and wasteUnexploited or not consumed products
MaintenanceRestoring initial conditions of productsEnd-of-life products Restored products, parts and materialsUnrecoverable/damaged products and materials
Collection, Recycling and Energy recoveryReprocessed materials with low propertiesEnd-of-life products and wasteMaterials and energy Unrecoverable waste/wastage
Table 7. Possible resource flows outgoing from each stage of the supply chain, according to waste hierarchy, starting from the most valuable option. Source: [115,116,117].
Output FlowsDescription
Final productIt derives from the transformation process of the input resources for its sale. It is the greatest flow and can improve with process optimization, which corresponds to the waste management option of reduction.
Reused resourcePart of resources discarded during production process and directly reused for its original purpose with the smallest efforts (checking and cleaning). It corresponds to the inner circle.
Recycled resourcePart of waste that cannot be reused maintaining its primary purpose, but still has a value that can be converted through a recycling process, with fewer properties than the initial materials.
Recovered resourceIt corresponds to the part of the waste that can be used for: (i) energy production; (ii) backfilling operations. These options do not exploit the entire value of the waste.
DisposalThe least valuable flow is the part of waste that is sent to landfill or to incinerators. It consists of the unavoidable leakages, which necessarily require the introduction of new raw materials.
Table 8. Possible resource flows incoming at each stage of the supply chain, starting from the least valuable option. Source: [118,119].
Input FlowsDescription
Raw materialsIt corresponds to the flow derived directly from the production of primary resources, which encompasses the extraction of natural resources from the environment. This flow involves the use of new resources and great efforts (costs, labor, energy and resources).
Secondary raw materialIt includes the resources deriving from the reuse and recycling of ‘waste’ flows and typically require regeneration or re-processing. Secondary raw materials require fewer efforts than the corresponding extraction of primary raw materials.
Flow from maintenance, reuse/redistribution and refurbishing/remanufacturingIt consists of flow derived from downstream stages after the restoring of the initial conditions. The original purpose is maintained without further transformation process and additional efforts. This flow is the most valuable.
Table 9. Approaches based on design for X that can have a positive effect on circular economy transition: a description of the main features and their effects are explained. Source: [136,137,138].
Design for XDescriptionEffect
Manufacturing (and/or assembling)
  • Reduction of the total number of parts;
  • increase of standard, modular and multi-function components;
  • ease of fabrication;
  • minimization of assembly directions and handling operations.
Avoiding errors in advance, reducing damages during transformation, minimizing wastage
→ Reduction of waste to landfill
Logistics
  • Economic packaging and transportation: ease of shipping and shelving; ease of packing and tracking;
  • standardization of product and packaging size;
  • concurrent/parallel processing.
Reduction in number of components ordered, shipped and stored and of emissions associated with transports. Reusing of the same packaging material.
Durability
  • Selection of proper materials for a great resistance to wear;
  • optimization of process operating conditions to obtain and maintain the appropriate technical features;
  • ensuring easy repair and updating of components.
Extension of product life-cycle.
Avoiding the replacement of old components with new parts.
Disassembly
  • Easily, rapidly and cost-effectively disassembling products;
  • Smart materials (e.g., self-disassembly at specific temperatures; shape memory polymers).
Greater effectiveness of maintenance; maximizing of resource recovery; replacement of only faulty parts.
Table 10. Tools and technologies typical of the Fourth Industrial Revolution that can have a positive effect on circular economy transition: a description of the main features and their effects are explained. Source: [47,143,144,145].
Digital/Intelligent AssetDescriptionEffect
Virtualization of products and processesReplacement of physical products with virtual services: e.g., digital books, documents (manuals, industry reports), courses and professional service.Dematerialization, reduction of resources necessary to manufacture the corresponding physical products and reduction of travel.
E-commerceIt avoids time and travel to search for the desired products and/or to compare price; it centralizes order processing, reducing overproduction.It dematerializes travel and emissions and avoid efforts (costs, resources, time, energy) for unsold products.
Smart and active packagingSmart packaging: information to preserve/use products.
Active packaging: monitoring of internal conditions (oxygen, temperature) to extend product duration.
Complete traceability of materials and products, before and after sales (location, condition and availability of resources).
Software for process optimizationSophisticated algorithms to control process parameters in real-time, balance quantity and quality of raw materials. Process productivity improvement and reduction in consumption and waste.
3D-printing/Rapid PrototypingComplex geometries and/or with light-weight and high-level properties. Very small batches of production and a high level of customization for products and services.Reduction of material underutilization and wastage and energy consumption typical of traditional shaving removal technologies.
Predictive maintenanceEvaluation of actual condition of assets, failures and remaining life-time estimation, downtime reduction, productivity and product quality improvement.Extension of asset life, acting only when needed, replacing only faulty components at the end of their life.
Table 11. Summary of the circular initiatives (both in input and output), approaches such as design for X and implementation of digitalization and intelligent subdivided for each stage of the supply chain. Source: [1,75,148].
StageTool
Circular InitiativesDesign for XDigitalization and Intelligent Assets
Input FlowsOutput Flows
Use
  • Sharing platform.
  • Regenerated products.
  • Sharing platform;
  • Pay-per-use.
Durability
  • Virtual product and process;
  • e-commerce.
Distribution & sales
  • Pay-per-use;
  • Regenerated products.
  • Redistribution of unsold good products.
Logistics
  • Smart and active packaging;
  • Traceability after sales/Data about consumer interests.
Manufacturing
  • Wastage recovery.
  • Materials with high properties.
  • Recycled materials with lower properties.
  • Wastage recovery.
Manufacturing
  • Advanced software for process optimization.
  • 3D-printing.
Assembling
  • Return of parts/components in good conditions.
  • Recovery of materials with high-level properties.
Assembling
  • Advanced software for process optimization.
  • 3D-printing.
Maintenance
  • Regenerated products.
  • Recovered components in good conditions.
  • Recovery of materials with high properties.
Disassembly Predictive maintenance with artificial intelligence.
Recycling and energy recovery
  • Recycled materials with low-level properties.
  • Energy recovery.
Advanced technology (e.g., robots) for waste sorting.

