Urban Function as a New Perspective for Adaptive Street Quality Assessment
by
 ,
,
Feng Hu
1,2, 
Wei Liu
1,
Junyu Lu
1,
Chengpeng Song
1,
Yuan Meng
3,* ,
,
Jun Wang
4 and
Hanfa Xing
4,5,* 1
Guangzhou Urban Planning and Design Survey Research Institute, Guangzhou 510060, China
2
Department of Landscape Architecture, School of Architecture, South China University of Technology, Guangzhou 510641, China
3
Department of Land Surveying and Geo-Informatics, The Hong Kong Polytechnic University, 181 Chatham Road South, Kowloon, Hong Kong, China
4
College of Geography and Environment, Shandong Normal University, Jinan 250300, China
5
School of Geography, South China Normal University, Guangzhou 510631, China
*
Authors to whom correspondence should be addressed.
Sustainability 2020, 12(4), 1296; https://0-doi-org.brum.beds.ac.uk/10.3390/su12041296
Submission received: 15 December 2019
/
Revised: 16 January 2020
/
Accepted: 8 February 2020
/
Published: 11 February 2020
Abstract
:Street networks are considered to be one significant component of urban structures that serve various urban functions. Assessing the quality of each street is important for managing natural and public resources, organizing urban morphologies and improving city vitality. While current research focuses on particular street assessment indices, such as accessibility and connectivity, they ignore biases in street assessment caused by differences in urban functions. To address this issue, an adaptive approach to assessing street quality from the perspective of the variation in urban functions is proposed. First, an adaptive urban function detection model is established, with street-level element segmenting using PSPNet and semantic urban function extraction using LDA topic modelling. On this basis, an urban function-driven street quality assessment is proposed to adaptively evaluate multilevel urban streets. Taking Tianhe District in Guangzhou, Guangdong Province, as the study area, experiments using street view images and points of interest (POIs) are applied to validate the proposed approach. The experiment results in a model for adaptive urban function detection with an overall accuracy of 64.3%, showing that streets with different urban functions, including traffic, commercial, and residential functions, can be assessed. The experimental results can facilitate urban function organization and urban land-use planning.
1. Introduction
Street networks are considered to be one significant component of urban structures and serve different urban functions for sustainable development, including commercial, traffic, industry and landscape-based functions [1,2,3]. Assessing the quality of each street is important for managing natural and public resources, organizing urban morphologies and improving city vitality [4,5,6].
Traditional approaches to assessing street quality are by means of analyzing walking behaviors using questionnaire surveys, which ask pedestrians for detailed respondents [7,8]. The rise of geographic information science and big geodata has brought new opportunities for understanding spatial configurations along streets [9]. Compared with conventional data sources, big geodata presents the advantages of being freely obtainable and continuously updated, and it contains sufficient physical and socioeconomic information describing urban environments [10]. For example, street view images, referring to the photographs captured along streets, show the potential to describe urban environments from the perspective of human vision [11,12]. In addition, point of interest (POI) data are locations posted on the Internet for a specific place and directly represent its functions and services for citizens [13,14,15].
Current studies have utilized different big geodata to assess street networks from different perspectives [16,17,18]. For instance, Long and Liu [19] evaluated street greenery by proposing an automatic method to detect greenery from street view images. This finding can improve urban planning and engineering practices for street greenery. Zhang, Wu, Zhu, and Liu [11] demonstrated the potential to use street view images in uncovering spatiotemporal urban mobility patterns, providing an opportunity to infer fine-scale street-level human activities. Shen and Karimi [20] utilized social media check-in data to characterize urban streets with land-use connectivity indices. This research enriches the current description of street networks and enhances the evaluation of street network performance.
For street quality assessment, much literature has verified the usability of big geodata. From the perspective of traffic condition, Zhao et al. [21] analyzed theories and methods of traffic demand forecasting using bus card data and mobile phone data. Zhou and Murphy [22] used smart card data to evaluate commuting patterns. In addition, Huang et al. [23] explored the interaction between traffic condition and human activities that are represented by social media data. From the perspective of built environment along streets, Estupiñán and Rodríguez [24] found that urban forms and bus transit demand are highly related. Moreover, An et al. [25] utilized POI data to identify the physical environmental factors that affect metro ridership.
However, limitations to assessing street quality using big geodata still exist. On the one hand, these studies have discussed greenery, mobility patterns, and land-use connectivity but ignored the different urban functions that each type of street serves. Second, current approaches to assessing street quality are static indices to fit all streets. On the other hand, considering that individual streets may serve different functions, these indices can lead to biases with regard to detecting multiple functions. For example, business streets should be assessed by not only traffic conditions, but also by commercial functions. In a word, the assessment of the street quality should fit adaptiveness with regard to various urban functions.
In fact, utilizing multisourced big geodata, current studies have investigated urban functions in various fields. For parcel-level functions, Yuan et al. [26] conducted an urban function parcel detection framework using human mobility data and POIs from the spatial and semantic perspective. Research proposed by Tu et al. [27], Ríos and Muñoz [28] analyzed the temporal changes of human activities within urban function parcels. For street-level units, Zhang et al. [29] discussed the concept of places from the human perception perspective. Middel et al. [30] described urban form composed by street canyons using deep learning. Despite different spatial units, the detection of urban functions in most research is static, and thus fail to fit the adaptiveness of urban functions.
Faced with these challenges, we propose an adaptive street quality assessment approach from the perspective of urban function. To identify different urban functions that streets serve, we utilize street view images and POIs for automatic detection including commercial, residential and traffic functions. Despite the fact that traffic function cannot be considered as traditional ones such as residential and public services, it serves as the basic element in the road networks, and thus should be involved in street-level urban functions. To fit the adaptiveness of various urban functions, we assess street quality using the urban function weight and urban function indicators based on POIs and street view. On this basis, a field survey is considered to validate the proposed assessment method. The contributions of this research are listed as follows:
- Street view image segmentation is proposed using the pyramid scene parsing network (PSPNet) to delineate physical characteristics of street networks.
- A semantic urban function extraction approach is proposed using the Latent Dirichlet allocation (LDA) topic model with POI data to extract socioeconomic information.
- Automatic urban function classification is proposed using a multilayer perceptron (MLP) model.
- A function-driven street quality assessment model is established to fit the adaptiveness of urban function variation.
The remainder of this paper is organized as follows. Section 2 introduces the study area and experimental data used in this study. Section 3 illustrates the urban function-driven adaptive street quality assessment approach. Section 4 displays the results of street quality assessment in the study area. It is followed by Section 5, which discusses the quality of street view images, the descriptions of street-level urban functions, and the disadvantages of the proposed adaptive street quality assessment approach. Section 6 concludes this study.
2. Study Area and Data
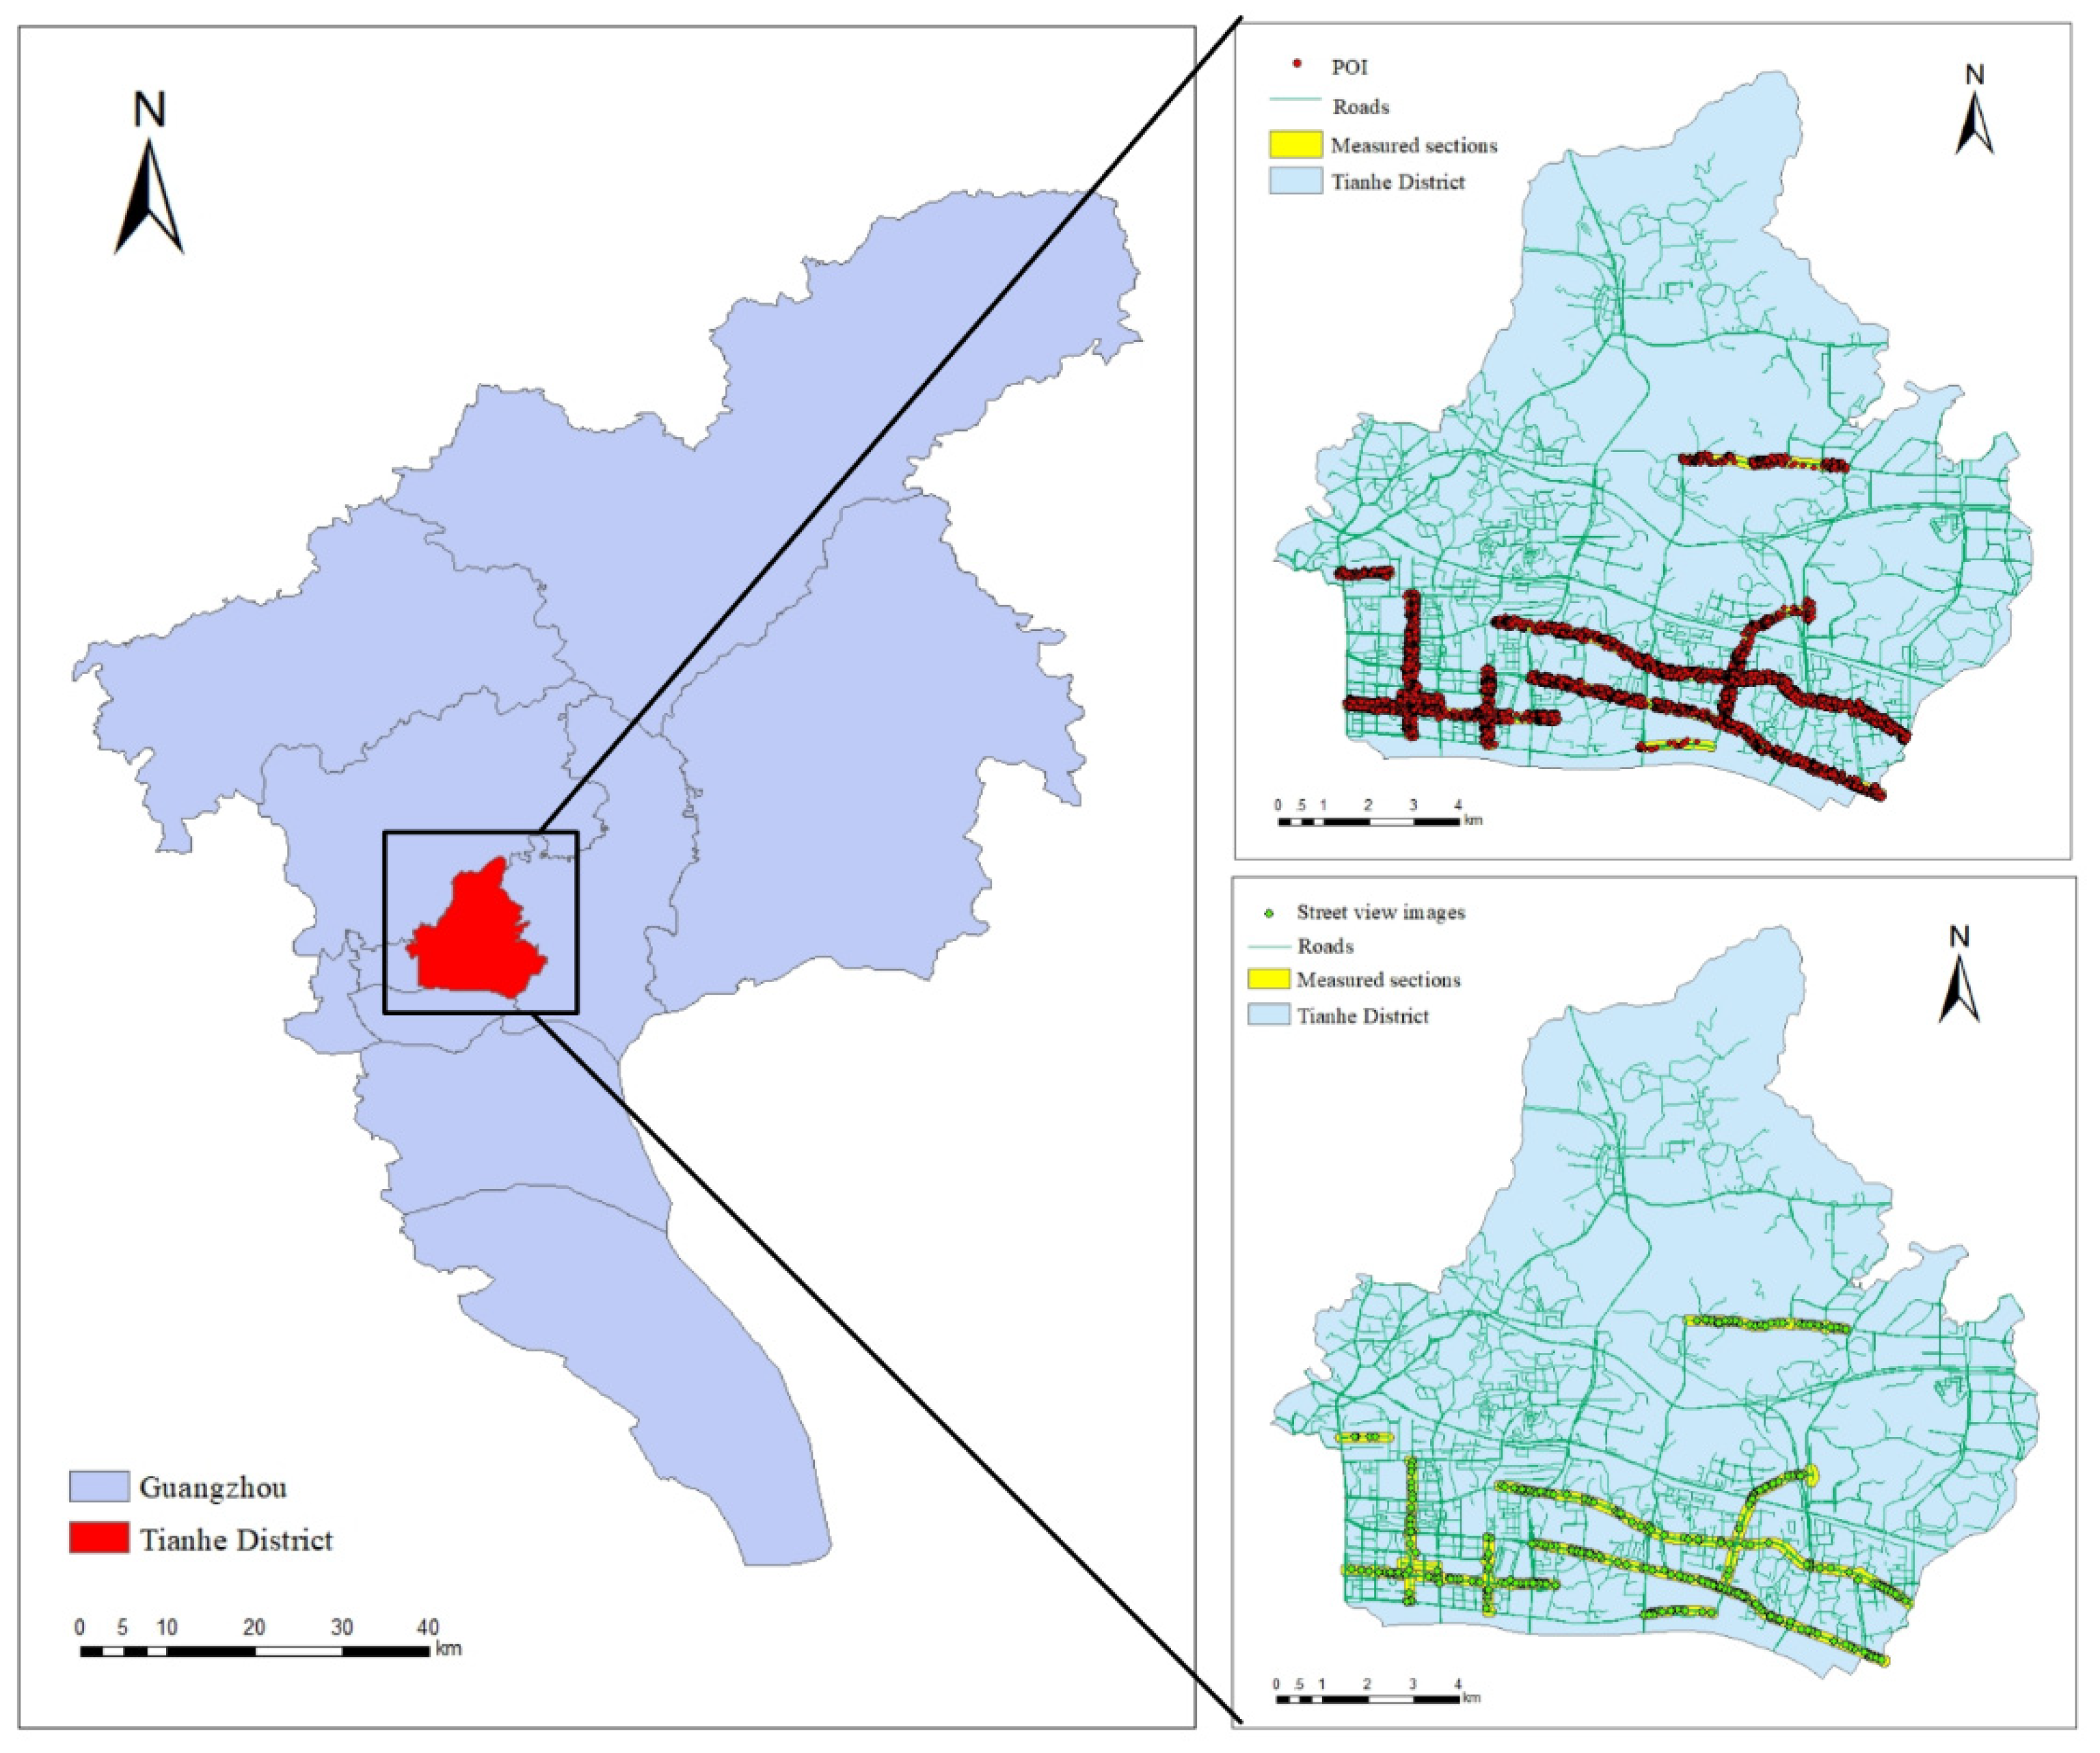
Taking Tianhe District in Guangzhou, Guangdong Province, as the study area, experiments are applied to validate the proposed approach. As shown in Figure 1, Tianhe District is the central area of Guangzhou. The traffic resources in the area are concentrated, and there are multilevel urban traffic systems such as subways, bus rapid transit (BRT) and railway stations. However, the unbalanced development of roads still exists in this area.
The datasets for adaptive street quality assessment include 21 selected road sections. On the street view, the street view locations are determined with a distance of 100 meters along selected road sections. Specifically, images from four headings are collected in each location, including 90°, 180°, 270°, and 360°. The POIs are distributed within 100 m of the selected road. As a result, 1604 street view images from Baidu Maps and 32,273 POIs from AutoNavi are collected, with the spatial distribution shown in Figure 1.
It should be noted that the street view image and POIs were all collected in 2017. Considering the rapid development of cities, this time consistency ensures the accuracy of and confidence in this research.
3. Adaptive Street Quality Assessment
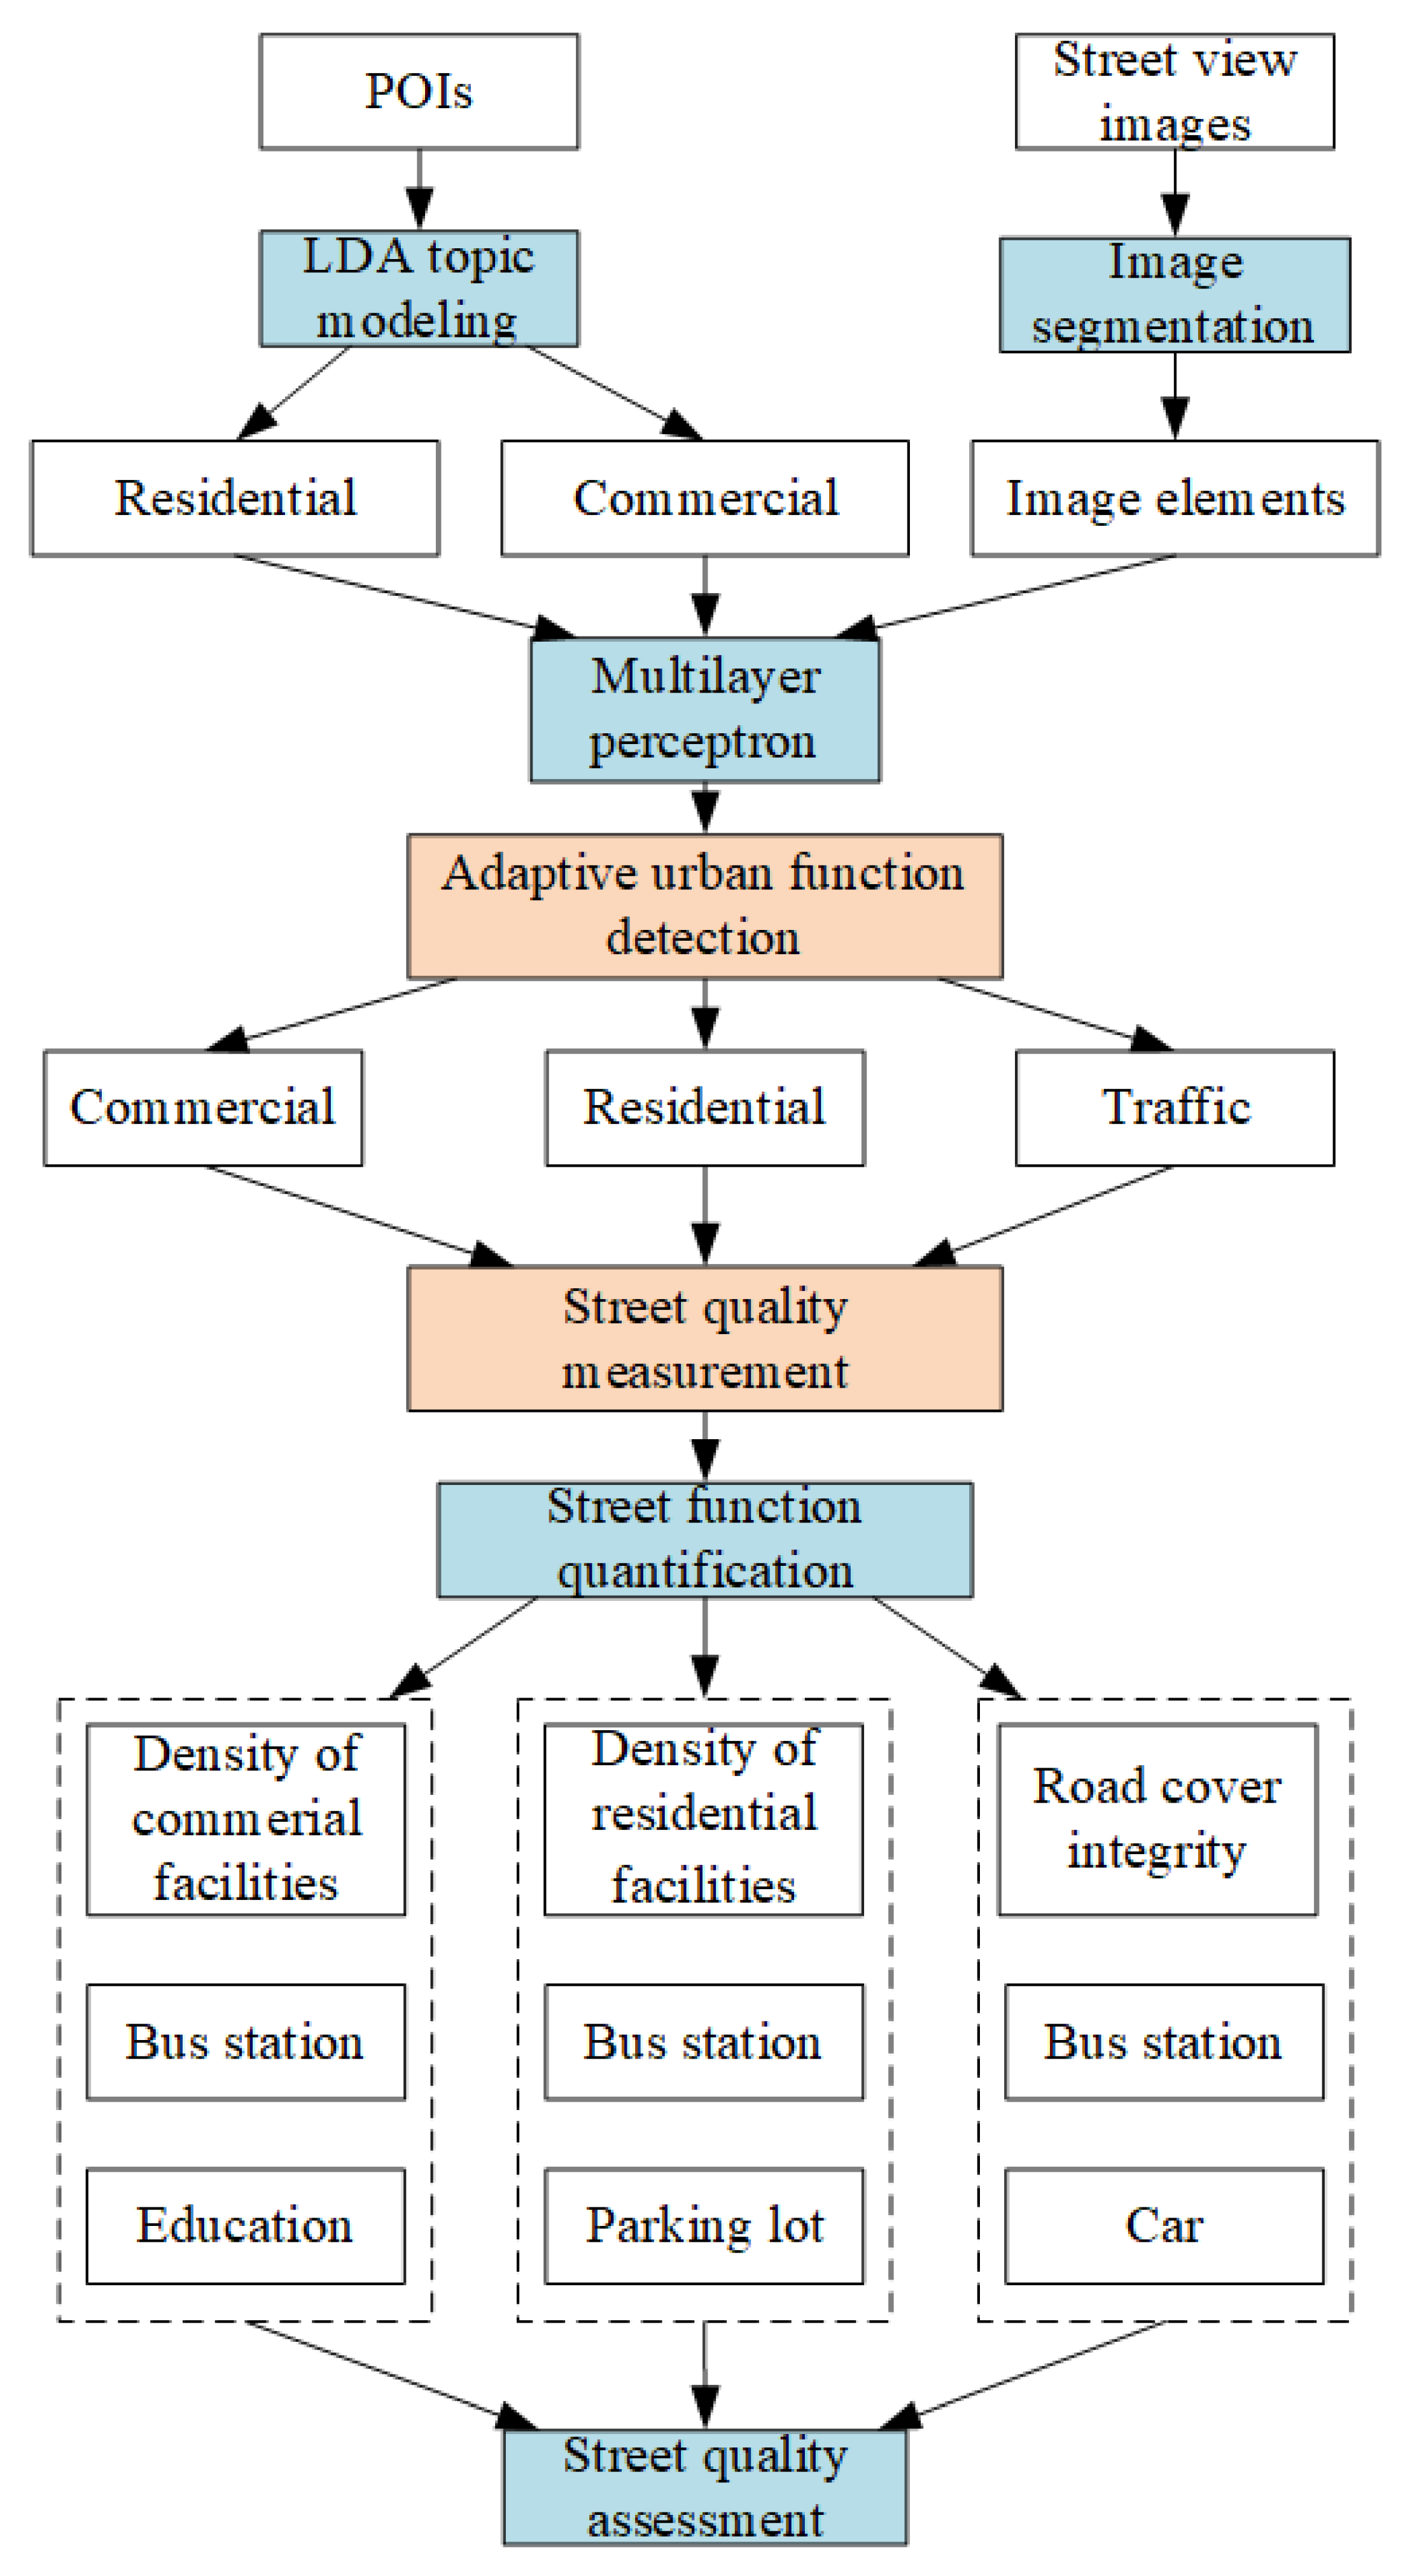
The framework of adaptive urban street quality assessment is divided into two steps displayed in Figure 2. In the first step, we utilize POIs and street view images to adaptively detect urban function. In particular, we use the LDA model and image segmentation to extract POIs’ urban function and the elements of street view images. Then, we train a multilayer perceptron for adaptive urban function detection using these indicators. In the second step, we build street-level urban function quantification indicators for different urban functions. Then, we determine the weight for different urban functions by analytic hierarchy process (AHP). Finally, we assess street quality using the urban function weight and urban function indicators. In particular, the first step focuses on classifying street-level urban functions, which forms the basis of adaptive assessment. The second step utilizes the classification of urban functions in the first step, and further proposes strategies on street quality description and weighting.
3.1. Urban Function Detection
Street-level urban functions contain both physical characteristics and socioeconomic information that serve human activities [10]. Here, street view image segmentation is proposed to delineate physical characteristics (3.1.1), while semantic function extraction is utilized for socioeconomic information (Section 3.1.2).
3.1.1. Street View Image Segmentation Using PSPNet
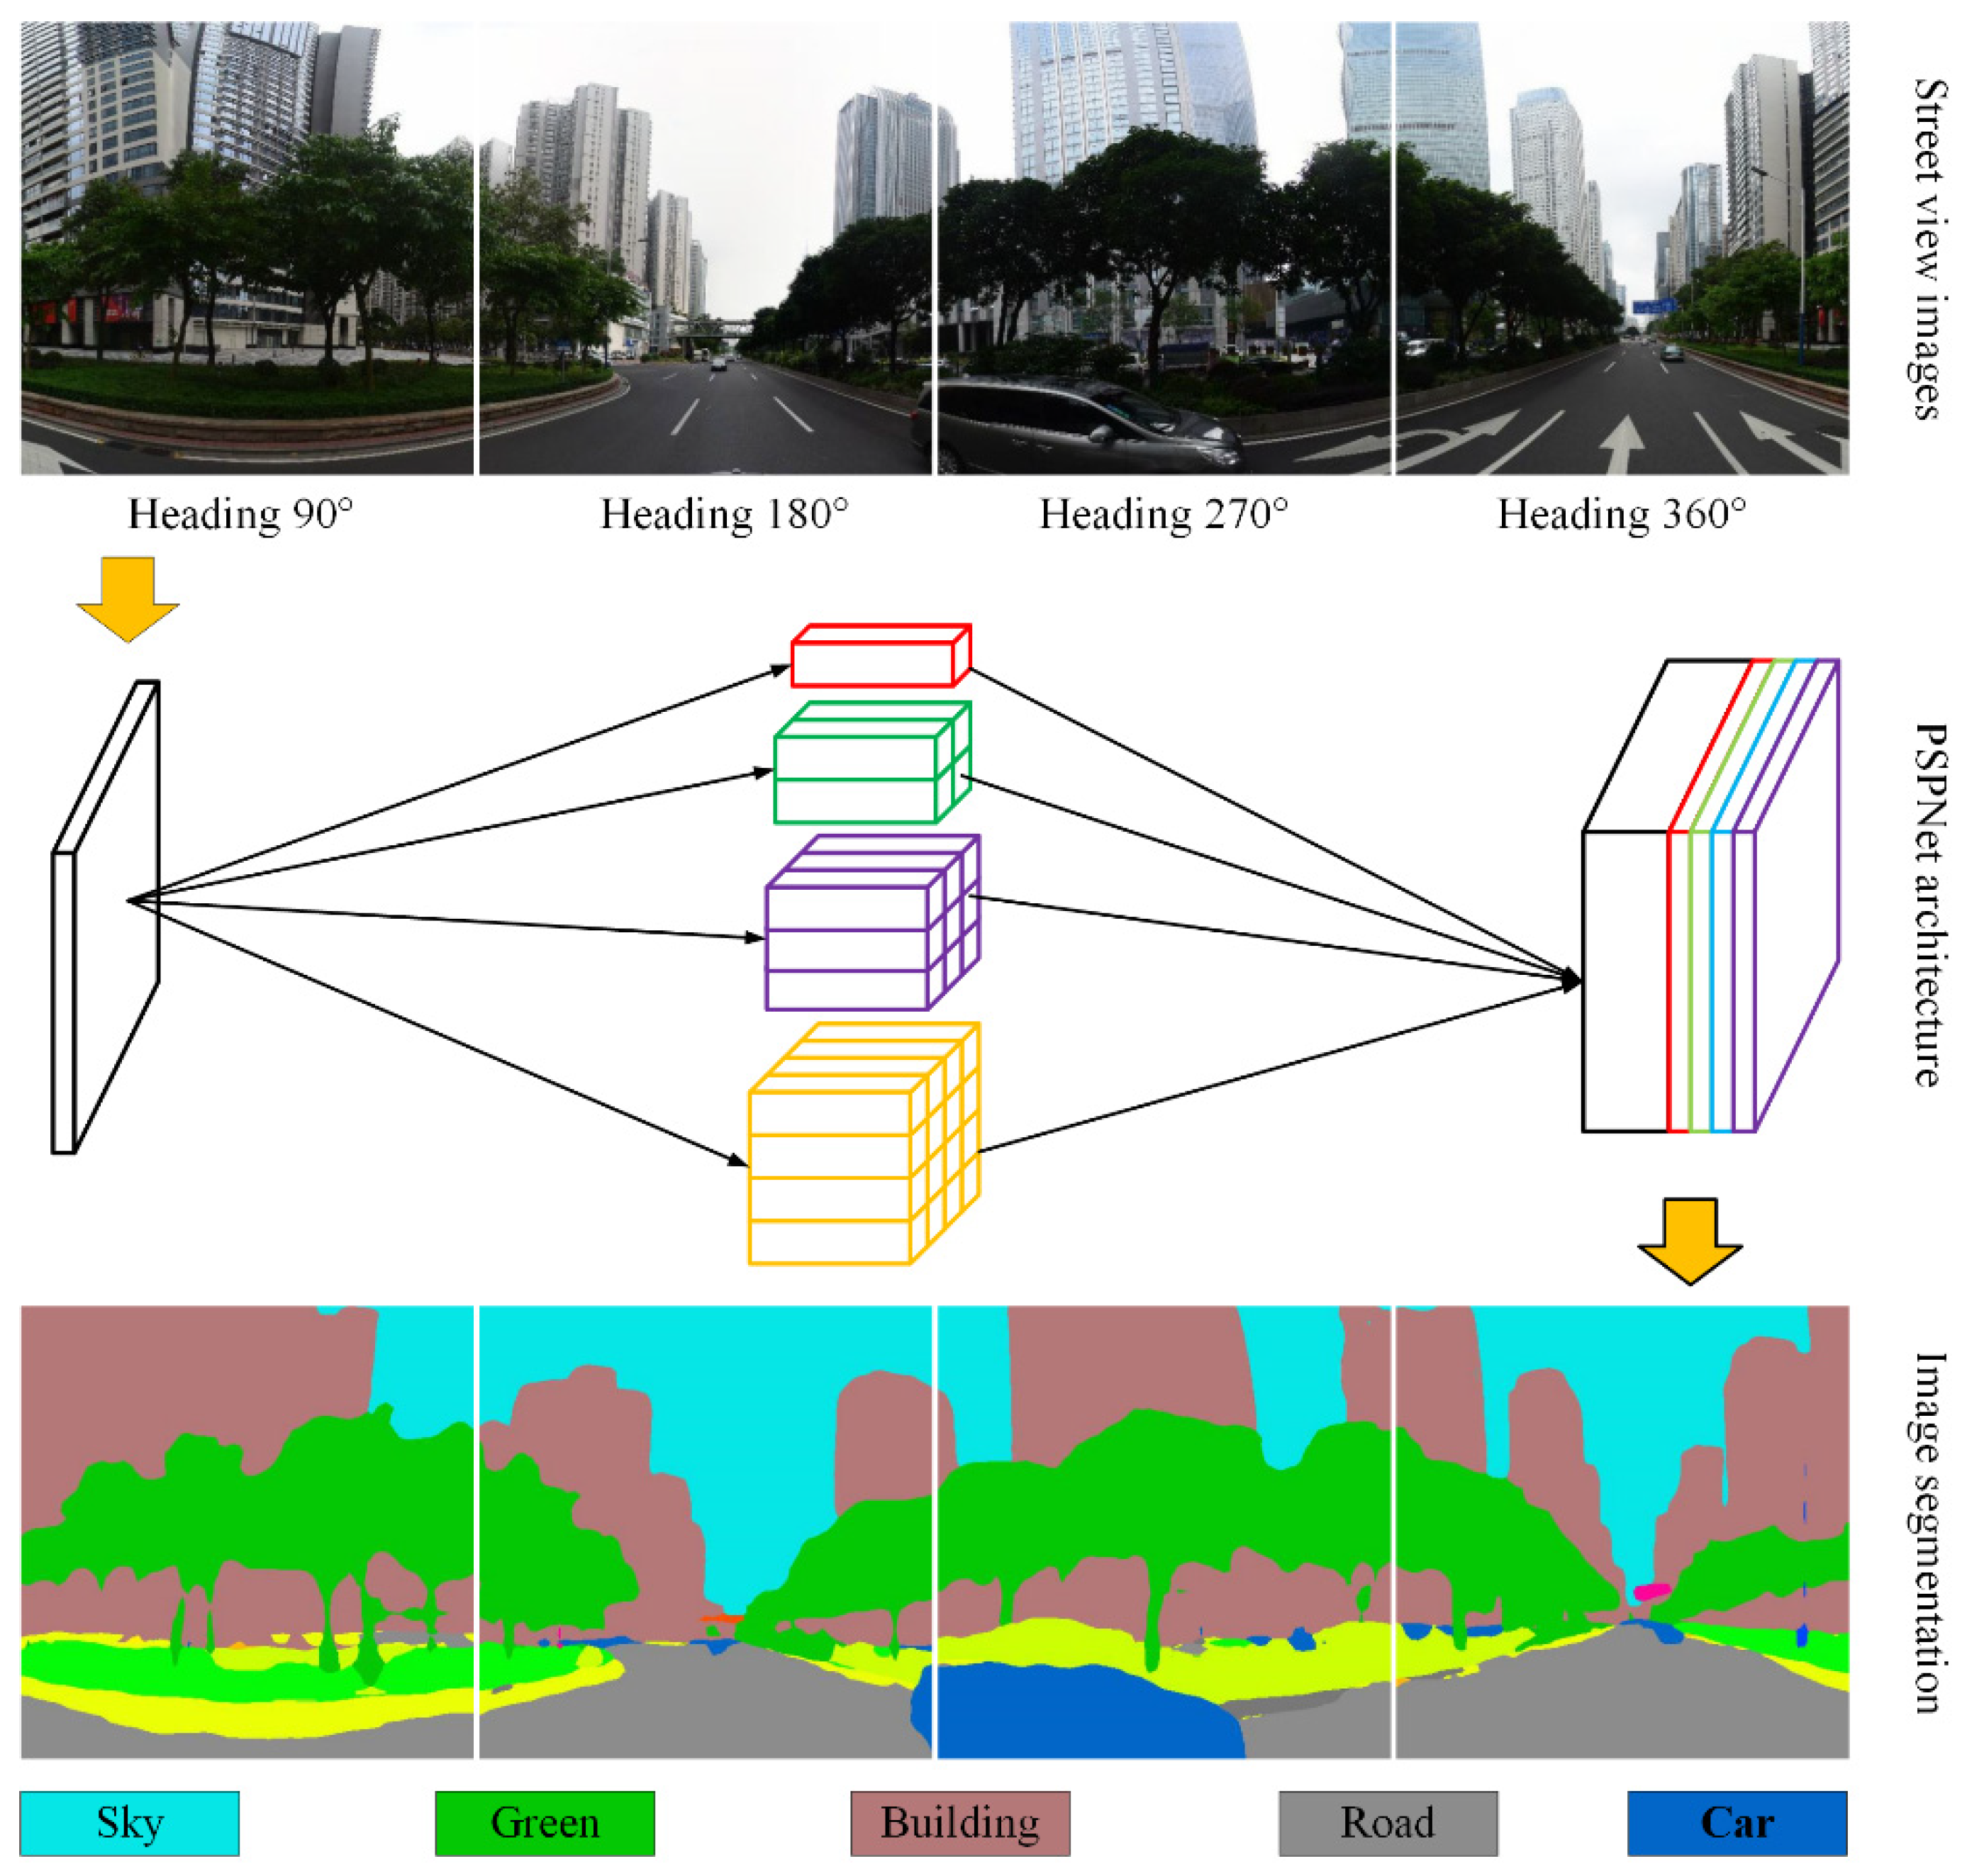
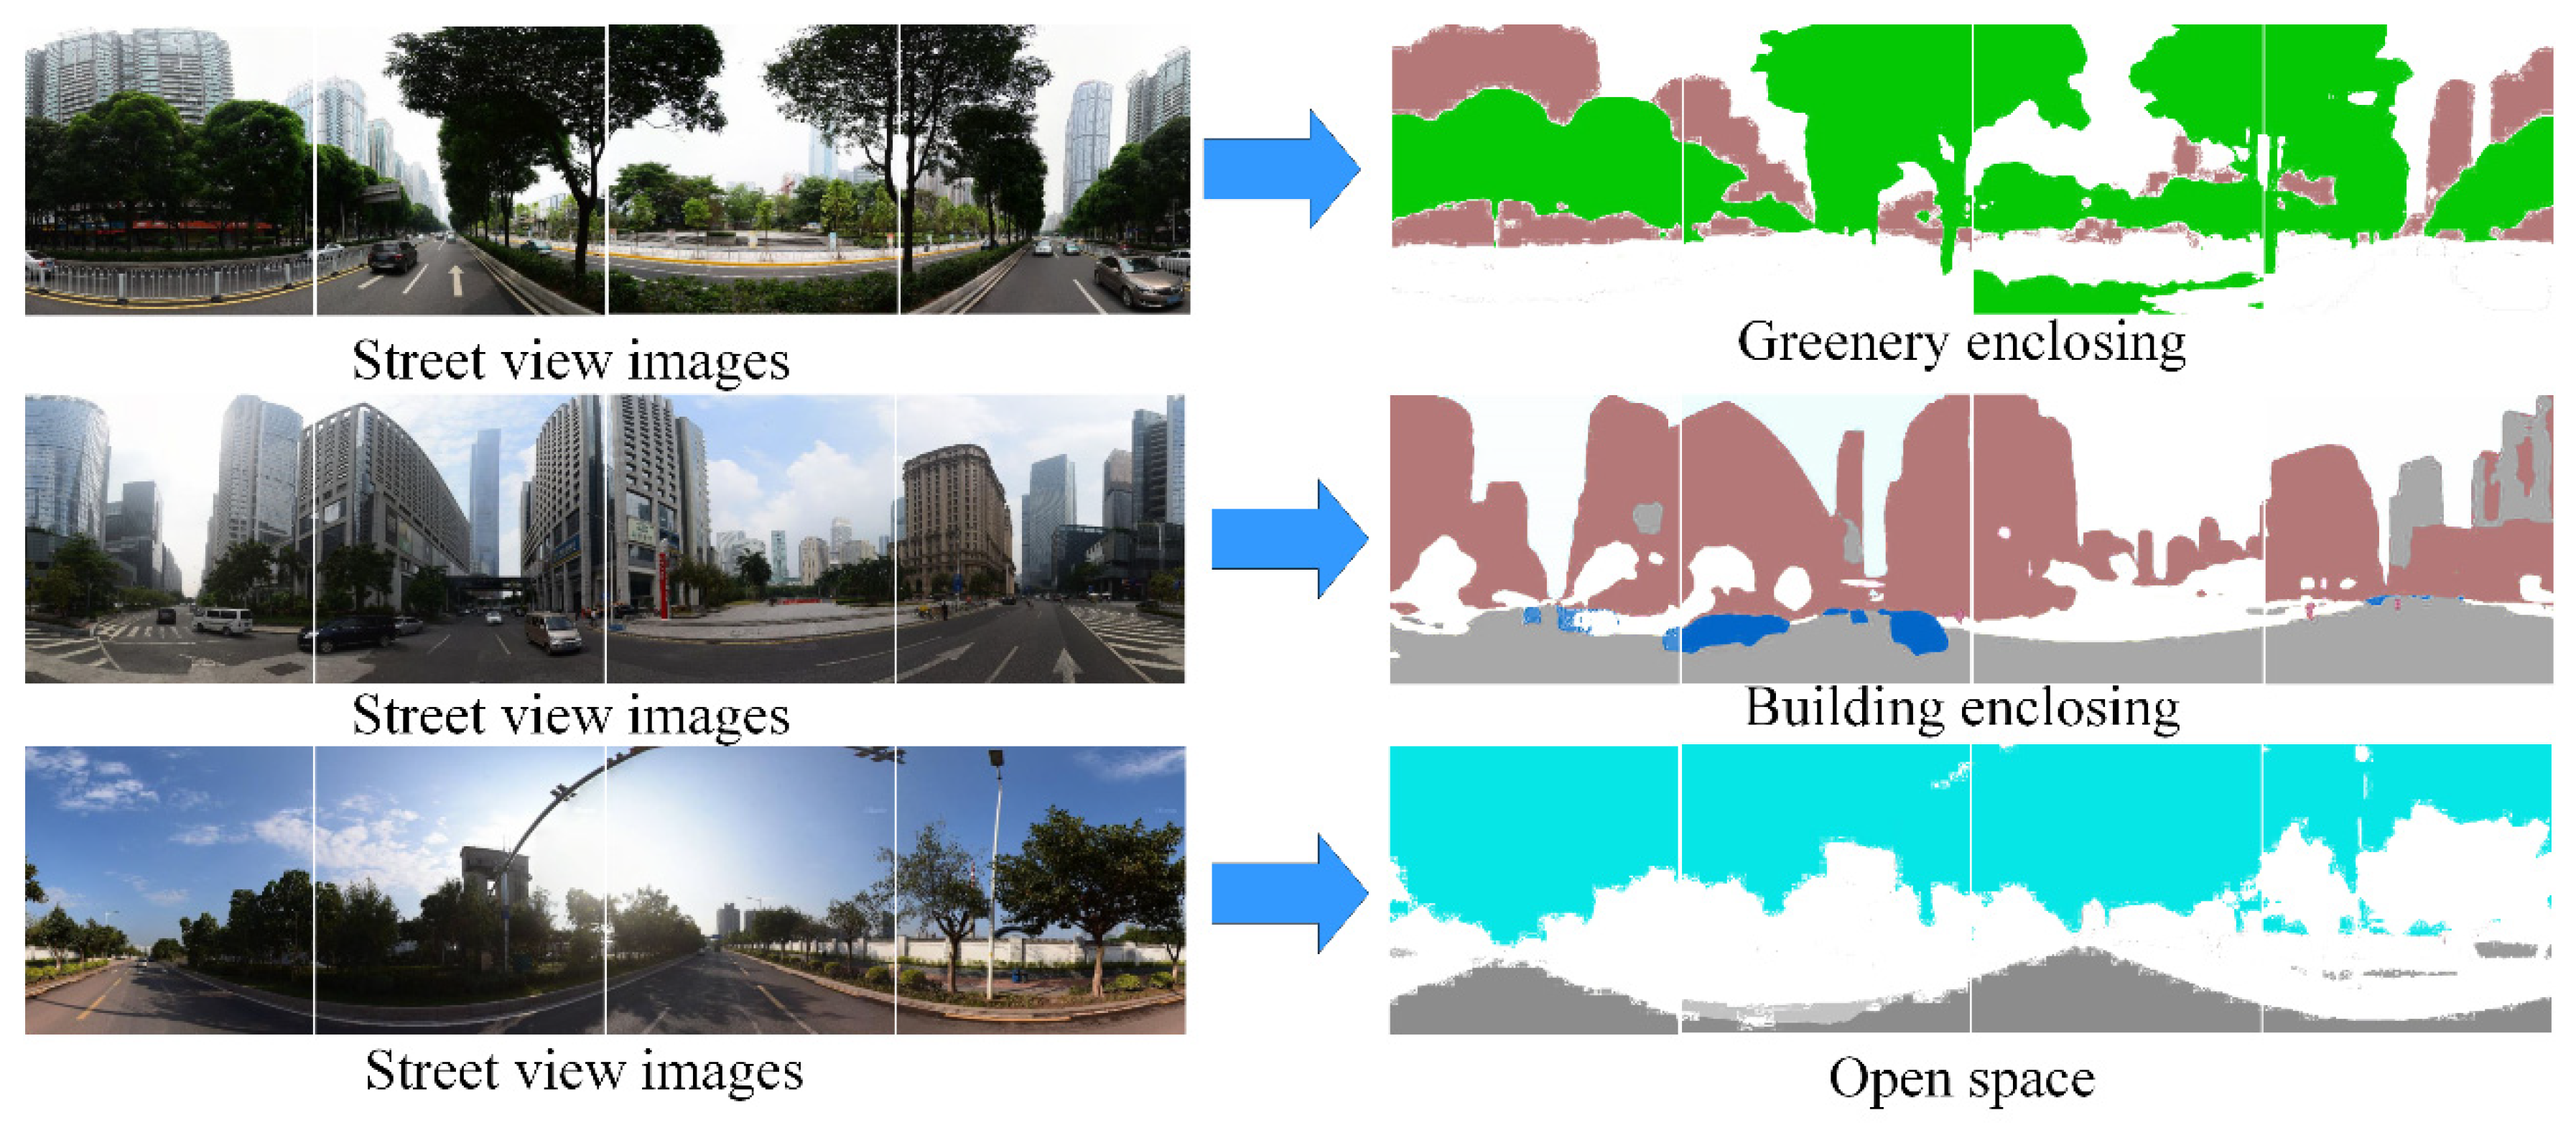
Image semantic segmentation is the automatic segmentation and recognition of image content by machine. Its goal is to classify every pixel of the image and divide the image into several regions of visual significance or interest. Thus, building enclosure degree, greenery enclosure degree and open spaces can be extracted from images by detecting greenery, sky, roads, buildings, and cars.
As shown in Figure 3, our extraction unit is a location point. Images from four headings are collected in each location, including 90°, 180°, 270°, and 360°. Then, different objects in the street view images are detected automatically, including greenery, sky, roads, buildings, and cars, by applying the PSPNet architecture [31]. PSPNet can reach an accuracy of 79.70% for classifying 150 categories after being trained by the ADE20K dataset [32].
On this basis, greenery, sky, roads, buildings, and cars objects are detected from each segmented street view image. Then, building enclosure degree, greenery enclosure degree, and open spaces are calculated by pixels,
,, , , refer to the total number of pixels recognised as greenery, sky, roads, buildings, and cars in the ith location. , and refer to the total number of pixels recognized as building enclosures, greenery enclosures, and open spaces in the ith location; N is the total number of pixels dedicated to that location.
3.1.2. Semantic Function Extraction Using LDA Topic Modelling
With the extracted residential, commercial, and traffic urban functions based on POI distributions, categories of POIs from each road are extracted to calculate topics with topic distributions related to residential, commercial, and traffic urban function types using LDA topic model [33]. In particular, LDA topic model is a generative probabilistic model for collecting text data and finding topics. The extraction of semantic function is based on the previous research proposed by Xing et al. [34]. Specifically, the LDA topic model defines documents as input data. A document contains several topics that involve different words. The outputs of LDA are the distribution of topics in each document and the distribution of words in each topic. Assuming that POI categories in one selected road section are treated as words in one document, two outputs, the calculated topics (category distributions) and topic distributions, can be used to indicate the urban function classification. One of the output topic distributions Θ is shown in Equation (4):
where represents the number n of POI topic Z in document d. K indicates the total number of POI topics. In addition, represents the parameter in the LDA model. Moreover, two variables that influence the output distributions of POI categories and topics are parameter α and topic number k. In general, we utilize deep semantic topics to reflect commercial and residential urban functions. In the LDA model, k = 2, ......, 50 topics can be utilized. On this basis, the value of k is determined using expert knowledge on which topics provide maximum information and minimal dimensionality.
3.1.3. Automatic Urban Function Classification
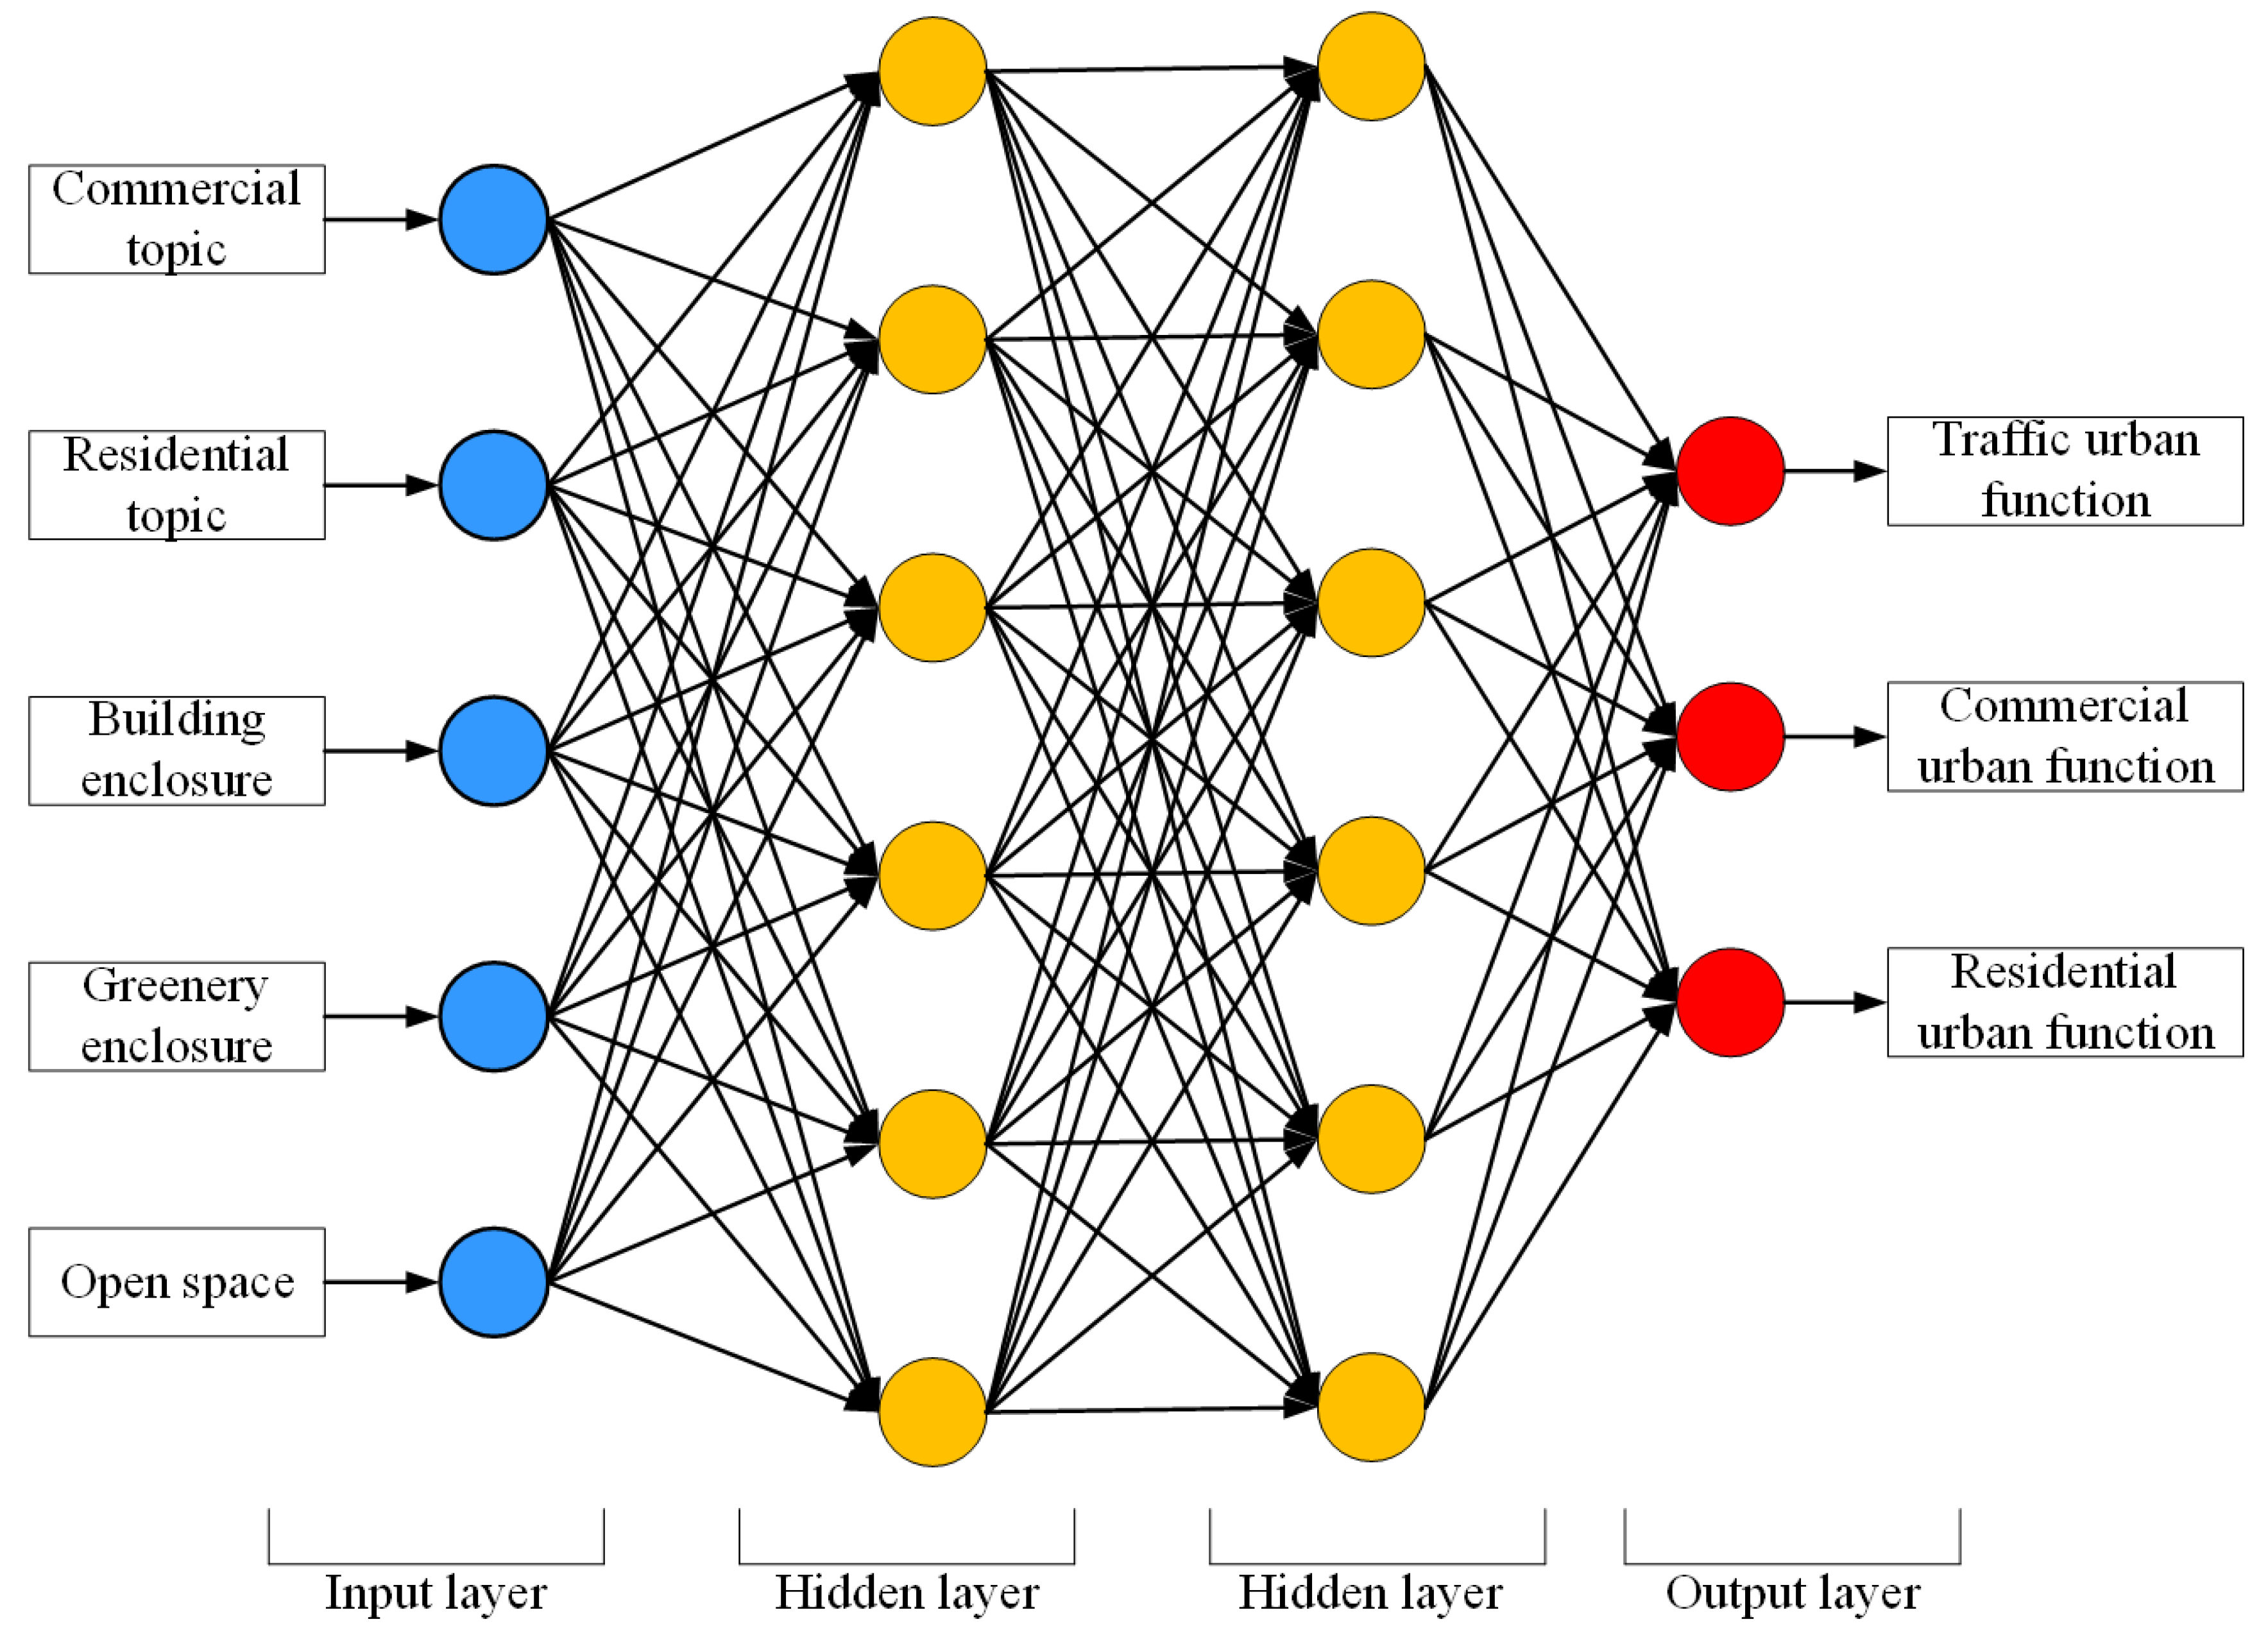
To mine the complexity of residential, commercial, and traffic urban functional characteristics, we employ a multilayer perceptron (MLP) [35] for grouping urban functions with different POI urban function topics and street view-based indicators based on Section 3.1.1 and Section 3.1.2. As shown in Figure 4, in the input layer, we use the POI urban function topic probability of distribution and street view-based indicators as input. In the output layer, the output is the detection result of each selected road section. The hidden layer is composed of many nonlinear neurons, through which the relationship between the input layer and output layer can be constructed. The layer MLP does not specify the number of hidden layers, so we can choose the appropriate number of hidden layers according to their own needs. There is no limit to the number of neurons in the output layer. Given the POI urban function topic probability of distribution and street view-based indicators as factors, parts of the roads are labelled with specific urban functional types for classification. The accuracy assessment is displayed in Section 4.1.
3.2. Adaptive Street Quality Assessment
3.2.1. Street Quality Description
To determine the score of street quality, the densities of different urban facilities are calculated using nuclear density method. Three aspects of urban function assessment indicators—residential indicators, commercial indicators and traffic indicators—are considered to further quantify street-level urban function.
For commercial and residential urban functions, we chose POIs distributed in shopping malls and residential areas. In particular, we divided each road into 50 m * 50 m regular grids to measure the commercial and residential urban function. The density of POIs in each grid is calculated as follows:
where represents the kernel density of residential facilities or density of catering and shops; x represents facilities or catering and shops; and n is the number of facilities or catering and shops. is the weight, and is a smoothing parameter, where D is divided into four ranks by natural discontinuity; the highest score is 4, and the lowest score is 1. Moreover, education services and parking lots are the embodiment of the residential and commercial functions. As a result, the presence of schools and special parking lots is a major indicator for measuring the residential and commercial urban functions.
For quantifying traffic function, the presence of bus stops and subway stations are measured:
where represents bus stop coverage; means the length of the ith road; and means the number of bus stations on the ith road. Having no bus station is score 1, 0 m < Ci ≤ 500 m is score 4, 500 m < Ci ≤ 1000 m is score 3, Ci > 1000 m is score 2. The threshold of 500 metres is based on the proposed principle in the China “Code for Transport Planning on Urban Road,” which has been further utilised and discussed in the research proposed by Li and Long [36]. Besides, street view data can directly reflect the situation on the street. Image segmentation can recognise independent objects and depict boundaries from a single street view image. Therefore, the traffic urban function indicator is defined as follows:
where refers to the average road ratio of the street, and n represents the number of street view locations. It represents the pavement installation integrity of the road. is divided into four ranks from 1 to 4, with 4 at the highest rank and 1 at the lowest.
3.2.2. Street Quality Weighting
The final adaptive street quality assessment results are obtained based on the scores and weights of the different urban functions. The final adaptive street quality assessment formula is as follows:
where is the ith road street quality assessment result and are the weights of the commercial, residential, and traffic functions. These weights are calculated by analytic hierarchy process (AHP) [37]. In particular, it is a multicriteria decision model for selecting the optimal alternative in which the factors are arranged in a hierarchic structure. In this study, the hierarchic structure that represents street quality factors is displayed in Table 1. Specifically, it provides an evaluation index system from the perspective of urban functions. While the target layer and criterion level indicate the goal of street quality assessment and different urban functions, the index level represents the factors that influence the forming of these functions. By comparing the pair-wise index in Table 1, weights of the commercial, residential and traffic functions can be calculated.
Moreover, , and are calculated as follows:
where is the ith road residential urban function quantification result, is the ith road commercial urban function quantification result, is the ith road traffic urban function quantification result, and R(x) means the rank of x indicators. Finally, we use the method of natural discontinuity to divide the score into four grades, with the best result being 4, and the worst being 1.
4. Results
4.1. Street-Level Urban Function Detection
By proposing PSPNet for image segmentation, the open space, building enclosure degree, and greenery enclosure degree were extracted from street view images. Figure 5 shows the street-level open space, building enclosure degree, and greenery enclosure degree extracted from three locations. Considering four headings, including 90°, 180°, 270°, and 360°, the street view images were merged to capture the surrounding environment in each location. Through a visual inspection, one can see that the proposed PSPNet model can accurately delineate the boundaries between different objects and precisely identify open space from street view images. In addition, it should be noted that there are other objects that are not extracted from the street view images and that block the measured objects. A detailed discussion is included in Section 5. Following the delineation of open space, building enclosure degree, and greenery enclosure degree, a total of 1604 street view images in 401 locations were utilized to identify open space, building enclosure degree, and greenery enclosure degree.
In our study, we extracted urban function-related topics by proposing an LDA model. The POI types of each selected road section are treated as a document, and the topic number for the value of k is determined using expert knowledge, considering which topics provide maximum information and minimal dimensionality. Therefore, we used the LDA model to extract and calculate the topic probability of each selected road section that reflects the urban functions of commercial and residential areas. In our study, we employed the selection of the value of α proposed by Griffiths and Steyvers [38], and, based on expert knowledge, we chose k = 10 as the topic number. Part of the results are shown in Table 2; POIs with a high probability distribution for the same topic often have the same or similar POI types. The POI types with a high probability of distribution in topic 3 are “Life service,” “Convenience store,” and “Residence,” which all reflect the related themes of the residential urban function.
Then, a multilayer perceptron was built. We put the open space, building enclosure degree, and greenery enclosure degree, which are extracted from the street view images, and the commercial-related and residential-related topic probabilities into the multilayer perceptron. As a result, we can obtain the urban function detection. The results are shown in Table 3. As shown in Table 3, the overall accuracy is 64.3%, and the highest accuracy is for the commercial function, while the lowest accuracy is for traffic. Traffic is more focused on the elements extracted from the street view, such as the distribution of roads, sky, and cars, independent of POI data. Commercial and residential areas rely on relevant topics extracted from POI categories, such as residential areas, shopping malls, convenience stores, and specialty stores. A detailed discussion is shown in Section 5.
4.2. Adaptive Street Quality Assessment
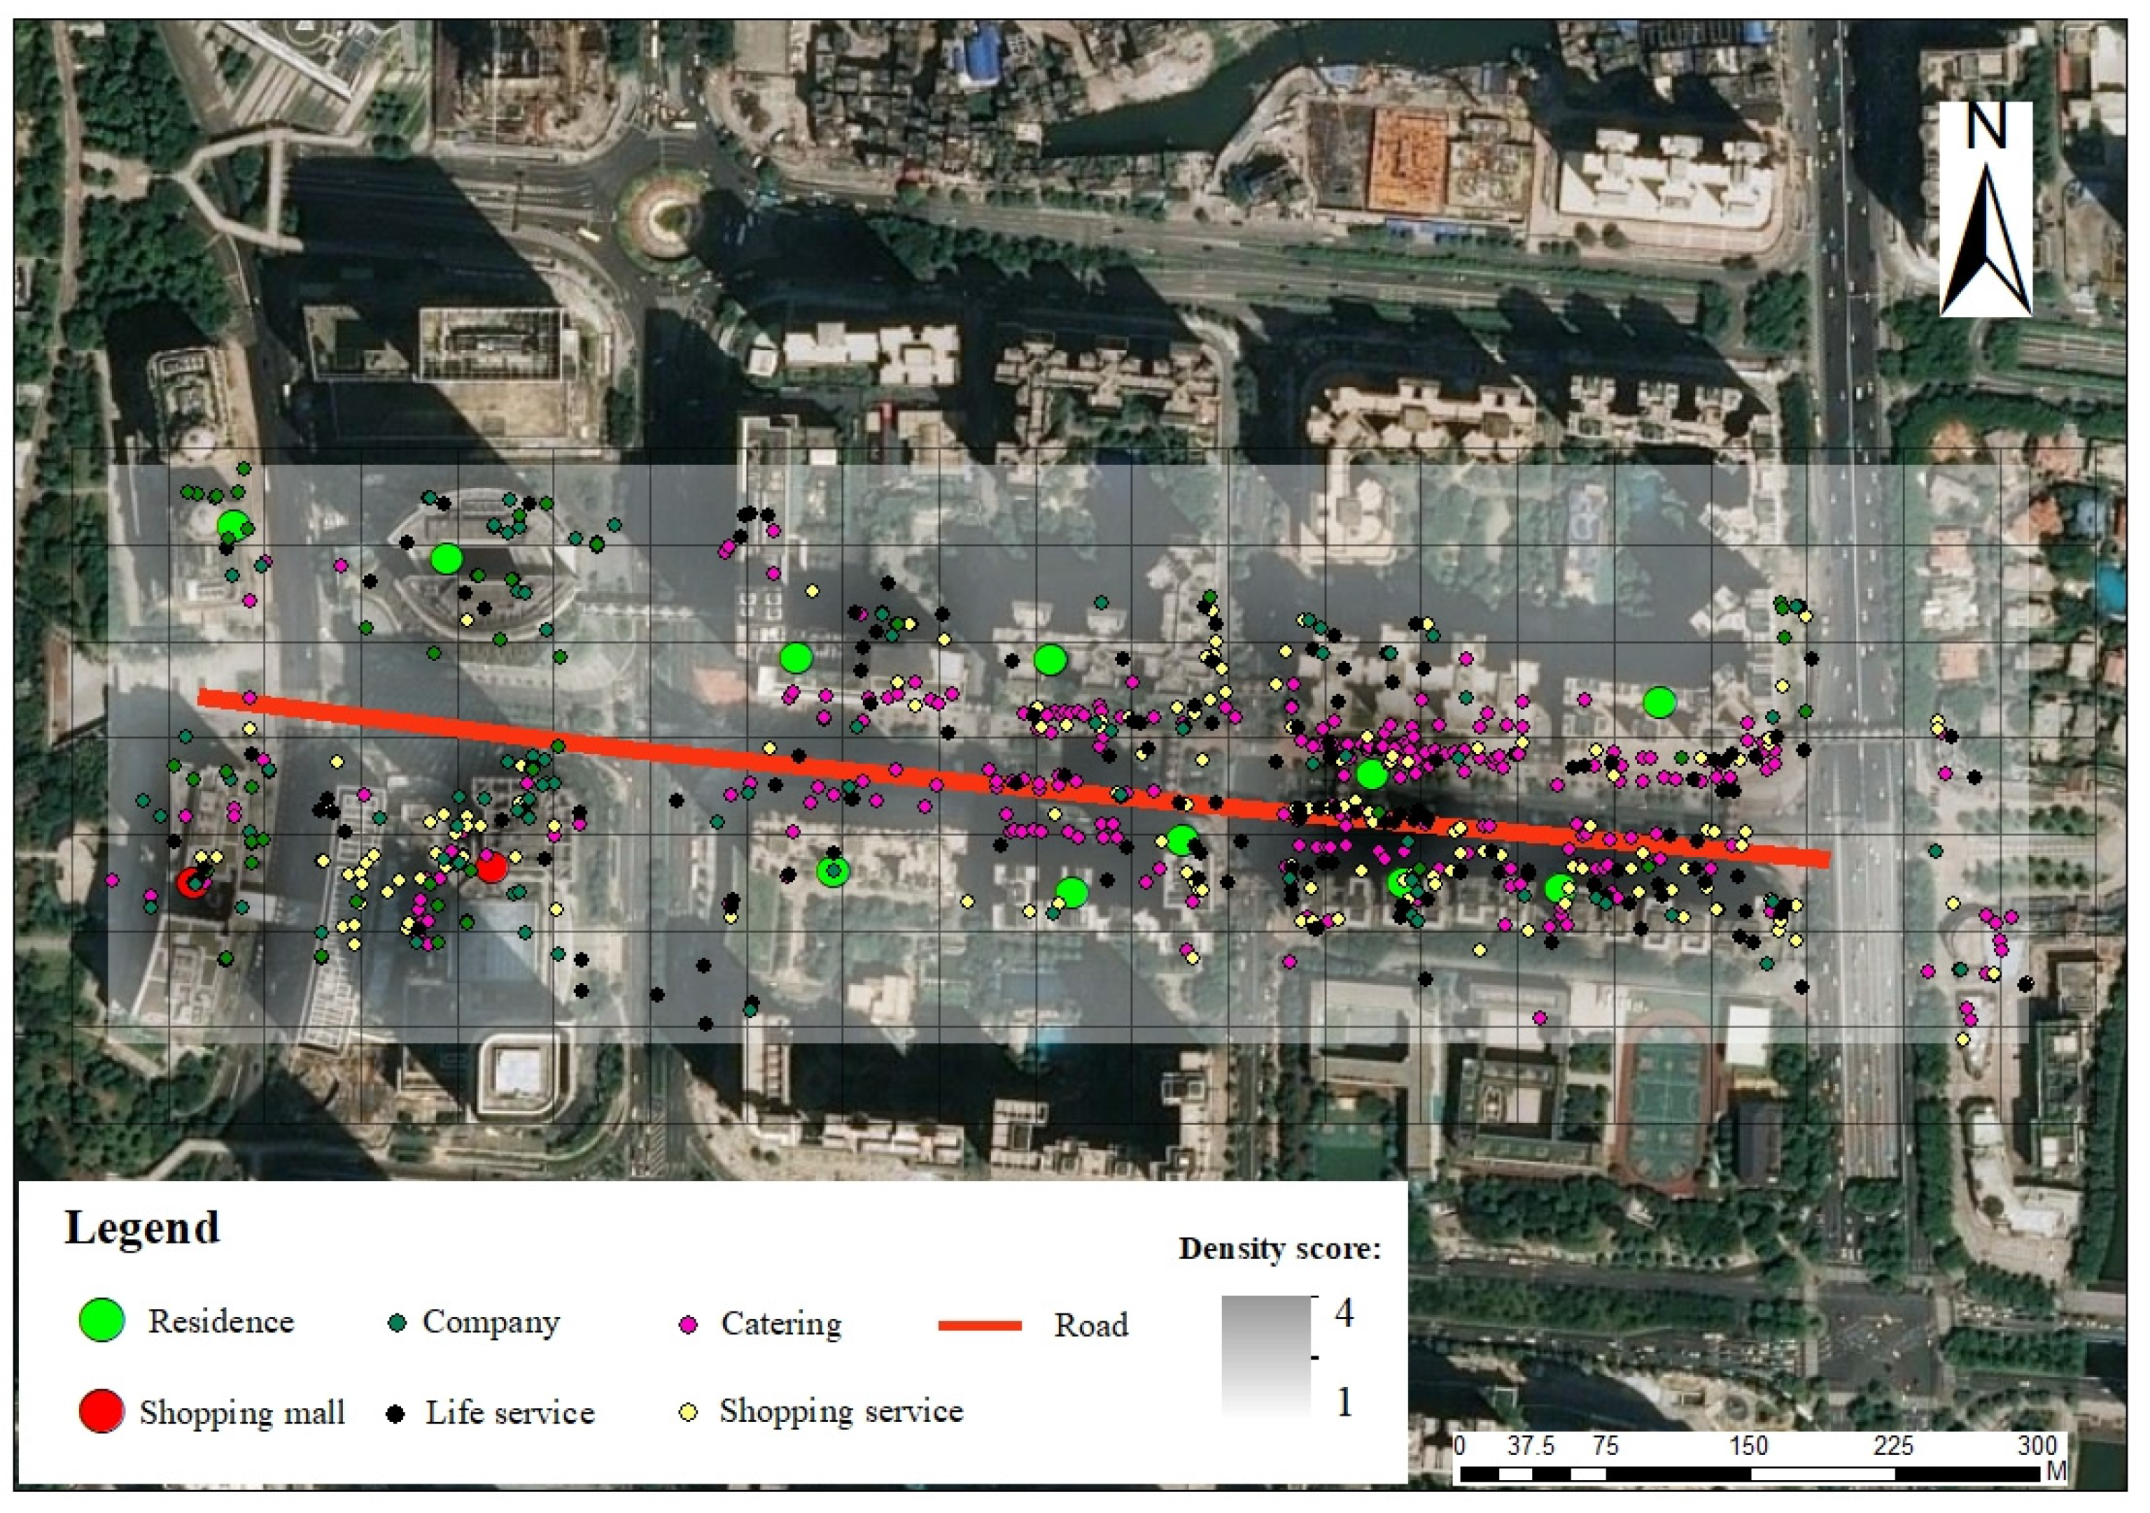
As shown in Figure 6, the distribution of POIs shows a trend of clustering and commercial-related POIs, and residential-related POIs are found near both shopping malls and residential areas. However, the types of POI distribution are not obvious. For example, catering is distributed around residential areas and in business office buildings and large shopping malls. Therefore, to solve the above problems, we chose grids with residential areas and shopping malls to calculate the average value of the kernel density of facilities in the selected grid. We calculated the kernel density of 21 road sections, and we selected 33 grids in all, including 11 for shopping malls and 22 for residential areas. The lowest nuclear density is 221, and the highest is 65,259. The lowest kernel density is 221, and the highest is 65,259. The traffic function is the basic function provided by roads, and the residential and commercial urban functions rely on the traffic function. Therefore, we calculated the bus stop service length of the 21 selected road sections. A detailed discussion is provided in Section 5.
As we know, the urban function of the road is not unique but permeates the area. The traffic function is the main function of the roads, but it also gradually forms the surrounding commercial and residential environment in the process of urban development. Section 4.1 detects the urban function of selected road sections. Specifically, the urban function detection result means a bias toward the road sections. For example, a road section’s urban function result detects a residential urban function. This means that comparing the traffic and residential urban functions, this road is more inclined toward the residential urban function. In our study, the weight value of the traffic, commercial, and residential functions were calculated by AHP. As shown in Table 1, we built an evaluation index system from the perspective of urban function and evaluated the streets from the perspective of traffic, residences, and commerce to obtain the weight values of different urban functional roads. The weight value results for the traffic, commercial, and residential functions are shown in Table 4 individually. For the traffic-driven streets, the weight values are 24.58%, 48.24%, and 27.18% in assessing the residential, traffic, and commercial functions, respectively; for commercial-driven streets, the weight values are 24.58%, 27.18%, and 48.24%; and for residential-driven streets, the weight values are 48.24%, 24.58%, and 27.18%. On this basis, the results of the street quality assessment are displayed in Table 5. As shown in Table 5, the urban function represents the adaptive urban function detection result. For example, ‘traffic’ means that this road is more oriented toward traffic than toward commercial and residential urban functions. The rank is from 1 to 4, which indicates the street quality assessment results ranging from bad to good, where the worst is grade 1, and the best is grade 4.
4.3. Street Quality Validation
For accuracy assessment, verification points are randomly generated using a random sampling approach. The random sampling strategy selects one sampling point every 500 m, for a total of 76 sampling points. On this basis, points for validation are visited on spots to confirm the assessment results. Partial validation results are displayed in Table 6. We chose the street view of the sampling point to describe and verify the results for the street quality evaluation.
For example, the urban function of these roads is residential: ID is the verification point of 2, whose urban function is residential. In terms of traffic urban function, this section of road is wide, but congested with traffic. In terms of the residential urban function, the residential buildings distributed on both sides of the road are low, living service settings are lacking, and in terms of commercial functions, there are no shopping malls or other commercial facilities, so the rank of 1 is reasonable. The verification point ID is 59, which has a residential urban function. In terms of the traffic urban function, the road is wide and unobstructed, and there are sidewalks and bus stops on both sides of the road, with good accessibility. Both sides of the road are high-grade residential areas with complete living facilities. In terms of the commercial urban function, shopping malls, entertainment, and leisure facilities are densely distributed, so a rank of 4 is reasonable.
Verification of traffic urban function: the verification point ID is 17, which has an urban function of traffic. In terms of the traffic urban function, the road is wide and unobstructed. In terms of the residential urban function, the density of the living areas on both sides of the road is low. In terms of the commercial urban function, there is no shopping mall or other commercial facilities. In general, the traffic function is the main function of this road, so a rank of 2 is reasonable.
Verification of commercial urban function: the verification point ID is 46, which has a commercial urban function. In terms of the traffic urban function, the road is wide and unobstructed, and there are bus stops with good accessibility. On both sides of the road are high-rise residential areas and office buildings, with complete living and commercial facilities. In terms of commercial urban function, there are shopping places that are close to the shopping mall, so a rank of 3 is reasonable.
5. Discussion
Although the proposed adaptive street quality assessment approach has obtained satisfactory results, limitations still exist and must be solved in future studies, which are discussed as follows.
The uncertainty of street view image quality is the first issue to be solved. In particular, street view images from the ADE20K database are utilized in PSPNet training, while the image semantic segmentation model built in this study used images from Baidu maps as data sources. Considering the inconsistence between street view images from the ADE20K database and Baidu maps, the segmentation accuracy of PSPNet will be affected by the street view image in this study. Moreover, the segmented elements will not be fully accurate due to object placement in the street view images. For example, a bus may block a large area of green, resulting in a decrease in the number of green pixels. At the same time, the collection location of the street view image will also affect the calculation results. For example, in a two-way, six-lane road, the proportion of buildings and roads will change if the street view collection points are distributed in the inner lane or the outer lane.
The second issue is the descriptions of street-level urban functions. Generally, multiple urban functions are defined within parcels, that is, communities in previous studies such as public, residential, commercial, industrial land, et. al. [14,39]. However, this study restricts urban functions into three types including residential, commercial, and traffic functions. This classification nomenclature is based on the consideration that street networks serve limited urban functions compared with communities. For example, industrial and public land usually distribute within parcels, while residential and commercial facilities are along the streets. Therefore, both industrial and public functions are not included in this study.
The third issue is the disadvantages of the proposed adaptive street quality assessment approach. On the one hand, for the construction of urban functional indicators, there is no significant connection between the types and distribution of POIs (shown in Figure 6,). It is also difficult to distinguish urban functions from POI types. Therefore, the distribution of POIs shows a trend of clustering around shopping malls and residential areas. However, the types of POI distribution are not obvious. For example, catering is distributed around residential areas and in office buildings and large shopping malls. To solve the above problems, we chose grids with residential areas and shopping malls to calculate the density of the facilities. On the other hand, the construction of the multilayer perceptron is limited by data, and the accuracy of the multilayer perceptron has an overfitting phenomenon. The larger the amount of data, the better the effect of the model will be. In our study, we chose only 21 roads as the experimental object. For a multilayer perceptron, the data volume is not sufficient. To make the model more robust, we should increase the data volume in future studies.
6. Conclusions
In this study, an adaptive street quality assessment approach is proposed. First, urban streets are divided into functions including traffic functional streets, commercial functional streets, and residential functional streets. Second, street assessment indices are established with regard to each street-level function. On this basis, adaptive indices are designed with index weighting strategies to eliminate any bias in street assessment caused by the differences in urban functions. Taking Tianhe District in Guangzhou as the study area, 21 selected road sections and 1604 street view images from Baidu Maps and 32,273 POIs from AutoNavi were utilized. In the experiment, a model for adaptive urban function detection was constructed with an overall accuracy of 64.3%. The results show that the adaptive street quality assessment is feasible. Our methodology is fully scalable to any geographic location where street-level image data or POI data are available.
The innovations of this study can be concluded as follows. First, as streets are considered as a basic component for recognizing urban structure, investigating whether an independent street can fit various urban functions is of vital importance for policy makers to design urban land uses. Lower assessment rankings suggest that current streets can be improved in terms of specific function to support the public services. Second, the proposed framework yields a novel method for adaptively assessing street quality for use in urban planning at both regional and global scales, establishing a universal pathway towards building a global urban network organization. Above all, this work has the potential to transform how we describe the form and composition of cities towards an urban function-driven perspective.
Author Contributions
F.H. implemented the method, performed the major part of the experiments, and drafted the manuscript. W.L., J.L., C.S., and J.W. made substantial contributions to the conceptual design and methodological development. H.X. and Y.M. developed the framework. All authors have read and agreed to the published version of the manuscript.
Acknowledgments
This research was supported by the National Natural Science Foundation of China (Grant No. 41971406).
Conflicts of Interest
The authors declare no conflict of interest.
References
- Zhu, D.; Wang, N.; Wu, L.; Liu, Y. Street as a big geo-data assembly and analysis unit in urban studies: A case study using Beijing taxi data. Appl. Geogr. 2017, 86, 152–164. [Google Scholar] [CrossRef]
- Xing, H.; Meng, Y. Measuring urban landscapes for urban function classification using spatial metrics. Ecol. Indic. 2020, 108, 105722. [Google Scholar] [CrossRef]
- Ma, F.; Ren, F.; Yuen, K.F.; Guo, Y.; Zhao, C.; Guo, D. The Spatial Coupling Effect between Urban Public Transport and Commercial Complexes: A Network Centrality Perspective. Sustain. Cities Soc. 2019, 50, 101645. [Google Scholar] [CrossRef]
- Meng, Y.; Xing, H. Exploring the relationship between landscape characteristics and urban vibrancy: A case study using morphology and review data. Cities 2019, 95, 102389. [Google Scholar] [CrossRef]
- Porta, S.; Strano, E.; Iacoviello, V.; Messora, R.; Latora, V.; Cardillo, A.; Wang, F.; Scellato, S. Street centrality and densities of retail and services in Bologna, Italy. Environ. Plan. B Plan. Des. 2009, 36, 450–465. [Google Scholar] [CrossRef] [Green Version]
- Stubbings, P.; Peskett, J.; Rowe, F.; Arribas-Bel, D. A Hierarchical Urban Forest Index Using Street-Level Imagery and Deep Learning. Remote Sens. 2019, 11, 1395. [Google Scholar] [CrossRef] [Green Version]
- Chan, E.T.; Schwanen, T.; Banister, D. The role of perceived environment, neighbourhood characteristics, and attitudes in walking behaviour: Evidence from a rapidly developing city in China. Transportation 2019, 1–24. [Google Scholar] [CrossRef] [Green Version]
- Millward, H.; Spinney, J.; Scott, D. Active-transport walking behavior: Destinations, durations, distances. J. Trans. Geogr. 2013, 28, 101–110. [Google Scholar] [CrossRef]
- Liu, Y.; Liu, X.; Gao, S.; Gong, L.; Kang, C.; Zhi, Y.; Chi, G.; Shi, L. Social sensing: A new approach to understanding our socioeconomic environments. Ann. Assoc. Am. Geogr. 2015, 105, 512–530. [Google Scholar] [CrossRef]
- Xing, H.; Meng, Y. Integrating landscape metrics and socioeconomic features for urban functional region classification. Comput. Environ. Urban Syst. 2018, 72, 134–145. [Google Scholar] [CrossRef]
- Zhang, F.; Wu, L.; Zhu, D.; Liu, Y. Social sensing from street-level imagery: A case study in learning spatio-temporal urban mobility patterns. ISPRS J. Photogramm. Remote Sens. 2019, 153, 48–58. [Google Scholar] [CrossRef]
- Yin, L.; Wang, Z. Measuring visual enclosure for street walkability: Using machine learning algorithms and Google Street View imagery. Appl. Geogr. 2016, 76, 147–153. [Google Scholar] [CrossRef]
- Xing, H.; Meng, Y.; Hou, D.; Cao, F.; Xu, H. Exploring point-of-interest data from social media for artificial surface validation with decision trees. Int. J. Remote Sens. 2017, 38, 6945–6969. [Google Scholar] [CrossRef]
- Zhang, X.; Du, S.; Wang, Q. Hierarchical semantic cognition for urban functional zones with VHR satellite images and POI data. ISPRS J. Photogramm. Remote Sens. 2017, 132, 170–184. [Google Scholar] [CrossRef]
- Yue, Y.; Zhuang, Y.; Yeh, A.G.; Xie, J.-Y.; Ma, C.-L.; Li, Q.-Q. Measurements of POI-based mixed use and their relationships with neighbourhood vibrancy. Int. J. Geogr. Inf. Sci. 2017, 31, 658–675. [Google Scholar] [CrossRef] [Green Version]
- Cao, R.; Zhu, J.; Tu, W.; Li, Q.; Cao, J.; Liu, B.; Zhang, Q.; Qiu, G. Integrating Aerial and Street View Images for Urban Land Use Classification. Remote Sens. 2018, 10, 1553. [Google Scholar] [CrossRef] [Green Version]
- Helbich, M.; Yao, Y.; Liu, Y.; Zhang, J.; Liu, P.; Wang, R. Using deep learning to examine street view green and blue spaces and their associations with geriatric depression in Beijing, China. Environ. Int. 2019, 126, 107–117. [Google Scholar] [CrossRef]
- Li, Y.; Cheng, Q.; Wang, Z.; Shao, Z. ‘Big data’ for pedestrian volume: Exploring the use of Google Street View images for pedestrian counts. Appl. Geogr. 2015, 63, 337–345. [Google Scholar]
- Long, Y.; Liu, L. How green are the streets? An analysis for central areas of Chinese cities using Tencent Street View. PLoS ONE 2017, 12, e0171110. [Google Scholar] [CrossRef] [Green Version]
- Shen, Y.; Karimi, K. Urban function connectivity: Characterisation of functional urban streets with social media check-in data. Cities 2016, 55, 9–21. [Google Scholar] [CrossRef] [Green Version]
- Zhao, Y.; Zhang, H.; An, L.; Liu, Q. Improving the approaches of traffic demand forecasting in the big data era. Cities 2018, 82, 19–26. [Google Scholar] [CrossRef]
- Zhou, J.; Murphy, E. Day-to-day variation in excess commuting: An exploratory study of Brisbane, Australia. J. Transp. Geogr. 2019, 74, 223–232. [Google Scholar] [CrossRef]
- Huang, W.; Xu, S.; Yan, Y.; Zipf, A. An exploration of the interaction between urban human activities and daily traffic conditions: A case study of Toronto, Canada. Cities 2018, 84, 8–22. [Google Scholar] [CrossRef]
- Estupiñán, N.; Rodríguez, D.A. The relationship between urban form and station boardings for Bogota’s BRT. Transp. Res. Part A Policy Pract. 2008, 42, 296–306. [Google Scholar] [CrossRef]
- An, D.; Tong, X.; Liu, K.; Chan, E.H. Understanding the impact of built environment on metro ridership using open source in Shanghai. Cities 2019, 93, 177–187. [Google Scholar] [CrossRef]
- Yuan, J.; Zheng, Y.; Xie, X. Discovering Regions of Different Functions in a City Using Human Mobility and POIs. In Proceedings of the 18th ACM SIGKDD International Conference on Knowledge Discovery and Data Mining, Bejing, China, 12–16 August 2012; ACM: New York, NY, USA, 2012; pp. 186–194. [Google Scholar]
- Tu, W.; Cao, J.; Yue, Y.; Shaw, S.-L.; Zhou, M.; Wang, Z.; Chang, X.; Xu, Y.; Li, Q. Coupling mobile phone and social media data: A new approach to understanding urban functions and diurnal patterns. Int. J. Geogr. Inf. Sci. 2017, 31, 2331–2358. [Google Scholar] [CrossRef]
- Ríos, S.A.; Muñoz, R. Land Use detection with cell phone data using topic models: Case Santiago, Chile. Comput. Environ. Urban Syst. 2017, 61, 39–48. [Google Scholar] [CrossRef]
- Zhang, F.; Zhang, D.; Liu, Y.; Lin, H. Representing place locales using scene elements. Comput. Environ. Urban Syst. 2018, 71, 153–164. [Google Scholar] [CrossRef]
- Middel, A.; Lukasczyk, J.; Zakrzewski, S.; Arnold, M.; Maciejewski, R. Urban form and composition of street canyons: A human-centric big data and deep learning approach. Landsc. Urban Plan. 2019, 183, 122–132. [Google Scholar] [CrossRef]
- Zhao, H.; Shi, J.; Qi, X.; Wang, X.; Jia, J. Pyramid Scene Parsing Network. In Proceedings of the IEEE Conference on Computer Vision and Pattern Recognition, Salt Lake City, UT, USA, 21–26 July 2017; pp. 2881–2890. [Google Scholar]
- Zhou, B.; Zhao, H.; Puig, X.; Fidler, S.; Barriuso, A.; Torralba, A. Scene Parsing through Ade20k Dataset. In Proceedings of the IEEE Conference on Computer Vision and Pattern Recognition, Salt Lake City, UT, USA, 21–26 July 2017; pp. 633–641. [Google Scholar]
- Blei, D.M.; Ng, A.Y.; Jordan, M.I. Latent dirichlet allocation. J. Mach. Learning Res. 2003, 3, 993–1022. [Google Scholar]
- Xing, H.; Meng, Y.; Hou, D.; Song, J.; Xu, H. Employing Crowdsourced Geographic Information to Classify Land Cover with Spatial Clustering and Topic Model. Remote Sens. 2017, 9, 602. [Google Scholar] [CrossRef] [Green Version]
- Cybenko, G. Approximation by superpositions of a sigmoidal function. Math. Control Signals Syst. 1989, 2, 303–314. [Google Scholar] [CrossRef]
- Li, M.; Long, Y. The Coverage Ratio of Bus Stations and an Evaluation of Spatial Patterns of Major Chinese Cities. Urban Plan. Forum 2015, 226, 38–45. [Google Scholar]
- Saaty, T.L. What is the analytic hierarchy process? In Mathematical Models for Decision Support; Springer: Berlin/Heidelberg, Germany, 1988; pp. 109–121. [Google Scholar]
- Griffiths, T.L.; Steyvers, M. Finding scientific topics. Proc. Natl. Acad. Sci. USA 2004, 101 (Suppl. 1), 5228–5235. [Google Scholar] [CrossRef] [Green Version]
- Yao, Y.; Li, X.; Liu, X.; Liu, P.; Liang, Z.; Zhang, J.; Mai, K. Sensing spatial distribution of urban land use by integrating points-of-interest and Google Word2Vec model. Int. J. Geogr. Inf. Sci. 2017, 31, 825–848. [Google Scholar] [CrossRef]
Figure 1.
Spatial distribution of selected street view images and points of interest (POIs).

Figure 2.
The overall framework. LDA: Latent Dirichlet allocation.

Figure 3.
Street view image segmentation.

Figure 4.
Multilayer perceptron structure.

Figure 5.
Street-level open space, building enclosure, and greenery enclosure.

Figure 6.
POI distribution and kernel density.


Table 1.
Evaluation index system from the perspective of urban functions.
| Target Layer | Criterion Level | Index Level |
|---|---|---|
| Street quality assessment | Traffic | Road traffic service level |
| Road area | ||
| Traffic organization and management | ||
| Road network connection | ||
| Residential | Quality of residential quarter | |
| Distribution of catering, shops, and living facilities | ||
| Cleanliness of street environment | ||
| Street greening | ||
| Road traffic service level | ||
| Commercial | Commercial service level around the road | |
| Road traffic | ||
| Traffic accessibility of commercial facilities | ||
| Shop density | ||
| Store diversity |
Table 2.
Some of the word distributions for selected topics (Prob. for Probability).
| Topic 3 | Topic 6 | Topic 7 | |||
|---|---|---|---|---|---|
| Words | Prob. | Words | Prob. | Words | Prob. |
| Life service | 0.680 | Incorporation | 0.294 | Parking lot | 0.233 |
| Convenience store | 0.158 | Exclusive shop | 0.228 | Intersection | 0.093 |
| Shop | 0.095 | Furniture store | 0.127 | Cultural place | 0.072 |
| Residence | 0.022 | Communal facilities | 0.071 | Bus stop | 0.024 |
| Restaurant | 0.021 | Fast food | 0.047 | Entrance | 0.008 |
| Decoration shop | 0.018 | Express | 0.023 | Hotel | 0.003 |
Table 3.
Adaptive street quality assessment function.
| Residential | Traffic | Commercial | Overall | |
|---|---|---|---|---|
| Producers’ accuracy | 100.0% | 33.3% | 80.0% | 64.3% |
| Users’ accuracy | 14.3% | 28.6% | 57.1% |
Table 4.
Weight of different urban functions.
| Road Urban Function | Traffic Weight | Commercial Weight | Residential Weight |
|---|---|---|---|
| Traffic function | 60.00% | 20.00% | 20.00% |
| Commercial function | 16.38% | 53.90% | 29.73% |
| Residential function | 16.38% | 29.73% | 53.90% |
Table 5.
Street quality assessment.
| ID | Road | Urban Function | Rank |
|---|---|---|---|
| 1 | Whampoa Avenue East (Chebei Road to beltway) | Traffic | 1 |
| 2 | Huaguan Road (Keyun Road to Gaotang Road) | Residential | 1 |
| 3 | Chebei Road (Guangyuan Expressway to Huangpu Road) | Traffic | 2 |
| 4 | Whampoa Avenue East (Huicai Road to Chebei Road) | Commercial | 2 |
| 5 | Huangpu Road Central (Tangxia Road to Kexin Road) | Commercial | 2 |
| 6 | Linhexi Road | Commercial | 2 |
| 7 | Chebei Road (Guangyuan Expressway to beltway) | Traffic | 2 |
| 8 | Huaguan Road (Gaotang Road to Daguan Road) | Traffic | 2 |
| 9 | Zhongshan Avenue Central (Guangzhou Expressway to Zhuji Road) | Commercial | 2 |
| 10 | Xiancun Road (Jinsui Road to Huacheng Avenue) | Commercial | 3 |
| 11 | Zhongshan Avenue West (Tianfu Road to Chebei Road) | Residential | 3 |
| 12 | Zhongshan Road (Chebei Road to Guangzhou Huancheng Expressway) | Traffic | 3 |
| 13 | Zhongshan Avenue West (Yangcheng Road to Tianfu Road) | Traffic | 3 |
| 14 | Xingsheng Road | Traffic | 3 |
| 15 | Huacheng Avenue | Commercial | 3 |
| 16 | Huangpu Road Central (Chebei Road to Huangpu Road East) | Traffic | 3 |
| 17 | Xiancun Road (Whampoa Road West to Jinsui Road) | Traffic | 3 |
| 18 | Huangpu Road Central (Chestwood Street to Tangxia Road) | Residential | 3 |
| 19 | Tiyu East Road (Tianhe Road to Whampoa Road West) | Residential | 4 |
| 20 | Racecourse Road | Residential | 4 |
| 21 | Tiyu East Road (Tianhe North Road to Tianhe Road) | Residential | 4 |
Table 6.
Street quality validation.
| ID | Street View | Road | Urban Function | Rank | Description |
|---|---|---|---|---|---|
| 2 |  | Huaguan Road (Keyun Road to Gaotang Road) | Residential | 1 | The road is open, and the buildings on both sides are under construction. |
| 17 |  | Chebei Road (Guangyuan Expressway to beltway) | Traffic | 2 | The green coverage on both sides of the road is good, the road surface is open, and commercial, residential facilities are few. |
| 46 |  | Huacheng Avenue | Commercial | 3 | High buildings stand on both sides of the road with high density |
| 59 |  | Racecourse Road | Residential | 4 | The road is clean and open, and the surrounding high-rise buildings stand |
© 2020 by the authors. Licensee MDPI, Basel, Switzerland. This article is an open access article distributed under the terms and conditions of the Creative Commons Attribution (CC BY) license (http://creativecommons.org/licenses/by/4.0/).
Share and Cite
MDPI and ACS Style
Hu, F.; Liu, W.; Lu, J.; Song, C.; Meng, Y.; Wang, J.; Xing, H. Urban Function as a New Perspective for Adaptive Street Quality Assessment. Sustainability 2020, 12, 1296. https://0-doi-org.brum.beds.ac.uk/10.3390/su12041296
AMA Style
Hu F, Liu W, Lu J, Song C, Meng Y, Wang J, Xing H. Urban Function as a New Perspective for Adaptive Street Quality Assessment. Sustainability. 2020; 12(4):1296. https://0-doi-org.brum.beds.ac.uk/10.3390/su12041296
Chicago/Turabian StyleHu, Feng, Wei Liu, Junyu Lu, Chengpeng Song, Yuan Meng, Jun Wang, and Hanfa Xing. 2020. "Urban Function as a New Perspective for Adaptive Street Quality Assessment" Sustainability 12, no. 4: 1296. https://0-doi-org.brum.beds.ac.uk/10.3390/su12041296
Note that from the first issue of 2016, this journal uses article numbers instead of page numbers. See further details here.