Article

Pass-by Characterization of Noise Emitted by Different Categories of Seagoing Ships in Ports

1
Physics Department, University of Pisa, Largo Bruno Pontecorvo 3, 56127 Pisa, Italy
2
iPOOL S.r.l., via Cocchi 7, 56121 Pisa, Italy
3
Environmental Protection Agency of Tuscany Region, via Vittorio Veneto 27, 56127 Pisa, Italy
*
Author to whom correspondence should be addressed.
Sustainability 2020, 12(5), 1740; https://0-doi-org.brum.beds.ac.uk/10.3390/su12051740
Submission received: 27 January 2020 / Revised: 13 February 2020 / Accepted: 18 February 2020 / Published: 26 February 2020
(This article belongs to the Special Issue Sustainable Maritime Transportation Management and Policies)

Abstract

:
In the light of sustainability, satisfactory living conditions is an important factor for people’s positive feedback in their own living environment. Acoustic comfort and noise exposure should then be carefully monitored in all human settlements. Furthermore, it is already well-known that high or prolonged noise levels may lead to unwanted health effects. Unfortunately, while in the last decades scientists and public authorities have investigated the noise produced by roads, trains, and airports, not enough efforts have been spent in studying what happens around the coastal and port areas. Following the attention brought to the subject by recent European projects on noise in port areas, the present paper characterizes the sound power level and 1/3 octave band sound power spectrum of seagoing ships while moving at low speeds. Five different categories have been distinguished: Roll-on/roll-off (RORO), container ship, oil tanker, chemical tanker, and ferry. The analysis is based on a continuous noise measurement lasting more than three months, performed in the industrial canal of the port of Livorno (Italy). The resulting noise emissions are new and useful data that could be inserted in acoustic propagation models to properly assess the noise in the areas affected by port activities. Thus, the present work can act as a supporting tool in planning ship traffic in ports towards better sustainability.

1. Introduction

Perception and concerns about the quality of the surrounding environment, both in urban and extra urban context, have grown in the last years so much that attention has been put on studying livable and sustainable communities [1]. In order to address quality of life issues, the scientific community and the stakeholders are looking at sustainability, which corresponds to a situation where “people are provided with satisfactory living conditions so that they can identify positively with their own environment” [2]. Noise pollution cannot avoid to fall into this concept, as it has been recognized among the most disturbing environmental parameters in a variety of epidemiological studies [3,4,5] and in a recent World Health Organization document [6].
It has now been demonstrated by many studies that prolonged exposure to noise can induce cardiovascular disease [7,8], alterations in blood pressure [9,10], respiratory diseases [11], hypertension [12], learning impairment [13,14], annoyance [15,16], and sleep disturbance [17,18,19]. In very recent years, awareness on the subject has also reflected on house pricing [20].
After the publication of European Noise Directive 2002/49/EC (END) [21], sustainability has grown towards the noise sources required by END: road and railway traffic [22,23,24], airports [25,26], and wind turbines [27,28]. For these type of noise sources, the scientific community has put a lot of effort into developing innovative and environmentally-friendly mitigations, such as low-noise pavements [29,30], live and integrated monitoring systems [31,32], sustainable metamaterial absorber [33,34], and sonic crystal noise barriers made of recycled materials [35].
As a counterpart, port noise has been studied much less compared to the other noise sources. However, in modern society maritime traffic plays a key role for commerce and the world seaborne trade has been growing at a steady +4% annual increase [36] in recent years. Thus, with increasing port size and ship movements, inhabited areas could come near to industrial and operative port areas, leading to possible health issue and citizens’ complaints, as reported in Athens [37] and Dublin [38]. For this reason, European projects like HADA [39], Eco.Port [40], NoMEPorts [41], SIMPYC [42], EcoPorts [43], MESP [44], and the on-going Interreg Maritime projects REPORT, RUMBLE and MON ACUMEN [45], have shed a bit of light on port noise in the very recent years. Mostly, all of them were focused on defining guidelines and assessing the problem on the END basis, while the Neptunes project [46] is studying noise produced by ships at berth.
The assessment of noise around ports is complicated, because the overall acoustic emission is the sum of roads, railways, or industrial installations in the area, as well as noise produced by ships themselves. Some authors investigated noise emitted from ships at berth [47,48,49,50,51] and all studies confirmed the complexity of the source. Internal machinery sources propagating trough hull vibrations, aerodynamic noise produced by funnels, heating and ventilation systems, and eventual outside cranes all contribute to the overall produced noise. Furthermore, the machinery functioning varies during different operating conditions occurring in ports: moving; maneuvering, mooring, and ground operations [52].
To the best of the authors’ knowledge, only a few studies have been dedicated to moving ships: Badino et al. [53] reported a measurement methodology, Di Bella et al. [54] and Fausti et al. [55] performed pass-by measurements of cruise ships, while Bernardini et al. [56] characterized the sound power level of small vessels moving in channels.
No proper characterization of the noise emission of large seagoing ships during their moving inside ports has been completely published. Thus, the present paper aims to fill this gap, starting from a long-term noise measurement performed during summer, which is the busiest period, placed along the “industrial canal” of the port of Livorno (Italy). A-weighted sound pressure level and sound spectrum of thousands of ships’ pass-by measures are collected. With the support of the surveillance cameras of the Port Authority, each noise information is assigned to a specific ship in order to finally compute the average sound power level (LW/m) and 1/3 octave band sound power spectrum of five different categories of ships: RORO (Roll-on/roll-off), container ships, oil tankers, chemical tankers, and ferries.
Together with the traffic flows, the newly obtained information can be the input for acoustic propagation models in order to evaluate noise in the surrounding areas. In this way, the present paper represents a valid improvement for the noise mapping and action plans phases of port areas, which, at present, do not include the noise emitted by moving ships.
The paper is structured as follows: the second chapter presents the materials and methods used in the paper, thus describing the area where measurements are performed, the parameters acquired, and some statistical data of ship types which pass during the measurements. The third chapter presents the results of the characterization of the noise emission of vessels, while the last chapter discusses and concludes the paper.

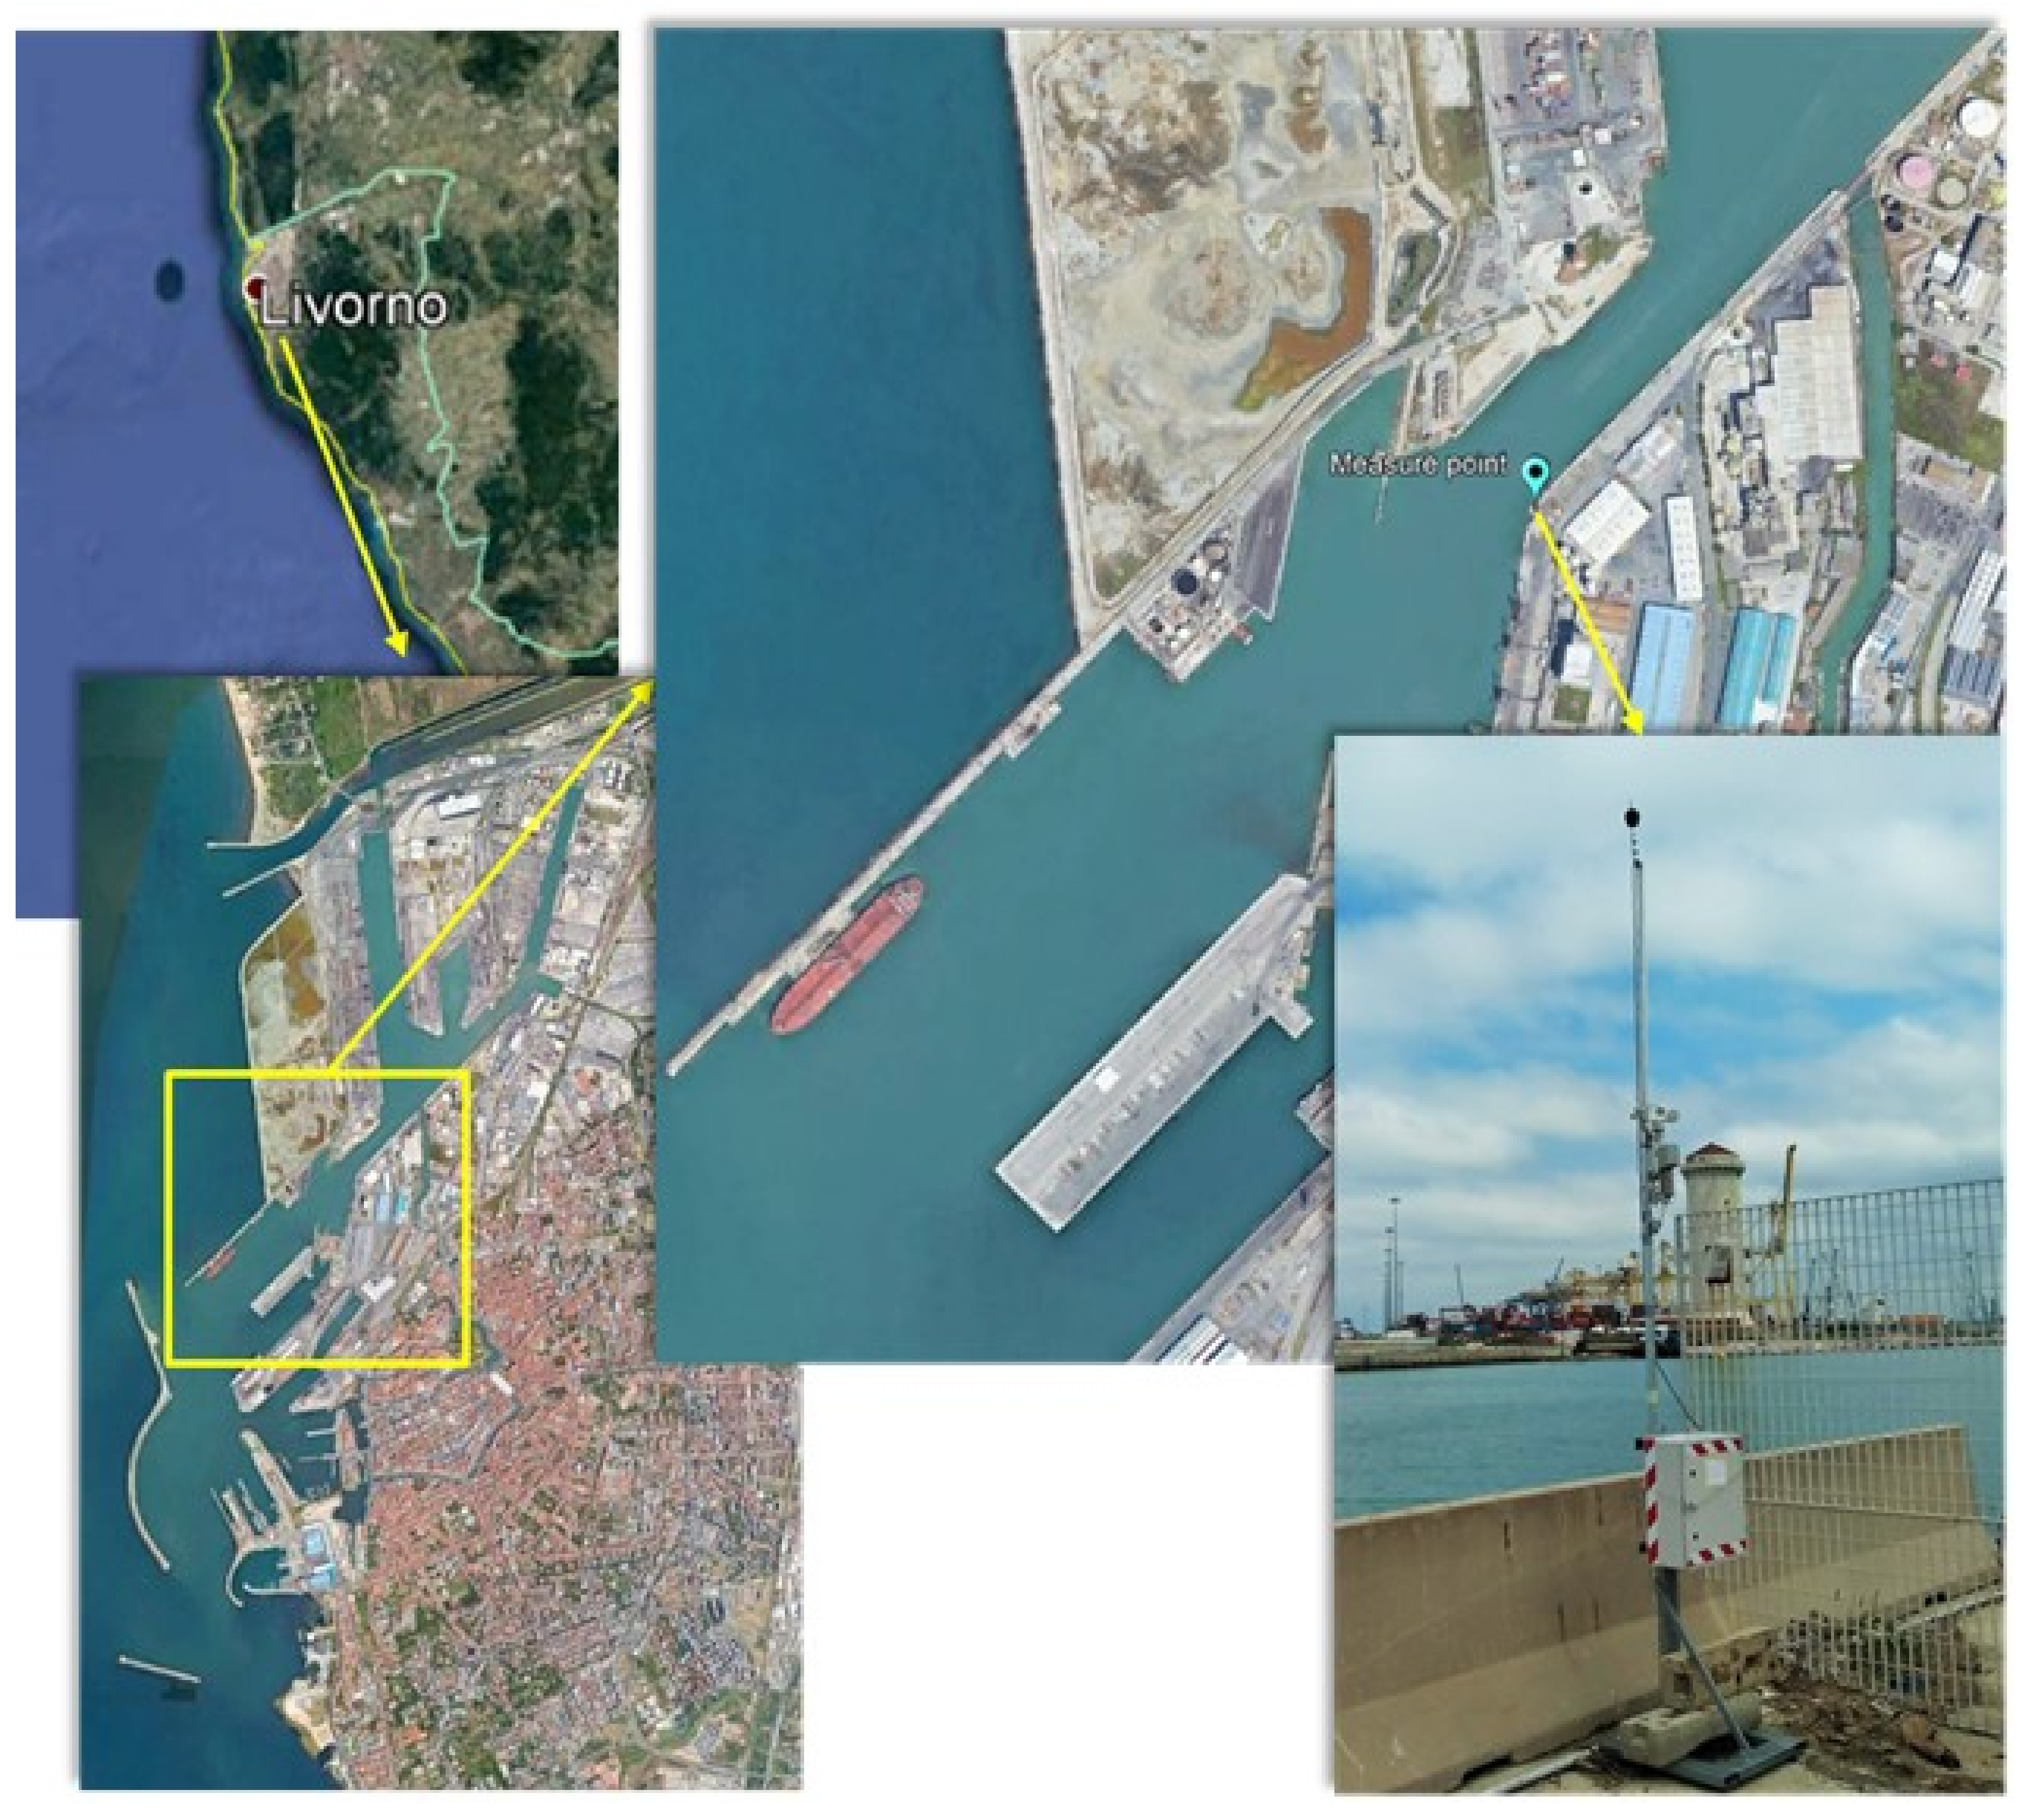
2. Materials and Methods
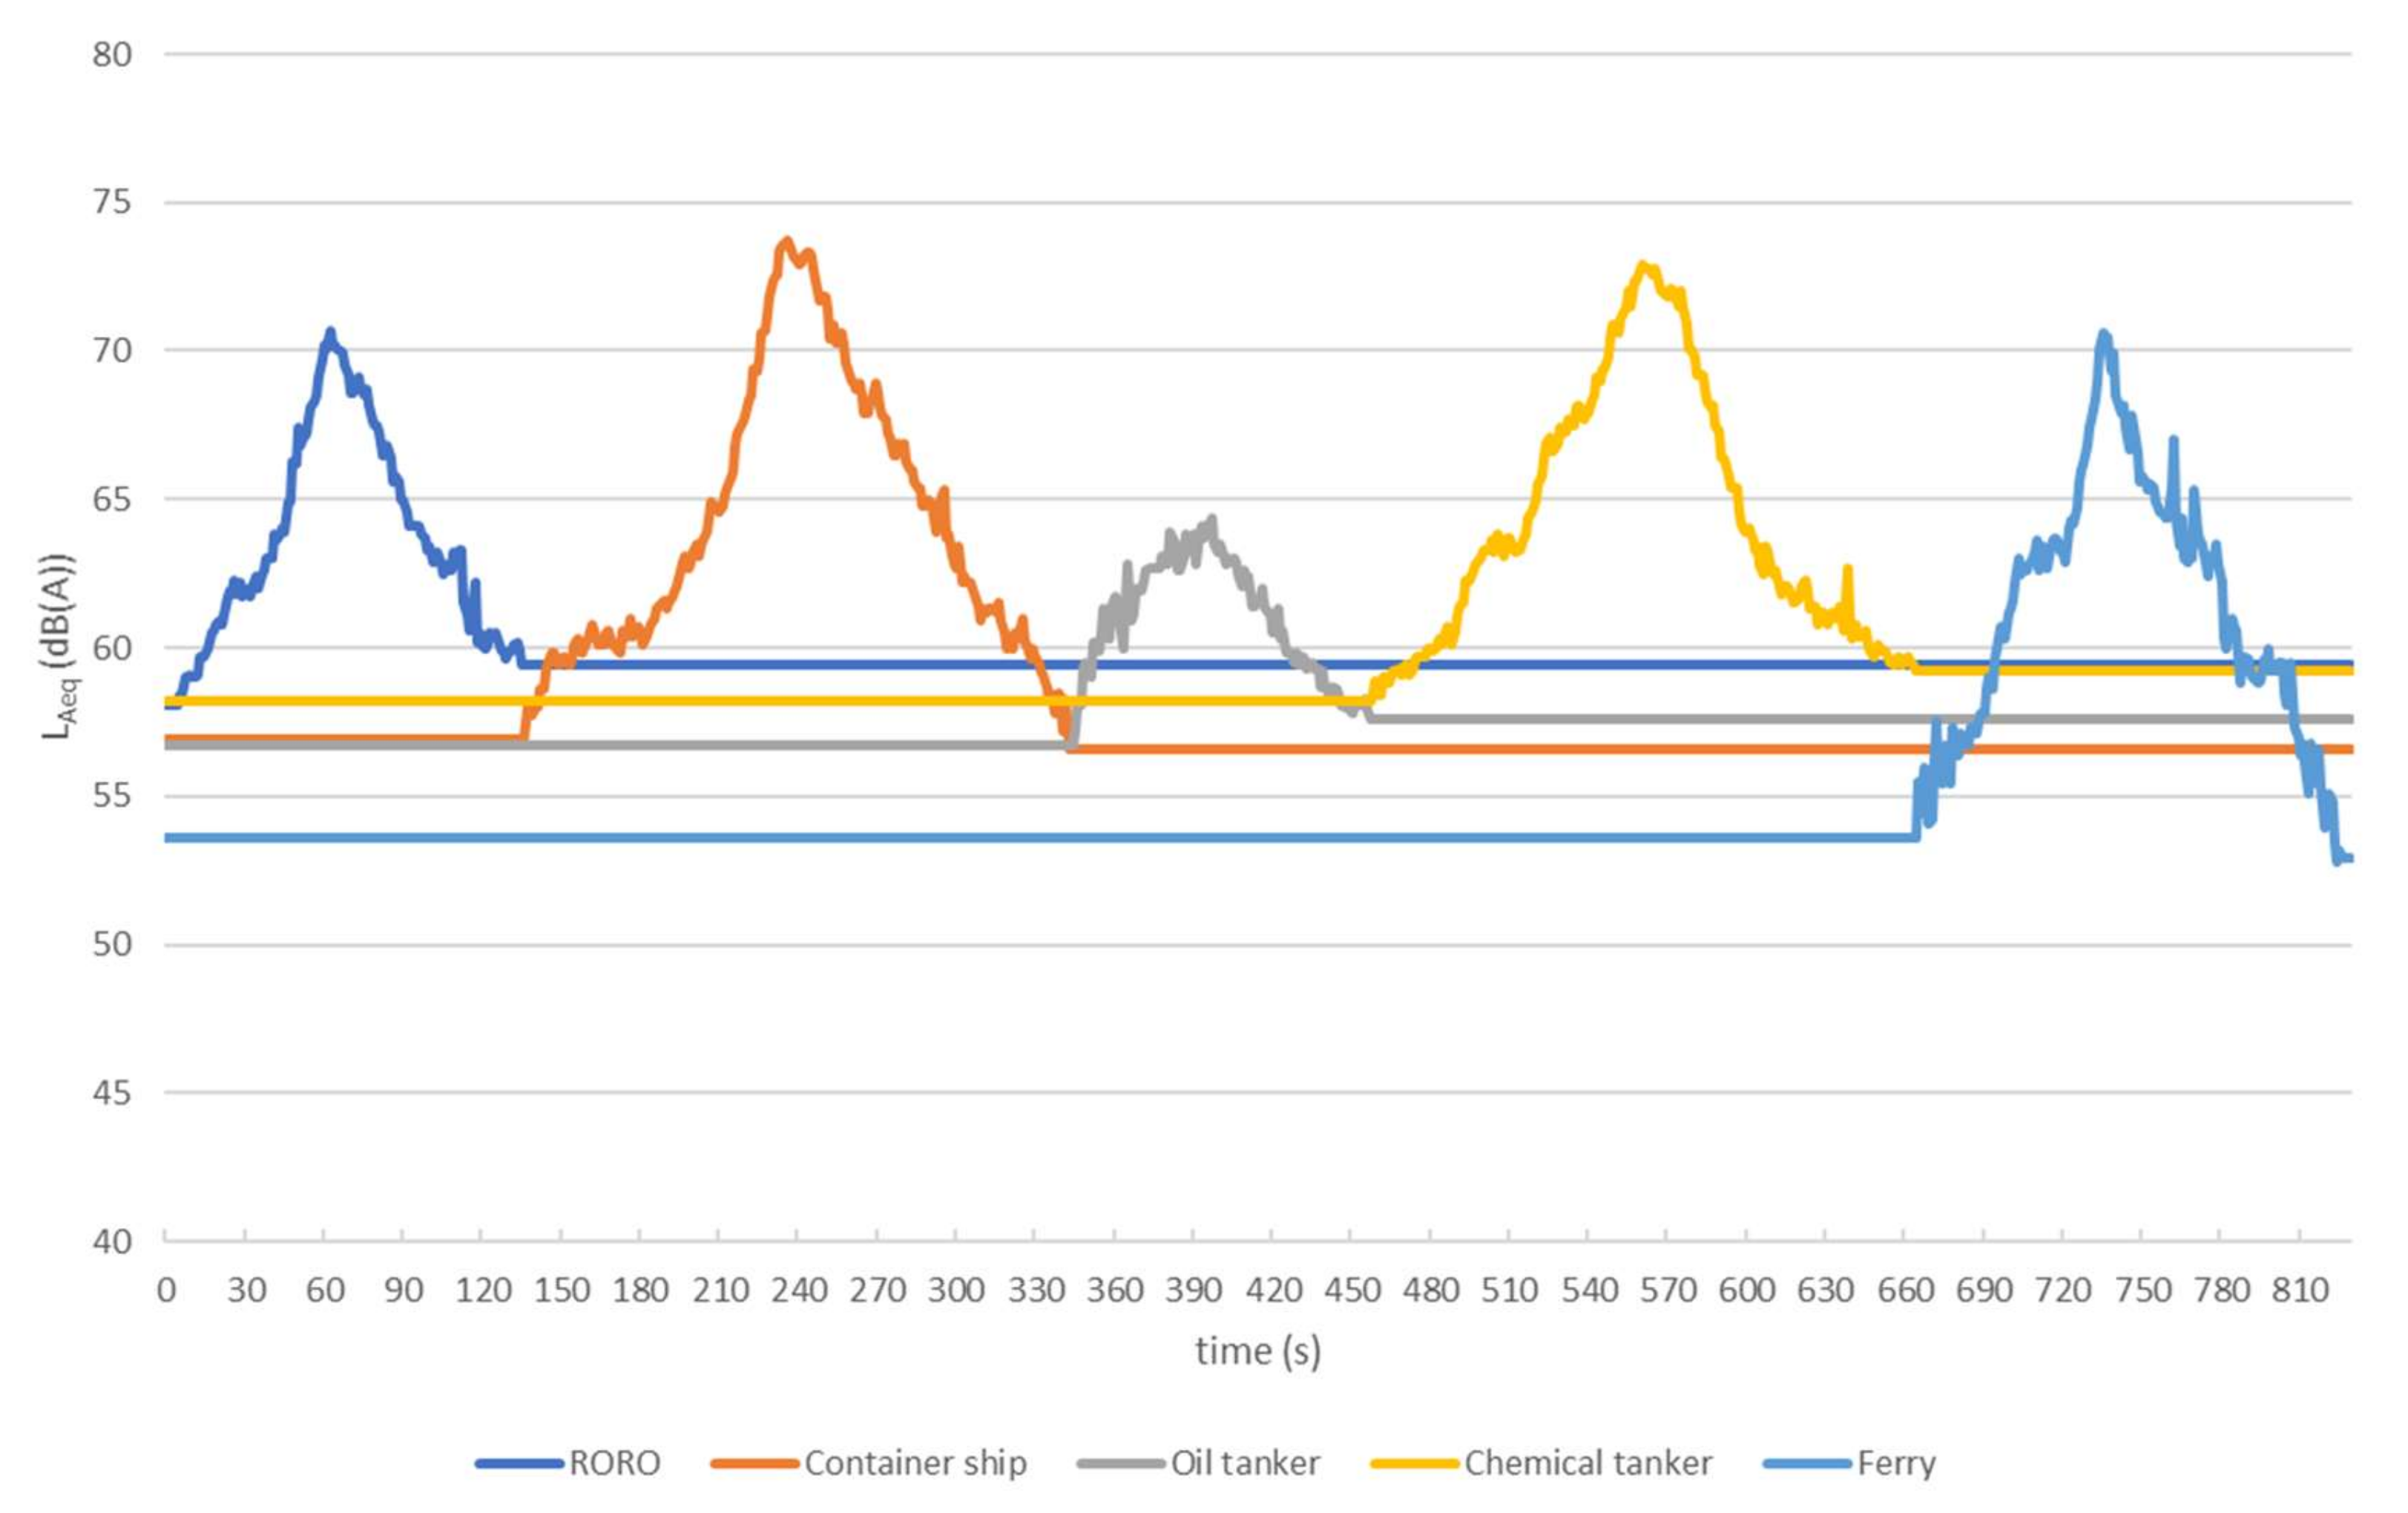
The work was based on an extremely long-term measurement of noise performed from 24th May 2018 to 5th September 2018 at a quay along the “industrial canal” of the port of Livorno, one of the largest in Italy. With its annual traffic capacity of about 36 million tons of cargo and 748,000 TEUs (twenty-foot equivalent unit) in 2018, the port of Livorno is also one of the largest ports in the Mediterranean Sea. The canal where the measurements were carried out represents the only access for all kind of vessels inward and outward from the industrial port area. Thus, all kind of ships, from Lift-on/lift-off (LOLO), RORO, container ships, and ferryboats to smaller vessels like tugboats and pilot boats that passed in front of the measurement position could be registered.
Due to port regulation, the ships’ passing speed limit is 5 knots, and in the present work this value was assumed to be constant for all transits.
A weather mast and a class I instrumentation according to IEC 61672-1 [57] were placed in the area reported in Figure 1. The area where the instrumentation was set up was a storage of sequestered boats managed by the Port Authority, not accessible by people. Except for ship noise, the only competing source in the area was represented by an internal road transited by few trucks, thus the background noise was mainly given by sea and wind sounds.
The microphone, equipped with a 90 mm windscreen foam, was sited at 1 m from the shore and at 4 m height, far from obstacles and in free field conditions. The 100 ms time-history of noise level was acquired and subsequently cleaned by periods with rainfall or with wind speed exceeding 5 m/s.
In accordance with the Port Authority, the surveillance cameras of the area were accessed and used to recognize each ship transit which occurred in the canal. Unfortunately, video data were recorded only for nearly one month, a shorter period with respect to the overall noise measurement. In order to extend the information to the overall period, incoming/outcoming transits and type of vessel were taken from the telematic system portal ShipInfo’s.
Figure 2 reports the percentage of transit for each ship type with respect to the totals. Tugboats and pilot boats were not considered in this work and are not reported in the picture. RORO and LOLO are almost similar from a structural point of view. Thus, in the following analysis for assessing the ships’ pass-by noise emission, they were considered as a single type. However, their differences can emerge in the load/unload phases, where cranes, onboard or at ground, are used for LOLO to move the shipping containers over the hull that, on the contrary, are not present in the RORO. “Other” included ships with very few transits, like gas carriers, supply vessel, and dredgers.
The ships that were therefore acoustically characterized in this work are ROROs, container ships, oil tankers, chemical tankers, and ferries, which together represent 99% of the totality of the ships that passed through the canal.
The weather mast was used for acquiring the rainfall rate, average wind speed, temperature, and humidity. Sea state was also gathered from the ships’ information telematics system portals.
Only well-identified transits were taken into consideration in the analysis, i.e., those not affected by the noise of the truck traffic. Furthermore, each noise event should have occurred in a period where wind speed was less than 5 m/s, no rainfall was present, and the Beaufort number of the sea was lower than 3, as also suggested by Borelli et al. [58].
Thus, for each single passage in front of the instrumentation, besides the information of category of vessel, the following set of data was acquired using the sound level meter:
  • Noise level (LAeq)
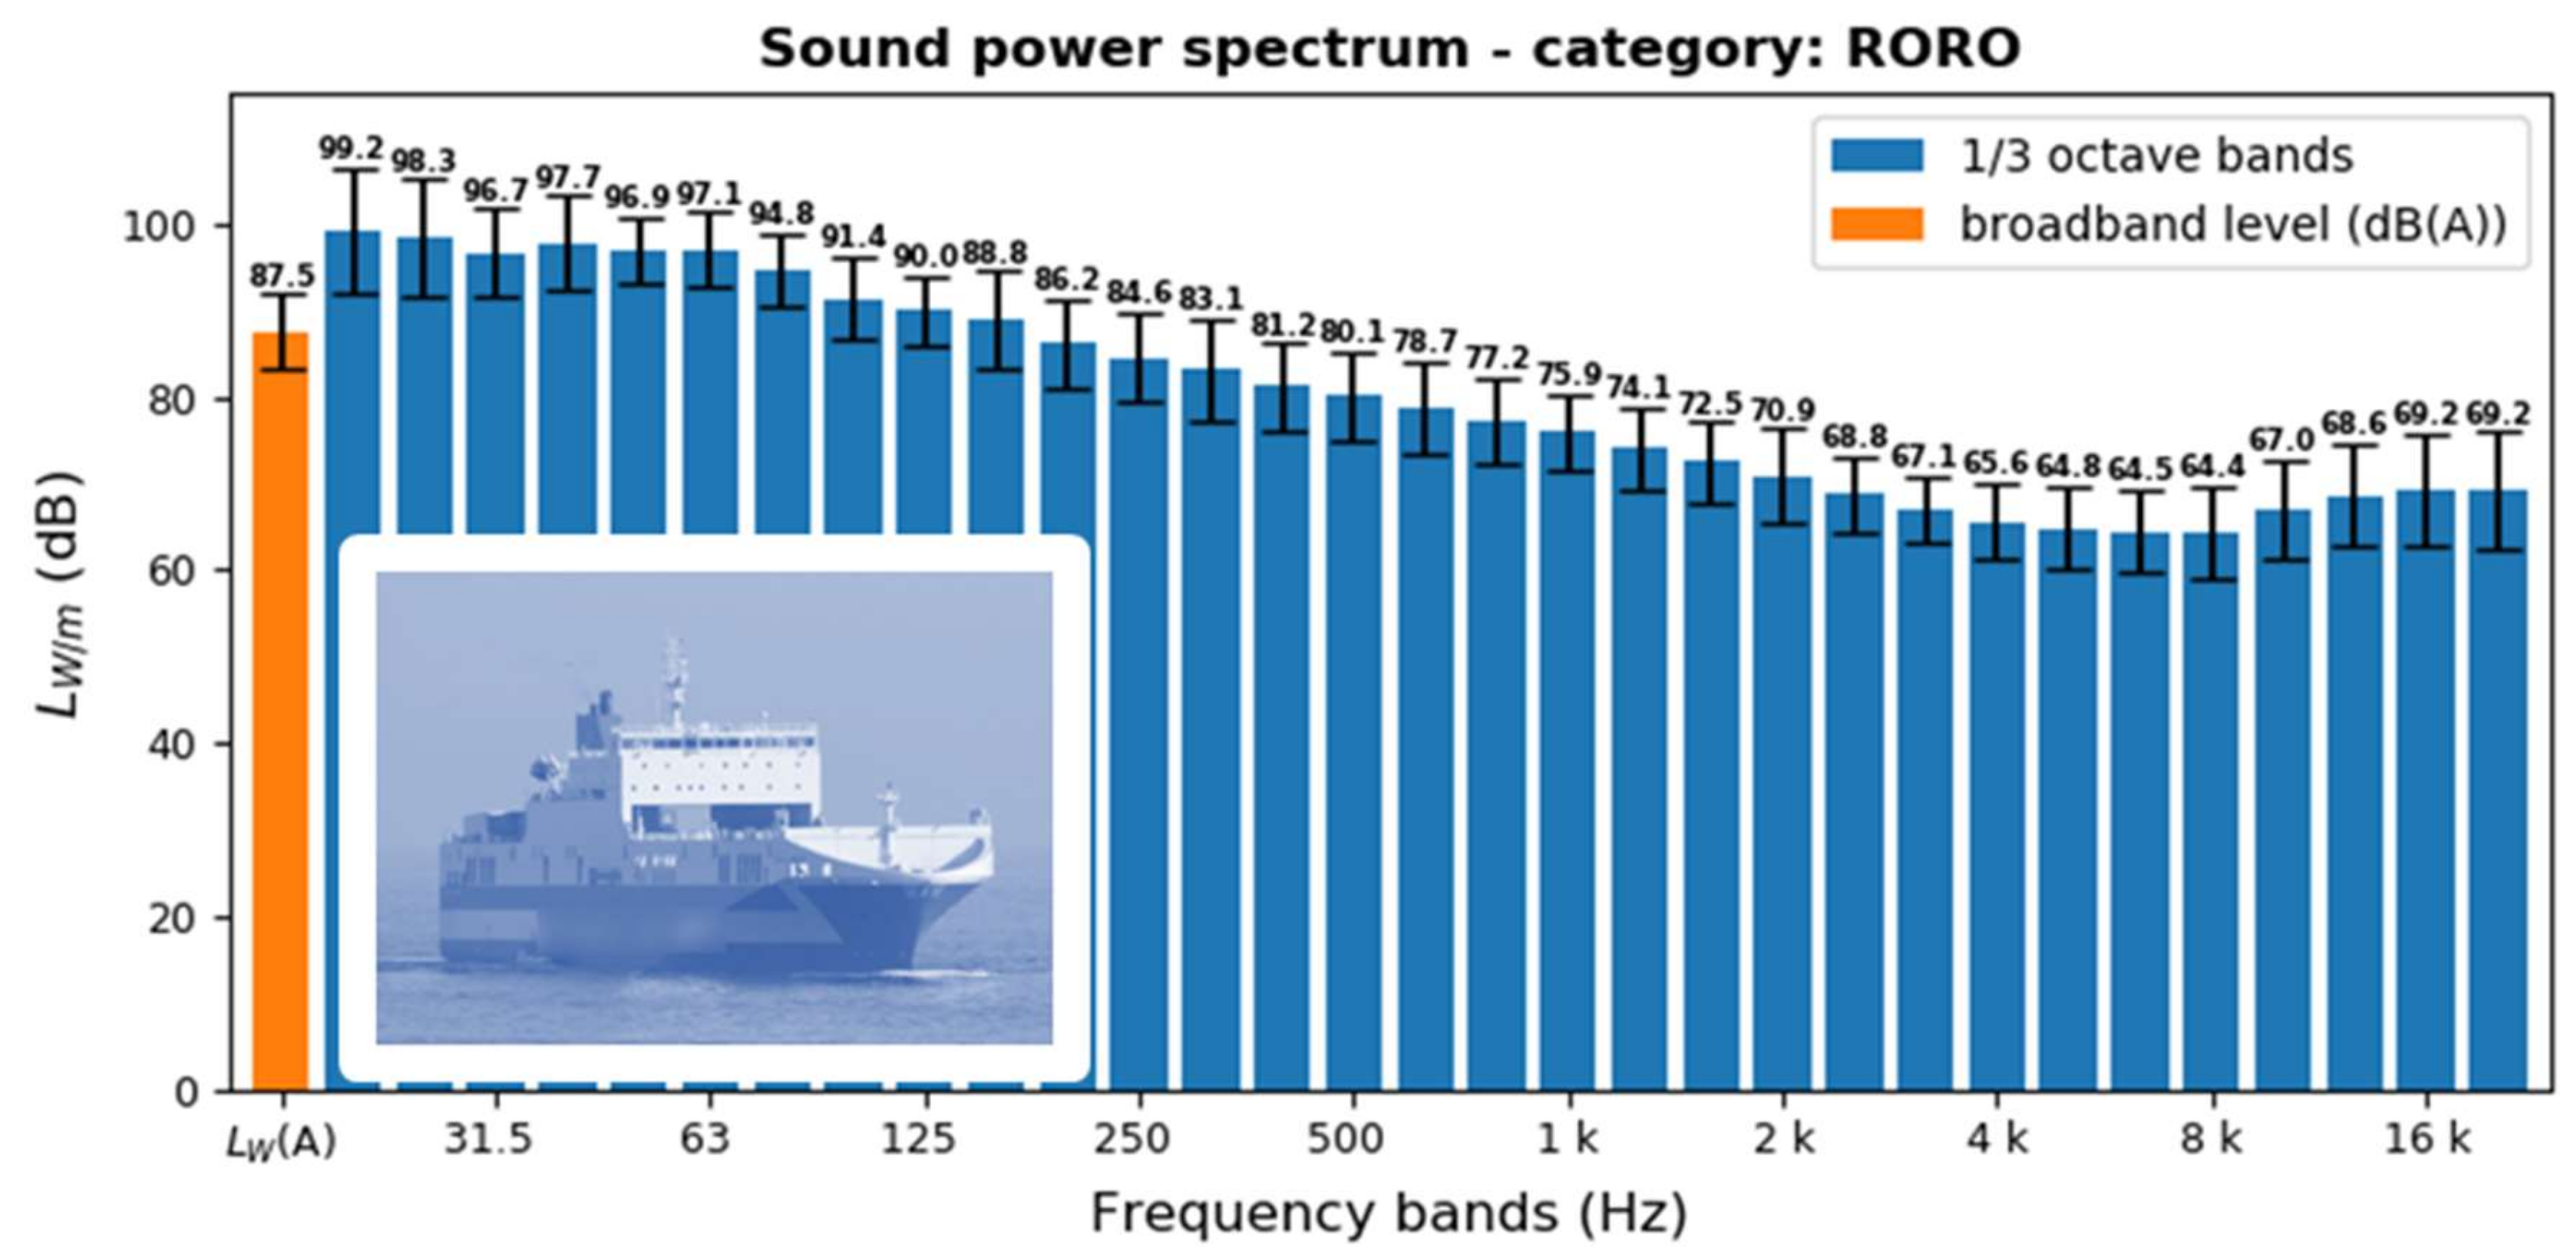
  • 1/3 octave band sound pressure spectrum
  • Average passage time
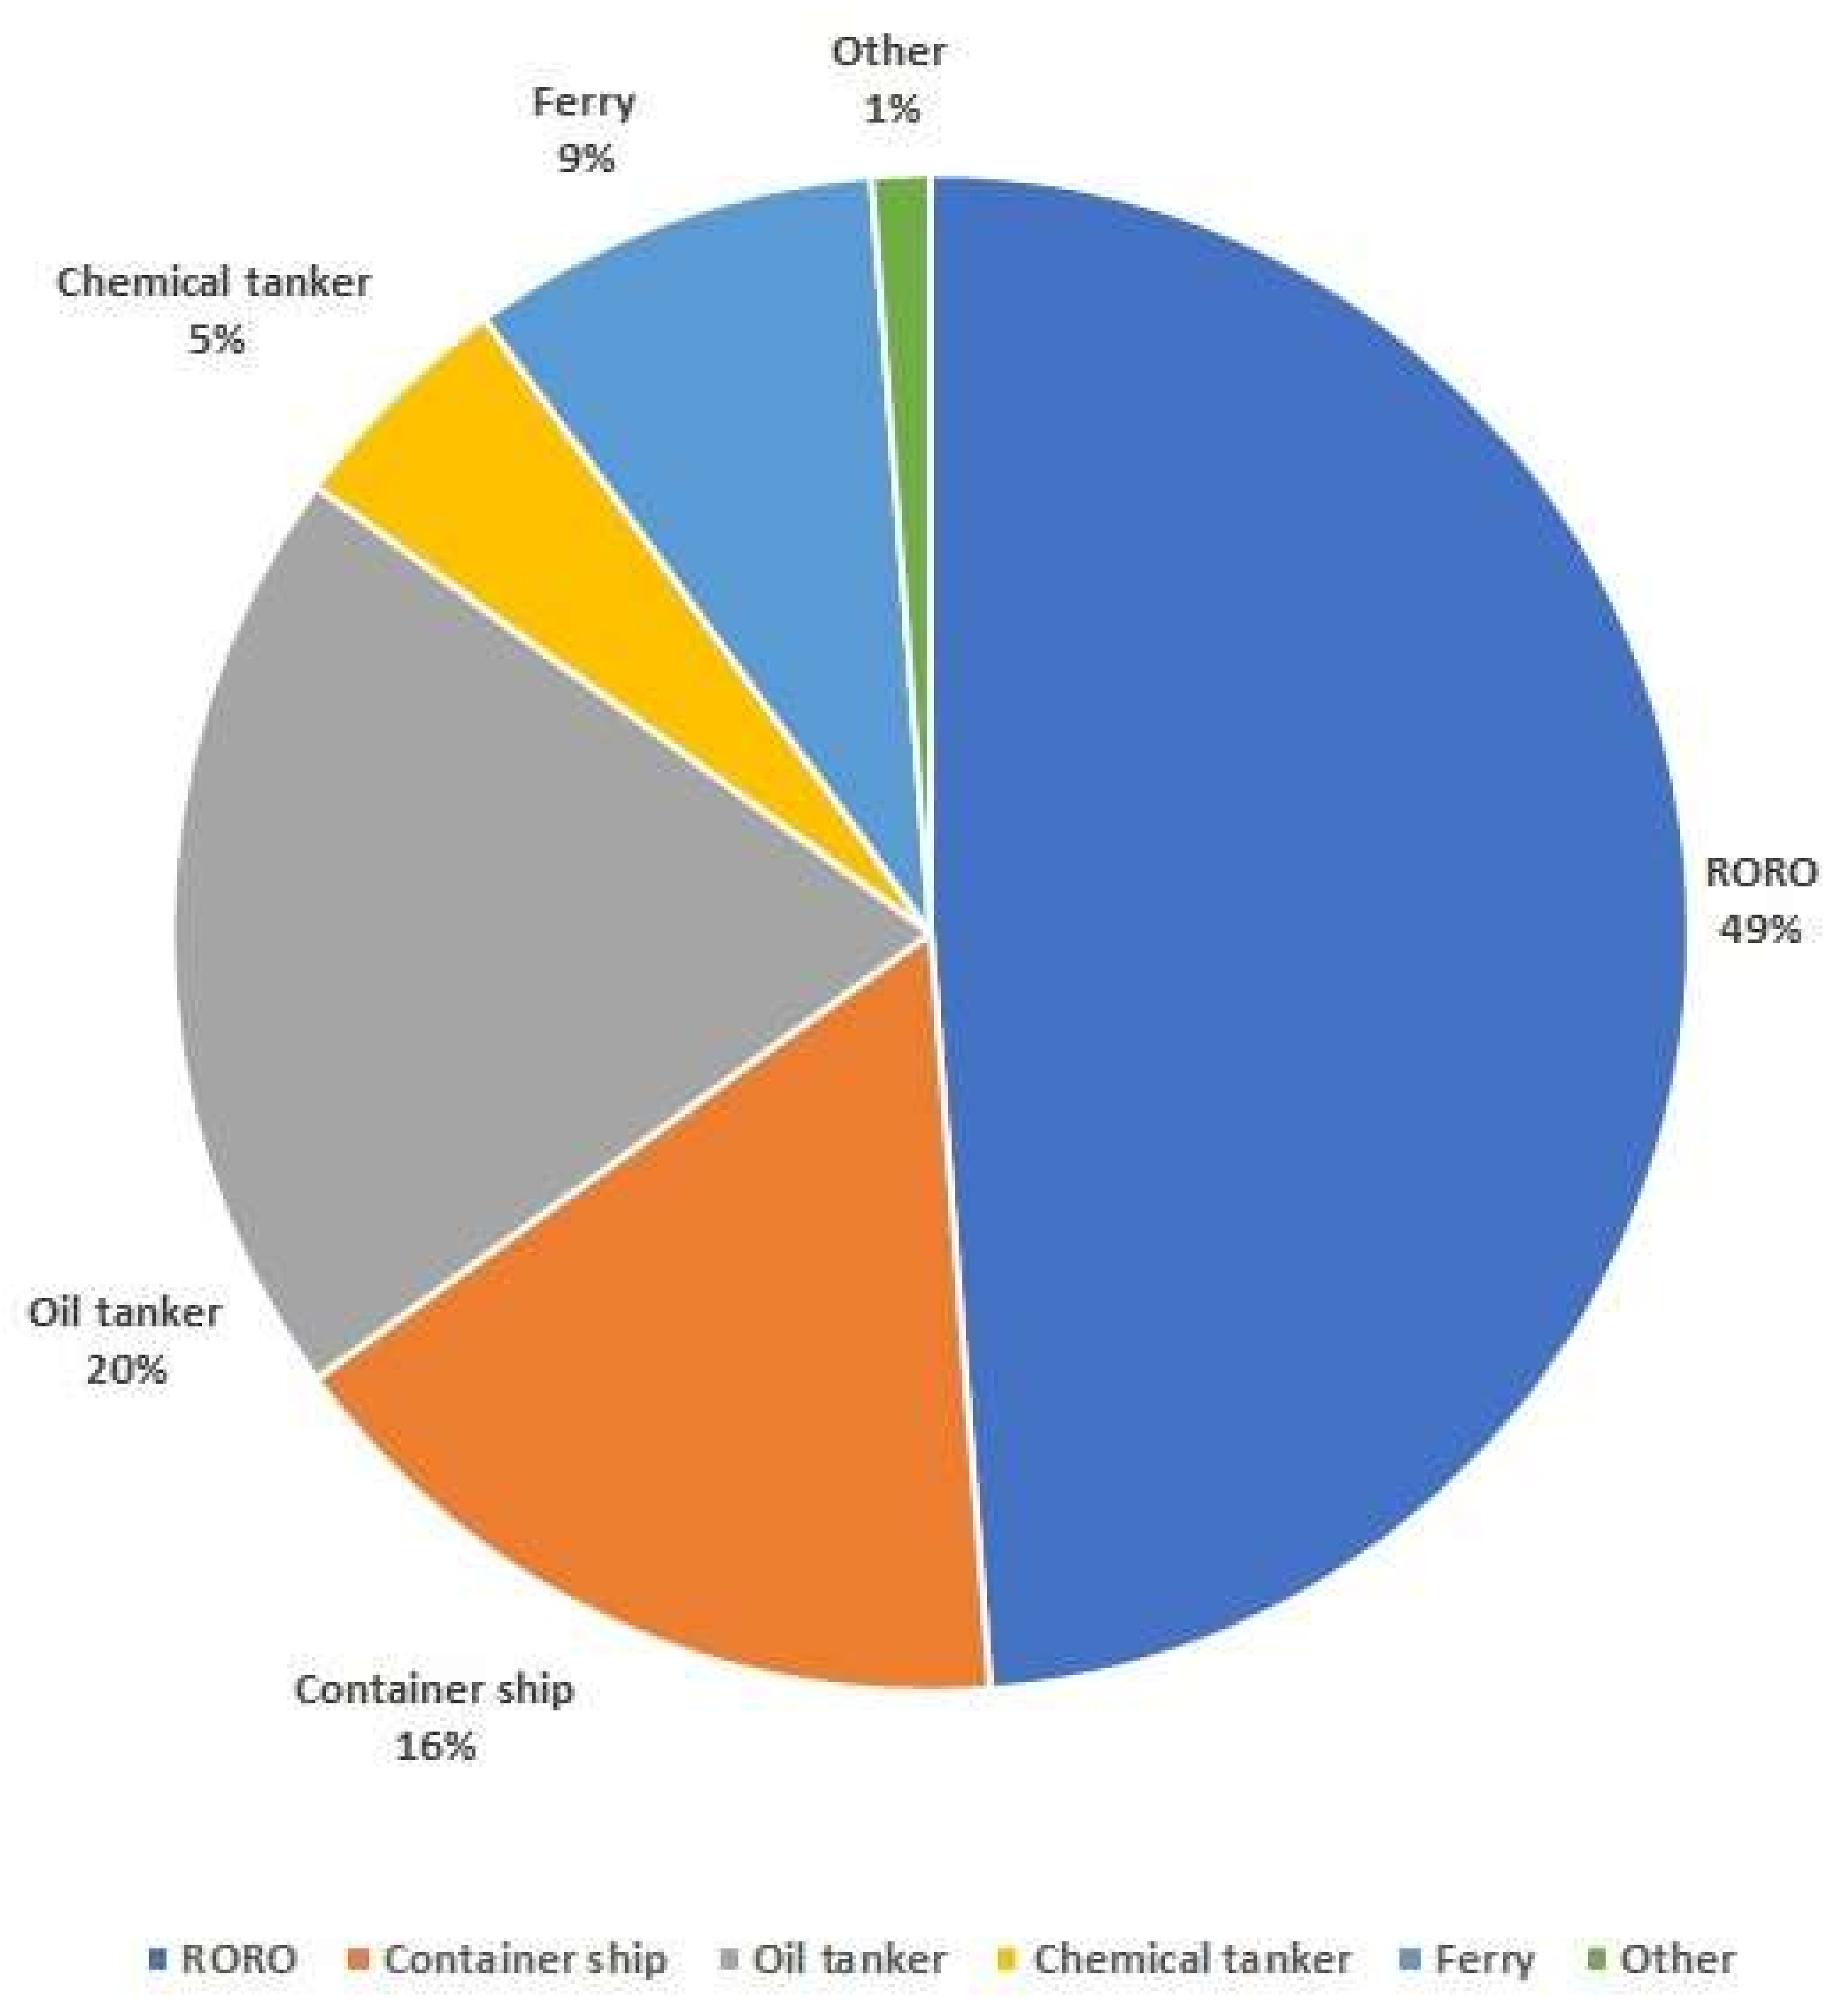
3. Results

The characterization of the noise emission of vessels passing in front of the sound level meter placed in the industrial canal of the Port of Livorno started from time history of the long-term noise measurement. The LAeq and the linear spectrum of each passage were extracted, marking 10 dB(A) around their peak. A database with each row containing the measured LAeq, time, duration, category of vessel, and noise spectrum of each pass-by was created.
The subsequent analysis was performed separately for each vessel type.
Figure 3 reports an example of a typical pass-by for each category of vessel seen in the 100 ms time-history of noise level. For a better comprehension of the picture, background noise before and after each passage was set to a constant level.
At first sight, container ship is the category with the highest peak in noise level measured, with oil tanker much more silent than all the others. For all the ships, the highest noise corresponds with the ventilation close to the chimney. Other eventual smaller spikes are given by other ventilation systems present on the hull. Furthermore, due to service reasons, ships entering and exiting the port are pulled by tugboats in a number depending on their category: generally, ROROs and container ships have two, oil tankers and chemical tankers have one, while ferries have none. The tugboats’ presence was reflected in the measured pass-by by enlarging either both tails, if they were two, or just one tail, if it was one. However, the authors decided to keep the tugboat noise included in the measured sound level of each ship category, and therefore also in the characterization of their category, because the two transits are connected and inseparable.
Table 1 reports their average duration. Their standard deviation was large probably not because of the speed, which remained approximately constant in the canal, but partly because of the different length of the ships in each category. Furthermore, it should be remembered that the duration of the pass-by means the duration of the measured sound event associated with the pass-by. Thus, most of the standard deviation associated derived from the different signal-to-noise ratio.
The average LAeq and 1/3 octave band spectra for each category were computed. Then, considering a geometrical distance of 53.5 m from the measurement point to the source, the average total sound power level (LW/m) and the 1/3 octave band sound power spectrum were calculated for each category by using the Expert Industry Toolbox of SoundPLAN vers. 8.1, which enabled the estimation of a source emission from measurements.
The resulting estimate for the sound power level and 1/3 octave band sound power spectrum of each vessel category are reported in Figure 4, Figure 5, Figure 6, Figure 7 and Figure 8.

4. Discussion and Conclusions

The attention towards noise produced in port areas has finally increased in recent years thanks to European Interreg maritime and a few other projects. Studies on the noise emitted by moored ships have therefore been published, reporting that the funnel, heating, ventilation, and air-conditioning systems are the principal sources for a ship at quay. In addition, during loading/unloading phases noisy machinery such as cranes or winches are used and produce a different kind of emission, making the overall noise produced very complex.
However, ships are not stationary sources. In fact, due to port geography and speed restrictions, they have to sail inside ports for a consistent amount of time in order to reach their docking. Each ship, entering and then exiting the port, spends overall two hours moving along the canals before reaching the open sea. Such an amount of time makes the ship transit unneglectable from a noise exposure point of view of the citizens living in the surrounding areas.
Unfortunately, to the best of the authors’ knowledge, only transits of small vessels and cruise ships have been characterized in the literature. Thus, the present paper aimed to cover this absence of scientific detailed literature about noise emitted by seagoing ships during their passage in port areas at a reduced speed regime.
The present paper reported the sound power level and 1/3 octave band sound power spectrum of five categories of ship: RORO, container ships, oil tankers, chemical tankers, and ferries. The results, with uncertainties, were obtained using data coming from a specific long-term noise measurement performed for more than three months along the route ships follow to enter the industrial port of Livorno (Italy). A weighted sound pressure level, sound spectrum, and the duration of each pass-by were joined with the corresponding type of vessel taken by surveillance cameras of the Port Authority and from the ships’ information telematics system portals. With the so built database of each pass-by, the average LW/m and 1/3 octave band sound power spectrum information were computed for each of the five categories.
The acquired data partly fulfilled the BS EN ISO 2922:2000 + A1:2013 [59] requests, such as no reflecting surfaces were present within 30 m around the vessel and the microphone, the height above water was approximately 4 m, the passages taken into account had the maximum of the level at least 6 dB over the background noise, in most cases even 10 dB above, and a sea state lower than 3 for all passages considered. However, some other prescriptions of the standard could not be applied to the present experimental setup for several critical points, such as the course of the sailing vessels was not under the authors’ control, the distance of the sound level meter from the vessel side was variable because of the variable widths of the sailing vessels (from 15 m to 40 m), and it was not possible to keep the spread of the sound level indicator lower than 3 dB because of ship and distance variability. It should be said that the ISO aims to provide specifies for acceptance and monitoring test vessels in test sessions, proving compliance with noise specification or prescribed limits and checking that no noticeable changes have occurred. In a real case scenario, the ISO was not applicable.
The moving ship noise emission was the sum of different mechanisms of generation, such as the water crossed by the ship, ventilation systems over the hull, low rpm engines, and, above all, the ventilation close to the chimney. Tugboats pulling the measured ships were included in the noise emission of the category of ships which normally need them: two for ROROs and container ships, one for oil and chemical tankers, and none for ferries.
Container ships were the category with the highest sound power level, while oil tankers were the lowest, with almost 7 dB(A) less.
Some difficulties emerged during the work, especially in finding the right place to perform such a long-term measurement. The chosen site had to be safe for leaving the instrumentation unattended, while being also sheltered enough from unwanted sound sources. The choice fell on a site that was slightly disturbed by truck transit, which, in some case, altered the ships’ pass-by measurements. Therefore, some transits were deleted, while others were lost due to missing information from malfunctioning of the surveillance camera and/or not registered traffic from the ships’ information telematics system portals. However, this issue was foreseen, and the long duration of the measurement still guaranteed sufficient statistics for each category.
Part of the uncertainty in the results originated from the distance source-receiver. Indeed, with a canal 100 m wide, ships are forced to pass in its middle, thus maintaining a fixed distance from the microphone. This is surely true for larger vessels, while for smaller ones some fluctuations on the distance could emerge, leading to uncertainties in the calculation of sound power level from the sound pressure level. The expected variation should be significant, but with the available video data a proper estimate was not possible. Nevertheless, the uncertainty on the sound power level was higher for bigger vessels like RORO and container ships. This is due to the greater number of different vessels that were present within these categories, as well as to the variability, which could introduce a load difference. These parameters, like others, are the subject of a subsequent study currently underway.
The directivity of the sources was not investigated. However, as previously reported, the pass-by of a large ship is the sum of a multitude of complex sources. Considering the distances at which noise usually propagates to reach receivers, directivity should not be a problem. This aspect is certainly worth being investigated, but in a very noisy environment like a port, where many noise sources are emitting simultaneously, isolating a specific source is almost impossible. In order to overcome this issue, the authors are planning a future measurement campaign using an acoustic camera based on an array of microphones.
At present, the obtained sound power levels and 1/3 octave band sound power spectrum for the five categories of seagoing ships represent new information that will extend the current knowledge regarding noise emitted by ships in a port, adding their noise produced while moving. This information increases the detail in input to noise propagation models for evaluating the noise in the surrounding areas and the noise exposure of citizens, mandatory for noise mapping and action plans according to the European Noise Directive.

Author Contributions

Conceptualization, L.F. and G.L.; methodology, L.F. and M.N.; validation, M.N. and M.B.; formal analysis, L.F., M.N. and M.B.; investigation, L.F. and M.N..; resources, L.F., M.N. and M.B.; data curation, M.N. and M.B.; writing—original draft preparation, L.F.; writing—review and editing, L.F., G.L. and F.F.; supervision, G.L. and F.F.; project administration, F.F.; funding acquisition, G.L. and F.F. All authors have read and agreed to the published version of the manuscript.

Funding

This research received no external funding.

Acknowledgments

The authors thank the Port Authority of Livorno for the data provided, as well as Alessandro Del Pizzo and Sandra Hill for linguistic support and proof reading of the article.

Conflicts of Interest

The authors declare no conflict of interest.

References

  1. Irvine, K.N.; Devine-Wright, P.; Payne, S.R.; Fuller, R.A.; Painter, B.; Gaston, K.J. Green space, soundscape and urban sustainability: An interdisciplinary, empirical study. Local Environ. 2009, 14, 155–172. [Google Scholar] [CrossRef]
  2. Moser, G. Quality of life and sustainability: Toward person-environment congruity. J. Environ. Psychol. 2009, 29, 351–357. [Google Scholar] [CrossRef]
  3. Power, M.; Bullinger, M.; Harper, A. The World Health Organization WHOQOL-100: Tests of the universality of quality of life in 15 different cultural groups worldwide. Health Psychol. 1999, 18, 495. [Google Scholar] [CrossRef] [PubMed]
  4. Evandt, J.; Oftedal, B.; Hjertager Krog, N.; Nafstad, P.; Schwarze, P.E.; Marit Aasvang, G. A population-based study on nighttime road traffic noise and insomnia. Sleep 2017, 40. [Google Scholar] [CrossRef]
  5. Cassina, L.; Fredianelli, L.; Menichini, I.; Chiari, C.; Licitra, G. Audio-Visual preferences and tranquillity ratings in urban areas. Environments 2018, 5, 1. [Google Scholar] [CrossRef] [Green Version]
  6. Guski, R.; Schreckenberg, D.; Schuemer, R. WHO environmental noise guidelines for the European region: A systematic review on environmental noise and annoyance. Int. J. Environ. Res. Public Health 2017, 14, 1539. [Google Scholar] [CrossRef] [Green Version]
  7. Héritier, H.; Vienneau, D.; Foraster, M.; Eze, I.C.; Schaffner, E.; Thiesse, L.; Brink, M. Transportation noise exposure and cardiovascular mortality: A nationwide cohort study from Switzerland. Eur. J. Epidemiol. 2017, 32, 307–315. [Google Scholar] [CrossRef]
  8. Vienneau, D.; Schindler, C.; Perez, L.; Probst-Hensch, N.; Röösli, M. The relationship between transportation noise exposure and ischemic heart disease: A meta-Analysis. Environ. Res. 2015, 138, 372–380. [Google Scholar] [CrossRef]
  9. Dratva, J.; Phuleria, H.C.; Foraster, M.; Gaspoz, J.M.; Keidel, D.; Künzli, N.; Schindler, C. Transportation noise and blood pressure in a population-Based sample of adults. Environ. Health Perspect. 2011, 120, 50–55. [Google Scholar] [CrossRef]
  10. Babisch, W.; Swart, W.; Houthuijs, D.; Selander, J.; Bluhm, G.; Pershagen, G.; Sourtzi, P. Exposure modifiers of the relationships of transportation noise with high blood pressure and noise annoyance. J. Acoust. Soc. Am. 2012, 132, 3788–3808. [Google Scholar] [CrossRef]
  11. Recio, A.; Linares, C.; Banegas, J.R.; Díaz, J. Road traffic noise effects on cardiovascular, respiratory, and metabolic health: An integrative model of biological mechanisms. Environ. Res. 2016, 146, 359–370. [Google Scholar] [CrossRef] [PubMed]
  12. Van Kempen, E.; Babisch, W. The quantitative relationship between road traffic noise and hypertension: A meta-analysis. J. Hypertens. 2012, 30, 1075–1086. [Google Scholar] [CrossRef] [PubMed] [Green Version]
  13. Lercher, P.; Evans, G.W.; Meis, M. Ambient noise and cognitive processes among primary schoolchildren. Environ. Behav. 2003, 35, 725–735. [Google Scholar] [CrossRef]
  14. Minichilli, F.; Gorini, F.; Ascari, E.; Bianchi, F.; Coi, A.; Fredianelli, L.; Cori, L. Annoyance judgment and measurements of environmental noise: A focus on Italian secondary schools. Int. J. Environ. Res. Public Health 2018, 15, 208. [Google Scholar] [CrossRef] [Green Version]
  15. Lechner, C.; Schnaiter, D.; Bose-O’Reilly, S. Combined Effects of Aircraft, Rail, and Road Traffic Noise on Total Noise Annoyance—A Cross-Sectional Study in Innsbruck. Int. J. Environ. Res. Public Health 2019, 16, 3504. [Google Scholar] [CrossRef] [Green Version]
  16. Basner, M.; Babisch, W.; Davis, A.; Brink, M.; Clark, C.; Janssen, S.; Stansfeld, S. Auditory and non-Auditory effects of noise on health. Lancet 2014, 383, 1325–1332. [Google Scholar] [CrossRef] [Green Version]
  17. Tiesler, C.M.; Birk, M.; Thiering, E.; Kohlböck, G.; Koletzko, S.; Bauer, C.P.; Heinrich, J. Exposure to road traffic noise and children’s behavioural problems and sleep disturbance: Results from the GINIplus and LISAplus studies. Environ. Res. 2013, 123, 1–8. [Google Scholar] [CrossRef] [Green Version]
  18. Onakpoya, I.J.; O’Sullivan, J.; Thompson, M.J.; Heneghan, C.J. The effect of wind turbine noise on sleep and quality of life: A systematic review and meta-Analysis of observational studies. Environ. Int. 2015, 82, 1–9. [Google Scholar] [CrossRef]
  19. Park, T.; Kim, M.; Jang, C.; Choung, T.; Sim, K.A.; Seo, D.; Chang, S. The Public Health Impact of Road-Traffic Noise in a Highly-Populated City, Republic of Korea: Annoyance and Sleep Disturbance. Sustainability 2018, 10, 2947. [Google Scholar] [CrossRef] [Green Version]
  20. Trojanek, R.; Tanas, J.; Raslanas, S.; Banaitis, A. The impact of aircraft noise on housing prices in Poznan. Sustainability 2017, 9, 2088. [Google Scholar] [CrossRef] [Green Version]
  21. European Union. Directive 2002/49/EC of the European parliament and the Council of 25 June 2002 relating to the assessment and management of environmental noise. Off. J. Eur. Communities L 2002, 189, 2002. [Google Scholar]
  22. Oltean-Dumbrava, C.; Watts, G.; Miah, A. Towards a more sustainable surface transport infrastructure: A case study of applying multi criteria analysis techniques to assess the sustainability of transport noise reducing devices. J. Clean. Prod. 2016, 112, 2922–2934. [Google Scholar] [CrossRef]
  23. Licitra, G.; Fredianelli, L.; Petri, D.; Vigotti, M.A. Annoyance evaluation due to overall railway noise and vibration in Pisa urban areas. Sci. Total Environ. 2016, 568, 1315–1325. [Google Scholar] [CrossRef]
  24. Kaewunruen, S.; Martin, V. Life cycle assessment of railway ground-Borne noise and vibration mitigation methods using geosynthetics, metamaterials and ground improvement. Sustainability 2018, 10, 3753. [Google Scholar] [CrossRef] [Green Version]
  25. Batóg, J.; Foryś, I.; Gaca, R.; Głuszak, M.; Konowalczuk, J. Investigating the Impact of Airport Noise and Land Use Restrictions on House Prices: Evidence from Selected Regional Airports in Poland. Sustainability 2019, 11, 412. [Google Scholar] [CrossRef] [Green Version]
  26. Tian, Y.; Wan, L.; Ye, B.; Yin, R.; Xing, D. Optimization Method for Reducing the Air Pollutant Emission and Aviation Noise of Arrival in Terminal Area. Sustainability 2019, 11, 4715. [Google Scholar] [CrossRef] [Green Version]
  27. Jianu, O.; Rosen, M.A.; Naterer, G. Noise pollution prevention in wind turbines: Status and recent advances. Sustainability 2012, 4, 1104–1117. [Google Scholar] [CrossRef] [Green Version]
  28. Gallo, P.; Fredianelli, L.; Palazzuoli, D.; Licitra, G.; Fidecaro, F. A procedure for the assessment of wind turbine noise. Appl. Acoust. 2016, 114, 213–217. [Google Scholar] [CrossRef]
  29. Kleizienė, R.; Šernas, O.; Vaitkus, A.; Simanavičienė, R. Asphalt Pavement Acoustic Performance Model. Sustainability 2019, 11, 2938. [Google Scholar] [CrossRef] [Green Version]
  30. Ohiduzzaman, M.D.; Sirin, O.; Kassem, E.; Rochat, J. State-Of-The-Art review on sustainable design and construction of quieter pavements—Part 1: Traffic noise measurement and abatement techniques. Sustainability 2016, 8, 742. [Google Scholar] [CrossRef] [Green Version]
  31. Wong, M.; Wang, T.; Ho, H.; Kwok, C.; Lu, K.; Abbas, S. Towards a smart city: Development and application of an improved integrated environmental monitoring system. Sustainability 2018, 10, 623. [Google Scholar] [CrossRef] [Green Version]
  32. Zambon, G.; Benocci, R.; Bisceglie, A.; Roman, H.E.; Bellucci, P. The LIFE DYNAMAP project: Towards a procedure for dynamic noise mapping in urban areas. Appl. Acoust. 2017, 124, 52–60. [Google Scholar] [CrossRef]
  33. Gori, P.; Guattari, C.; Asdrubali, F.; de Lieto Vollaro, R.; Monti, A.; Ramaccia, D.; Toscano, A. Sustainable acoustic metasurfaces for sound control. Sustainability 2016, 8, 107. [Google Scholar] [CrossRef] [Green Version]
  34. Danihelová, A.; Němec, M.; Gergeľ, T.; Gejdoš, M.; Gordanová, J.; Sčensný, P. Usage of Recycled Technical Textiles as Thermal Insulation and an Acoustic Absorber. Sustainability 2019, 11, 2968. [Google Scholar] [CrossRef] [Green Version]
  35. Fredianelli, L.; Del Pizzo, A.; Licitra, G. Recent developments in sonic crystals as barriers for road traffic noise mitigation. Environments 2019, 6, 14. [Google Scholar] [CrossRef] [Green Version]
  36. Review of Maritime Transport, UNCTAD/RMT/2018. Available online: https://unctad.org/en/PublicationsLibrary/rmt2018_en.pdf (accessed on 15 February 2020).
  37. Paschalidou, A.K.; Kassomenos, P.; Chonianaki, F. Strategic Noise Maps and Action Plans for the reduction of population exposure in a Mediterranean port city. Sci. Total Environ. 2019, 654, 144–153. [Google Scholar] [CrossRef]
  38. Murphy, E.; King, E.A. An assessment of residential exposure to environmental noise at a shipping port. Environ. Int. 2014, 63, 207–215. [Google Scholar] [CrossRef] [Green Version]
  39. Herramienta Automática de Diagnóstico Ambiental (Automatic Tool for environmental diagnosis), LIFE02 ENV/E/000274; Environment-LIFE: Brussels, Belgium, 2005.
  40. Eco.Port Project (cod. 41). EU Co-Financed Project through the European Regional Development Fund (ERDF) in the Framework of the Adriatic New Neighbourhood Program INTER-REG/CARDS-PHARE 2000–2006. Available online: https://www.port.venice.it/it/progetto-eco-port.html (accessed on 15 February 2020). (In Italian).
  41. NoMEPorts 2008. Noise Management in European Ports, LIFE05 ENV/NL/000018, Good Practice Guide on Port Area Noise Mapping and Management; Technical Annex; Environment-LIFE: Brussels, Belgium, 2008. [Google Scholar]
  42. SIMPYC 2008. Sistema de Integración Medioambiental de Puertos y Ciudades (Environmental integration for ports and cities), LIFE04 ENV/ES/000216; Environment-LIFE: Brussels, Belgium, 2008. [Google Scholar]
  43. EcoPorts 2011. EcoPorts Project, Information Exchange and Impact Assessment for Enhanced Environmental-Conscious Operations in European Ports and Terminals, FP5. Available online: http://cordis.europa.eu/project/rcn/87079_en.html (accessed on 15 February 2020).
  44. Schenone, C.; Pittaluga, I.; Borelli, D.; Kamali, W.; El Moghrabi, Y. The impact of environmental noise generated from ports: Outcome of MESP project. Noise Mapp. 2016, 3. [Google Scholar] [CrossRef] [Green Version]
  45. Licitra, G.; Bolognese, M.; Palazzuoli, D.; Fredianelli, L.; Fidecaro, F. Port noise impact and citizens’ complaints evaluation in RUMBLE and MON ACUMEN INTERREG projects. In Proceedings of the 26th International Congress on Sound and Vibration, Montreal, QC, Canada, 7–11 July 2019. [Google Scholar]
  46. Neptunes Project. Available online: https://www.neptunes.pro/ (accessed on 25 September 2019).
  47. Di Bella, A. Evaluation methods of external airborne noise emissions of moored cruise ships: An overview. In Proceedings of the 21st International Congress on Sound and Vibration, Beijing, China, 13–17 July 2014. [Google Scholar]
  48. Witte, J. Noise from moored ships. In INTER-NOISE and NOISE-CON Congress and Conference Proceedings; Institute of Noise Control Engineering: Reston, VA, USA, 2010; pp. 3202–3211. [Google Scholar]
  49. Di Bella, A.; Tombolato, A.; Cordeddu, S.; Zanotto, E.; Barbieri, M. In situ characterization and noise mapping of ships moored in the Port of Venice. J. Acoust. Soc. Am. 2008, 123, 3262. [Google Scholar] [CrossRef]
  50. Santander, A.; Aspuru, I.; Fernandez, P. OPS Master Plan for Spanish Ports Project. Study of potential acoustic benefits of on-Shore power supply at berth. In Proceedings of the Euronoise 2018, Heraklion-Crete, Greece, 27–31 May 2018. [Google Scholar]
  51. Badino, A.; Borelli, D.; Gaggero, T.; Rizzuto, E.; Schenone, C. Acoustical impact of the ship source. In Proceedings of the 21st International Congress on Sound and Vibration, Beijing, China, 13–17 July 2014; pp. 13–17. [Google Scholar]
  52. Badino, A.; Borelli, D.; Gaggero, T.; Rizzuto, E.; Schenone, C. Airborne noise emissions from ships: Experimental characterization of the source and propagation over land. Appl. Acoust. 2016, 104, 158–171. [Google Scholar] [CrossRef]
  53. Badino, A.; Borelli, D.; Gaggero, T.; Rizzuto, E.; Schenone, C. Noise emitted from ships: Impact inside and outside the vessels. Procedia-Soc. Behav. Sci. 2012, 48, 868–879. [Google Scholar] [CrossRef] [Green Version]
  54. Di Bella, A.; Fausti, P.; Francesca, R.; Tombolato, A. Measurement methods for the assessment of noise impact of large vessels. In Proceedings of the 23rd International Congress on Sound & Vibration, Tehran, Iran, 10–14 July 2016; pp. 1–7. [Google Scholar]
  55. Fausti, P.; Santoni, A.; Martello, N.Z.; Guerra, M.C.; Di Bella, A. Evaluation of airborne noise due to navigation and manoeuvring of large vessels. In Proceedings of the 24th International Congress on Sound and Vibration, London, UK, 23–27 July 2017. [Google Scholar]
  56. Bernardini, M.; Fredianelli, L.; Fidecaro, F.; Gagliardi, P.; Nastasi, M.; Licitra, G. Noise Assessment of Small Vessels for Action Planning in Canal Cities. Environments 2019, 6, 31. [Google Scholar] [CrossRef] [Green Version]
  57. IEC 61672-1:2013. Electroacoustics—Sound Level Meters—Specifications; IEC: Geneva, Switzerland, 2013. [Google Scholar]
  58. Borelli, D.; Gaggero, T.; Rizzuto, E.; Schenone, C. Holistic control of ship noise emissions. Noise Mapp. 2016, 3, 107–119. [Google Scholar] [CrossRef]
  59. BS EN ISO 2922:2000+A1:2013 Acoustics. Measurement of Airborne Sound Emitted by Vessels on Inland Waterways and Harbours. Available online: https://www.iso.org/standard/59762.html (accessed on 15 February 2020).
Figure 1. Map of the area and localization of the measurement position.
Sustainability 12 01740 g001
Figure 2. Percentage of transit for each ship type with respect to the totals.
Sustainability 12 01740 g002
Figure 3. Example of a typical pass-by for each category of vessel from the time-history of noise level.
Sustainability 12 01740 g003
Figure 4. LW/m and 1/3 octave band sound power spectrum of RORO (Roll-on/roll-off) ships, together with uncertainties.
Sustainability 12 01740 g004
Figure 5. LW/m and 1/3 octave band sound power spectrum of container ships, together with uncertainties.
Sustainability 12 01740 g005
Figure 6. LW/m and 1/3 octave band sound power spectrum of oil tanker ships, together with uncertainties.
Sustainability 12 01740 g006
Figure 7. LW/m and 1/3 octave band sound power spectrum of chemical tanker ships, together with uncertainties.
Sustainability 12 01740 g007
Figure 8. LW/m and 1/3 octave band sound power spectrum of ferry ships, together with uncertainties.
Sustainability 12 01740 g008
Table 1. Average duration of a typical pass-by for each category of vessel.
Category of VesselAverage Duration of a Pass-By (s)Standard Deviation (s)
RORO10351
Container ships12050
Oil tanker11836
Chemical tanker10447
Ferry10938

