Article

Factors Underlying Life Quality in Urban Contexts: Evidence from an Industrial City (Arak, Iran)

1
Graduated from University of Tehran and Independent Researcher, Tehran 1418733516, Iran
2
Department of Human Geography, University of Tehran, Tehran 1417466191, Iran
3
Islamic Azad University, Arak Branch, Arak P.O. Box 38135/567, Iran
4
Department of Agriculture, University of Udine, Via del Cotonificio 114, I-33100 Udine, Italy
5
Department for Innovation in Biological, Agro-food and Forest System (DIBAF), Tuscia University, Via S. Camillo De Lellis, I-01100 Viterbo, Italy
6
Department of Economics and Law, University of Macerata, Via Armaroli 43, I-62100 Macerata, Italy
7
Global Change Research Institute of the Czech Academy of Sciences, Lipová 9, CZ-37005 České Budějovice, Czech Republic
*
Authors to whom correspondence should be addressed.
Sustainability 2020, 12(6), 2274; https://0-doi-org.brum.beds.ac.uk/10.3390/su12062274
Submission received: 27 February 2020 / Revised: 6 March 2020 / Accepted: 7 March 2020 / Published: 14 March 2020
(This article belongs to the Special Issue Urban Growth and Demographic Dynamics)

Abstract

:
Cities play a vital role in local development providing a high education level, specialized jobs and advanced services. When assessing living conditions and wellbeing in cities, economic indicators alone are generally unable to evaluate the inherent complexity of the ‘quality of life’ issue in urban environments. With rapid urbanization, shortage of infrastructures and services emerged in metropolitan regions of developing countries, leading to disadvantaged settlements, urban poverty, lower citizens’ satisfaction, and an overall decline in life quality. Based on these premises, the present study illustrates a subjective investigation of life quality in an emerging economy such as Iran, focusing on Arak, the fourth largest industrial pole of the country. Based on a literature review on quality of life in industrial cities of emerging economies, subjective indicators of citizens’ satisfaction on living quality in Arak were identified and quantified using empirical results from a field survey. Results of our study show that the overall satisfaction for living quality in Arak is rather low, reaching the lowest rank in the issues of environmental sanitation and public transportation. Lack of investments in urban infrastructure justifies the low citizens’ perception of life quality in Arak city. The paper concludes outlining the urgent need of homogeneous and comparable macro- and micro-data on multiple aspects of quality of life at both city-level and metropolitan-level in emerging economies.

1. Introduction

Quality Of Life (QOL) is a complex and multidimensional aspect of human societies [1,2,3]. QOL is defined as the interaction of human needs and the perception of their fulfillment [4,5,6]. Being an eminently subjective issue, quality of life is difficult to quantify objectively [7], and represents a specific measurement challenge for different disciplines—from psychology to medicine, from social science to environmental studies [8]. Since the 1930s, QOL has been investigated in different geographical and socioeconomic contexts [9,10,11]. While representing a hegemonic concept in social science, the QOL notion has no clear origin and no shared definitions [12,13,14,15]. However, there is a general consensus on the fact that “quality of life”—to a greater or lesser extent—consists of two basic ingredients: an operational (or environmental) context and a psychological milieu [16]. In other words, the notion includes a condition that is perceived by local population and translated into varying degrees of a sense of wellbeing [2,17,18]. This is because ‘quality of life’ can be regarded as a genuine, subjective experience and hence makes the quantitative assessment more difficult [3]. In these regards, Lambiri et al. [19] argued that “the social and physical environment of an area can influence the wellbeing of people residing in that area”.
According to Luger [20], “quality of life depends on the assortment of amenities that individuals and businesses value. Differences in the amount and mix of those amenities should affect the geographic “sorting out” of households and businesses, as well as welfare”. At the same time, while external environment does not influence everybody’s life at the same way [21], the objective characteristics of a given location may affect the overall individual perception together with a complex function of subjective psychological and physiological factors “responsible of producing a sense of satisfaction (or non-satisfaction) from the environment” [19].
Being investigated in theory and practice, quality of life is increasingly becoming a ‘hegemonic’ notion in social science [3]. In this ambit, quality of life has become a particularly articulated issue including socioeconomic, cultural/ethical and political/institutional challenges [22]. Earlier studies have attempted to evaluate the multidimensional nature of the notion [23], proposing (more or less refined) measures and indicators [24]. Problems of measurement arise from the complex nature of this concept [25]. In regional studies, the increasing interest on this dimension of urban life basically depends on the fact that QOL may significantly affect local competitiveness, social cohesion, and environmental sustainability, shaping urban growth and settlement expansion [1,26,27]. According to Royuela et al. [28], quality of life can play an important role in location decisions taken by households and businesses.
Quality Of Urban Life (QOUL) specifically refers to wellbeing of individuals and local communities living in cities and metropolitan areas at large [29,30,31,32,33]. Improving QOUL is an explicit (or implicit) goal for individuals, communities, and nations [34,35,36,37]. In this ambit, QOUL is a relevant dimension of recent theories and practical approaches of urban design and planning, including the ‘new urbanism’ theory, ‘smart growth’ issues and, more generally, sustainable/resilient management of cities [15,30,38,39,40]. A strong limitation of livability studies in urban areas is “their failure to connect outcomes with inputs. In short, they are atheoretic and of limited use for policy making since no attempt is made to model and estimate cities’ ‘production functions’. However they are measured, QOL outcomes may have less to do with public spending and more to do with demographic, socioeconomic and environmental factors” (Luger, [20], p. 751). For this reason, investigating QOUL implies a comparative and integrated analysis of citizens’ perceptions and the places where they live [41], considering the specific socioeconomic characteristics of cities and metropolitan regions [6,21,28,42,43,44].
In this regard, QOUL is considered a multivariate concept whose meaning and perception may differ across local contexts, because of the complex relation with socioeconomic factors such as income and wealth, welfare, local traditions, cultural and religious issues [3,45,46]. According to Marans [47], the QOUL experience of each individual is embedded in the social context of the evaluator. Studies addressing QOUL should recognize the nature of the human–environment relationship as a key issue in social science [4,9,48]. By this way, it is possible to identify objective dimensions (urban environmental contexts) and subjective dimensions (people perception) as two QOUL dimensions [1,14,49]. In this regard, Marans [47] argued how QOUL is a composite notion grounded on individual’s psychological (subjective dimension) and physical wellbeing (objective dimension) spheres, and closely linked to concepts such as satisfaction, human development, happiness, and wellness [24,50,51]. It was also argued that “objective” measures are proxies for individual experiences based on a “subjective” association of policy goals [8,39,44]. Hence, the distinction between objective and subjective indicators is somewhat illusory [5,11,17]. Marans [47] assumes that some objective characteristics of local societies, such as poverty, crime rates or pollution levels, contribute to peoples’ judgments of their life quality. This assumption suggests how a complete assessment of QOUL requires a refined understanding of both components and the related linkages [52]. Nevertheless, this is a controversial and still debated issue [53]; consensus has not been reached yet on specific issues such as (i) how many aspects (i.e., analysis’ dimensions) should be measured, (ii) the relative importance of different dimensions, and (iii) the use of objective vs subjective indicators [30].
Since the 1960s, some general measures of QOUL have been proposed through the use of (single or multiple) indicators [8]. In the 1970s and 1980s, the QOUL has been increasingly considered a multidimensional concept that includes different dimensions of human life [9,22,54]. At the same time, empirical studies proposed specific methodologies assessing QOUL through the the joint use of objective and subjective indicators [16,34,55]. More recent studies about QOUL focused on environmental quality in inner cities [6], where unemployment, the increasing concentration of less skilled workers because of immigration, population aging, and class segregation, contributed to a progressive decline in life quality [48]. QOUL frequently deteriorated in large cities because of a declining economic base and a progressive degradation of physical infrastructures [2]. These issues were recently framed in the sustainable development paradigm [56], considering together the increasing complexity of built environments and citizens’ perception of urban life [15]. In this regard, Turkoglu [57] investigated the relationship between urban sustainability and quality of life, evidencing the impact of environmental, economic, social, physical, and health-related factors on QOUL.
To estimate QOUL in metropolitan contexts, two basic approaches have been proposed. The first approach quantifies QOUL through a set of diachronic indicators built-up from aggregated spatial data and variables derived from secondary sources (e.g., official statistics), such as population/housing censuses, or sampling surveys such as the labor force survey [3,28,58]. Specific information, such as household income and wealth, crime rates, pollution levels, or housing costs, can be directly or indirectly derived from such statistical sources [47]. The second approach is based on primary data sources (sampling surveys) that estimate the individual, subjective assessment of several QOL domains together, including place-specific characteristics of each study area [4,51,52]. This approach typically measures satisfaction with both specific issues and life as a whole [59]. In some studies, individual survey questions have been combined with the aim to create indicators and composite indexes [8], assuring a greater reliability of the integrated assessment of QOUL [60]. Results of earlier studies demonstrate the broad applicability of QOUL measurement based on subjective approaches [61].
QOUL in emerging economies has attracted the interest of scholars for the intimate linkage with more general phenomena such as the progressive deterioration of urban environments [7,24,51]. In these contexts, urbanization stimulates fast economic growth [61] with negative externalities that include vehicular traffic, congestion, lack in housing, resources, infrastructures, diurnal and night noise, as well as air and water pollution [53,56,57]. A close relationship exists between QOUL and sustainable development of urban areas in emerging economies [16,46,51,62,63]. By exploring a specific case in Iran, Sheikh Azami and Razavian [34] argued that QOUL is connected with a variety of urban life aspects because of the interplay of socioeconomic and environmental issues. Such relationship has been affected by the social features of urban life [64]. Therefore, a comprehensive assessment of QOUL in emerging economies should address all the domains characteristic of the QOL issue at the base of a truly sustainable development [65].
In this line of thinking, joint improvements in QOUL and environmental quality are considered a basic goal of Sustainable Development policies in emerging economies [40,55,66]. In these contexts, urbanization, late industrialization, and socio-political development have a great impact on the quality of urban life, shaping sustainable development [34,49,67]. Due to the increasing concerns in urban life quality [68], QOUL studies should concentrate on industrial cities, a type of urban agglomeration still frequent in emerging countries [57,69,70].
A broader convergence on standard definitions of QOUL [49], as well as shared approaches and models investigating subjective QOUL, are increasingly required [71]. The partial availability of variables and indicators relevant in the analysis of the QOUL in emerging countries poses a problematic aspect for both statistical reporting and implementation of local development policies. In such contexts, subjective analyses based on pilot surveys and a broader-spectrum investigation evaluating individual perceptions with respect to multiple QOUL dimensions, contributes to a fine tuning of policy interventions with the specificity of local environments. This basic knowledge is necessary when designing integrated, official surveys and statistical systems for a comprehensive assessment of QOUL in emerging countries. More specifically, an integrated evaluation of a large number of potentially relevant QOUL dimensions is needed to evaluate how specific characteristics of the local community may influence the individual perception of life quality.
The present study contributes to this deserving issue with a comprehensive assessment of citizens’ perception of urban life quality in Iran, based on subjective indicators. Iran is exemplificative of emerging economies in the Middle East region [51,56,72], with rapid growth of cities and metropolitan areas fuelled by internal migration and high (but declining) fertility [59]. Although some previous works have analyzed specific problems dealing with quality of life in Iran [51,56,59], our study refers to a particularly large ensemble of QOUL issues [2,16,57]. More specifically, we evaluated 38 dimensions of QOUL in a representative sample of residents in an industrial city representative of complex urban growth dynamics in Iran. By investigating how the specific characteristics of local communities shape the individual perception of QOUL, the present study adds to the literature on QOL in urban areas, providing empirical evidence for less known social contexts in emerging economies.

2. Materials and Methods

2.1. Study Area

Arak, Markazi province, central Iran (Figure 1), is the fourth industrial pole in Iran. The city produced 80% of energy in the country and has the biggest aluminum factory and the largest sodium sulfate mine. Industrial development caused environmental, social and cultural problems, including air pollution, massive immigration, unaffordable housing, class segregation, social conflicts and the lack of living facilities. Arak is one of the most polluted metropolitan regions in Iran; population growth and the consequent increase in private mobility, industrialization and land conversion to urban use, have determined diffused air pollution. Despite environmental problems, Arak is the fourth most expensive city in Iran for housing, after Tehran, Isfahan and Karaj.

2.2. QOUL Dimensions and Indicators

To assess QOUL in Arak, seven domains (place identity, citizenship ethics, social security, environmental quality, environmental sanitation, economic satisfaction, quality of public transportation) have been considered evaluating 38 QOL dimensions. These dimensions were investigated through a field survey based on a questionnaire submitted to selected respondents. The subjective indicators derived from this primary data source (Table 1) were selected on the base of a review of local and regional literature [34,51,56,59].

2.3. Survey Strategy

Subjective measures typically rely on survey (interview) tools collecting respondents’ own assessments of their perceptions in the form of self-reports of satisfaction, happiness, wellbeing, or other synonyms [5,46,54]. In our study, a questionnaire survey was carried out with the aim to measure the quality of urban life in Arak. Measuring QOUL through surveys is a common approach to collect information on people’s subjective assessment of QOL in urban contexts [73]. More specifically, QUOL was estimated by asking respondents to rank various aspects (i.e., dimensions) of their every-day life classified into specific QOL domains. Responses evaluated the level of satisfaction in each QOL aspect using a Likert scale [71]. An individual Likert item is a specific instance of a fully anchored rating scale where the anchors represent different levels of agreement or disagreement on a given dimension [60]; in our case, the scale was organized in 5 score items, ranging from 5 (total agreement) to 1 (total disagreement). A representative number of face-to-face interviews was carried out in 2016, considering that Arak population amounted to 599,634 inhabitants in 2016. Using a random stratified sampling method, 384 residents in Arak aged 7 years and more (49.1% females and 50.9% males) were selected for interview. The age group between 15 and 40 years was the most abundant (74%) in the sample, followed by the age class 41-64 years (22%), 7-14 years (2%), and 64+ years (2%).
The questionnaire contained a broad range of questions (corresponding to the 38 dimensions reported in Table 1) classified in the 7 domains described above (place identity, citizenship ethic, social security, environmental quality, environmental sanitation, economic satisfaction, and quality of public transportation. Each questionnaire item was evaluated before the final implementation. A total of 30 pre-test questionnaires were submitted to randomly selected respondents. Relevant items were identified and inappropriate items were corrected (or removed) in order to increase reliability and validity of the survey.

2.4. Data Analysis

Data collected through questionnaires were digitalized and analyzed using spreadsheets. Reliability of each variable derived from questionnaires’ analysis was estimated using Cronbach’s alpha scores [74]; a threshold for reliable questions was fixed to alpha > 0.A Principal Component Analysis was carried out on the data matrix composed of 38 variables (the dimensions reported in Table 1 and described in Section 2.3). For each questionnaire variable, the Likert score items were rescaled to a range between 0 (the highest disagreement) and 1 (the highest agreement). Seven additional variables were inserted as supplementary information for each respondent (gender, place of birth, marital status, literacy, age group, job, and family size). Principal Component Analysis is a multivariate statistical technique that allows the integrated analysis of large data matrices, highlighting the most significant latent patterns among variables and eliminating intrinsic redundancies within the data matrix [75]. By extracting the components that explain the highest proportion of the data matrix variance, the analysis identifies complex (multiple) relationships between variables (QOUL dimensions), according to the socioeconomic characteristics of the cases considered in the analysis (respondents). By this way, it is possible (i) to discriminate the QOUL dimensions that are perceived homogeneously within the sample from those perceived heterogeneously, and (ii) to relate the individual QOUL dimensions to the socioeconomic profile of each respondent. This result contributes to designing and implementing urban development policies and more specific and targeted actions to improve quality of life conditions for individual segments of the population.
The extracted components were regarded as significant when the corresponding eigenvalue was greater than Component loadings and scores were calculated and analyzed together [76]. Component loadings represent the degree of correlation between individual variables (38 active and 7 additional) and the extracted components. Component scores represent the association between the components and the socioeconomic characteristics of the individual cases (respondent). To evaluate the ability of the PCA to summarize latent patterns within the input data matrix, an expansion coefficient indicating PCA efficiency was calculated as the ratio between the explained variance (as a relative proportion ranging between 0 and 1) and the number of components with eigenvalue > 1 extracted out of the total number of input variables (giving a relative proportion ranging between 0 and 1). Values higher than 1 indicate that the PCA has magnified the informative content of the data matrix; in a given analysis, a value greater than 4 highlights a sufficient magnification power [77].

3. Results

3.1. Place Identity

This domain includes the multifaceted social aspects of QOUL (Table 2). More than 48% of the respondents mentioned that they have a high sense of belonging to their place of residence (the sum of responses 4 and 5 in the Likert scale, corresponding to very high and high levels of agreement). The familiarity with the environment and the long time they live in the neighborhood were the most important factors contributing to their sense of belonging. However, 38% of respondents believed that their neighborhood was close to ‘the ideal neighborhood’ standard. Only 35% of the respondents had a moderate satisfaction of housing facilities in their place of residence and 39% did not consider their place of residence as appropriate for their needs. Results finally outlined that 51% of respondents have expressed a high sense of belonging to their dwelling unit.

3.2. Citizenship Ethic

Citizenship ethic is a domain that represents the processes of socialization and observance of social norms that are intrinsically embedded in QOUL, having a positive impact on the quality of life conditions. The status of the living neighborhood has been individually evaluated as far as local citizenship ethic is concerned, using 5 variables (Table 3). A total of 82% of respondents have expressed that they are not willing to ask neighbors for help under the current financial crisis, and 64% have stated that interactions with neighbors are limited. However, in terms of individual duties and citizenship, 60% of citizens declared to be responsible for the cleanliness and beauty of the neighborhood, and 67% believe that they are socially responsible for the elders and young people.

3.3. Social Security

This domain includes key dimensions of QOL in urban contexts, having in turn important psychological implications for citizens. A total of 25% of respondents have shown a moderate feeling of insecurity in the neighborhood life and 18% declared a high perception of insecurity (Table 4). Respectively 38% and 41% of the respondents ranked the social security of the living neighborhood as intermediate and low. However, half of the respondents in the sample (51%) feel safe in the neighborhood.

3.4. Environmental Quality

Environmental quality is one of the key QOL domains in urban contexts. A total of 10 dimensions have been assessed covering multiple aspects of the environmental issue (Table 5).
In the field of pedestrian satisfaction, more than 44% of the respondents expressed dissatisfaction for pedestrian ways, with 33% of the respondents having an intermediate judgment. Lighting of walkable ways and public spaces was another dimension that 45% of respondents evaluated in a neutral way. One third of respondents (32%) expressed disappointment with the status of educational facilities at their place of residence. At the same time, more than half of the respondents (55%) were satisfied with the accessibility to shopping centers and only 26% rated it as intermediate. More than half respondents (53%) were dissatisfied with the green areas in the neighborhood. More specifically, dissatisfaction involves the lack of facilities in green areas, the inadequate quality of green spaces and the lack of proper design for gardens, that were often considered as unsafe places. Regarding access to sport and recreational facilities, 54% of the respondents acknowledged that there were no sport facilities near their place of residence.

3.5. Environmental Sanitation

Environmental health issues linked to urban infrastructures were evaluated in this section. Despite a rapid expansion of Arak settlements because of massive immigration from the surrounding rural areas, development of appropriate infrastructures in the city has not been consistent with this trend. Based on the empirical findings of our study (Table 6), 32% of respondents displayed a neutral judgement of urban plumbing. A total of 52% of respondents were totally dissatisfied and 25% were moderately dissatisfied with the presence of insects acting as carrier of multiple diseases that impact urban health. Respondents also indicated the key role of beautification and physical maintenance of the neighborhood in the visual quality of urban landscapes (24% of them evaluated this dimension as a particularly desirable issue). More than 33% of respondents have evaluated access to health facilities as highly desirable, while 40% of the respondents considered the status of general access to health care centers as intermediate.

3.6. Economic Satisfaction

According to the survey results (Table 7), 32% of respondents expressed dissatisfaction with their economic situation as a result of job shortage. More than 39% of respondents expressed dissatisfaction with their job conditions. The last variable is the level of confidence to find an appropriate job: 48% of respondents expressed disappointment with the current situation, hoping to improve their working condition soon.

3.7. Quality of Public Transportation

The overall degree of satisfaction in the use of public transport was investigated considering 4 dimensions (Table 8). A total of 47% of the respondents declared to be unsatisfied with urban transport security. More than 45% of respondents were dissatisfied with access to public transport, and 29% of them evaluated the availability of transportation vehicles as difficult.

3.8. A Summary Analysis

Results of a multivariate statistical analysis considering all the response variables (38 dimensions) for the whole sample of respondents were illustrated in Table 9. Three axes with an eigenvalue greater than 1 were extracted and analyzed, accounting for nearly 35% of the total variance in the data matrix. This proportion is quite high when the total number of input variables (n = 38) is considered. The expansion coefficient (the ratio between the explained variance and the number of components extracted) indicating that PCA efficiency was close to 4.4, a value that highlights a sufficient magnification power of this technique. Component 1 explained more than 20% of the total variance in the data matrix, while components 2 and 3 accounted for nearly 7% of the total variance. Axis 1 identified the majority of QOL dimensions in urban areas, being substantially uncorrelated with the socioeconomic profile of respondents. These results indicate that the perception of many dimensions of life quality in Arak was homogeneous across population segments in the same neighborhood (Figure 2). Components 2 and 3 identified specific dimensions of QOL in urban areas that were found highly variable across population segments. Neighborhood cleaning, responsibility for the elderly and air pollution were subjective dimensions positively associated with family size, education level and age of respondents (Component 2). Financial assistance from neighboring families, meeting the neighboring, participation of residents to preservation of commons from degradation, presence of stray people and noise pollution were dimensions negatively associated with respondents’ education level and positively associated with respondent’s age. These dimensions were finally perceived in a different manner according with the job condition of each respondent (Component 3).

4. Discussion and Conclusion

Quality of life in cities, and especially in industrial cities of emerging countries, is a challenging issue in urban policy and planning [1,46,78,
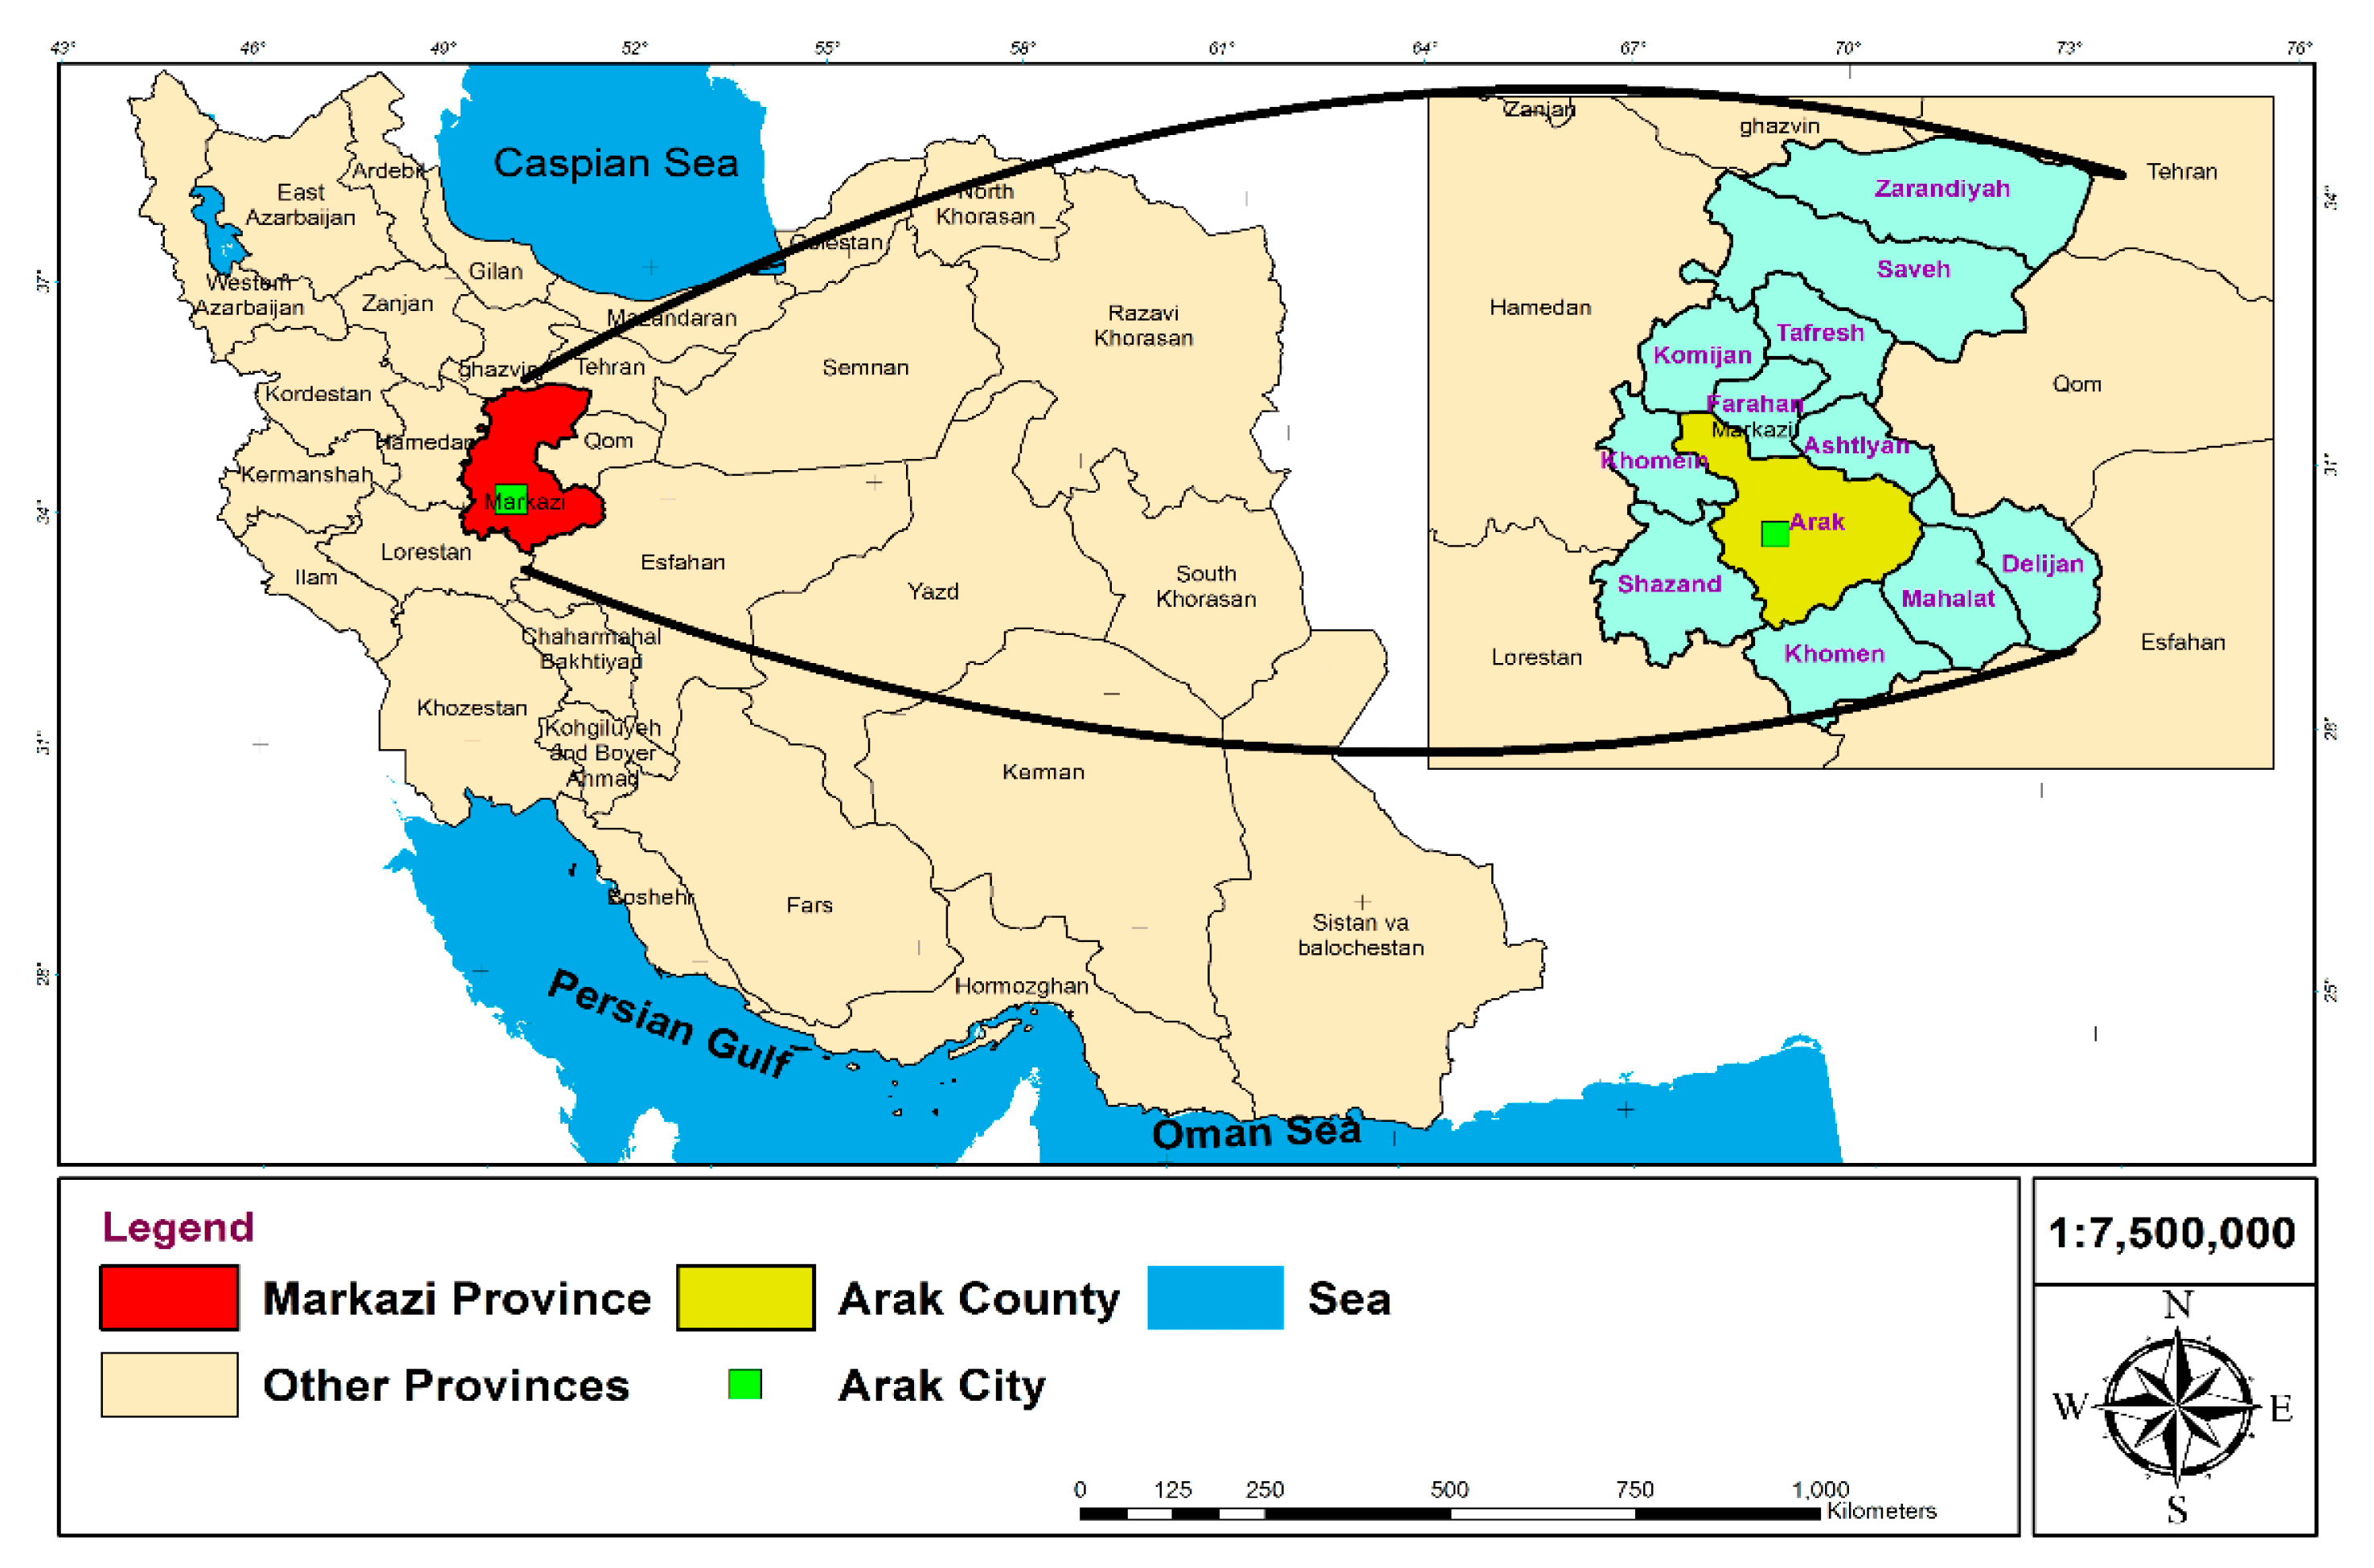
79]. Based on this premise, quality of life in Arak, Iran, has been evaluated from a subjective perspective. On average, 51% of the respondents expressed a high attachment to their place of residence. However, 24% of respondents were dissatisfied with the social security system. On average, respondents’ evaluation of environmental quality was middle-low. An even lower satisfaction for public transportation was recorded (56% of respondents considered public transportation in the city as particularly ineffective).
Taken together, the subjective evaluation of QOUL in Arak was relatively low, and particularly negative judgements for environmental sanitation and public transportation were observed, in line with earlier studies in similar socioeconomic contexts [64,65,80]. Neglecting adequate infrastructure investments for a long time resulted in a lack of fundamental facilities and tools [58,81,82,83]. These results indicate that Arak, the fourth agglomeration in the urban hierarchy of Iran, is a deprived city as far as quality of life is concerned [51]. Attentions should be paid to improvement of specific life quality aspects [49,54,84,85,86], especially environmental sanitation and public transportation.
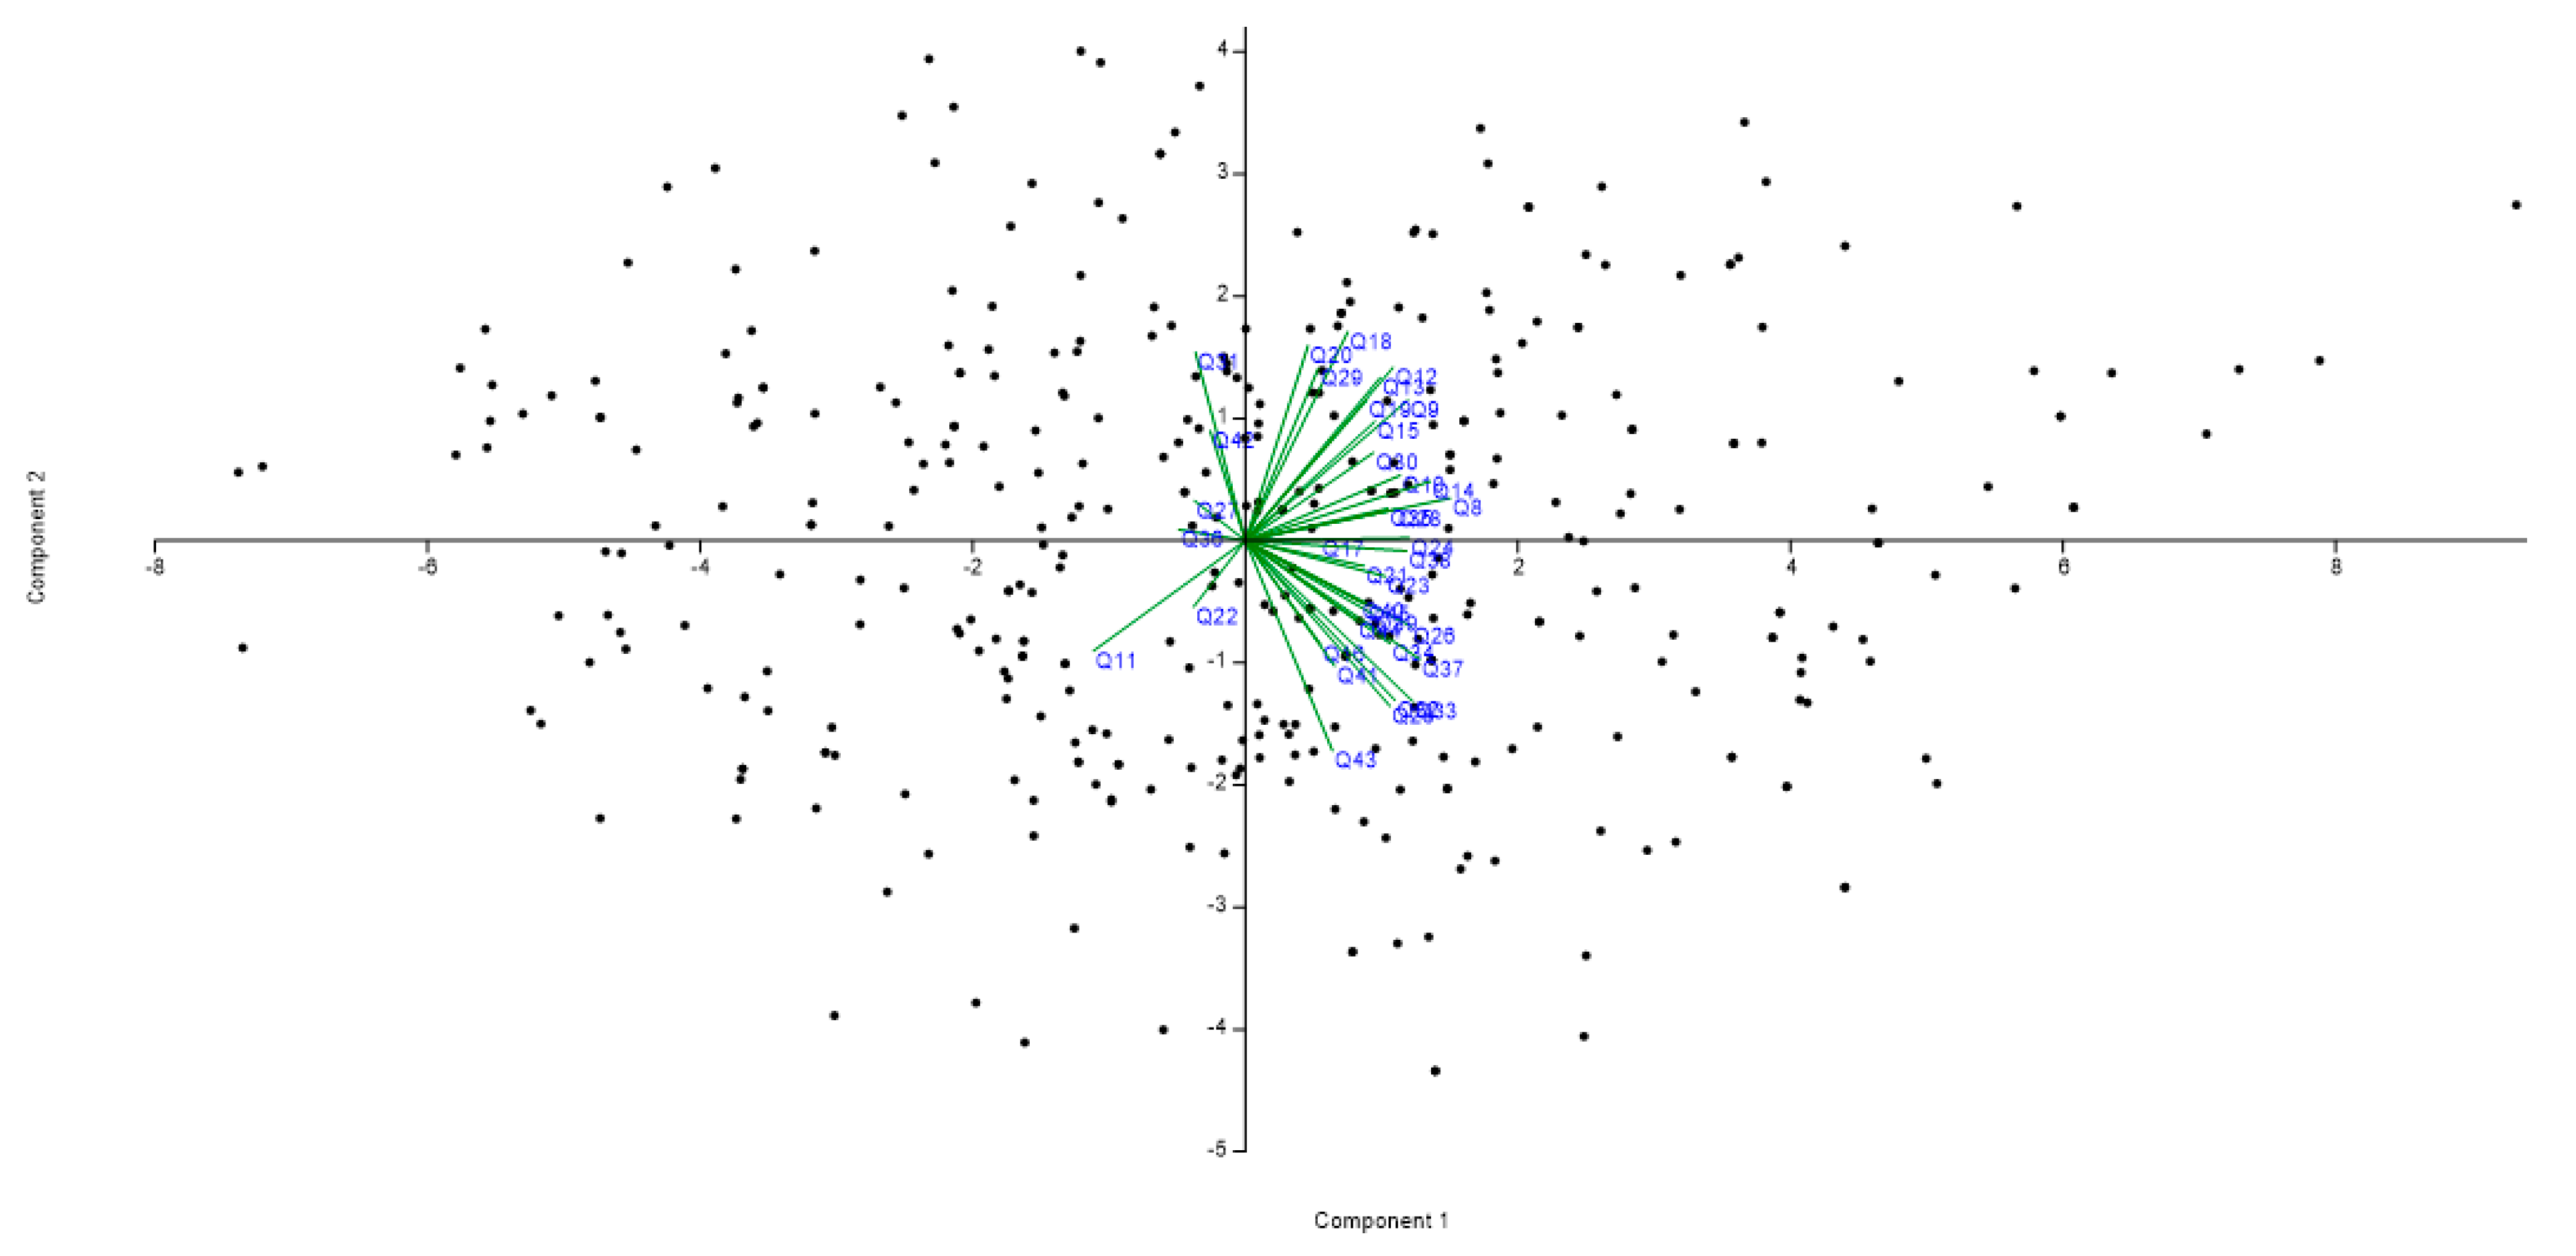
The multivariate statistical analysis developed in this work provides an original interpretation of the complexity of the QOUL issue in Arak [3], identifying the QOL dimensions that have received a homogeneous and transversal judgment from all the components of the local community (22 dimensions out of 38). These dimensions were distinguished from a smaller set of specific QOL dimensions that have been judged in a different way by specific segments of the resident population. In particular, economic satisfaction and the quality of public transport seem to be perceived differentially by the different segments of the population. This result appears relevant both in a positive context (e.g., when developing or improving a statistical survey of the various aspects of the QOUL) and in a regulatory context [24]. In particular, the empirical results of this study suggest that socio-demographic policies supporting urban sustainability should be better phased with (i) the specific demand of local communities and with (ii) the particular needs of specific components of the local population [57]. These assumptions, although linked with the specific analysis’ context, deserve further investigation through comparative studies in similar socioeconomic contexts [16].
An important distinction has been made between feelings and judgments in QOUL assessment [48,65,71]. While feelings are an important component of subjective wellbeing [4], research into specific QOL domains like QOUL should be increasingly focused on subjective evaluations of multiple targets, e.g., housing, transportation, or social security [5]. At the same time, while subjective dimensions play an important role in the assessment of QOL domains, measuring such dimensions may benefit from the joint use of objective indicators in order to establish their significance [47,50,87]. In a socioeconomic context typical of emerging economies, supply of official data sources and indicators concerning QOUL is a pre-requisite to reach an appropriate and refined knowledge of different dimensions of urban sustainability [22], which can inform more effective policies matching local development and economic competitiveness with social cohesion [88].
While presenting the results of an exploratory analysis, our study outlines the urgent need of making available homogeneous and comparable collections of macro- and micro-data assessing multiple QOUL aspects at both city- and metropolitan-level [52]. A more comprehensive analysis of factors underlying subjective wellbeing is particularly appropriate when developing interpretative models that investigate individual perceptions as a function of individual characteristics and contextual factors, e.g., locational patterns (central vs peripheral neighborhoods), class/ethnic segregation, infrastructures and amenities [28,39,89]. In these regards, awareness of critical conditions stemming from integration of objective and subjective evaluation leads to a better understanding of social problems in daily life and implementation of decision-making processes in urban development ([19,54,88].
New theoretical and practical approaches, integrated methodologies and composite indicators are necessary tools for a refined analysis of multiple aspects of QOL at both urban and metropolitan scales [45,50,90,91,92,93]. By identifying the urgent needs for improvement of the available data sources [94,95,96,97,98], methodologies that integrate primary and secondary data and new indicators for statistical reporting are particularly appropriate for this crucial aspect of urban science in emerging economies.

Author Contributions

Conceptualization, S.Z.S. and L.S.; methodology, S.Z.S. and M.P.; software, N.K.; validation, N.K. and M.P.; formal analysis, M.P.; investigation, N.K.; resources, M.P.; data curation, N.K.; writing—original draft preparation, L.S.; writing—review and editing, S.Z.S. and M.C.; visualization, S.C.; supervision, S.C.; project administration, M.C.; funding acquisition, S.C. and M.C. All authors have read and agreed to the published version of the manuscript.

Funding

This research received no external funding.

Conflicts of Interest

The authors declare no conflict of interest.

References

  1. Das, D. Urban quality of life: A case study of Guwahati. Soc. Indic. Res. 2008, 88, 297–310. [Google Scholar] [CrossRef]
  2. Serag El Din, H.; Shalaby, A.; Farouh, H.E.; Elariane, S. Principles of urban quality of life for a neighborhood. HBRC J. 2012, 9, 86–92. [Google Scholar] [CrossRef] [Green Version]
  3. Mittal, S.; Chadchan, J.; Mishra, S.K. Review of Concepts, Tools and Indices for the Assessment of Urban Quality of Life. Soc. Indic. Res. 2019, 1–28. [Google Scholar] [CrossRef]
  4. Veenhoven, R. Quality-of-life in individualistic society. Soc. Indic. Res. 1999, 48, 159–188. [Google Scholar] [CrossRef]
  5. Costanza, R.; Brendan, F.S.; Beer, C.; Bond, L.; Roelof, B.; Nicholas, L.; Dickinson, J.; Elliott, C.; Farley, J.; Gayer, E.D.; et al. Quality of life: An approach integrating opportunities, human needs, and subjective well-being. Ecol. Econ. 2007, 6, 267–276. [Google Scholar] [CrossRef]
  6. Talmage, C.A.; Frederick, C. Quality of life, multimodality, and the demise of the autocentric metropolis: A multivariate analysis of 148 mid-size US cities. Soc. Indic. Res. 2019, 141, 365–390. [Google Scholar] [CrossRef]
  7. Taçoral, E.; Atik, A.; Yilmaz, B.; Aslan, F.; Altunkasa, M.F. A sustainability assessment of quality of life in a traditional settlement pattern: The case of Kemaliye, Turkey. Indoor Built Environ. 2017, 26, 456–470. [Google Scholar] [CrossRef]
  8. Rapley, M. Quality of life Research: A Critical Introduction; Sage: London, UK, 2003. [Google Scholar]
  9. Wish, N.B. Are we measuring the quality of life? Well-being has subjective dimensions, as well as objective ones. Am. J. Econ. Sociol. 1986, 45, 93–99. [Google Scholar] [CrossRef]
  10. Deller, S.C.; Tsai, T.H.; Marcouiller, D.W.; English, D.B. The role of amenities and quality of life in rural economic growth. Am. J. Agric. Econ. 2001, 83, 352–365. [Google Scholar] [CrossRef]
  11. Sirgy, M.J.; Cornwell, T. How neighborhood features affect quality of life. Soc. Indic. Res. 2002, 59, 79–114. [Google Scholar] [CrossRef]
  12. Lydick, E.; Epstein, R.S. Interpretation of quality of life changes. Qual. Life Res. 1993, 2, 221–226. [Google Scholar] [CrossRef] [PubMed]
  13. Ross, C.E.; Van Willigen, M. Education and the subjective quality of life. J. Health Soc. Behav. 1997, 38, 275–297. [Google Scholar] [CrossRef] [PubMed]
  14. Helgeson, V.S. Social support and quality of life. Qual. Life Res. 2003, 12, 25–31. [Google Scholar] [CrossRef] [PubMed]
  15. Lotfi, S.; Koohsari, M.J. Analyzing Accessibility Dimension of Urban Quality of Life: Where Urban Designers Face Duality Between Subjective and Objective Reading of Place. Soc. Indic. Res. 2009, 94, 417–435. [Google Scholar] [CrossRef]
  16. Senlier, N.; Yildiz, R.; Aktas, D. A Perception Survey for the Evaluation of Urban Quality of Life in Kocaeli and a Comparison of the Life Satisfaction with the European Cities. Soc. Indic. Res. 2009, 94, 213–226. [Google Scholar] [CrossRef]
  17. Shin, D.C.; Johnson, D.M. Avowed happiness as an overall assessment of the quality of life. Soc. Indic. Res. 1978, 5, 475–492. [Google Scholar] [CrossRef]
  18. Steg, L.; Gifford, R. Sustainable transportation and quality of life. J. Transp. Geogr. 2005, 13, 59–69. [Google Scholar] [CrossRef]
  19. Lambiri, D.; Biagi, B.; Royuela, V. Quality of life in the economic and urban economic literature. Soc. Indic. Res. 2007, 84, 1–12. [Google Scholar] [CrossRef] [Green Version]
  20. Luger, M.I. Quality-of-life differences and urban and regional outcomes: A review. Hous. Policy Debate 1996, 7, 749–771. [Google Scholar] [CrossRef]
  21. Royuela, V.; Suriñach, J. Constituents of quality of life and urban size. Soc. Indic. Res. 2005, 74, 549–572. [Google Scholar] [CrossRef]
  22. Cicerchia, A. Indicators for the measurement of the quality of urban life. Soc. Indic. Res. 1996, 39, 321–358. [Google Scholar] [CrossRef]
  23. Kitchen, P.; Muhajarine, N. Quality of life research: New challenges and new opportunities. Soc. Indic. Res. 2008, 85, 1–4. [Google Scholar] [CrossRef]
  24. Low, C.T.; Stimson, R.; Chen, S.; Cerin, E.; Wong, P.P.Y.; Lai, P.C. Personal and neighbourhood indicators of quality of urban life: A case study of Hong Kong. Soc. Indic. Res. 2018, 136, 751–773. [Google Scholar] [CrossRef] [Green Version]
  25. Sirgy, M.J.; Phillips, R.; Rahtz, D.R. Community Quality-of-Life Indicators; Springer: New York, NY, USA, 2011. [Google Scholar]
  26. Schneider, M. The quality of life in large American cities: Objective and subjective social indicators. Soc. Indic. Res. 1975, 1, 495–509. [Google Scholar] [CrossRef]
  27. Cicerchia, A. Measures of optimal centrality: Indicators of city effect and urban overloading. Soc. Indic. Res. 1999, 46, 273–299. [Google Scholar] [CrossRef]
  28. Royuela, V.; Romaní, J.; Artís, M. Using quality of life criteria to define urban areas in Catalonia. Soc. Indic. Res. 2009, 90, 419–440. [Google Scholar] [CrossRef]
  29. Bourne, L.S. Self-fulfilling prophecies? Decentralization, inner city decline, and the quality of urban life. J. Am. Plan. Assoc. 1992, 58, 509–513. [Google Scholar] [CrossRef]
  30. Khalil, H. Enhancing quality of life through strategic urban planning. Sustain. Cities Soc. 2012, 5, 77–86. [Google Scholar] [CrossRef]
  31. Frick, D.; Hoefert, H.W.; Legewie, H.; Mackensen, R.; Silbereisen, R.K. Quality of Urban Life: Social, Psychological, and Physical Conditions; Walter de Gruyter: Berlin, Germany, 2013. [Google Scholar]
  32. Clemente, M. Liveliness and livability of urban space. Perception of well-being and public space design. In Proceedings of the International Conference on Changing Cities II Spatial, Design, Landscape & Socio-Economic Dimensions, Peloponnese, Greece, 22–26 June 2015; Gospodini, A., Ed.; Grafima: Thessaloniki, Grecia, 2015. ISBN 978-960-6865-88-6. [Google Scholar]
  33. Clemente, M. Re-Design Dello Spazio Pubblico; FrancoAngeli: Milano, Italy, 2017; ISBN 9788891762450. [Google Scholar]
  34. Sheikh Azami, A.; Razavian, M. Analysis Moving Towards Sustainable Development of a City with Emphasis on the Quality of Urban Life: The Case of Noor. Environ. Urban. 2013, 4, 31–56. [Google Scholar]
  35. Okulicz-Kozaryn, A. Happiness and Place: Why Life is Better outside of the City; Springer: Berlin/Heidelberg, Germany, 2015. [Google Scholar]
  36. Morrison, P.S.; Weckroth, M. Human values, subjective well-being and the metropolitan region. Reg. Stud. 2018, 52, 325–337. [Google Scholar] [CrossRef]
  37. Lenzi, C.; Perucca, G. The nexus between innovation and wellbeing across the EU space: What role for urbanisation? Urban Stud. 2019. [Google Scholar] [CrossRef]
  38. Ng, M.K. Quality of life perceptions and directions for urban regeneration in Hong Kong. Soc. Indic. Res. 2005, 71, 441–465. [Google Scholar] [CrossRef]
  39. Wey, W.M.; Wei, W.L. Urban street environment design for quality of urban life. Soc. Indic. Res. 2016, 126, 161–186. [Google Scholar] [CrossRef]
  40. Ivaldi, E.; Penco, L.; Isola, G.; Musso, E. Smart Sustainable Cities and the Urban Knowledge-Based Economy: A NUTS3 Level Analysis. Soc. Indic. Res. 2020. [Google Scholar] [CrossRef]
  41. Winston, N.; Eastaway, M.P. Sustainable housing in the urban context: International sustainable development indicator sets and housing. Soc. Indic. Res. 2008, 87, 211–221. [Google Scholar] [CrossRef]
  42. Currie, R.F.; Thacker, C. Quality of the urban environment as perceived by residents of slow and fast growth cities. Soc. Indic. Res. 1986, 18, 95–118. [Google Scholar] [CrossRef] [Green Version]
  43. Baldazzi, B.; Corrado, H.C.; Ferruzza, A. The quality of life in some local metropolitan labour markets in Italy. Soc. Indic. Res. 1998, 44, 71–95. [Google Scholar] [CrossRef]
  44. Perz, S.G. The quality of urban environments in the Brazilian Amazon. Soc. Indic. Res. 2000, 49, 181–212. [Google Scholar] [CrossRef]
  45. Allison, P.J.; Locker, D.; Feine, J.S. Quality of life: A dynamic construct. Soc. Sci. Med. 1997, 45, 221–230. [Google Scholar] [CrossRef]
  46. Santos, L.D.; Martins, I. Monitoring urban quality of life: The Porto experience. Soc. Indic. Res. 2007, 80, 411–425. [Google Scholar] [CrossRef]
  47. Marans, R. Quality of urban life and environmental sustainability studies: Future linkage opportunities. Habitat Int. 2015, 45, 47–52. [Google Scholar] [CrossRef]
  48. Chamhuri, H.; Hamdan, H.; Ahmah, P.; Ismail, F. Conceptual Framework of Public Participation in Ensuring Quality of Life of the Urban Poor in Malaysia. Procedia Soc. Behav. Sci. 2015, 168, 349–356. [Google Scholar] [CrossRef] [Green Version]
  49. Stover, M.E.; Leven, C.L. Methodological issues in the determination of the quality of life in urban areas. Urban Stud. 1992, 29, 737–754. [Google Scholar] [CrossRef]
  50. Diener, E.; Suh, E. Measuring quality of life: Economic, social, and subjective indicators. Soc. Indic. Res. 1997, 40, 189–216. [Google Scholar] [CrossRef]
  51. Rezvani, M.R.; Mansourian, H.; Sattari, M.H. Evaluating quality of life in urban areas (case study: Noorabad City, Iran). Soc. Indic. Res. 2013, 112, 203–220. [Google Scholar] [CrossRef]
  52. Tartaglia, S. Different predictors of quality of life in urban environment. Soc. Indic. Res. 2013, 113, 1045–1053. [Google Scholar] [CrossRef]
  53. D’Acci, L. Monetary, Subjective and Quantitative Approaches to Assess Urban Quality of Life and Pleasantness in Cities. Soc. Indic. Res. 2015, 115, 531–559. [Google Scholar] [CrossRef] [Green Version]
  54. Omuta, G.E. The quality of urban life and the perception of livability: A case study of neighbourhoods in Benin City, Nigeria. Soc. Indic. Res. 1988, 20, 417–440. [Google Scholar] [CrossRef]
  55. Cabello, E.; Dayli, J.; Varela, C.; Hernandez, G.D.; Alexis, P.; Dunia, L. Comparative study of the urban quality of life in Cuban first-level cities from an objective dimension. Environ. Dev. Sustain. 2014, 16, 195–215. [Google Scholar] [CrossRef]
  56. Zebardast, E. The housing domain of quality of life and life satisfaction in the spontaneous settlements on the Tehran metropolitan fringe. Soc. Indic. Res. 2009, 90, 307–324. [Google Scholar] [CrossRef]
  57. Turkoglu, H. Sustainable Development and Quality of Urban Life. Procedia Soc. Behav. Sci. 2015, 202, 10–14. [Google Scholar] [CrossRef] [Green Version]
  58. Rinner, C. A geographic visualization approach to multi-criteria evaluation of urban quality of life. Int. J. Geogr. Inf. Sci. 2007, 21, 907–919. [Google Scholar] [CrossRef]
  59. Rajaei, S.A.; Mansourian, H. Urban growth and housing quality in Iran. Soc. Indic. Res. 2017, 131, 587–605. [Google Scholar] [CrossRef]
  60. Harpe, S. How to analyze Likert and other rating scale data. Curr. Pharm. Teach. Learn. 2015, 7, 836–850. [Google Scholar] [CrossRef]
  61. Wasserman, I.M.; Chua, L.A. Objective and subjective social indicators of the quality of life in American SMSA’s: A reanalysis. Soc. Indic. Res. 1980, 8, 365–381. [Google Scholar] [CrossRef]
  62. Ülengin, B.; Ülengin, F.; Güvenç, Ü. A multidimensional approach to urban quality of life: The case of Istanbul. Eur. J. Oper. Res. 2001, 130, 361–374. [Google Scholar] [CrossRef]
  63. Di Feliciantonio, C.; Salvati, L. ‘Southern’ Alternatives of Urban Diffusion: Investigating Settlement Characteristics and Socio-Economic Patterns in Three Mediterranean Regions. Tijdschr. Voor Econ. Soc. Geogr. 2015, 106, 453–470. [Google Scholar] [CrossRef]
  64. Mohammad Sufian, A.J. A multivariate analysis of the determinants of urban quality of life in the world’s largest metropolitan areas. Urban Stud. 1993, 30, 1319–1329. [Google Scholar] [CrossRef]
  65. Burnell, J.D.; Galster, G. Quality-of-life measurements and urban size: An empirical note. Urban Stud. 1992, 29, 727–735. [Google Scholar] [CrossRef]
  66. Salvati, L.; Carlucci, M. A composite index of sustainable development at the local scale: Italy as a case study. Ecol. Indic. 2014, 43, 162–171. [Google Scholar] [CrossRef]
  67. Zambon, I.; Serra, P.; Sauri, D.; Carlucci, M.; Salvati, L. Beyond the ‘Mediterranean city’: Socioeconomic disparities and urban sprawl in three Southern European cities. Geogr. Ann. Ser. B Hum. Geogr. 2017, 99, 319–337. [Google Scholar] [CrossRef]
  68. Hunt, S.M. The problem of quality of life. Qual. Life Res. 1997, 6, 205–212. [Google Scholar] [PubMed]
  69. Shye, S. The systemic life quality model: A basis for urban renewal evaluation. Soc. Indic. Res. 1989, 21, 343–378. [Google Scholar] [CrossRef]
  70. Muoghalu, L.N. Measuring housing and environmental quality as indicator of quality of urban life: A case of traditional city of Benin, Nigeria. Soc. Indic. Res. 1991, 25, 63–98. [Google Scholar] [CrossRef]
  71. McCrea, R.; Shyy, T.K.; Stimson, R. What is the strength of the link between objective and subjective indicators of urban quality of life? Appl. Res. Qual. Life 2006, 1, 79–96. [Google Scholar] [CrossRef]
  72. Kousha, M.; Mohseni, N. Predictors of life satisfaction among urban Iranian women: An exploratory analysis. Soc. Indic. Res. 1997, 40, 329–357. [Google Scholar] [CrossRef]
  73. Türksever, A.N.E.; Atalik, G. Possibilities and limitations for the measurement of the quality of life in urban areas. Soc. Indic. Res. 2001, 53, 163–187. [Google Scholar] [CrossRef]
  74. Colantoni, A.; Grigoriadis, E.; Sateriano, A.; Venanzoni, G.; Salvati, L. Cities as selective land predators? A lesson on urban growth, deregulated planning and sprawl containment. Sci. Total Environ. 2016, 545, 329–339. [Google Scholar] [CrossRef]
  75. Zambon, I.; Benedetti, A.; Ferrara, C.; Salvati, L. Soil matters? A multivariate analysis of socioeconomic constraints to urban expansion in Mediterranean Europe. Ecol. Econ. 2018, 146, 173–183. [Google Scholar] [CrossRef]
  76. Biasi, R.; Colantoni, A.; Ferrara, C.; Ranalli, F.; Salvati, L. In-between sprawl and fires: Long-term forest expansion and settlement dynamics at the wildland–urban interface in Rome, Italy. Int. J. Sustain. Dev. World Ecol. 2015, 22, 467–475. [Google Scholar] [CrossRef]
  77. Colantoni, A.; Mavrakis, A.; Sorgi, T.; Salvati, L. Towards a ‘polycentric’ landscape? Reconnecting fragments into an integrated network of coastal forests in Rome. Rend. Lincei 2015, 26, 615–624. [Google Scholar] [CrossRef]
  78. Pacione, M. Quality-of-life research in urban geography. Urban Geogr. 2003, 24, 314–339. [Google Scholar] [CrossRef]
  79. Pacione, M. Urban environmental quality and human wellbeing—a social geographical perspective. Landsc. Urban Plan. 2003, 65, 19–30. [Google Scholar] [CrossRef]
  80. Kahneman, D.; Diener, E.; Schwarz, N. Well-Being: The Foundations of Hedonic Psychology; Russel Sage Foundation: New York, NY, USA, 1999; p. 593. [Google Scholar]
  81. Blomquist, G.C.; Berger, M.C.; Hoehn, J.P. New estimates of quality of life in urban areas. Am. Econ. Rev. 1988, 78, 89–107. [Google Scholar]
  82. Aguilar, A.G. Peri-urbanization, illegal settlements and environmental impact in Mexico City. Cities 2008, 25, 133–145. [Google Scholar] [CrossRef]
  83. Zitti, M.; Ferrara, C.; Perini, L.; Carlucci, M.; Salvati, L. Long-term urban growth and land use efficiency in Southern Europe: Implications for sustainable land management. Sustainability 2015, 7, 3359–3385. [Google Scholar] [CrossRef] [Green Version]
  84. Myers, D. Building knowledge about quality of life for urban planning. J. Am. Plan. Assoc. 1988, 54, 347–358. [Google Scholar] [CrossRef]
  85. Shucksmith, M.; Cameron, S.; Merridew, T.; Pichler, F. Urban–rural differences in quality of life across the European Union. Reg. Stud. 2009, 43, 1275–1289. [Google Scholar] [CrossRef]
  86. Rontos, K.; Grigoriadis, E.; Sateriano, A.; Syrmali, M.; Vavouras, I.; Salvati, L. Lost in protest, found in segregation: Divided cities in the light of the 2015 “Oχι” referendum in Greece. City Cult. Soc. 2016, 7, 139–148. [Google Scholar] [CrossRef]
  87. Marans, R.; James, S. Investigating Quality of Urban Life: Theory, Methods, and Empirical Research; Springer: Dordrecht, The Nederlands, 2011; p. 453. [Google Scholar]
  88. Rogerson, R.J. Quality of life and city competitiveness. Urban Stud. 1999, 36, 969–985. [Google Scholar] [CrossRef]
  89. Pili, S.; Grigoriadis, E.; Carlucci, M.; Clemente, M.; Salvati, L. Towards sustainable growth? A multi-criteria assessment of (changing) urban forms. Ecol. Indic. 2017, 76, 71–80. [Google Scholar] [CrossRef]
  90. Dasgupta, P.; Weale, M. On measuring the quality of life. World Dev. 1992, 20, 119–131. [Google Scholar] [CrossRef]
  91. Salvati, L.; Serra, P. Estimating rapidity of change in complex urban systems: A multidimensional, local-scale approach. Geogr. Anal. 2016, 48, 132–156. [Google Scholar] [CrossRef]
  92. Serra, P.; Vera, A.; Tulla, A.F.; Salvati, L. Beyond urban–rural dichotomy: Exploring socioeconomic and land-use processes of change in Spain (1991–2011). Appl. Geogr. 2014, 55, 71–81. [Google Scholar] [CrossRef]
  93. Salvati, L.; Zambon, I.; Chelli, F.M.; Serra, P. Do spatial patterns of urbanization and land consumption reflect different socioeconomic contexts in Europe? Sci. Total Environ. 2018, 625, 722–730. [Google Scholar] [CrossRef] [PubMed]
  94. Weber, C.; Hirsch, J. Some urban measurements from SPOT data: Urban life quality indices. Int. J. Remote Sens. 1992, 13, 3251–3261. [Google Scholar] [CrossRef]
  95. Gill, T.M.; Feinstein, A.R. A critical appraisal of the quality of quality-of-life measurements. JAMA 1994, 272, 619–626. [Google Scholar] [CrossRef]
  96. Rowley, A. Private-property decision makers and the quality of urban design. J. Urban Des. 1998, 3, 151–173. [Google Scholar] [CrossRef]
  97. Morelli, G.V.; Rontos, K.; Salvati, L. Between suburbanisation and re-urbanisation? Revisiting the Urban Life Cycle in a Mediterranean Compact City. Urban Res. Pract. 2014, 7, 74–88. [Google Scholar] [CrossRef]
  98. Munafò, M.; Salvati, L.; Zitti, M. Estimating soil sealing rate at national level—Italy as a case study. Ecol. Indic. 2013, 26, 137–140. [Google Scholar] [CrossRef]
Figure 1. Locaton of Arak in Iran (source: National Cartographic Center, 2017).
Sustainability 12 02274 g001
Figure 2. Biplot of a Principal Component Analysis (see dimension numbering, ‘Qx’, in Table 4, Table 5, Table 6, Table 7 and Table 8).
Sustainability 12 02274 g002
Table 1. Subjective dimensions and specific aspects of QOUL in Arak.
DomainDimension
Place IdentityAttachment to the city, spending leisure time in the city, willingness to leave the city, Attachment to house unit, house unit safety, satisfaction in building quality, satisfaction in house ownership
Citizenship EthicsNeighborhood supportive in the case of money problems, amount of social interactions with neighbors, degree of responsibility for participating in clean and beauty urban environment, degree of responsibility for city inhabitants, degree of responsibility for children and elders, degree of citizens’ participation
Social SecurityDegree of facing with stray people and delinquent youth, degree of safe presence of women and teenagers, degree of safe feeling in daily life
Environmental qualityDegree of satisfaction of pedestrian, degree of satisfaction of night lightening, degree of being annoyed by noises in open environments, degree of satisfaction of educational facilities, degree of satisfaction of daily commuting to workplace, degree of satisfaction of access to daily shopping, degree of being annoyed by pollution, degree of satisfaction of green areas, degree of satisfaction of pleasure facilities for teenagers and children, degree of satisfaction of sport facilities
Environmental SanitationDegree of satisfaction of sewage system, degree of being annoyed by vermin, degree of satisfaction of city cleanness and beautification, degree of satisfaction of sanitation and health services
Economic SatisfactionDegree of satisfaction of income and costs of living, degree of job satisfaction, degree of job opportunity
Quality of public transportationSafety feeling in crossing streets, degree of satisfaction of daily traffic, degree of satisfaction of public transportation
Table 2. Response distribution (%) of place identity variables (Likert scale from 5, full agreement, to 1, full disagreement).
Question54321
1. Is your city close to the ‘ideal’ city?12.525.538.411.910.1
2. How strong is your sense of belonging to the neighborhood?17.730.631.413.85.7
3. Do you spend your free time in the neighborhood?3.916.621.032.724.2
4. Do you want to leave your city?43.824.222.624.714.0
5. How strong is your sense of belonging to your dwelling unit?17.434.03.010.12.3
6. Are you satisfied with your house facilities?19.730.438.78.81.3
7. Are you satisfied with your living conditions?17.426.536.113.85.5
8. Are you satisfied with your house ownership status?33.826.022.613.53.4
Table 3. Response distribution (%) of citizenship variables (Likert scale from 5, full agreement, to 1, full disagreement).
Question54321
9. If you have a financial problem, do you get help from your neighbors?1.68.18.320.861
10. How frequently have you meet neighbors during the last 3 months?4.710.919.527.337
11. Do you consider yourself responsible for cleaning and beautifying your neighborhood?17.142.627.510.41.8
12. Do you care of the neighborhood and its inhabitants?12.235.636.411.73.9
13. Do you consider yourself responsible for taking care of elders and children?22.944.523.66.52.1
14. Do you think residents participate in common activities in your neighborhood?4.415.132.232.515.6
Table 4. Response distribution (%) of social security variables (Likert scale from 5, full agreement, to 1, full disagreement).
Question54321
15. Are strays/ delinquent/strangers common in your place of life?3.61425.245.511.4
16. Are women/children safe going out in the night?4.219.237.828.313.2
17. Do you feel safe and comfortable in your everyday life?8.63339.512.76.2
Table 5. Response distribution (%) of environmental quality variables (Likert scale from 5, full agreement, to 1, full disagreement).
QuestionFullyHighIntermediateLowNever
18. Are you satisfied with the pedestrian paths?4.416.133.527.816.4
19. Are you satisfied with the night lightening?4.423.444.718.27.5
20. Are you satisfied with road noise while resting or studying?2.924.424.434.311.4
21. Are you satisfied with the educational facilities in your neighborhood?5.724.433.223.18.6
22. Are you satisfied with your commuting?12.526.230.611.48.1
23. Are you satisfied with access to shopping centers and daily necessities close to your house?21.334.026.012.23.6
24. Do you think air pollution hurts?16.146.217.915.12.9
25. Are you satisfied with the amount of green space in your neighborhood?5.715.324.230.122.9
26. Are you satisfied with the availability of playgrounds for children and recreation facilities in your neighborhood?3.68.825.528.133.0
27. Are you satisfied with access to sport facilities?3.113.528.829.923.9
Table 6. Response distribution (%) of environmental sanitation variables (Likert scale from 5, full agreement, to 1, full disagreement).
Question54321
28. Are you satisfied with plumbing and the smell of wastewater wells in your neighborhood?12.231.932.515.86.8
29. How much harmful insects in the area hurt you?7.015.625.240.311.4
30. Are you satisfied with the cleanness and beauty of your neighbor? 4.219.739.525.210.6
31. Are you satisfied with access to health care services?6.519.539.722.910.9
Table 7. Response distribution (%) of economic satisfaction variables (Likert scale from 5, full agreement, to 1, full disagreement).
Question54321
32. Are you satisfied with your income and living expenses?7.517.941.817.714.3
33. Are you satisfied with your job condition?8.621.827.819.519.2
34. Are you satisfied with the opportunities to find a suitable job?4.712.229.927.520.5
Table 8. Response distribution (%) of satisfaction for public transportation variables (Likert scale from 5, full agreement, to 1, full disagreement).
Question54321
35. Do you feel comfortable when using public transport?3.115.133.033.813.5
36. Are you satisfied with the flow of traffic in the main streets during peak hours?6.011.932.232.715.6
37. Are you satisfied with public transport?3.115.133.033.813.5
38. Are you satisfied with cost of public transport?8.324.936.421.07.8
Table 9. Loadings of QOUL dimensions in the first three components.
DimensionComponent 1Component 2Component 3
Ideal neighborhood0.72
Sense of belonging to the neighborhood0.57
Leisure in the neighborhood0.55
Leaving the place of residence–0.53
Satisfaction with residential units0.52
Unit dimension0.47
Satisfaction with neighborhood amenities0.65
Ownership satisfaction0.46
Financial assistance from neighbors 0.62
Meeting the neighbors 0.68
Neighborhood beauty 0.49
Efforts to secure neighborhood0.45
Responsibility for the elders 0.46
Participation of residents 0.46
Presence of stray people 0.51
Ladies’ security0.49
Feeling safe0.58
Satisfaction with street pavements0.51
Lighting at night0.58
Noise pollution 0.45
Educational facilities0.53
Distance to work
Access to commercial places0.45
Air pollution 0.45
Neighborhood green space0.53
Children’s playground0.59
Access to sports facilities0.51
Plumbing0.50
Insect pests
Neighborhood cleaning0.61
Access to health services0.57
Satisfaction with income0.45
Job stability
Opportunity to find a job
Accident/collision risk in the neighborhood
Traffic flow –0.49
Cleanliness of Public Transport
Access to public transportation
Correlation of components with individual variables assessing the socioeconomic profile of respondents
Gender (female vs male)
Place of birth (Arak vs other places)
Marital status (single vs married)
Literacy (low to high) –0.180.14
Age group (low to high) –0.11–0.12
Job (high to low) –0.11
Number of family components 0.17
Explained variance (%)20.67.36.6

