Spatial Pattern and Effects of Urban Coordinated Development in China’s Urbanization


1
School of Political Science and Public Administration, Shandong University, Qingdao 266237, China
2
Institute for Studies in County Development, Shandong University, Qingdao 266237, China
*
Author to whom correspondence should be addressed.
Sustainability 2020, 12(6), 2389; https://0-doi-org.brum.beds.ac.uk/10.3390/su12062389
Submission received: 23 February 2020
/
Revised: 17 March 2020
/
Accepted: 17 March 2020
/
Published: 19 March 2020
(This article belongs to the Special Issue Urban Economics, City Development and Future Social Challenges)
Abstract
:Regional urbanization in China has made formidable progress in, among other things, economic growth and urban sprawl, but local development is undergoing severe stress with irreversible impacts for urban ecological environment. Furthermore, spatial interactions are proved to be related to urban coordinated development. However, this spatial effect cannot usually be found in the literature. Based on the concept of coordinated development, the interaction among the economic, social and ecological systems of cities at prefecture level and above in China can be modeled by a coupling coordination model, and then analyzed using spatial analysis methods and spatial econometrics models, which can explain the patterns in spatial variation and its evolutionary trends. The results show that urban coordinated development has an apparent spatial heterogeneity, and East China develops better than West China. Moreover, urban coordinated development has an increasing global trend, which mainly results from East China, while the other regions cannot provide a definite boost. Lastly, there is an evident spatial dependence in urban coordinated development, which is positively influenced by an area’s own previous condition and its neighboring cities. Furthermore, population size, local GDP and green land, etc. have spatial spillover effects on urban coordinated development in China.
1. Introduction
Since the Chinese economic reform starting in 1978, social and economic development in China has succeeded spectacularly, especially in terms of gross domestic product (GDP) and carbon emissions [1]. According to the China Statistical Yearbooks, the rates of urbanization were around 11% in 1950, and steady grew to 61% in 2019, which meant over 848.4 million people lived in urban areas in 2019. The economic urbanization rate, which was defined as the proportion of the sum of secondary industry and tertiary industry in the GDP, increased from 50% in 1950 to 93% in 2019 (Figure 1). Moreover, as the process of urbanization develops rapidly, the urban area has gradually been the central region of social life and economic production [2]. Nevertheless, besides the imperfect policy system and the defective economic system in China, the excessive spatial agglomeration of local human activities has unfortunately resulted in severe crowding in cities and related effects, such as air pollution, traffic jams, and ecological degradation [3]. This also may indirectly cause all kinds of unpredictable problems or difficulties in achieving sustainable and coordinated development [4]. Following the accelerating process of local urbanization in China, complex crises also have been arising in the field of the urban natural environment. In the broadest consensus yet on urban coordinated development in China, the empirical quantification and explanation of the spatial distribution of urban coordinated development and its driving factors, has such high real values, which can help us to know where and when urban coordinated development in China is very satisfactory.
Nowadays in terms of public policy, the urban coordinated development includes economic production, social life and environmental ecology, which has gradually received extensive attention from officials, scholars and citizens [5,6,7]. For example, economic growth, social development and environmental protection are the core principles for the main functional area planning in China. Moreover, the 18th Communist Party of China (CPC) National Congress reported that the promotion of intensive economic growth, harmonious social development and sustainable ecological protection were the main policy requirements. The proposals of China’s Central Urbanization Conference and China’s Central City Conference to promote the regional coordinated development of economic growth, social development and environmental protection also sent a strong signal and the main task of new urbanization. The year 2018 was the 40th anniversary of Chinese economic reform, and China’s economic development has been increasing rapidly for about 40 years, although the traditional development model is no longer sustainable [8]. So in the new era, China’s understanding of urban coordinated development has gone through a process from real economic growth to the coordinated development of economy, society and ecology [9].
The urban coordinated development in urbanization has been an important issue in China and abroad. Urban development is the process of a rural population migrating into urban areas and the corresponding transfer of agricultural lands to commercial lands. The rapid urbanization in China used to be at the cost of overusing natural resources and losing natural areas. At the same time however, the growing economy did represent the income and the living standards of urban residents were correspondingly improved. Then, local governments realized that the development was unsustainable without protecting the environment and improving the residents’ quality of life, and that it was necessary to achieve a coordinated development of urban economy, society, and ecology. There is a complicated nonlinear coupling relationship among these three subsystems [10,11]. Based on the concept above, various attempts to explicitly address the issue, such as “economy, energy” [12], ‘‘society, ecology’’ [13,14], ‘‘economy, energy, environment’’ [15,16], ‘‘urbanization, environment’’ [17], ‘‘human, environment’’ [18], ‘‘economy, resource, environment’’ [19], ‘‘economy, society, environment’’ [20], “economy, environment’’ [21] and “population, economy, space, environment” [22], have been done in transdisciplinary research. Most studies have focused on spatial pattern analysis, neglecting the spatiotemporal coupling and trend analysis [23]. For example, Yang et al. [24], Liu et al. [2], Xie et al. [25] and Wu et al. [18] explored urban coordinated development using classical econometric methods instead of spatial econometrics, so no spatial effects were considered. Moreover, because most research was conducted at a provincial level, the spatial heterogeneity within provinces was missed, which could affect the credibility of the research results. A closer look at the history and the current achievements in urban development teaches us that, despite the formidable progress made in achieving a further understanding of its structure and evolution, there are few studies on the spatial dependence effects of urban coordinated development [23,26]. This research was conducted at city level by using statistical data, which showed the spatial correlation within provinces. The analysis of the spatial heterogeneity and spatial dependence of urban coordinated development has been conducted over nearly twenty years. Such long-term analysis would help to explain whether the urban coordinated development among different neighborhood cities have an effect on each other, and how spatial distance influences the correlation between cities. So, to study dynamic spatial patterns of urban coordinated development in a period will have significant meaning for regional sustainability, which is fundamental to recognizing, respecting and conforming to the new urbanization [27].
This study aims to understand the spatial patterns and influencing factors of urban sustainability in mainland China on a city scale. As an important perspective to identify and further solve regional problems, a coordinated development model was constructed, which reflected the relationship between economy, society and ecology during 1995-2015. First, we proposed an indicator system of urban coordinated development; then the spatial pattern of urban coordinated development was analyzed by using data collected from statistical yearbooks; third, a spatial econometrics model was used to explore the influencing factors and their spatial effects on urban coordinated development.
2. Study Area
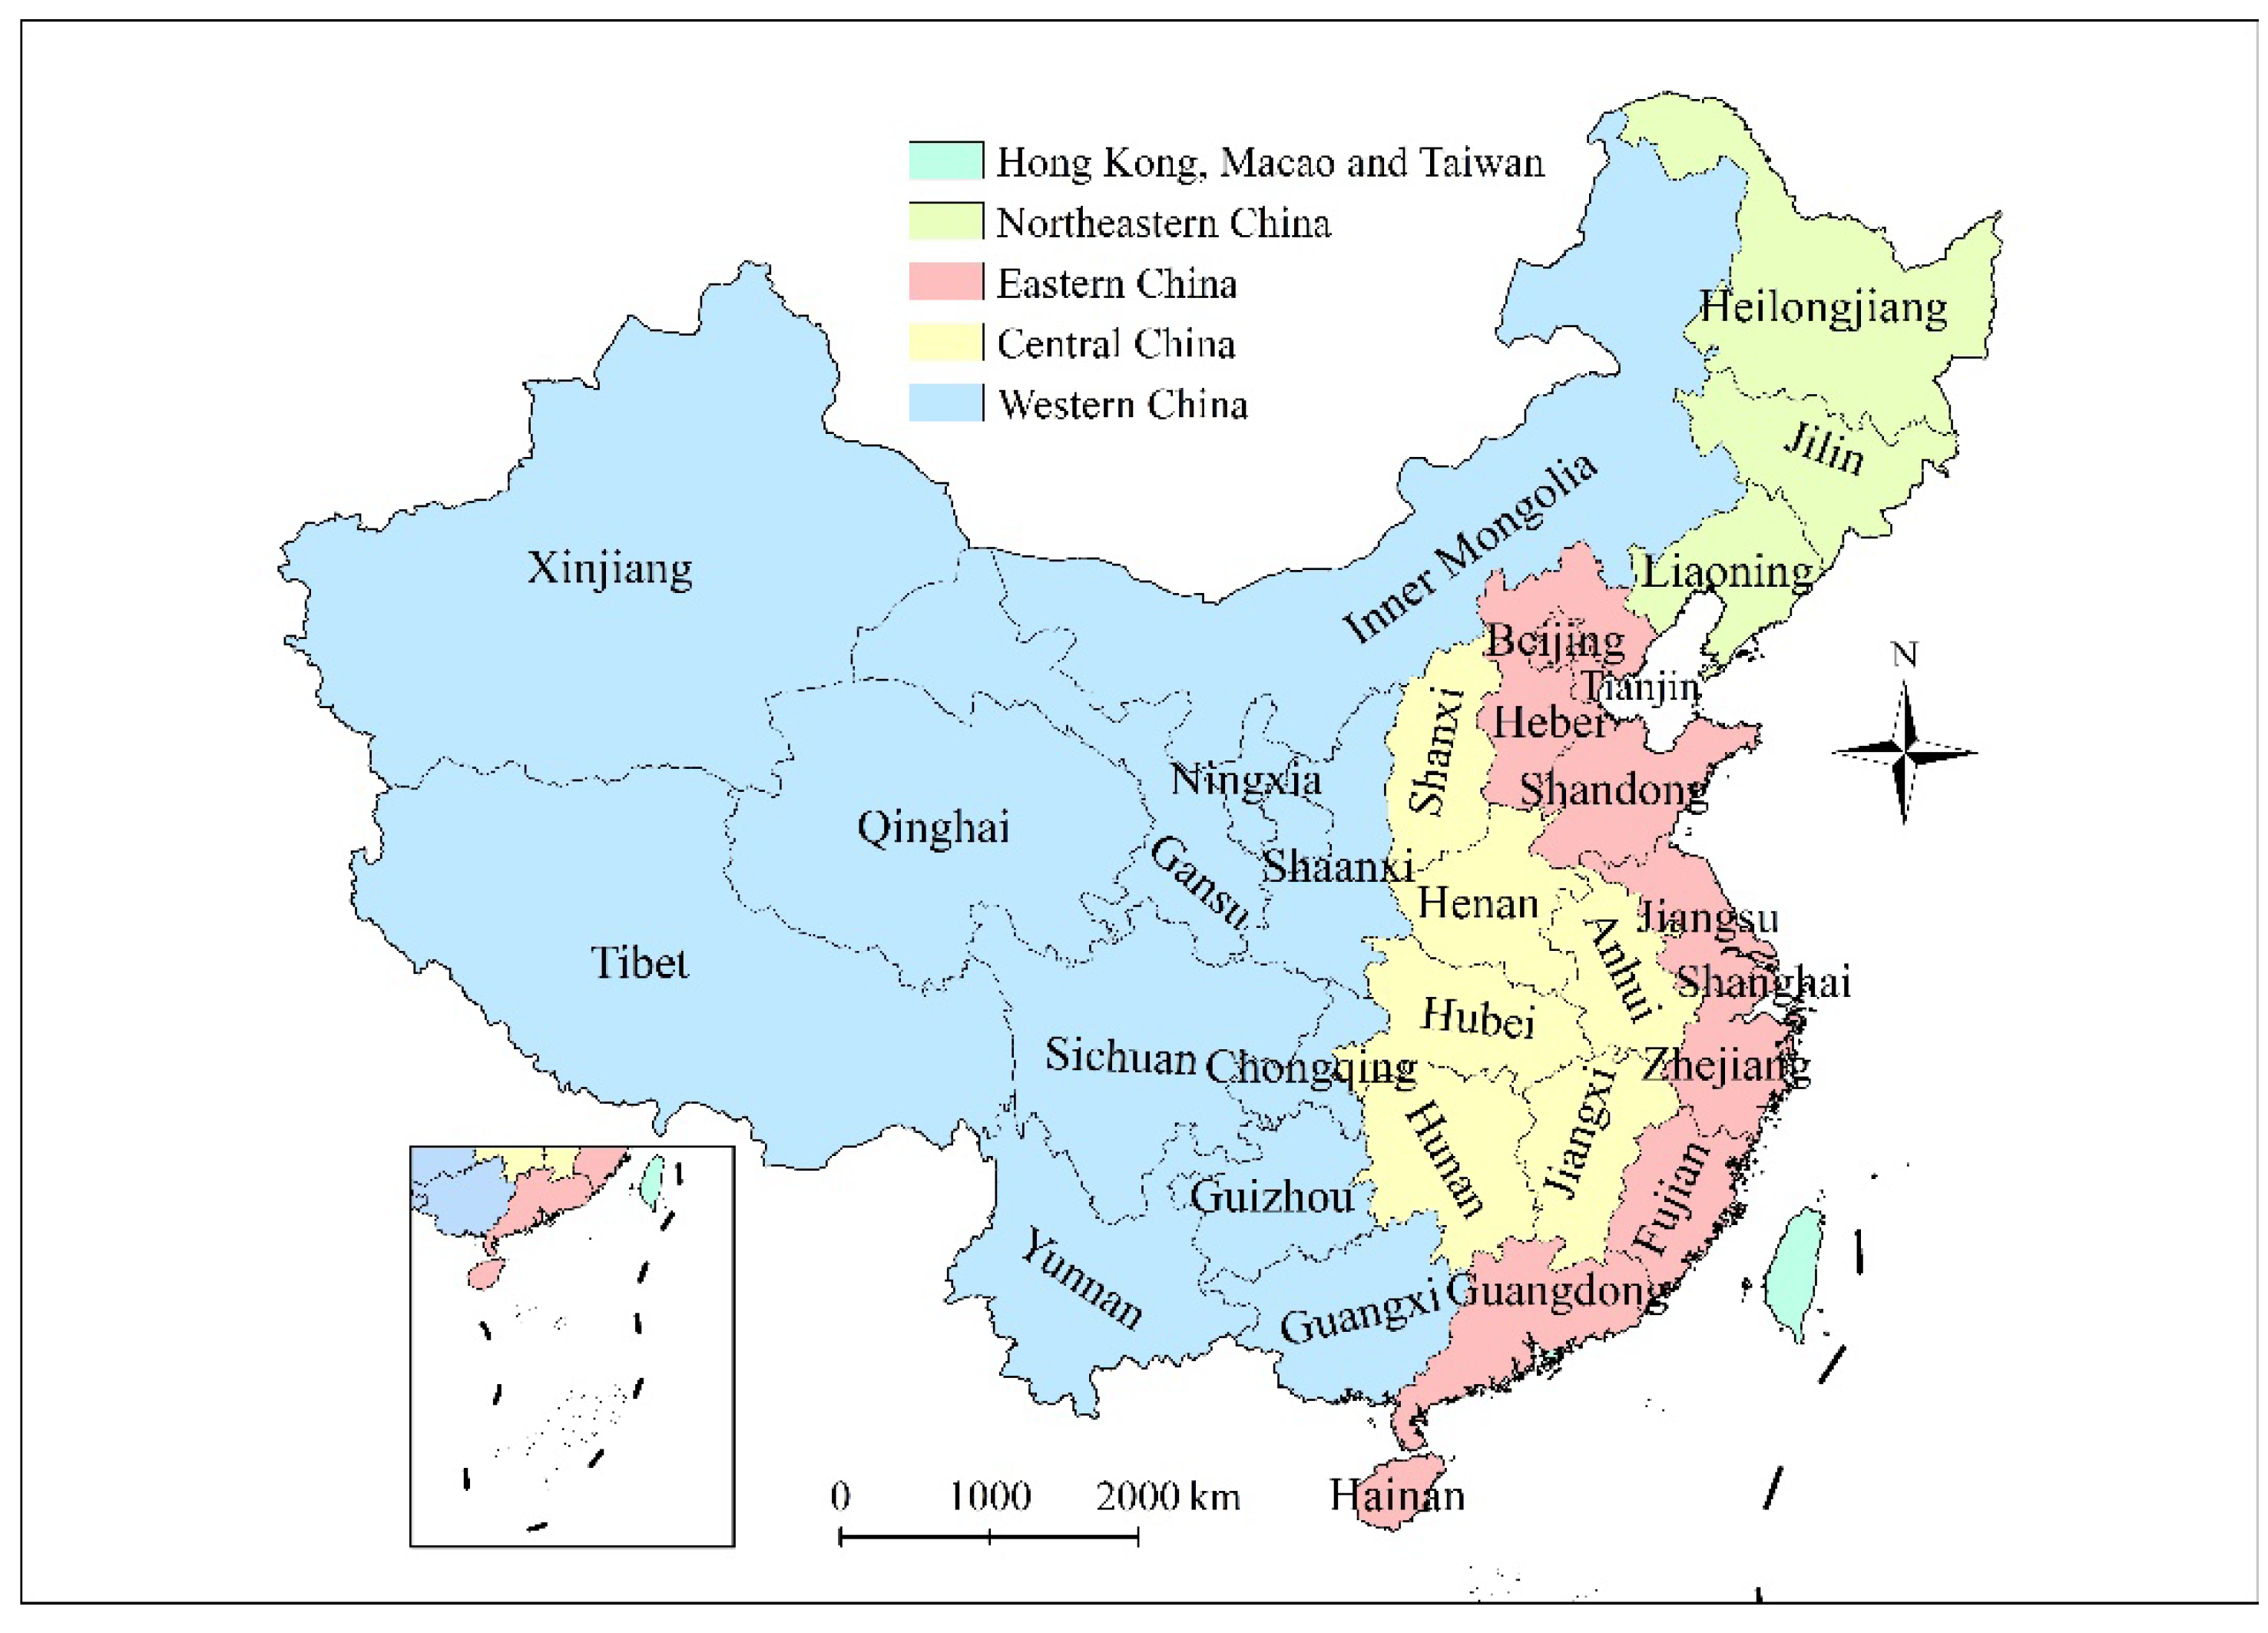
China has four province-level cities (Beijing, Tianjin, Shanghai and Chongqing), and thirty provinces that include 332 prefecture-level cities and 27 prefecture-level counties. Based on their position, all province-level cities and provinces can be classified into four groups: Northeastern, Eastern, Central and Western (Figure 2). The study was conducted in 332 prefecture-level cities and four province-level cities, whose development was more similar to prefecture-level cities instead of provinces. Hong Kong, Macao, Taiwan and prefecture-level counties were excluded from the research because of a lack of data.
3. Materials and Methods
3.1. The Index System
Generally, urban coordinated development is precisely the coordinated development of local economic, social and ecological systems, which refer to intensive economic growth, harmonious social development and sustainable ecological protection [24,25]. Currently, there is no universal criterion for index selection, and the selection of index also varies with the purpose of research, study area and spatial scale, etc. We chose indexes by following the traditional selection principles, such as operability, relative independence, instructive principles, comparability, etc. [25,28]. The index also satisfied the requirements concerning the study area and data collection: (1) The indices should cover broad rather than detailed contents, and they should be able to describe and embody the status and changing trends of economy, society and ecology; (2) The data should be reliable and accessible; (3) The indexes should be employed to evaluate existing and emerging problems, diagnose factors causing the damages, and guide the formulation and implementation of policies and measures.
Therefore, an index system was proposed including three levels and 18 indicators (Table 1). The indexes in Economy (C) represented the economic development of a city as a whole with the consideration of the number of residents. The indexes in Society (H) described public facilities and services available for residents, their income and living standard. The indexes in Ecology (T) reflected the natural resources in cities and the influence of cities on nature. All data were collected from China City Statistical Yearbooks (CC) and China Statistical Yearbooks for Regional Economy (RE). Table 2 shows a summary description of the data.
Furthermore, among 18 indicators, the population density of city districts and the industrial wastewater discharged density of city districts are both a negative value, which means that urban coordinated development becomes better and better as the indicator decreases. Conversely, the other indicators in the article are all positive. What is more, in order to reduce the statistical error caused by different units of evaluating indexes, the original data has been corrected by min-max normalization. The weights of indexes in some research were estimated by AHP (Analytic Hierarchy Process) based on Delphi method [29,30], which we considered to be a difficult method for determining the weights objectively as it relies on a panel of experts. Therefore, we applied the Shannon’s entropy method, an objective measure of uncertainty regarding the source of data information [28]. The indicator weight based on its entropy redundancy was estimated by calculating the information entropy and variations [31].
The coupling coordination degree model based on the concept of coupling in physics can express interactions among systems, which can measure the changes in the extent of coordination as well as determine the phase change when it reaches a critical value (nowadays this model has been used in studies of interactive, nonlinear relationships) [29]. Based on the principle of urban coordinated development evidenced from economic, social and ecological systems, as shown in Formula (1), economic level (C), social level (H) and environmental level (T) were quantified respectively. In the formula, ci, hi and ti are their respective indicators in the index system. Moreover, accordingly, w1, w2, and w3 are its weights. More specifically, in the article, the three subsystems above were the equal value, as shown in Formulas (2) and (3), the absolute index (A) and the relative index (R) were built. Then urban coordinated development (D) in the article should consider the absolute index and the relative index above, as shown in Formula (4), which scientifically reflected economic, social and ecological coordination in China in the new era [30].
3.2. The Analysis Methods
The spatial statistic methods, such as optimized hot spot analysis, can quantify the spatial distribution of urban development [28]. The short panel model and spatial econometrics models such as spatial Durbin model can identify the significant factors in China’s urbanization process.
3.2.1. Optimized Hot Spot Analysis
In the article, optimized hot spot analysis was introduced to quantify the spatial distribution of urban coordinated development in China. The optimized hot spot analysis is used to identify the spatial high value (hot spots) and the spatial low value (cold spots) [31,32,33]. Unlike the traditional spatial analysis controlled by a researcher, optimized hot spot analysis can execute the hot spot analysis using parameters derived from characteristics of input indexes. Similar to the function of the automatic setting on a digital camera, it can interrogate empirical indexes to obtain the settings that will yield optimal hot spot results [34].
3.2.2. Spatial Durbin Model
Before using spatial econometrics, it was necessary to justify if there was significant spatial dependence. So Moran’s I, Geary’s C and Getis-Ord’s G were used to quantify the spatial autocorrelation of urban coordinated development in China, and to describe whether the spatial distribution of urban coordinated development was spatially clustered, random or dispersed, and whether it was statistically significant or not [35,36,37]. Then based on the result of the Hausman test (χ2 = 147.99, ρ = 0.00), we used the spatial Durbin model (SDM) with spatial effects as shown in the Formula (5) [37,38,39] to analyze whether there was an exclusive spatial interaction among neighboring cities in China. The spatial autoregression model (SAR) and the spatial autocorrelation model (SAC) were also applied as auxiliary models. The spatial weight w was identified and constructed through the queen contiguity. Compared with traditional econometrics focusing on spatial heterogeneity, spatial econometrics is more concerned with spatial dependence. Nowadays, the spatial econometrics model has been developed for three generations, being the spatial section model, the spatial static panel model and the spatial dynamic panel model. Therefore, the article used the spatial dynamic panel model with spatial effects and time effects, and empirically study the spatial effects of urban coordinated development in China.
In the formula, yi,t is the urban coordinated development index of the city i in year t, yi,t−1 is in year t−1, wi’ is the spatial weight, x’ is explanatory variables, ρwi’yi,t is spatial lag of yi,t, δdi’Xt is spatial lag of explanatory variables, μ is spatial effects, γ is time effects, and ε is spatial errors. The logarithm of urban population size (lnpeop), urban GDP (lngdp), retail sales of consumer goods (lnsoci) and urban green land (lnlvdi) were control variables. The 18-index system may enhance its relation with control variables. However, considering the way to choose indexes, estimate their weights, and construct the urban coordinated development value (D), we think the influence from these indexes would be slight.
4. Results
4.1. Probability Distribution of Hot Spots and Cold Spots
Urban coordinated development is the aggregated results among economic, social and ecological systems. Based on the results of the optimized hot spot analysis every year, we recorded the probability distribution of hot and cold spots of economic, social and ecological development in China during 1995–2015. As shown in Figure 3, in three terms of economic, social and ecological subsystems, there have been some visible geographical characters in China during these years, and different regions distribute significantly different cold spots or hot spots. Hot spots of the economic system are significantly clustered in East China, such as Shandong, Jiangsu, Shanghai, Zhejiang and Fujian. Furthermore, its cold spots mainly distribute in Southwestern China, so urban economic development in China trends to increase gradually from the western inland to the east coast. Then hot spots of the social development spatially located in East China, especially in the Bohai Rim region, and Chongqing, Yunnan and Guizhou are the main areas of cold spots, which means that the spatial pattern of the social subsystem is globally similar to the economic subsystem. Compared with economic and social subsystems, the ecological subsystem distributes less geographical heterogeneity, and the Tibetan Plateau is still an essential zone for cold spots. Generally, hot spots of three subsystems are mainly distributed in East China, and cold spots are significantly clustered in West China, suggesting that an apparent increasing trend exists spatially from the western inland region to the eastern coastal region in China.
4.2. Urban Coordinated Development Index
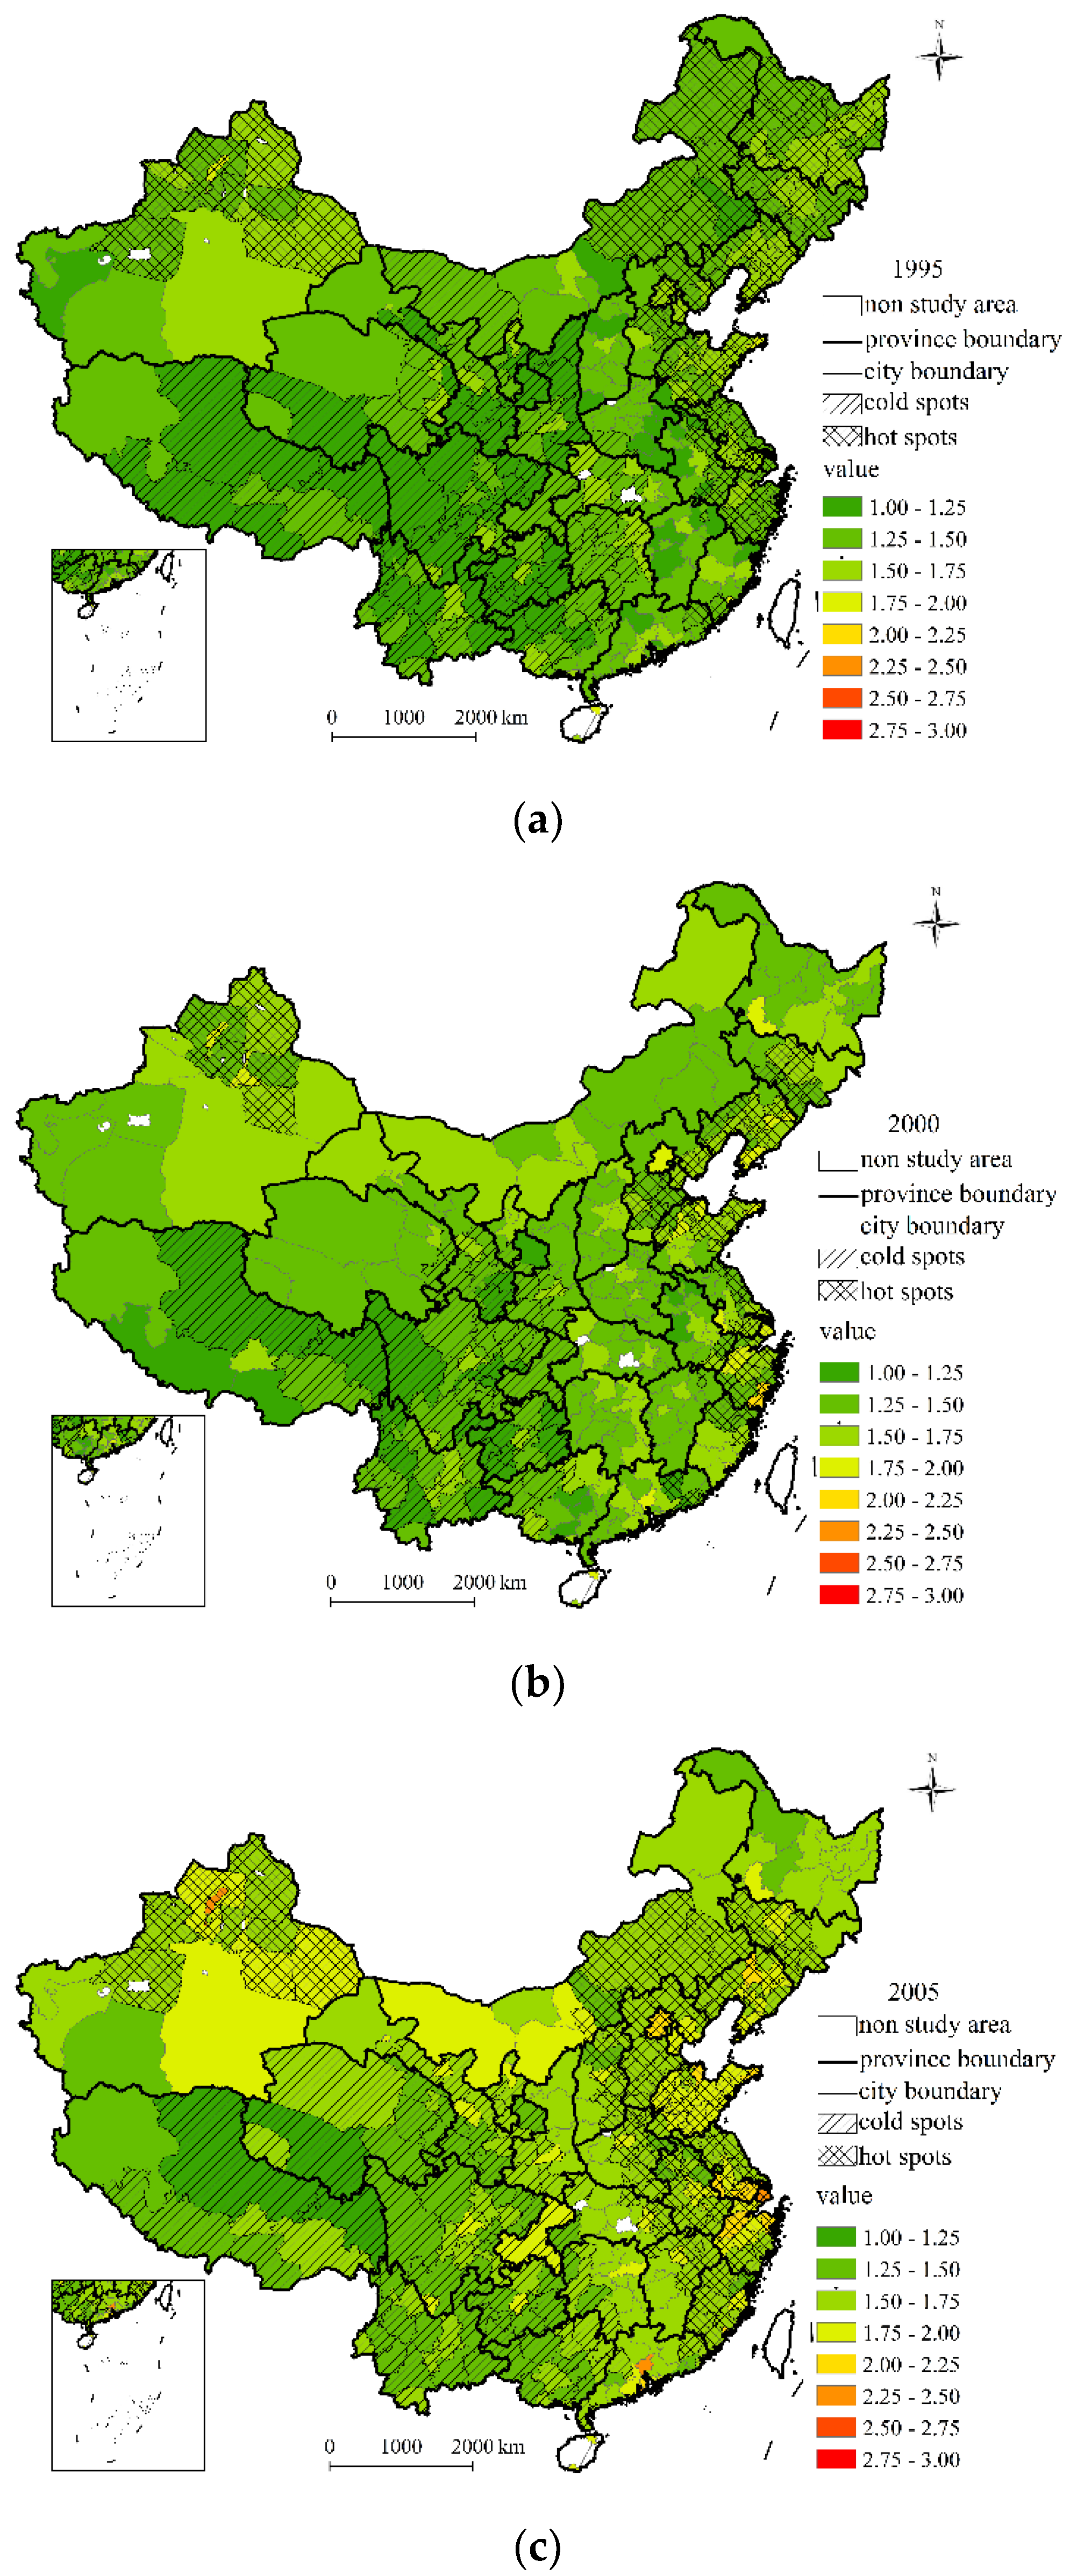
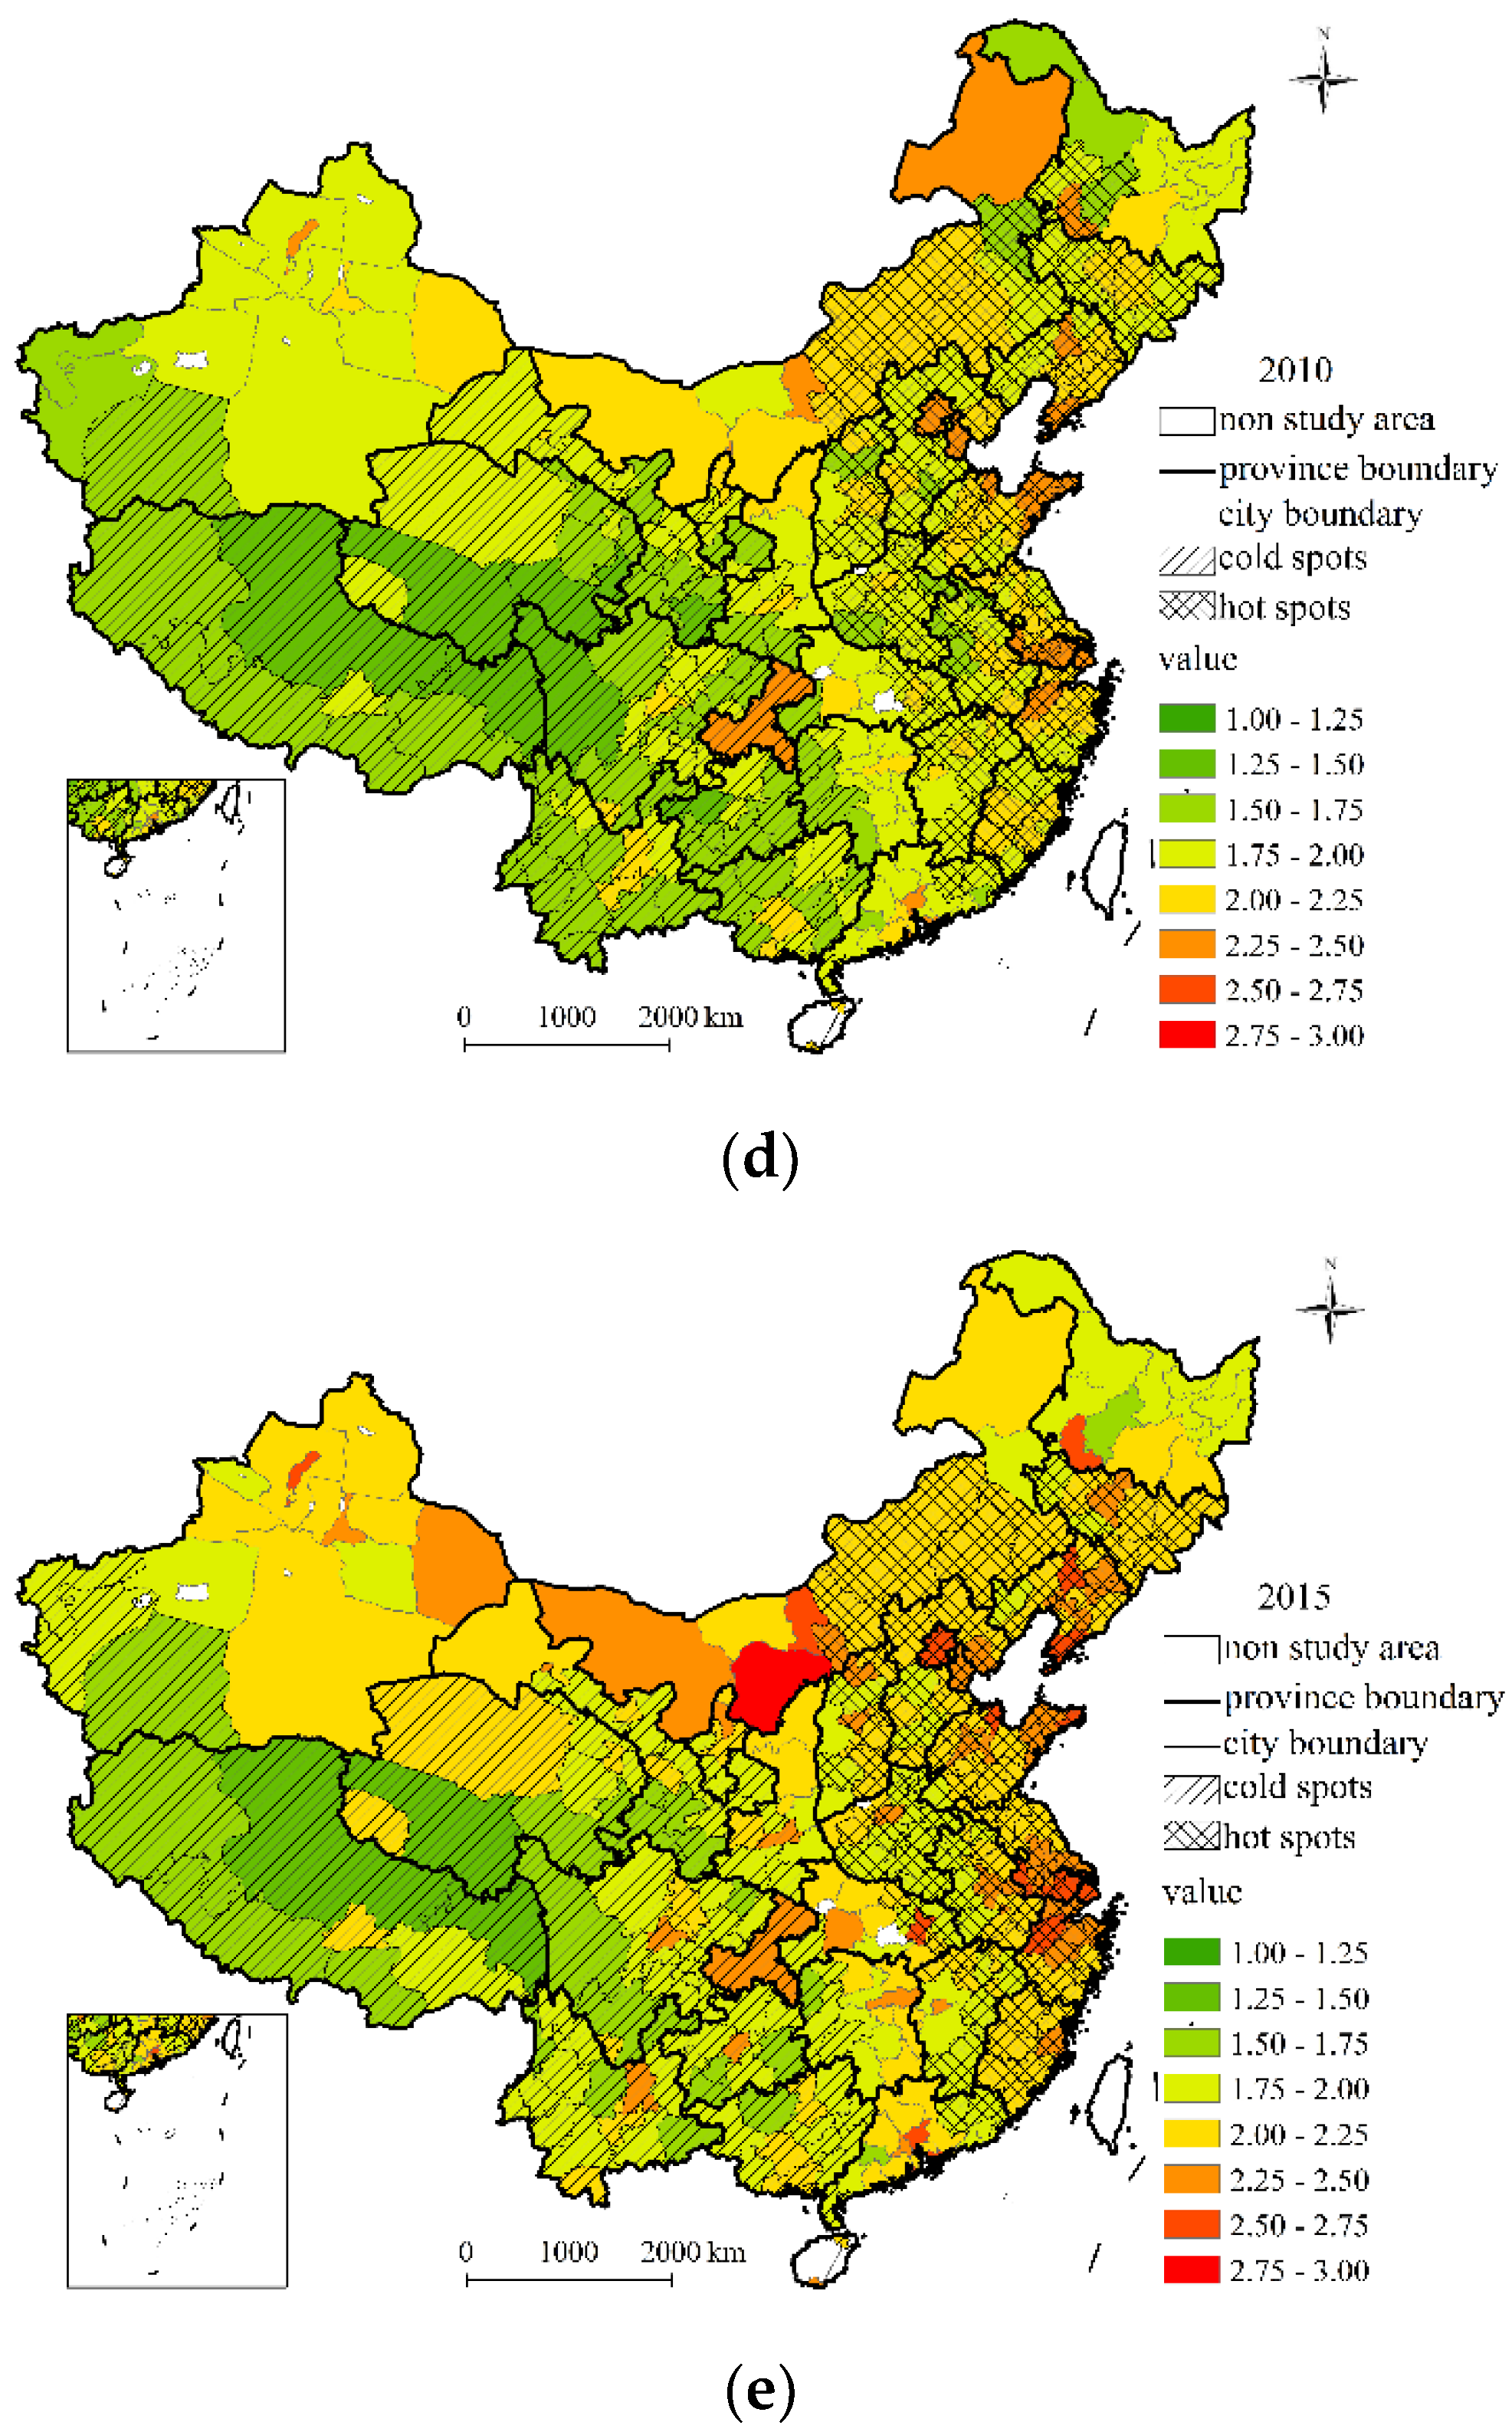
As a benefit of sustained economic, social and ecological development, urban coordinated development in China has been dramatically and globally improved as the urban coordinated development values (Variable D) generally increased during the study period (Figure 4). Moreover, geographical heterogeneity of both hot and cold spots is still very significant, but not robust during the years under investigation. Especially, hot spots in 1995 mainly occurred in the Beijing-Tianjin-Hebei region and East China, then in 2000 hot spots shrunk globally and even disappeared locally, but in 2005–2015 they expanded and sprawled steadily in East China while at the same time they shrunk slowly in Northeast China. In contrast, cold spots still being clustered in Southwest China in these years, have significant and robust geographical characters.
5. Discussion
5.1. Spatial Distribution
The means, standard deviations and frequencies (the number of cities) of urban coordinated development in China were listed in Table 3. Based on the analysis-of-variance model (ANOVA), the F value is 136.38 reaching the 99% level of statistical significance, and urban coordinated development in China had significant spatial effects. There were fundamental differences among Eastern, Central, Western and Northeastern China in terms of the urban coordinated development during these years.
Each region had different urban coordinated development during 1995–2015. To evaluate whether the development was improved or worsened, we used the F test linear hypotheses after ANOVA (Table 4).
The results got the statistical significance level and showed that Eastern China reached the highest level of coordinated development and followed by the Northeastern and Central, and the last is Western China.
5.2. Temporal Dynamics
Urban coordinated development in China has prominent geographical characteristics according to divisions of administrative areas in China. Consequently, we divided empirically into East China, Central China, West China and Northeast China to identify significant factors and their differences among the four regions above.
We aimed to determine whether urban coordinated development in China during the years under investigation evolves relative to an apparent time effect. Based on the short panel model with time fixed effects (Table 5), the coefficients of the four years were 0.0798, 0.2370, 0.4754 and 0.6120 respectively, and were all clear positive values. This meant that urban coordinated development in China had a significant and robust positive time effect, and that this effect showed a trend of strengthening and accelerating during these years.
In addition, the F value using the analysis-of-variance (ANOVA) model was 685.66 and its ρ was 0.00, which meant the urban coordinated development had significant time effects. The F-test was applied to reflect the joint significance of all annual dummy variables (Table 5), all of the time-fixed effects reached the level of statistical significance, so urban coordinated development in China continued to improve globally. Nevertheless, very significantly, the time effect is very different in the four regions above. Specifically, compared with the nation as a whole, during 1995–2005, East China was much higher, and Northeast China was the lowest, which meant that during this period global improvement in China mainly benefited from East China’s development, rather than the other three regions. Then during 2005–2015, the above phenomenon had not completely changed, but central China developed significantly, which may have benefitted from the “Rise of Central China” strategy starting from the 2004. “The Rise of Central China”, which first appeared in the Report on the Work of the Government in 2004, aimed to promote development in six provinces in Central China: Anhui, Henan, Hubei, Hunan, Jiangxi and Shanxi. It is a major strategy in China’s coordinated regional development. In general, urban coordinated development in China has been improving, and this improvement mainly results from East China. Furthermore, such development in Central China, West China and especially Northeast China, was comparatively less in most years.
5.3. Spatial Interactions
Based on Moran’s I and Getis-ord’s G, urban coordinated development in China during 1995–2015 had an evident clustering phenomenon, as shown in Table 6, which means that there is a special spatial dependence effect. Furthermore, a city’s urban coordinated development can be affected by its neighboring cities, as cities are not an isolated “island”. So spatial econometrics models are essential for this article.
The spatial coefficient ρ in SDM was 0.9656, being at a 99% statistical significance level, as it was in SAC and in SAR, as shown in Table 7. The positive value means that urban coordinated development in China is not only affected by the city’s previous conditions but is also restricted by the surrounding cities. Furthermore, as neighboring cities’ coordinated development grows, so does the coordinated development in other cities within the corresponding area. To conclude, in recent years, urban coordinated development in China still has an apparent spatial dependence, and a city can be effected evidently by its surrounding cities. In this respect, the promotion a city’s coordinated development must be based on its urban agglomeration’s improvement, which means that unique political and institutional advantages that enable us to mobilize resources to accomplish large undertakings are not useful in a single city.
The coefficient of urban population size in SDM was −0.1780, and its weighted coefficient was 0.5411, both of which were significant values. That is, as a city’s population size enlarges, its coordinated development may not improve greatly and can even worsen, and its neighboring cities may develop accordingly. A central reason for the phenomenon mentioned above is that, as city size increases, the agglomeration effect of productive urban resources, such as labor, innovation and capital, will be more significant and effectively result in local economic growth. Conversely, super large cities may bring some troubles, among other things, in the form of urban problems, transportation problems and natural resource problems, emerging at the crossroads of social economy and natural ecology. As such, this crowding effect resulting from city size may have a great many negative linkages to urban coordinated development. Nevertheless, whether this linkage is linear or nonlinear needs to be discussed in our future work. Furthermore, an increasing city size can bring a visible spatial spillover effect for its surrounding cities inter alia in urban development regions, which can indirectly improve public facilities and public services, and promote the whole coordinated development.
Furthermore, in SDM, the coefficient of urban GDP was positive 0.0908, and its weighted coefficient was negative 0.2717, which means that urban economic growth can improve its coordinated development, but may negatively restrict the nearby cities, because of its serious polarizing effect. As a result of their lack of unique political and institutional advantages, small cities are still facing increasingly severe social and economic problems and have been troubled by the “dark under light” phenomenon from a Chinese proverb. The phenomenon above refers to the suggestion that, although a small city is spatially adjacent to a large core one, it cannot get any benefits from the core city, or worse, it can experience negative effects, such as air pollution or increases in house prices.
What is more, both the coefficient and its weighted coefficient of urban green lands in SDM were significant positive numbers. That is, enlarging urban green lands can not only make the areas much more beautiful and more livable but can also improve the surrounding environment. So, the urban natural environment has an apparent spatial effect on the city and its surroundings. Moreover, the coefficient of retail sales was significant, but its weighted coefficient was not, so a city’s social consumption cannot improve its surrounding development effectively, and its spatial spillover is not apparent, which is different from the other three coefficients above.
Understanding the urbanization process is important for a developing country with a large population such as China. Thus, it is necessary to describe urban coordinated development with sufficient data, and to further quantitatively analyze various cities to find out the regions with problems and shortages with respect to urbanization. Even though the meaning of urban coordinated development is much more complex than is reflected in our research, we tried to analyze urban coordinated development in mainland China on a city scale based on long-term statistical data. By constructing an 18-indicator system from three aspects: economy, society and ecology, we studied the spatial mechanism, development mode and multiscale features of urban coordinated development under the current socioeconomic conditions. However, Hong Kong, Taiwan, Macao and some prefecture-level counties were excluded from the research because of the lack of data, which may mean that some information is missing in the spatial distribution and interactions analysis.
6. Conclusions
In the article, we analyzed the spatial pattern of urban coordinated development in China in recent years by using spatial analysis methods and spatial econometric models. We find that the urban economic, social or ecological system in East China is much better than that in West China, and urban coordinated development in China has an apparent spatial heterogeneity. Second, in recent years, urban coordinated development in China has been improving, and this positive time effect mainly resulted from East China, while Central, Northeast and West China cannot provide a definite boost. Lastly, urban coordinated development in China also has an exclusive spatial dependence, which is not only affected by its previous condition, such as population size and local GDP, etc. but is also positively influenced by surrounding cities.
The conclusions of this study provide a policy direction for managing and improving urban coordinated development in China in recent years. Initially, for an extended period of time, economic growth will remain a core role of government functions and will establish and improve modern industrial clusters by allocating scarce innovative elements in urbanized regions. Furthermore, to improve public facilities and public services between urban and rural regions is an effective way to improve coordinated development, and the local government must give full play to the leading role of people-centered urbanization strategy.
Moreover, regional development must be based on its special location conditions among the central, eastern, western and northeastern regions. Full consideration must be given to the economically driven functions of the eastern region and the inherent resource advantages of the central and western regions. However, China’s development strategy should also be adjusted dynamically. More precisely, East China should further develop its advantages in location, capital and technology, and maximize its spatial spillover effects on developed cities to drive the coordinated development level of their surrounding small cities, in particular the Beijing–Tianjin–Hebei region, the Yangtze River Delta and the Pearl River Delta. Central China should further innovate its industrial and land policies to promote the sustainable development of industrialization and urbanization, but not at the severe expense of the local ecological environment. Similarly, Northeast China should stimulate the vitality and motivation of economic growth by optimizing industrial structures and improving the investment environment. However, in West China, to protect and improve local natural resources and ecology, environment is an essential basis for the whole coordinated development.
In the context of economic growth and social progress with scarce ecological resources, in brief, we must make good use of new technologies and new strategies in developed cities. Performance evaluation systems compatible with the coordinated development in developing cities must be built by establishing ecological compensation mechanisms, which eventually help us to improve the urban coordinated development of economic, social and ecological subsystems in China.
Author Contributions
Writing—original draft, H.L.; Writing—review & editing, L.M. and H.L. All authors have read and agreed to the published version of the manuscript.
Acknowledgments
This research was funded by the National Natural Science Foundation of China grant number 41901141, the Shandong Natural Science Foundation grant number ZR2019PD015 and ZR2019PD009, the China Postdoctoral Science Foundation grant number 2018M642643 and 2019M652364. Moreover, this work was supported by the “Korea Foundation for Advanced Studies”/”Chey Institute for Advanced Studies” International Scholar Exchange Fellowship for the academic year of 2018-2019.
Conflicts of Interest
The authors declare no conflict of interest.
References
- Wei, W.; Wang, X.; Zhu, H.; Li, J.; Zhou, S.; Zou, Z.; Li, J. Carbon emissions of urban power grid in Jing-Jin-Ji region: Characteristics and influential factors. J. Clean. Prod. 2017, 168, 428–440. [Google Scholar] [CrossRef]
- Liu, Y.L.; Zhang, X.; Kong, X.; Wang, R.; Chen, L. Identifying the relationship between urban land expansion and human activities in the Yangtze River Economic Belt, China. Appl. Geogr. 2018, 94, 163–177. [Google Scholar] [CrossRef]
- Sun, Y.; Cui, Y. Evaluating the coordinated development of economic, social and environmental benefits of urban public transportation infrastructure: Case study of four Chinese autonomous municipalities. Transp. Policy 2018, 66, 116–126. [Google Scholar] [CrossRef]
- Wang, J.Y.; Wei, X.M.; Guo, Q. A three-dimensional evaluation model for regional carrying capacity of ecological environment to social economic development: Model development and a case study in China. Ecol. Indic. 2018, 89, 348–355. [Google Scholar] [CrossRef]
- Zong, W.W.; Cheng, L.; Xia, N.; Jiang, P.; Wei, X.; Zhang, F.; Jin, B.; Zhou, J.; Li, M. New technical framework for assessing the spatial pattern of land development in Yunnan Province, China: A “production-life-ecology” perspective. Habitat Int. 2018, 80, 28–40. [Google Scholar] [CrossRef]
- Cerreta, M.; Poli, G. Landscape Services Assessment: A Hybrid Multi-Criteria Spatial Decision Support System (MC-SDSS). Sustainability 2017, 9, 1311. [Google Scholar] [CrossRef] [Green Version]
- Perchinunno, P.; Rotondo, F.; Torre, C.M. The evidence of links between landscape and economy in a rural park. Int. J. Agric. Environ. Inf. Syst. 2012, 3, 72–85. [Google Scholar] [CrossRef] [Green Version]
- Liu, J.; Wang, S.W. Balancing Disassembly Line in Product Recovery to Promote the Coordinated Development of Economy and Environment. Sustainability 2017, 9, 309. [Google Scholar] [CrossRef] [Green Version]
- Lan, S.L.; Tseng, M.L. Coordinated Development of Metropolitan Logistics and Economy toward Sustainability. Comput. Econ. 2018, 52, 1113–1138. [Google Scholar] [CrossRef]
- Song, J.; Tang, B.; Zhang, J.; Dou, X.; Liu, Q.; Shen, W. System dynamics simulation for optimal stream flow regulations under consideration of coordinated development of ecology and socio-economy in the Weihe River Basin, China. Ecol. Eng. 2018, 124, 51–68. [Google Scholar] [CrossRef]
- Chen, J.; Yu, X.; Qiu, L.; Deng, M.; Dong, R. Study on Vulnerability and Coordination of Water-Energy-Food System in Northwest China. Sustainability 2018, 10, 3712. [Google Scholar] [CrossRef] [Green Version]
- Wu, M.R.; Zhao, M.; Wu, Z.D. The Coordination and Dynamic Relationship of the Industrial Energy Consumption, Economic Growth and SO2 Emission-Analysis of Time Series Data of China from 1990 to 2016. Environ. Process. Int. J. 2018, 5, 789–806. [Google Scholar]
- Estoque, R.C.; Murayama, Y. Social-ecological status index: A preliminary study of its structural composition and application. Ecol. Indic. 2014, 43, 183–194. [Google Scholar] [CrossRef]
- Hufnagl-Eichiner, S.; Wolf, S.A.; Drinkwater, L.E. Assessing social-ecological coupling: Agriculture and hypoxia in the Gulf of Mexico. Glob. Environ. Chang. Hum. Policy Dimens. 2011, 21, 530–539. [Google Scholar] [CrossRef]
- Dong, J.; Chi, Y.; Zou, D.; Fu, C.; Huang, Q.; Ni, M. Energy-environment-economy assessment of waste management systems from a life cycle perspective: Model development and case study. Appl. Energy 2014, 114, 400–408. [Google Scholar] [CrossRef]
- Oliveira, C.; Antunes, C.H. A multi-objective multi-sectoral economy-energy-environment model: Application to Portugal. Energy 2011, 36, 2856–2866. [Google Scholar] [CrossRef]
- Li, Y.; Li, Y.; Zhou, Y.; Shi, Y.; Zhu, X. Investigation of a coupling model of coordination between urbanization and the environment. J. Environ. Manag. 2012, 98, 127–133. [Google Scholar] [CrossRef]
- Srinivasan, V.; Seto, K.C.; Emerson, R.; Gorelick, S.M. The impact of urbanization on water vulnerability: A coupled human-environment system approach for Chennai, India. Glob. Environ. Chang. Hum. Policy Dimens. 2013, 23, 229–239. [Google Scholar] [CrossRef]
- Ma, T.; Chen, M.; Wang, C.; Mao, Z.; Jiang, M. Study on the environment-resource-economy comprehensive efficiency evaluation of the biohydrogen production technology. Int. J. Hydrogen Energy 2013, 38, 13062–13068. [Google Scholar] [CrossRef]
- Bastianoni, S.; Coscieme, L.; Pulselli, F.M. The input-state-output model and related indicators to investigate the relationships among environment, society and economy. Ecol. Model. 2016, 325, 84–88. [Google Scholar] [CrossRef]
- Zhang, H.M.; Zhu, Z.S.; Fan, Y.J. The impact of environmental regulation on the coordinated development of environment and economy in China. Nat. Hazards 2018, 91, 473–489. [Google Scholar] [CrossRef]
- Anghelache, C.; Anghel, M.G. Analysis Models and Methods of the Life Quality in Romania. Rom. Stat. Rev. 2018, 2, 59–86. [Google Scholar]
- Sun, P.; Song, W.; Xiu, C.; Liang, Z. Non-coordination in China’s Urbanization: Assessment and Affecting Factors. Chin. Geogr. Sci. 2013, 23, 729–739. [Google Scholar] [CrossRef] [Green Version]
- Yang, Q.; Ding, Y.; de Vries, B.; Han, Q.; Ma, H. Assessing Regional Sustainability Using a Model of Coordinated Development Index: A Case Study of Mainland China. Sustainability 2014, 6, 9282–9304. [Google Scholar] [CrossRef] [Green Version]
- Xie, M.X.; Wang, J.Y.; Chen, K. Coordinated Development Analysis of the “Resources-Environment-Ecology-Economy-Society” Complex System in China. Sustainability 2016, 8, 582. [Google Scholar] [CrossRef] [Green Version]
- Tian, Y.; Wang, L. Mutualism of intra- and inter-prefecture level cities and its effects on regional socio-economic development: A case study of Hubei Province, Central China. Sustain. Cities Soc. 2019, 44, 16–26. [Google Scholar] [CrossRef]
- Wang, Q.; Yuan, X.; Cheng, X.; Mu, R.; Zuo, J. Coordinated development of energy, economy and environment subsystems—A case study. Ecol. Indic. 2014, 46, 514–523. [Google Scholar] [CrossRef]
- Li, L.; Lei, Y.; Wu, S.; He, C.; Yan, D. Study on the coordinated development of economy, environment and resource in coal-based areas in Shanxi Province in China: Based on the multi-objective optimization model. Resour. Policy 2018, 55, 80–86. [Google Scholar] [CrossRef]
- Zhang, L.; Yang, J.; Li, D.; Liu, H.; Xie, Y.; Song, T.; Luo, S. Evaluation of the ecological civilization index of China based on the double benchmark progressive method. J. Clean. Prod. 2019, 222, 511–519. [Google Scholar] [CrossRef]
- Li, Y.; Wang, J.; Liu, Y.; Long, H. Problem regions and regional problems of socioeconomic development in China: A perspective from the coordinated development of industrialization, informatization, urbanization and agricultural modernization. J. Geogr. Sci. 2014, 24, 1115–1130. [Google Scholar] [CrossRef]
- Sun, Q.; Zhang, X.; Zhang, H.; Niu, H. Coordinated development of a coupled social economy and resource environment system: A case study in Henan Province, China. Environ. Dev. Sustain. 2018, 20, 1385–1404. [Google Scholar] [CrossRef]
- Sannicandro, V.; Torre, C.M. The use of GIS as a tool of analysis and representation of land use. Geomedia 2016, 20, 38–42. [Google Scholar]
- Park, J.; Lee, J. Spatial Pattern and Factor Analyses for Forest Sustainable Development Goals within South Korea’s Civilian Control Zone. Sustainability 2018, 10, 3500. [Google Scholar] [CrossRef] [Green Version]
- Colak, H.E.; Memisoglu, T.; Erbas, Y.S.; Bediroglu, S. Hot spot analysis based on network spatial weights to determine spatial statistics of traffic accidents in Rize, Turkey. Arab. J. Geosci. 2018, 11, 151. [Google Scholar] [CrossRef]
- Ansong, D.; Renwick, C.B.; Okumu, M.; Ansong, E.; Wabwire, C.J. Gendered geographical inequalities in junior high school enrollment: Do infrastructure, human, and financial resources matter? J. Econ. Stud. 2018, 45, 411–425. [Google Scholar] [CrossRef] [Green Version]
- Bunting, R.J.; Chang, O.Y.; Cowen, C.; Hankins, R.; Langston, S.; Warner, A.; Yang, X.; Louderback, E.R.; Sen Roy, S. Spatial Patterns of Larceny and Aggravated Assault in Miami-Dade County, 2007–2015. Prof. Geogr. 2018, 70, 34–46. [Google Scholar] [CrossRef]
- Bunch, R.L.; Murray, C.; Gao, X.; Hunt, E.D. Geographic Analysis of Domestic Violence Incident Locations and Neighborhood Level Influences. Int. J. Appl. Geospat. Res. 2018, 9, 14–32. [Google Scholar] [CrossRef] [Green Version]
- Zhu, C.; Zhao, D.; Qiu, Z.Y. Internal and External Effect of Estate Investment upon Regional Innovation in China. Emerg. Mark. Financ. Trade 2019, 55, 513–530. [Google Scholar] [CrossRef]
- Chen, W.; Shen, Y.; Wang, Y.; Wu, Q. The effect of industrial relocation on industrial land use efficiency in China: A spatial econometrics approach. J. Clean. Prod. 2018, 205, 525–535. [Google Scholar] [CrossRef]
Figure 1.
The rate of urbanization in China during 1950–2019.

Figure 2.
Administrative divisions in China.

Figure 3.
Probability distribution of hot spots (the positive values) and cold spots (the negative values) of urban subsystems: economy (a), society (b), environment (c).
Figure 3.
Probability distribution of hot spots (the positive values) and cold spots (the negative values) of urban subsystems: economy (a), society (b), environment (c).

Figure 4.
Spatial pattern and its hot spots of urban coordinated development values (Variable D) in 1995 (a), 2000 (b), 2005 (c), 2010 (d) and 2005 (e).
Figure 4.
Spatial pattern and its hot spots of urban coordinated development values (Variable D) in 1995 (a), 2000 (b), 2005 (c), 2010 (d) and 2005 (e).


Table 1.
The index system of urban coordinated development in China.
| Levels | ID | Indicators (Unit) | Unit | Weight |
|---|---|---|---|---|
| Economy C | A1 | secondary and tertiary industry GDP (100 million yuan) | + | 0.1441 |
| A2 | urban GDP growth rate (%) | + | 0.0296 | |
| A3 | per capita urban GDP (yuan) | + | 0.2228 | |
| A4 | per capita investment in fixed assets (yuan) | + | 0.1750 | |
| A5 | per capita general public budget revenue (yuan) | + | 0.2228 | |
| A6 | per capita retail sales of consumer goods (yuan) | + | 0.2057 | |
| Society H | B1 | per capita disposable income of urban households (yuan) | + | 0.1578 |
| B2 | per capita savings deposit (yuan) | + | 0.1750 | |
| B3 | per capita area of paved roads (sq.m) | + | 0.1798 | |
| B4 | per capita full-time teachers of secondary education (person) | + | 0.1800 | |
| B5 | collections of public libraries owned per person (copy) | + | 0.1531 | |
| B6 | per capita licensed (assistant) doctors (person) | + | 0.1543 | |
| Ecology T | C1 | population density of city districts (persons/sq.km) | − | 0.1744 |
| C2 | the green covered area as % of the completed area (%) | + | 0.2419 | |
| C3 | per capita area of parks and green land (sq.m) | + | 0.0769 | |
| C4 | per capita area of cultivated land (sq.m) | + | 0.0864 | |
| C5 | industrial wastewater discharged density of city districts (tons/sq.km) | − | 0.1785 | |
| C6 | area of green land (sq.m) | + | 0.2419 |
Table 2.
The summary description of the data.
| Levels | ID | Mean | Min | Max | Standard Deviation | Data Source |
|---|---|---|---|---|---|---|
| Economy C | A1 | 774.21 | 1.00 | 21,472.90 | 1625.94 | CC |
| A2 | 12.11 | −20.00 | 20.00 | 4.90 | CC | |
| A3 | 20,531.62 | 109.00 | 196,728.00 | 22,904.53 | RE | |
| A4 | 13,118.01 | 17.86 | 148,463.83 | 16,677.71 | CC | |
| A5 | 1506.54 | 6.61 | 21,804.54 | 2279.35 | CC | |
| A6 | 6647.04 | 79.70 | 53,243.96 | 7333.88 | RE | |
| Society H | B1 | 11,967.89 | 694.65 | 16,4741.00 | 9297.93 | RE |
| B2 | 12,554.95 | 8.05 | 175,402.65 | 15,268.14 | CC | |
| B3 | 9.84 | 0.00 | 54.55 | 7.14 | CC | |
| B4 | 34.59 | 0.48 | 199.64 | 13.26 | CC | |
| B5 | 0.35 | 0.01 | 4.45 | 0.38 | CC | |
| B6 | 32.18 | 1.35 | 228.44 | 15.69 | CC | |
| Ecology T | C1 | 0.04 | 0.00 | 0.53 | 0.05 | CC |
| C2 | 30.28 | 0.13 | 66.10 | 12.05 | CC | |
| C3 | 9.70 | 0.04 | 149.14 | 15.09 | CC | |
| C4 | 933.14 | 3.86 | 15,705.10 | 973.11 | CC | |
| C5 | 0.75 | 0.00 | 18.31 | 1.40 | RE | |
| C6 | 30.28 | 0.13 | 66.10 | 12.05 | CC |
Table 3.
Means, standard deviations and frequencies of urban coordinated development in China.
| Region | Variables | 1995 | 2000 | 2005 | 2010 | 2015 | Total |
|---|---|---|---|---|---|---|---|
| Northeastern | mean | 1.4969 | 1.5389 | 1.6667 | 1.9444 | 2.0958 | 1.7486 |
| standard deviation | 0.0965 | 0.1220 | 0.1453 | 0.1822 | 0.2133 | 0.2813 | |
| frequency | 36 | 36 | 36 | 36 | 36 | 36 | |
| Eastern | mean | 1.4657 | 1.5741 | 1.7744 | 2.0528 | 2.2222 | 1.8178 |
| standard deviation | 0.1385 | 0.1753 | 0.2112 | 0.1876 | 0.2118 | 0.3399 | |
| frequency | 87 | 87 | 87 | 87 | 87 | 87 | |
| Central | mean | 1.3672 | 1.4451 | 1.6117 | 1.8883 | 2.0390 | 1.6703 |
| standard deviation | 0.1332 | 0.1027 | 0.1198 | 0.1424 | 0.1595 | 0.2891 | |
| frequency | 82 | 82 | 82 | 82 | 82 | 82 | |
| Western | mean | 1.3109 | 1.3860 | 1.5526 | 1.7999 | 1.9556 | 1.6010 |
| standard deviation | 0.1739 | 0.1636 | 0.1835 | 0.2264 | 0.2493 | 0.3167 | |
| frequency | 131 | 131 | 131 | 131 | 131 | 131 | |
| Entire study area | mean | 1.3847 | 1.4655 | 1.6367 | 1.9024 | 2.0600 | 1.6899 |
| standard deviation | 0.1649 | 0.1691 | 0.1953 | 0.2180 | 0.2406 | 0.3248 | |
| frequency | 336 | 336 | 336 | 336 | 336 | 336 |
Frequency is the number of cities.
Table 4.
The F test of regions and years in China.
| Region | Eastern | Central | Western | Year | 1995 | 2000 | 2005 | 2010 |
|---|---|---|---|---|---|---|---|---|
| Central | 143.13 *** | 2000 | 34.18 *** | |||||
| Western | 382.70 *** | 37.67 *** | 2005 | 332.20 *** | 153.26 *** | |||
| Northeastern | 19.03 *** | 23.87 *** | 95.72 *** | 2010 | 1402.46 *** | 998.74 *** | 369.53 *** | |
| 2015 | 2386.09 *** | 1849.09 *** | 937.66 *** | 129.92 *** |
*** p < 0.01.
Table 5.
Time fixed effects of urban coordinated development in China.
| z | China | Eastern | Central | Western | Northeastern |
|---|---|---|---|---|---|
| 2000 | 0.0798 *** | 0.1131 *** | 0.0769 *** | 0.0734 *** | 0.0370 *** |
| (0.0046) | (0.0080) | (0.0087) | (0.0071) | (0.0083) | |
| 2005 | 0.2370 *** | 0.2872 *** | 0.2324 *** | 0.2268 *** | 0.1483 *** |
| (0.0069) | (0.1296) | (0.0123) | (0.0110) | (0.0134) | |
| 2010 | 0.4754 *** | 0.5386 *** | 0.4866 *** | 0.4438 *** | 0.3779 *** |
| (0.0094) | (0.0146) | (0.0163) | (0.0186) | (0.0200) | |
| 2015 | 0.6120 *** | 0.6641 *** | 0.6236 *** | 0.5709 *** | 0.4939 *** |
| (0.1127) | (0.0189) | (0.0193) | (0.0219) | (0.0257) | |
| _cons | 1.4942 *** | 1.8280 *** | 1.4046 *** | 1.3423 *** | 1.6526 *** |
| (0.0457) | (0.5885) | (0.0467) | (0.0199) | (0.1668) | |
| controlled variables | Yes | Yes | Yes | Yes | Yes |
| σu | 0.1837 | 0.2356 | 0.0997 | 0.1649 | 0.1661 |
| σe | 0.0788 | 0.0698 | 0.0634 | 0.0876 | 0.0523 |
| ρ | 0.8446 | 0.9192 | 07121 | 0.7798 | 0.9099 |
| R2 | 0.6347 | 0.5543 | 0.8451 | 0.6709 | 0.6441 |
| N | 1680 | 435 | 410 | 655 | 180 |
| F-test | 12.22 | 6.10 | 7.46 | 2.05 | 7.46 |
| ρ | 0.00 | 0.00 | 0.00 | 0.09 | 0.00 |
*** p < 0.01. Robust standard errors are inside parentheses.
Table 6.
Moran’s I and Getis-ord’s G of urban coordinated development in China.
| Year | 1995 | 2000 | 2005 | 2010 | 2015 |
|---|---|---|---|---|---|
| Moran’s index | 0.2701 *** | 0.2770 *** | 0.3025 *** | 0.3528 *** | 0.3319 *** |
| z-score | 14.6962 | 15.1004 | 16.4749 | 19.1527 | 18.0391 |
| Observed general G | 0.0030 *** | 0.0030 *** | 0.0030 *** | 0.0030 *** | 0.0030 *** |
| z-score | 3.5284 | 3.2042 | 4.8101 | 4.6671 | 4.6285 |
*** p < 0.01.
Table 7.
Spatial statistical results of urban coordinated development in China.
| SDM | SAR | SAC | ||
|---|---|---|---|---|
| Main | lnpeop | −0.1780 *** | −0.1658 *** | −0.1759 *** |
| (0.0329) | (0.0337) | (0.0331) | ||
| lngdp | 0.0908 *** | 0.0533 *** | 0.0845 *** | |
| (0.0192) | (0.0161) | (0.0189) | ||
| lnsoci | 0.0456 ** | 0.0114 ** | 0.0486 ** | |
| (0.0201) | (0.0161) | (0.0195) | ||
| lnlvdi | 0.0395 *** | 0.0431 *** | 0.0410 *** | |
| (0.0070) | (0.0069) | (0.0069) | ||
| wx | lnpeop | 0.5411 *** | ||
| (0.1662) | ||||
| lngdp | −0.2717 *** | |||
| (0.0892) | ||||
| lnsoci | 0.0473 | |||
| (0.0703) | ||||
| lnlvdi | 0.0935 *** | |||
| (0.0523) | ||||
| Spatial | ρ | 0.9656 *** | 0.7002 *** | 0.8382 *** |
| (0.0047) | (0.0502) | (0.0393) | ||
| N | 336 | 336 | 336 | |
| T | 5 | 5 | 5 | |
| R2 | 0.5338 | 0.7536 | 0.7381 |
*** p < 0.01, ** p < 0.05. Robust standard errors are inside parentheses.
© 2020 by the authors. Licensee MDPI, Basel, Switzerland. This article is an open access article distributed under the terms and conditions of the Creative Commons Attribution (CC BY) license (http://creativecommons.org/licenses/by/4.0/).
Share and Cite
MDPI and ACS Style
Liu, H.; Ma, L. Spatial Pattern and Effects of Urban Coordinated Development in China’s Urbanization. Sustainability 2020, 12, 2389. https://0-doi-org.brum.beds.ac.uk/10.3390/su12062389
AMA Style
Liu H, Ma L. Spatial Pattern and Effects of Urban Coordinated Development in China’s Urbanization. Sustainability. 2020; 12(6):2389. https://0-doi-org.brum.beds.ac.uk/10.3390/su12062389
Chicago/Turabian StyleLiu, Hao, and Lin Ma. 2020. "Spatial Pattern and Effects of Urban Coordinated Development in China’s Urbanization" Sustainability 12, no. 6: 2389. https://0-doi-org.brum.beds.ac.uk/10.3390/su12062389
Note that from the first issue of 2016, this journal uses article numbers instead of page numbers. See further details here.