Socioeconomic Indicators to Monitor Norway’s Bioeconomy in Transition


NIFU (Nordic Institute for Studies in Innovation, Research and Education), Postboks 2815 Tøyen, NO-0608 Oslo, Norway
*
Author to whom correspondence should be addressed.
Sustainability 2020, 12(8), 3173; https://0-doi-org.brum.beds.ac.uk/10.3390/su12083173
Submission received: 14 March 2020
/
Revised: 8 April 2020
/
Accepted: 9 April 2020
/
Published: 15 April 2020
(This article belongs to the Section Economic and Business Aspects of Sustainability)
Abstract
:Bioeconomy is a concept increasingly used to circumscribe that part of the economy which depends on the utilisation of biomass. Recent empirical analyses of the European Union bioeconomies have adopted a definition of bioeconomy which also encompasses activities in “hybrid” sectors; inputs for these sectors include not only biomass, but also a relevant share of other materials. We use the same definition to assess the features and evolution of the bioeconomy in Norway. The Norwegian bioeconomy is complex, both in terms of sectoral composition and of technological development. Our analysis builds upon national statistics on value added and employment as well as on expert interviews, aimed at detecting Norway’s peculiarities in terms of biomass utilisation. We find that the Norwegian bioeconomy has strongly increased its productivity in recent years. An astonishingly high peak in productivity is registered for fishing and aquaculture, whose value added has evolved massively; at the same time, pharmaceuticals are experiencing a dramatic shift toward bio-based production. General trends in the country’s bioeconomy have thus emerged from different transformation pathways across sectors. Our empirical analysis leads to formulating a general reflection about the definition of bioeconomy and its implications for socioeconomic quantitative studies.
1. Introduction
The environmental challenges connected to Climate Change, depletion of natural resources, environmental degradation, freshwater scarcity and decreasing biodiversity have made it a necessity to look for new ways of production and consumption [1]. For instance, the cycles of production should change in order to reach a new equilibrium between CO2 produced and CO2 stored, which is compatible with a stable temperature in the world. A sustainable cycle can be reached through a higher utilisation of organic materials which derive from “recently” living beings (“biomass”), so that the cycle of the production for human utilisation is consistent with a lifecycle where photosynthesis prevents the level of CO2 in the air from increasing. The connection between the sustainability goals and the evolving bioeconomy have been studied widely recently (e.g., see [2,3,4]). How the bioeconomy is defined has a great impact on how the development of the bioeconomy is understood, what kind of visions or pathways are sketched out and what kind of strategies national governments, industries and international bodies define. The orientation of those visions and strategies are strongly influenced by the dominating specialisation of the respective country or industry. Therefore, there are many often divergent and conflicting visions [5,6].
Many countries and international bodies have developed strategies for the development of the bioeconomy over the last decade and these strategies have been widely studied, see, for instance, the comparative study of 41 national strategies by Dietz et al. [2] and the study of the Norwegian bioeconomy strategy by Scordato et al. [7]. In the Norwegian strategy, the government highlighted the need for a green shift in the Norwegian economy based on sustainable use of renewable biological resources (The Norwegian Government, 2016). Instrumental are new scientific knowledge, technology, innovation and investments in bio-based industries. Eriksson et al. [8] point out that “the Government wants to increase agricultural food production, through rationalisation and increased research and development on the genetic potential in plants and animals, and through improved breeding” ([8], p. 230).
Dietz et al. [2] distinguish between four transformation paths for the bioeconomy: (1) Replacement of fossil fuels with biological materials; (2) increased productivity in the primary sectors; (3) increased efficiency in the use of biomass; and (4) “value creation and addition through the application of biological principles and processes separate from large-scale biomass production” ([2], p. 2). Especially the fourth path can create high economic value without needing large amounts of biomass and requiring knowledge input. In the analysis of the national bioeconomy strategies Dietz et al. [2] reveal that most of the highly industrialised countries, and some emerging economies such as China, South Africa and India, follow all four paths but that most of the developing countries and countries in Eastern Europe have either no bioeconomy strategy at all or they concentrate just on the first two paths, while some countries such as Argentina, Mexico, New Zealand and Russia follow the first three paths ([2], p. 9, Figure 2).
The bioeconomy has been in focus not just for national governments but also for international organisations, such as the OECD and the European Commission (European Commission, 2018). Their strategies have evolved and changed over the last decade; see, for the OECD, the shifting focus on biotechnology in the 2009 strategy [9] towards a strategy encompassing many economic sectors and related policies: Agriculture and forestry, fisheries, food, trade, waste management and industry [10].
The European Commission had first directed its attention to the knowledge-based bioeconomy, which was defined as “life sciences and biotechnology knowledge converging with other technologies to transform into new, sustainable, eco-efficient and competitive products” ([11], p. 13). This focus has been criticised for reducing sustainability to efficiency and ignoring important features of the evolving bioeconomy (see, for instance, [6]). In the updated strategy issued in 2018, the European Commission connected the development of a sustainable bioeconomy to the sustainable development goals of the United Nations [1] and the Paris Agreement on Climate Change. According to the updated bioeconomy strategy of the European Commission the “bioeconomy covers all sectors and systems that rely on biological resources (animals, plants, micro-organisms and derived biomass, including organic waste), their functions and principles. It includes and interlinks: Land and marine ecosystems and the services they provide; all primary production sectors that use and produce biological resources (agriculture, forestry, fisheries and aquaculture); and all economic and industrial sectors that use biological resources and processes to produce food, feed, bio-based products, energy and services” [12]. This much broader concept of the bioeconomy refers to the set of economic activities connected to the production and usage of renewable biological resources and processes to create economic products such as food, feed, energy, materials and chemicals. The bioeconomy is thought to be the basis for global nutrition, for the access to renewable energy and for access to basic resources in a plenitude of economic sectors and applications.
The traditional “bioeconomy”, meant as the economic system connected to the valorisation of biomass, has long existed in Norway. However, the view of the bioeconomy as a unique entity, with an attached value arising from the current climate challenges, is a novel concept, bringing new challenges with it. The traditional logical discontinuities between agriculture, forestry and fishery, which were grounded in different production systems, have become less marked during the current search for environmentally sustainable economic cycles. New challenges arise because an increased activity in the bioeconomy can occur easily only if new paths to value creation can be identified, providing also at the private level incentives to an activity that is collectively desirable.
By value creation, we refer to the value of the primary resources plus the value that is added to the primary resources along the value chain, by working on the resources and transforming them into something more useful and/or less easily available. The “value added”, for each stage of transformation of the bioresource, can thus be measured in monetary terms, as the difference between the amount of money paid for the biogood after and before the transformation. Notice that such amount crucially depends on the transformation chosen: A type of transformation that is more difficult to achieve and which provides a more useful transformed good will correspond to a higher value added. Therefore, a higher knowledge of the final markets and a higher technological ingenuity in the transformation process would be necessary to maximise such value added. Moreover, a proper consideration of sidestreams and residues, allowing a valorisation of what would otherwise go wasted, will provide, in the aggregate, a higher value added in the “bioeconomy”. That is why recycling processes, economies of scope and cascading use of bioresources become key elements for a maximisation of the value added in the bioeconomy. When put in a comparative perspective, the increasing use of such processes would allow to provide the right incentives for a restructuring of the whole economy, which in turn allows to achieve the desired environmental goals. However, to properly observe how the restructuring is taking place, it is necessary to develop a clear idea of the “structure” of the bioeconomy, intended as its composition in terms of economic sectors. The value added in the bioeconomy should then be conceptualised, and operationalised, as the sum of several components, each one related to a particular economic sector, having its own peculiarities in terms of technology and markets.
Nordic countries exhibit specific features which can become particular advantages in enabling and supporting the bioeconomy. Apart from the availability of biological resources, also the high level of technological development, and of related competencies, can constitute important assets for the bioeconomy, as shown by Rönnlund et al. [13]. The same study also highlights the potential of cross-cutting initiatives across companies, industries, sciences and resource flows. This view seems confirmed also by Skjermo et al. [14], who envision a specific bioeconomic path for Norway opened by the cultivation of seaweed (macroalgae), an activity of the “blue” bioeconomy which could benefit from agricultural knowledge. Even a few varieties of seaweed, for instance, sugar kelp, could develop into a broad range of products, whose profitability would also depend on the development of innovative preservation techniques. Long-term research would, however, be essential to follow this path [14]. This perspective has been confirmed by Stevant et al. [15] more recently. They point out that commercial outputs from Norwegian cultivated seaweeds are still limited and the Norwegian regulations regarding seaweed cultivation are not yet fully developed ([15], p. 1385). Beside the cultivation of seaweed, there are also activities going on for the fully automated production of microalgae [16]; such activity would also allow the exploitation of biogas and carbon dioxide from agricultural and other organic residues, and the production of protein sources for aquaculture, feed for husbandry, food and health products.
However, a transdisciplinary collaboration and interaction between researchers and companies will be necessary to achieve a more sustainable bioeconomy [17]. Moreover, long-term commitments in regional policies, as highlighted by the Nordic case studies in Teräs et al. [18], will also be essential to develop regional bioeconomies. A complete market development for innovative products can indeed be reached through a gradual innovation process, leading from pilots to a full scale-up. Teräs et al. [18] also point out the need for rural regions to share experiences in order to reduce the risk of innovative bioeconomic policies and investments. Hansen and Bjorkhaug [19] notice a related phenomenon: In Norway, the forestry sector seems to have an easier interaction with manufacturing sectors than with the public sector, due partly to a typical private ownership of forests, but also to the relatively high presence of manufacturing in the outskirts of cities, as opposed to a more urban public sector. Geographic proximity could work, in this case, in favour of a dialogue between different sectors. Creating shared expectations across sectors seems, according to the same study, an important obstacle to overcome in Norway for developing further the bioeconomy. Agriculture, on the one hand, and fishing and aquaculture, on the other hand, often correspond to differences in expectations and visions, thus creating a divide between the “green” and the “blue” economy. We argue that joint analyses of all bioeconomic sectors within a country, based on a common methodology, can lead to a common vision of the country’s bioeconomy. Indeed, a common understanding of the present, and of the recent past, is propaedeutic to a common vision of the future. In turn, the current trends of a country’s bioeconomy can be reconducted to the current dynamics in each of its bioeconomic sectors, only by adopting the same methodological and theoretical framework throughout the whole analysis.
Our study of the Norwegian bioeconomy bases upon recent analyses of the European Union, stemming from analogous motivations. The European Union has indeed recently been covered by quantitative analyses of the bioeconomy [20], and results about the EU bioeconomy’s value added have specifically been summarised by Ronzon and M’Barek [21]. Their analysis is sector-based, in the sense that it builds upon statistics which follow industry NACE codes; a difficulty that the authors had to face and overcome, in their analysis, was indeed the association of NACE codes to the bioeconomy. However, a sector-based analysis allows an easier understanding of how the bioeconomy interacts with a nation’s economic structure, and of how its value results from the economic contribution of organisational and geographical units that are sectorally defined. Additionally, the study by Ronzon and M’Barek [21] investigates diversities in bioeconomic value creation across European countries, and is able to point at an untapped potential for bioeconomic value creation in Central and Eastern Europe.
Norway is not present among the countries studied by Ronzon and M’Barek [21]. Our study provides a novel analysis of the processes of value creation in Norway, in order to assess the current situation and the ongoing evolution of the Norwegian bioeconomy. A comparison with the European countries allows us to define the Norwegian bioeconomy within a broader international context, as well as to assess whether changes in the Norwegian bioeconomy mirror changes occurring at European scale. Our empirical analysis leads to formulating a general reflection about the definition of bioeconomy and its implications for socioeconomic quantitative studies.
2. Materials and Methods
2.1. Method
Our specific analysis of Norway is based methodologically on what has been done by Ronzon et al. [20] and Ronzon and M’Barek [21] about the European Union case; it also builds upon previous socio-technical analyses of the Norwegian bioeconomic potential [22] to deepen previous quantitative overviews of the Norwegian bioeconomic context [23,24].
The first goal is understanding how much value added can be found in the Norwegian bioeconomy, according to the sectors that pertain to the bioeconomy. If we follow a NACE classification of sectors, thus adopting a traditional categorisation of economic sectors, the main issue is understanding which NACE sectors can be defined as bioeconomic and which ones are not. A good starting point is referring to the sectors that most easily can be associated to the bioeconomy. Those sectors are, following Ronzon and M’Barek [21]: A01, A02, A03; C10, C11, C12, C15, C16, C17. They can be summarised as: The bioeconomic primary sectors (agriculture, forestry, aquaculture and fishing) plus the types of manufacturing that almost exclusively use biomaterials as main inputs (food, beverages, tobacco, leather, wood products excl. furniture, paper). Notice they are all classified at 2-digit NACE coding.
This is possible to retrieve with an almost perfect correspondence. Indeed, Statistics Norway (the national Norwegian statistical office) provides figures for value added, at country level for whole Norway, using a high disaggregation of industries. This means that it is possible to retrieve figures, for value added, about: Crop and animal production, hunting and related service activities; forestry and logging; manufacture of food products, beverages and tobacco products; manufacture of wood and wood products, except furniture; manufacture of paper and paper products. Notice that this covers all the “pure” bioeconomic sectors, with the exception of leather, which is mixed with other textile types of manufacturing and therefore is not accounted on its own. Notice also that these are the same sectors which NHO Mat og Drikke (a section of the main Norwegian industry association) has considered in the report “Mot Bioøkonomien” [22] when showing the total employment and production value of the bioeconomy in Norway (see footnote 2 on page 7 of [22]).
However, a more comprehensive view of the Norwegian bioeconomy should also consider what Ronzon and M’Barek [21] call “hybrid” sectors: C13 (textiles), C14 (clothes), C31 (furniture), C20 (chemicals), C21 (pharmaceuticals), C22 (plastics and rubber), C2014 (other organic basic chemicals), C2059 (other chemical products), D3511 (electricity). For these sectors, only a part of the production can be considered as “bio-based”. For each of these sectors, Ronzon and M’Barek [21] estimate a bio-based percentage which varies across EU countries. Following a methodology first outlined by Ronzon et al. [20], the authors first compile a product-level assessment of bio-based percentage (this is made through expert interviews and it is uniform across countries), and then, by checking the relative shares of products within the production of each sector in each country (possible mainly through the ProdCom statistics compiled by Eurostat), are able to reach an assessment of bio-based percentage which varies both across sectors and across countries (for the bio-electricity case, a different procedure is adopted based on energy balances shown by Eurostat). For instance, they can say to which extent the textile sector is “bio-based” in Denmark; such “bio-based share” is then used to assess how much of the value added of the whole textile sector in Denmark should be ascribed to the Danish bioeconomy value added. Notice that, through the database published by Ronzon and M’Barek [21] (retrievable at https://datam.jrc.ec.europa.eu/datam/perm/od/7d7d5481-2d02-4b36-8e79-697b04fa4278/download/dataset.zip), it is possible to obtain the “bio-based share” for each “hybrid” sector of each EU country, but not the product-level expert assessment which, combined with the figures of ProdCom for the Norwegian sectors, would allow to infer a specific “bio-based” share of the Norwegian “hybrid” sectors. Therefore, as a general rule, we will use interviews with Norwegian experts (see Section 2.3) to define possible differences between the “bio-based” shares of Norwegian “hybrid” sectors and the average of the “bio-based” share of the same “hybrid” sector across the three EU Nordic countries (Denmark, Sweden and Finland), as based on Ronzon and M’Barek [21] estimates. For one of the “hybrid” sectors, production of electricity, we will define the Norwegian “bio-share” looking at the energy mix overview (“varedeklarasjon”) from the Norwegian energy directorate (Noregs vassdrags-og energidirektorat, NVE).
2.2. Data
The data on value added for agriculture, forestry, fishing and aquaculture are taken from the dataset “09170: Production account and income generation, by industry 1970–2018” of Statistics Norway (“Value added at basic prices. Current prices (NOK million)”; update from 29 August 2019, downloaded on 16 September 2019).
The data on value added, and on employees, of all manufacturing sectors are taken from the dataset “08596: Principal figures for establishments in manufacturing, by industry (SIC2007) 2007–2017” compiled by Statistics Norway (respectively, “Value added (factor) (NOK million)” and “Persons employed (persons)”; update from 15 April 2019, downloaded on 02 July 2019). In particular, the values for sectors with NACE codes 10, 11 and 12 have been retrieved already as a unique group, without need for further aggregation (since they correspond to manufacture of food, beverages and tobacco, which are considered completely as bio-products); the values for sectors with NACE codes 16 and 17 have been retrieved directly at the 2-digit level, without need for aggregation; the values for sectors with NACE codes 13, 14, 15, 20, 21, 22 and 31 have been retrieved at 3-digit level and then aggregated at 2-digit level (since the higher aggregation level already available mixes together sectors having different bioshares); the values for sectors with NACE codes 2014 and 2059 have been retrieved at 4-digit level and then aggregated at 2-digit level (since they are analysed separately).
The data on employees for agriculture are taken from the Labour Force Survey dataset “lfsa_egan22d: Employment by sex, age and detailed economic activity (from 2008 onwards, NACE Rev. 2 two-digit level)” compiled by Eurostat (update from 08.08.2019, downloaded on 22 Ausgust 2019). The data on employees for forestry are taken from the Labour Force Survey dataset “for_emp_lfs: Em-ployment in forestry and forest-based industry” compiled by Eurostat (update from 08 Ausgust 2019, downloaded on 22 Ausgust 2019). The data on employees for fishing are taken from the dataset “07811: Fishermen, by fishing as source of livelihood (C) 1945–2017” compiled by Statistics Norway (update from 08 November 2018, downloaded on 22 Ausgust 2019). The data on employees for aquaculture are taken from the dataset “03214: Fish farming of salmon, rainbow trout and other marine species. Number of workers and labour input, by type of production (C) 1986–2018” compiled by Statistics Norway (update from 20.06.2019, downloaded on 22 Ausgust 2019). The data on value added and employees for sector 3511 (Production of Electricity) are taken from the dataset “sbs_na_ind_r2: Annual detailed enterprise statistics for industry (NACE Rev. 2, B-E)” compiled by Eurostat (update from 19 Ausgust 2019, downloaded on 22 Ausgust 2019).
The data on value added for all sectors of Norway, grouped together, are taken from the dataset “NY.GDP.FCST.CN: Gross value added at basic prices (GVA) (current LCU)” compiled by the World Bank (update from 24 April 2019, downloaded on 25 June 2019).
The data on employees for all sectors of Norway, grouped together, are taken from the Labour Force Survey dataset “lfsa_egan22d: Employment by sex, age and detailed economic activity (from 2008 onwards, NACE Rev. 2 two-digit level)” compiled by Eurostat (update from 28 Ausgust 2019, downloaded on 04 September 2019).
The conversion of value added from the Norwegian currency to Euros (used for comparisons between Norway and European Union countries) has been performed using conversion rates from the European Central Bank (downloaded on 04 September 2019; for each year, conversion rates from 1 July have been considered).
2.3. Interviews
The design of the analysis required an assessment of the bio-share of the different hybrid sectors by experts. The experts belong to the following manufacturing sectors (in brackets: The organisation for which the experts currently work):
- C13: Manufacture of textiles (Teko Bransjeforening)
- C14: Manufacture of wearing apparel industry (Teko Bransjeforening)
- C20: Manufacture of chemicals and chemical products (Norsk Industri, Borregaard and Norner)
- C21: Manufacture of basic pharmaceutical products and pharmaceutical preparations (LMI Legemiddelindustrien)
- C22: Manufacture of rubber and plastic products (Norner and Norsk Komposittforbund)
- C31: Manufacture of furniture (Designindustrien)
We identified at least one expert in each of the industries and organised interviews with at least one of those experts, either as face-to-face interviews or as telephone or Skype-based interviews, lasting between 30 min and one hour. For each of the interviews, the choice of the expert to interview depended on both her experience and competence in the sector. In some cases, experience and competence were judged sufficient by us on the basis of collaboration on past related projects. For all the other cases (the majority), we described our research goals to the official reference person for the sector under analyis, in the main industry organisation of Norway, who then suggested us the expert to contact, within the same organisation. All interviews were recorded and transcribed; for anonymity purposes, no names of the interviewees will be mentioned, but only their affiliation. For the interviews we created an interview guide which the interviewees received in advance to be able to be prepared for our questions (the interview guide is shown in the Appendix B).
In the interviews we asked the interviewees to give an assessment of the bio-share for their respective sector, based on value added or turnover. We asked also if the experts could distinguish between different product groups and if they had observed changes in the bio-share over the last 10 years. We asked them also to tell us how well they know the sector and how precise can their assessment be. To support this information gathering process, we had computed the development of the bio-shares for the respective sectors in each of the neighbouring Nordic countries, Denmark, Finland and Sweden and calculated also the average for those three Nordic countries, all based on the existing EU-study by Ronzon and M’Barek (2018). Then the experts could discuss the differences and/or similarities with those countries. We finalised the interviews by asking if they could see some differences with regard to the regional specialisation, within Norway, in the sector of interest.
The information regarding following three sub-sectors were collected by a combination of interviews with the firms Norsk Industri, Borregaard and Norner, as well as on open available statistics:
- C20.14: Production of other organic raw materials
- C20.59: Production of chemical products not mentioned elsewhere
- D35.11: Production of electricity.
In the following we summarise the main information from the interviews with regard to the bio-share in the respective sector, a discussion of the differences compared to the other Nordic countries, eventual trends–both in the past and in the future, some problems related to the assessment of the bio-share, and we highlight main product groups and regional specialisation, including names of larger companies and their location (if mentioned by the interviewees).
3. Results
3.1. Information from the Interviews
3.1.1. Manufacture of Textiles (NACE: C13)
The interviewee concluded that the bio-share is ca. 15% for Norway and that the share has been rather constant over the last 10 years. There is very little production of textiles in Norway. There was much more after WW2 but in the seventies and eighties those textile plants mostly closed. Today the production is mainly restricted to knitting yarn from wool, to polyester-based fishing nets, and textile elements in oil spill containment booms.
There are three main companies producing woollen knitting yarn: Sandnes Ullvare in Rogaland, Hillesvåg outside Bergen, and Rauma Ullvare in the Åndalsnes area. Gudbrandsdal Ullvare in Lillehammer is the only vertically integrated manufacturer of upholstery fabrics in Scandinavia and is producing woollen textiles for furniture, hotels, restaurants and cruise ships, and national costume fabrics. An increasing share of the wool comes from Norwegian sheep, collected and sorted by Nortura’s subsidiary Norilia.
It was pointed out that most of bed clothing sold by Norwegian brands is actually not produced, but only designed, in Norway. An example for this is Mascot Høie at Brekklandet. There is just a small bed clothing company in Mysen, called Nordicform, which is importing down fillings and cotton to sew them together in Norway.
The interviewee assessed that the main textile producers in the three Nordic countries Denmark, Finland and Sweden use mainly synthetic raw materials rather than biological resources. In particular, it can be said that the other Nordic countries do not produce as much woollen textiles as Norway.
In Sweden there exist some production of technical textiles, for the automotive industry and for pulp and paper machinery, based on synthetic fibres. The production of wood-based viscose has been previously developed, but today Domsjö Fabriker only produce the cellulosic material to export it to customers in Asia, who produce viscose out of it.
In 2018, in Finland the development of a new wooden fibre has been started by the fibre technology company Spinnova company. This will probably contribute to increase the share of Finland’s bio-share in the textile industry, in the years to come.
3.1.2. Manufacture of Wearing Apparel Industry (NACE: C14)
The bio-share in the wearing apparel industry (C14) is higher than for the textile industry (C13) and was assessed to be ca. 40%, with a rather constant share over the last 10 years.
There is no production of wearing apparel based on synthetics in Norway, with the exception of survival suits for fishing and offshore industries. They are 100% synthetic.
The production of sportswear, outdoor equipment and other technical clothes is almost totally outsourced to countries like China, Vietnam, Cambodia and Portugal. Those clothes are more or less synthetic, with the exception of merino wool for underwear. However, the design is Norwegian and is presented by brands like Norrøna in Asker, Bergans located in Hokksund or Helly Hansen, an originally fully Norwegian company which has developed into an international company headquartered in Oslo.
The main domestic industry for wearing apparel is concentrated in the production of woollen underwear, knitted sweaters and woollen national costumes. Such products have a large domestic market in Norway, but not in the other Nordic countries where the corresponding production is much lower.
While most of the Norwegian wearing apparel production has been moved abroad, there is still some capacity in Norway, mainly in relation to wool-made clothes. Their producers are concentrated in the region around Bergen, like Oleana in Ytre Arna, Janus, Hillesvåg ullvarefabrikk, Dale of Norway in Vaksdal, and Rauma ullvare in Møre og Romsdal.
3.1.3. Manufacture of Chemicals and Chemical Products (NACE: C20)
The bio-share in the chemical industry was assessed to be about 10%. This share has been rather constant over the last 10 years. The sector is rather small compared to Finland and Sweden. We downloaded from Amadeus a list of the most important companies in Norway in terms of turnover and got this commented by one of the interviewees with regard to the use of renewable biological resources.
The Norwegian chemical industry is concentrated in one sub-sector: 20.1 “Manufacture of basic chemicals, fertilisers and nitrogen compounds, plastics and synthetic rubber in primary forms”. In addition, there come some activities in 20.3 “Manufacture of paints, varnishes and similar coatings, printing ink and mastics”, 20.4 “Manufacture of soap and detergents, cleaning and polishing preparations, perfumes and toilet preparations” and 20.5 “Manufacture of other chemical products”.
In the sub-sector 20.11 “Manufacture of industrial gases” we find very few companies, specialised in the production of industrial gases and mainly based on fossil resources. The international group AGA AS, with its Norwegian branch located in Oslo, should be mentioned here.
Sub-sector 20.13 “Manufacture of other inorganic basic chemicals” is rather strong in Norway. There are several companies specialised in the production of inorganic basic chemicals, where renewable organic resources such as charcoal are used only to some minor degree as a reduction agent, as for the case of for Elkem AS, with headquarter in Oslo and production in several places including Kristiansand.
Sub-sector 20.14 is accounted for separately and the same applies for 20.59.
Manufacture of fertilisers and nitrogen (20.15) compounds is rather strong in Norway and not based on renewable organic resources. The main company is here Yara with headquarter in Oslo.
In sub-sector 20.16 “Manufacture of plastics in primary forms” there are mainly companies, in Norway, specialised in manufacturing polymers, especially producing PVC, PE and polystyrene, and they use only fossil resources. However, this can change in the future because there is an increasing demand for bio-based packaging materials.
Subsector 20.30 “Manufacture of paints, varnishes and similar coatings, printing ink and mastics” is using some plant-based oils such as tall oil in the production of paints. The most important company is Jotun in Sandefjord.
Sub-sector 20.41 “Manufacture of soap and detergents, cleaning and polishing preparations” exploits some plant-based oils. The biggest company in Norway is Lilleborg AS in Oslo.
When comparing this sector with the three other Nordic countries, it can be said that the chemical industry in Finland and in Sweden are larger than in Norway, but Denmark’s chemical industry is probably smaller. The bio-shares previously estimated for Sweden are quite unstable, between 8% and 35% (probably partially due to some technical artefact in the estimation of the shares) The shares for Finland look more reliable.
3.1.4. Manufacture of Other Organic Raw Materials (NACE: C2014)
The bio-share of this sub-sector is assessed to be ca. 20%. This assessment is based on a combination of the interviews and available statistical information provided by Amadeus, Statistics Norway and Eurostat about the turnover of the sub-sector and of main companies in the sub-sector. Compared with Finland, Sweden and Denmark, Norway’s bio-share is slightly lower.
In sector C2014 we find companies like Borregaard, located in Sarpsborg in Østfold, specialised in the conversion of spruce into chemicals, and Dupont Nutrition Norge, specialised in the production of alginates (with the headquarter in Sandvika and production site near Haugesund). Borregaard is also producing 20 million of litres second-generation bioethanol per year, used as a biofuel.
3.1.5. Manufacture of Chemical Products Not Mentioned Elsewhere (NACE: C2059)
For this sub-sector a bio-share of 5% has been assessed. This assessment is based on a combination of the interviews and available statistical information provided by Amadeus, Statistics Norway and Eurostat about the turnover of the sub-sector and of main companies in the sub-sector. Compared with Finland, Sweden and Denmark, Norway’s bio-share is estimated to be slightly lower.
Main companies are the Norwegian branch of BASF, located in Oslo and specialised in the production of fish-based omega-3, and Life Technologies AS, since 2014 acquired by the global actor Thermo Fisher Scientific, also located in Oslo and specialised in biotechnology and diagnostics. In 2019, Adesso BioProducts AB took over Perstorp’s biodiesel plant in Fredrikstad, producing 110.000 tons of first-generation biodiesel from raps. This plant was in turn taken over by Perstorp in 2016; it had previously been started by Uniol (which went bankrupt in 2010) and then taken over by North Sea Biodiesel (which went bankrupt in 2014).
3.1.6. Manufacture of Basic Pharmaceutical Products and Pharmaceutical Preparations (NACE: C21)
The bio-share in the pharmaceutical industry was assessed to be about 50%. This share has increased from 10% over the last 10 years. The interviewee assessed that the bio-share of the sector will increase to 70–80% in the future.
There are two groups of products in this industry, standing for altogether 37 billion NOK of turnover: Pharmaceuticals (24 billions), diagnostics (13 billions). In addition, there comes Medtech (3.5 billions), which is part of another sector (32.50 Manufacture of medical and dental instruments and supplies). It was pointed out that 90% of all exported goods from this sector are originally produced in Norway.
When comparing Norway with the three other Nordic countries, the interviewee pointed out that Norwegian pharmaceutical industry has the highest specialisation in delivering new types of vaccines for aquaculture fish, in order to decrease the use of antibiotics. Regarding human pharmaceuticals, Norway and Finland are about the same level, while Denmark and Sweden are much stronger.
There are many global companies which are located in Norway, although not with their headquarters: Especially their research teams are often present in the country, and they are also guiding smaller Norwegian companies by investing in them with the aim to buy them later.
A big player for the Norwegian export is GE Health Care. They are located in Oslo and in Lindesnes in Norway, and they are going to invest billions of euros over the next years to raise even further their export.
The “red biotech” industry is concentrated in Oslo and in the Eastern part of Norway, which together host around 70% of the national research in the field. Incubators, spin-offs, companies and clusters are often located in this region. Other activities connected to red biotech are around Bergen and Trondheim, while Tromsø has a high importance for aquaculture-related biotech.
3.1.7. Manufacture of Rubber and Plastic Products (NACE: C22)
The bio-share for the manufacture of thermoplastic products made of polymers and rubber is less than 1%, according to our interviews. However, the bio-share for resin-based composite plastic products lies between 1 and 5%. For the sector C22 as a whole, the bio-share would be around 3%.
Regarding bio-based packaging, it is important to mention Elopak, a company specialised in paper-based packaging solutions for liquid food. They use forest-based PE to cover the cartons. However, also in this case most of the production occurs outside Norway, but the headquarter and the design and development departments are located in Oslo, Norway. The main production sites are in the Netherlands, as a result of a cooperation with the Finnish firm UPM. The manufactured cartons are imported to Norway by the dairy firms TINE and Røros Meieri. The enterprises mentioned above contribute, altogether, to the 1% (maximum) Norwegian bio-share of thermoplastic products made of polymers.
A different case is represented by CocaCola, whose PET plant bottle has a 25% bio-share; however such product is not completely produced in Norway, but just expanded at a filling plant.
There is one Norwegian company specialised in the production of plastic bags made of biological materials: BioBag International AS. Earlier the company produced bags in Northern Norway (in Rognan), but the company is now a global player with headquarter in Askim, in the south-eastern region of Norway. All production plants are outside Norway.
There are some plans, for the future, to produce PE from biological resources (bio-ethanol), in Norway at Bamble. The realisation of these plans depends on investors. In comparison to especially Finland and Sweden, the bio-share of the Norwegian industry is still rather small.
3.1.8. Manufacture of Furniture (NACE: C31)
The bio-share of the manufacturing industry of furniture was assessed to be about 40%. The interviewee assessed that there will be a higher bio-share in the future since the demand for bio-based furniture is increasing.
A main feature of this industry is that the main renewable biological materials used are either wood (for frames, etc.) or wool (for the textile elements). The wool comes from Norway, while the wood is mainly imported from Sweden, Poland and the Baltic countries, especially when the wooden elements are clearly visible.
The furniture industry is concentrated in Southern Norway and in Møre og Romsdal; it is not present in Northern Norway.
The following main sub-sectors are active in Norway:
- The sub-sector 31.01 “Manufacture of office and shop furniture”: Here we find manufacture of office chairs, mainly at the Håg-plant at Røros.
- The sub-sector 31.02 “Manufacture of kitchen furniture” is not so developed and the production is spread over the country. There exist a large number of smaller firms specialised in producing kitchen furniture. The three largest Norwegian producers are Sigdal, Norema and Huseby; they are specialised in producing the kitchen cabinet doors, while the insides of the cabinets are mostly produced in Sweden.
- The sub-sector 31.03 “Manufacture of mattresses” is important and concentrated in Southern Norway and in Møre og Romsdal (Jensen nearby Svelvik, south for Drammen, Ekornes in Fetsund, east for Lillestrøm and Wonderland in Åndalsnes in Møre og Romsdal).
- The sub-sector 31.09 “Manufacture of other furniture” includes the production of sofas, sofa beds and sofa sets, furniture for bedrooms. There is a vast production of upholstered seats with wooden frames, spread over the country.
In comparison to the other Nordic countries, the interviewee assessed that Denmark has a higher bio-share due to a very profitable solid wood furniture production, while Sweden has a lower bio-share than Norway, and Finland is probably at the same level as Norway (the interviewee has however declared to have limited knowledge of the domestic market within Finland).
3.1.9. Production of Electricity (NACE: D3511)
The bio-share of electricity production is maximum 0.1% (we will use a 0.1% bio-share in our analysis). This information is derived from the interview with Norsk Industri as well as from data provided by Eurostat. Eurostat has data about Gross electricity production from liquid biofuels, biogas and renewable municipal waste. Altogether this amounted in 2017 to 204,000 GW-h, while the total electricity production was almost 149,000,000 GW-h, which is about 0.14%.
Electricity prices are rather low due to the availability of hydropower and biological resources are more used for manufacturing or for heat production.
3.2. Value Added
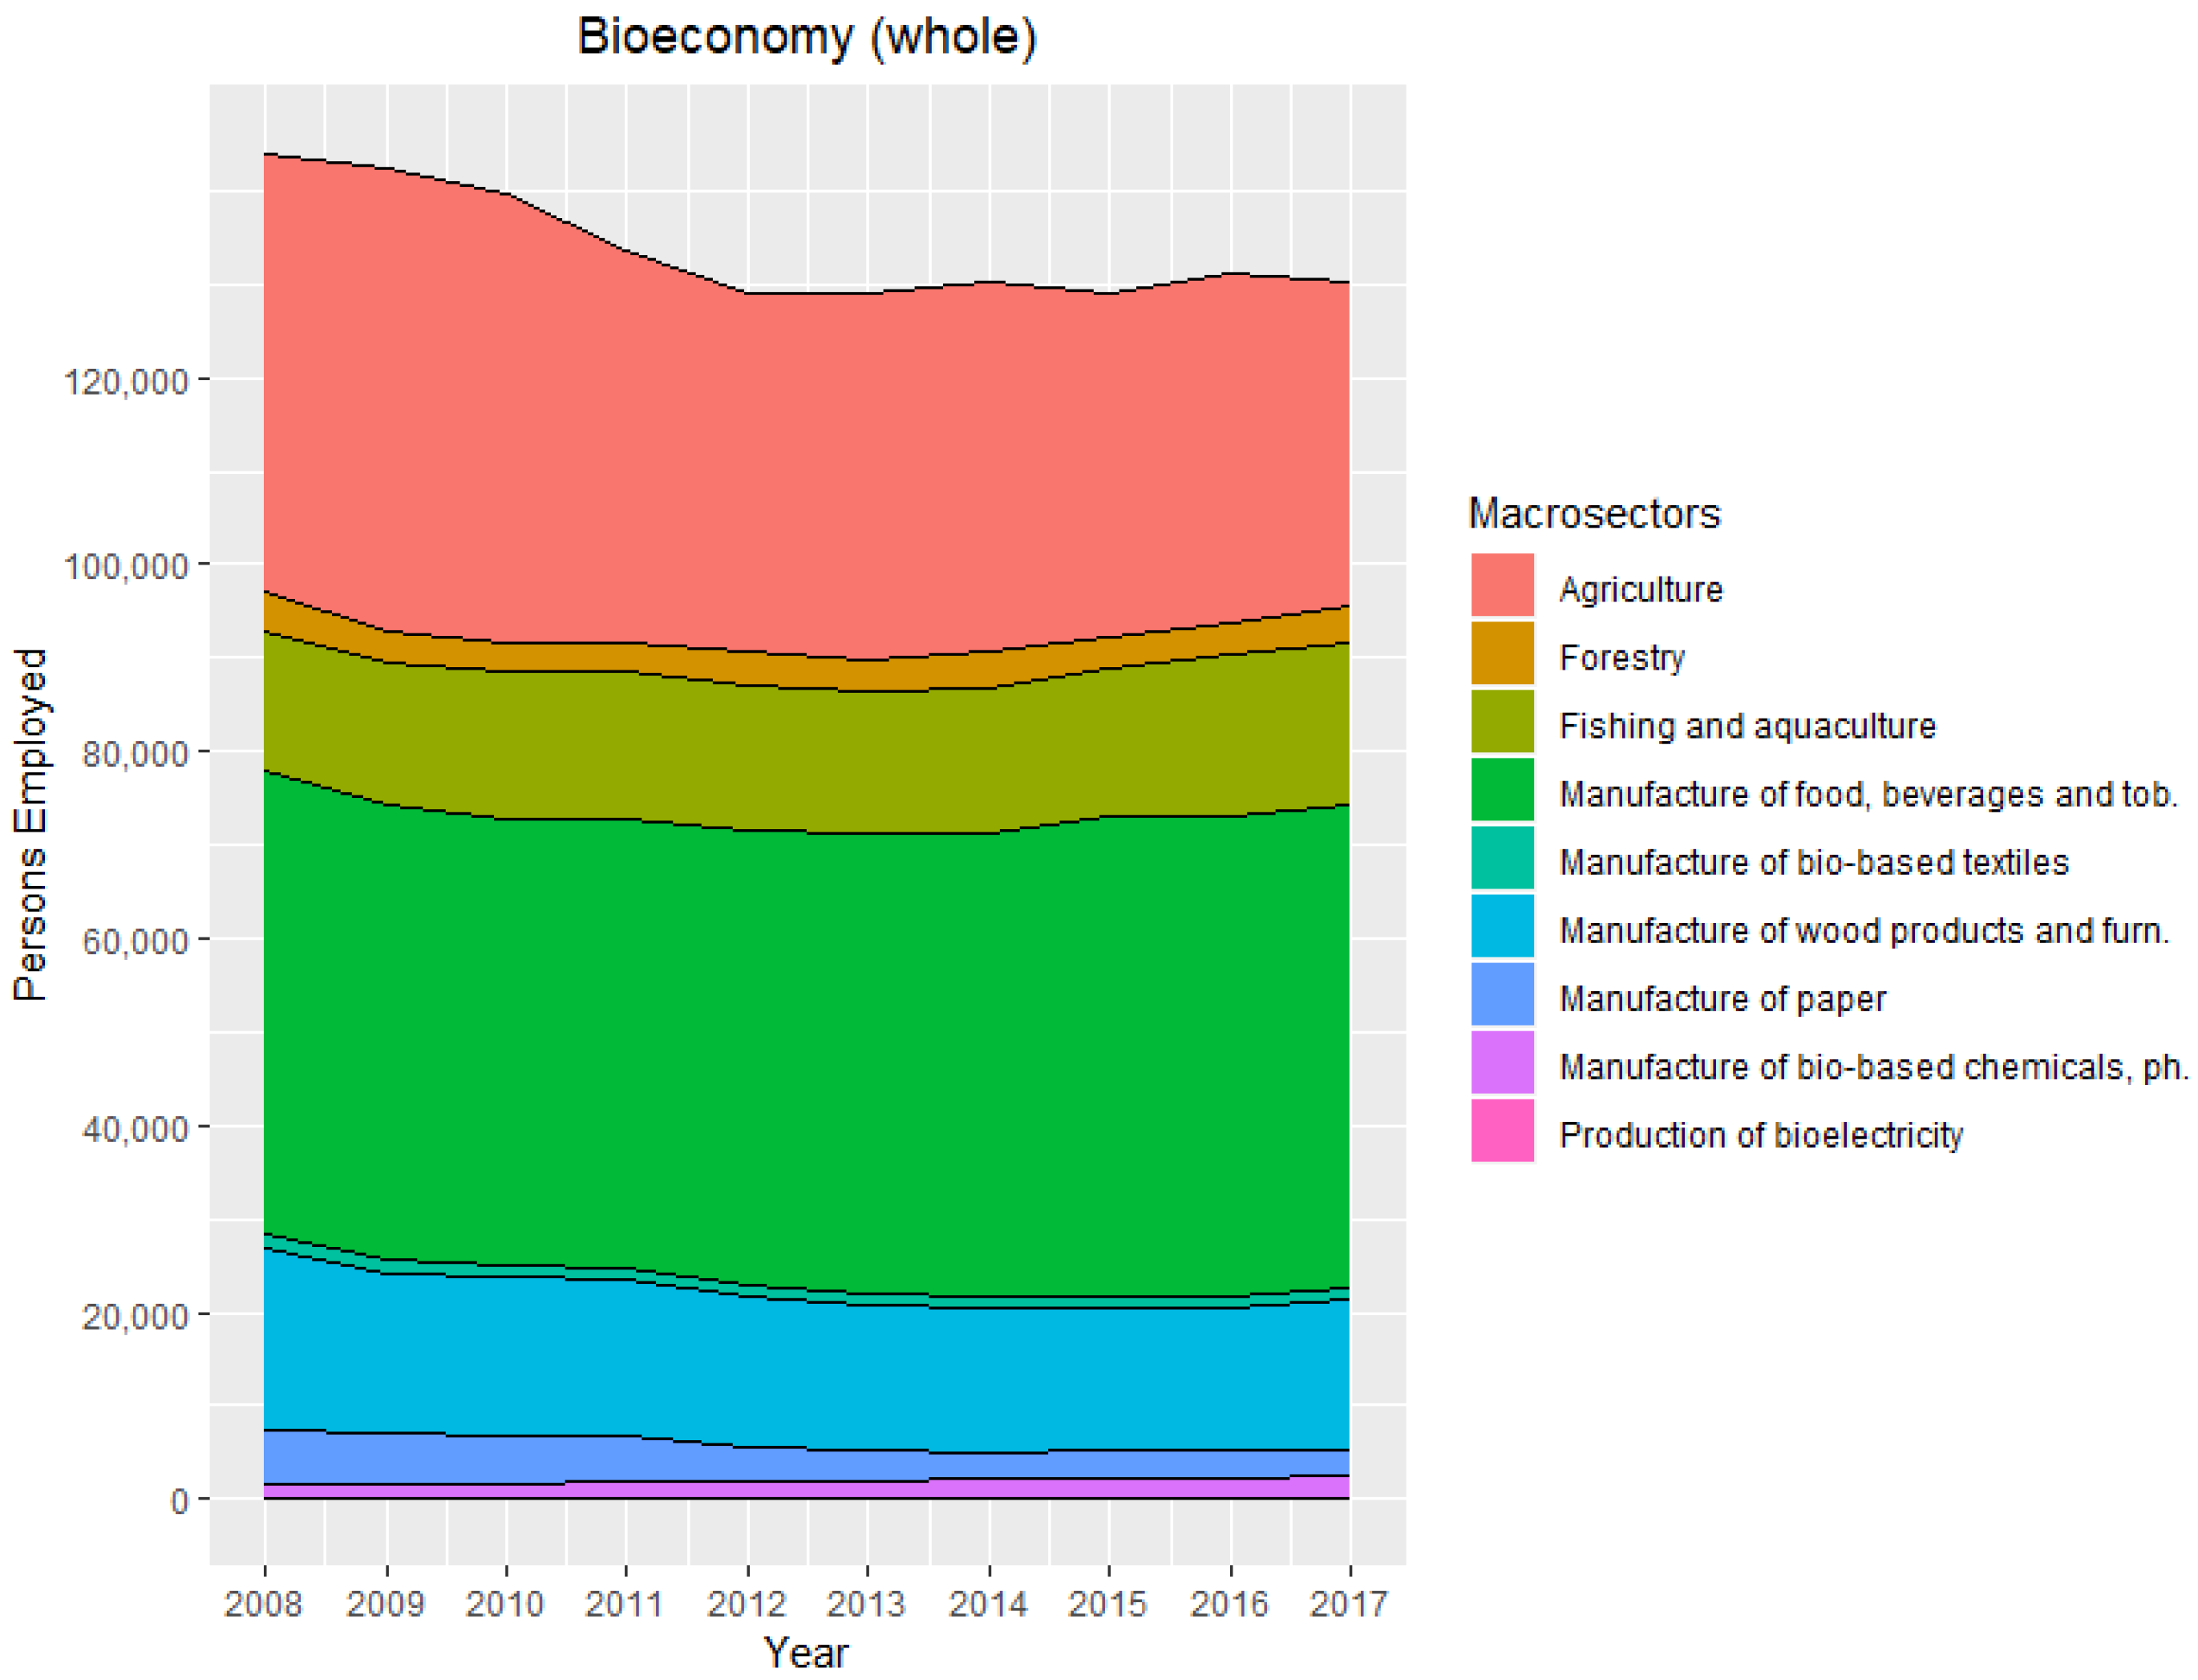
We can now apply the Norwegian sectoral “bioshares” inferred from our interviews, to compute measures of value added and employment in the Norwegian bioeconomy. Figure 1 reports the evolution of the value added of the whole Norwegian bioeconomy between years 2008 and 2017. The current total value of approximately 130 billion Norwegian Crowns (NOK) has been reached following a strong increase from an initial value of around 76 billion NOK in year 2008. Two macro-sectors seem to have been determinant for the increase. First, the value added from fishing and aquaculture (NACE code 03) has grown from around 12 billion to more than 43 billion NOK: An impressive growth spurt for the sector, especially considering that the sector is classified as a “pure” biosector and the increase in value added cannot thus be ascribed to substitutions of nonbiological inputs with biomass.
Secondly, the production of food, beverages and tobacco (NACE codes 10, 11, 12, considered altogether) has followed a regular, but still steep, path of growth, leading from a value of around 31 billion to more than 45 billion NOK. Given that some of the products from fishing and aquaculture are processed within Norway, it is likely that part of the growth of the food sector value depends partially on the processing of fish produced in Norway. As a result, in year 2017 fishing, aquaculture, food, beverages and tobacco contributed, taken together, to 89 billion NOK; if we also sum the value added of agriculture, which has grown from 12 billion to 16 billion NOK, then we can see that the total value added from food-related sectors amount in year 2017 to 105 billion NOK: More than 80% of the total value added of the Norwegian bioeconomy.
The forestry sector (NACE code A02) contributes to the bioeconomy with a value added of 5.4 billion NOK (in year 2017), having almost recovered to the initial value of 5.7 billion (in year 2008) after a decline which touched its low point in year 2013 with 4.2 billion NOK. The Paper sector (NACE code C17) has followed a similar path: In year 2008 its value added was 3.4 billion NOK, then it has faced a strong turbulence for some years, touching a low at 2.2 billion (in year 2014) before partially recovering and almost reach 3 billion in year 2017. The macrosector producing wooden products and furniture (NACE codes C16 and C31) has experienced ups and downs during the last ten years, but its value added has in the end reached a higher value in year 2017 (10.2 billion NOK) than in 2008 (9.1 billion. However, both the turbulence and the final increase seem to be due mainly to events in the wood products sector (NACE code C16), while the “hybrid” furniture sector (NACE code C31) has experienced a slight decrease in value added, as can be seen in Figure 2 (for hybrid sectors, we are considering and showing only the value added related to their bioshare).
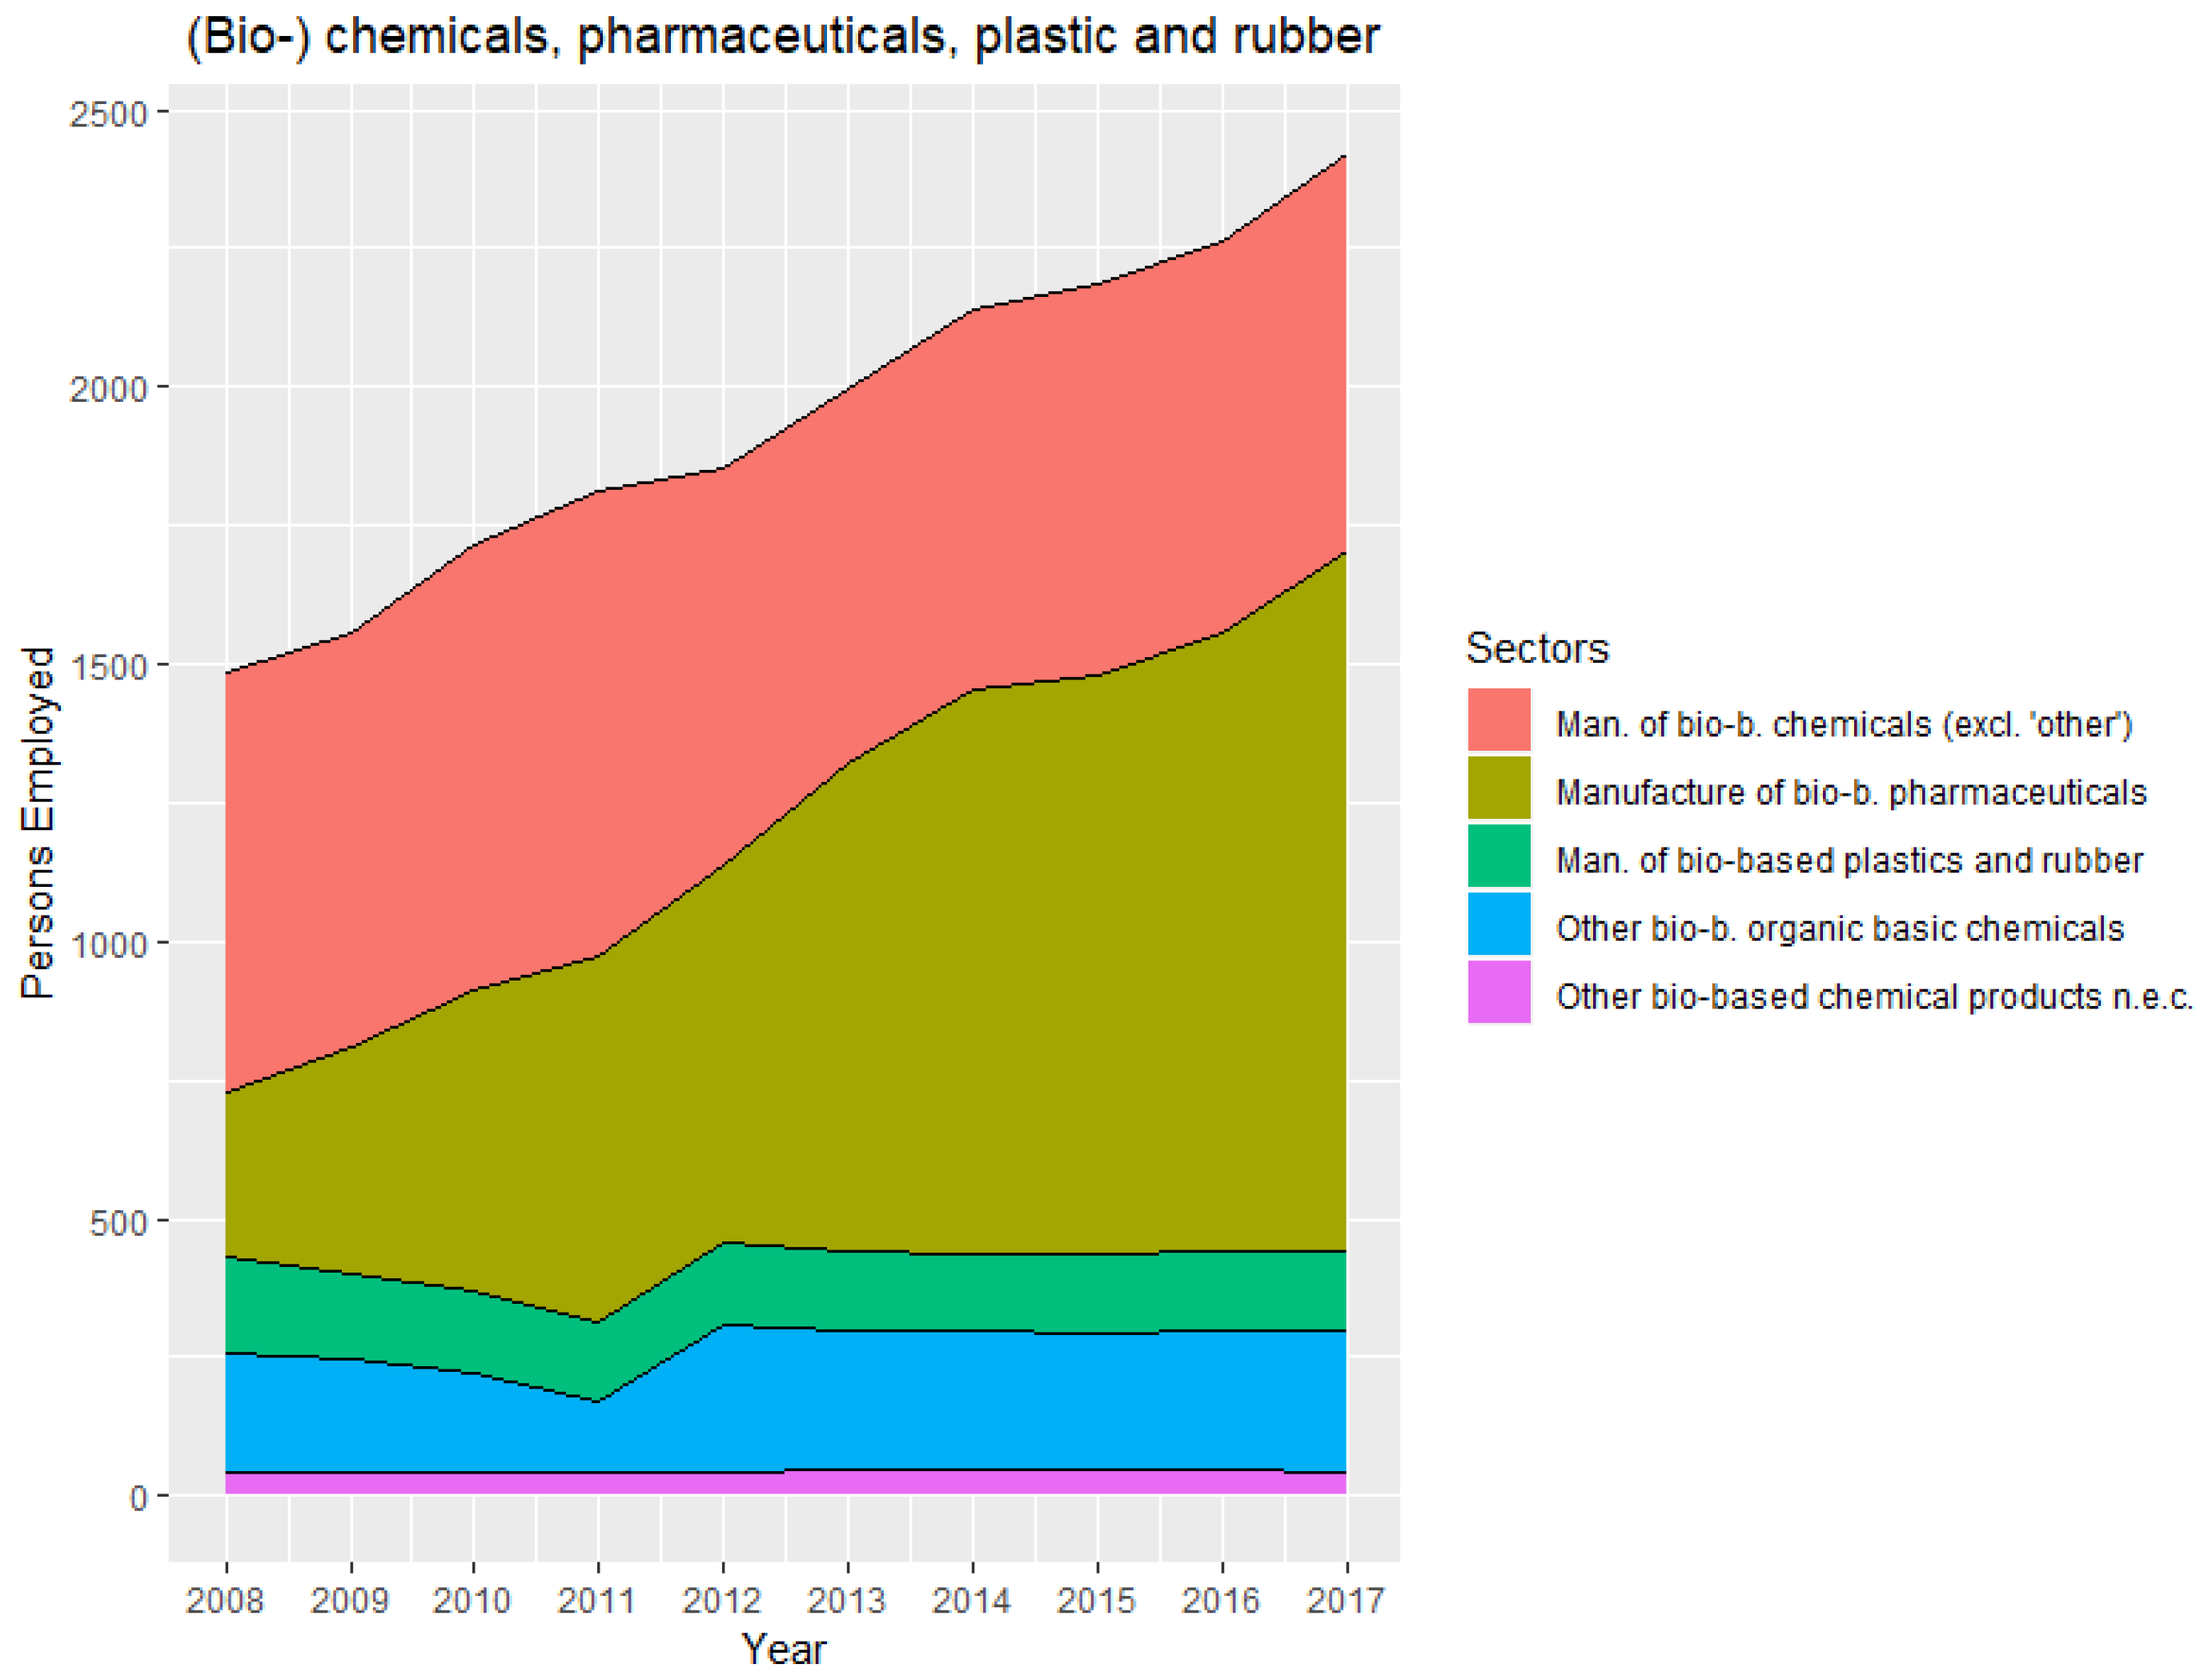
A particular phenomenon can be observed concerning the macrosector for bio-based chemicals, pharmaceuticals, plastics and rubber: As can be seen in Figure 1, its value added has almost doubled within ten years, going from 2.6 billions NOK to more than 5 billion. The macrosector components are shown in Figure 3: In front of a decline of bio-based chemicals (NACE sector C20; the decline involves also the subsectors C2014 and C2059 which have a different bioshare), the bio-based plastic and rubber (C22) and the bio-based pharmaceuticals (C21) have experienced an increase in value added. For the latter case of bio-based pharmaceuticals, in particular, the increase has been dramatic: From 0.3 billion in year 2008 to more than 3 billion in 2017, a growth spurt which can only partially be explained by an increase in the sector’s bioshare and which witness the stronger weight held today by pharmaceuticals in the Norwegian bioeconomy.
Finally, there are two macrosectors which are currently playing a minor part in the bioeconomy, namely manufacture of textiles and textile-related products (NACE codes C13, C14, C15, considered altogether in Figure 1) and production of Bioelectricity (NACE code D3511). The value added from the manufacture of textiles and textile-products amounts to around 0.8 billion NOK (in year 2017) and has been approximately constant since 2008, the only variations deriving from Sector C14 (manufacture of wearing apparel, see Figure 4). A low contribution to the bioeconomy can be registered from the production of bioelectricity, whose value added oscillates between 0.02 and 0.04 billion NOK.
3.3. Employment and Productivity
We now turn to sectoral employment figures, to understand whether the labour force mirrors the movements observed in terms of sectoral value, and how labour productivity has evolved during the last decade. A summarising figure for all the bioeconomic macrosectors is shown through Figure 5. We can immediately see that the total number of people employed by the Norwegian bioeconomy has decreased: In year 2008 the bioeconomy was giving employment to 144.227 people, while in 2017 the number has shrunk to 130.472. The decrease has been driven by several macrosectors; an important role has been played by agriculture, going from almost 47 to less than 35 thousand employed. The decline of forestry has been less steep, moving from around 4300 to 3800 employed. Among the primary sectors, an opposing trend has been registered by fishing and aquaculture, whose employment total has increased by roughly 2500 units from a starting figure of around 15,000 employed in year 2008.
Within manufacturing sectors, strong and steady decrease has been registered for production of Paper, which was employing almost 6000 people in year 2008 and only less than 3000 in year 2017. A milder decrease has hit the macrosector of Wood products and Furniture, moving from almost 20 to around 16 thousands units (see Figure 5), with a relative decrease much higher for what concerns its Furniture component (see Figure 6; remember that Furniture is a “hybrid” sector, therefore the figure shows only the bio-related share of the sector’s employed). For what concerns textile-related sectors, the employment has partially recovered from a decline experienced soon after year 2008, a decline suffered particularly by leather producing firms (NACE sector C15; see Figure 7).
In contrast, the macrosector for bio-based chemicals, pharmaceuticals, plastics and rubber has increased its employment from around 1500 to around 2500 (see Figure 5). The sectoral composition shown in Figure 8 highlights the major role played by pharmaceuticals (NACE sector C21) which has quadrupled its employment, compensating decreases from Plastics and Rubber and from Chemicals (notice, however, the good performance from manufacture of other organic basic chemicals, NACE sector C2014).
Last, but perhaps most importantly, we must mention the contribution from the macrosector Food, beverages and tobacco (NACE sectors C10, C11, C12) to the bioeconomy in terms of employment. Even if its growth has been negligible since year 2008, the absolute number of people working at the macro-sector is very high (around 50 thousand employed) and constitutes a pillar for the bioeconomic labour force of Norway.
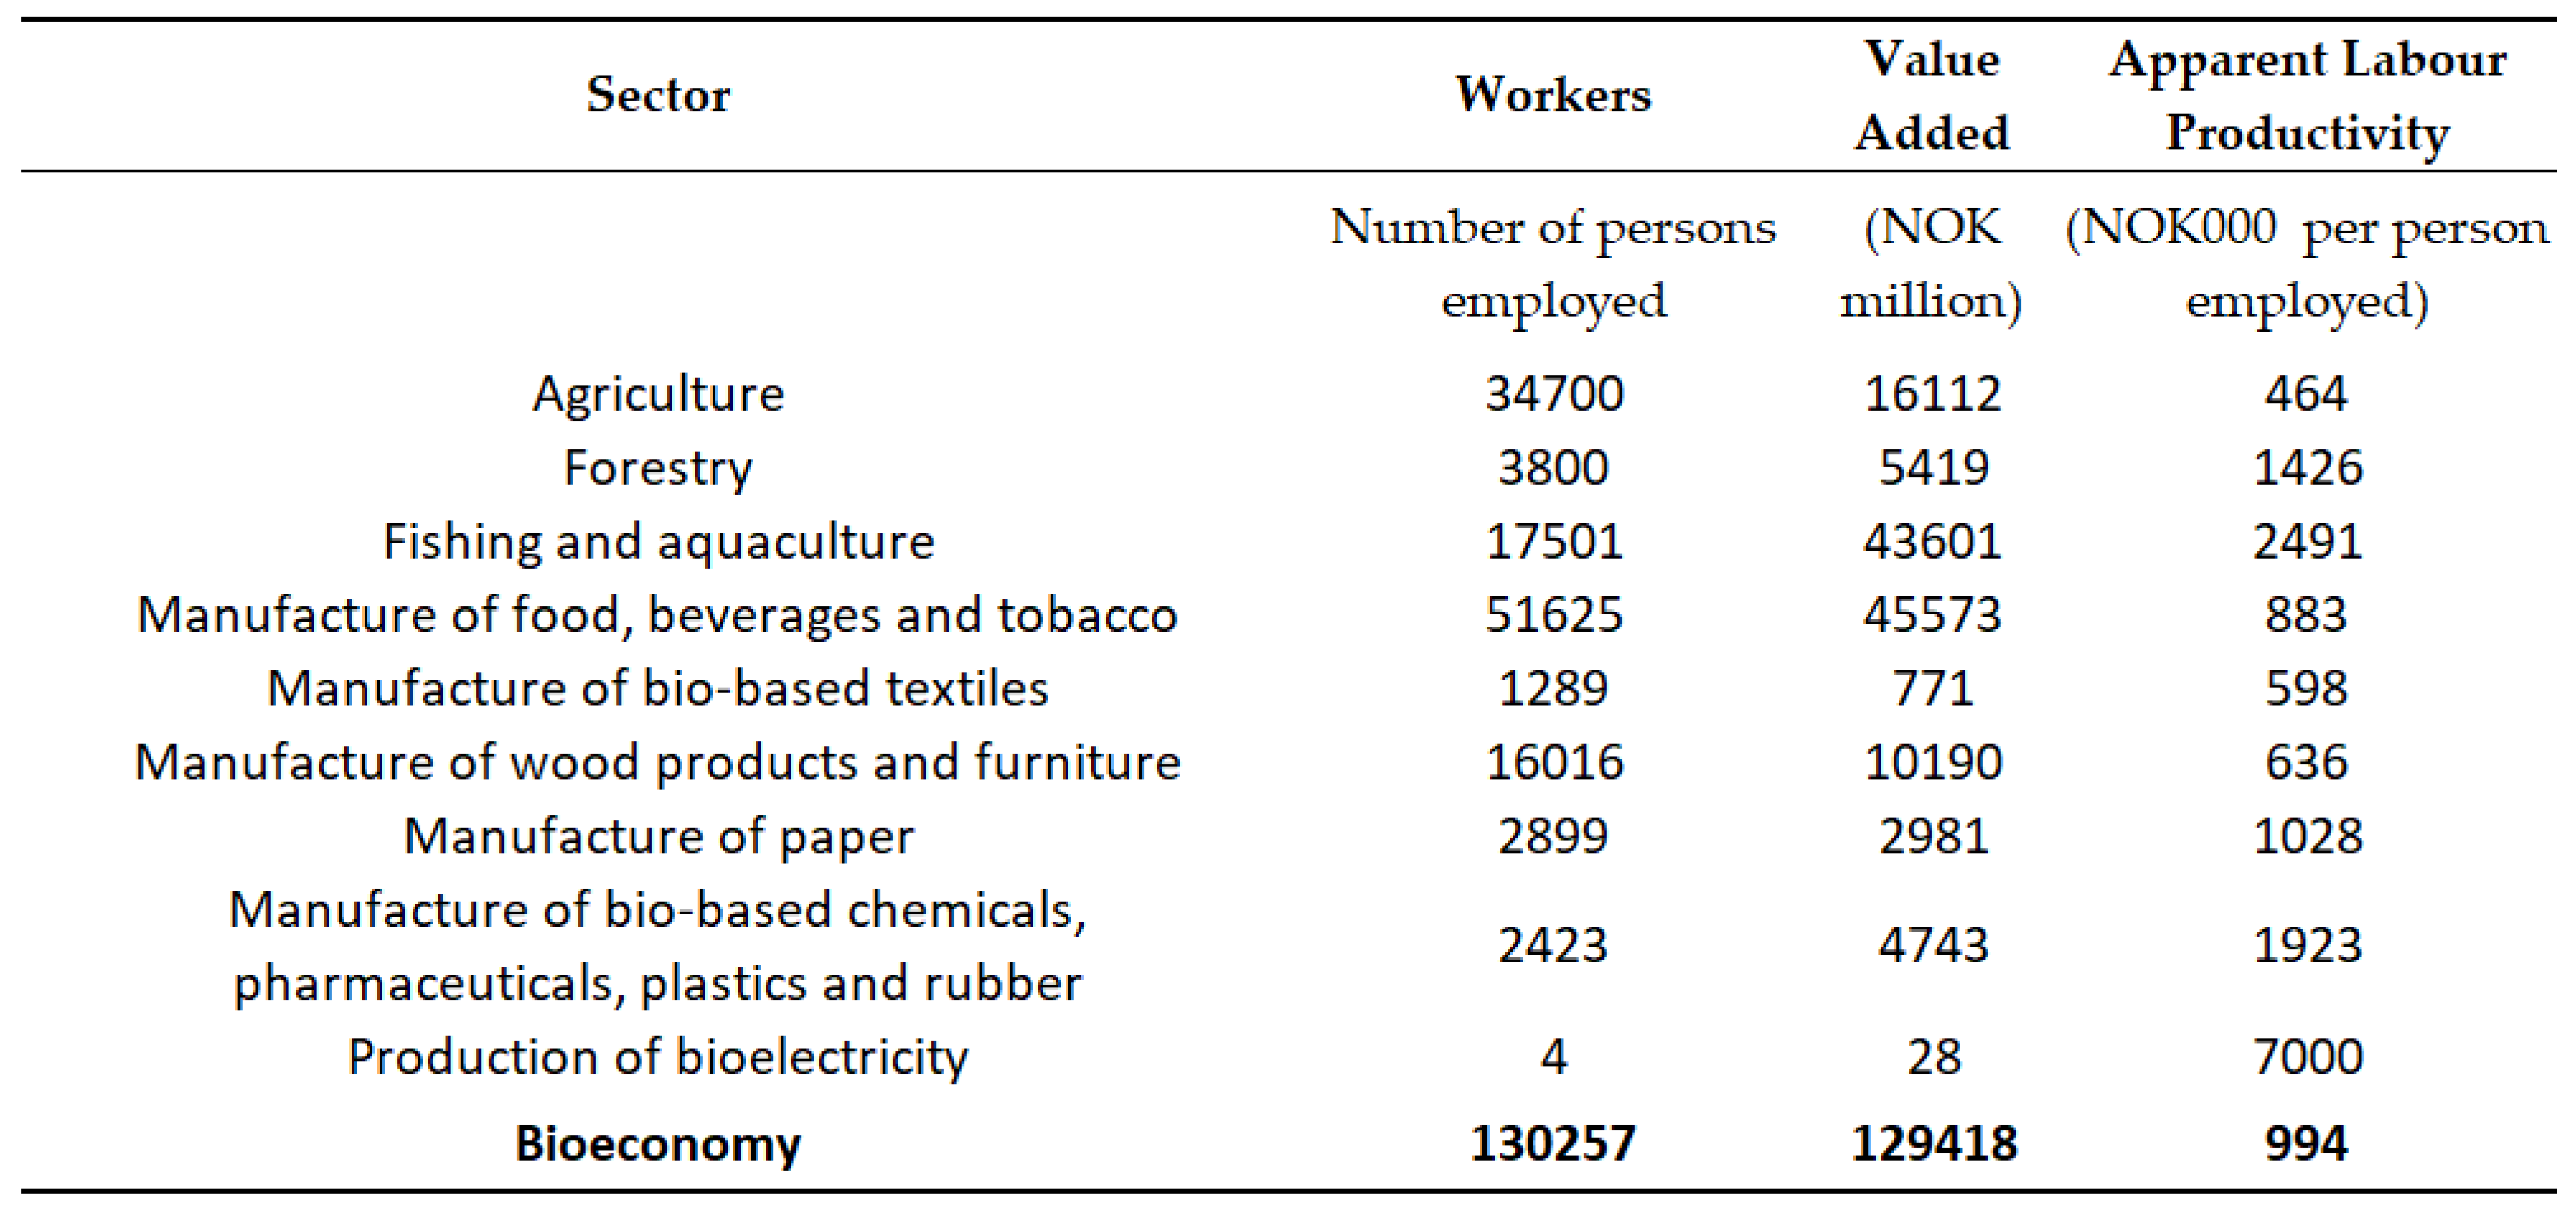
By using, at the same time, our results about, respectively, value added and employment, we are able to compute sectoral labour productivities, which we show in Figure 9. In the middle of the figure, indicating a median labour productivity about Norwegian sectors, we find manufacture of paper and forestry and, at a slightly lower level, food, beverages and tobacco. On the left hand, with a relatively low productivity, there are wood products and furniture, textiles and plastics and rubber. At the middle-high productivity rank, instead, there are the chemical sectors, where we have here separated the 4-digit sectors 2014 and 2059 (associated by Ronzon and M’Barek, 2018, to biofuels, but involving other biochemicals for the Norwegian case) from the main chemical sector. Close to the chemical sectors, and with a high productivity, there are the pharmaceuticals. Then, if we exclude the particular case of bioelectricity which is neither a primary nor a secondary sector, the top level of productivity is occupied by fishing and aquaculture (the precise amounts of the productivity indicators are reported in the Appendix A). Given that bioelectricity contributes to a very low proportion of electricity production in Norway, some of our statistical assessments about the biobased part of the electricity sector (like the indication of 4 employees working on bioelectricity) must not be taken literally, but only as an indication of such a low proportion. We are still including bioelectricity among the hybrid sectors, mainly for comparisons with previous studies on other European countries. However, considering as hybrid a sector where only 0.1% of production is biobased exacerbates the approximations of the method, which was conceived for hybrid sectors with a more relevant bioshare. In the next section we show how this ranking, especially at the top positions, marks an important difference between Norway and other European countries.
3.4. Comparison with EU Countries
If we compare Figure 9 with the analogous figure shown by (Ronzon and M’Barek [21], Figure 1) for the EU countries, some differences are evident. First, productivity in Norway is generally higher: Keeping in mind that 10 NOK (the Norwegian currency: Norwegian crowns) roughly equate 1 euro in terms of currency exchange, we can see how Norway performs much better than the EU average for what concerns apparent labour productivity. This may not be a surprising result, considering the availability of capital in Norway, which sums up with a favourable exchange rate; however, the productivity difference for some sectors is way beyond obvious. There is indeed no country in the European Union having such a high productivity in fishing and aquaculture: The highest country-level estimates for the EU would not reach 2 million NOK per person, while Norway is able to go above such threshold. The labour productivity for the forestry sector is also much higher than the EU average, although it is comparable to what found in some countries like Finland. Instead, the Norwegian productivity picture resembles the EU picture when it comes to the relatively low ranking of agriculture and high ranking of electricity and pharmaceuticals.
We now turn to a dynamic analysis to check whether the differences detected about labour productivity have intensified or weakened since year 2008. To this purpose, we now provide an updated version of the double scatter plot provided for the EU countries by (Ronzon and M’Barek [21], Figure 4): In our Figure 10, the two axes measure, respectively, location quotient and apparent labour productivity, and each country is represented by the starting point of an arrow (for year 2008) and the ending point of an arrow (for year 2015). While (Ronzon and M’Barek [21], Figure 4) considered only EU countries, we here also include Norway (to allow an easier comparison between figures, we consider the times span 2008–2015, as for the original figure); notice that all location quotients for the EU countries have been recomputed by considering, as a benchmark, an enlarged set of countries consisting of all EU countries plus Norway. A location quotient greater than 1 in a country thus means that the labour market of the country is more ‘concentrated’ in the bioeconomy than the whole labour market composed by the EU-28 countries plus Norway.
The resulting Figure 10 does not show strong differences from the one by (Ronzon and M’Barek [21], Figure 4) for what concerns the EU countries, which means that the different benchmark did not change qualitatively what was previously observed about the European Union; instead, our analysis can focus on Norway (identified through the code NO) and its position in Figure 10, where clusters of EU countries have been highlighted as in Ronzon and M’Barek [21]. The arrow depicting Norway’s dynamics (its starting point, in blue colour, refers to the values in year 2008) shows that Norway clearly belongs to the cluster (circled in red) of European countries with a low specialisation, but a high productivity in the bioeconomy: The “Northern states” cluster previously identified by Ronzon and M’Barek [21]. Moreover, the arrow associated to Norway shows that the country has slightly decreased its bioeconomic location quotient and strongly increased its bioeconomy’s labour productivity. In other words, Norway’s labour market is, relative to the EU, stayed specialised in non-bio sectors, but the value added per worker in the Norwegian bioeconomy has increased dramatically.
To have an intuitive idea of where the low level of the Norwegian bioeconomic location quotient originates from, we need to mention that the biosectors employ altogether a low share of the Norwegian labour force (around 5%). The bioeconomy’s employment is also decreasing over time (see Figure 11, employment measured on the right axis). Instead, the value added of the Norwegian bioeconomy, as resulting from all bioeconomic sectors, has experienced a steep increase (in Figure 11, the value added is measured on the left axis; for “hybrid” sectors, the values have been split between bioeconomy and “other” non-bio-sectors according to their respective bioshares). The value added of the Norwegian bioeconomy appears to account for 4% of the total value added in the whole economy, as of year 2017. However, a precise interpretation of the relation between bioeconomy and rest of the economy requires additional reflections, which we report in Section 4.
4. Discussion
4.1. Bioshare of Products
When considering the proportion between the whole economy of a country and that part of it which depends on the utilisation of biomass, that is the “bioeconomy”, it is important to find a definition of the term “bioeconomy” in a way that can simplify the interpretation of such comparison. Traditionally, when it comes to define the bioeconomy in quantitative terms, and to estimate its value in monetary terms, researchers tend to focus only on the sectors which constitute the “green” economy (agriculture and forestry) and the “blue” economy (fishing and aquaculture). The articles by Ronzon et al. [20] and by Ronzon and M’Barek [21], instead, have extended the boundaries of the bioeconomy from the primary sectors to include secondary sectors which are connected to bio-mass, even if less directly. Of course, when including manufacturing sectors in the analysis, an estimation problem arises because some of those sectors (think, for instance, about textile-related sectors), present only a share of activity and of output which depend on a bioresource input. This estimation problem has already been dealt with in the previous sections of this study; however, we need to point out specifically here that, however we estimate the “bioshare” of a particular “hybrid” industrial sector, we indirectly provide also an estimation of the share of industrial sector that is not “bio”, in the sense that does not depend on biomass. Such “non-bio-share” of an industrial sector will characterize those economic activities which we would altogether consider as the rest of the economy, or “non-bioeconomy”, which in turn constitutes our term of comparison when inferring the economic importance of the bioeconomy within a country. We argue that the relative weight of the bioeconomy in a country could be assessed more precisely by considering “bio-shares” for all the economic sectors of the country and not only for primary sectors, where the bioshare approximates 100%, and secondary sectors, which have been considered in our study, following Ronzon and M’Barek [21].
Let us consider the estimation problem from a value chain perspective. Primary sectors may have biomass as input or as output, but in any case, their connection to biomass is direct and pervasive. Manufacturing sectors can lay on the second layer, or on lower layers, of the same value chain of the primary sectors; the biomass coming from the primary sectors constitutes the inputs, or part of the inputs, of the manufacturing sectors. In this sense, the manufacturing sectors have a “bio-share”. Why not going further down the value chain? The output of the manufacturing sectors may still contain plant or animal materials; which will be used as input by other sectors of the economy. The only sector that is not primary nor secondary, and still is considered in our study of the bioeconomy following Ronzon and M’Barek [21], is the production of Bioelectricity. We think that many more sectors could, in the future and after further elaborations on the problem, be included in the analysis. A first example can be the construction sector. Suppose that some activities in the construction sector of a country are devoted to the production of wooden houses. Would such activities represent a “bio-share” of the construction sector? Probably so, if we use the same criteria, we have used for manufacturing sectors: The wooden houses produced by the construction sector would indeed utilize construction elements which are outputs of secondary sectors (to be precise, of the “bio-shares” of some secondary sectors) and would still comprise bioelements. Therefore, part of the value added of the construction sector could be considered as resulting from bioeconomic processes, and as such contribute to the estimate of the overall value-added of a country’s bioeconomy.
4.2. Bioeconomic Activities
Notably, Ronzon and M’Barek [21] have considered also production of bioelectricity as a bioeconomic sector (the only sector they consider which is not primary not secondary). This sector is totally different from all the other bioeconomic sector, in that biomass is here used as an input, but does not constitute any part of the output. This peculiarity has led first Ronzon and M’Barek [21], and then us, to adopt a totally different way of measuring its contribution to a country’s bioeconomy: We cannot measure a percentage of the product which is made of biomaterials, but we must estimate how much of the product (electricity) has been produced by using biomass (or derivates) as a main input.
We agree with the inclusion of bioelectricity in the analysis; four possible implications follow. First, other forms of energy production could be considered; a major example comes from biogas production, which pertains to NACE code D3821 (“...disposal of non-hazardous waste by combustion or incineration or other methods, with or without the resulting production of electricity or steam, compost, substitute fuels, biogas, ashes or other by-products for further use etc.”) and has therefore not been included in the analysis by Ronzon and M’Barek [21], nor by ours. Notice, moreover, that the NACE code D3821 is a subcategory of the NACE sector D38 (“waste collection, treatment and disposal activities; materials recovery”). Can waste collection and treatment be considered, at least partially, as a bioeconomic sector? We suppose so, especially because biomaterials often constitute an important input and sometimes even an output (think, for instance, of recycling activities).
If we think that energy from biomass is not only the output of a specific sector, but can be also used by the same sector that produces it, we can approach our second implication, focused on processes rather than products. There have been cases, also in Norway, where manufacturing sectors have employed energy from biomass, and specifically sludge and leftovers from other biosectors, to produce cement. This is not a marginal event for a cement-producing company, given that the share of its budget devoted to energy utilisation is typically far from irrelevant. Therefore, we believe that the analysis of a bioeconomy could encompass also a study of the changes in the processes behind the economic activities of a country. It is important to point out that such encompassing might extend the area of the bioeconomy to some sectors, but downsize the bioshare of sectors which we already consider: For instance, an intensive application of synthetic chemicals in the processing of wood might be accounted for by lowering the bioshare of a wood-related sector.
A third implication about possible extensions of the definition of the bioeconomy can be suggested by a more challenging, but not less meaningful, example. Consider a research institute that has bought wooden chairs. The wooden chairs are acknowledged as inputs by the accounting division of the research institute: A value added tax will either not be paid upon the purchase of those chairs or will be paid but reimbursed at a later time. This is because those chairs will contribute to the value of the output of the research institute. Given that such output is intangible, it is not intuitive for us to determine a “bioshare” of it and, therefore, a “bio-share” of the research activities connected to it. However, a parallel with the case of bioelectricity production can be established, even if far-fetched: Both the power company and the research institute perform tasks leading to a product which does not contain biomaterials, and both utilize bio-materials as an input. The obvious objection is: The biomaterial input has a major role for the power company while it is scarcely relevant for the research institute. Suppose now that, instead of the research institute, we consider a major distribution company buying and selling paper products. In this case, the objection would not hold: Even if the value added by the distribution company does not involve the production or transformation of biomaterials, its formation clearly bases upon bio-materials. As a consequence, that value added could as well be defined as bioeconomic, even if it would stem from a sector which, as all trade sectors, has not been considered as bioeconomic.
We could go on mentioning other sectors, for instance, in transportation, where biomaterials enter the sector as inputs but not as outputs; instead, for sake of space, we prefer to turn now our attention toward activities which sell their outputs to sectors producing bioproducts. All sectors that have been considered as bioeconomic in our study, no matter whether primary or secondary, use also inputs and infrastructures which do not have a physical “bioshare”. Sometimes the inputs and infrastructures are purchased directly by the firms belonging to the bioeconomic sector: A biopharmaceutical company may, for instance, acquire a patent from a private research firm. In other cases, they are purchased indirectly: A forest-related company may employ new roads and skilled workers, where the infrastructure and education have at least partially been provided by the state or the county, that is, indirectly, by the same forest-related company through taxes. How much of the services, of the public administration, of the education system of a country are financed by, and contribute to, the sectors which we are traditionally considered as bioeconomic? In other words, does a “bioshare” exist for their value added as well? If so, such bioshare could be extremely high in some countries, especially in the developing world, where the whole economy rests upon the production of bio-goods. In Norway, such bioshare would be lower and difficult to quantify, but placing it at zero, by excluding almost all services and all the public administration from the accounting of the Norwegian bioeconomy, still feels like a methodological stretch.
4.3. Cross-Border Bioeconomies
An analysis of socioeconomic indicators of the bioeconomy for a country like Norway, whose economy is characterised by openness and internationality, poses additional methodological questions. In an open economy, goods and capitals flow across country borders by means of international trade and foreign investments. The indicators of an open economy include distinctions between national property and national place of production; an exemplary distinction in this sense is between Gross Domestic Product and Gross National Product, which derive from different points of view on a country’s economy, and possibly at different definitions of a country’s economy. Should similar distinctions be in place when defining indicators for an “open bioeconomy”? Consider the case of wearing apparel: As pointed out previously in Section 3, the production of wearing apparel in Norway often employs wool as a material. The utilisation of wool is grounded in the Norwegian history, marks the Norwegian society in that wool is still considered the champion material to protect from the cold, and constitutes one of the traditional prides of the “made in Norway” apparel. On the other hand, the use of synthetic materials is far from negligible among Norwegian clothing brands; however, most of the production based on synthetic materials for the same brands occurs abroad. This does not mean that value adding processes for these products only happen abroad: Many value adding activities still happen in Norway even if not directly involving physical activities of production. A first order of technical problems, therefore, comes from the fact that some of the value adding activities in a sector in a country may derive from a production abroad with synthetic materials, even if the production within the country is mainly based on biomaterials.
Unfortunately, a second and more difficult set of problems comes from the international division of demand, which we can illustrate again through the example of wearing apparel. The Norwegian domestic market is much more oriented towards biomaterials in clothing than many foreign markets, including other Nordic markets. This means that an assessment of the sectoral bioshare based on export statistics could differ strongly from an assessment based on production statistics. For our analysis, we have related to production rather than to exports, but a different decision would have led to different quantifications of the Norwegian textile-related bioshares. Notice that the bioshares considered by Ronzon and M’Barek [21] for the sectors C20 and C21 were based on production value (from the EUROSTAT-Prodcom database) while the bioshares for the other sectors were based on export value (from the EUROSTAT-Comext database); for an open economy like the one of Norway, a decision had to be made between the two methodological approaches.
A third comment can be brought forward about the international features of the bioeconomy, and specifically about the role of imports. If a country shifts its manufacturing toward a higher use of biomaterials, and those biomaterials are imported, an analysis like ours would translate this shift in an increase of bioeconomic value added for the manufacturing sectors, because of an increased bio-share in its products. Figures for primary sectors like agriculture and forestry would not be altered, since the analysis is restricted to sectors within a country and ignores repercussions on a global scale. Therefore, changes in the world’s bioeconomy, following a country’s shift like the one described above, could go well beyond the changes in the same country’s bioeconomy, both in terms of value added and in terms of employment.
4.4. Complementary Visions
In the current study, we have used a definition of the bioeconomy which focuses mostly on the resources used by firms in order to produce. To allow comparisons between countries, our analysis has closely followed the methodology used by Ronzon and M’Barek [21] for the European Union, which was based on evaluations of the share of biomass included in each product. Other approaches are however possible, and especially an approach would be possible which looks at biotechnology as a defining element of the bioeconomy [5]. Nowadays, the key role of biotechnology in shaping bioeconomies is pacific among experts [25]. However, even without an explicit account, the influence of biotechnology on our estimations of the bioeconomy is still evident. In industries which manufacture pharmaceuticals, chemical products and plastic products, the dynamics of value added have been shaped also, if not primarily, by biotechnology. When, in our analysis, the bioshare of pharmaceuticals is estimated to have increased dramatically over time, we are implicitly showing the power of biotechnology in creating bioeconomic value added.
We do not forget that the existing visions of the bioeconomy are indeed not only based on bio-resources, but also on bio-technology and bio-ecology [5]; therefore, a goal for future studies on value creation in the bioeconomy could be aimed at disentangling between the value creation occurred within the existing production patterns and within the existing national economic structure, and the value creation which results from systemic changes in the country’s production patterns. Such systemic changes may signal a restructuring process for the country, as well as global economic reactions to environmental and political pushes towards sustainability development goals. Radical innovations from the supply side, and changes on the consumption side in the way human beings satisfy their needs, translate into money flows which we measure through value added measures. Our analysis of value creation in the bioeconomy in Norway represents an occasion for hinting towards future analyses, which would look at the overall structural variations in the Norwegian economy, and at the innovation patterns followed by firms at micro-level to respond to macro-level global challenges.
Possible alterations of existing ecosystems should also be taken into account more explicitly. For instance, the high value added for fishery and aquaculture found in this report has to be seen on the background of the IPBES-report on biodiversity and ecosystem services [26]. While the draft IPBES-report highlights that fishery, aquaculture and mariculture play an increasing role in food security, livelihoods and the global economy, the report also points out that these bioeconomic activities affect nature directly and indirectly. Industrial fishing can lead to the depletion or overexploitation of marine fish stocks, while growth of aquaculture and mariculture affects nature in several ways, such as through the production of aquafeed—by harvesting stocks of small, fast reproducing or by producing plant-based fish feed—or through the degradation of coastal habitats by different waste streams (nutrients, feces, antibiotics) [26]. On the other hand, the specific context of Norway can provide examples of a sustainable management of fishery resources, as well as of ecologically sound aquaculture and marine spatial planning systems. Cross-sectoral cooperation between fishery, aquaculture and mariculture could then be important for addressing the potential damages caused by fishery, aquaculture and mariculture, especially in terms of losses in biodiversity. Technology can help to address some of the mentioned challenges.
4.5. Bioeconomic Value Addition for a Country Rich in Fossil Resources
For future research it would also be important to highlight changes in the Norwegian technology and supplier industries towards the evolving bioeconomy. While the main focus of economists, regarding technology and supplier industries, has often been on the provision of knowledge-based services, equipment and machinery for the oil and gas industry, the evolving bioeconomy brings the need for turning the technology and supplier industries towards different needs. The bioeconomy can indeed become a new platform for value creation and employment, involving not only primary industries, but many other industries of the Norwegian economy, and to produce not only material goods, but also immaterial goods and services. Value creation examples can include: Technology and services for aquaculture and mariculture, digitalisation and artificial intelligence in the bioeconomy, new equipment for processing organic biomass in biorefineries.
There are several reasons why value addition in the bioeconomy should be a goal also for a country rich in fossil resources, like Norway. The first reason is about diversification in economic activities, which allows a higher stability in the economy. Fluctuations in oil price have shown that, in fossil-rich countries, macroeconomic variations may not always be smooth. Therefore, the diversification of the economy, in general, and of exports, in particular, may serve as a partial protection from macroeconomic fluctuations.
Notice that this goal would closely connect with the Sustainable Development Goals, which cover also job safety and welfare. Even if the decrease in employment observed in the Norwegian bioeconomy may appear in contrast with the goal of job safety, there are three reasons why such phenomenon must not automatically lead to a dramatic worry. The first reason relates to the goal of job stability: The turbulence in some areas of the bioeconomic job market may be lower than the one observed in non-bioeconomic sectors. Whether this is true or not on average, across all bioeconomic sectors, should be checked by further analyses. A second reason for keeping optimism towards the current bioeconomic situation lies in the possibility, untested by our study, that job positions have been created in service sectors connected to the bioeconomy. Especially in times when the bioeconomy has increased its reliance on external service activities (and here we also include professional and research activities) there is a possibility that increased employment on those activities have, at least partially, compensated the employment lost directly by the bioeconomic sectors. A special mention would then go to services devoted to repair and maintenance of manufactured goods; policies aimed at recycling or circularity could also create jobs, which would still be closely related to the bioeconomy. A third reason for optimism regards the country’s possibility of affecting its own future. We have observed the recent employment increase in aquaculture, a sector which, in the last decades, has been reshaped by innovation. Would other bioeconomic sectors be able to reshape themselves? The answer is yes, if an effort within those sectors is going to be taken, both in terms of investments and in terms of culture adaptation.
Agriculture in Norway has, traditionally, a specific political value, signifying and symbolising a partial independence of the country in terms of food. We wonder whether an analogous political value could, to some extent, be tributed also to other sectors of the bioeconomy. Even if less symbolic to the country, the continuity in the production of a wide range of bioeconomic products avoids an exclusive dependence on oil and gas exports, otherwise necessary for securing the import of vital bioeconomic products. Another element to consider, again with a strong political weight, is sustainability: When environmental goals also become political goals, economic policies should be carefully evaluated not only for what concerns consequences for the country but also for the whole world. Value creation in the bioeconomy could then be seen as enriched by positive externalities for the world. In particular, Norway could become an exemplary case and set a model for other countries rich in fossil resources, if the bioeconomy were fully able to exploit its strong assets in terms of biomass access, of technological capabilities and of political directionality.
The interaction between these assets has already shown its potential: The described increase in bioeconomic labour productivity has also been caused by possibilities built up through knowledge and competence development, in the involved sectors and industries, over the last decade. Science and skills are indeed decisive factors to build a knowledge-based bioeconomy which, in countries like Norway, can stretch across several economic sectors [27]. The Norwegian bioeconomy strategy pointed out that collaboration across sectors, industries and research fields is an important avenue for the further development of the bioeconomy ([28], p. 9). This includes collaboration across different value chains, the development of networks and clusters, the coordination of public support for research and innovation and improved international collaboration, either in the EU Framework programmes (FPs) or in bilateral collaboration with selected countries. An impact assessment of Norwegian participation in FP7 and H2020 shows that, in the Societal Challenges part of Horizon 2020, Norway’s participation is well above the average in projects funded on food security, sustainable agriculture and forestry, marine/maritime/inland water research, and bioeconomy ([29], p. 91). This is assessed to be a success and can also be related to the national research and innovation activities in the same field, which have contributed to the steep improvement of the labour productivity in the Norwegian bioeconomy since 2008. The Research Council of Norway and Innovation Norway have developed, over years, dedicated programmes for funding research and innovation activities, such as: The Research Programme on Sustainable Innovation in Food and Bio-based Industries (“BIONÆR”), the Programme on Aquaculture Research (“HAVBRUK”) and the Programme on Biotechnology for Innovation (“BIOTEK2021”), under the Research Council of Norway; and the “Bioeconomy” scheme, under Innovation Norway. A recently published joint action plan, for the implementation of the bioeconomy, will improve this knowledge-based and collaborative approach further in the future [30].
We also need to stress that a mental dichotomy between fossil-based sectors and bioeconomic sectors should be avoided. The competence base nurtured by fossil-based sectors is also part of the assets to leverage on, for developing the bioeconomy. For instance, the development of offshore aquaculture can benefit from the progress made in offshore oil extraction. At the same time, efforts for the evolving digitalisation of the Norwegian economy have initially been focused more on telecommunication, processing of light metals and silicon and the oil and gas sector, but they have later reached also the other parts of the Norwegian bioeconomy. Examples include automation of aquaculture, vegetable cultivation supported by robots, automated manufacturing of wooden construction materials, automated and integrated biorefineries, development of pharmaceuticals for aquaculture and automated production of microalgae. Innovations have allowed more effective and precise production, less use of harmful substances such as antibiotics in aquaculture and husbandry, and the connection of different value chains, as the example of the production of microalgae shows. A lesson we can take from this recent history is: The concept of bioeconomy must help researchers to identify synergies rather than to deepen divides between sectors.
5. Conclusions
Environmental challenges at global scale are forcing countries to re-examine their economic structure and adopt new economic concepts. The bioeconomy is a concept increasingly used to circumscribe that part of the economy which depends on the utilisation of biomass.
Our study has replicated recent analyses of the European bioeconomies, to assess the features and evolution of the Norwegian bioeconomy. Norway appears to belong to the Nordic bioeconomy cluster, in the sense that the Norwegian bioeconomy is characterised, as for other Nordic countries, by a relatively low share of workers in bioeconomic sectors and by a very high labour productivity in the same sectors. In other words, while not many workers are employed in the Norwegian bioeconomy, their socioeconomic impact is high. This is due not only to a high productivity across all bioeconomic sectors, as expected given the level of development of the Norwegian economy, but also to astonishingly high peak in productivity in fishing and aquaculture, whose value added has evolved massively during the last ten years. Moreover, as a whole, the Norwegian bioeconomy has strongly increased its productivity in recent years. Sectors connected to food and beverages, which already had a high weight within the Norwegian bioeconomy, are still increasing their contributing to the Norwegian value added; at the same time, pharmaceuticals are experiencing a dramatic shift toward bio-based production and thus contributing to qualitative changes in the Norwegian bioeconomy. We need to point out that stable measures of value added detected in some sectors, for instance, in forestry and in paper manufacturing, may hide strong internal dynamics aimed at curbing pressures from foreign competition.
Our empirical analysis has followed the footprints of recent studies by Ronzon et al. [20] and Ronzon and M’Barek [21] in considering the bioeconomy as made also of activities in secondary and tertiary sectors. The different transformation paths theorized by Dietz et al. [2] for the bioeconomy have materialised, in Norway, in different sectoral approaches to growth, characterised by upscaled biomass production for aquaculture but not, for instance, for pharmaceuticals. However, bioeconomic sectoral growth spurts can often be reconducted to advances in biotechnology, to the point that to consider biotechnology as a single sector would seem reductive; in this sense, the line taken by the European Commission [12] and, more recently, by the OECD [10], of a bioeconomy strategy encompassing many economic sectors, would not seem to downplay the role of biotechnology, but rather to recognize its “general purpose” qualities. Norway’s endowment in technology and competence is confirmed, by our analysis, to have been central for the bioeconomy, as previously suggested also by Rönnlund et al. [13]. The fact that specific bioeconomic sectors appear to be more successful than others, in exploiting such endowment, is shown but not explained by our analysis; previous studies like Hansen and Bjorkhaug [19] would however hint that openness to knowledge flows from other parts of the economy can have been a decisive factor.
Deriving from our reflections throughout the present study, we advise a further evolution of socioeconomic indicators to parallel more extensive definitions of the bioeconomy concept. Future analyses should devote attention to the construction sector, since biomass can often be incorporated in its products. Socioeconomic indicators should also account for the use of biomass as inputs for processing, even when the materials constituting the final products are not biological. Immaterial contributions to and from the bioeconomy, in terms of knowledge, could be studied to redefine the socioeconomic potential of research and professional activities. Interactions of national bioeconomies with the world bioeconomy could also be analysed further, by exploiting statistics on external trade and foreign investments. Finally, strategies could be elaborated to develop new synergies within the bioeconomy, as well as between the bioeconomy and other sectors of the economy.
Author Contributions
M.C. and A.K. conceptualised the original idea and contributed to all sections. The authors contributed equally to Section 1 and Section 5; A.K. contributed especially on Section 2.3, Section 3.1, Section 4.4 and Section 4.5; M.C. contributed especially on the remaining subsections. All authors have read and agreed to the published version of the manuscript.
Funding
This research was funded by Innovation Norway, grant number 2019/106506, in collaboration with the Research Council of Norway.
Acknowledgments
The authors would like to thank: Arne Fevolden, Marit Heller, Per Koch, Krister Moen, Trond Einar Pedersen, Vera Schwach, Lisa Scordato, Espen Solberg, Sigridur Thormodsdottir, Marit Valseth and Oskar Aalde, for useful comments and suggestions; Idiano D’Adamo and Piergiuseppe Morone, for advices about the computation and application of sectoral bioshares; Borregaard AS, Designindustrien, LMI Legemiddelindustrien, Norner AS, Norsk Industri, Norsk Komposittforbund and Teko Bransjeforening, for contributing to the interview process. The responsibility for any error and the views expressed are solely of the authors.
Conflicts of Interest
The authors declare no conflict of interest. The views expressed are those solely of the authors and should not in any circumstances be regarded as stating an official position of Innovation Norway nor of the Research Council of Norway.
Appendix A. Quantified Socioeconomic Indicators
Figure A1.
Quantified Socioeconomic Indicators of Norway’s Bioeconomy in 2017 (number of persons employed, value added and apparent labour productivity).
Figure A1.
Quantified Socioeconomic Indicators of Norway’s Bioeconomy in 2017 (number of persons employed, value added and apparent labour productivity).

Appendix B. Interview Guide
Before the interview, each expert was provided with a table showing the bioshares computed by Ronzon and M’Barek [21] for the sectors under analysis in the Nordic EU countries (Denmark, Finland, Sweden). A second table was provided containing the list of goods produced by Norway in year 2017 according to Eurostat (ProdCom database) and having, as initial digits of their CPA code, the same digits of the NACE code of the interviewee’s sectors of expertise; the function of this second table was to have a common understanding about the boundaries of the sectors in terms of goods produced.
The interviews revolved around the following main questions (original in Norwegian):
- Which economic sector do you represent?
- How long have you worked in this sector?
- What is the bioeconomic share in your economic sector, based on added value and turnover?
- How can we differentiate between different groups of products?
- How has this proportion changed over the last 10 years?
- What problems do you see in estimating this biomass?
- What differences do you see here between Norway and Denmark, Sweden and Finland?
- Are there regional differences within Norway for the bio-share in the sector you represent?
References
- United Nations. Transforming Our World: The 2030 Agenda for Sustainable Development. Policy Document. 2015. Available online: https://sustainabledevelopment.un.org/?page=view&nr=2125&type=400&menu=35 (accessed on 4 April 2020).
- Dietz, T.; Borner, J.; Forster, J.J.; von Braun, J. Governance of the Bioeconomy: A Global Comparative Study of National Bioeconomy Strategies. Sustainability 2018, 10, 3190. [Google Scholar] [CrossRef] [Green Version]
- El-Chichakli, B.; von Braun, J.; Lang, C.; Barben, D.; Philp, J. Five cornerstones of a global bioeconomy. Nature 2016, 535, 221–223. [Google Scholar] [CrossRef] [PubMed]
- Zeug, W.; Bezama, A.; Moesenfechtel, U.; Jahkel, A.; Thran, D. Stakeholders’ Interests and Perceptions of Bioeconomy Monitoring Using a Sustainable Development Goal Framework. Sustainability 2019, 11, 1511. [Google Scholar] [CrossRef] [Green Version]
- Bugge, M.; Hansen, T.; Klitkou, A. What is the bioeconomy? A review of the literature. Sustainability 2016, 8, 691. [Google Scholar] [CrossRef] [Green Version]
- Levidow, L.; Birch, K.; Papaioannou, T. Divergent Paradigms of European Agro-Food Innovation: The Knowledge-Based Bio-Economy (KBBE) as an R&D Agenda. Sci. Technol. Hum. Values 2012, 38, 94–125. [Google Scholar] [CrossRef]
- Scordato, L.; Bugge, M.M.; Fevolden, A.M. Directionality across Diversity: Governing Contending Policy Rationales in the Transition towards the Bioeconomy. Sustainability 2017, 9, 206. [Google Scholar] [CrossRef] [Green Version]
- Eriksson, D.; Brinch-Pedersen, H.; Chawade, A.; Holme, I.B.; Hvoslef-Eide, T.A.K.; Ritala, A.; Teeri, T.H.; Thorstensen, T. Scandinavian perspectives on plant gene technology: Applications, policies and progress. Physiol. Plant. 2018, 162, 219–238. [Google Scholar] [CrossRef] [PubMed]
- OECD. The Bioeconomy to 2030: Designing a Policy Agenda; OECD: Paris, France, 2009; p. 322. [Google Scholar]
- OECD. Meeting Policy Challenges for a Sustainable Bioeconomy; OECD: Paris, France, 2018; p. 195. [Google Scholar]
- European Commission. Innovating for Sustainable Growth: A Bioeconomy for Europe; Publications Office of the European Union: Luxembourg, 2012; p. 60. [CrossRef]
- European Commission. A Sustainable Bioeconomy for Europe: Strengthening The Connection Between Economy, Society and the Environment: Updated Bioeconomy Strategy; European Commission, Directorate-General for Research and Innovation: Brussels, Belgium, 2018; p. 102. [Google Scholar] [CrossRef]
- Rönnlund, I.; Pursula, T.; Bröckl, M.; Hakala, L.; Luoma, P.; Aho, M.; Pathan, A.; Pallesen, B.E. Creating Value from Bioresources: Innovation in Nordic Bioeconomy; Nordic Innovation: Oslo, Norway, 2014. [Google Scholar]
- Skjermo, J.; Forbord, S.; Solbakken, R.; Steinhoved, K.; Handå, A.; Arff, J.; Broch, O.; Reitan, K.; Carvajal, A.; Wolff, R.; et al. A New Norwegian Bioeconomy Based on Cultivation and Processing of Seaweeds: Opportunities and R&D; SINTEF: Trondheim, Norway, 2014. [Google Scholar]
- Stevant, P.; Rebours, C.; Chapman, A. Seaweed aquaculture in Norway: Recent industrial developments and future perspectives. Aquac. Int. 2017, 25, 1373–1390. [Google Scholar] [CrossRef] [Green Version]
- Sindre, G. Nominert til Landbrukets Innovasjonspris. Fjordingen (News Website). 2019. Available online: https://www.fjordingen.no/nyhende/2019/12/20/Nominert-til-Landbrukets-Innovasjonspris-20670671.ece (accessed on 3 April 2020).
- Egelyng, H.; Romsdal, A.; Hansen, H.O.; Slizyte, R.; Carvajal, A.K.; Jouvenot, L.; Hebrok, M.; Honkapaa, K.; Wold, J.P.; Seljasen, R.; et al. Cascading Norwegian co-streams for bioeconomic transition. J. Clean. Prod. 2018, 172, 3864–3873. [Google Scholar] [CrossRef] [Green Version]
- Teräs, J.; Johnsen, I.H.; Lindberg, G.; Perjo, L.; Giacometti, A. Bioeconomy in the Nordic Region: Regional Case Studies; Technical Report, NordRegio Working Paper 2014-4; NordRegio: Stockholm, Sweden, 2014. [Google Scholar]
- Hansen, L.; Bjorkhaug, H. Visions and Expectations for the Norwegian Bioeconomy. Sustainability 2017, 9, 341. [Google Scholar] [CrossRef] [Green Version]
- Ronzon, T.; Piotrowski, S.; M’Barek, R.; Carus, M. A systematic approach to understanding and quantifying the EU’s bioeconomy. Bio-Based Appl. Econ. J. 2017, 6, 1–17. [Google Scholar]
- Ronzon, T.; M’Barek, R. Socioeconomic Indicators to Monitor the EU’s Bioeconomy in Transition. Sustainability 2018, 10, 1745. [Google Scholar] [CrossRef] [Green Version]
- NHO. Mot Bioøkonomien—NHOs Innspill til et Nytt Internasjonalt og Konkurransedyktig Næringsliv; NHO Report; Næringslivets Hovedorganisasjon: Oslo, Norway, 2015. [Google Scholar]
- Falk-Andersson, J.; Forbord, M.; Vennesland, B. Mapping the Bioeconomy: Biological Resources and Production in Forestry, Agriculture, Fisheries and Aquaculture Across Norway; NORUT Report 16/2016; Norut (Norut Northern Research Institute AS): Tromsø, Norway, 2016. [Google Scholar]
- Mikkelsen, E. Value added in the Norwegian Bioeconomy; NORUT Report 8/2017; Norut (Norut Northern Research Institute AS): Tromsø, Norway, 2017. [Google Scholar]
- Laibach, N.; Börner, J.; Bröring, S. Exploring the future of the bioeconomy: An expert-based scoping study examining key enabling technology fields with potential to foster the transition toward a bio-based economy. Technol. Soc. 2019, 58, 101118. [Google Scholar] [CrossRef]
- IPBES. Report of the Plenary of the Intergovernmental Science-Policy Platform on Biodiversity and Ecosystem Services on the Work of Its Seventh Session; Unpublished Work; Intergovernmental Science-Policy Platform on Biodiversity and Ecosystem Services (IPBES): Paris, France, 2019. [Google Scholar]
- Biber-Freudenberger, L.; Basukala, A.K.; Bruckner, M.; Börner, J. Sustainability performance of national bio-economies. Sustainability 2018, 10, 2705. [Google Scholar] [CrossRef] [Green Version]
- Norwegian Government. Kjente Ressurser—Uante Muligheter: Regjeringens Bioøkonomistrategi. Policy Document. 2016. Available online: https://www.regjeringen.no/contentassets/32160cf211df4d3c8f3ab794f885d5be/nfd_biookonomi_strategi_uu.pdf (accessed on 5 March 2020).
- Tofteng, M.; Åström, T.; Bjøru, E.; Lindström, M.; Brown, N.; Spaini, C.; Peter, V.; Jallow, A.B.; Uhrwing, M.; Røtnes, R.; et al. Norway’s Participation in the EU Framework Programmes for Research and Innovation: An Impact Assessment of Participation in FP7 and H2020; Technical Report, Samfunnsøkonomisk Analyse AS Report 06-2020; Samfunnsøkonomisk Analyse AS: Oslo, Norway, 2020. [Google Scholar]
- Research Council of Norway; Innovation Norway; SIVA. Bioøkonomi—Felles Handlingsplan for Forskning og Innovasjon. Technical Report. 2020. Available online: https://www.forskningsradet.no/contentassets/0d795024392342bd947b6a2c9a60736a/biookonomi_handlingsplan_endelig.pdf (accessed on 5 April 2020).
Figure 1.
Added value in the bio-macrosectors of Norway.

Figure 2.
Added value from (bio-)wood products and furniture.

Figure 3.
Added value from bio-based chemicals, pharmaceuticals, plastics and rubber.

Figure 4.
Value added from (bio-)textiles and wearing apparel.

Figure 5.
Employment from all the bio-macrosectors of Norway.

Figure 6.
Employment from (bio-)wood products and furniture.

Figure 7.
Employment from (bio-)textile-related sectors.

Figure 8.
Employment from (bio-)chemicals, pharmaceuticals, plastic and rubber.

Figure 9.
Sectoral apparent labour productivity in Norway, 2017.

Figure 10.
Evolution of the location quotient and apparent labour productivity in the bioeconomy of Norway and of the 28 EU Member States, 2008–2015. Note that Romania is missing since it is out of scale (location quotient of 3.77).
Figure 10.
Evolution of the location quotient and apparent labour productivity in the bioeconomy of Norway and of the 28 EU Member States, 2008–2015. Note that Romania is missing since it is out of scale (location quotient of 3.77).

Figure 11.
Evolution of employment and value added in the Norwegian bioeconomy.

© 2020 by the authors. Licensee MDPI, Basel, Switzerland. This article is an open access article distributed under the terms and conditions of the Creative Commons Attribution (CC BY) license (http://creativecommons.org/licenses/by/4.0/).
Share and Cite
MDPI and ACS Style
Capasso, M.; Klitkou, A. Socioeconomic Indicators to Monitor Norway’s Bioeconomy in Transition. Sustainability 2020, 12, 3173. https://0-doi-org.brum.beds.ac.uk/10.3390/su12083173
AMA Style
Capasso M, Klitkou A. Socioeconomic Indicators to Monitor Norway’s Bioeconomy in Transition. Sustainability. 2020; 12(8):3173. https://0-doi-org.brum.beds.ac.uk/10.3390/su12083173
Chicago/Turabian StyleCapasso, Marco, and Antje Klitkou. 2020. "Socioeconomic Indicators to Monitor Norway’s Bioeconomy in Transition" Sustainability 12, no. 8: 3173. https://0-doi-org.brum.beds.ac.uk/10.3390/su12083173
Note that from the first issue of 2016, this journal uses article numbers instead of page numbers. See further details here.