Human Capital Approach in the Economic Assessment of Interventions for the Reduction of Seismic Vulnerability in Historic Centres


Department of Civil Engineering and Architecture, University of Catania, 95124 Catania, Italy
Sustainability 2020, 12(19), 8059; https://0-doi-org.brum.beds.ac.uk/10.3390/su12198059
Submission received: 20 August 2020
/
Revised: 21 September 2020
/
Accepted: 27 September 2020
/
Published: 29 September 2020
(This article belongs to the Section Sustainability in Geographic Science)
Abstract
:The economic evaluation of the interventions aimed at reducing the seismic risk in the historic centres starting from a minimum risk scenario established by law, namely that provided by the Emergency Limit Condition (ELC), and aimed at supporting efficient and effective choices by the public decision-maker pursuing objectives of equity and social well-being, displaying a multidimensional nature. As a result, the evaluation process should integrate more approaches to quantify the different forms of capital involved. The seismic event can pose risks to an individual’s survival or reduce the quality of life. The assessment of the effects of the potential seismic vulnerability reduction plan on the population can be determined on the basis of the value of a statistical life (VSL). Among the possible approaches for its determination, that of the human capital (HC) was chosen for use. A critical review of the HC approach literature has been instrumental in defining an empirical approach that integrates the income-based approach proposed by Jorgenson–Fraumeni for market and non-market assets as well as the approach of Dagum. On the basis of this, the value of the HC for the historic centre of Brisighella was determined. The empirical approach also supported the definition of a model for the quantification of the benefits produced on the population by the plan of interventions to reduce the seismic vulnerability of the historic centre.
1. Introduction
This contribution is the first step of a second part of a larger project aimed at forming a general model of analysis, evaluation, and planning of conservation interventions in the historic city and reduction of seismic vulnerability in the historic city [1,2,3,4,5,6].
In the framework of an approach to urban planning in which the historic centres are recognized as terms of uniqueness and identity, not only cultural but also economic, interventions aimed at promoting the reduction of the seismic vulnerability of the building fabric are instrumental to increase the resilience of the entire urban organism and must be identified on the basis of choices that involve the territorial capital in general and specifically urban and human capital [7,8].
Based on the results of the first phase aimed at the formation of a generative model of vulnerability reduction interventions, the second phase aimed at sizing the area of intervention and maximizing a multi-function objective, which includes the main value terms for urban and human capital [9,10]. The first values include architectural and real estate values [11,12,13], while the second is the value of life that can be linked to the prediction of the damage avoided by people depending on the extent of the protected area using a specific probability coefficient.
The second phase of this research was divided into two steps, the first relating to the quantification of the value of life on the basis of the value of human capital and the second involving constructing a model aimed at identifying a function for calculating the benefits associated with vulnerability reduction.
In the final phase of the research, the comparison between benefits and costs allows one to determine the extent of the interventions and the type of interventions that maximize the difference.
In particular, the theme addressed in this paper is that of determining the value of statistical life (VSL) on the basis of the value of human capital (HC).
Calculating the value of statistical life is a commonly used methodology for the monetary assessment of the risk of mortality from road accidents, which has since been widely used in the estimation of pollution mortality. The calculation is performed on the basis of future productivity failure, usually measured in terms of GDP or by the preferences of individuals (willingness to pay) related to risk reduction, which is normally accidental.
In considering future productivity failure (the so-called human capital approach), the loss of wealth by society as a result of the loss of human resources is considered, attributing an economic loss to the community equal to the value of output (gross or net) which would have been produced by the individual had he not died.
The economic concept of human capital has existed since at least the eighteenth century, as it was already present in the studies of the Scottish economist Adam Smith, but it only became important in the late 1950s and 1960s.
In fact, the birth of the human capital theory coincided with the publication of Theodore Schultz in the Journal of Political Economy of his supplementary volume “Investments in human beings” of October 1962 [14].
This volume included, among other pioneering documents, the preliminary chapters of the 1964 monograph on human capital by Gary Becker, which has since served as the locus classicus of the topic [15].
In this volume, Schultz identified human capital as one of the important factors for national economic growth in a modern economy.
With the emergence and the development of human capital as an academic field, some researchers have attempted to clarify how human capital could contribute to socio-political development and freedom [16,17,18].
Based on the different contributions of the researchers, the concept of human capital can be classified according to three different perspectives.
The first point of view is based on individual aspects.
Starting from Schultz [19] who, in contrast to the concept of workforce in the classical perspective, recognized human capital as “something similar to property”, going so far as to conceptualize “the productive capacity of human beings now enormously greater than all the others. forms of wealth collected together”, the researchers identified human capital as knowledge and skills, education and abilities [20,21], knowledge, competency, attitude and behaviour [22], and knowledge and skills embedded in an individual [23].
The second point of view focuses on human capital and its accumulation process. In this perspective, human capital is closely connected to the knowledge and the skills acquired during educational activities such as compulsory education, post-secondary education, and professional education [24,25]. This perspective, despite offering an extension of the concept, neglects the knowledge and the skills that the human being will acquire in the course of his experience.
The third point of view is closely linked to the production-oriented perspective of human capital. For example, in this framework, Romer [26,27,28,29] considers human capital as “a fundamental source of economic productivity”; Rosen [30] as “an investment that the people make in themselves to increase their productivity”; Frank and Bemanke [31] as “an amalgam of factors such as education, experience, training, intelligence, energy, work habits, trustworthiness and initiative that affect the value of a worker’s capital marginal product”; Sheffin [32] as “the stock of skills, knowledge embodied in the ability to perform labour so as to produce the economic value”; and Rodriguez and Loomis [33] as “knowledge, skills, competencies and attributes in individual that the facilitate the creation of persona, social and economic well-begin” with the social perspective.
In summary, according to the three different perspectives, human capital simultaneously includes both instrumental concepts to produce certain values and the “endogenous” meaning of self-generating it. In defining the concept of human capital, the creation of these values in a dependent/independent way is closely linked to education and training. Furthermore, given that experience can be considered a category of knowledge, then human capital can identify itself as a synonym of knowledge incorporated in individuals.
The objective of this study was to determine the value of a statistical life on the basis of the human capital approach, instrumental for the quantification of benefits/revenues in the framework of the effects on the population from the potential plan of interventions to reduce the seismic vulnerability of historic centres.
The purpose of determining the VSL is to measure the economic value associated with risk reduction, which can support the choice of interventions that maximise its value from a minimum scenario, as set in the context of the Emergency Limit Condition (ELC), with the possibility of identifying scenarios with higher performance in terms of risk reduction that can be supported by the system of individual preferences and aimed at generally maximizing the share capital in different territorial contexts [34,35,36,37].
This approach was implemented in the case study of the municipality of Brisighella that is part of the Union of Romagna Faentina, which approved the ELC that formed the basis for the urban and construction regulation (UCR).
Section 2 presents a brief overview of the approaches to calculating the VSL and a deepening for its estimate on the basis of human capital. This section presents: a review of the concept, the methodological approaches, and the calculation procedures for the estimation of human capital; an empirical approach identified from a critical review of the literature on HC approaches; and a model for the quantification of the benefits produced on the population by the plan of interventions to reduce the seismic vulnerability of the historic centre. Section 3 introduces the case study of the historic centre of Brisighella. Section 4 reports and discusses the results. Section 5 proposes some reflections on the approach used to estimate the value of human capital to support the identification of the benefits of interventions to reduce seismic risk in the historic centre of Brisighella, proposes a synthesis of the results, and identifies the lines of future development of this research. Appendix A and Appendix B propose a deeper estimation of the human capital component related to non-market activities (namely, household production and use of leisure time) by the Jorgenson–Fraumeni approach.
2. Methods
The purpose of the economic assessment of human life is not, of course, to establish monetary compensatory measures, since compensatory measures would in any event be inappropriate, nor is it to give any indication of absolute value, which has rather its own utility in bringing back to a generally recognized benchmark the priority implicitly given in our social context at risk to life and health. It is, therefore, more appropriate to recognize an economic value in the possibility of survival or prolongation of the expected life or to the maintenance of a certain level of quality of life. The economic evaluation of human life is, therefore, an instrument of rational control with which the public decision-maker [38,39,40], entrusted with the role of guardian of the interests of the community, is able to promote decision making and, above all, the quality of public decisions that pursue the objectives of equity and social well-being (Figure 1). The change in the probability of survival of an individual or in the quality of life has serious consequences for economic and emotional situations, not only to the individual and his family members but also to the community.
Costs attributable to a person’s lower probability of survival or a deterioration in the level of quality of life may be particularly considered not only as direct losses resulting from future deaths (e.g., possible hospital costs or loss of production) but also as indirect costs and costs of an affective nature [41] normally generated by biological and moral damage suffered by the individual and the family members of the victim:
- losses of future production, which in addition to the individual have a direct impact on society;
- state of suffering and difficulty of adaptation for family members following premature death (moral harm);
- state of suffering caused by sickness or sickness preceding death, irrespective of the loss of income (biological damage).
A critical point concerns, however, the characteristics of the procedure by which an economic value is attributed to human life, distinguishing between the statistical life method (VSL) and, from this derivative, the method of valuation of the lost years of life (value of life years (VOLY)).
An alternative and innovative method to these two approaches, although it has thus far been used mainly in Canadian studies, is the Life Quality Index (LQI) method, which represents a combined social indicator for the assessment of life, also considered from the point of view of quality. This indicator includes both measures of real gross domestic product per capita as an index of resources and quality of life and measures related to life expectancy as a valid indication of social development, environmental quality, and the public health of a country.
The calculation of statistical life is a commonly used methodology for the monetary assessment of the risk of mortality from road accidents [42], which has recently been included in the estimate of pollution mortality and can be used for the monetary assessment of the risk of natural disasters on the population.
In considering the future lack of productivity (the so called human capital approach), the loss of wealth by society is considered as a result of the loss of human resources, attributing an economic loss to the community equal to the value of output (gross or net) which would have been produced by the individual had he not died or if he had not reduced his productive capacity related to the occurrence of a specific event. The willingness to pay (WTP) approach takes into account individual preferences by taking the individual’s point of view.
This method is based on the estimation of how many (and how much) individuals are willing to pay for improved health or protection from exposure to natural disasters compared to other alternatives [43].
According to this approach, the VSL is calculated on the economic value that the individual attributes to the probability of a reduction in the risk of death or a reduction in the quality of life.
2.1. Human Capital
There are different definitions of the concept of human capital that differ mostly in the nature of what is measured and in their scope. This theme was originally developed in economic studies with exclusively technical aims and was subsequently extended to the assessment of a country’s well-being and to actions implemented on the basis of national policies. The concept was introduced by the economists at the end of the seventeenth century. William Petty was the first to promote men’s ability to work, understood as an ability to create wealth as a factor relevant to the assessment of a nation’s wealth [44]. Later, Adam Smith introduced the concept of human capital into his work, “The Wealth of Nations” [45]. In this work, proposing an analogy between men and machines for production, he wanted to point out that the rearing of men as well as the production of machines (fixed capital) require the use of economic resources and, therefore, as such, it shall be taken into account in the calculation of national wealth.
Later, other economists recalled this concept: Engel promoted an approach aimed at determining the economic value of man on the basis of rearing costs from birth [46]; Marshall started from the claim that “most valuable of all capital is that invested in human beings” [47] and came to define human capital as the whole that includes energies, faculties, and habits that contribute directly to the productive efficiency of men; Gini argued that human capital was an important factor for national wealth [48,49]; Pareto argued that much of the wealth possessed by American citizens between the two world wars stemmed from savings accumulated through the immigration of labour since the beginning of the nineteenth century [50]. The concept of human capital, although it was presented by various authors, until the middle of the 1900s was never developed within a solid theoretical structure [51].
Later, the contributions of Jacob Mincer [52], Theodore Schultz [53], and Gary Becker [54], favoured by the stimulating research climate of the University of Chicago, developed an economics theory on human capital. This theory focused mainly on years of schooling and professional experience in work as explanatory factors. The development of this theory in this first phase did not produce an estimate of human capital for a set of economic units.
Before the contribution of the Chicago School, most economists, while arguing that acquired skills and education contribute to determining the amount of human capital, never accepted, in principle, the fact that human beings can be considered, from an economic point of view, as capital. Until that time, many economists had shown a certain reluctance to consider human beings as capital, appealing to ethical questions often not well defined.
Despite this, many scholars proposed numerous theoretical models [55,56,57,58,59,60] that, through empirical verification, led to the identification of the factors that influence the productivity increase of economic systems.
In particular, these studies showed that investment in human capital was one of the main factors on which national income growth rates depend.
Some theories on human capital, developed in the twentieth century, were aimed at assessing its impact on economic development at a macro level to explain the reasons for the variability of wages and the different success in the world of work as well as to identify and specify the type of skills acquired which increase human capital [61].
From an economic point of view, human capital acts on development because it increases productivity, even if investments in human capital in areas such as health, crime, participation, and social cohesion have, in some cases, led to greater social impacts than those in economic terms.
In this context, the European Commission points to human capital as the productivity potential of an individual which should also include health as well as education, professional experience, and skills, because all these elements determine the productivity of the workforce [62].
A definition widely shared internationally is that provided by the OECD (Organization for Economic Co-operation and Development), which considers human capital “the knowledge, skills, competences and attributes embodied of individuals that facilitate the creation of personal, social and economic well-being” [63,64].
Although human capital is strongly influenced by innate individual abilities (such as genetic ability or factors acquired from the first years of life in the family and social environment), it is producible and accumulative [65].
Human capital can be accumulated and increased through formal forms of learning such as education and vocational training and through non-formal forms of learning such as the family, the work environment, and social and civil networks.
Therefore, the learning function that is the basis for the accumulation of human capital is activated and has a greater concentration in the youth phases but exercises its action throughout the life of the individual.
The accumulation process determines costs (monetary and non-monetary) which are incurred at an individual level (for example, the costs of rearing or the time that parents devote to their children) or a social level (for example, the costs of building schools). Social costs represent the investments that the community supports for future development and aim at improving the quality of life.
With this in mind, human capital, given that a society’s ability to produce goods and services to meet its needs depends on quantity, quality, and combination of available resources, can be considered an economic resource as well as environmental and fixed capital.
The sustainable development of a country in the medium to long term can only be pursued through the conservation or the replacement of the stock of physical, natural, human, and social capital [66], especially in Western economies, which are increasingly based on the knowledge and the production of intangible goods and services. Based on a greater awareness of the importance of human capital in the pursuit of sustainable economic and social development, international institutions and organisations have highlighted the need to identify a statistical measure of this aggregate, especially in the national accounts [67,68,69,70,71,72,73,74].
2.2. Human Capital Measurement Approaches
The centrality of the theme of human capital in the economic debate has promoted the identification of instrumental indicators to measure its stock in each country. The absence of a shared theoretical framework and standard definitions has resulted in a fragmented identification of the factors explaining the contribution of human capital to the development of countries [75].
Research aimed at identifying a human capital stock measurement converges on four approaches:
- Education-based approach (based on the education performance): measures the human capital based on educational performance indicators (total number of years of schooling of the labour force; number of educational infrastructures; ratio of public expenditure on training to GDP; public expenditure on education per head, teacher/student ratio [82,83,84,85,86], school enrolment [87,88,89], literacy rate of adults [90], average schooling of workers [91,92,93], and number of individuals involved in the economic process with a certain amount of school years [94];
- Knowledge-based approach (based on the cognitive skills of students): measures the human capital on the basis of the quality of education in terms of cognitive skills learned and developed, for example, the level of learning of mathematics or sciences [86].
2.3. The Jorgenson–Fraumeni Approach
In 2009, OECD promoted the OECD Human Capital Project involving a consortium of 17 countries (Italy, Australia, Canada, Denmark, France, Japan, Korea, Mexico, Netherlands, Norway, New Zealand, Poland, Spain, United Kingdom, United States, Romania, and Russia) by Eurostat and the International Labour Office with a view of achieving a monetary measure of human capital consistent both with economic theory and with the fundamental principles of national accounting. This project adopted the Jorgenson–Fraumeni approach [95] as the sole methodological basis in order to facilitate a comparison of the human capital stock between the countries involved. Jorgenson–Fraumeni’s approach of working income in the life cycle applies the neoclassical theory of investment [96] to human capital. According to this extension, the value of an individual’s human capital can be determined by the discounted income over his or her life cycle.
The estimation methodology takes into account the present value of long life income while taking into account possible changes in remuneration (also due to experience), additional education that can be acquired, differential patterns of labour force participation, and mortality. In determining life cycle income, Jorgenson and Fraumeni apply their methodology to both market and non-market activities.
2.3.1. The Jorgenson–Fraumeni Approach for Estimating Human Capital from Market Assets
In the case of the OECD Human Capital Project, the calculations relate to the active population (15–64 years) and activities within the central framework of the System of National Economic Accounts, thus giving rise to estimates relating to the measurement of only human capital employed in market activities.
In this project, lifetime labour income is determined for the three phases in which it subdivides the life cycle of an individual in working age (15–64 years), namely: Phase I—Study and work (15–40 years); Phase II—Work only (41–64 years); Phase III—Pension only (65 and over).
- For individuals between 15 and 40 years of age (Phase I) who are confronted each year with the possibility of completing their studies or starting to work, the lifetime labour income estimate distinctly includes the two different cases; it is based on the following formula:
is the discounted value of lifetime labour income for individuals with “edu” level of education (International Standard Classification for Education of 1997-ISCED 1, 2, etc.) at age “age” (64 years, 63 years, etc.), given by the sum of income from current work and that expected for the rest of life (the latter is based on the incomes observed in a cohort of contemporary individuals);
is the employment rate of people with “edu” level of education at age “age”;
is the current work income of people with “edu” level of education at age “age”;
is the probability of surviving one more year (up to age+1);
is the discounted value of lifetime labour income of contemporary individuals with the same “edu” level of education (for the different levels of ISCED 1997-International Standard Classification for Education of 1997) and one more year of age (age + 1 = 65 years, 64 years, etc); the value in question is set at zero per age = 64 in view of the fact that contemporary 65 year olds are in the last year of working age;
is the annual growth rate of labour income in the future (in real terms) of a person with those specific characteristics;
is the annual discount rate;
is the level of education of people with “edu” level of education (ISCED−1997) at age (40, 39, etc.) studying to reach the “edu” level of higher education (ISCED 2, 3, etc.);
is the length of the course of study required for individuals with “edu” level of education (ISCED 1, 2, etc.) to attain “edu” level of higher education (ISCED 2, 3, etc.).
Individuals during the observation year can perform two types of activities (work and study) that determine different lifetime income levels.
They can continue to work (keeping their level of education) and thus earn income with probability ;
or they can study at higher education level and receive an income of with probability .
- For individuals aged between 41 and 64 (Phase II), the calculation of lifetime labour income is based on the following formula:
To calculate the value of the human capital stock, the estimated lifetime income measures per capita for each category of individuals (by age and level of education as well as by gender) by means of the expressions described above, which must be multiplied by the number of persons of all ages, genders, and educational qualifications.
2.3.2. The Value of the Total Human Capital Stock Estimated by ISTAT in Relation to Market Assets
The value of the total human capital stock, estimated by ISTAT (Italian National Statistics Institute) on the basis of the Jorgenson–Fraumeni approach, is around EUR 13,475 billion. Transforming this value in terms of per capita, it would result that the human capital of each Italian is worth about 342 thousand euros. The calculation shows a strong gender difference, in particular, the human capital per capita for men is 453,000 euros and that for women is 231,000 euros (Table 1).
2.3.3. The Jorgenson–Fraumeni Approach for Estimating Human Capital from Non-Market Assets
In general, Jorgenson–Fraumeni proposes a monetary valuation method also for non-market assets, extending the lifetime income approach to them. On the basis of this approach, the non-market component of human capital is calculated on the basis of a projection of future events, assessed in probabilistic terms over the lifetime of an average individual.
For the estimation of the human capital component associated with non-market assets, since there is no monetary consideration for them, a notional or an imputed value should be determined. A measure of the output produced can be obtained by applying a (imputed) salary/salary to the volume of work done. There are two measurement methods in the economic literature to determine the (imputed) salary/salary from non-market activities:
- opportunity cost method;
- replacement cost method.
The opportunity cost method is based on the assumption that time spent on unpaid work is a cost, as it reduces time spent on paid work [98]. The opportunity cost method gives a non-market hour of work a value equal to the net market hourly wage (average wage).
The replacement cost method, on the other hand, is based on the assumption that the imputed value to be attributed to the own reproduction of a service may be derived from the actual market wage required for the same service. An hour of work devoted to the production of a service within the household is assessed by the average salary of those who could carry out this same activity for a fee on the market.
In particular, non-market activities, considered in the calculation of human capital, are the use of leisure time and household production.
Fraumeni [99] argues that leisure activities contribute to the accumulation of human capital value and that the productivity of human capital increases as a result of leisure time spent replacing time spent at work. For the purpose of determining the value of leisure time, the opportunity cost method should be used, since there is no market replacement value for leisure time and the replacement cost method for the calculation of household production.
- Non-market activities—use of leisure time:
A definition widely present in the literature for leisure time is that proposed by Rescini [100]. He defines the free space as “the life time complementary to that devoted to the job of which the individual can dispose with discretion of choice in a more or less active way for creative or recreational purposes”.
The work conducted by the OECD [101] considers the following types of leisure activities: (1) multimedia entertainment at home (TV or radio); (2) other leisure activities (various hobbies, telephone conversations, internet use); (3) frequenting friends; (4) active participation in social events (concerts, cinemas, museums, etc.); (5) sports activities.
ISTAT has identified the average time devoted to leisure by the Italian population aged 15–64 years as about four and a half hours, with about one hour more for men than women.
To determine the monetary value of time use, imputed income is recorded using different methods for employed and non-employed persons (Appendix A).
- 2.
- Non-market activities—household production:
In the case of the determination of the value of household production activities to the quantities of time used, estimated imputed incomes are applied using the replacement cost method (Appendix B).
2.3.4. The Value of the Total Human Capital Stock Estimated by ISTAT in Relation to Non-Market Assets
The value of the total human capital stock in relation to non-market assets, estimated by ISTAT on the basis of the Jorgenson–Fraumeni approach, is around EUR 16,053 billion. Transforming this value in terms of per capita, it would result that the human capital of each Italian is worth about 401,000 euros. The calculation shows a strong gender difference, in particular, the human capital per capita for men is 384,000 euros and that for women is 431,000 euros (Table 2).
2.4. Dagum’s Approach to Human Capital
Camillo Dagum proposed the theoretical formulation of an economic system in which human capital becomes a pivotal element for the explanation of income and wealth of economic units (families or individuals) [102].
In particular, a causal model is formulated for the explanation of the vector of quantity , where is the gross wealth of households, is the total debt of households, is the human capital held by households, and is the total income [103,104].
The approach aims to estimate human capital on each economic unit but also to integrate this economic concept within a system of relationships in order to explain the factors that determine the amount, the accumulation, and the distribution of all economic variables at stake.
From a statistical point of view, human capital is regarded as an unobservable (latent) variable whose monetary value can be deduced by means of economic-social indicators.
In order to study the amount, the formation, the accumulation, and the distribution of human capital as an unobservable variable, it is necessary to identify a set of indicators that admit human capital as an endogenous variable, that is, its determining factors [105].
The problem here is the choice of the variables which influence the formation of and, above all, the formulation of an econometric system which binds together the variables of interest, in particular, human capital, income, and wealth [106].
In particular, in order to arrive at the measurement of human capital, a series of relationships between predetermined variables (strictly exogenous) and endogenous variables (to which , , , belong) must be specified.
In the case of the US Federal Reserve Board survey on income and wealth held by US households for the implementation of this approach, the following variables have been used in which H refers to the head of household (as the major income earner) and S to the other spouse [107].
- predetermined exogenous variables: ; ; ; ; ; ; .
- endogenous variables: ; ; ; ; ; ; ; ; ; ; ; ; ; ; ; .
The model is defined by a system of 17 mutually and linearly independent equations (a recursive model) where each endogenous variable is a function of the exogenous variables and the previous endogenous, which in turn are explained in the previous equations.
Thus, in each equation, we can explain a single endogenous variable through predetermined variables or other endogenous variables and so on up to the first equation.
In particular, the equation for h shows that human capital levels are a function of a number of indicators, including gross family wealth (real and financial assets) and total household debt (financial liabilities to banks, households, etc.).
One of the major consequences of this recursive model is that human capital is an explanatory variable of the income of each individual. In fact, the last equation, defined as income generating function (FGR), shows that, from the bivariate distribution of wealth and human capital, the univariate distribution of income shows that income is ultimately expressed as a function of wealth and human capital held by economic units, consistent with the assumptions of economic theory, e.g., the direct positive relationship between income and capital and between income and total wealth.
The proposed model was applied to estimate the human capital of American families which, in line with economic assumptions, allows one to quantify the human capital of families (generalizable to a context of individuals) as a multidimensional latent construct generated by investment in education (and training received directly at work) and leading to an increase in working capacity, measurable by an increase in perceived income, and the wealth accumulated by the individual in the life cycle.
2.5. Empirical Approach to Determining the Value of Brisghella’s Human Capital
The income-based approach proposed by Jorgenson and Fraumeni is based on the ability of human capital to generate income. In this context, the determination of lifetime labour income for the three phases in which it subdivides the life cycle of an individual in working age (15–64 years) may be used for the determination of the value of human capital for the different activities carried out by individuals, whether they fall into market or non-market categories. In this approach, human capital is valued on the basis of its ability to produce income for the various activities carried out.
Such an approach, however, is not able alone to enhance the component of human capital connected to its ability to accumulate wealth and/or heritage highlighted in the generating function of the approach of Dagum.
Among the forms of wealth that best express the function of human capital as an accumulator of wealth, certainly real estate as a form of wealth deposited can highlight this attitude.
In this context, the choice of interventions to reduce seismic vulnerability become important factors for the preservation of the level of human capital incorporated in the real estate with reference to a minimum scenario, namely, the one set by the Limit Condition for Emergency (CLE) and for the enhancement of the same in scenarios with higher performance in terms of risk reduction. In this regard, the two components of human capital calculated with the approach of Jorgenson and Fraumeni and related to income have to be integrated with a third component related to real estate asset and household debt.
In this regard, an empirical approach is proposed for the determination of human capital according to the following scheme:
- Jorgenson–Fraumeni (J–F) approach for estimating human capital from market assets;
- Jorgenson–Fraumeni approach for estimating human capital from non-market assets;
- empirical relationship between human capital and real estate as a form of wealth deposited on the basis of the Dagum approach.
is the value of HC for the i-th individual belonging to the j-th age group, with for the three phases in which it subdivides the life cycle, at the time; is the value of human capital determined according to the J–F approach for market assets for the i-th individual belonging to the j-th age group, with for the three phases in which it subdivides the life cycle, at time t; is the value of human capital determined according to the J–F approach for non-market assets for the i-th individual belonging to the j-th age group, with for the three phases in which it subdivides the life cycle, at the time; is the value of human capital related to its ability to accumulate wealth for the i-thindividual belonging to the age group, with for the three phases in which it subdivides the life cycle, at time .
is the value of human capital related to its ability to accumulate wealth for the i-th individual belonging to the j-th age group, with for the three phases in which it subdivides the life cycle, at time ; is the i-th individual debt (household debit) for the acquisition of real estate belonging to the age range for the three phases in which it subdivides the life cycle at time .
2.6. The Quantification of the Effects of Seismic Risk Reduction Interventions on Brisighella’s Human Capital
The first part of this study proposed the Cost-Based Programming Model for the reduction of the seismic vulnerability of the centre of Brisighella. The model was built on the basis of structural, material, geometric, technological, typological, and maintenance characteristics of the old town units. The different units identified were: a measure of the vulnerability of the building units as a tendency to overturn the interfering facade units; interventions corresponding to each degree of vulnerability; costs for the interventions for each of the facade units facing the public areas; different intensity and size of the interventions; mapped interventions corresponding to each combination of intensity and extent of the interventions; total cost for each hypothesis defining the trade-off functions between intensity and extension of the interventions and the functions of allocation of the budget on the basis of the strategic objectives. The research involved the disciplines of restoration, urban planning, and economic evaluation. In particular, 36 types of seismic risk reduction interventions and different combinations of interventions aimed at reducing the different degrees of seismic vulnerability have been identified [1].
To the different degrees of seismic vulnerability identified, it is possible to associate a specific coefficient (qualifier, indicating the extent of a health level) that takes into account the International Classification of Functioning, Disability and Health (ICF) introduced by the 54th World Health Assembly on 22 May 2001 (resolution WHA54.21) [108]. The ICF is a classification of human functioning and disability. It systematically groups together health and related domains. The ICF offers operational definitions of health domains and related domains as opposed to «current» health definitions. The ICF uses an alphanumeric system in which the letters b (body), s (structure), d (domain), and e (environment) denote: Body Functions, Body Structures, Activity and Participation, and Environmental Factors [108]. All three components classified in the ICF (Body Functions and Structures, Activity and Participation, and Environmental Factors) are quantified using the same scale: xxx.0 NO problem (absent, negligible,...) 0–4%; xxx.1 mild problem (light, small,...) 5–24%; xxx.2 AVERAGE problem (moderate, moderate,...) 25–49%; xxx.3 SEVERE problem (noticeable, extreme,...) 50–95%; xxx.4 COMPLETE problem (total,...) 96–100%.
To the different degrees of seismic vulnerability identified, it is possible to associate a specific coefficient (qualifier, which indicates the classes and the level of damage associated with the specific degrees of vulnerability) for the building stock. The different seismic vulnerabilities can be compensated by the different combination of seismic risk reduction interventions.
As part of the definition of a measure representing the variation of HC related to seismic reduction interventions, the following function is proposed:
where:
is the human capital variation for the j-th age group, with for the three phases in which it subdivides the life cycle, at the time ; is the probability of occurrence of the seismic event;
is a qualifier associated with the three health classes and related domains (k = 1,2,3), for level l of the qualifier for the seismic risk reduction intervention class defined on the basis of the vulnerability detected for the j-th age group, with for the three phases in which it subdivides the life cycle, at the time ;
is the estimated value of HC related to market and non-market assets for the j-th age group, with for the three phases in which it subdivides the life cycle, at the time ;
is a qualifier associated with classes and level of damage related to a specific level of seismic vulnerability, compensated by an combination of seismic reduction interventions detected for the j-th age group, with for the three phases in which it subdivides the life cycle, at the time ;
is the estimated value of HC related to real estate assets for the j-th age group, with for the three phases in which it subdivides the life cycle, at the time .
2.7. Data Sources
The data used to determine the value of human capital for the historic centre of Brisighella are as follows:
- ISTAT database: total population of males and females; families, level of education, vocational status of total males and females; dwellings;
- Database Comuni-italiani.it: http://www.comuni-italiani.it/:income;
- ISTAT value of UC for market and non-market assets with the approach of J-F [97];
- Observatory of the Italian Property Market of the National Revenue Agency;
3. Materials
3.1. The Historic Centre of Brisighella
Brisighella is an Italian town of 7426 inhabitants in the province of Ravenna, located 115 m a.s.l. in the lower Lamone Valley on the slopes of the Tuscan-Romagna Apennines.
It is part of the Union of Romagna Faentina, a union of municipalities formed on 1 January 2012 which includes the municipalities of Faenza, Castel Bolognese, Solarolo, Brisighella, Casola Valsenio, and Riolo Terme, all in the territory of the province of Ravenna in which they constitute the south western portion.
The Union of Romagna Faentina was formed following the accession of the municipalities of Faenza, Castel Bolognese, and Solarolo to the pre-existing union of the municipalities of Brisighella, Casola Valsenio, and Riolo Terme, formed in 2009 following the suppression of the Mountain Community of the Faenza Apennines.
Since 2010, the six municipalities of the Union of Romagna Faentina (Brisighella, Casola Valsenio, Castel Bolognese, Faenza, Riolo Terme, and Solarolo) have worked together and have been equipped with the tools of a planning unit set with a supra-municipal dimension. The Associated Municipal Structural Plan (AMSP) outlines the strategic choices of planning, development, and protection of physical and environmental integrity and cultural identity of the territory of the Union.
Its editorial staff has represented in the last decade an unprecedented opportunity to ensure the convergence of urban policies to Romagna Faentina, previously addressed at the scale of individual municipalities, based on an organic and innovative vision of the territory, with urban strategies aimed at elevating the well-being of the community.
The Union of Romagna Faentina covers an area of 597.58 kmq, with a population density of 148.4 inhabitants per kmq. The mountain area represents 33.7% of the total, with a population of 88,662 (as of 2019).
This territory is characterized by the richness of cultural, environmental, landscape, and food and wine resources, the system of medieval villages, the Valle del Lamone, the Vena del Gesso Romagnola Regional Park, the Giardino delle Erbe di Casola Valsenio, the Apennines footpath, the oil and wine, and the ceramics of Faezana. In 2016, the karst area of Emilia Romagna was nominated for the World Heritage List.
While this territory is rich in cultural, environmental, and landscape resources, it is characterized by an old age index of 189, which is slightly higher than the regional average (182.4) and a negative demographic balance (−213 inhabitants with reference to 2018) in contrast to the positive regional-scale figure.
Demographic data show a trend towards depopulation, particularly in hilly and mountainous areas, especially among young people; this trend, together with the progressive ageing of the population and the low ratio of births to the total population—confirmed by a negative demographic balance—could have a negative impact on the territory’s growth potential.
The Strategic Plan 2030, “a territory without barriers, without peripheries” approved by Council Resolution no. 22 of 17 July 2020, provides for this area a series of measures aimed at the protection and the enhancement of the territory to favour the permanence of the local populations on the territory, to facilitate accessibility, and to reverse the demographic negative trends in order to contrast the marginalization of some areas of the territory.
The historical centres of the municipalities of the Faentine Union (Brisighella, Casola Valsenio, Castel Bolognese, Faenza, Riolo Terme, and Solarolo) represent an important component of the landscape of the Tuscan-Emilian Apennines, which can be identified as the nodes on the basis of which to interconnect territorial resources in order to promote a coordinated development in contrast with demographic dynamics.
They are, however, also the most vulnerable resources in exposure to seismic events. The area, although not directly affected, was impacted by the earthquake of Emilia in 2012 (25–27 January, with magnitude 6.1; 20 May 2012, with magnitude 6.1; 29 May 2012, with magnitude 5.9; 31 May 2012, with magnitude 4.9; 3 June 2012, with magnitude 5.1). Actions to protect the territory in general and the historic centres in particular, in this context, are identified as the preconditions for the development of this territory. A lack of protection of these areas already at risk of marginalisation in relation to the trends denied to the population risks aggravating this condition, condemning them to total abandonment and the impossibility of expressing an adequate level of competitiveness.
In particular, Brisighella, characterized by the ancient medieval village, is part of the list of the most beautiful villages in Italy.
The village is characterized by three rocky pinnacles (the “Tre Colli”), on which rest the Manfredian fortress (XIV century), the sanctuary of Monticino (XVIII century), and the clock tower, rebuilt in the nineteenth century on the ruins of a pre-existing defensive settlement of the twelfth century. The origins of the village date back to the end of the thirteenth century, when the leader Maghinardo Pagani built, on one of the three rocks of selenite, what became the most important stronghold of the Lamone valley.
In 1310, Francesco Manfredi, the first lord of Faenza, erected on another rock spike the fortress of Brisighella, completed by the Venetians in 1508 with the highest tower connected to the walls. Between 1356 and 1376, it was under the direct control of the Papal States and then returned to the domain of Manfredi. During this period, the Via del Borgo was built, also known as Via degli Asini, whose name derives from the use of the caravans of animals used to transport the material from the nearby gypsum quarries.
It is an evocative road, almost entirely covered by arches of different widths and resting on a wide rock base, and built for defensive purposes, which developed a compact row of houses to protect the south side of the village. Only at a later time was the hoof excavated to obtain stables, backdrops, and shops, thus transforming the porch into an elevated one. After a brief period of Venetian rule, from 1509, Brisighella returned to the Papal States.
Towards the end of the sixteenth century, the town began to extend beyond the walls. A suburb was born, which then became the centre of urban development between the seventeenth and the nineteenth centuries. Brisighella was struck by destructive earthquakes in 1625, 1690, and 1781, the latter of which caused serious damage to the fortress.
The municipality of Brisighella, moreover, stands out in the area of the Faenza Union for the marked vocation to hospitality and sustainable tourism, certified with the recognition of the “Orange Flag” by the Italian Touring Club, and other important certifications such as “Slow Town” and “City of Oil and Wine”. All these elements, in addition to the inclusion in the list of the most beautiful villages in Italy, identify Brisighella as a potential instrumental attractor to support an adequate enhancement of the entire area.
3.2. The Characterization of the Brisighella’s Population under the Socio-Economic Profile
The town of Brisghella has a population of 7426 inhabitants distributed in an articulated system of hamlets: Boesimo, Brisighella centro, Casale, Castellina, Cavina, Cottignola, Fognano, Fornazzano; Fregbanello, La Strada, Marzeno, Montecchio Moronico, Parrocchia di Monte, Romano, Pedrolosa, Pideura, Pietramora, Pieve del Tho, Rignano, Ritortolo, Rontana, San Cassino, San Martino, San Michele in Quarneto, San Ruffino, Sant’Eufemia, Scavignano, Urbiano, Villa San Giorgio in Vezzano, and Zattaglia.
The population of the old town is about 2072 inhabitants, of whom 1280 are men and 1422 are women.
The age resident population shows a higher concentration of the population group over 74 (Figure 2a) with a prevalence of women, therefore, the old town is characterized mostly by an older population more vulnerable in case of exposure to seismic risk.
From the point of view of educational attainment, the population is characterised by a medium-low level of education for both the female and the male populations (Figure 2b).
The composition of the families is mainly characterized by two or three components, with a clear predominance of one component (Figure 2c).
The occupational status of the population in cases of both women and men shows a prevalence of the population employed; additionally, of pensioners, the latter data in fact confirm those already found in the composition by age group (Figure 2d).
The construction of the Lorenz curve shows the percentage of income actually received by a percentage of households. In the case of Brisighella household incomes, the Lorenz curve deviation (Figure 3) from the perfect equality curve, which is a measure of the degree of inequality in income distribution, is fairly broad by detecting an uneven distribution of income. In this case, the Gini coefficient assumes a value of 0.87, confirming this inequality. In addition, the concentration of population incomes is found in the two ranges between 15,000–26,000 and 26,000–55,000.
3.3. The Characterization of the Real Estate Capital of the Historical Centre of Brisighella
The analysis of the real estate for the historic centre of Brisighella is instrumental to characterize the quantitative and the qualitative profiles of this assets, aimed at determining the component of human capital specifically related.
The real estate asset of the historic centre of Brisighella was built mainly before 1919, with subsequent expansions that affected the period immediately after until 1980 (Figure 4a).
The prevailing building construction technology is load-bearing masonry (Figure 4b). The number of floors for buildings (residential use) is mostly two or three floors (Figure 4c). The state of use for the dwellings is mainly occupied by residents in the historic centre of Brisighella (Figure 4d). The number of interiors for building (residential use) is predominantly between one and four, which is equivalent to saying that the real estate asset consists of small building units (Figure 4e).
The database of real estate quotes of the Revenue Agency shows a value for the properties in this area minimum of 1250 €/mq and maximum of 1450 €/mq, with an average value of 1400 €/mq.
4. Results
4.1. The Jorgenson–Fraumeni Approach for Estimating Human Capital from Non-Market Assets
The value of the connected human capital of the historical centre of Brisighella has been determined on the base of the value per capita of the human capital determined from the ISTAT using the Jorgenson–Fraumeni approach for estimating human capital from market assets and with reference to both male and female populations for the three age groups of the population, 15–34 years, 35–54 years, and 55–64 years (Table 3), and with reference to the same age and level of education according to ISCED 1997 (International Standard Classification for Education of 1997) (Table 4).
In Figure 5, the comparison by age and level of ISCED education based on ISTAT data for different age groups highlights the factors that most influence the formation of Brisighella’s human capital.
The greatest contribution to the formation of HC is given by the 15–34 age group, with a value comparable between the two levels of education ISCED 3/4 and ISCED 5/6. This result depends on a different distribution of the population belonging to this range for the two levels of ISCED (Figure 6).
In the 35–54 age group, the overall contribution to HC formation is lower for ISCED 3/4 level of education, slightly higher for ISCED 5/6 level of education, and almost constant for ISCED 0/1/2 level of education compared to those in the previous range.
In the 55–64 age group, the overall contribution to human capital formation is low for both ISCED 3/4 and ISCED 5/6 and very low for 0/1/2 level of education.
4.2. The Jorgenson–Fraumeni Approach for Estimating Human Capital from Non-Market Assets
The value of the connected human capital of the historical centre of Brisighella has been determined on the base of the value per capita of the human capital determined from the ISTAT using the Jorgenson–Fraumeni approach for estimating human capital from non-market assets (household production and use of leisure time) and with reference to both male and female populations for the three age groups of the population, 15–34 years, 35–54 years, and 55–64 years (Table 5), and with reference to the same age and level of education according to ISCED 1997 (International Standard Classification for Education of 1997) (Table 6).
In Figure 6, the comparison by age and ISCED educational level highlights the factors that most influence the formation of Brisighella’s human capital related to household production, namely, the 35–54 age group, with a prevalence of ISCED 3/4 educational level.
In the 15–34 age group, the overall contribution to human capital formation is lower, with a prevalence of ISCED 3/4 educational level. The 55–64 age group has a very low contribution to human capital formation, with a prevalence of ISCED 0/1/2 educational level.
In Figure 7, the comparison by age group and ISCED educational level highlights the factors that most influence the formation of Brisighella’s human capital in relation to use of leisure time, namely, the 35–54 age group, with a prevalence of ISCED level 3/4.
In the 15–34 age group, the overall contribution to human capital formation is slightly lower than in the previous group, with a prevalence of ISCED 3/4 level of education. The 55–64 age group has a low contribution to the formation of human capital, however, it is overall higher than in the case of household production, with a prevalence of ISCED 3/4 educational level.
4.3. Empirical Approach to Determining the Value of Brisghella’s Human Capital
In order to arrive at a measurement of the component of human capital related to its ability to accumulate wealth, and in particular with reference to real estate as a form of wealth deposited able to detect this attitude, an empirical approach was proposed in this study.
This approach measures the value of human capital on the basis of the value of the accumulated real estate asset in a certain time, , the reference period for the estimate, 2019, for the individuals belonging to the three age groups considered for the three phases in which it subdivides life cycle, average income, working position, and debt related to the acquisition of such real estate.
The determination of the real estate assets of individuals/households was based on the following assumptions: the average area occupied for buildings in the historic centre of Brisighella of 96 square metres, the number of buildings owned by the resident population and by age of 883 units according to the ISTAT database, and the average euro value per square metre measured by the Real Estate Listing Database Revenue Agency.
The assumptions relating to the debt contracted by individuals for the acquisition of the property are as follows: the i-th subject activates a mute for the acquisition of the first house, requiring 70% of the entire amount with a fixed rate for a duration of 20 years, according to age, employment position, and an average income of 1500 €.
The value of the real estate assets of individuals/households is determined for the three age groups considered on the basis of the following formula:
where is the value of the real estate assets of the j-th age group, with at time , i.e., the reference period for estimation; is the initial capital paid up at the time of activation of the loan by individuals belonging to the j-th age group, with ; is the number of properties (first house) occupied by individuals in the j-th age group, with j = 1,2,3 residing in the municipality of Brisighella, at time t; represents the average principal amount paid up by individuals in the j-th group with at time .
The estimated value of the human capital component related to the properties held by age brackets for the historic centre of Brisighella is reported in the Table 7.
The comparison between the different components of human capital shows: a greater influence of the component related to market assets for the age groups 15–34 years and 35–54 years; a smaller but still significant influence of the component related to non-market assets use of leisure time comparable for age groups 14–34 years and 35–54 years; an even smaller influence of the component related to the non-market assets household production activity for the age groups 15–34 years and 35–54 years; a low influence of the component related to real estate assets, which is more relevant in the age groups 35–54 years and 55–64 years and very low in the 15–34 years range, which somehow follows the normal cycle of access to the acquisition of real estate (Figure 8 and Figure 9).
Interventions to reduce seismic vulnerability are instrumental to maintain or increase if, in the latter case, they contribute to increase the value of buildings to ensure or increase the relative component of human capital. At the same time, the absence or the inadequate planning of even minimal interventions aimed at reducing seismic vulnerability could reduce the value of human capital related to the value of real estate.
The value of human capital for Brisighella considering all the components according to the empirical approach is 1,213,214,456 euros.
5. Discussion and Conclusions
The multidimensionality of economic evaluation of interventions aimed at reducing the seismic risk of urban tissues in historic centres and at supporting efficient and effective choices by the public decision maker [109,110,111], who has the responsibility to pursue objectives of equity and social well-being, requires the identification and the use of specific approaches.
Plan interventions to increase the resilience of the urban fabric from a minimum scenario, e.g., that provided by the Boundary Condition for Emergency (CLE) and aimed at preserving, in the event of a seismic event as a whole, the operation of most of the strategic functions for the emergency, their accessibility, and the connection with the territorial context, are processes involving different forms of capital, that is, urban, human, and social. Identifying interventions that ensure a minimum risk condition established by law but also with a lower risk condition than the latter is equivalent to selecting those which minimize costs and maximise benefits. In particular, with regard to benefits, the evaluation process must integrate more instrumental approaches to quantify the different forms of capital involved [112,113,114]. The seismic event may pose risks to an individual’s own survival, but, in general, it may result in a reduction in quality of life both as a transitory and a permanent condition. The evaluation of the effects produced by the seismic action on individuals can be determined on the basis of the VSL. In this case, the VSL is instrumental to assess the effects of interventions aimed at reducing seismic risk on the population resident in the historic centre.
Among all the approaches present in the literature for the determination of the VLS, the one to the human capital has some specific peculiarities within the context of the research. Among the approaches present in the literature for the determination of human capital, the “prospective method” considers man as a fixed capital; every individual with his work produces wealth, therefore, the complex of intellectual, physical, and cognitive abilities of an individual constitute an economic asset (human capital), thus any intervention to improve these capabilities constitutes a real investment because it increases the value or the quality of future production.
The factors influencing this approach are mainly the determination of future income and the discount rate to discount future flows. The determination of income shows a number of limitations mostly related to uncertainty of other factors, such as the determination of the amount of production and the duration of income, since the individual is not able to determine even with a certain degree of probability the consistency and the duration of their earnings; even the maintenance expenses are not free from doubts and subjective questions about their actual extent. The identification of the discount rate has a subjective nature, as it derives from a subjective appreciation linked to intertemporal valuations of goods that vary from person to person and from region to region.
The subjectivity of the discount rate is not solvable, even if a current market rate is used, because it would be completely general, as it varies between the different forms of investment and between the different periods of time to which it refers. The Jorgenson and Fraumeni approach goes beyond, albeit only partially, one of the main limits of the prospective method, namely, the difficult quantification of future income flows.
The estimation methodology takes into account the present value of long-life income while taking into account possible changes in remuneration (also due to experience), additional education that can be acquired, differential patterns of labour force participation, and mortality. Expectations about future life cycle income and education are calculated from information about contemporaries present in a specific year. The estimation scheme is applied separately by gender and by level of education of persons and is based on a recursive backwards algorithm applied from the last of the five vital phases considered [115].
The Jorgenson and Fraumeni approach, however, requires a large amount of very disaggregated information about the levels of education achieved or in progress as well as about the status of the labour market, income, and survival.
In this regard, in some cases, as in the calculation for Italian human capital proposed by ISTAT [97], some simplifications have been introduced, such as:
- the income of persons who are no longer working age is considered to be zero;
- young people, although they have a lower income than older workers, have a longer period in which to work and earn income than older workers on the assumption that, as age progresses, they are as likely to be employed with the same earnings observed for older contemporary workers.
Some reflections are necessary in order to open a new debate on the question of the determination of the value of human capital in Italy on the basis of the hypotheses previously mentioned.
The GDP loss related to the economic crisis of 2008 has never been recovered, and there is a current crisis related to the health emergency due to COVID-19. The latter emergency led to an exceptional fall in Italian GDP in the first quarter (−5.3% compared to the previous quarter), with a forecast of a marked contraction of GDP in 2020 (−8.3%) and a partial recovery in 2021 (+4.6%) (ISTAT). This macro-economic perspective might render untrue the assumption that young people with a longer perspective of work can recover income more than older workers, as the conditions underlying this comparison may change, namely, the same probability of being employed and the same earnings observed for older contemporary workers.
The sharp reduction in the level of employment that, according to ISTAT in 2020, will be 9.3% and a recovery in 2021 of +4.1% is still very uncertain. This scenario could influence the employment rate of individuals with a certain level of education and age in the estimation of lifetime labour income.
The increase in the old index of the Italian population in relation to what was previously mentioned amounts to a reduction in the value of human capital, given that an ever wider range would become non-productive to the detriment of productive capital.
Vulnerable areas, such as small historic centres which are already affected by abandonment and depopulation, would experience a further decline in the value of human, urban, and social capital, worsening their marginalisation and converging towards the progressive loss of value and identity and even of entire territories.
The territorial differences between the macro-economic indicators could outline a strong differentiation of the value of human capital under the same conditions as “the knowledge, skills, competences and attributes embodied of individuals that facilitate the creation of personal, social and economic well-being” [63,64], creating an intra-generational issue of such value [116].
Another issue raised by this study that is important to highlight, because it stimulates some reflections that may be useful to contribute to the debate on the estimation of human capital in general but also on the economic assessment of interventions, is linked to another limit found in the J–F approach.
The Jorgenson and Fraumeni approach is not able to detect the component of human capital related to its ability to accumulate wealth and/or asset that is highlighted in the generative function of the approach of Dagum.
On the basis of the two approaches, this study proposed an empirical approach to determining the value of human capital. This approach takes into account the human capital component related to its ability to generate income by considering the results produced by ISTAT on the basis of the J–F approach to market assets and non-market assets and the component related to the ability to accumulate assets highlighted by the Dagum approach.
On the basis of formula 5 applied to the case of the historic centre of Brisighella, which represents a simplified (empirical) approach while being consistent with the approach of Dagum, we determined the component of human capital related to real estate as a form of deposited wealth.
The comparison of the different components of human capital by age group showed a different distribution and incidence for the component related to real estate asset (Figure 10), which was greater for the age groups 35–54 years and for over 64 years. In particular, the latter range, which, according to the approach to lifetime labour income has a very low contribution to the formation of capital related to the ability to produce income, has a greater impact on the production of its component related to assets.
The results of the empirical approach show that not considering the over 64 age group would lead to an underestimation of the value of human capital. The value of human capital for Brisighella considering all the components and the three age groups (15–34 years, 35–54 years, 55–64 years) is 1,213,214,456 euros, while if considering the over 64 years group, which contributes in this case only to the component related to real estate, the value is 1,253,106,589 euros.
Given that the proportion of the retired population in the total population of the historic centre of Brisighella is 31%, the exclusion of this band would have significant effects on the determination of the benefits produced by interventions to reduce seismic risk. This issue can in fact be observed in general in the historical centres and particularly in the in small urban areas; therefore, it is possible to extend the previous considerations to the studies on them.
As mentioned, this study is part of a first step, a second phase aimed at identifying the benefits within a study conducted on the issue of the economic assessment of seismic risk reduction interventions in historic centres.
In general, the second phase aimed to identify a function that includes the value of human and urban capital.
At this stage, the research addressed the question of the methodological approach to the determination of the first form of capital. The determination of a measure for human capital required a specific deepening that was relegated to a more marginal space, the question of the estimation of the benefits related to seismic risk reduction, at the present state synthesized in formula 6. This issue deserves more space to highlight and assess the results.
In addition, it is closely related to the identification of a measure for the determination of urban capital, thus more in-depth study and a more complete point of view will be provided at the end of the second step of the second phase of research.
Further development of this study will be aimed at determining the benefits of seismic risk reduction interventions by extending the analysis to urban capital.
The identification of a benefit function can complete the model already built on the cost side by merging into the constitution of a support model for the choice for public and private decision-makers of the minimum interventions to be placed at the base of the CLE and those that increase the resilience of the historic centre.
The support model for the selection of seismic risk reduction interventions built for the case study of Brisighella as a pilot case for the centres of the Faenza Union is a general tool that can be extended to the economic assessment of interventions aimed at preserving social and cultural values contained within historic centres.
Funding
This work was financed by the University of Catania in a project entitled Architettura a Rischio: Demolire, Recuperare, Restaurare. Il tema della qualità nel progetto sul patrimonio—ARDeRe, scientific responsible De Medici S, which is part of the general project “Piano della Ricerca Dipartimentale 2020–2022 of the Department of Civil Engineering and Architecture”.
Conflicts of Interest
The authors declare no conflict of interest.
Appendix A
Non-Market Activities—Use of Leisure Time
- For an employed individual, it is assumed that free time is subtracted from that devoted to work or to the activity of household production. The calculation of the current imputed income for an employed individual with “edu” level of education at age “age” is based on the following formula:
is the net hourly salary of an individual with “edu” level of education at age “age”;
is the share of free time of an employed individual with edu level of education at age “age”, which is assumed to be enjoyed to the detriment of work for the market;
is the net imputed salary for one hour of household production of an individual with edu level of education at age “age”;
is the share of free time of an employed individual with “edu” level of education level and at age “age” that is assumed to be enjoyed to the detriment of household production;
is the time in hours/day devoted to leisure by an employed individual with “edu” level of education at age “age”.
- For an unemployed person, it is assumed that leisure time is taken away exclusively from household production. The calculation of the current imputed income for an unoccupied person with “edu” level of education at age “age” is based on the following formula:
is the net imputed salary for one hour of household production of an individual with edu level of education at age “age”;
is the time in hours/day devoted to leisure by an unoccupied individual with edu level of education at age “age”.
The calculation of the imputed current figured income in relation to the use of leisure time considering an individual with “edu” level of education level and age “age” (employed and unoccupied) can be determined as follows:
in which is the share of unoccupied individuals in the population, and d is that of employed individuals in the total population
On the basis of estimates of current imputed labour income, the calculation of notional lifetime labour income associated with leisure activity is determined as in the case of market activities with recursive processes backwards from the last year of working age.
- For individuals aged 15 to 40 (Phase I), the calculation of lifetime labour income is based on the following formula:
is the discounted value of life time labour income figured associated with the use of leisure time for individuals with “edu” level of education (ISCED), and age “age” (64 years, 63 years, etc.), the sum of current and expected imputed income for the rest of life;
is the current imputed work income related to the use of leisure time of people with edu level of education at age “age”;
is the discounted value of the life time labour income chart associated with the use of leisure time of contemporary individuals with the same “edu” level of education (ISCED) and one year older than age (age + 1 = 65 years, 64 years, etc.); the value in question is set at zero for age = 64 years, as processing is also limited in this case to the two phases 15–40 years (study and work) and 41–64 years (work only);
, , , , have the same meaning previously stated.
- For individuals aged between 41 and 64 (Phase II), the calculation of lifetime labour income is based on the following formula:
is the discounted value of life time labour income figured associated with the use of leisure time for individuals with “edu” level of education (ISCED), at age “age” (64 years, 63 years, etc.), the sum of current and expected imputed income for the rest of life;
is the current imputed work income associated with the use of leisure time of people with “edu” level of education at age “age”;
is the discounted value of the life time labour income chart associated with the use of leisure time of contemporary individuals with the same edu level of education (ISCED) and one year older than age (age + 1 = 65 years, 64 years, etc.); the value in question is set at zero for age = 64 years, as processing is also limited in this case to the two phases 15–40 years (study and work) and 41–64 years (work only);
, , have the same meaning previously stated.
Appendix B
Non-Market Activities—Household Production
The formula for calculating current imputed income for individuals with a certain “edu” level of education at age “age” is as follows:
where:
is the current imputed income;
is the net imputed salary for each hour of household production of an individual with “edu” level of education at age “age”;
is the average time in hours/day spent by people of both education and age in the household production.
On the basis of estimates of current imputed labour income, the calculation of notional lifetime labour income associated with the household production activity is determined as in the case of market activities with recursive processes backwards from the last year of working age.
- For individuals between 15 and 40 years (Phase I), who each year are confronted with the possibility of completing the course of study to begin work, the estimate of lifetime labour income figurative associated with the performance of household production activities is based on the following formula:
is the discounted value of the life time labour income chart associated with the performance of a household production activity for individuals with an “edu” level of education (ISCED), at age “age” (64 years, 63 years, etc.), the sum of current and expected imputed income for the rest of life;
is the current imputed work income associated with the performance of a household activity of individuals with edu level of education at age “age”;
is the discounted value of the life time labour income figure connected with the performance of family production activities of contemporary individuals with the same “edu” level of education (ISCED) and one year older (age + 1 = 65 years, 64 years, etc.); the value in question is set at zero for age = 64 years, as processing is also limited in this case to the two phases 15–40 years (study and work) and 41–64 years (work only);
, , , , have the same meaning previously stated.
- For individuals aged between 41 and 64 (Phase II), the calculation of lifetime labour income is based on the following formula:
is the discounted value of the life time labour income chart associated with the performance of a family production activity for individuals with “edu” level of education (ISCED), at age “age” (64 years, 63 years, etc.), the sum of current and expected imputed income for the rest of life;
is the current imputed work income associated with the performance of a family activity of individuals with “edu” level of education at age “age”;
is the discounted value of the life time labour income figure connected with the performance of family production activities of contemporary individuals with the same “edu” level of education (ISCED) and one year older (age + 1 = 65 years, 64 years, etc.); the value in question is set at zero for age = 64 years as processing is also limited in this case to the two phases 15–40 years (study and work) and 41–64 years (work only);
, , , have the same meaning previously stated.
References
- Giuffrida, S.; Trovato, M.R.; Circo, C.; Ventura, V.; Giuffrè, M.; Macca, V. Seismic vulnerability and old towns. A cost-based programming model. Geosciences 2019, 9, 427. [Google Scholar] [CrossRef] [Green Version]
- Trovato, M.R.; Clienti, C.; Giuffrida, S. People and the city: Urban fragility and the real estate-scape in a neighborhood of Catania, Italy. Sustainability 2020, 12, 5409. [Google Scholar] [CrossRef]
- Giuffrida, S.; Gagliano, F.; Giannitrapani, E.; Marisca, C.; Napoli, G.; Trovato, M.R. Promoting research and landscape experience in the management of the archaeological networks. A project-valuation experiment in Italy. Suistanibility 2020, 12, 4022. [Google Scholar] [CrossRef]
- Giuffrida, S.; Ventura, V.; Nocera, F.; Trovato, M.R.; Gagliano, F. Technological, axiological and praxeological Coordination in the energy-environmental equalization of the strategic old town renovation programs. In Values and Functions for Future Cities; Mondini, G., Oppio, A., Stanghellini, S., Bottero, M., Abastante, F., Eds.; Green Energy and Technology; Springer: Cham, Switzerland, 2020; pp. 425–446. [Google Scholar] [CrossRef]
- Trovato, M.R. A multi-criteria approach to support the retraining plan of the Biancavilla’s old town. In Proceedings of the Smart Innovation, Systems and Technologies, 3rd International New Metropolitan Perspectives, Local Knowledge and Innovation Dynamics towards Territory Attractiveness through the Implementation of Horizon/Europe2020/Agenda2030, Reggio Calabria, Italy, 22–25 May 2018; Calabrò, F., Spina, L.D., Bevilacqua, C., Eds.; Springer Science and Business Media Deutschland GmbH: Cham, Switzerland, 2019; Volume 101, pp. 434–441. [Google Scholar] [CrossRef]
- Gabrielli, L.; Giuffrida, S.; Trovato, M.R. Real estate landscapes and the historic city: On how looking inside the market. In Proceedings of the Smart Innovation, Systems and Technologies, 3rd International New Metropolitan Perspectives, Local Knowledge and Innovation Dynamics towards Territory Attractiveness through the Implementation of Horizon/Europe2020/Agenda2030, Reggio Calabria, Italy, 22–25 May 2018; Bevilacqua, C., Calabrò, F., Spina, L.D., Eds.; Springer Science and Business Media Deutschland GmbH: Cham, Switzerland, 2019; Volume 101, pp. 269–276. [Google Scholar] [CrossRef]
- Giuffrida, S. City as Hope. Valuation Science and the Ethics of Capital. Green Energy and Technology; Springer: Berlin/Heidelberg, Germany, 2018; pp. 469–485. [Google Scholar] [CrossRef]
- Napoli, G.; Giuffrida, S.; Trovato, M.R. A paradigm interpreting the city and the analytic network process for the management of urban transformations. In Proceedings of the Smart Innovation, Systems and Technologies, 3rd International New Metropolitan Perspectives, Local Knowledge and Innovation Dynamics towards Territory Attractiveness through the Implementation of Horizon/Europe2020/Agenda2030, Reggio Calabria, Italy, 22–25 May 2018; Bevilacqua, C., Calabrò, F., Spina, L.D., Eds.; Springer Science and Business Media Deutschland GmbH: Cham, Switzerland, 2019; Volume 100, pp. 672–680. [Google Scholar] [CrossRef] [Green Version]
- Giuffrida, S.; Ventura, V.; Trovato, M.R.; Napoli, G. Axiology of the historical city and the cap rate. The case of the old town of Ragusa superior. Valori e Valutazioni 2017, 18, 41–55. [Google Scholar]
- Giuffrida, S. A fair city. Value, time and the cap rate. In Integrated Evaluation for the Management of Contemporary Cities; Green Energy and Technology; Springer: Berlin/Heidelberg, Germany, 2018; pp. 425–439. [Google Scholar] [CrossRef]
- Gabrielli, L.; Giuffrida, S.; Trovato, M.R. Gaps and overlaps of urban housing sub market: A fuzzy clustering approach. In Appraisal from Theory to Practice; Stanghellini, S., Morano, P., Bottero, M., Oppio, A., Eds.; Green Energy and Technology; Springer: Cham, Switzerland, 2017; pp. 203–219. [Google Scholar] [CrossRef]
- Gabrielli, L.; Giuffrida, S.; Trovato, M.R. From Surface to Core: A Multi-layer Approach for the Real Estate Market Analysis of a Central Area in Catania. In Computational Science and Its Applications—ICCSA 2015; Gervasi, O., Murgante, B., Misra, S., Gavrilova, M.L., Rocha, A.M.A.C., Torre, C.M., Taniar, D., Apduhan, B.O., Eds.; Springer Nature Switzerland AG: Cham, Switzerland, 2015; Volume 3, pp. 284–300. [Google Scholar] [CrossRef]
- Gabrielli, L.; Giuffrida, S.; Trovato, M.R. Functions and perspectives of public real estate in the urban policies: The sustainable development plan of syracuse. In Computational Science and Its Applications—ICCSA 2016, LNCS 9789; Gervasi, O., Murgante, B., Misra, S., Rocha, A.M.A.C., Torre, C.M., Taniar, D., Apduhan, B.O., Stankova, E., Wang, S., Eds.; Springer: Cham, Switzerland, 2016; Volume IV, pp. 13–28. [Google Scholar] [CrossRef]
- Schultz, T. Reflections on Investment in Man. J. Political Econ. 1962, 5, 1–8. [Google Scholar] [CrossRef]
- Schultz, T. Investment in Human Capital: A Theoretical Analysis. J. Political Econ 1962, 70 Pt 2, 9–49. [Google Scholar]
- Alexander, K. The Value of an Education; Simon & Schuster: Boston, MA, USA, 1996. [Google Scholar]
- Grubb, W.N.; Lazerson, M. The Educational Gospel: The Economic Power of Schooling; Harvard University Press: Cambridge, MA, USA, 2004. [Google Scholar]
- Sen, A. Development as Freedom; Anchors Books: New York, NY, USA, 1999. [Google Scholar]
- Schultz, T.W. Investment in Human Capital. The Role of Education and of Research; Free Press: New York, NY, USA, 1971. [Google Scholar]
- Garavan, T.N.; Morley, M.J.; Gunnigle, P.; Collins, E. Human capital accumulation: The role of human resource development. J. Eur. Ind. Train. 2001, 25, 48–68. [Google Scholar] [CrossRef]
- Youndt, M.A.; Subramaniam, M.; Snell, S.A. Intellectual capital profiles: An examination of investments and returns. J. Manag. Stud. 2004, 41, 335–361. [Google Scholar] [CrossRef]
- Rastogi, P.N. Knowledge management and intellectual capital as paradigm of value creation. Hum. Syst. Manag. 2002, 21, 226–240. [Google Scholar]
- Beach, M.J. A critique of human capital formation in the U.S. and the economic returns to sub-baccalaureate credentials. Educ. Stud. 2009, 45, 24–38. [Google Scholar] [CrossRef]
- De Fuente, A.; Ciccone, A. Le Capital Humain dans une Économie Mondial sur Connaissance; Rapport por; La Commission Européenne: Bruxelles, Belgium, 2002. [Google Scholar]
- Au, A.K.M.; Altman, Y.; Roussel, J. Employee training needs and perceived value of training in the Pearl River Delta of China: A human capital development approach. J. Eur. Ind. Train. 2008, 32, 19–31. [Google Scholar]
- Romer, P.M. Human Capital and Growth: Theory and Evidence; NBER Working Paper No. 3173; National Bureau of Economic Research: Cambridge, MA, USA, 1989; Available online: https://www.nber.org/papers/w3173 (accessed on 7 November 2019).
- Romer, P.M. Increasing Returns and New Developments in the Theory of Growth; NBER Working Papers 3098; National Bureau of Economic Research, Inc.: Cambridge, MA, USA, 1989. [Google Scholar]
- Romer, P.M. Endogenous Technological Change; NBER Working Papers 3210; National Bureau of Economic Research, Inc.: Cambridge, MA, USA, 1989. [Google Scholar]
- Romer, P.M. Increase return and long-run growth. J. Political Econ. 1990, 94, 1002–1037. [Google Scholar] [CrossRef] [Green Version]
- Rosen, H.S. Public Finance; McGraw Hill: New York, NY, USA, 1999. [Google Scholar]
- Frank, R.H.; Bernanke, B.S. Principle of Microeconomics; McGraw Hill: New York, NY, USA, 2007. [Google Scholar]
- Sullivan, A.; Sheffrin, M.S. Economics: Principles and Actions; Pearson Prentice Hall: Upper Saddle River, NJ, USA, 2003. [Google Scholar]
- Rodriguez, P.J.; Loomis, R.S. A new view of institutions, human capital and market standardization. Educ. Knowl. Econ. 2007, 1, 93–105. [Google Scholar] [CrossRef]
- Giuffrida, S.; Trovato, M.R.; Falzone, M. The Information Value for Territorial and Economic Sustainability in the Enhancement of the Water Management Process. In Proceedings of the ICCSA 2017, Trieste, Italy, 3–6 July 2017; LNCS 10406. Borruso, G., Cuzzocrea, A., Apduhan, B.O., Rocha, A.M.A.C., Taniar, D., Misra, S., Gervasi, O., Torre, C.M., Stankova, E., Murgante, B., Eds.; Springer: Cham, Switzerland, 2017; Volume 3, pp. 575–590. [Google Scholar] [CrossRef]
- Giuffrida, S.; Trovato, M.R.; Giannelli, A. Semiotic-sociological textures of landscape values. Assessments in urban-coastal areas. In Information and Communication Technologies in Modern Agricultural Development, Communications in Computer and Information Science; Salampasis, M., Bournaris, T., Eds.; Springer: Cham, Switzerland, 2019; Volume 953, pp. 35–50. [Google Scholar] [CrossRef]
- Giuffrida, S.; Trovato, M.R. A semiotic approach to the landscape accounting and assessment. An application to the urban-coastal areas. In Proceedings of the 8th International Conference on Information and Communication Technologies in Agriculture, Food and Environment, HAICTA 2017, Chania, Crete Island, Greece, 21–24 September 2017; Salampasis, M., Theodoridis, A., Bournaris, T., Eds.; CEUR Workshop Proceedings. CEUR: Aachen, Germany, 2017; pp. 696–708. [Google Scholar]
- Giuffrida, S.; Casamassima, G.; Trovato, M.R. Le norme EMAS-ISO nella valutazione della qualità del servizio idrico integrato. Aestimum 2017, 70, 109–134. [Google Scholar] [CrossRef]
- Trovato, M.R.; Giuffrida, S. A DSS to Assess and Manage the Urban Performances in the Regeneration Plan: The Case Study of Pachino. In International Conference on Computational Science and Its Applications—ICCSA 2014- ICCSA 2014, LNCS 8581; Murgante, B., Misra, S., Rocha, A.M.A.C., Torre, C.M., Rocha, J.G., Falcão, M.I., Taniar, D., Apduhan, B.O., Gervasi, O., Eds.; Springer Nature Switzerland AG: Cham, Switzerland, 2014; Part III; pp. 224–239. [Google Scholar] [CrossRef]
- Trovato, M.R.; Giuffrida, S. The choice problem of the urban performances to support the Pachino’s redevelopment plan. IJBIDM 2014, 9, 330–355. [Google Scholar] [CrossRef]
- Napoli, G.; Giuffrida, S.; Trovato, M.R. Efficiency versus Fairness in the Management of Public Housing Assets in Palermo (Italy). Sustainability 2019, 11, 1190. [Google Scholar] [CrossRef] [Green Version]
- Pierantoni, I. Analisi Economica Della Vita Umana. Valutazione di un Bene Intagibile Nell’analisi Costi-Benefici; Giuffrè: Milano, Italy, 1986. [Google Scholar]
- Putignano, C.; Pennini, L. Il Costo Sociale Degli Incidenti Stradali. Rivista Giuridica Della Circolazione e Dei Trasporti. Quaderno n,16. 1999. Available online: https://ebiblio.istat.it/SebinaOpac/resource/il-costo-sociale-degli-incidenti-stradali/IST0029540 (accessed on 3 January 2020).
- Chilton, S.; Covey, J.; Lorraine, H.; Jones-Lee, M.; Loomes, G.; Pidgeon, N.; Spencer, A. New Research Results on the Valuation of Preventing Fatal Road Accident Casualties, Road Accidents Great Britain; Department for Transport: London, UK, 1997. [Google Scholar]
- Petty, W. Aritmetica Politica (Original Title: Discourse on Political Arithmetic, 1690); Liguori Editore: Liguori, Napoli, 1986. [Google Scholar]
- Smith, A. Ricchezza Delle Nazioni (Original Tittle: An Inquiry into the Nature and Causes of the Wealth of Nations, 1776); UTET: Torino, Italy, 1948. [Google Scholar]
- Engel, E. Der Werth Des Menschen; Berlin Verlag von Leonard Simion: Berlin, Germany, 1883. [Google Scholar]
- Marshall, A. Principles of Economics; Macmillan: New York, NY, USA, 1922. [Google Scholar]
- Gini, C. La teoria europea e la teoria americana delle migrazioni internazionali. Economia e Commercio 1946, 2. [Google Scholar]
- Gini, C. L’ammontare e la Composizione Della Ricchezza Delle Nazioni; UTET: Torino, Italy, 1962. [Google Scholar]
- Pareto, V. IL costo economico dell’uomo ed il valore economico degli emigranti. Giornale degli Economisti 1905, 2, 322–327. [Google Scholar]
- Kiker, B.F. Historical roots of the concept of human capital. J. Political Econ. 1996, 29, 481–499. [Google Scholar] [CrossRef]
- Mincer, J. Investment in human capital and personal income distribution. J. Political Econ. 1958, 66, 281–302. [Google Scholar] [CrossRef]
- Schultz, T.W. Investment in human capital. Am. Econ. Rev. 1961, 51, 1–17. [Google Scholar]
- Becker, G.S. Human Capital, 2nd ed.; Columbia University Press: New York, NY, USA, 1964. [Google Scholar]
- Fabricant, S. Economic Progress and Economic Change; Annual Report of the National Bureau of Economic Research; National Bureau of Economic Research: New York, NY, USA, 1954. [Google Scholar]
- Solow, M. A Contribution to the theory of economic growth. Q. J. Econ. 1956, 70, 65–94. [Google Scholar] [CrossRef]
- Abramovitz, M. Resource and output trends in the United States Since 1870. Am. Econ. Rev. 1956, 46, 5–23. [Google Scholar]
- Solow, M.; Arrow, K.J.; Chenery, B.S.; Minhas, B.S. Capital labor substitution and economic efficiency. Rev. Econ. Stat. 1961, 43, 56–98. [Google Scholar]
- Schmookler, J. Invention and Economic Growth; Harvard Press: Cambridge, MA, USA, 1966. [Google Scholar]
- Denison, E. The contribution of capital to economic growth. Am. Econ. Rev. 1980, 70, 221–231. [Google Scholar]
- Lovaglio, P.G. Investimento in capitale umano e disuguaglianze sociali. In Capitale Umano. La Ricchezza dell’Europa; Vittadini, G., Ed.; Guerini e Associati: Milano, Italy, 2004. [Google Scholar]
- Commission of the European Communities. COM (2003) 842 Final—Communication from the Commission to the Council, The European Parliament, The European Economic and Social Committee and the Committee of the Regions. Brussels, Belgium, 30 December 2003. Available online: https://eur-lex.europa.eu/legal-content/EN/TXT/?uri=CELEX%3A52004AE0966 (accessed on 2 January 2020).
- OCSE. The Well-Being of Nations: The Role of Human and Social Capital; OCES: Paris, France, 2001. [Google Scholar]
- OCSE. Measuring the Stock of Human Capital for Comparative Analysis: An Application of the Lifetime Income Approach to Selected Countries, 2011. Available online: https://0-www-oecd--ilibrary-org.brum.beds.ac.uk/docserver/5kg3h0jnn9r5en.pdf?expires=1601310392&id=id&accname=oid055706&checksum=5CF6A8D0460B77292779A69770AC8195, (accessed on 2 January 2020).
- Cipollone, P.; Sestito, P. Il Capitale Umano. Farsi Un’idea; Il Mulino: Bologna, Italy, 2010. [Google Scholar]
- TFSD. Draft Report of the Joint UNECE/Eurostat/OECD Task Force on Measuring Sustainable Development. 2012. Available online: http://www.unece.org/fileadmin/DAM/stats/documents/sustainable_development/2012/Report_on_measuring_sustainable_development_Dec_2012_-_for_consultation.pdf (accessed on 5 January 2020).
- European Union Strategy for Sustainable Development (EC). 2001. Available online: https://ec.europa.eu/environment/sustainable-development/strategy/index_en.htm (accessed on 3 January 2020).
- OECD. The Well-Begin of Nation. The Role of Human and Social Capital 2001; Working Group on Statistics for Sustainable Development (UNECE/OECD/Eurostat): Paris, France, 2005. [Google Scholar]
- European Commission and Eurostat. Measuring Progress towards a More Sustainable Europe. 2007 Monitoring Report of the EU Sustainable Development Strategy. 2007. Available online: https://ec.europa.eu/eurostat/documents/3217494/5619864/KS-77-07-115-EN.PDF/06ee41ca-2717-46ee-bee5-07e6bf6c26a2 (accessed on 2 January 2020).
- Stiglitz, J.E.; Fitoussi, J.P.; Durand, M. Measuring What Counts for Economic and Social Performance; OECD: Paris, France, 2018. [Google Scholar] [CrossRef]
- Stiglitz, J.E.; Sen, A.; Fitoussi, J.P. Report by the Commission on the Measurement of Economic Performance and Social Progress, France, 2008. Available online: http://files.harmonywithnatureun.org/uploads/upload112.pdf (accessed on 5 January 2020).
- World Bank. The Changing Wealth of Nations, Measuring Sustainable Development in the New Millennium; The International Bank for Reconstruction and Development/The World Bank: Washington, DC, USA, 2011; Available online: https://openknowledge.worldbank.org/bitstream/handle/10986/2252/588470PUB0Weal101public10BOX353816B.pdf?sequence=1&isAllowed=y (accessed on 6 February 2020).
- Unece-Eurostat-OCED. Conference of European Statistical Recommendations on Measuring Sustainable Development. UNITED NATIONS. New York and Geneva, 2014. Available online: https://www.unece.org/publications/ces_sust_development.html (accessed on 5 January 2020).
- Unece. Conference of European Statisticians Recommendations on Measuring Sustainable Development. United Nations. New York and Geneva, 2016. Available online: https://unstats.un.org/unsd/nationalaccount/consultationDocs/HumanCapitalGuide.web.pdf (accessed on 5 January 2020).
- OCSE. Building Human capital accounts for the purpose of international comparisons: A project proposal. In Proceedings of the OCSE Committe on Statistical Meeting, Genova, Italy, 10–11 June 2009. [Google Scholar]
- Kendrick, J.W. The accounting treatment of human investiment and capital. Rev. Income Wealth 1974, 20, 469–482. [Google Scholar] [CrossRef]
- Kendrick, J.W. The Formation of Stock of Total Capital; National Bareau of Economic Research: New York, NY, USA, 1976. [Google Scholar]
- Eisner, R. The Total Income System in Accounts; University of Chicago Press: Chicago, IL, USA, 1989. [Google Scholar]
- Le, T.; Gibson, J.; Oxley, L. Cost- and Income-Based Measures of Human Capital. J. Econ. Surv. 2003, 17, 271–307. [Google Scholar] [CrossRef]
- Jorgenson, D.W.; Fraumeni, B. The output of education sector. In Output Measuring in the Services Sector; Griliches, Z., Ed.; University of Chicago Press: Chicago, IL, USA, 1992. [Google Scholar]
- Abraham, K.G.; Mackie, C. Beyond the market—Designing the Nonmarket Accounts for the United States; The National Academies Press: Washington, DC, USA, 2005. [Google Scholar]
- Barro, R.J.; Lee, J.W. International data on educational attainment: Updates and implications. Oxf. Econ. Pap. 2001, 53, 541–563. [Google Scholar] [CrossRef]
- Hanushek, E.A.; Kim, D. Schooling, Labor Force Quality and Economic Growth; W.P. 5399; NBER: Cambridge, MA, USA, 1995. [Google Scholar]
- Hanushek, E.A. The failure of input-based schooling policy. Econ. J. 2003, 113, F64–F98. [Google Scholar] [CrossRef]
- OCSE. Human Capital Investment: An International Comparison; OCSE—CERIS: Paris, France, 1998. [Google Scholar]
- Wößmann, L. Specifying human capital. J. Econ. Surv. 2003, 17, 239–270. [Google Scholar] [CrossRef]
- Barro, R.J. Economic growth in a cross section of countries. Q. J. Econ. 1991, 106, 407–443. [Google Scholar] [CrossRef] [Green Version]
- Mankiw, N.G.; Rome, D.; Weil, D.N. A contribution of empirics economic growth. Q. J. Econ. 1992, 107, 407–437. [Google Scholar] [CrossRef]
- Levine, R.E.; Renelt, D. A sensitivity analysis of cross-countries growth regression. Am. Econ. Rev. 1992, 82, 942–963. [Google Scholar]
- Romer, P.M. Increasing returns and long-run growth. J. Political Econ. 1986, 94, 1002–1037. [Google Scholar] [CrossRef] [Green Version]
- Psacharopoulos, G.; Arriagada, A.M. The educational composition of the labour force: An international comparison. Int. Laour Rev. 1986, 125, 561–574. [Google Scholar]
- Krueger, A.B.; Lindahl, M. Educational for growth: Why and for whom? J. Econ. Lit. 2001, 39, 1101–1136. [Google Scholar] [CrossRef] [Green Version]
- O’Neill, D. Education and income growth: Implications for cross-country inequality. J. Political Econ. 1995, 103, 1289–1301. [Google Scholar] [CrossRef] [Green Version]
- Mulligan, C.-B.; Sala-i-Martin, X. A labour-income-based measure of the value of Human capital: An application to the State of United States. Jpn. World Econ. 1997, 9, 159–191. [Google Scholar] [CrossRef] [Green Version]
- Jorgenson, D.W.; Fraumeni, B. The accumulation of Human and non-human capital 1948–1984. In The Measurement of Savings, Investment and Wealth; Lipsey, R.E., Tice, H.S., Eds.; University of Chicago Press: Chicago, IL, USA, 1989. [Google Scholar]
- Jorgenson, D.W. The theory of investment behavior. In Determintants of Investment Behavior; Feber, R., Ed.; National Bureau of Economic Research: Cambridge, MA, USA, 1967; pp. 129–188. [Google Scholar]
- ISTAT. Il Valore Monetario Dello Stock di Capitale Umano in Italia. 2014. Available online: https://www.istat.it/it/files/2014/02/Il-valore-monetario-dello-stock-di-capitale-umano.pdf (accessed on 7 November 2019).
- Becker, G.S. A theory of the allocation of time. Econ. J. 1965, 75, 493–517. [Google Scholar] [CrossRef] [Green Version]
- Fraumeni, B.M. Human Capital Accounts: Choice of Rates and Construction of Volume Indices; Working paper 16865; National Bureau of Economic Research: Cambridge, MA, USA, 2011; Available online: https://www.nber.org/papers/w16895 (accessed on 7 November 2019).
- Resciniti, R. Economics and marketing of leisure time. In Profiles and Proseptives of an Emerging Industry; Philips Morris Marketing Award; Francoangeli: Milan, Italy, 2002. [Google Scholar]
- OECD. Special focus: Measuring leisure. In Society at Glange 2009: OECD Social Indicators; OECD: Paris, France, 2009; Chapter 2. [Google Scholar]
- Vittadini, G. Capitale Umano. La Ricchezza dell’Europa; Guerini e Associati: Milan, Italy, 2004. [Google Scholar]
- Dagum, C.; Slottje, D.J. A new method to estimate the level and distribution of the household human capital with applications. J. Struct. Chang. Econ. Dyn. 2000, 11, 67–94. [Google Scholar] [CrossRef]
- Dagum, C. Human capital, income and wealth distribution models with applications. In Proceedings of the Business and Economic Statistics Section; ASA: Washington, DC, USA, 1994; pp. 253–258. [Google Scholar]
- Dagum, C.; Vittadini, G. Estimation and distribution of human capital with applications. In Scritti di Statistica Economica, 3; Quintano, C., Ed.; Rocco Curto Publisher: Napoli, Italy, 1997; pp. 115–131. [Google Scholar]
- Dagum, C.; Vittadini, G. Human capital measurement and distribution. In Proceedings of the Business and Economic Statistics Section of the American Statistical Association; ASA: Washington, DC, USA, 1996; pp. 194–199. [Google Scholar]
- Avery, R.B.; Elliehausen, G.E. 1983 Survey of Consumer Finance: Technical Manual and Codebook; Federal Reserve Board: Washington DC, USA, 1995. [Google Scholar]
- Organizzazione Mondiale della Sanità (O.M.S.). International Classification of Functioning, Disability and Health—Trad. It. ICF; Erikson: Trento, Italy, 2002; pp. 14–22. ISBN 978-88-7946-628-8. [Google Scholar]
- Giuffrida, S.; Gagliano, F.; Nocera, F.; Trovato, M.R. Landscape assessment and economic accounting in wind farm programming: Two cases in Sicily. Land 2018, 7, 120. [Google Scholar] [CrossRef] [Green Version]
- Trovato, M.R.; Nocera, F.; Giuffrida, S. Life-cycle assessment and monetary measurements for the carbon footprint reduction of public buildings. Sustainability 2020, 12, 3460. [Google Scholar] [CrossRef] [Green Version]
- Nocera, F.; Giuffrida, S.; Trovato, M.R. Energy and new economic approach for nearly zero energy hotels. Entropy 2019, 21, 639. [Google Scholar] [CrossRef] [Green Version]
- Naselli, F.; Trovato, M.R.; Castello, G. An evaluation model for the actions in supporting of the environmental and landscaping rehabilitation of the Pasquasia’s site mining (EN). In Computational Science and Its Applications—ICCSA 2014, LNCS 8581; Murgante, B., Misra, S., Rocha, A.M.A.C., Torre, C.M.., Rocha, J.G., Falcão, M.I., Taniar, D., Apduhan, B.O., Gervasi, O., Eds.; Part 3; Springer: Cham, Switzerland, 2014; pp. 26–41. [Google Scholar] [CrossRef]
- Giannelli, A.; Giuffrida, S.; Trovato, M.R. Madrid Rio Park. Symbolic values and contingent valuation. Valori e Valutazioni 2018, 21, 75–85. [Google Scholar]
- Trovato, M.R.; Giuffrida, S. The monetary measurement of flood damage and the valuation of the proactive policies in Sicily. Geosciences 2018, 8, 141. [Google Scholar] [CrossRef] [Green Version]
- Fraumeni, B.M. Conto del capitale umano: Scelta dei tassi e costruzione degli indici di volume. In Capitale Umano. Definizione e Misurazioni; Tronti, L., Ed.; Cedam: Padova, Italy, 2012. [Google Scholar]
- Trovato, M.R.; Giuffrida, S. The Protection of territory in the perspective of the intergenerational equity. In Seminar of the Italian Society of Property Evaluation and Investment Decision; Green Energy and Technology; Springer Nature: Cham, Switzerland, 2018; Volume Part F8, pp. 469–485. [Google Scholar] [CrossRef]
Figure 1.
Flow chart—the first step of the research project aimed at identifying the benefits produced by seismic risk reduction interventions.
Figure 1.
Flow chart—the first step of the research project aimed at identifying the benefits produced by seismic risk reduction interventions.

Figure 2.
Socio-economic indicators for the historic centre of Brisighella: (a) total population by age bracket and by age and gender; (b) total population by level of education and by gender; (c) composition of resident households; (d) professional or non-professional status for total population and gender (our elaboration on National Institute of Statistics).

Figure 3.
Gini index (source: our elaboration on https://www.tuttitalia.it).
Figure 3.
Gini index (source: our elaboration on https://www.tuttitalia.it).

Figure 4.
State of the residential buildings in the historical centre of Brisighella: (a) construction period for buildings; (b) building technology; (c) number of floors for the buildings; (d) state of use for the dwellings; (e) number of interior for buildings.
Figure 4.
State of the residential buildings in the historical centre of Brisighella: (a) construction period for buildings; (b) building technology; (c) number of floors for the buildings; (d) state of use for the dwellings; (e) number of interior for buildings.

Figure 5.
The comparison between age groups and by ISCED (educational level) in human capital formation related to market assets in euros.
Figure 5.
The comparison between age groups and by ISCED (educational level) in human capital formation related to market assets in euros.

Figure 6.
Population by age group and ISCED in Brisighella.

Figure 7.
The comparison between age groups and by ISCED (educational level) in human capital formation related to non-market (household production) assets in euros.
Figure 7.
The comparison between age groups and by ISCED (educational level) in human capital formation related to non-market (household production) assets in euros.

Figure 8.
The comparison between age groups and by ISCED (educational level) in human capital formation related to non-market assets (use of leisure time) in euros.
Figure 8.
The comparison between age groups and by ISCED (educational level) in human capital formation related to non-market assets (use of leisure time) in euros.

Figure 9.
The comparison between the different components of human capital in euros—Brisighella.

Figure 10.
The comparison between the different components of human capital in euros for four age groups—Brisighella.
Figure 10.
The comparison between the different components of human capital in euros for four age groups—Brisighella.


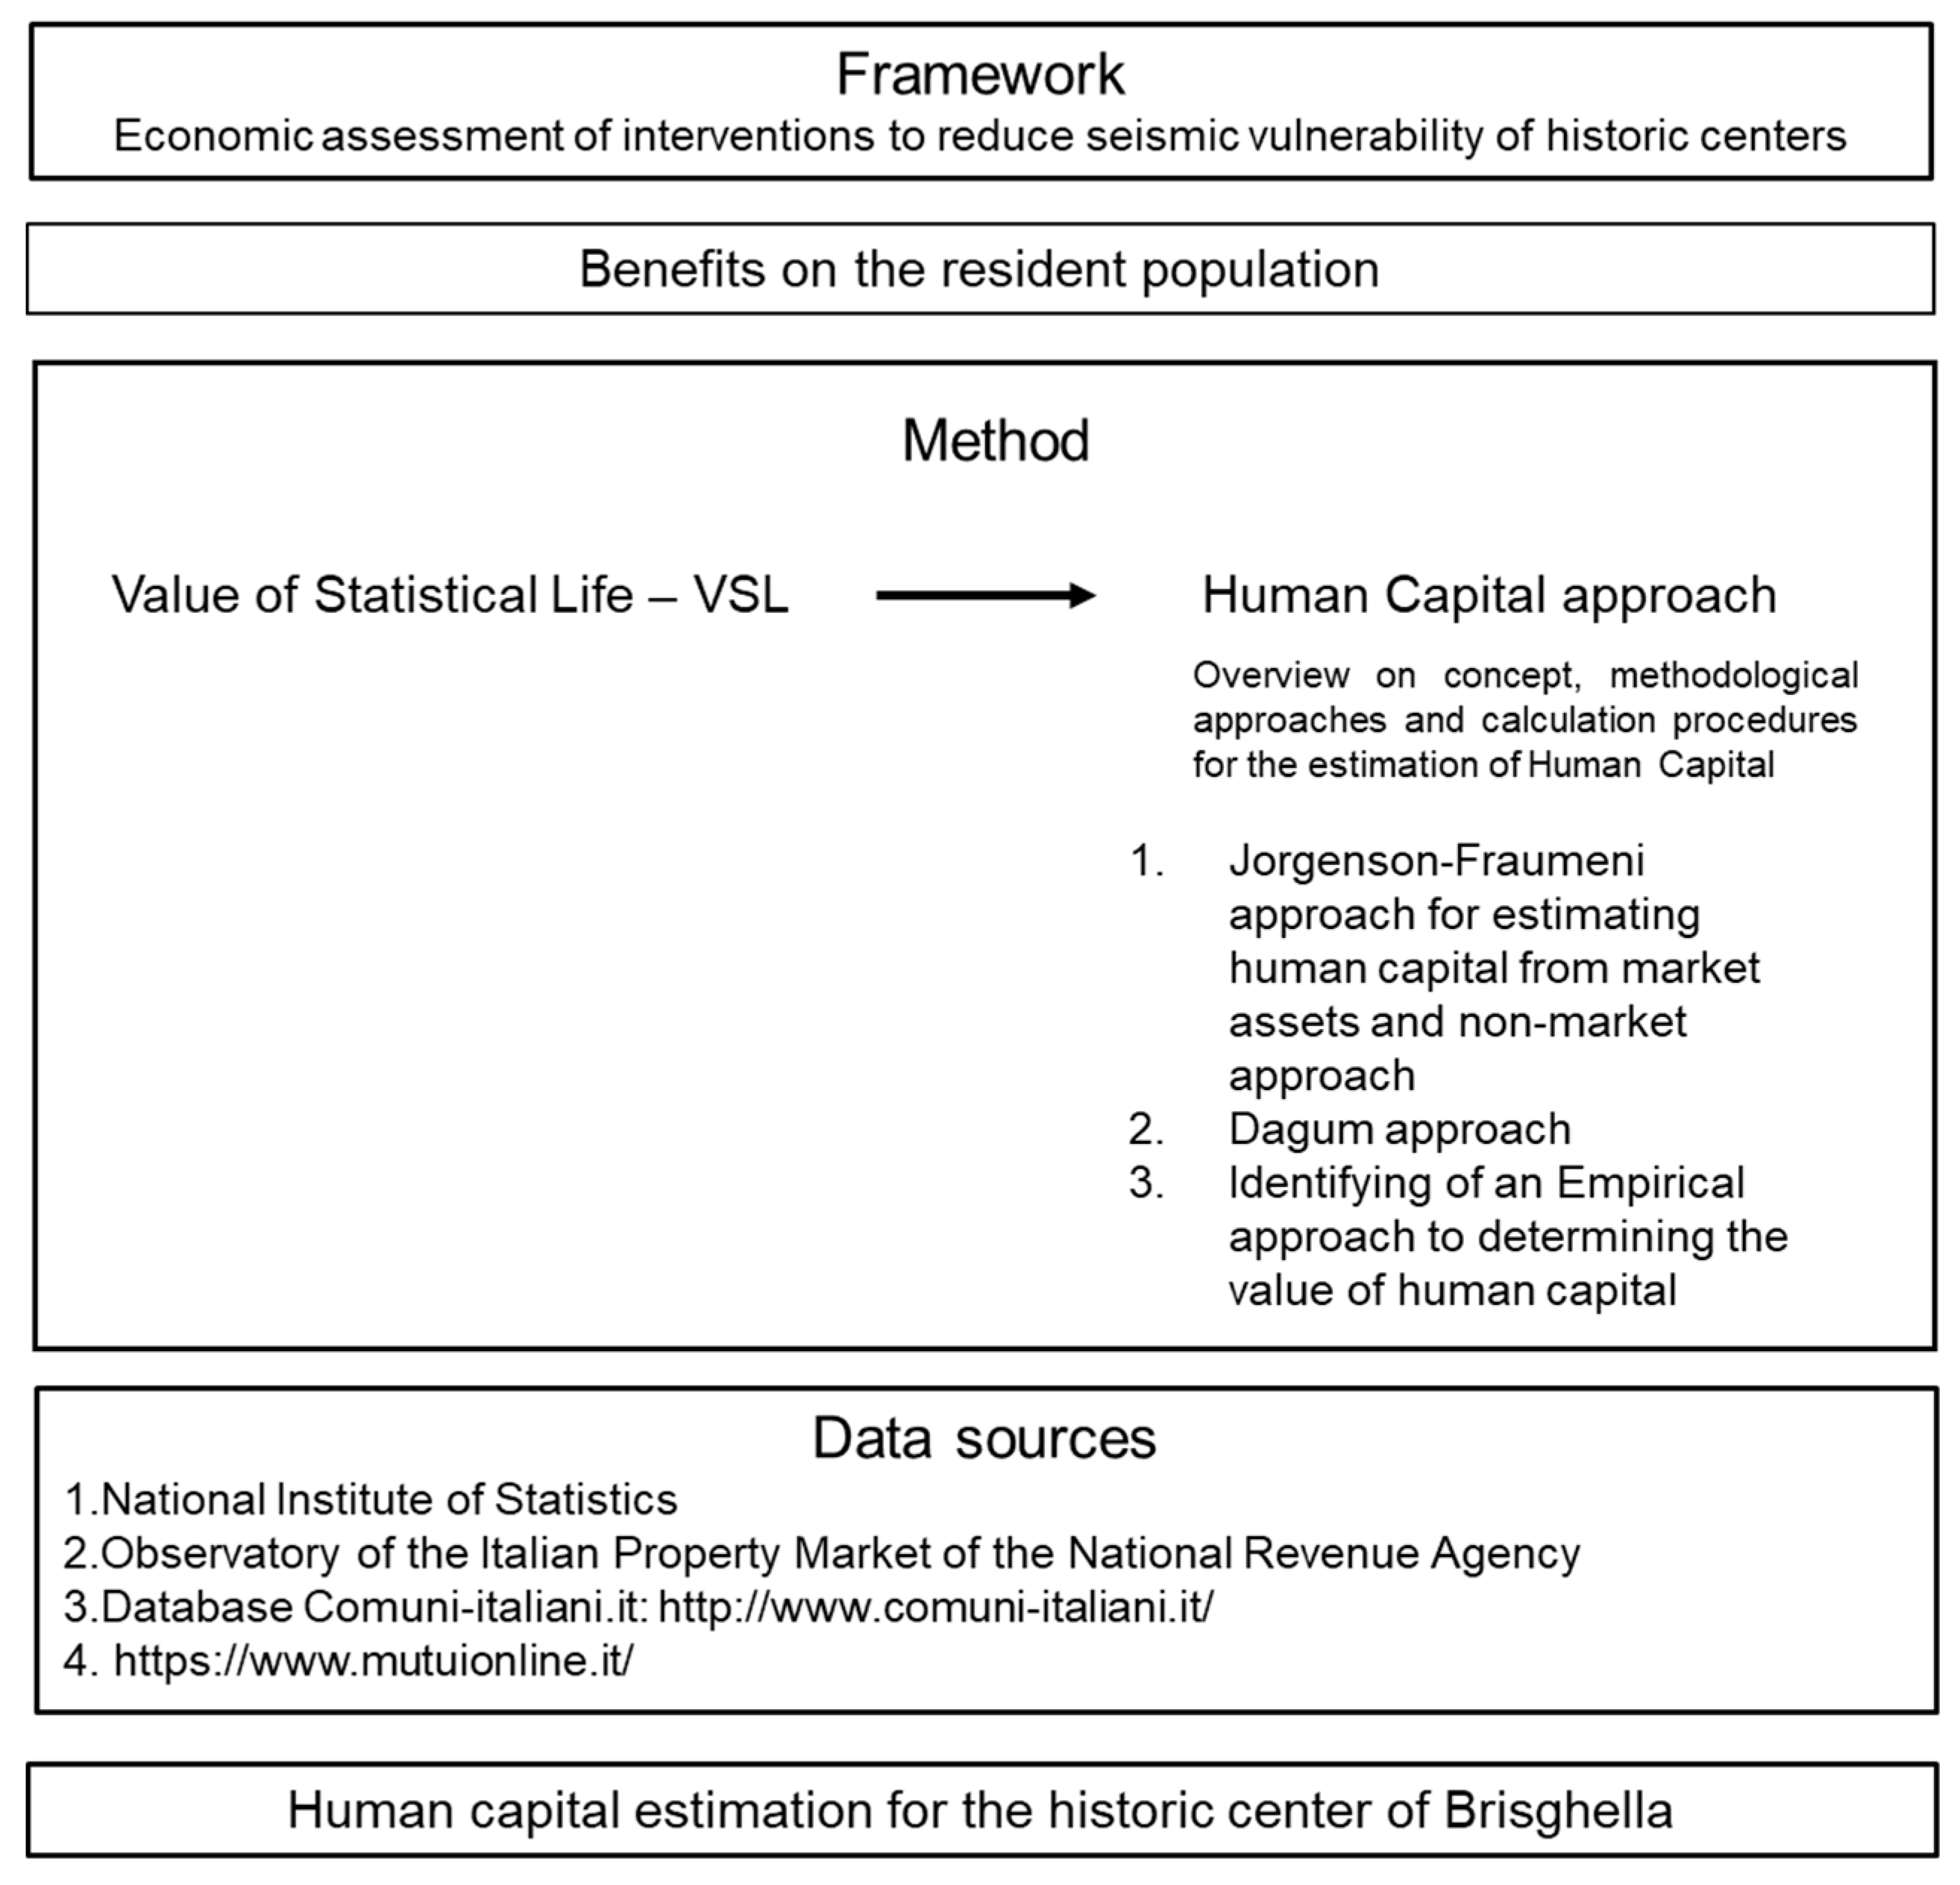
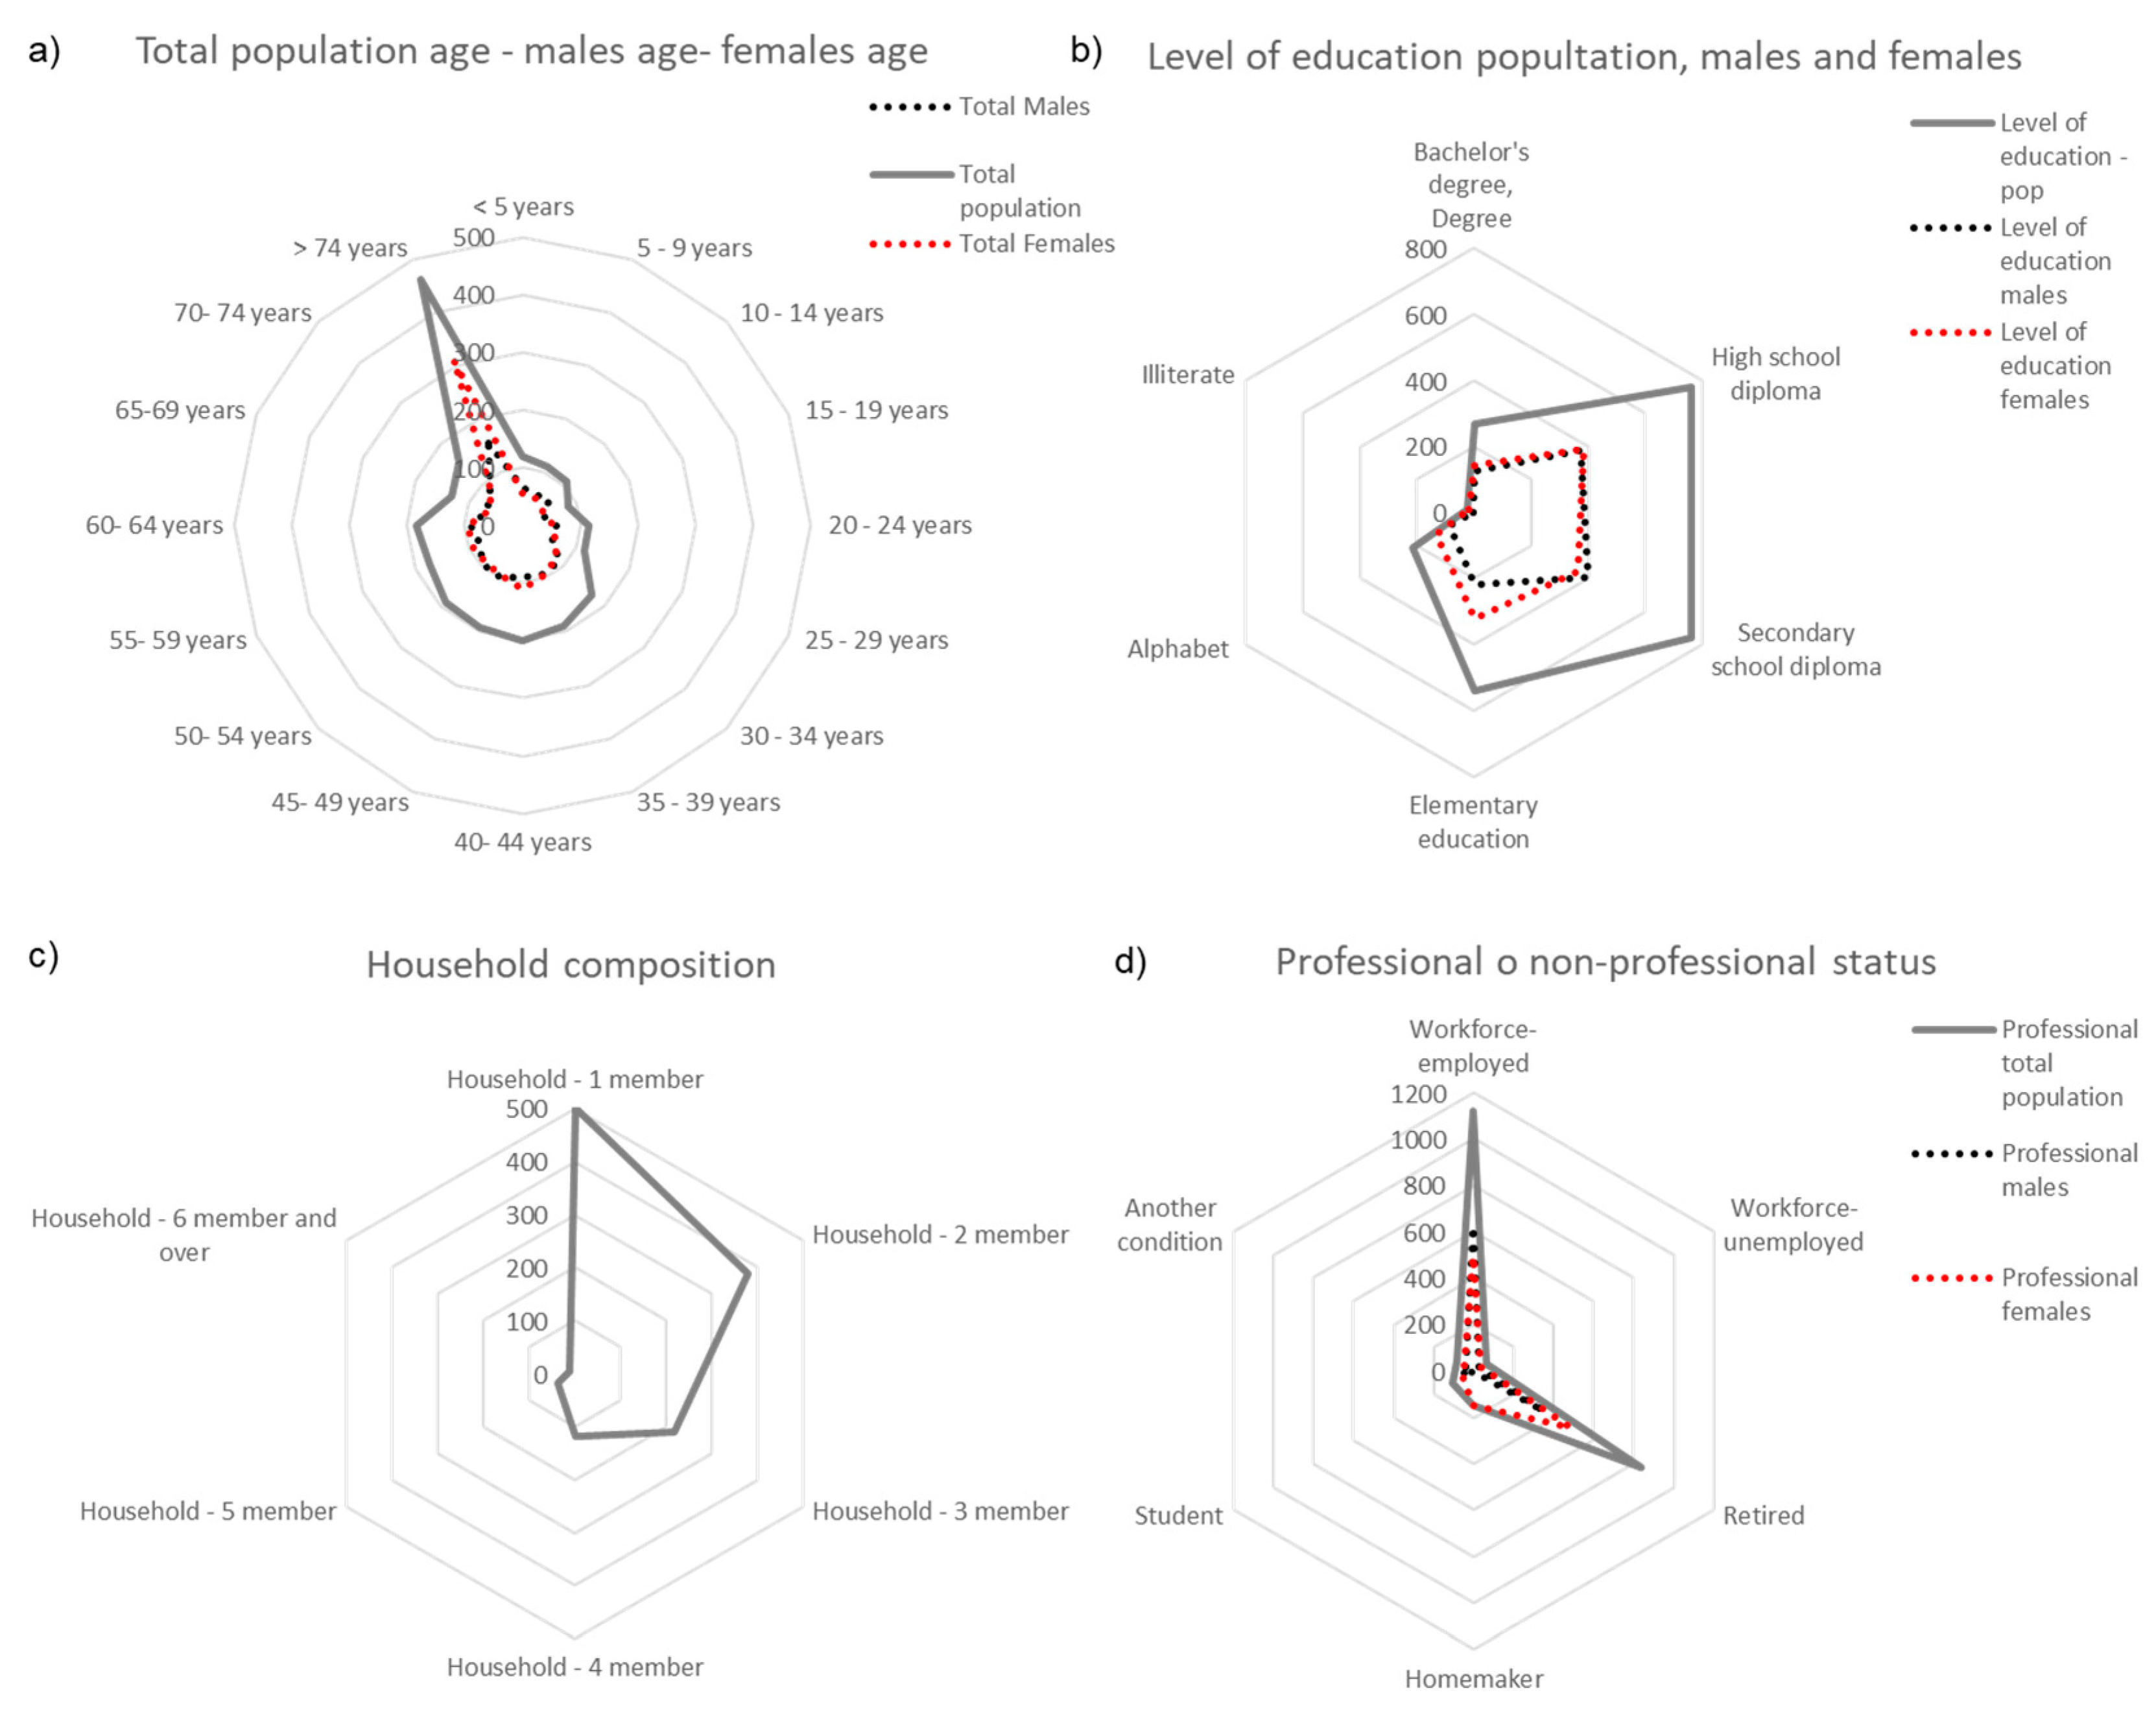
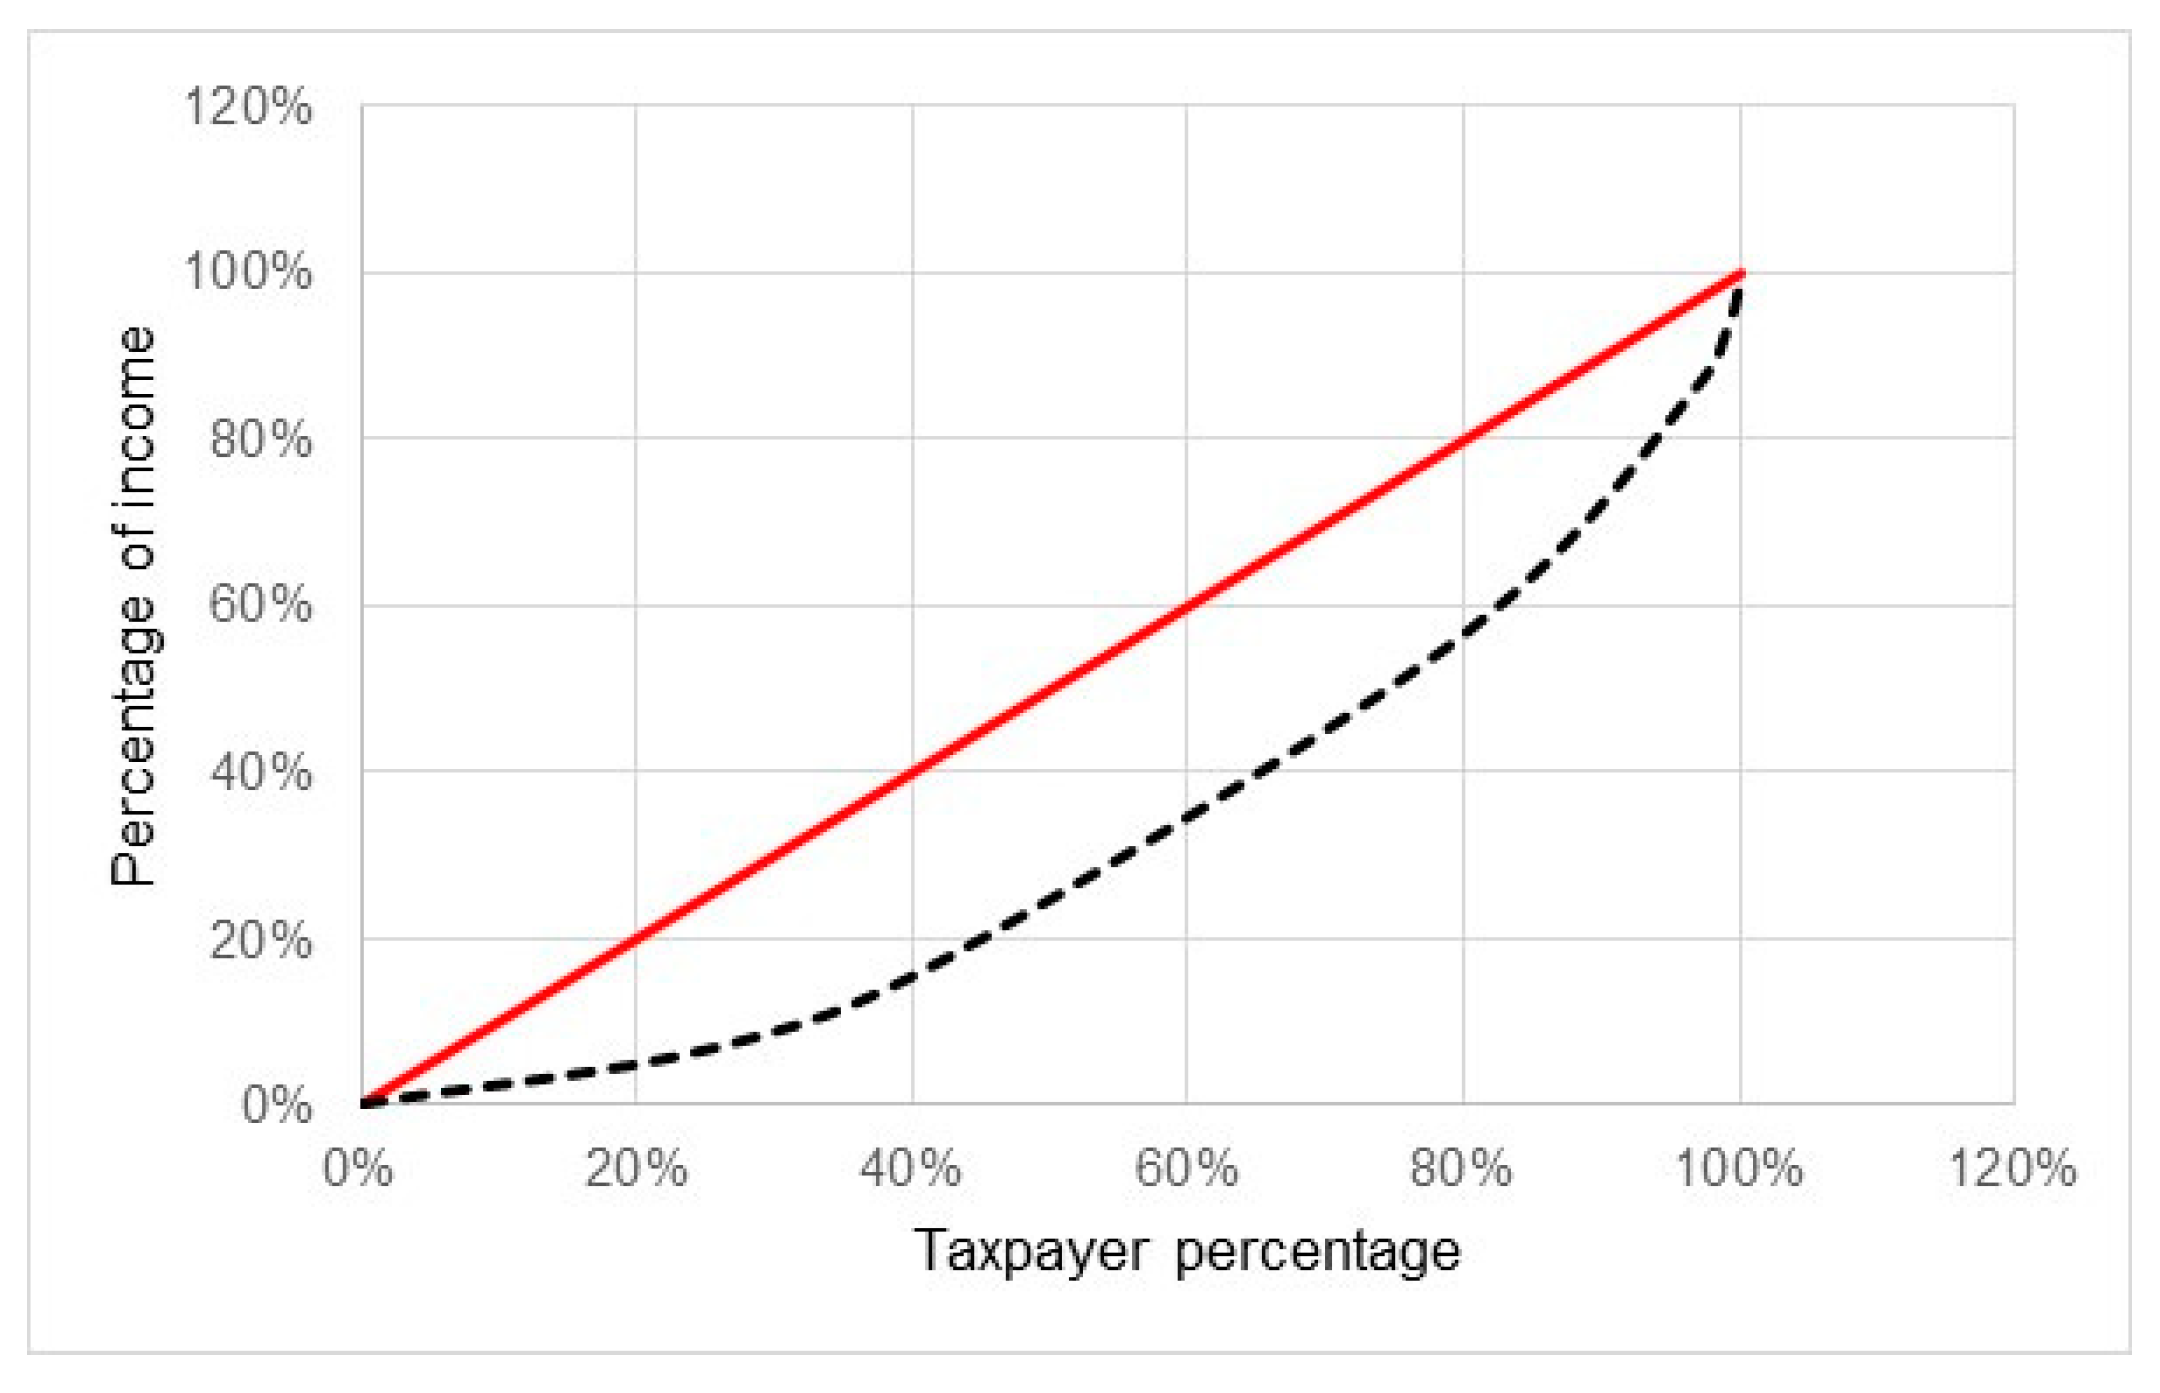
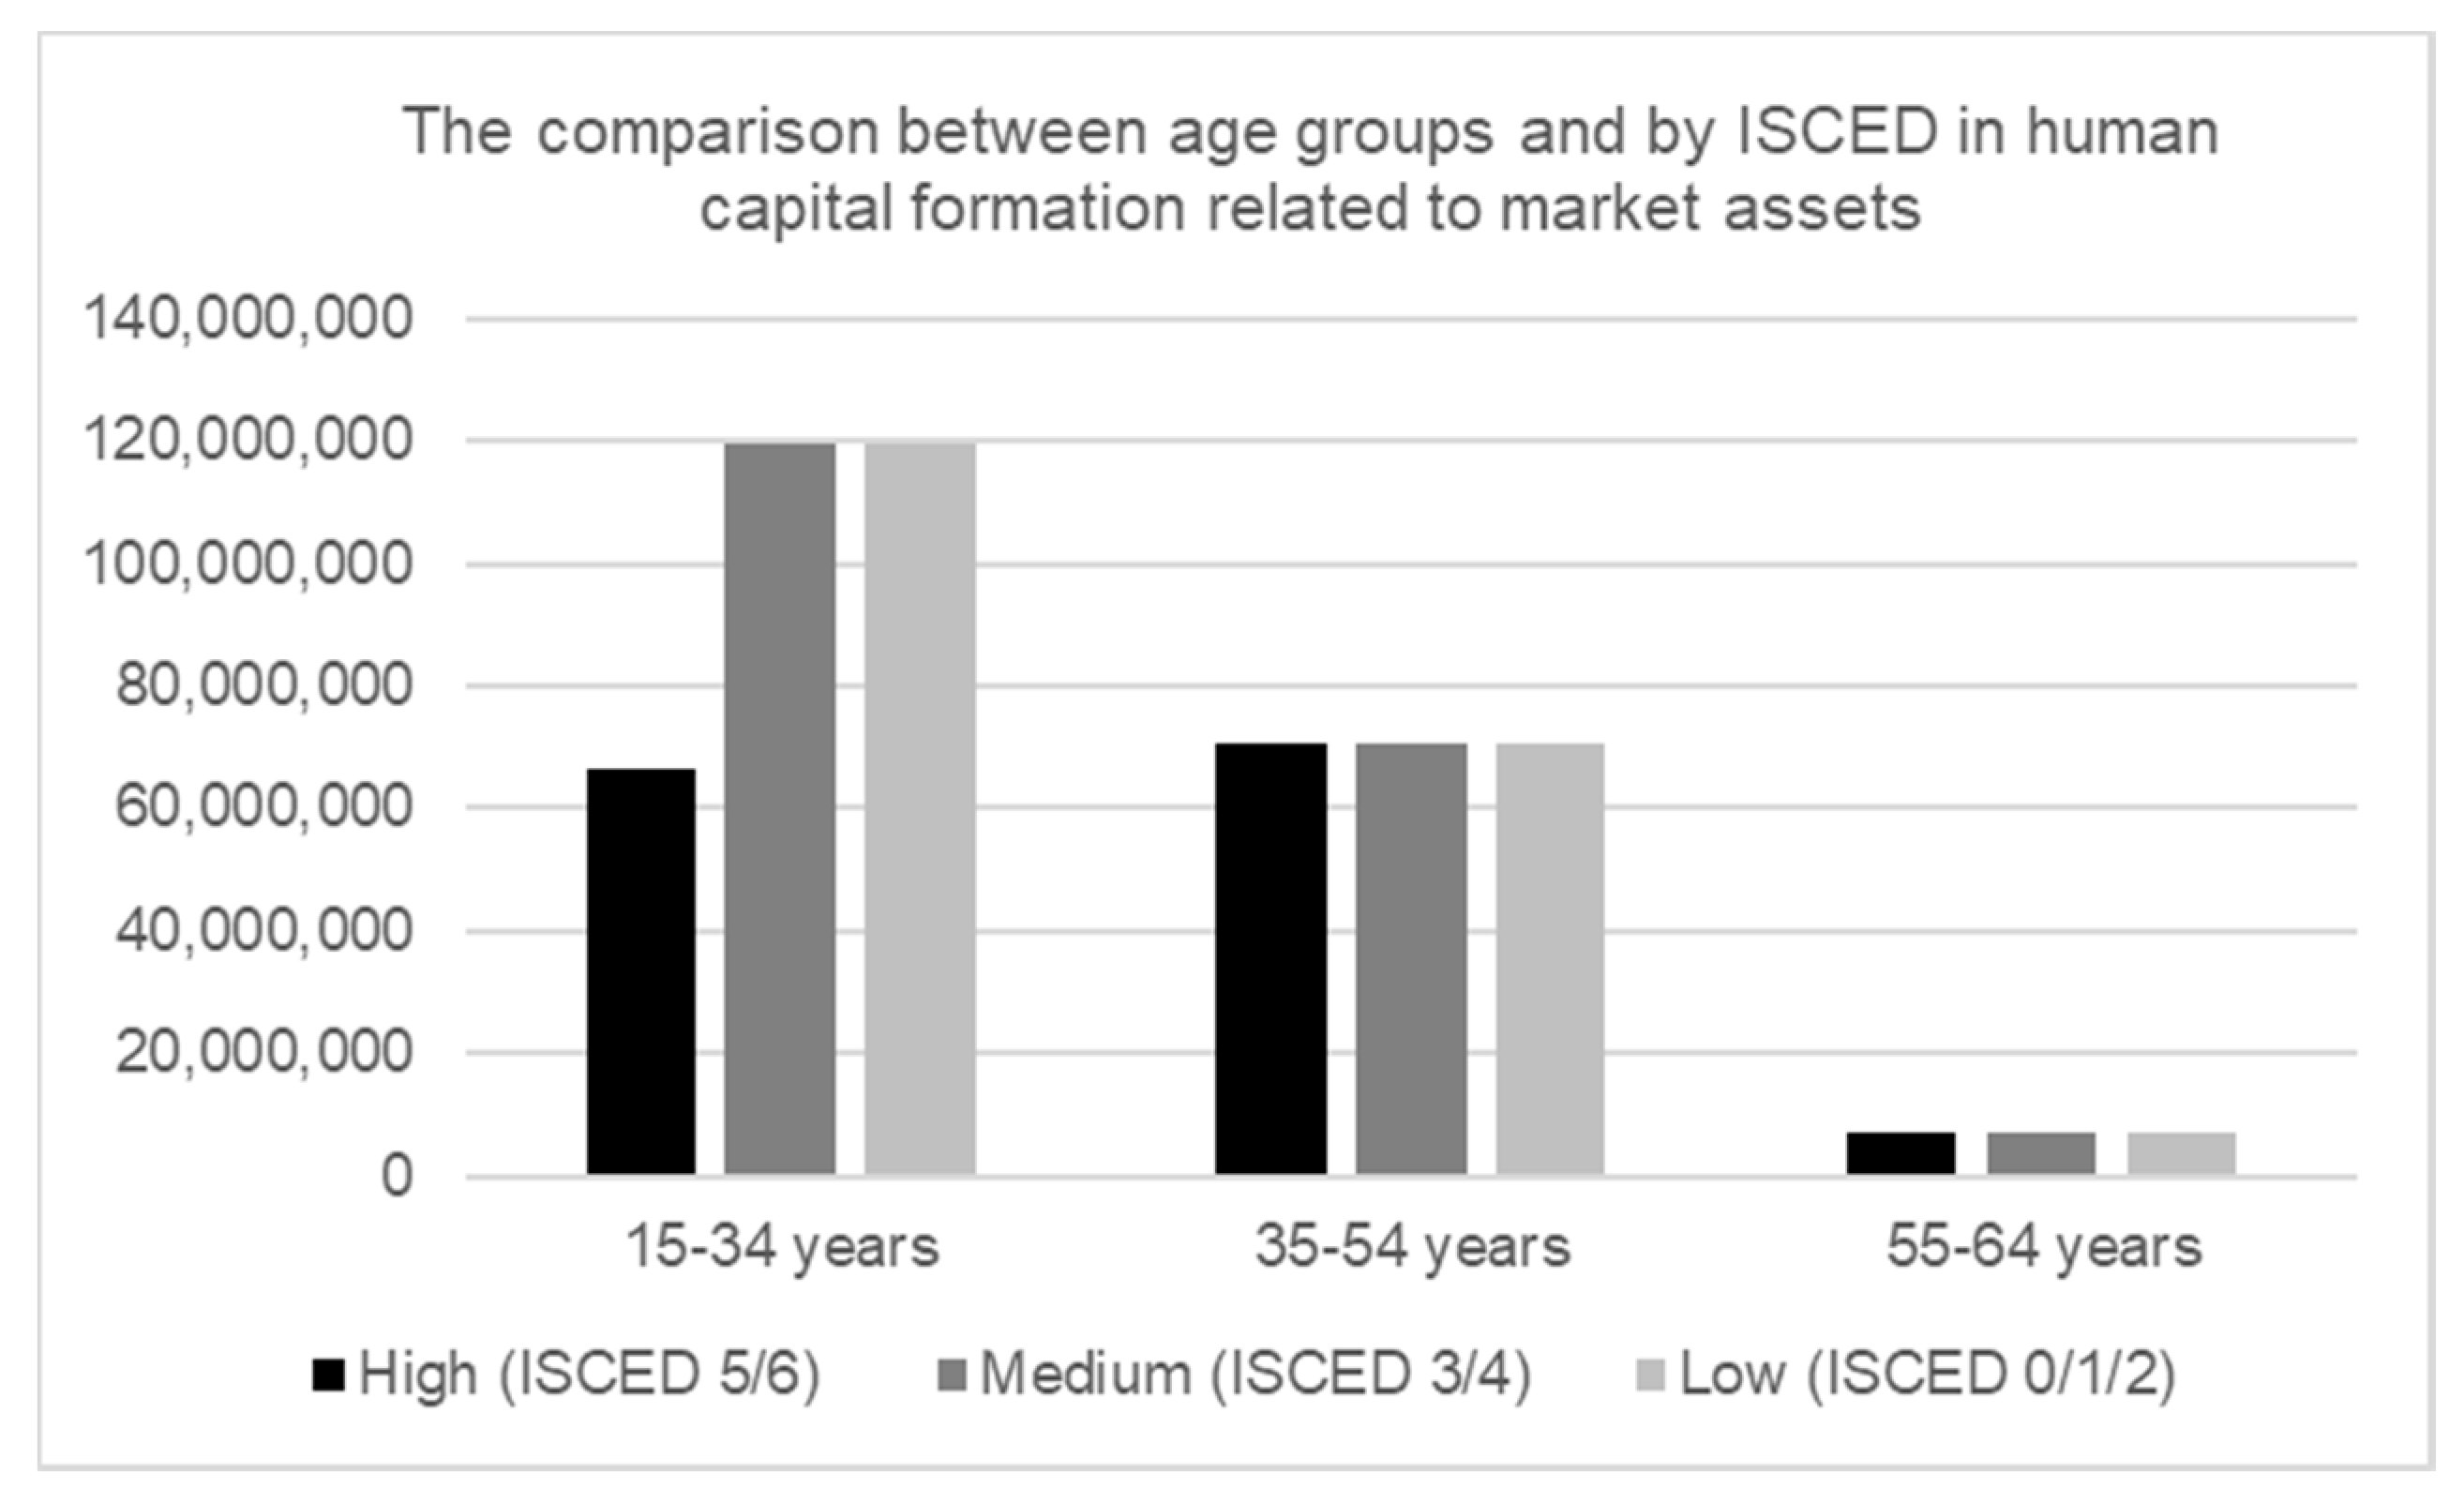
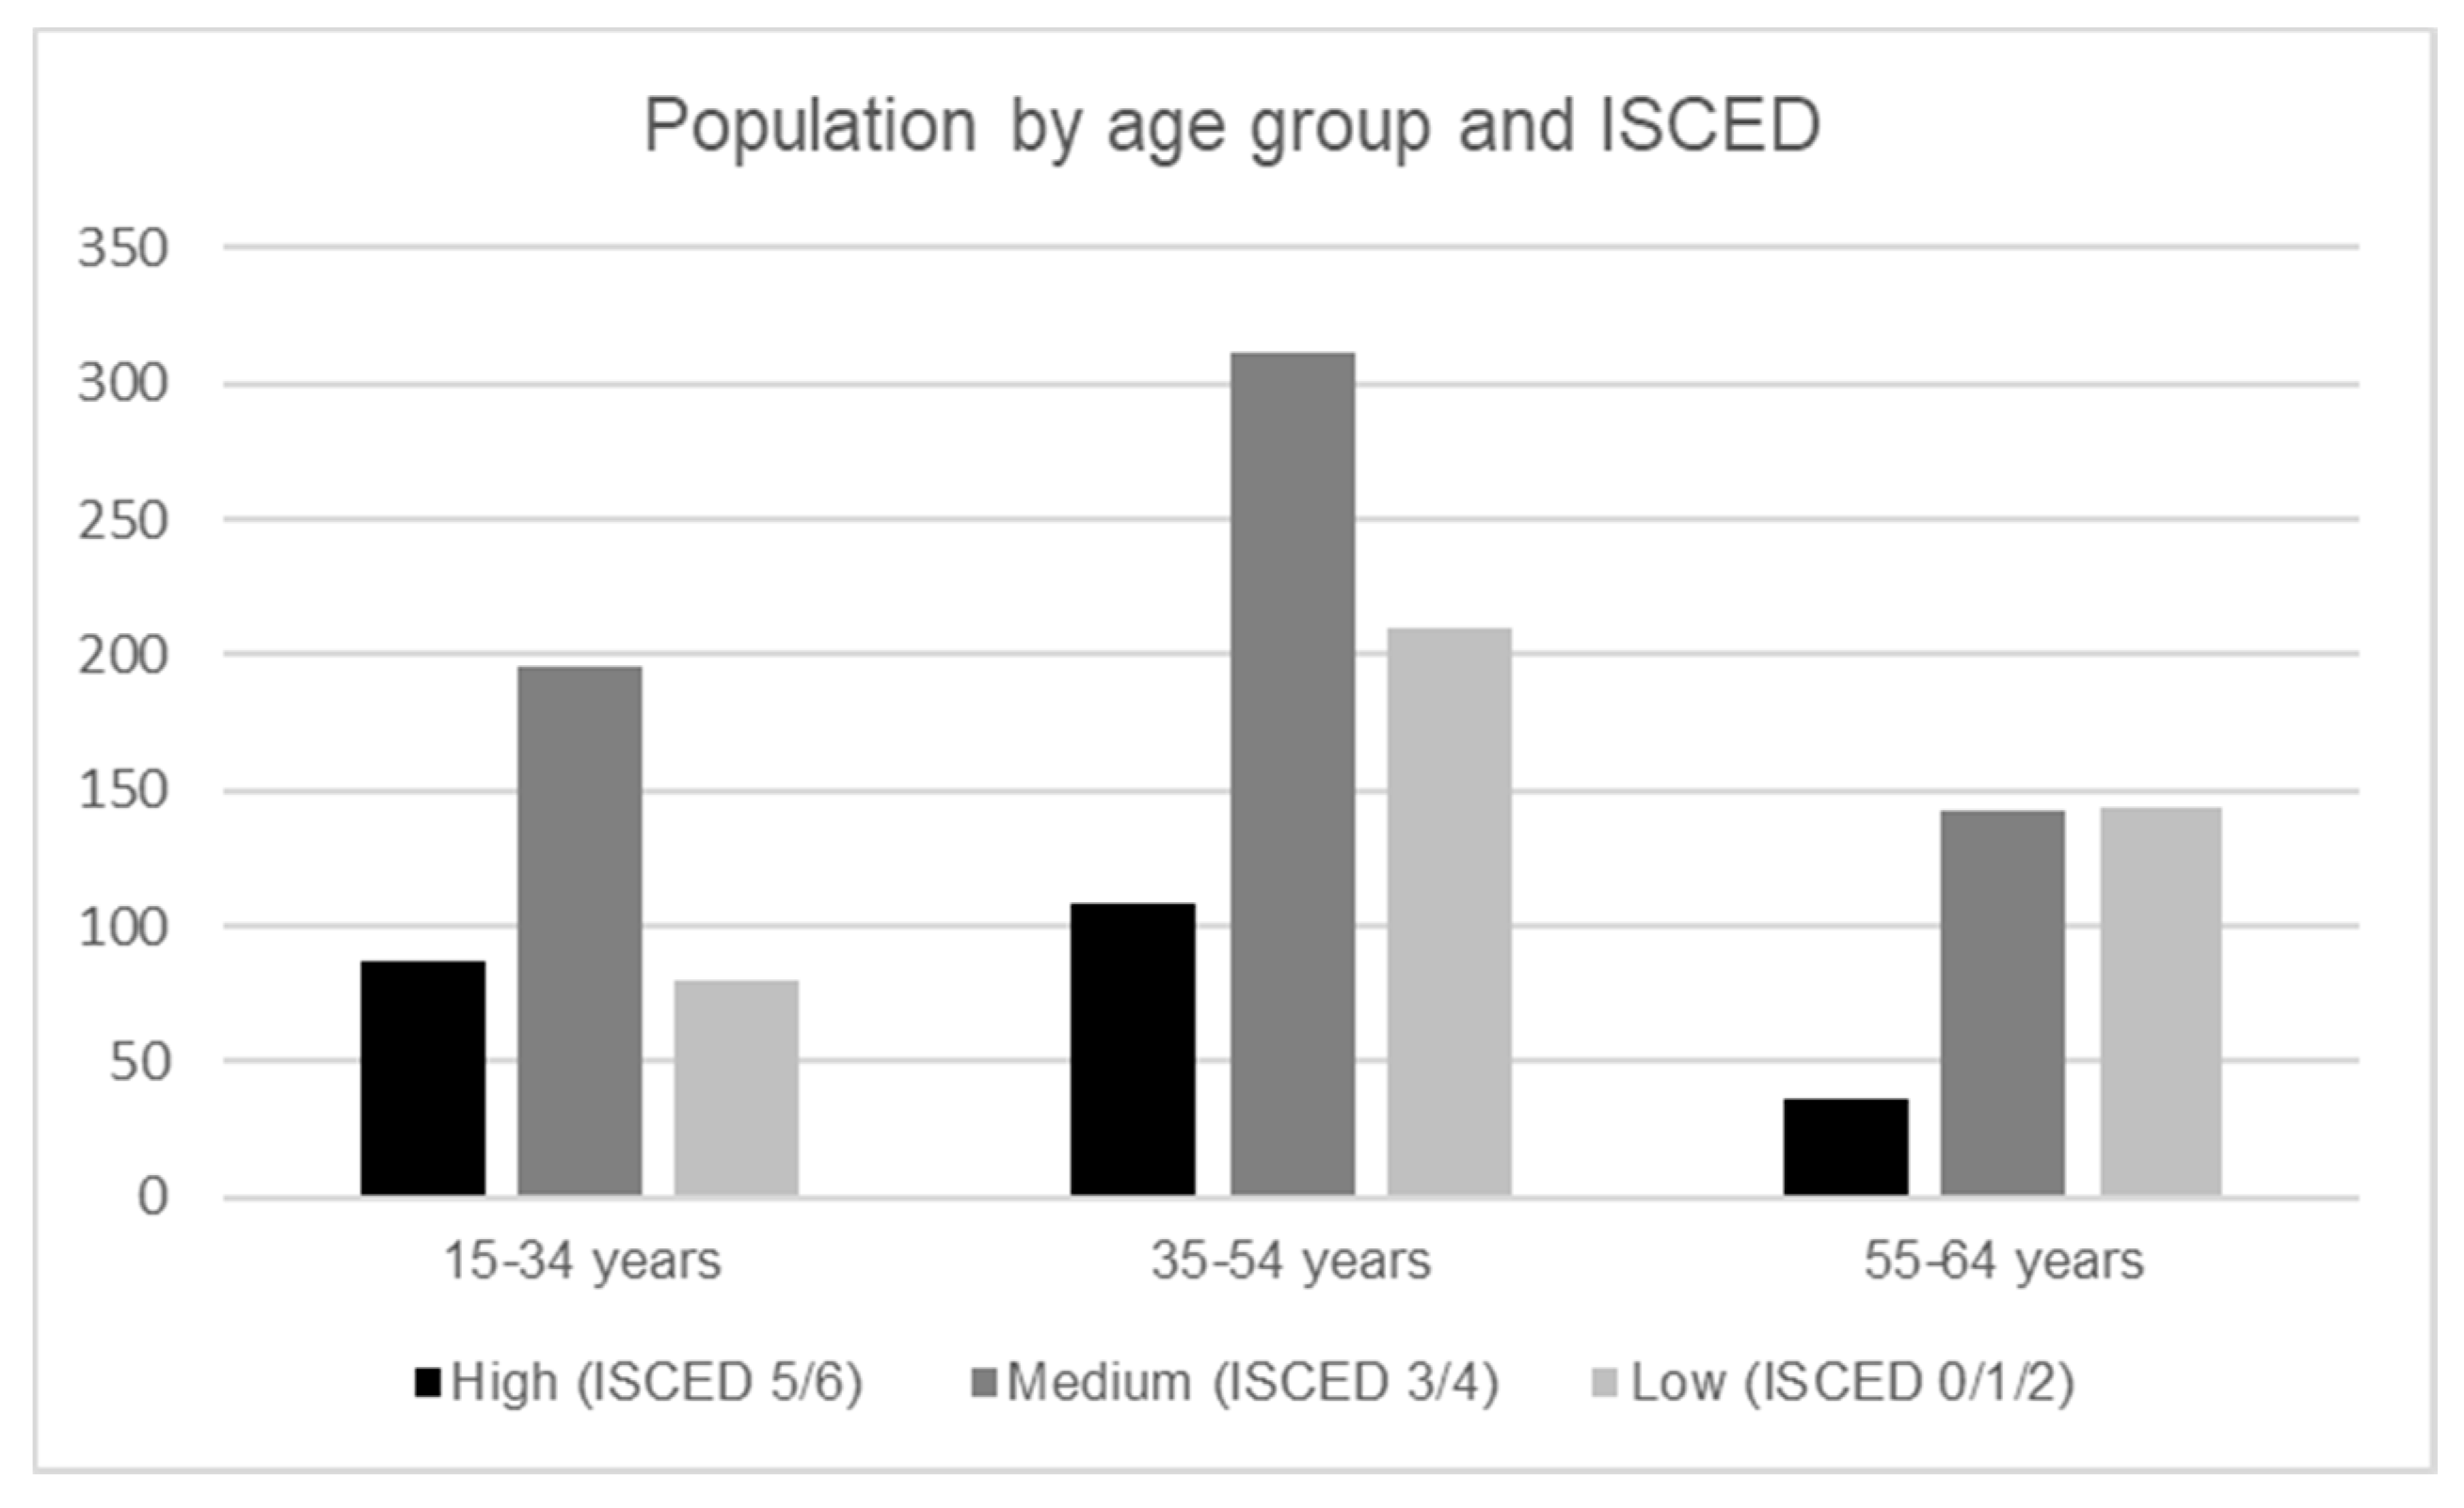
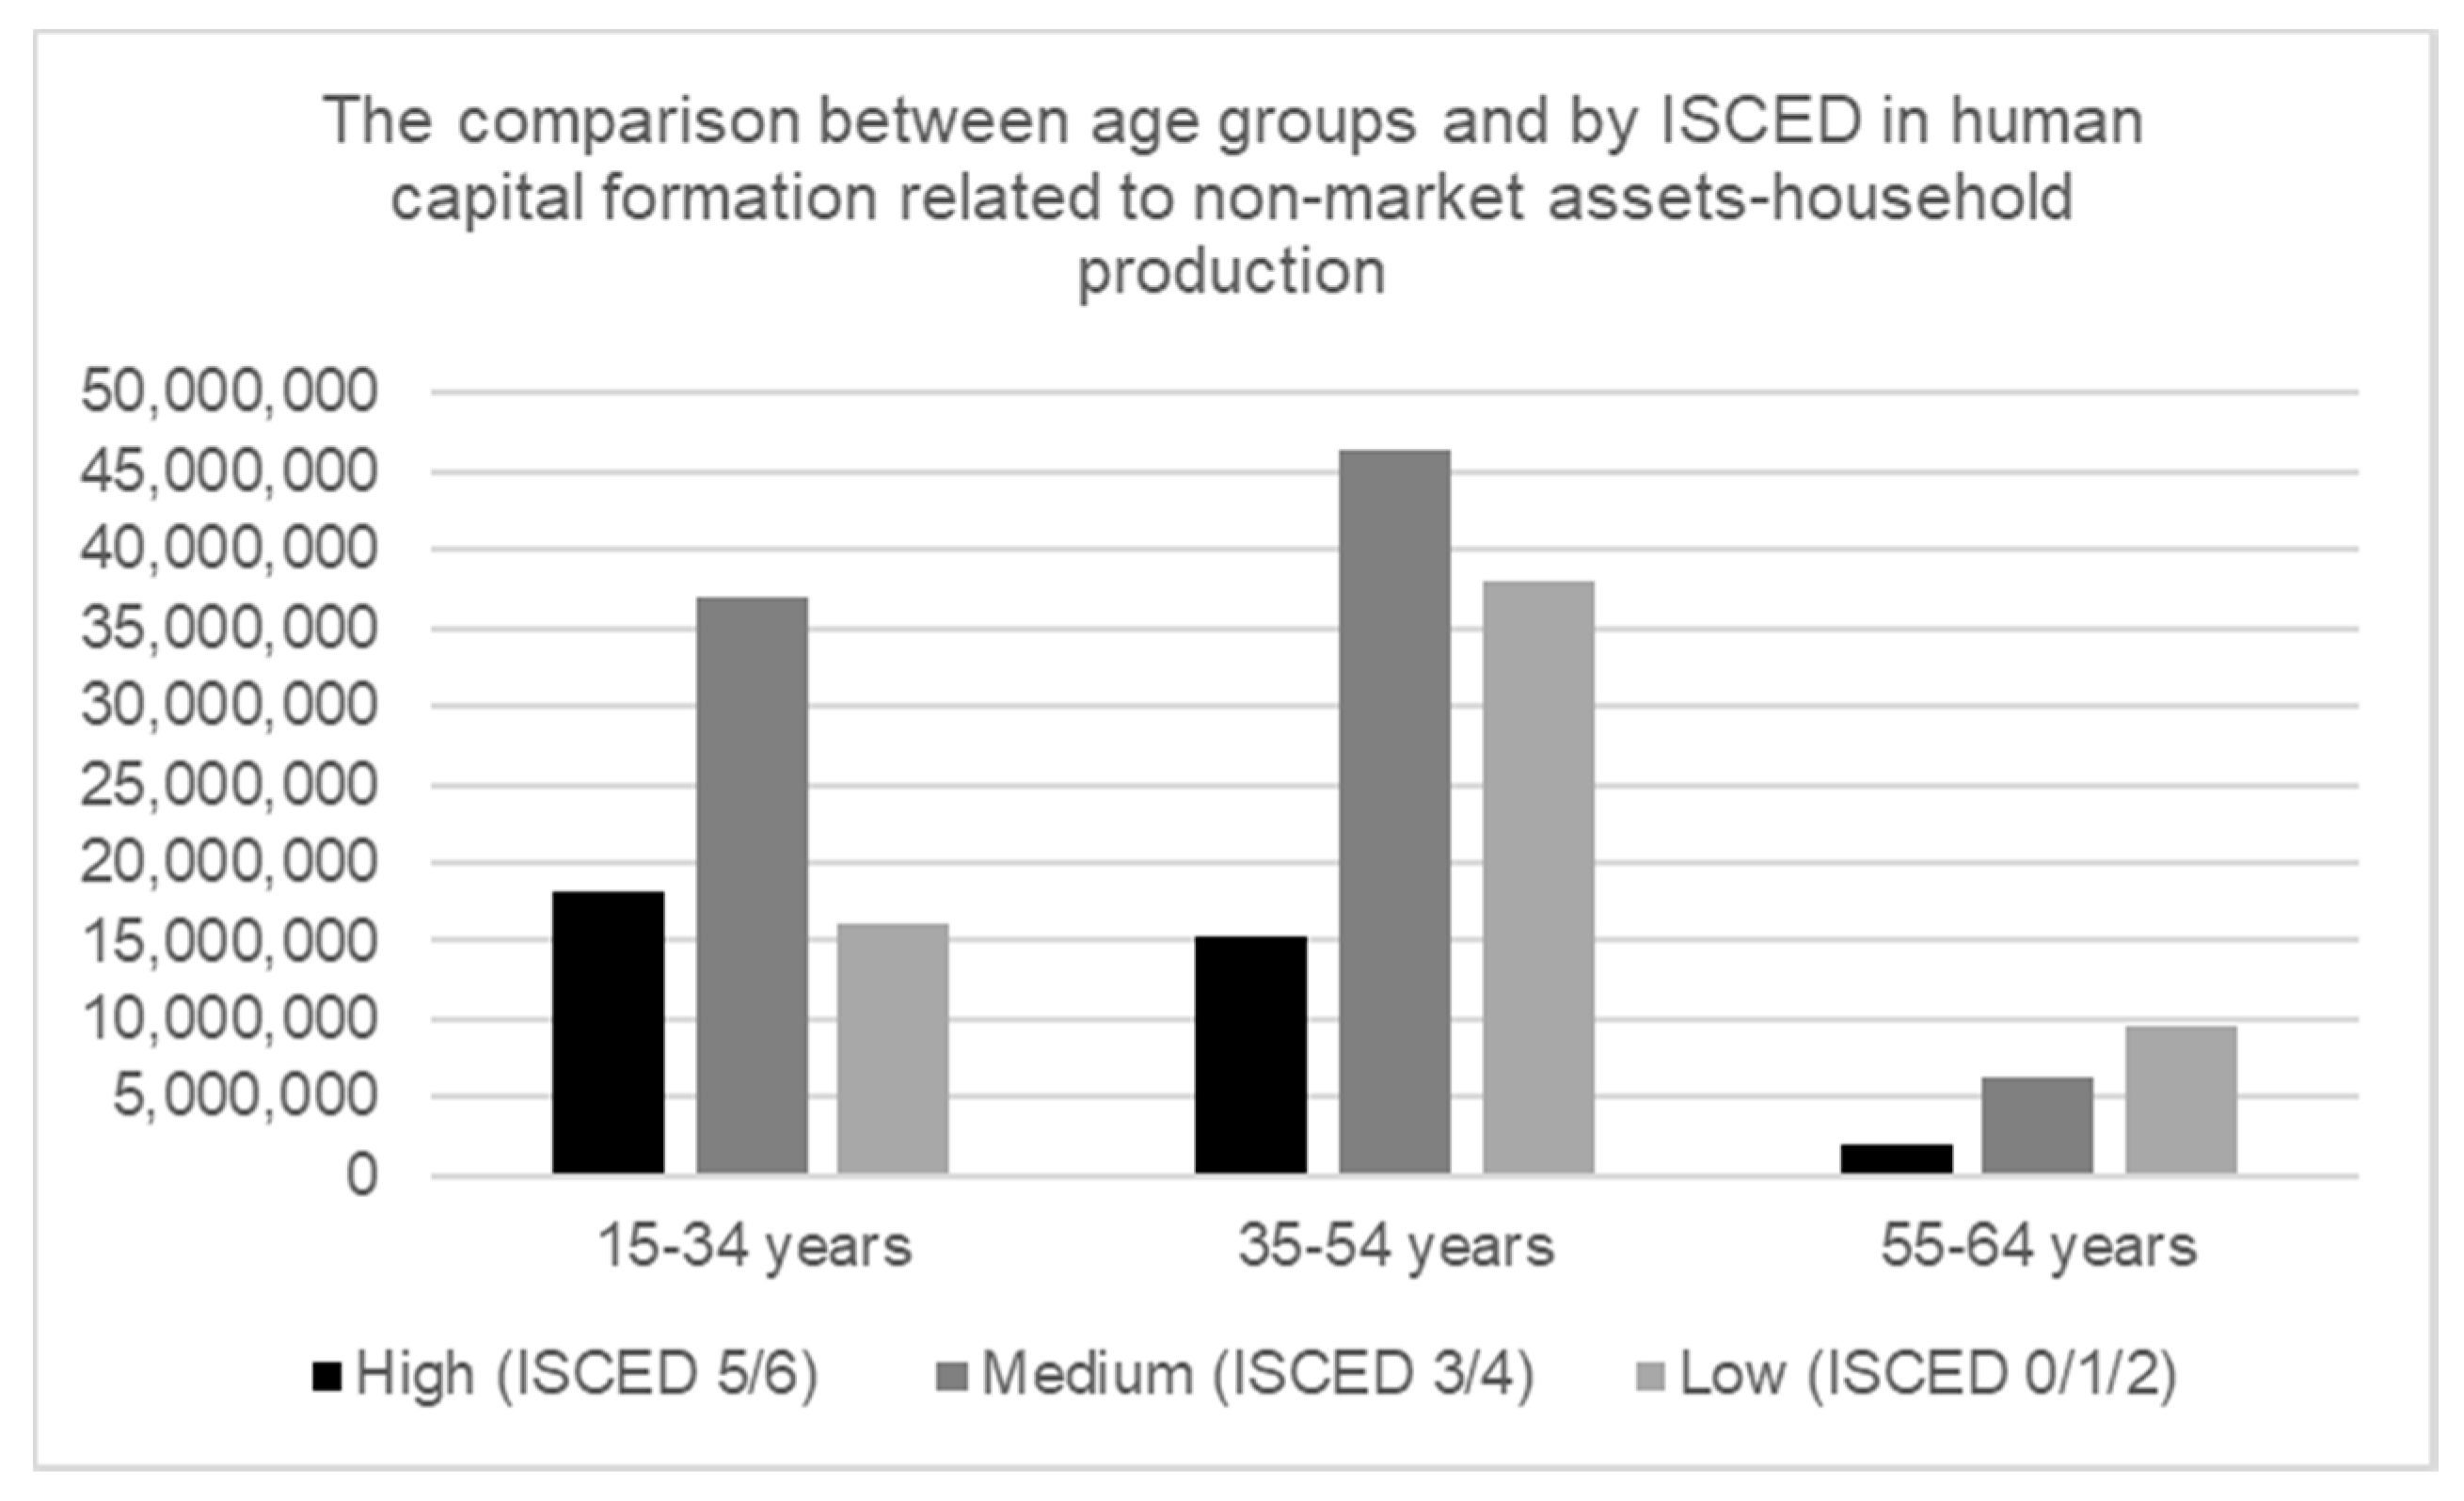
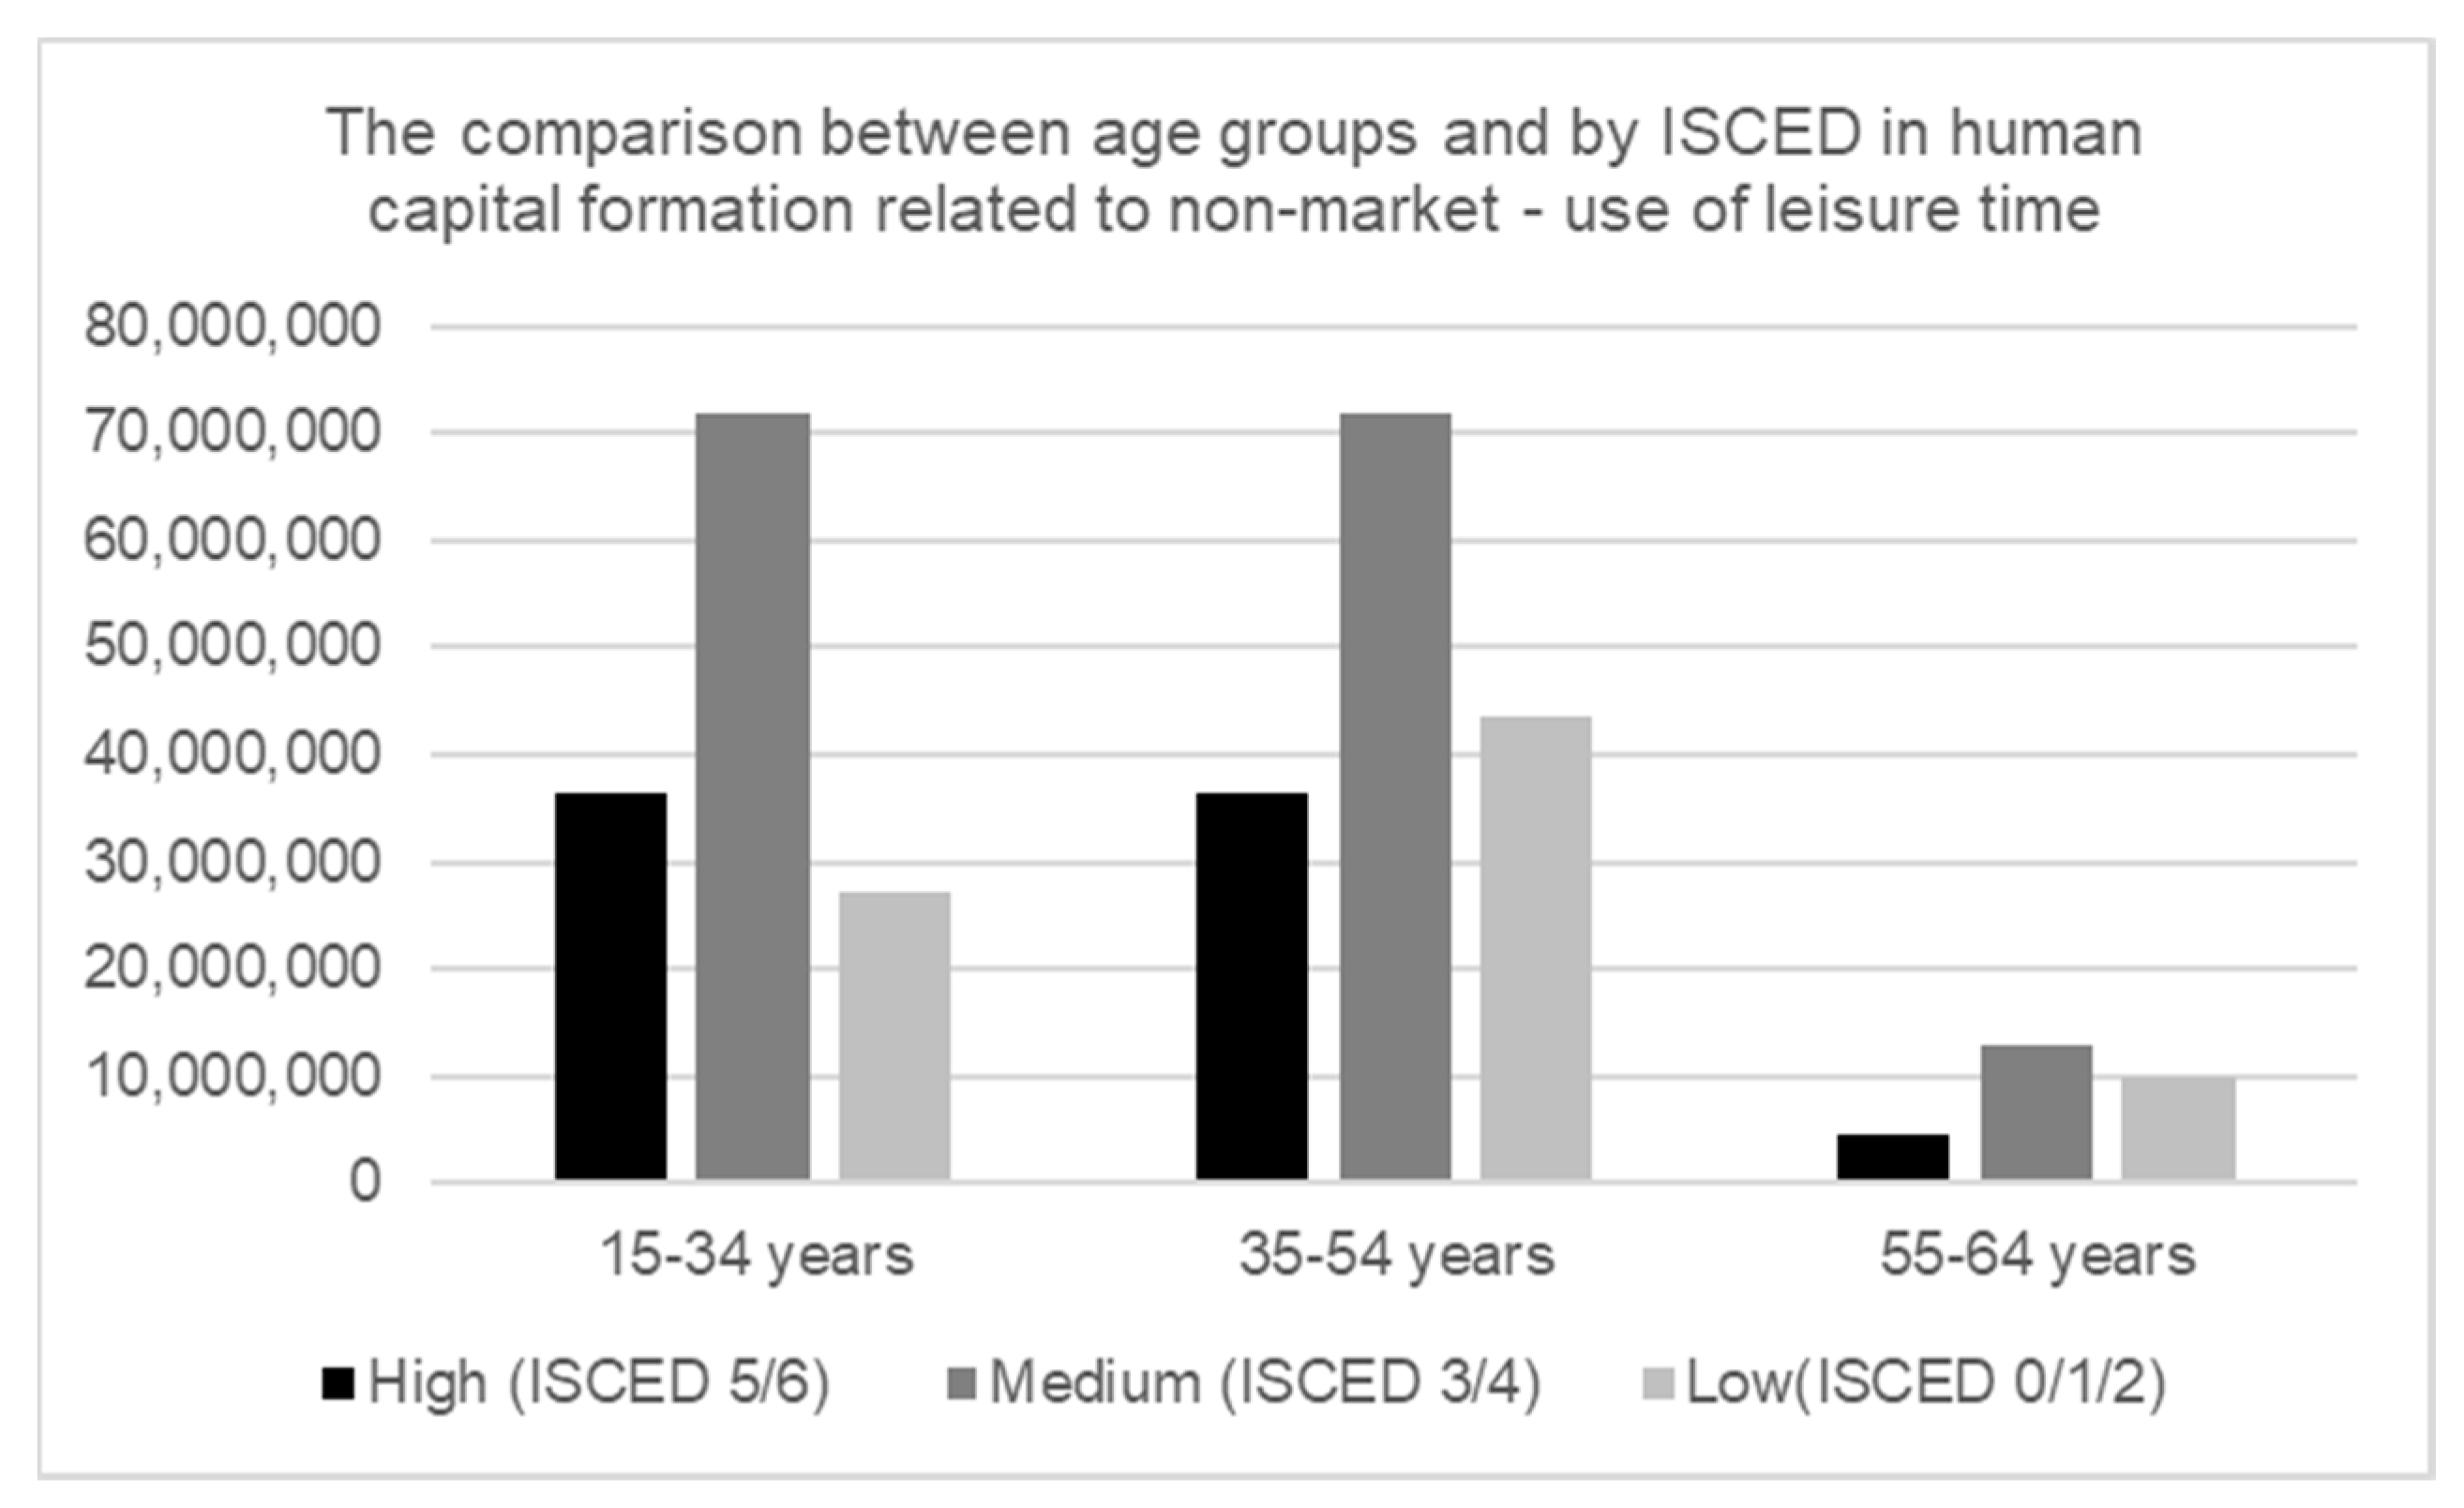
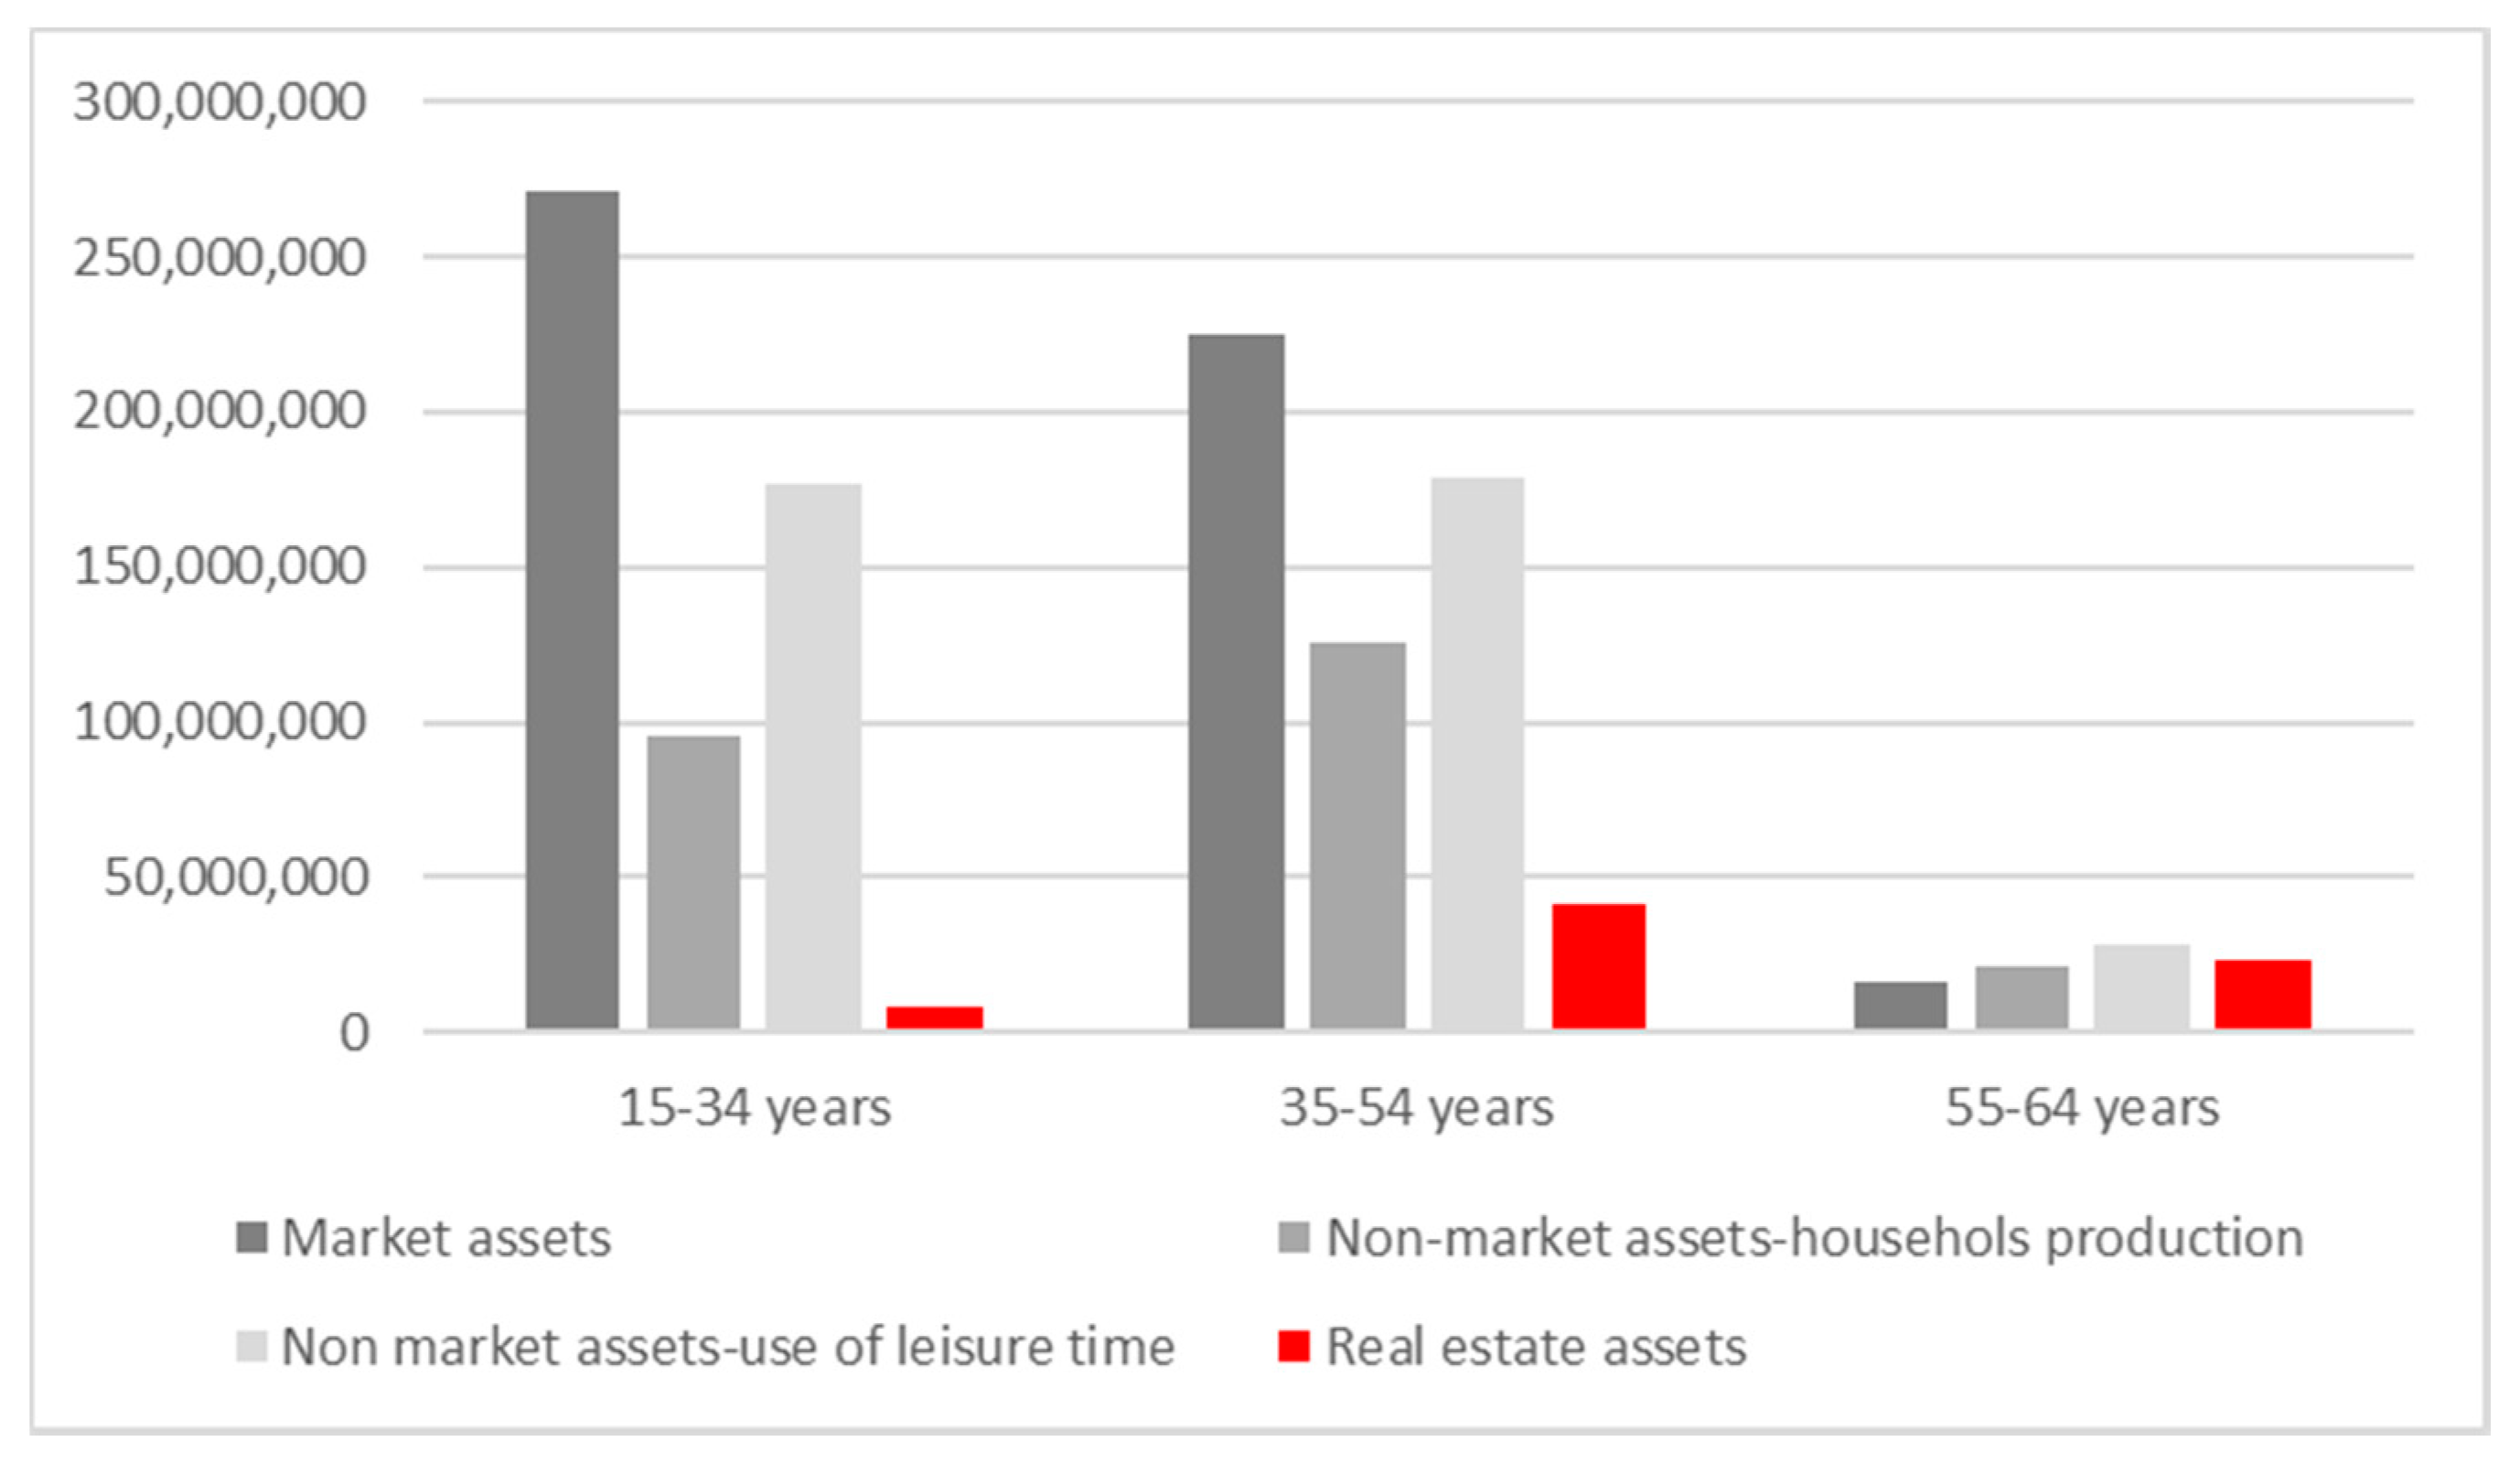
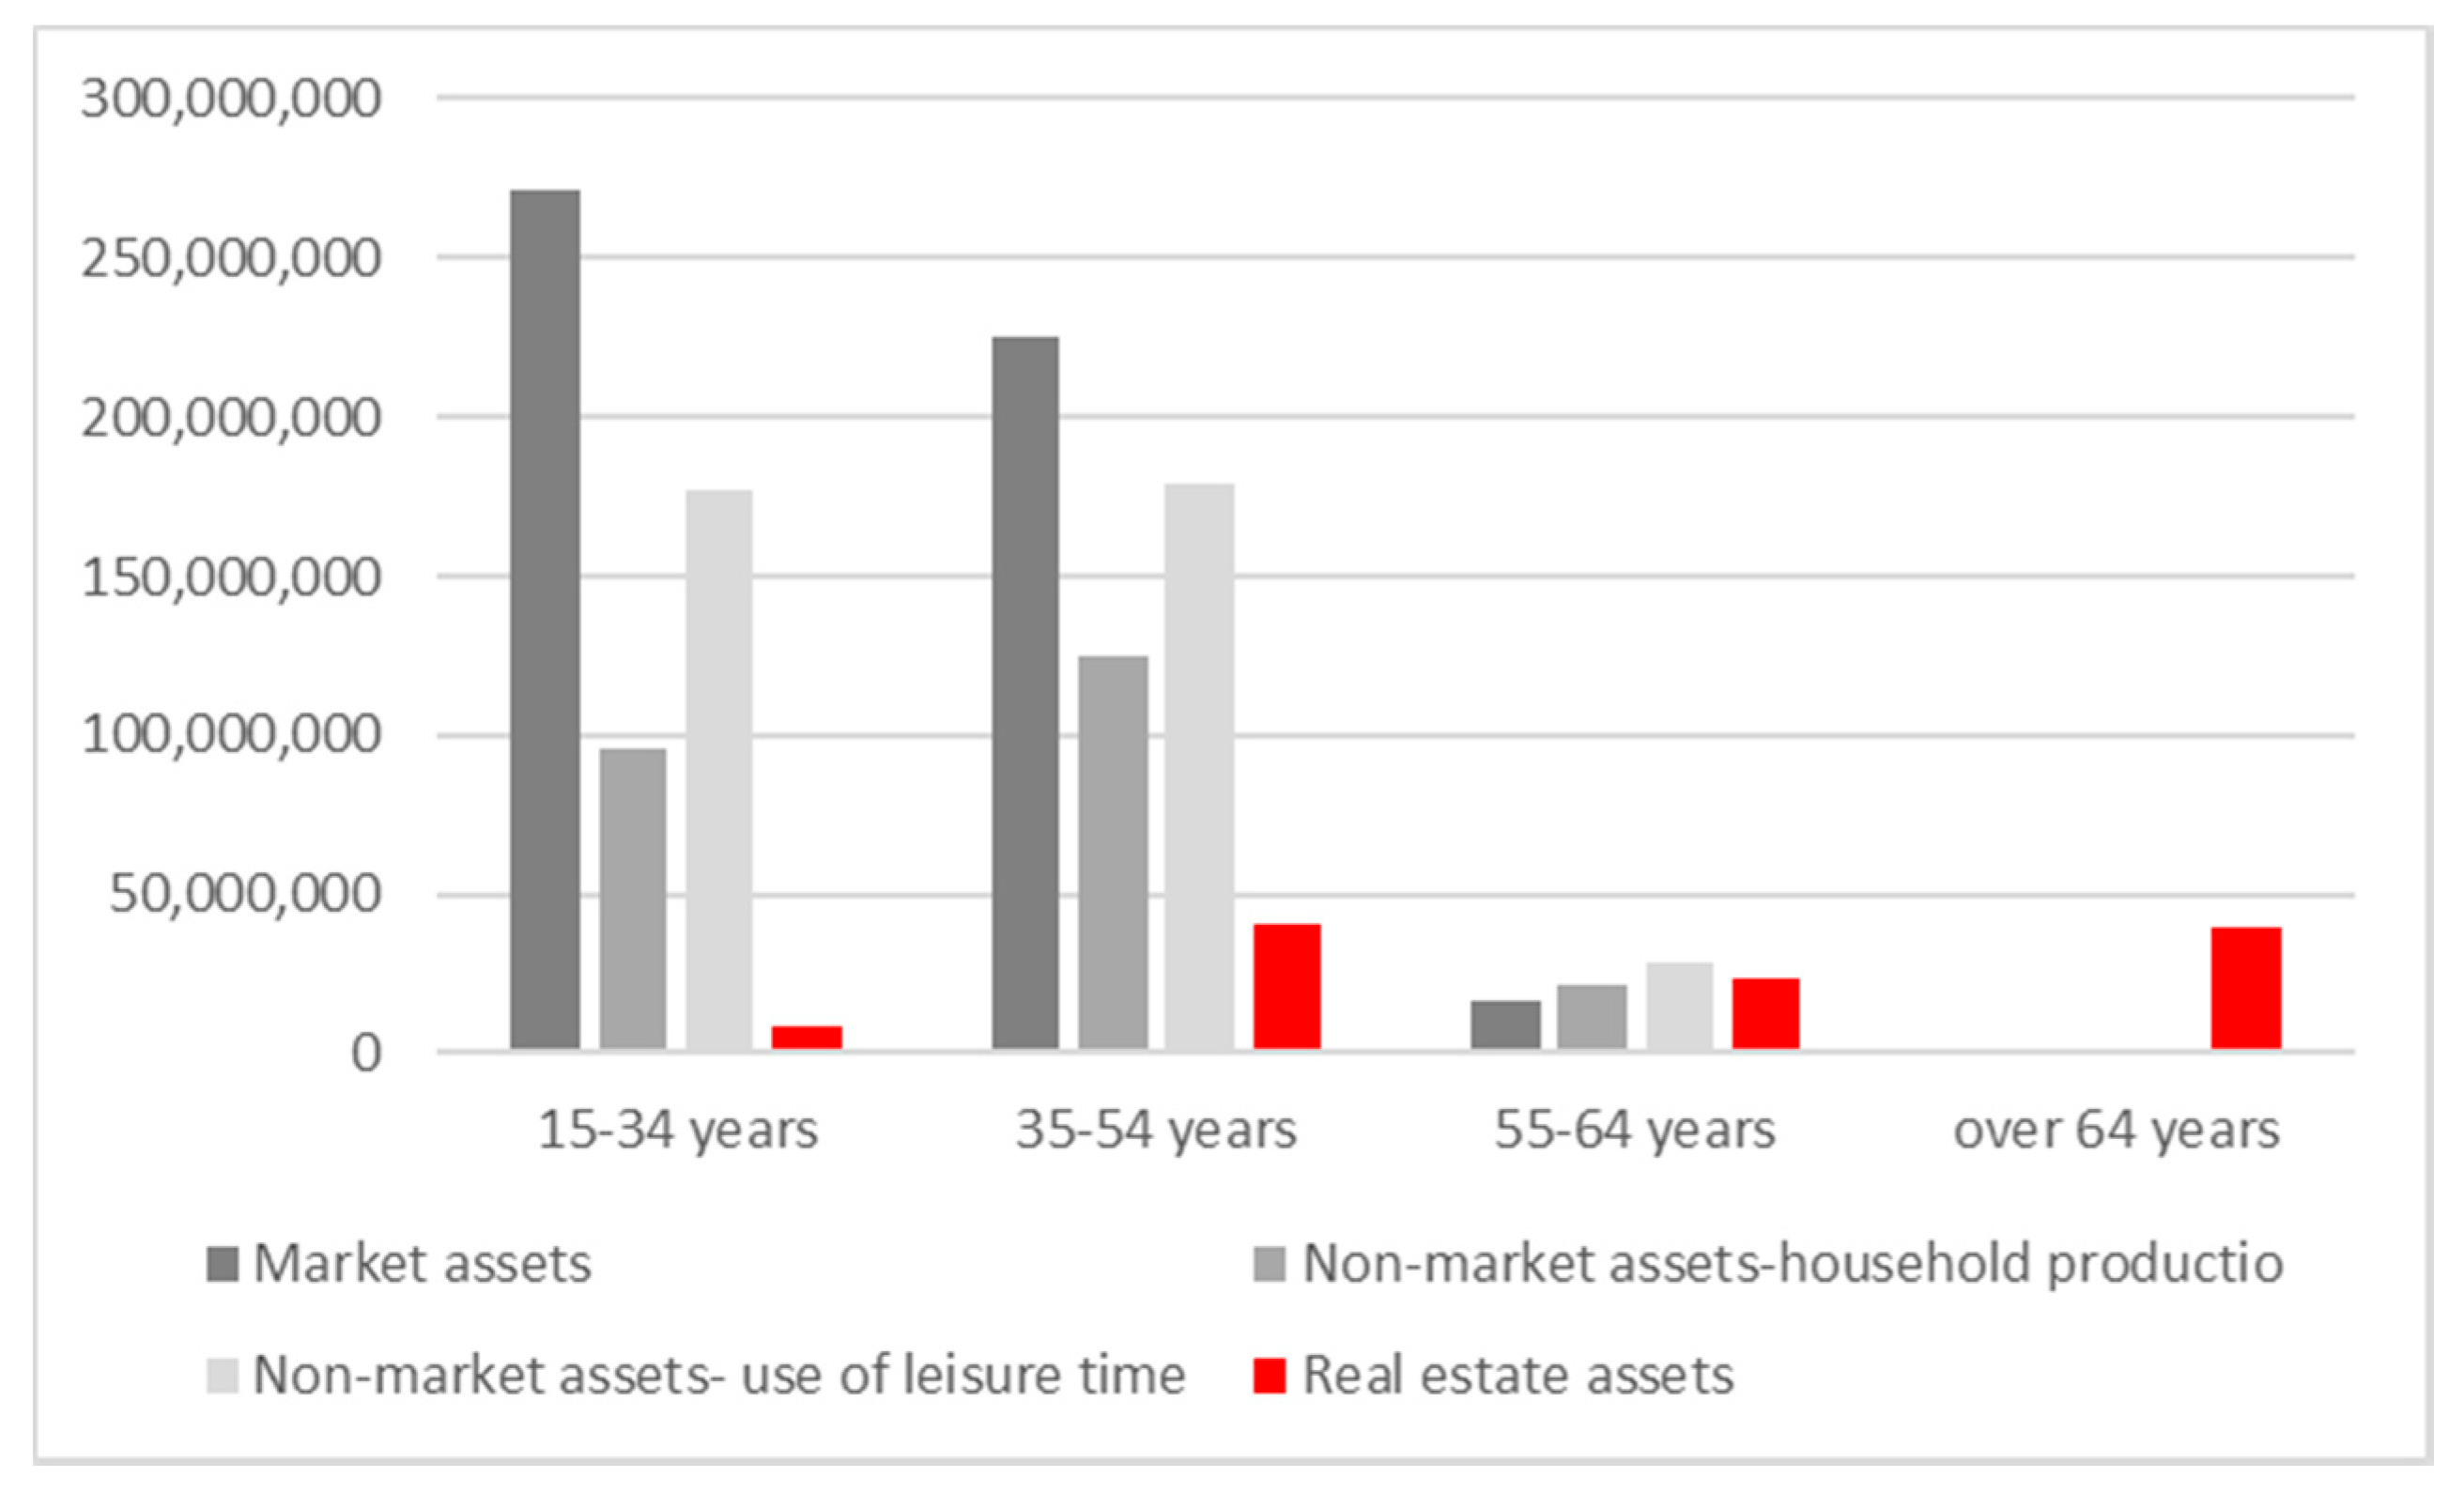
Table 1.
Total and per capita value of human capital stock in market assets by gender—year 2008 (total values in billions of euro and per capita values in thousands of euro) [97].
Table 1.
Total and per capita value of human capital stock in market assets by gender—year 2008 (total values in billions of euro and per capita values in thousands of euro) [97].
| Gender | Human Capital (Billions of Euros) | Population Aged 15 to 64 | Human Capital (Thousands of Euros) |
|---|---|---|---|
| Males | 8925 | 19,696,777 | 453 |
| Females | 4549 | 19,721,955 | 231 |
| Total | 13,474 | 39,418,732 | 342 (average) |
Table 2.
Total and per capita value of human capital stock in non-market assets by gender, Italy—year 2008 (total values in billions of euro and per capita values in thousands of euros) [97].
Table 2.
Total and per capita value of human capital stock in non-market assets by gender, Italy—year 2008 (total values in billions of euro and per capita values in thousands of euros) [97].
| Gender | Human Capital (Billions of Euros) | Population Aged 15 to 64 | Human Capital (Thousands of Euros) |
|---|---|---|---|
| Males | 7556 | 19,696,777 | 384 |
| Females | 8496 | 19,721,955 | 431 |
| Total | 16,053 | 39,418,732 | 401(average) |
Table 3.
Value of human capital stock from market assets and age groups—Brisighella.
| Value of Human Capital Stock from Market Assets and Age Groups in Thousands of Euros—Brisighella | ||
|---|---|---|
| 15–34 years | 35–54 years | 55–64 years |
| thousands € | thousands € | thousands € |
| 271,328 | 225,317 | 16,468 |
Table 4.
Value of human capital stock from market assets, age groups and by International Standard Classification for Education (ISCED) (educational level)—Brisighella.
Table 4.
Value of human capital stock from market assets, age groups and by International Standard Classification for Education (ISCED) (educational level)—Brisighella.
| Value of Human Capital Stock from Market Assets, Age Groups and by ISCED in Thousands of Euros—Brisighella | |||
|---|---|---|---|
| 15–34 years | 35–54 years | 55–64 years | |
| thousands € | thousands € | thousands € | |
| High (ISCED 5/6) | 66,294 | 70,416 | 6948 |
| Medium (ISCED 3/4) | 119,364 | 99,209 | 8008 |
| Low (ISCED 0/1/2) | 34,800 | 36,960 | 3024 |
| Total | 220,458 | 206,585 | 17,980 |
Table 5.
Value of human capital stock from non-market assets and age groups—Brisighella.
| Value of Human Capital Stock from Non-Market Assets and Age Groups in Thousands of Euros—Brisighella | |||
|---|---|---|---|
| Household production | 15–34 years | 35–54 years | 55–64 years |
| thousands € | thousands € | thousands € | |
| 95,648 | 125,347 | 21,122 | |
| Use of leisure time | 15–34 years | 35–54 years | 55–64 years |
| thousands € | thousands € | thousands € | |
| 177,144 | 179,177 | 28,640 | |
Table 6.
Value of human capital stock from non-market assets and age groups and by ISCED (educational level)—Brisighella.
Table 6.
Value of human capital stock from non-market assets and age groups and by ISCED (educational level)—Brisighella.
| Value of Human Capital Stock from Non-Market Assets and Age Groups and by ISCED in Thousands of Euros—Brisighella | |||
|---|---|---|---|
| 15–34 years | 35–54 years | 55–64 years | |
| Household production | thousands € | thousands € | thousands € |
| High (ISCED 5/6) | 18,096 | 15,336 | 1944 |
| Medium (ISCED 3/4) | 37,044 | 46,339 | 6292 |
| Low (ISCED 0/1/2) | 16,080 | 38,010 | 9504 |
| Use of leisure time | |||
| High (ISCED 5/6) | 36,366 | 36,396 | 4536 |
| Medium (ISCED 3/4) | 71,932 | 71,841 | 13,013 |
| Low (ISCED 0/1/2) | 27,360 | 43,680 | 9936 |
| Total | 206,878 | 251,602 | 45,225 |
Table 7.
The value of the human capital component related to the real estate held from age groups—Brisighella.
Table 7.
The value of the human capital component related to the real estate held from age groups—Brisighella.
| The Value of the Human Capital Component Related to the Real Estate Held | ||
|---|---|---|
| 15–34 years | 35–54 years | 55–64 years |
| 8,241,798 | 41,073,259 | 23,708,399 |
© 2020 by the author. Licensee MDPI, Basel, Switzerland. This article is an open access article distributed under the terms and conditions of the Creative Commons Attribution (CC BY) license (http://creativecommons.org/licenses/by/4.0/).
Share and Cite
MDPI and ACS Style
Trovato, M.R. Human Capital Approach in the Economic Assessment of Interventions for the Reduction of Seismic Vulnerability in Historic Centres. Sustainability 2020, 12, 8059. https://0-doi-org.brum.beds.ac.uk/10.3390/su12198059
AMA Style
Trovato MR. Human Capital Approach in the Economic Assessment of Interventions for the Reduction of Seismic Vulnerability in Historic Centres. Sustainability. 2020; 12(19):8059. https://0-doi-org.brum.beds.ac.uk/10.3390/su12198059
Chicago/Turabian StyleTrovato, Maria Rosa. 2020. "Human Capital Approach in the Economic Assessment of Interventions for the Reduction of Seismic Vulnerability in Historic Centres" Sustainability 12, no. 19: 8059. https://0-doi-org.brum.beds.ac.uk/10.3390/su12198059
Note that from the first issue of 2016, this journal uses article numbers instead of page numbers. See further details here.