Article

Optimization of the Weighted Linear Combination Method for Agricultural Land Suitability Evaluation Considering Current Land Use and Regional Differences

1
Department of Surveying and Land Use, College of Geoscience and Surveying Engineering, China University of Mining and Technology (Beijing), Beijing 100083, China
2
Department of Land Planning, China Land Surveying and Planning Institute, Beijing 100035, China
3
Department of Spatial Information, College of Information Science and Engineering, Henan University of Technology, Zhengzhou 450001, China
*
Author to whom correspondence should be addressed.
Sustainability 2020, 12(23), 10134; https://0-doi-org.brum.beds.ac.uk/10.3390/su122310134
Submission received: 10 November 2020 / Revised: 29 November 2020 / Accepted: 30 November 2020 / Published: 4 December 2020

Abstract

:
This study was aimed at optimizing the weighted linear combination method (WLC) for agricultural land suitability evaluation (ALSE) through indicator selection, weight determination, and classification of overall suitability scores in Handan, China. Handan is a representative research area with distinct agricultural advantages and regional differences in land use, where the expansion of construction land has led to a rapid decrease of agricultural land in recent years. Natural factors (topography, climate, soil conditions, and vegetation cover) and socioeconomic factors (land use and spatial accessibility) were selected to establish a more comprehensive evaluation system. The index weight was calculated by the mutual information between index suitability and current land use. The consistency index was used to identify the boundary value dividing the overall suitability score into a suitable category and unsuitable category in each sub-region. The results demonstrated that the optimized WLC-ALSE model outperformed the comparison models using conventional methods in terms of the consistency between the evaluation results and current land use. Owing to the increasing limitations of topography, soil conditions, spatial accessibility, and land use, the proportions of suitable land in Zone 1, Zone 2, and Zone 3 were 77.4%, 67.5%, and 30.9%, respectively. The agricultural land unsuitable for agriculture (14.5%) was less than non-agricultural land suitable for agriculture (7.4%), indicating that agricultural land had low growth potential in Handan. Finally, specific recommendations were made to improve agricultural land suitability, alleviate land use conflicts, and further optimize the model. The results can provide effective guidance for WLC-ALSE and land use decision-making for sustainable agriculture.

1. Introduction

With the continuous growth of the earth’s population, maintaining the area and productivity of agricultural land is becoming increasingly important for producing enough food [1]. However, the serious spatial conflicts between agricultural land and non-agricultural land have posed a serious threat to food security and sustainable agricultural development in many parts of world. On the one hand, a large amount of high-quality agricultural land is at a high risk of being occupied by construction land [2]. On the other hand, agricultural development has destroyed important ecological spaces with low suitability for crop production, leading to deforestation, soil erosion, and habitat destruction [3].
As the basis of land use planning and decision-making, agricultural land suitability evaluation (ALSE) is urgently needed to reduce the risks of agricultural land and promote the sustainable agriculture [4,5]. ALSE refers to assessing the potentials and limitations of land for agricultural purposes [6]. The evaluation result reflects the matching degree between land characteristics and agricultural requirements [3,7]. It has been applied to analyze agricultural development potential [8], optimize land use patterns, identify spatial conflicts, improve agricultural land productivity, develop crop insurance models [9], and conduct major function-oriented zoning [10].
The methods of ALSE included fuzzy assessment [11], ordered weighted averaging (OWA) [12], Boolean overlay [13], artificial neural network (ANN) [8,14], logic scoring of preference (LSP) [15], and weighted linear combination (WLC) [16]. WLC mainly uses the weighted average operation to integrate the suitability scores of multiple evaluation factors into a composite suitability score [17]. Because of its simplicity, flexibility, and efficiency [18], WLC has become one of the most commonly used ALSE methods [19], as well as an important component of fuzzy assessment and OWA [11,18]. Previous studies have attempted to optimize the WLC-based land suitability evaluation from different perspectives. Radočaj et al. [18] compared three criteria standardization methods (fuzzy, stepwise, and linear) in land suitability assessment for soybean cultivation in Osijek-Baranja County, Croatia. Li et al. [20] compared three weighting methods (AHP, CV, and AHP-CV) for urban green space suitability evaluation in Fuping County, China. Jayasinghe et al. [21] combined AHP, Decision-Making Trail, and Evaluation Laboratory (DEMATEL) to determine the criteria weights in Sri Lanka. Zhang et al. [22] developed an improved MCE-GIS method by constructing a composite evaluation system, using the FAHP method to calculate index weight, and integrating the overlay rules of evaluation indexes in New Hefei City, China. Ziadat et al. [23] combined current land use and farmers’ knowledge to modify the suitability criteria in Jordan. Nevertheless, the WLC-ALSE model still has some limitations in the following three aspects, which may affect its effectiveness and applicability in land use planning and decision-making.
(1)
The selection of evaluation factors. The evaluation factors serve as decision variables in ALSE. Natural factors (e.g., soil conditions, climate, and topography) reflect the natural environment and internal capability of land for crop growth. Socioeconomic factors (e.g., distance to road, labor force, and land use) reflect the human impact and external environment of agricultural development. Therefore, both natural factors and socioeconomic factors are expected to play an important role in ALSE [24]. However, many previous studies on ALSE only considered natural factors, but often ignored socioeconomic factors [3,25]. Some researchers [3,15] pointed out that incorporating both natural factors and socioeconomic factors into ALSE could get a more complete view of agricultural land suitability, thereby effectively supporting integrated land use planning and decision-making.
(2)
The weight determination of evaluation factors. The weight represents the importance of one evaluation factor relative to another in ALSE [15]. The evaluation factor with larger weight plays a more important role in calculating the overall suitability score. The index weight can be determined by the subjective weighting (SW) method or objective weighting (OW) method. SW methods include the analytic hierarchy process (AHP) and expert scoring [17], direct assignment method, and direct ranking method [26,27]. The SW method relies heavily on expert knowledge or literatures [28]. Although the SW method is widely used in ALSE, it has been criticized for its subjectivity and uncertainty [20,29]. For example, two experts with different personal preferences and opinions may generate significantly different weighting schemes in the same research area. Compared with the SW method, the OW method mainly uses data to calculate the index weight. Hence, the OW method is applicable to research that lacks sufficient expert experience [30]. The existing OW methods include the coefficient of variation (CV) [20], entropy weight [31], principal component analysis, and correlation analysis, etc. They were mainly based on the variability or correlation of evaluation factors [14], but the interrelation between evaluation factors and the distribution of agricultural land was ignored. The corresponding weighting scheme may be inconsistent with the actual situation, which may explain why the OW method is rarely used in prior studies. It is necessary to develop a more reliable and acceptable OW method for objectively analyzing the actual impact of evaluation factors on the spatial pattern of agricultural land.
(3)
The classification of overall suitability scores. The overall suitability scores reflect the suitability degree of evaluation units for agriculture. The least suitable level is generally indicated by 0, while the most suitable level is represented by 100. In order to promote the application of evaluation results in land use planning and decision-making, it has become a key issue to divide the overall suitability score into a suitable category and unsuitable category. The traditional classification methods mainly included manual classification, equal interval classification [15], Jenks Natural Breaks classification [8,17,32], expert knowledge classification [28,33], and cluster analysis [34]. Prior studies generally established a unified classification standard, mainly based on the mathematical characteristics of overall suitability score in the whole study area. However, they usually neglected current land use, as well as regional differences in climate and landform, which might lead to an obvious inconsistency between classification results and the actual situation. If the overall suitability classification considers current land use and regional differences, the corresponding classification results may be improved and provide better guidance for land use practice.
The objective of this study was to optimize the WLC-ALSE model by considering current land use and regional differences and subsequently conduct a systematic analysis of agricultural land suitability and land use conflicts in Handan City, China. The main contents were as follows. (1) A more comprehensive evaluation system was constructed by selecting both natural factors (topography, climate, soil condition, hydrological condition, and vegetation cover) and socioeconomic factors (spatial accessibility and land use). (2) The weight of evaluation factors was objectively measured by the mutual information between the suitability of evaluation factors and current land uses. (3) A novel classification scheme of overall suitability score was designed based on the consistency between classification results and current land use, combined with regional differences of Handan. The consistency index was used to determine the boundary value dividing the overall suitability score into a suitable category and unsuitable category in each sub-region of Handan. (4) The performance of the optimized model was examined through the sensitivity analysis and the model comparison. Sensitivity analysis was performed to test the stability of the optimized model. Comparative analysis was made to check whether the optimized model could generate more reasonable results than the comparison models using conventional parameter measurement methods. (5) The ALSE results were systematically analyzed in terms of the suitability of evaluation factors, the overall suitability, and land use conflicts. (6) The targeted suggestions were put forward to improve agricultural land suitability, manage land use conflicts, and future optimize the model. The findings can provide useful references for WLC-ALSE and decision-making for sustainable agricultural land use.

2. Materials and Methods
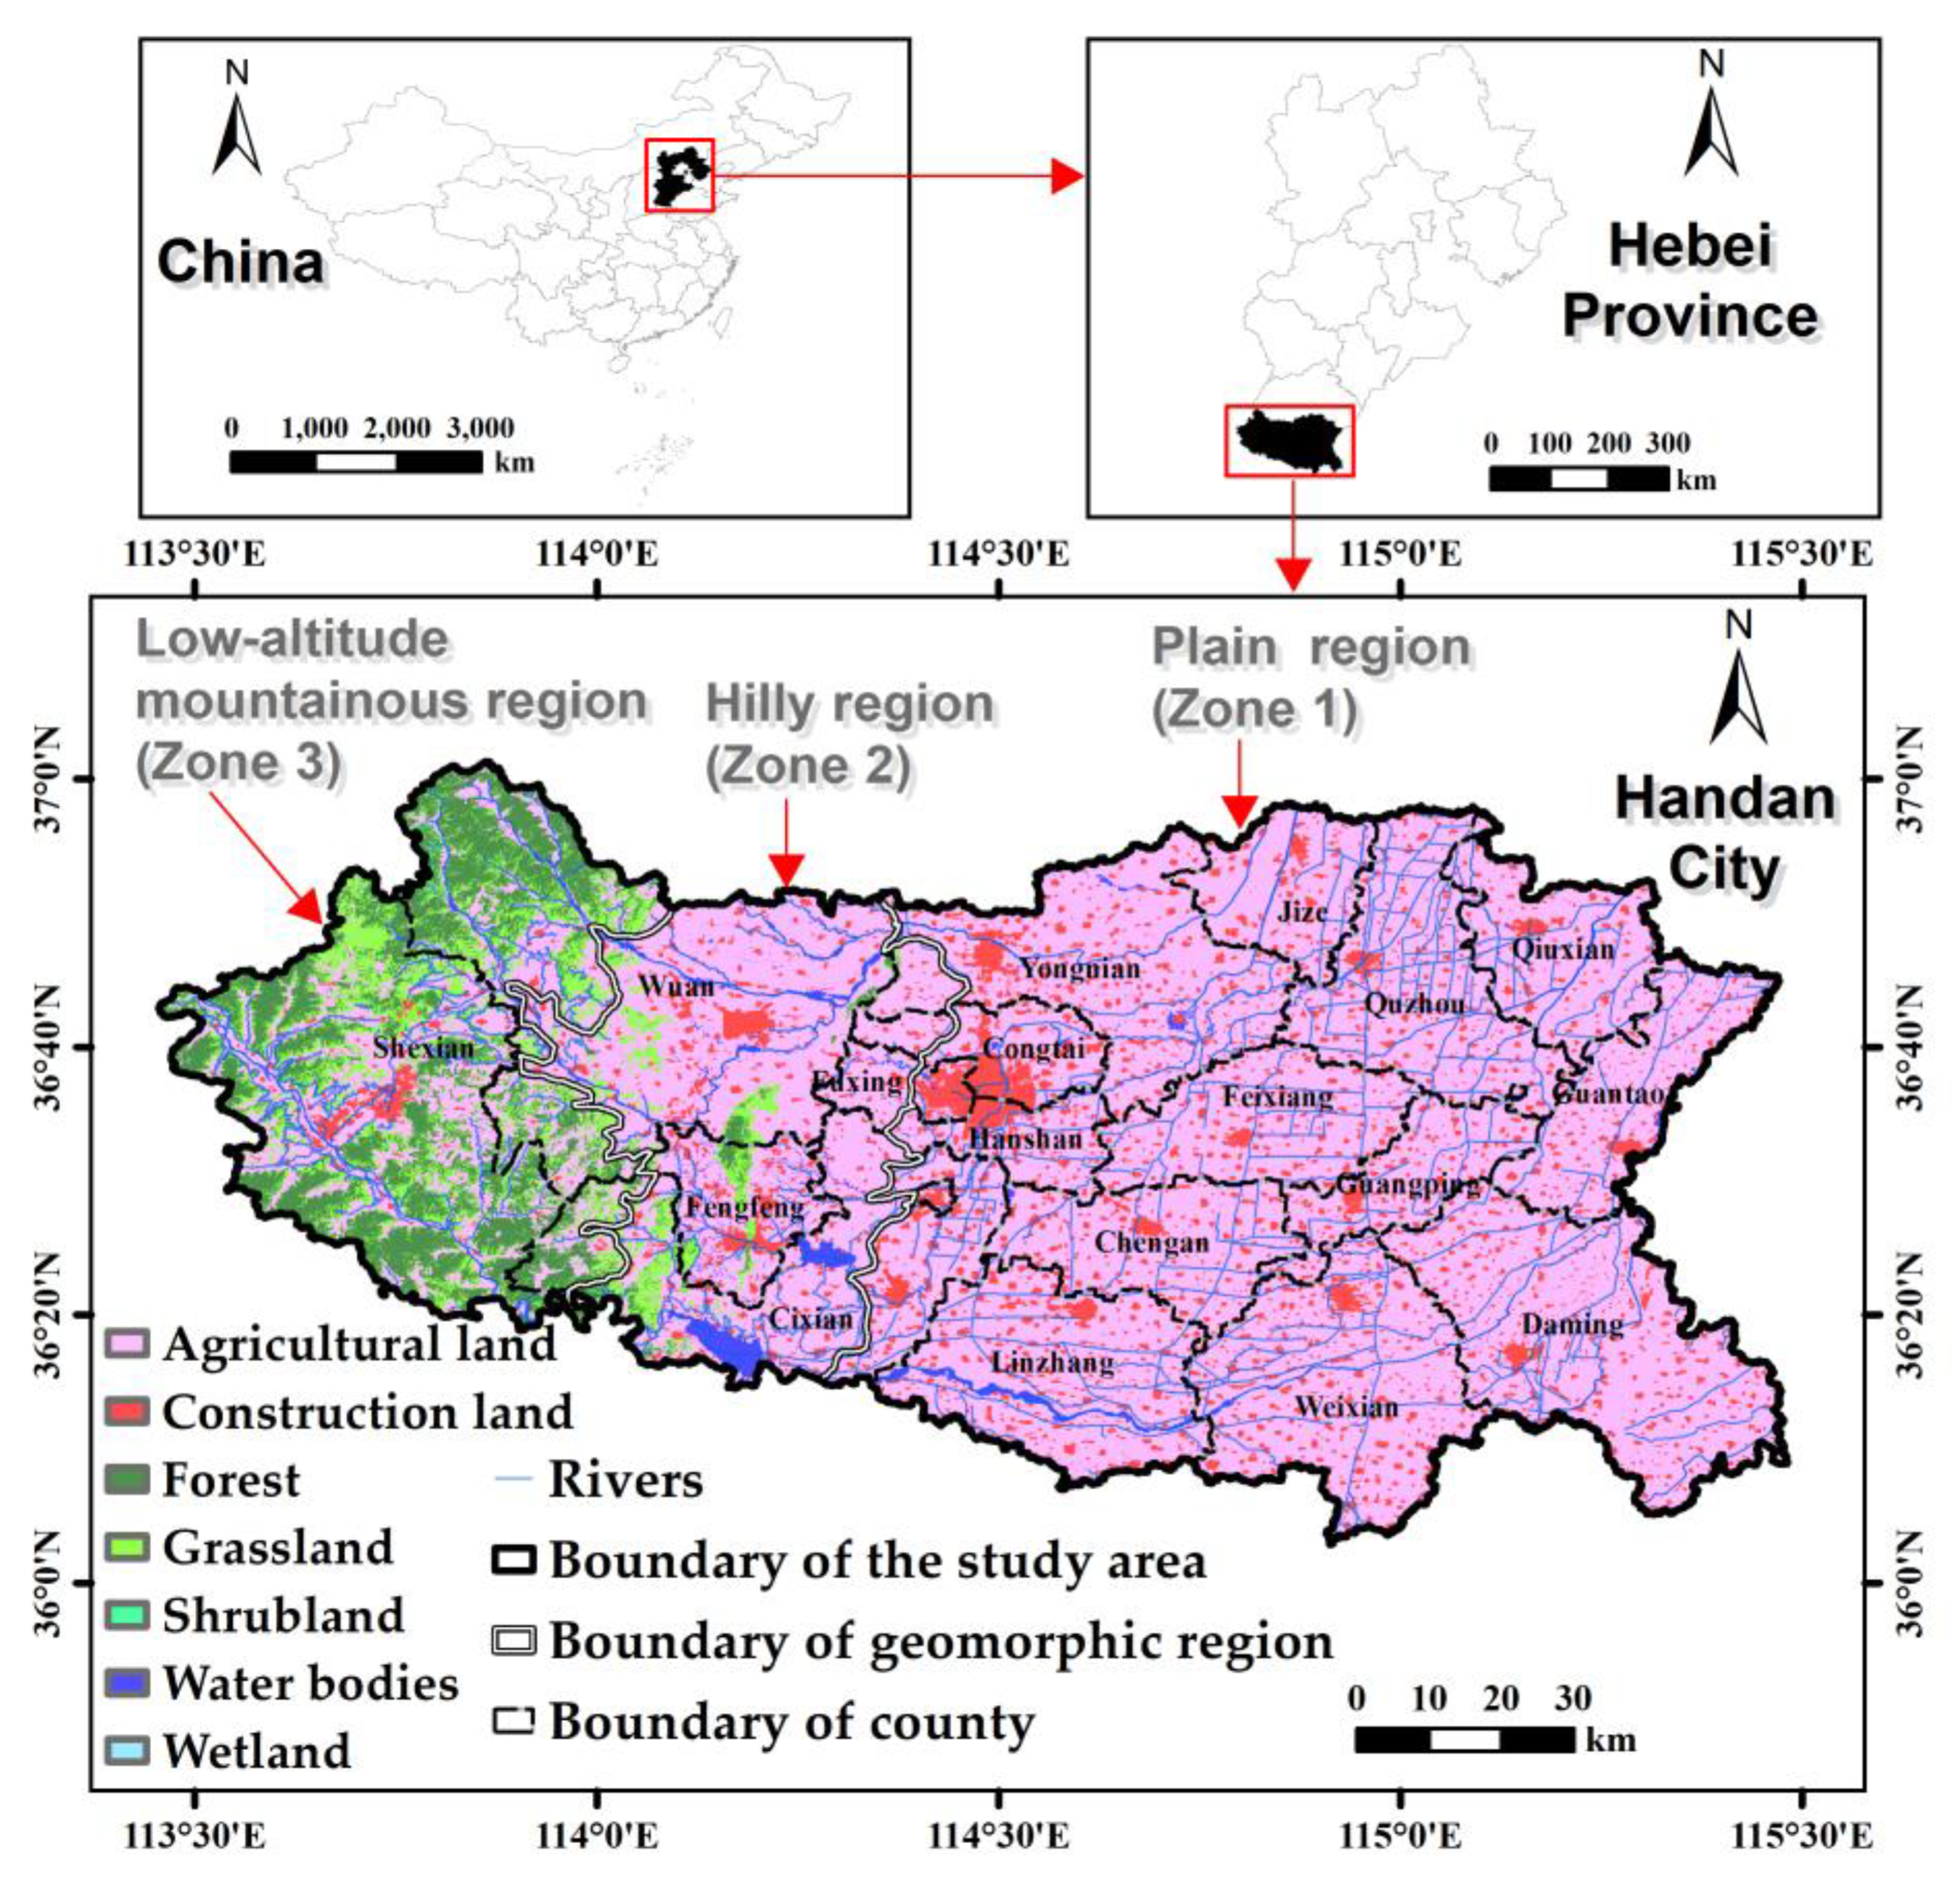
2.1. Study Area

Handan is the southernmost prefecture-level city in Hebei Province, North China (Figure 1). It lies in 36°02′ N–37°03′ N and 113°19′ E–115°37′ E, covering about 12,053 km2. Handan has a warm temperate and a semi-humid continental monsoon climate. The weather is dry and windy in spring, hot and rainy in summer, temperate and cool in autumn, and chilly in winter. The annual precipitation is more than 500 mm and the annual average temperature is above 13.5 °C.
Agricultural land, construction land, and ecological land accounted for about 73.27%, 10.27%, and 16.46% of Handan in 2015, respectively. Handan spans three geomorphic regions from east to west: plain region (Zone 1), hilly region (Zone 2), and low-altitude mountainous region (Zone 3), occupying 62%, 18%, and 20% of Handan, respectively. Agricultural land and construction land were mostly located in Zone 1 and Zone 2. The ecological land (i.e., forest, grassland, shrub land, water bodies, and wetland) is mainly distributed in Zone 2 and Zone 3.
The reasons for choosing Handan as the study area are as follows. First, Handan belongs to a traditional agricultural area and has distinct advantages in cultivating wheat, corn, and cotton. According to the “Hebei Economic Yearbook (2018)”, its grain output ranked second among 11 prefecture-level cities in Hebei Province and 22nd among all prefecture-level cities in China. Second, Handan is a representative city where the protection of agricultural land is facing pressure from the population growth, water shortage, and urban sprawl. Just like many cities in the world, Handan has undergone a significant reduction in agricultural land and rapid rise of construction land in recent years, threatening local food security and sustainable agricultural development. According to the land use maps of Handan in 2010 and 2020, the proportion of agricultural land declined from 73.6% to 66.8%. Correspondingly, the proportion of construction land increased from 10.9% to 16.9% and the proportion of ecological land increased from 15.5% to 16.3%. Third, Handan is a typical area where various landforms have led to obvious regional differences in land use. In 2015, the proportion of agricultural land in Zone 1, Zone 2, and Zone 3 was 85%, 75%, and 34%, respectively. Accordingly, this study is expected to provide effective guidance for assessing and improving agricultural land suitability under different geomorphic conditions.

2.2. Data Collection

The datasets were obtained from websites or administrative departments. They were converted into raster maps with a resolution of 90 m by ArcMap 10.5. Land use and traffic data were derived from global land cover map (GlobeLand30) and 1:10,000 Digital Line Graphic (DLG) on the National Catalogue Service for the Geographic Information website (http://www.webmap.cn). Slope and relief degree of land surface (RDLS) were generated from ASTER GDEM available on Geospatial Data Cloud (http://www.gscloud.cn). Climatic data were collected from the National Meteorological Information Center (https://data.cma.cn), WorldClim Version2 (http://worldclim.org), and Resource and Environment Data Cloud Platform (http://www.resdc.cn). Soil data were extracted from China Soil Map Based Harmonized World Soil Database (http://westdc.westgis.ac.cn), Resource and Environment Data Cloud Platform (http://www.resdc.cn), and the database of cultivated land quality offered by the land management department. MODIS/Terra Normalized Difference Vegetation Index (NDVI) was provided by NASA’s Goddard Space Flight Center (https://ladsweb.modaps.eosdis.nasa.gov). Soil moisture was obtained from the National Earth System Science Data Center of China (http://www.geodata.cn) [35]. The groundwater depth was collected from China’s monthly monitoring reports of groundwater in 2018 (http://www.mwr.gov.cn).

2.3. The Optimized WLC-ALSE Model

In the WLC-ALSE model, the suitability scores of various evaluation factors were multiplied by the corresponding weights and then added together to obtain an overall suitability score in the GIS environment [12], see Equation (1) [19,36]. This study mainly improved the WLC-ALSE model from the selection and weight determination of evaluation factors, as well as classification of overall suitability score. Details are described in the following sections.
F = i = 1 n W i × f i = i = 1 n W i × 1 m i j = 1 m i f i j ,
where F = overall suitability score; Wi = weight of the ith evaluation factor; fi = suitability score of the ith evaluation factor; fij = suitability score of the jth sub-factor in the ith evaluation factor; n = total number of evaluation factors; and mi = total number of sub-factors in the ith evaluation factor.

2.3.1. The Evaluation Factors

Based on the research objectives and available data, both natural factors and socioeconomic factors were selected to establish a relatively holistic evaluation system [37,38]. Natural factors primarily reflected the physical setting for crop growth, containing topography, climate, soil condition, hydrologic condition, and vegetation cover. Socioeconomic factors mainly embodied the human impact on agricultural development, composed of land use and spatial accessibility.
Table 1 shows the suitability classification of evaluation factors for agriculture in Handan. Through a literature review and expert consultation, the original values of a sub-factor with generally accepted classification standards were directly classified into four discrete suitability scores: 100 (S1: highly suitable), 80 (S2: moderately suitable), 60 (S3: moderately unsuitable), and 40 (S4: highly unsuitable). In comparison, the original values of a sub-factor without generally accepted classification standards were converted into continuous suitability score through the linear transformation [39], see Equation (2) and Equation (3).
f i = 100 V i M I N M A X M I N
f i = 100 100 V i M I N M A X M I N ,
where fi = suitability score of a sub-factor in the ith evaluation unit; Vi = original value of a sub-factor in the ith evaluation unit; MAX = maximum original value of a sub-factor in all evaluation units; MIN = minimum original value of a sub-factor in all evaluation units.
Topography was indicated by slope and relief amplitude. It directly affects agricultural productivity [40], vegetation species, surface runoff, soil properties, soil erosion [3], convenience of agricultural development, water holding capacity, and solar radiation.
The climate is closely related to cropping systems, agricultural production potential, and irrigation patterns. Annual precipitation and aridity index can reflect the input and output of water resources. The aridity index was calculated by Equation (4) [41]. The annual accumulated temperature above 10 °C is used to select cropping systems and divide temperature zones.
A I = 0.16 A T 10 P 10 ,
where AI = aridity index; AT10 = annual accumulated temperature above 10 °C; and P10 = annual accumulated precipitation during the period when daily temperature was above 10 °C.
Soil provides moisture and nutrients for crops, serving as a crucial component of successful agriculture [42]. Soil depth affects the coverage and species of crops. Soil texture affects soil structure, moisture, fertility, and breathability [40]. Soil organic matter content reflects the soil fertility. Soil moisture is closely correlated with crop yields in water-deficient regions. Generally, the land with a soil depth > 60 cm, soil organic matter content > 1%, loamy soils or clay soils, and high soil moisture is more suitable for crop growth [43].
The hydrologic conditions reflect the supply, accessibility, and availability of water resources [44]. The irrigation guarantee rate refers to the probability that the water resources provided by irrigation facilities can meet crop water requirements in a certain year. The data comes from the database of cultivated land quality offered by land management department. An irrigation guarantee rate of 100% indicates the land with perfect irrigation facilities, while an irrigation guarantee rate of 0 indicates dryland without any irrigation facilities. The groundwater depth is used to reflect the scarcity of groundwater, ranging from 6 m to 46 m in the eastern plain of Handan, with an average of 23.8 m. Surface water bodies are mainly composed of reservoirs, lakes, ponds, rivers, canals, and ditches [44]. They play an important role in agricultural irrigation and drainage. The distance to surface water ranged from 0 m to 7205 m in Handan, with an average of 1029 m. Generally, the land with an irrigation guarantee rate > 50%, shallow groundwater depth, and close distance to surface water was more likely to get enough water for crop growth.
Normalized difference vegetation index (NDVI) reflects the vegetation coverage of land surface, biomass, and crop yields [37], ranging from 0 to 1. The high annual maximum NDVI represents small human disturbance [45] and favorable natural conditions for vegetation growth.
Land use reflects the non-agricultural impact (e.g., urban development and ecological protection). The land far away from large-scale non-agricultural areas was considered to have good land use conditions because of small non-agricultural impacts. First, the area of contiguous non-agricultural land was transformed into a suitability score of non-agricultural land by Equation (3). Then, using the natural neighbor interpolation tool in ArcMap 10.5, the suitability score of agricultural land was derived from the suitability score of non-agricultural land.
Spatial accessibility was indicated by the cost distance from rural residential areas to evaluation units [46]. It is closely related to the convenience of agricultural development and the cost of the agricultural labor force [47]. (1) The rural residential areas were taken as the sources of agricultural labor, so the corresponding accumulated cost distance was assigned 0. (2) The passing distance of each evaluation unit was indicated by its slope length (Equation (5)). (3) The passing speed of the road units was set according to road grades. The other units were assigned a walking speed of 4 km/h. (4) The passing time of each evaluation unit was calculated based on the passing distance and the passing speed. Water bodies were set as null values. (5) By the cost distance tool in ArcMap 10.5, the least-accumulative passing time from rural residential areas to evaluation units was calculated based on the input source locations (i.e., rural residential areas) and the input cost raster (i.e., the passing time). The water bodies were directly set as 0.
S L = S L x 2 + S L y 2 2 = 1 2 { C e l l s i z e 2 [ 1 + ( d z d x ) 2 ] + C e l l s i z e 2 [ 1 + ( d z d y ) 2 ] } = C e l l s i z e 1 + 1 2 [ ( d z d x ) 2 + ( d z d y ) 2 ] = C e l l s i z e 1 + 1 2 P e r c e n t _ s l o p e 2 ,
where SL = slope length; SLx = slope length in the horizontal direction; SLy = slope length in the vertical direction; d z d x = change rate of elevation (z) in the horizontal direction; d z d y = change rate of elevation (z) in the horizontal direction; Percent_slope = percent slope (%); Cellsize = cell size.

2.3.2. MI Weighting Method

The mutual information (MI) is one of the most commonly used statistical indicators to measure the mutual dependence between two variables. The high MI indicates a close correlation between two variables [48]. Previous studies usually used MI to build decision trees, select classification features [49], and allocate weights to variables [48] in the field of machine learning and artificial intelligence.
This study measured the weight of evaluation factors based on the MI between suitability grades of the evaluation factor (S1, S2, S3, and S4) and current land use (agricultural land and non-agricultural land), see Equations (6) and (7). MI can be interpreted as the reduction degree in the uncertainty of current land use when the suitability of evaluation factor is known [49]. The information entropy was used to quantify the uncertainty of land use. This was calculated by the proportion of agricultural land, ranging from 0 to 1. A small information entropy indicates little surprise and uncertainty of land use in a certain region, where either agricultural land or non-agricultural land is dominant. A large entropy indicates much surprise and uncertainty of land use, where no land use category dominates another. When evaluation factor A has a larger MI than evaluation factor B, this means that A is able to reduce more information entropy of current land use than B [50]. In that case, A is likely to be more closely related to the layout of current agricultural land than B. Hence, A is given a higher weight than B in ALSE.
The specific procedures of weight determination were as follows. (1) The actual land use types were grouped into two categories: agricultural land and non-agricultural land. (2) The suitability score of each evaluation factor was classified into four suitability grades by the Jenks natural breaks classification method: S1, S2, S3, and S4. (3) By overlaying the suitability grade map of the evaluation factor and current land use map, the areas of agricultural land and non-agricultural land corresponding to each suitability grade of various evaluation factors were counted up. (4) The weight of evaluation factors was calculated based on mutual information by Equations (6) and (7).
I ( S , C ) = H ( C ) H ( C | S ) = H ( C ) j = 1 4 P ( S j ) H ( C | S j ) = i = 0 1 P ( C i ) log 2 P ( C i ) + j = 1 4 P ( S j ) i = 0 1 P ( C i j ) log 2 P ( C i j ) ,
where S = suitability of evaluation factor; C = current land use; Sj = land in the jth suitability grade (S1, S2, S3 and S4); C0 = non-agricultural land; C1 = agricultural land; Cij = Ci in Sj; I(S,C) = mutual information between S and C; H(C) = information entropy of C; H(C|S) = information entropy of C given S; H(C|Sj) = information entropy of C in Sj; P(Sj) = proportion of Sj; P(Ci) = proportion of Ci; and P(Cij) = proportion of Cij.
W i = I ( S i , C ) i = 1 n I ( S i , C )
where Wi = weight of the ith evaluation factor; I(Si,C) = mutual information between the suitability of the ith evaluation factor (Si) and current land use (C); and n = number of evaluation factors.

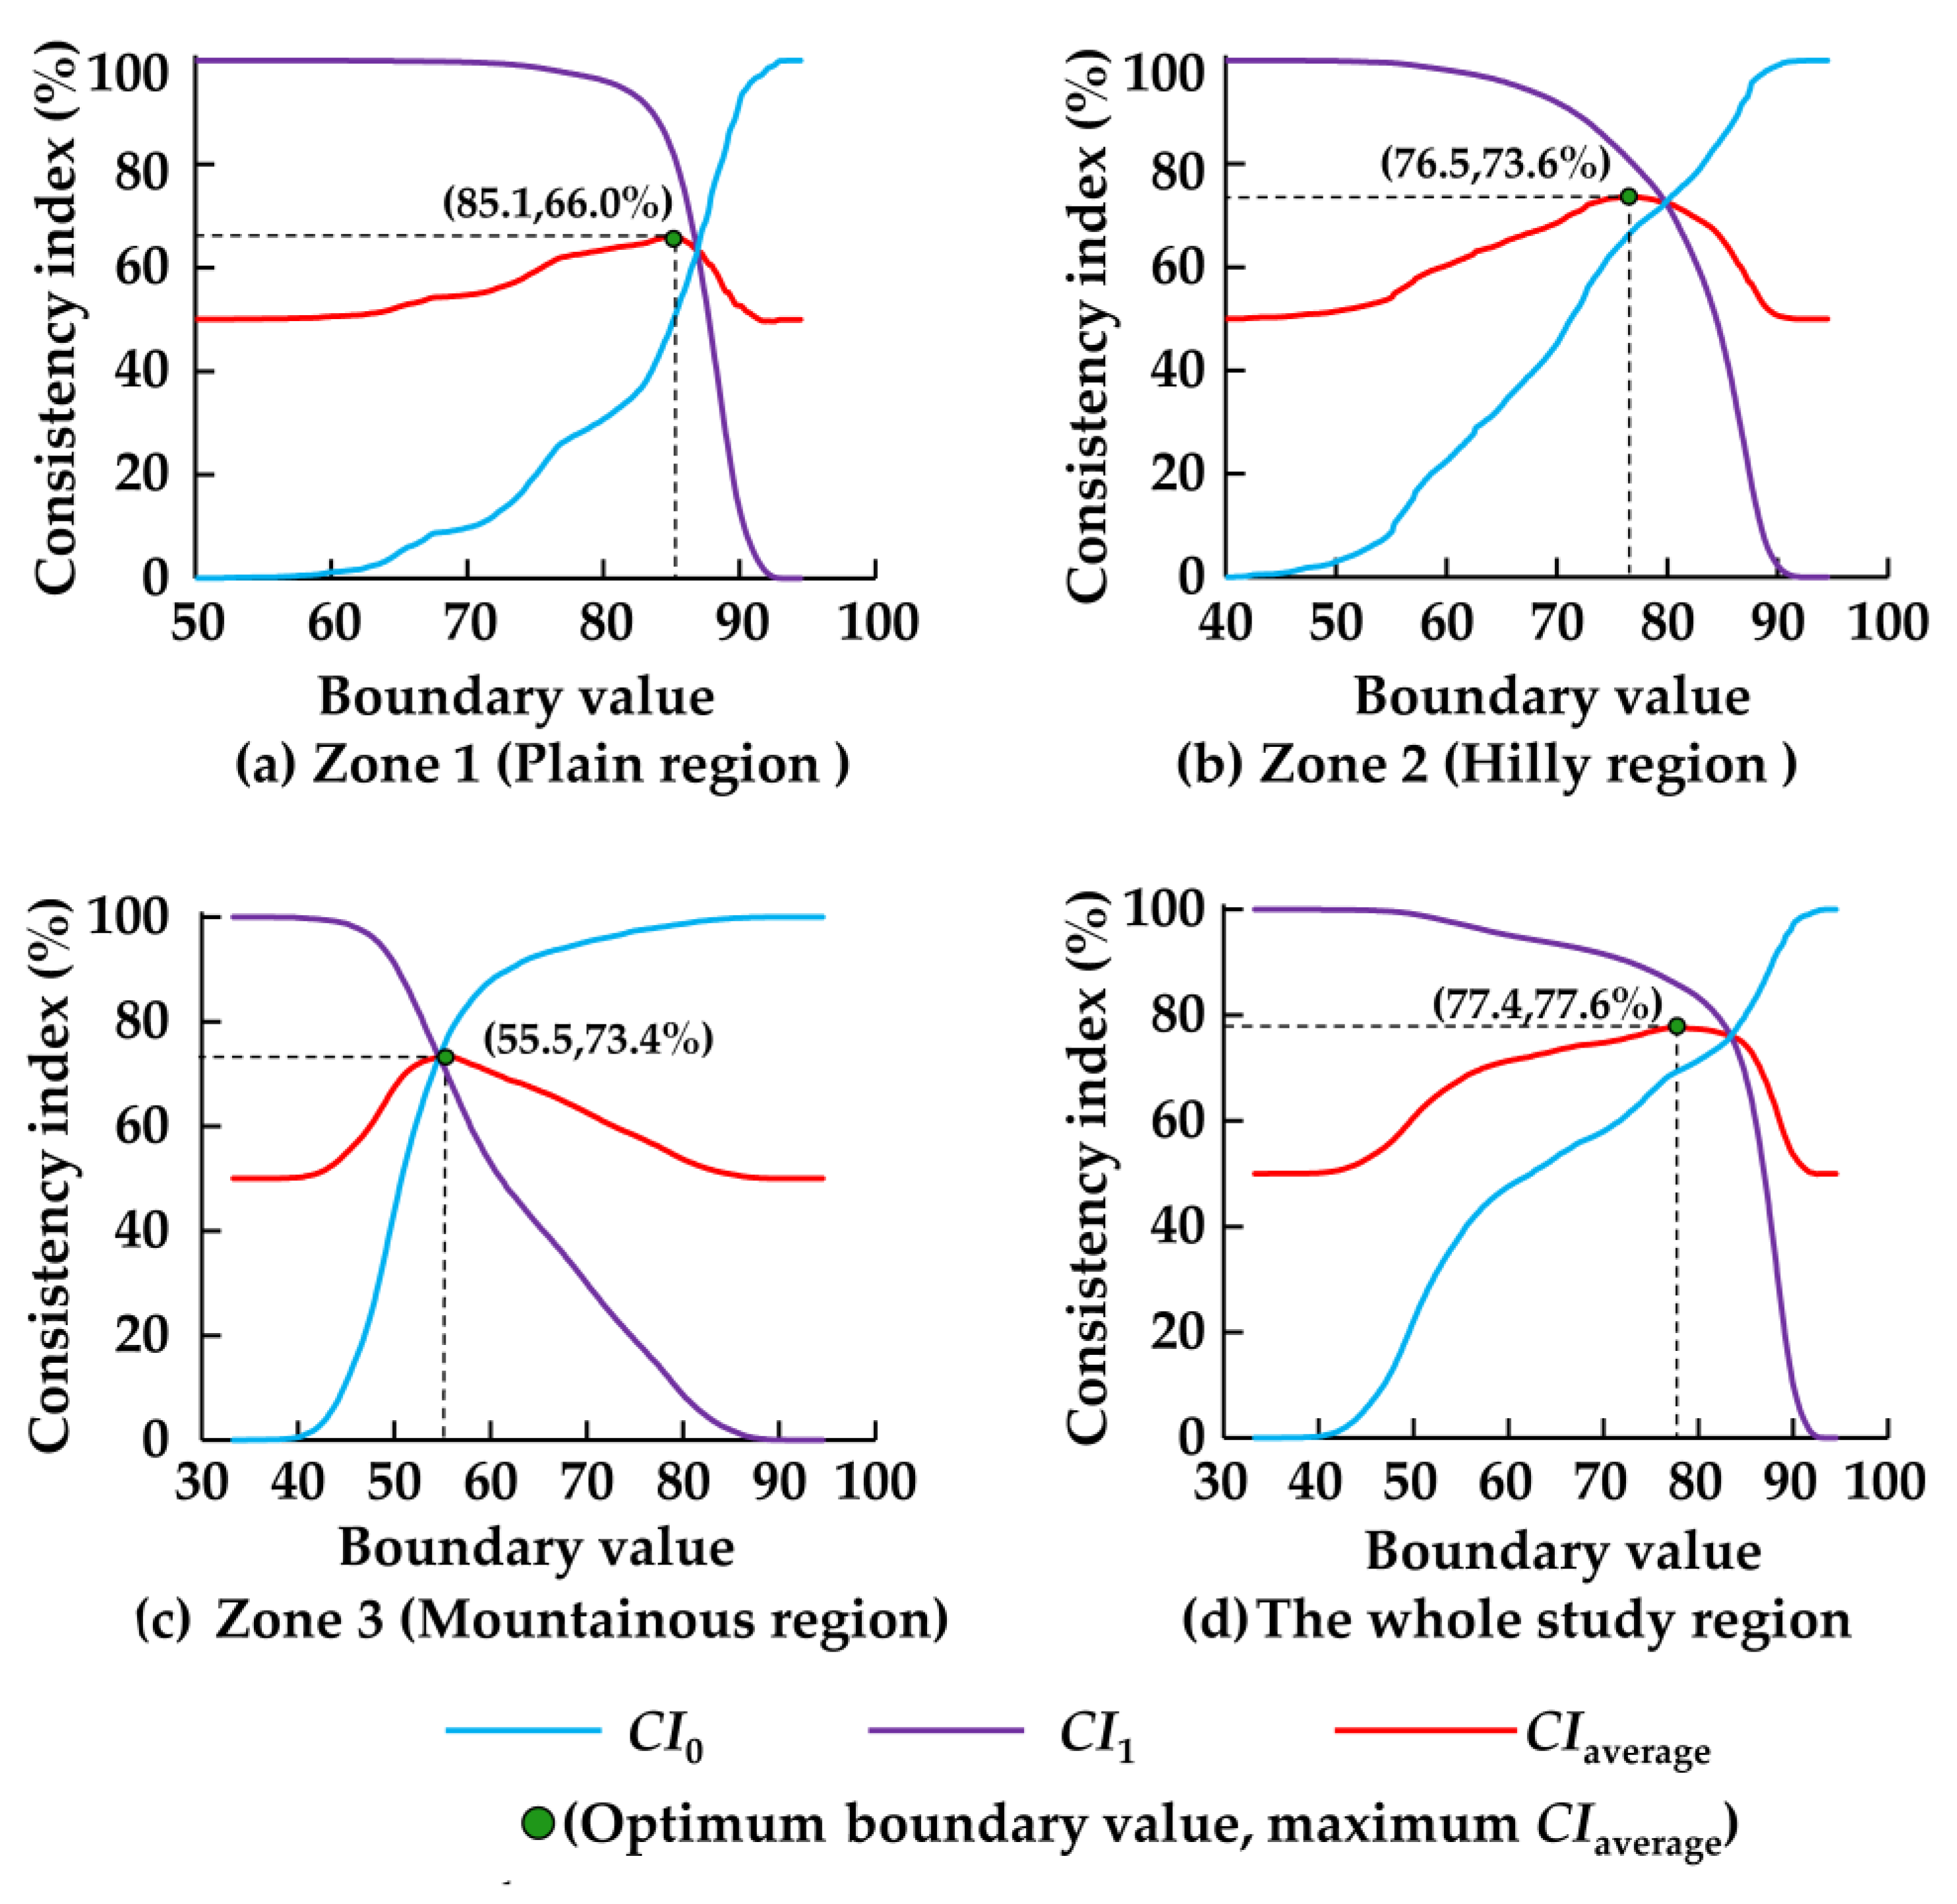
2.3.3. Overall Suitability Classification Considering Consistency Index and Regional Differences

When one suitability score was taken as the boundary value of the suitable category and unsuitable category, the consistency indexes of the corresponding classification results were calculated by Equations (8)–(11), as shown in Figure 2. The parameters for calculating the consistency indexes were derived from the contingency table of the suitability category and current land use (Table 2). The consistency indexes represent the consistency between classification result and current land use in a certain region, ranging from 0% to 100%. The consistency index of agricultural land (CI1) is equal to the proportion of suitable land in current agricultural land. The consistency index of non-agricultural land (CI0) is equal to the proportion of unsuitable land in current non-agricultural land. Mean consistency index (CIaverage) is equal to the average of CI0 and CI1. Overall consistency index (CIoverall) is equal to the proportion of land of which its suitability category is consistent with current land use. The CI1 of 100% means that all agricultural land is classified as suitable for agriculture, that is, the classification result of agricultural land is completely consistent with current land use. In contrast, CI1 of 0 means that no agricultural land is classified as suitable for agriculture, that is, the classification result of agricultural land is completely different from the current land use.
C I 0 = N 00 N 00 + N 10
C I 1 = N 11 N 11 + N 01
C I average = ( C I 0 + C I 1 ) / 2
C I overall = N 11 + N 00 N 11 + N 01 + N 00 + N 10 ,
where CI1 = consistency index of agricultural land; CI0 = consistency index of non-agricultural land; CIaverage = mean consistency index; CIoverall = overall consistency index; N11 = area of suitable land in current agricultural land; N01 = area of unsuitable land in current agricultural land; N00 = area of unsuitable land in current non-agricultural land; and N10 = area of current non-agricultural land in the suitable category.
The consistency indexes were used to identify the optimum boundary value of the suitable category and unsuitable category in each sub-region of Handan. As the boundary value increased from 30 to 100, more and more evaluation units were classified as unsuitable for agriculture. Correspondingly, the consistency index of non-agricultural land (CI0) increased from 0% to 100%, whereas the consistency index of agricultural land (CI1) decreased from 100% to 0% and the average consistency index (CIaverage) increased at first and then decreased (see Figure 2). When CIaverage reached the maximum, both CI0 and CI1 were at a relatively high level. In this case, the corresponding boundary value distinguishing between the suitable category and unsuitable category was regarded as the optimum choice. Considering the regional differences, the optimum boundary values in Zone 1, Zone 2, and Zone 3 were 85.1, 76.5, and 55.5, respectively.

3. Results

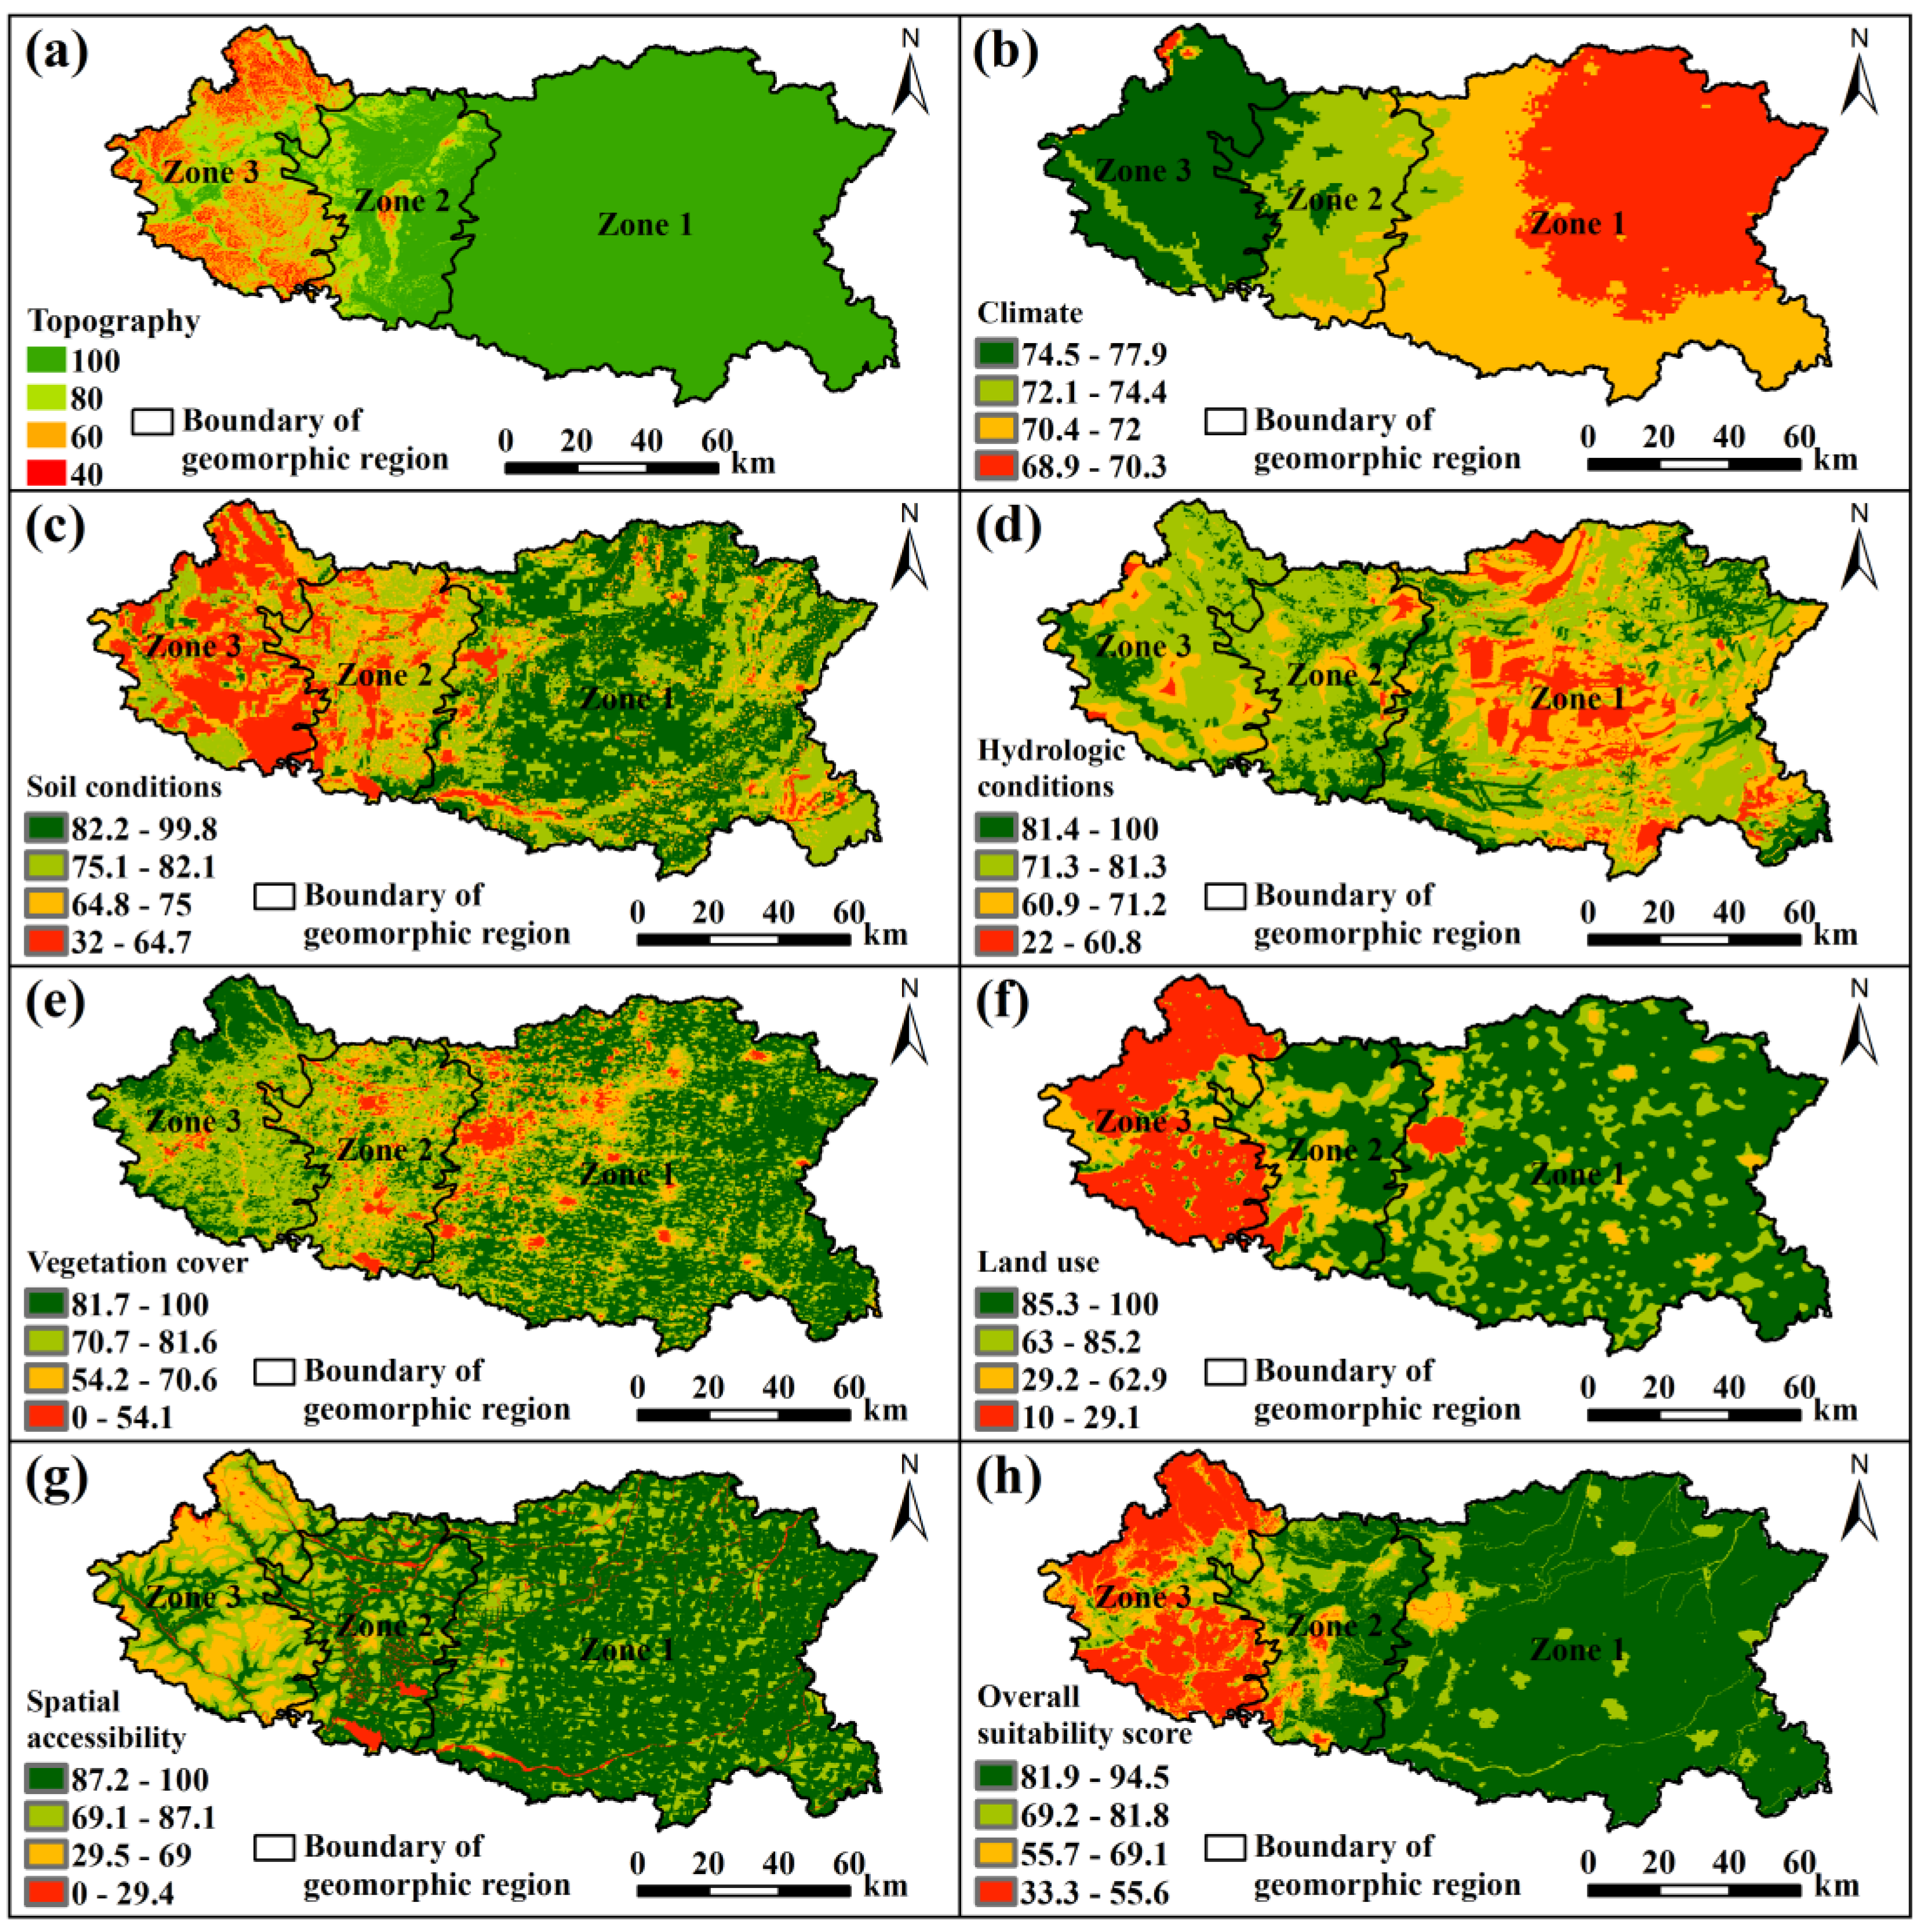
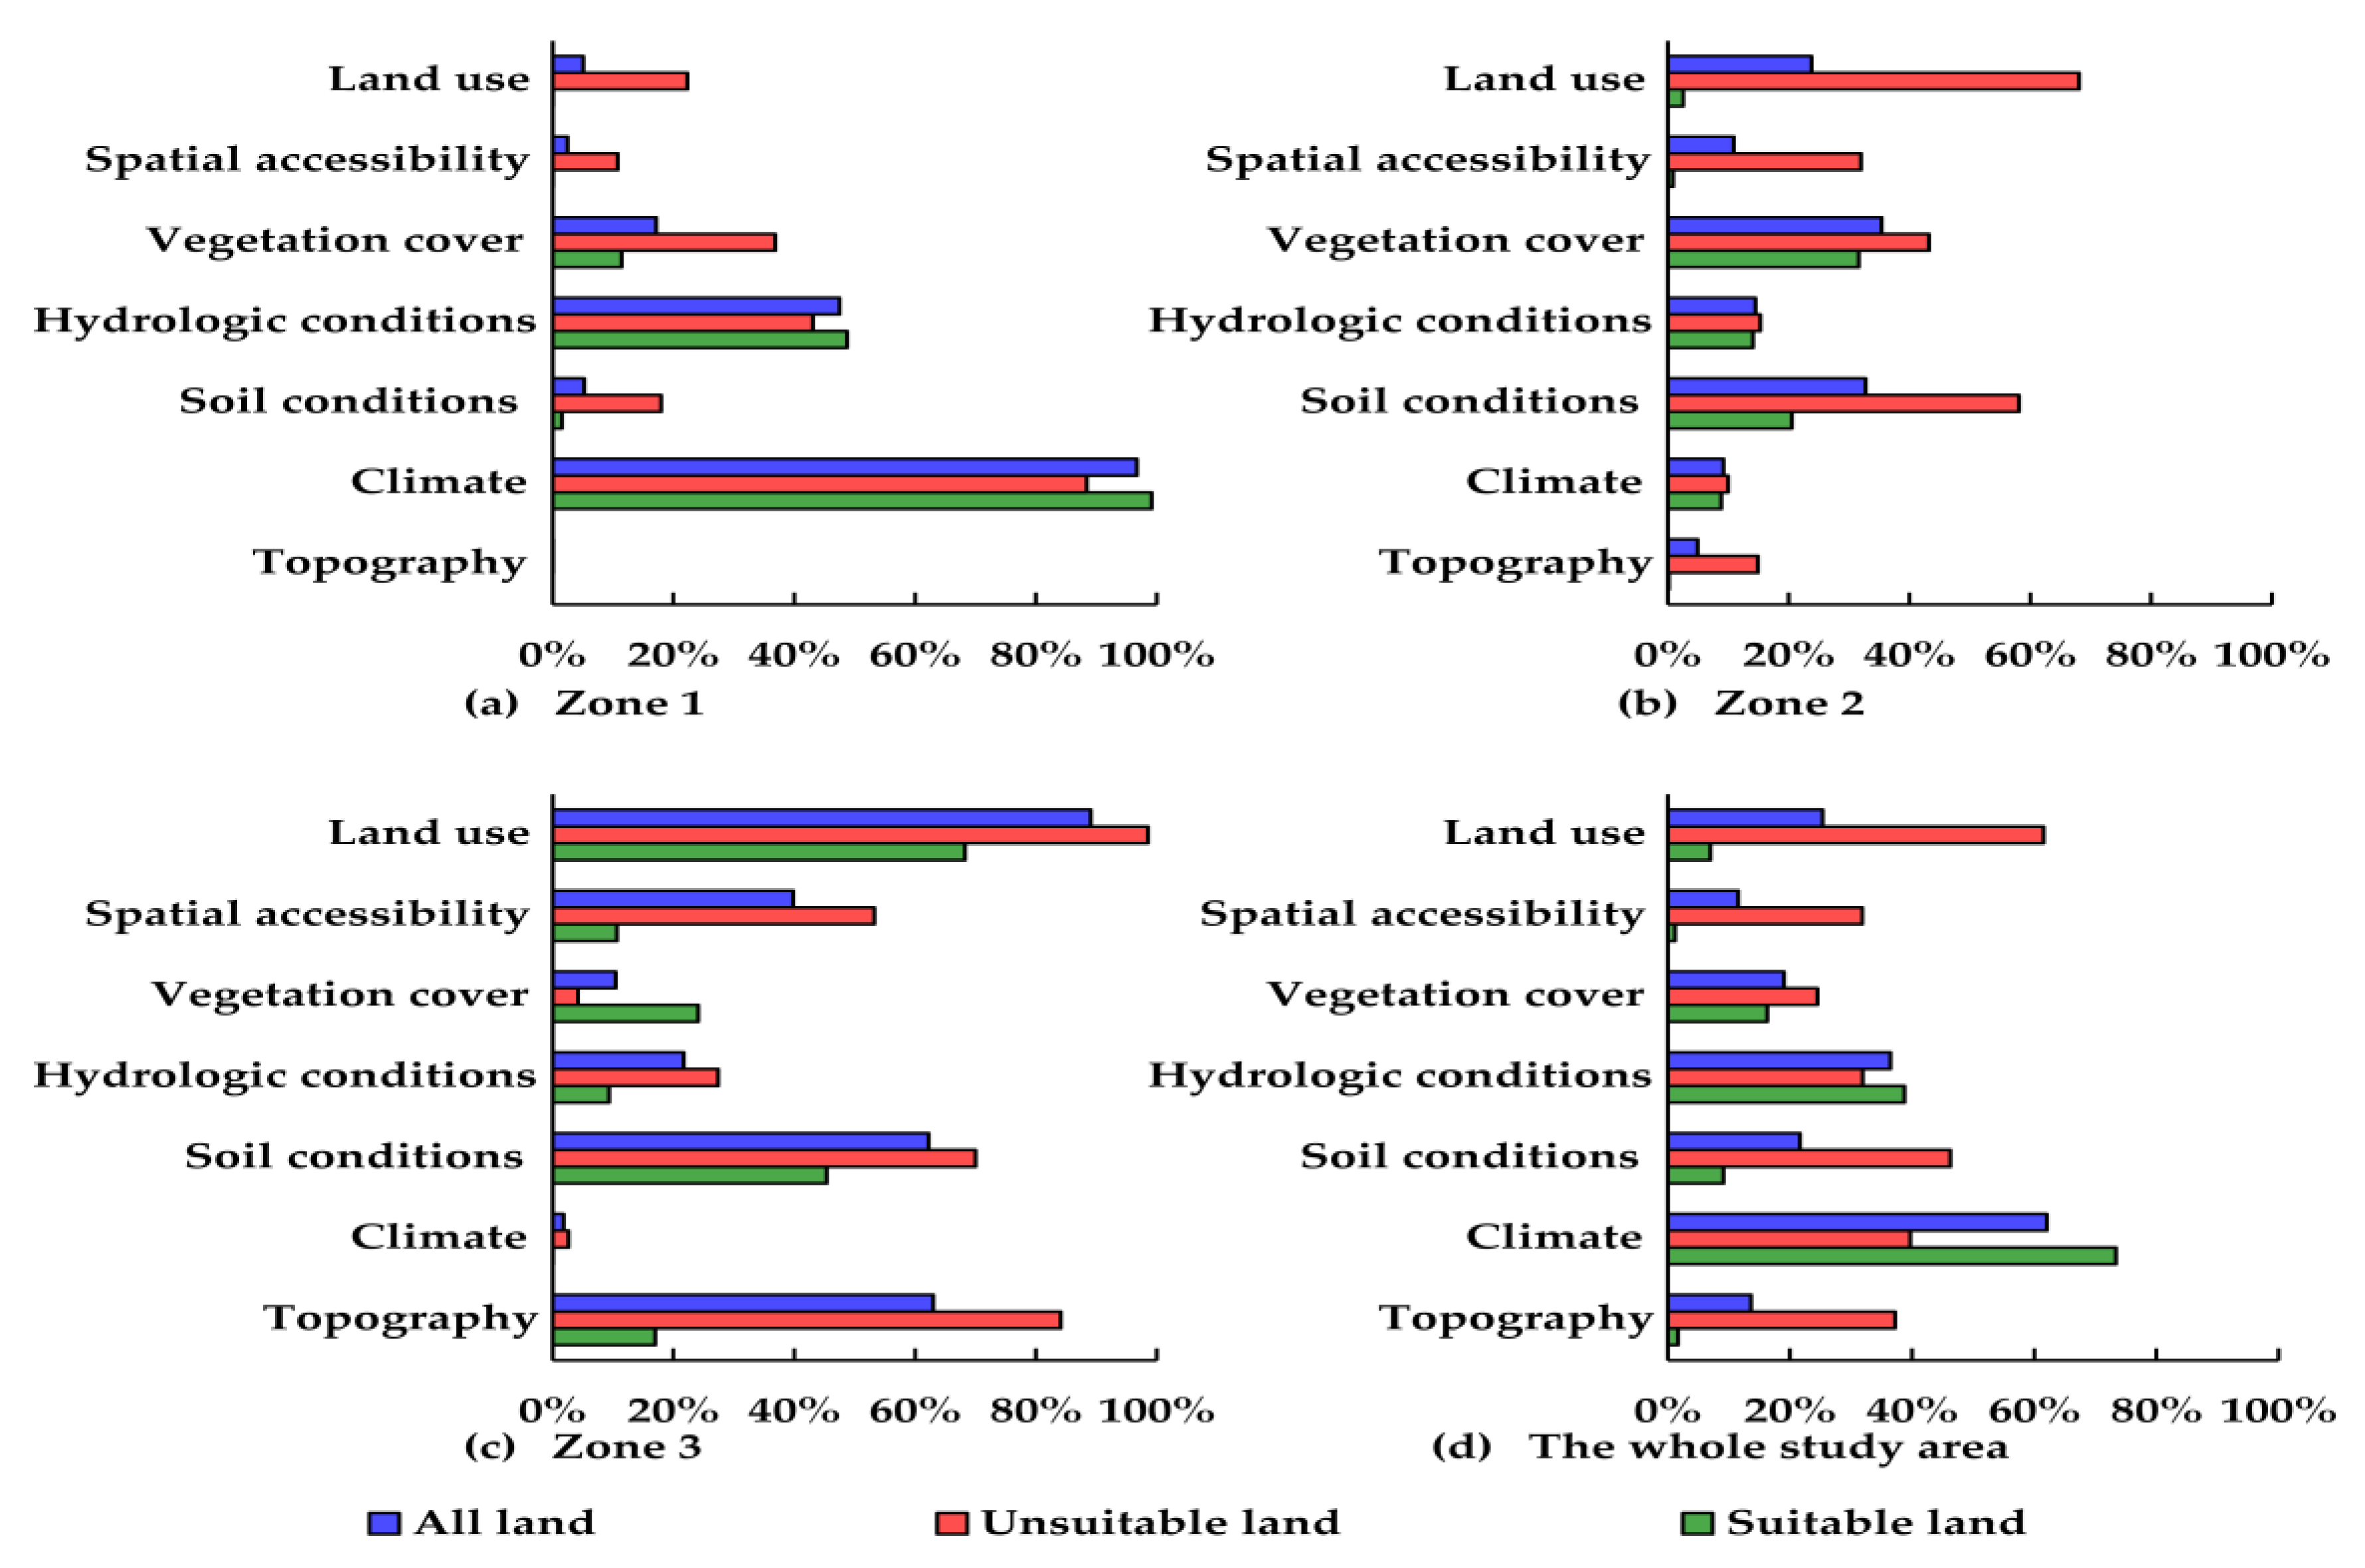
3.1. Suitability of Evaluation Factors

The suitability maps of evaluation factors in Handan are displayed in Figure 3. The suitability of topography, soil conditions, land use, and spatial accessibility gradually decreased from east to west. In contrast, the suitability of climatic conditions gradually increased with the rise of precipitation and humidity from east to west. Topography and spatial accessibility were relatively superior to most of the land in Zone 1 and Zone 2, but they became two prominent limiting factors of agricultural land use in Zone 3. The soil condition was suitable for agriculture in 95% of Zone 1, but it caused severe restrictions on 33% of Zone 2 and 62% of Zone 3. The high soil moisture mainly occurred in the overexploited area of groundwater in zone 1. Soil organic matter content and soil texture imposed severe limitations on 76% and 55% of the land in Zone 2, respectively, while soil depth and texture imposed severe limitations on 51% and 69% of the land in Zone 3, respectively. The suitability score of hydrologic condition was below 60 in a large area of Zone 1, where the groundwater depth even exceeded 40 m. The land with an irrigation guarantee rate less than 50% accounted for 30% of Zone 1, 85% of Zone 2, and 90% of Zone 3, respectively. There was 76% of the land within 1500 m of rivers, canals, ditches, lakes, or reservoirs, indicating that a large percentage could be irrigated with surface water in Handan. Vegetation coverage was generally low in construction land (e.g., built-up areas, rural residential areas, mining land, and traffic land), water bodies, and vegetable greenhouses. Agricultural development was adversely affected by non-agricultural land use in or near large-scale urbanized areas and ecological areas, accounting for 5%, 24%, and 89% of Zone 1, Zone 2, and Zone 3, respectively.

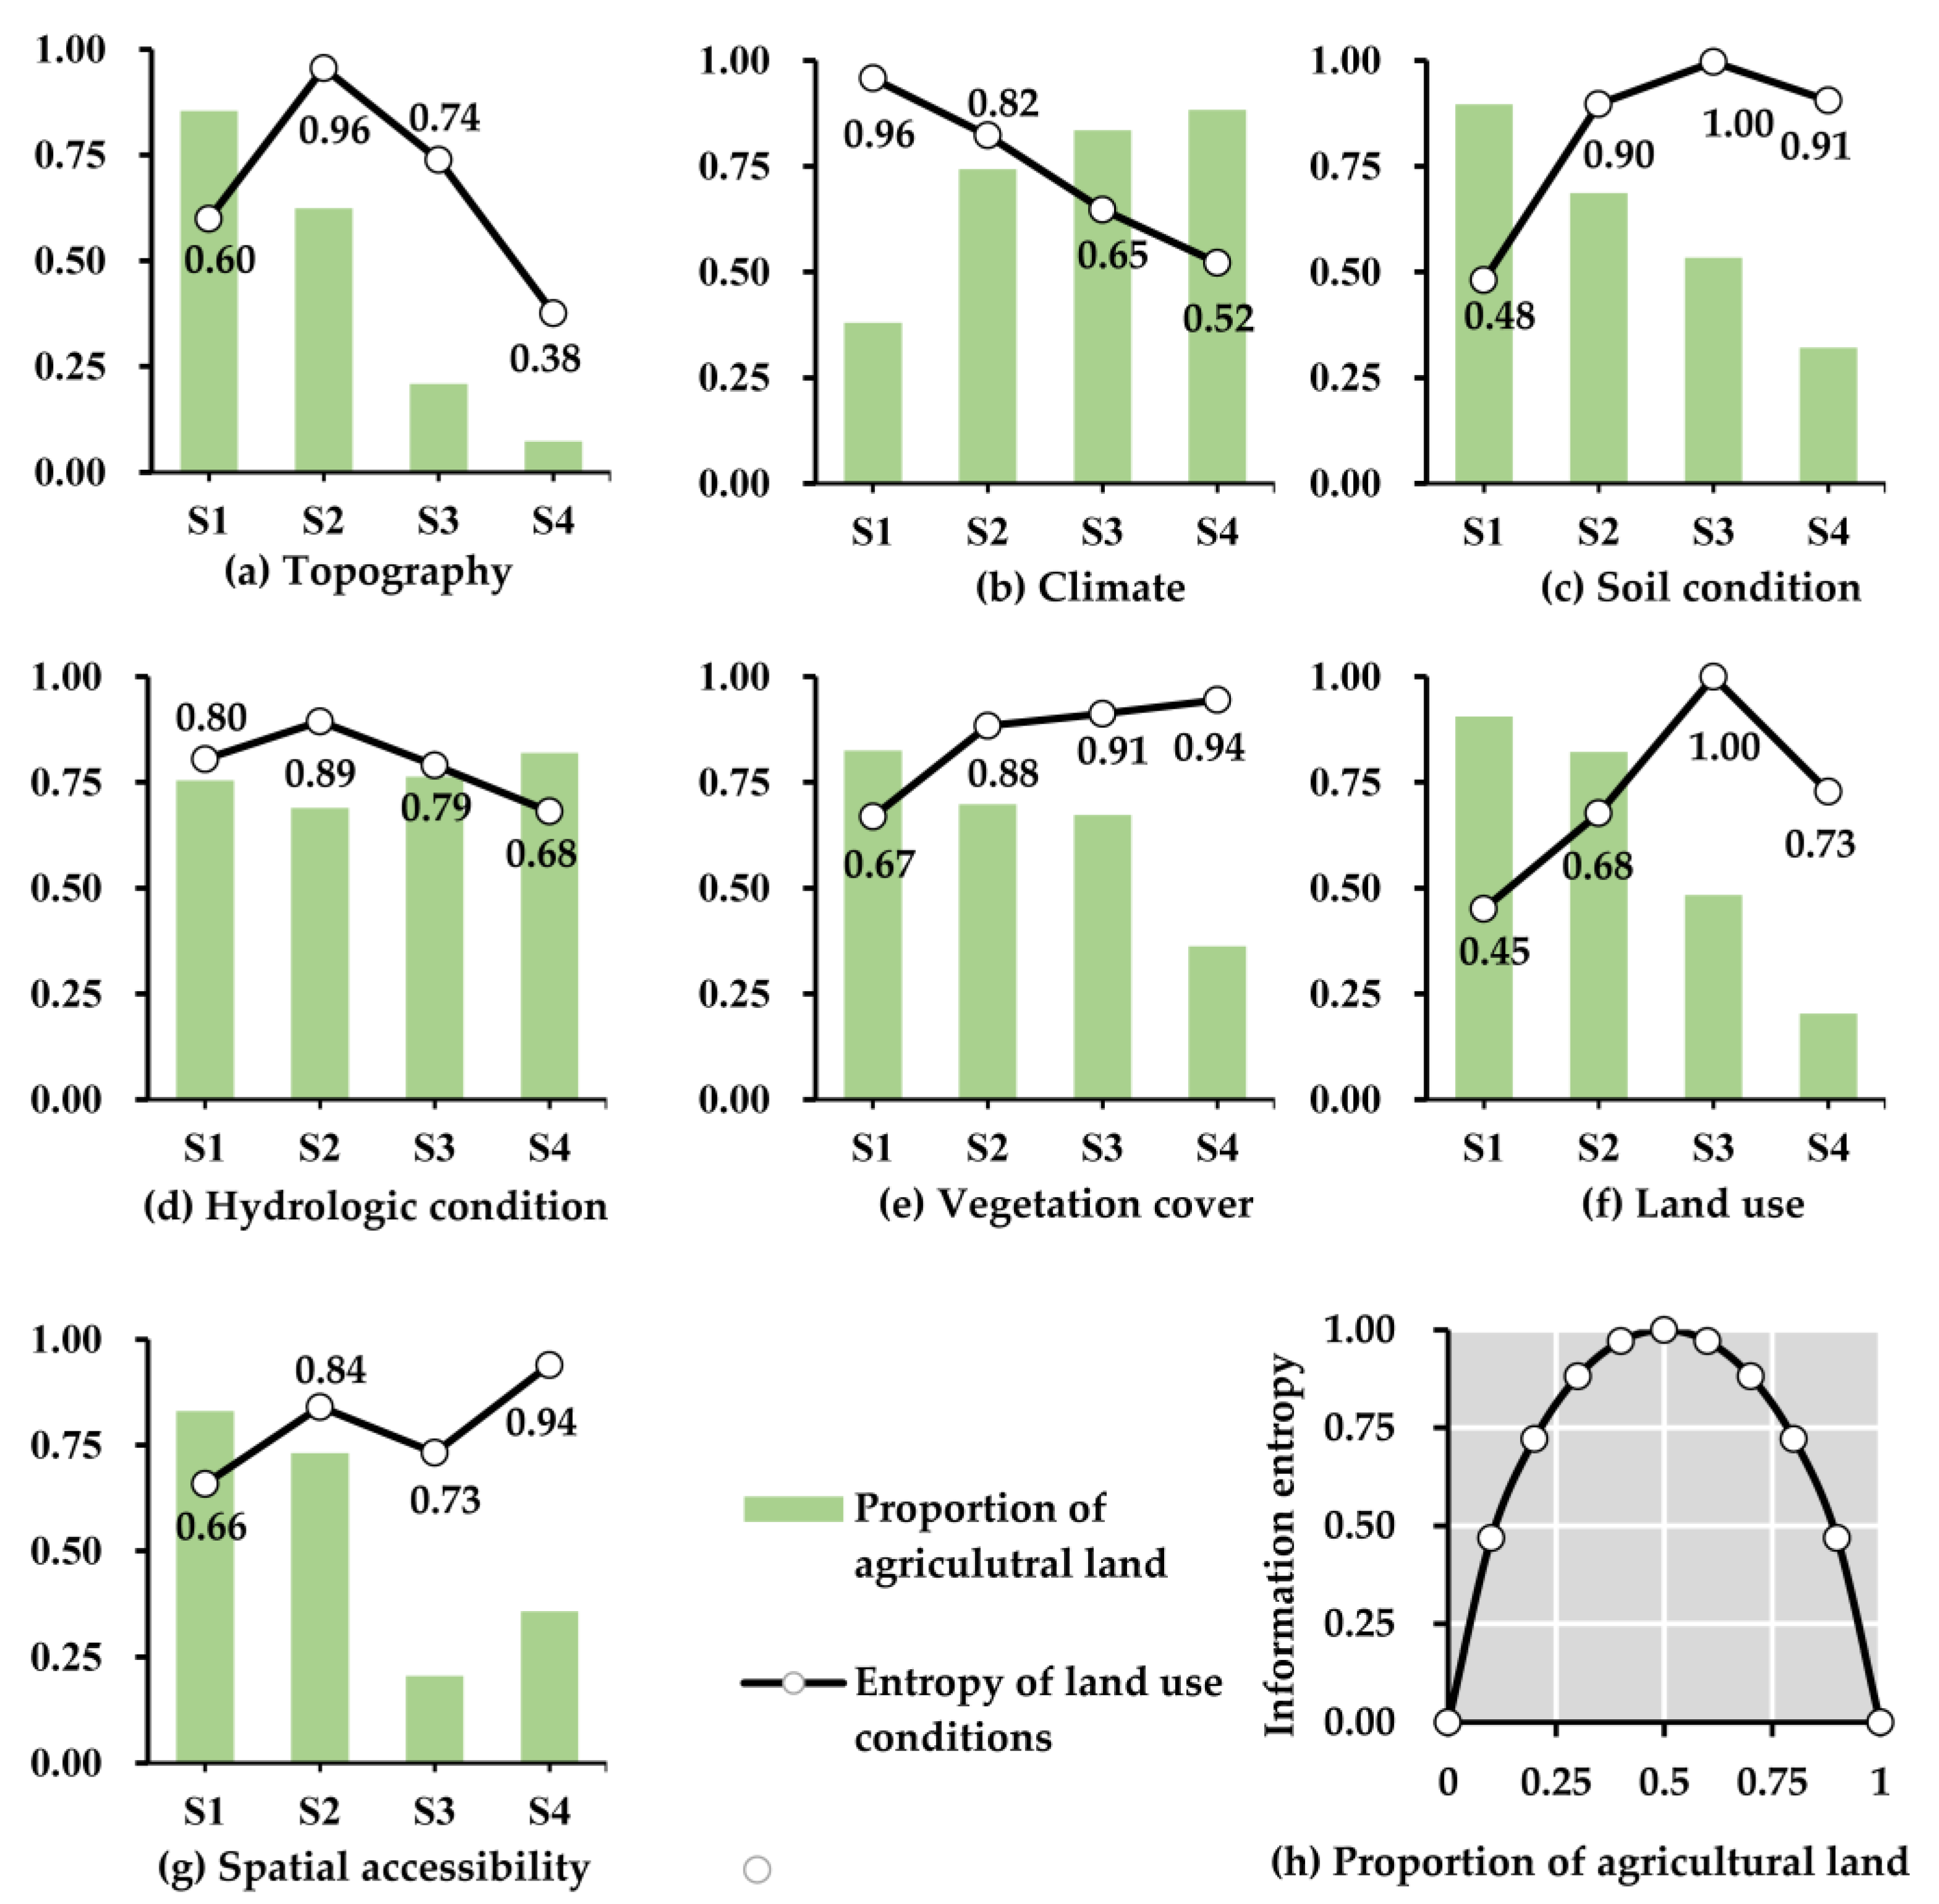
3.2. MI Weight of Evaluation Factors

Figure 4 shows the proportion of current agricultural land and information entropy of land use corresponding to different suitability grades of evaluation factors. The information entropy of land use (i.e., 0.84) corresponding to the proportion of current agricultural land (i.e., 0.73) in Handan was taken as the threshold of uncertainty reduction of land use. When the information entropy of land use in Sj is below the benchmark of 0.84, this indicates that the uncertainty of land use in Sj is reduced.
Table 3 shows the suitability grades with reduced uncertainty in land use and MI weight of evaluation factors calculated by Equations (6) and (7). The weight of land use and topography was 0.28 and 0.22, respectively. They were two primary factors affecting the distribution of agricultural land: agricultural land was dominant in the suitable category (S1 and S2), whereas non-agricultural land was widespread in the unsuitable category (S3 and S4). The weight of climate, soil conditions, and spatial accessibility ranged from 0.13 to 0.16, indicating that these three factors were also closely associated with the distribution of current agricultural land. As for climate, the dominance of agricultural land reduced the uncertainty of land use in S2, S3, and S4. With regard to soil conditions, the prevalence of agricultural land reduced the uncertainty of land use in S1. As for spatial accessibility, agricultural land was dominant in S1, whereas non-agricultural land was predominant in S3. The weight of the hydrologic condition and vegetation cover was no more than 0.05, which revealed that they might have no close correlations with the distribution of current agricultural land. In terms of hydrological conditions, agricultural land was prevalent in S1, S3, and S4. As for vegetation cover, agricultural land was dominant in S1.

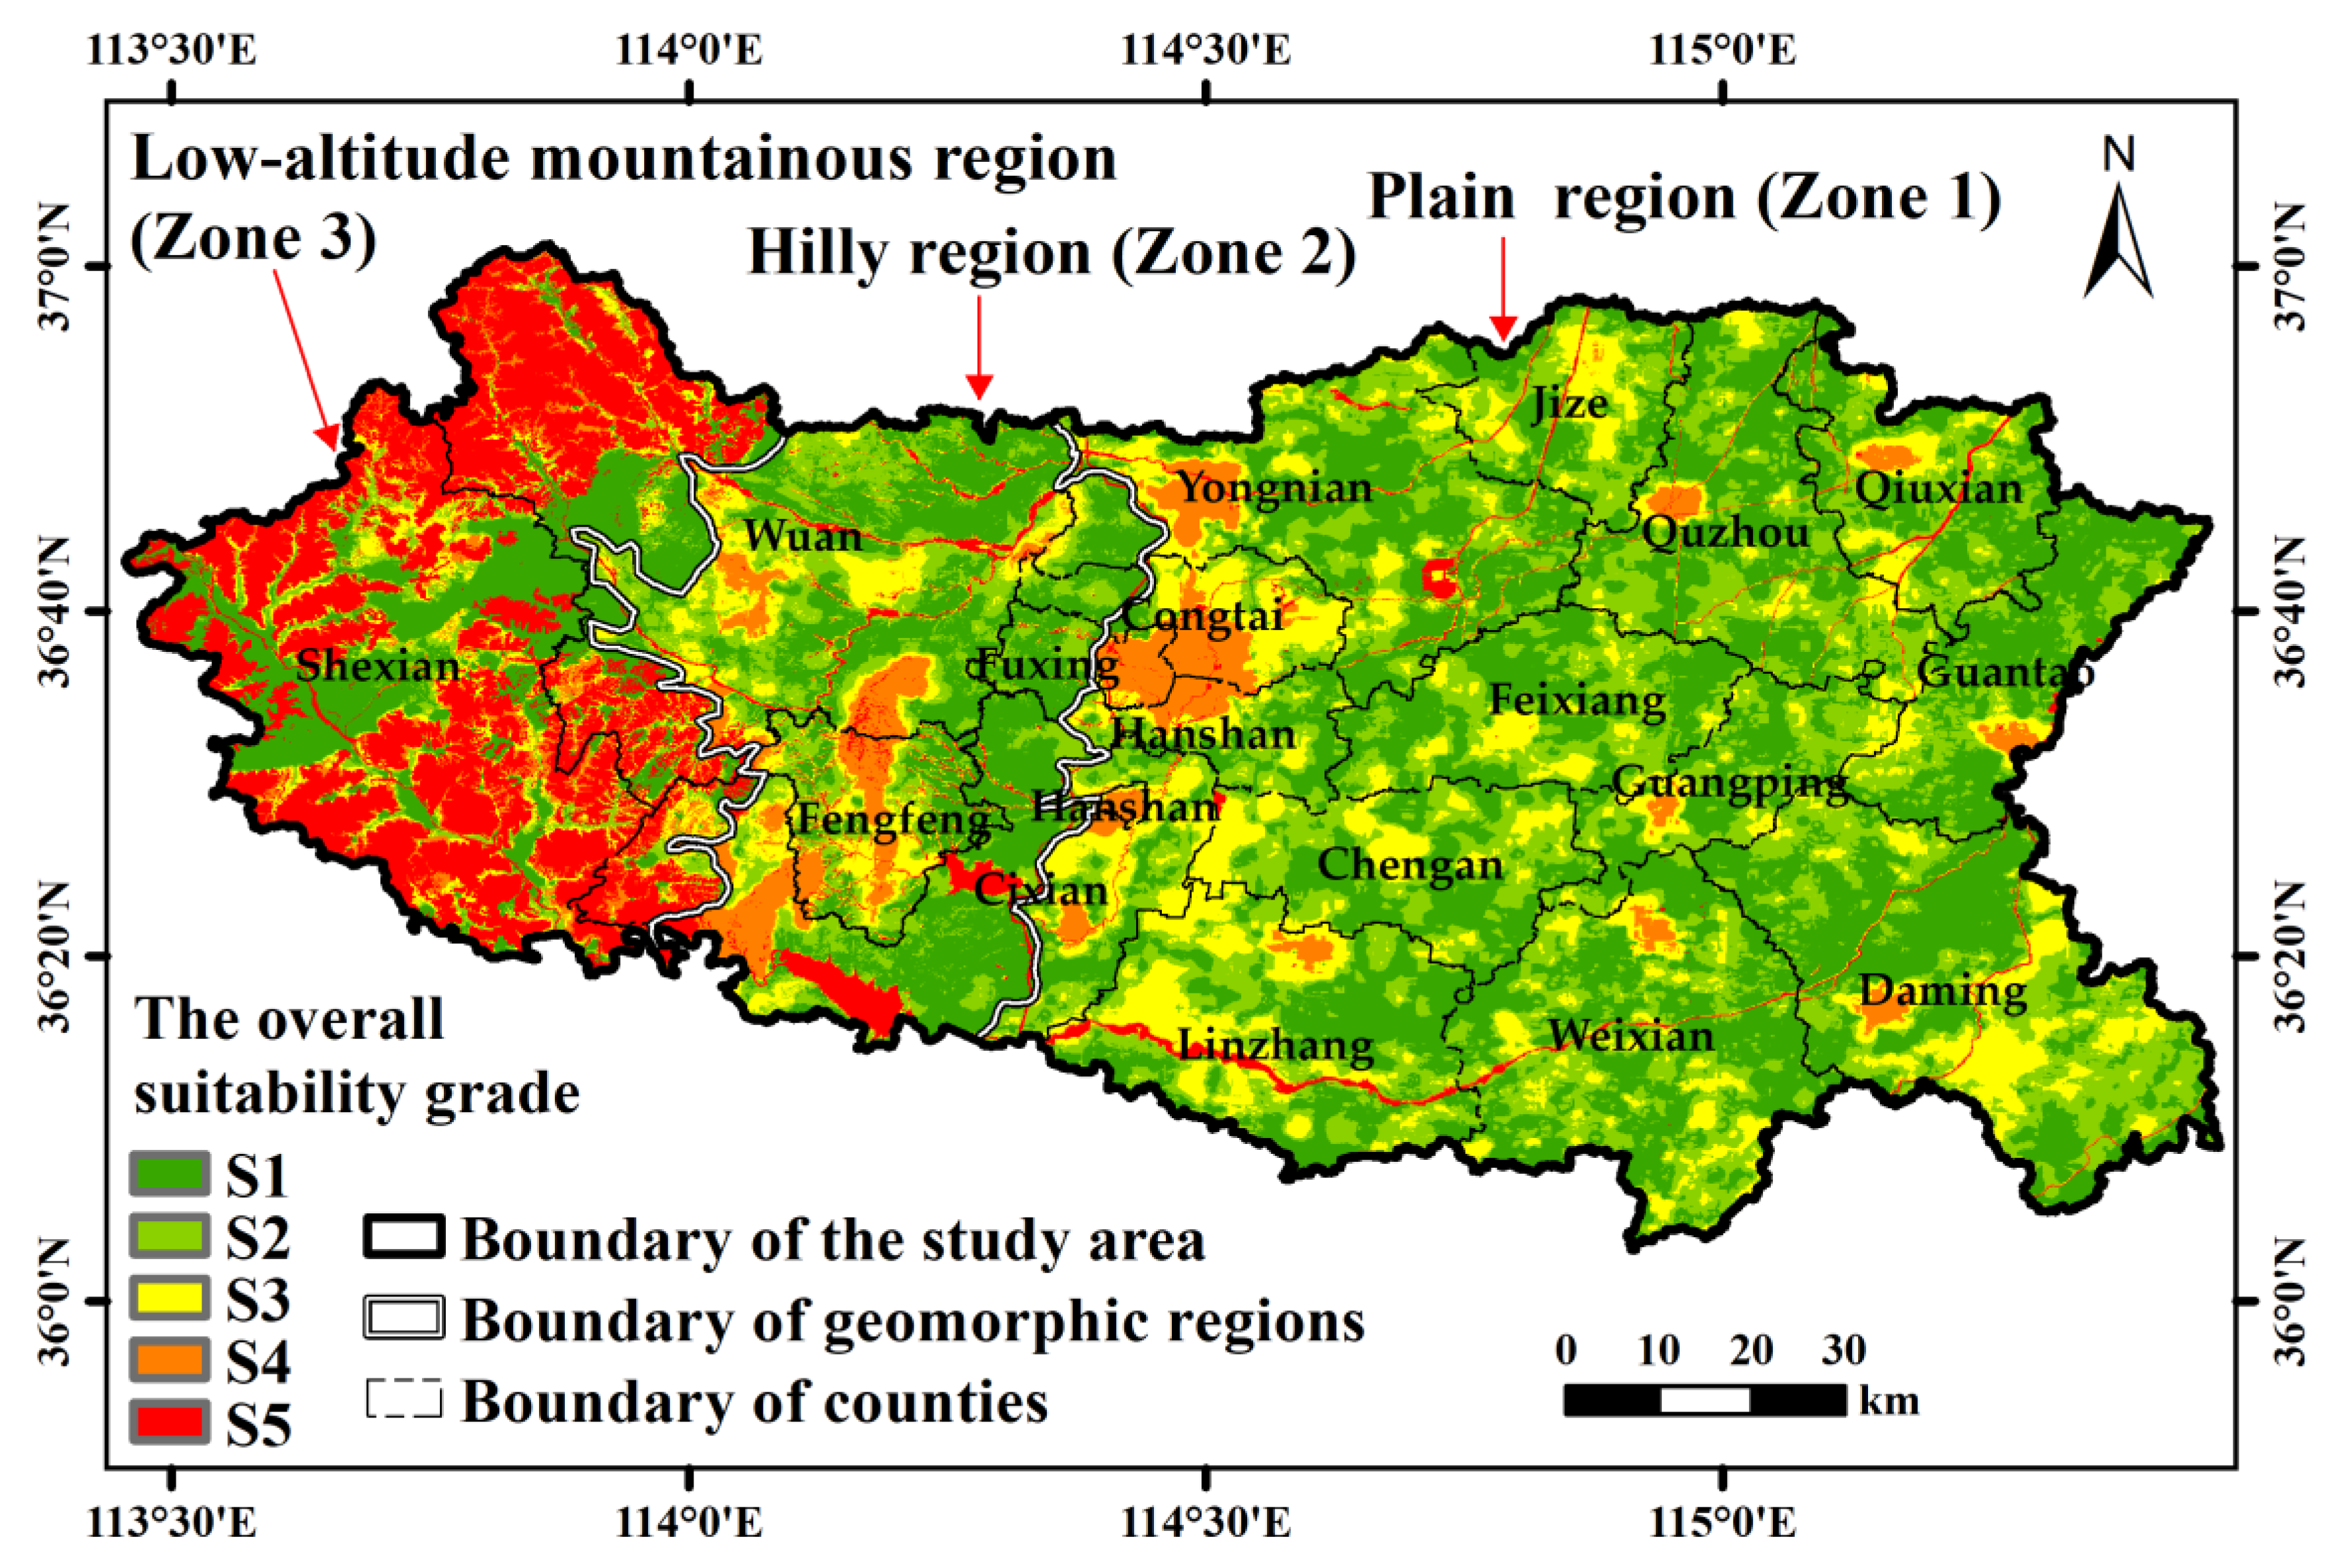
3.3. Overall Suitability and Limiting Factors

Based on the consistency indexes, the boundary values between the suitable category and unsuitable category in Zone 1, Zone 2, and Zone 3 were 85.1, 76.5, and 55.5, respectively. Then, using the Jenks Natural Breaks classification method, the suitable category was further divided into highly suitable class (S1) and moderately suitable class (S2), while the unsuitable category was further divided into moderately unsuitable class (S3) and highly unsuitable class (S4) in each geomorphic region. Finally, the special land was directly classified as a particularly unsuitable class (S5). They had crucial ecological functions or severe agricultural restrictions [51], including land within the ecological red line, water bodies and wetlands, and land with slopes above 25°. The classification results of overall suitability score are displayed in Table 4 and Figure 5. By spatial overlay analysis of the suitability map of evaluation factors (Figure 1) and overall suitability grade map (Figure 5), the percentage of land limited by various evaluation factors in suitable land, unsuitable land, and all land were calculated, as shown in Figure 6. For each evaluation unit, the evaluation factor in the unsuitable category (S3 or S4) was identified as the limiting factor of agriculture.
According to Table 4, S1, S2, S3, S4, and S5 were 38.7%, 27.5%, 14.4%, 5.8%, and 13.6% of Handan, respectively. Due to the increasing limitations of topography, soil condition, spatial accessibility, and land use, the overall suitability level gradually decreased from east to west in Handan (Figure 6d). The average suitability score in Zone 1, Zone 2, and Zone 3 was 86.4, 79.1, and 56.2, respectively. The suitable land (S1 and S2) was 77.4%, 67.5%, and 30.9% of Zone 1, Zone 2, and Zone 3, respectively. According to Figure 6, the suitable land in Zone 1 and Zone 2 was characterized by easy spatial accessibility, smooth terrain and slight non-agricultural impacts, mainly including contiguous agricultural land and dispersed construction land. In contrast, the suitable land in Zone 3 was characterized by good spatial accessibility and flat terrain, covering almost all the agricultural land and construction land, as well as a small part of ecological land. A large amount of agricultural land was classified as moderately suitable land (S3). They were confronted with a high risk of degradation or encroachment by non-agricultural land. The highly unsuitable land (S4) was mainly located in the county towns and urban districts in Zone 1, as well as large-scale ecological areas in Zone 2 and Zone 3. The particularly unsuitable land (S5) was mainly composed of woodland and grassland in zone 3, as well as water bodies in Zone 1 and Zone 2. In addition, some slope farmland in Zone 3 was classified as S5.
According to Figure 6, the main limiting factors were different in the three geomorphic regions of Handan. Climate, hydrologic condition, and vegetation cover were the main limiting factors of both suitable land and unsuitable land in Zone 1. The land use, spatial accessibility, vegetation coverage, and soil conditions placed more restrictions on the unsuitable land in Zone 1. Vegetation cover, soil condition, and land use were the primary restraints in Zone 2. The suitable land was mainly limited by vegetation cover, soil condition, and hydrologic condition. Land use, spatial accessibility, and topography imposed more limitations on the unsuitable land in Zone 2. Land use, topography, soil condition, and spatial accessibility were major limiting factors in Zone 3. Spatial accessibility and topography were merely the main constraints of unsuitable land. The suitable land was mainly restricted by land use, soil condition, and vegetation cover.

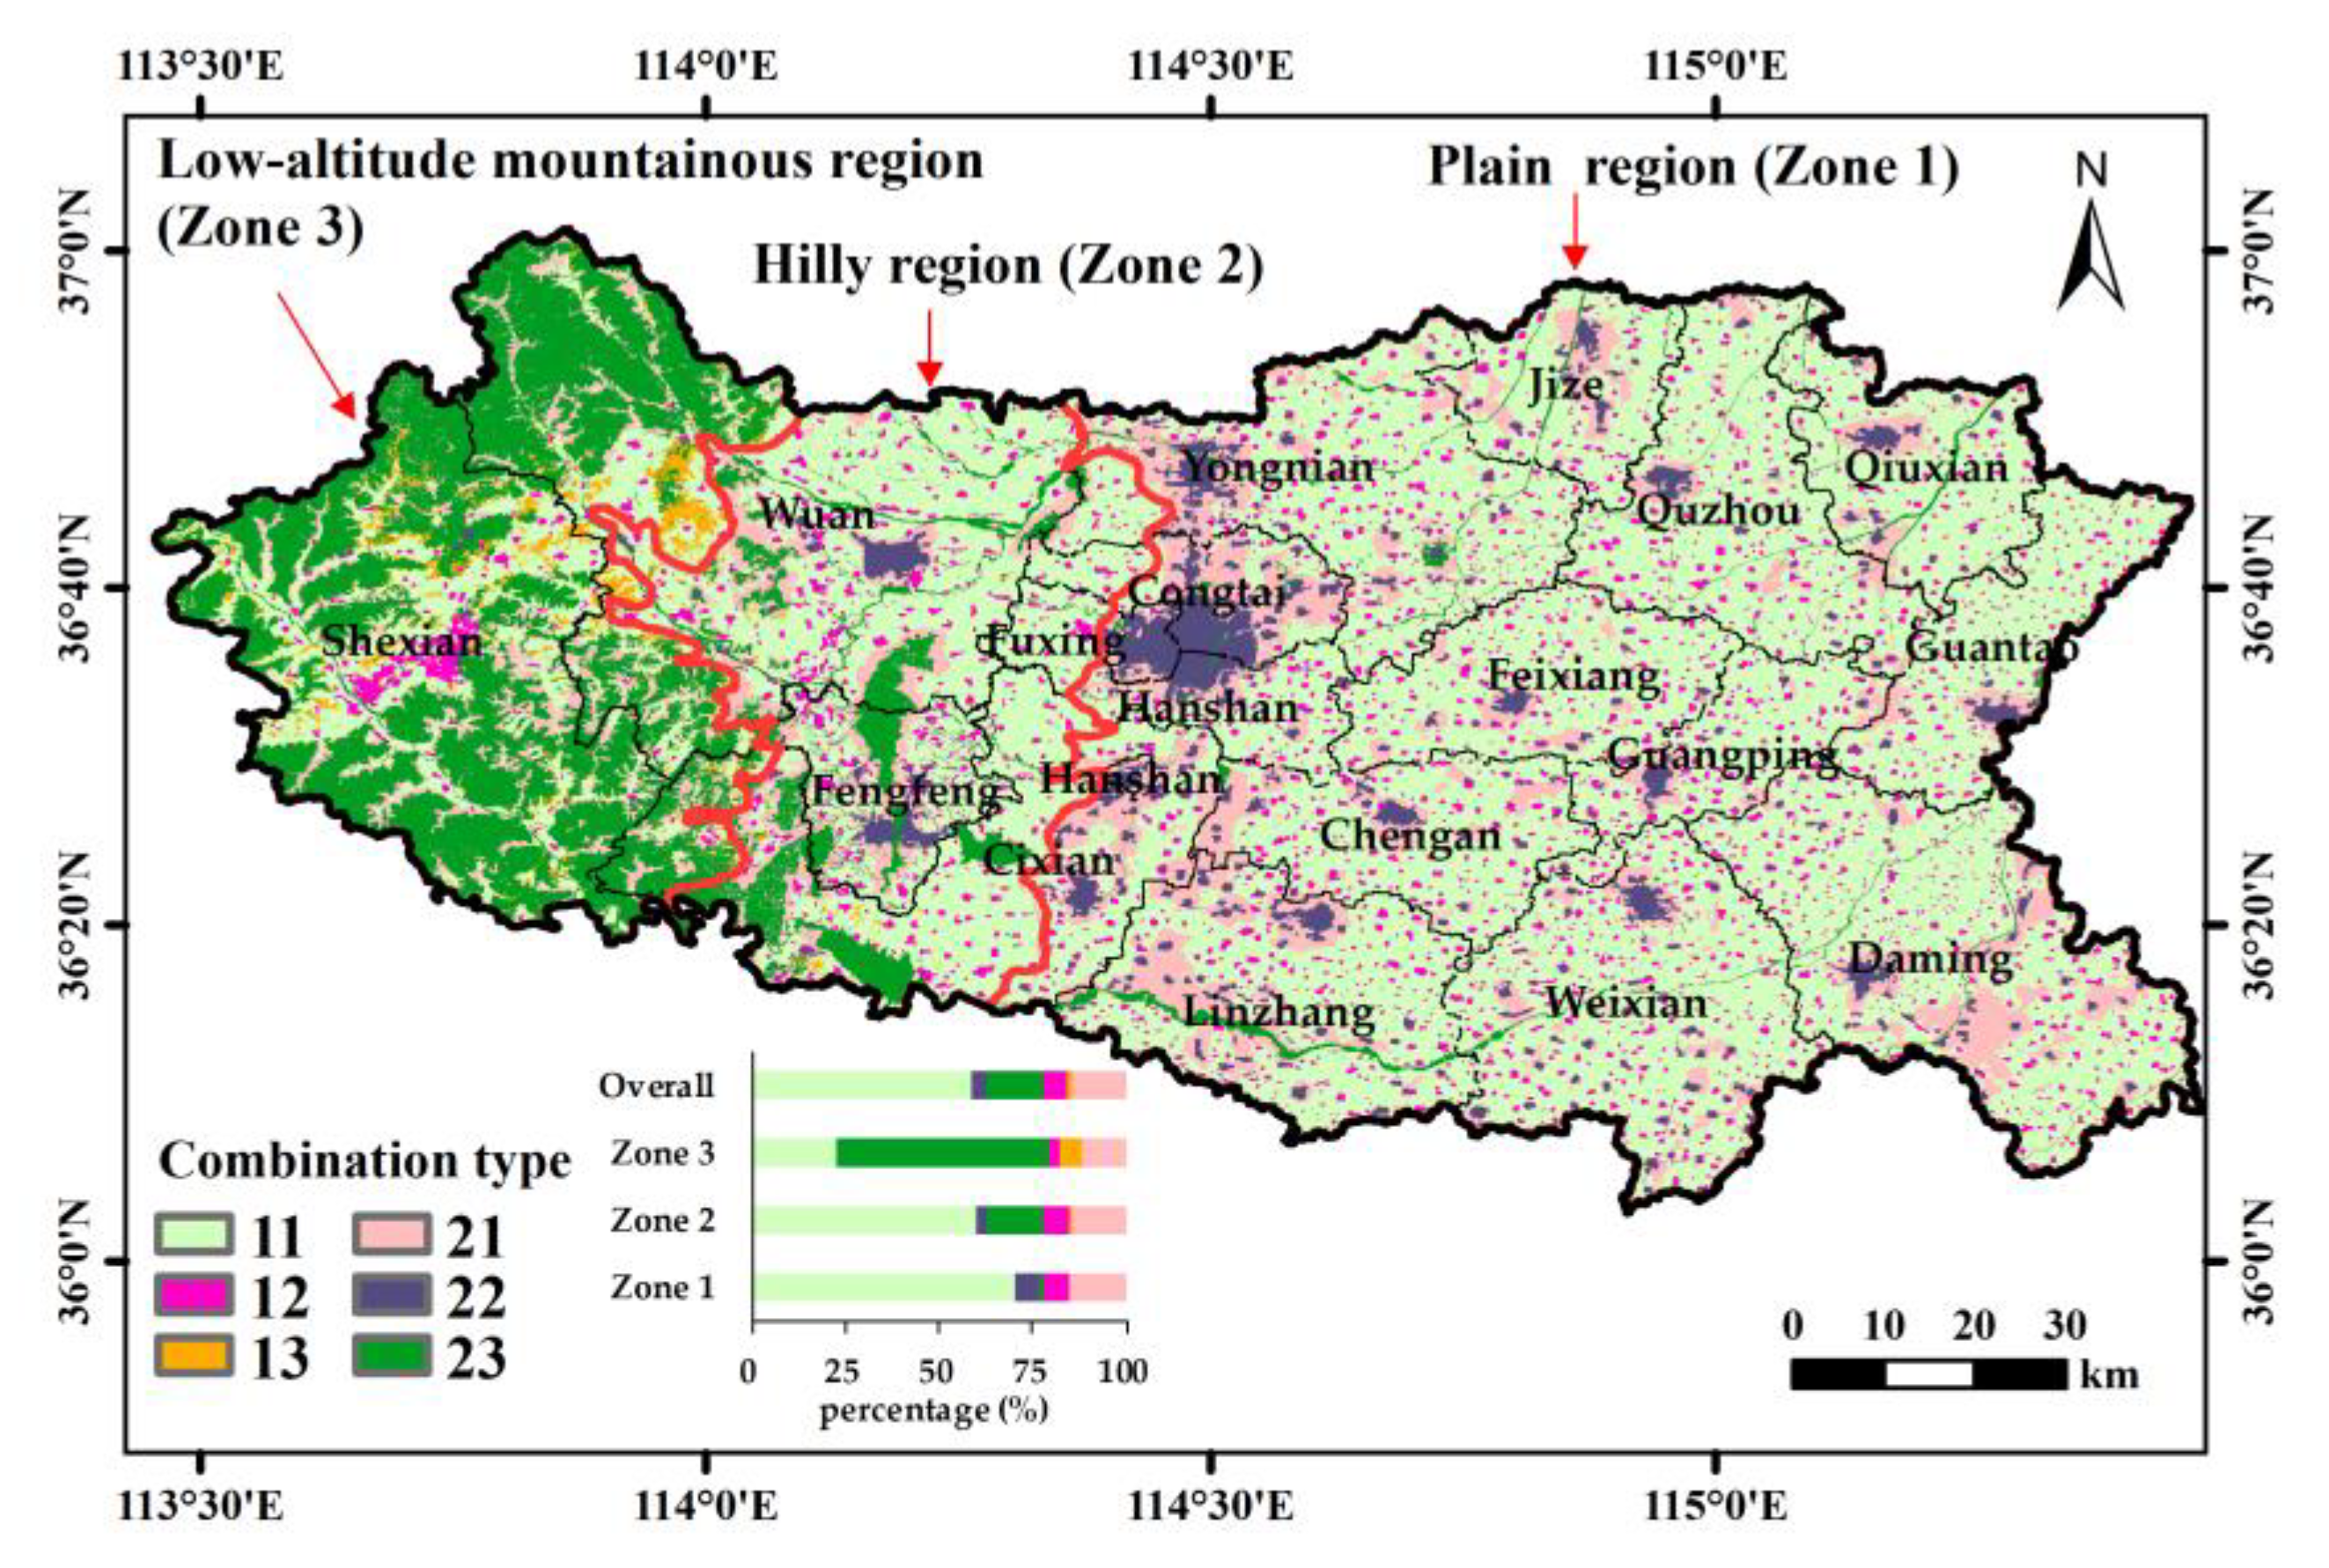
3.4. Land Use Conflicts

The overall suitability grade map was compared with a current land use map to identify the harmonious region and conflict region. The combination types of overall suitability categories and current land uses in Handan are shown in Figure 7.
Type 11, Type 22, and Type 23 occupied 58.8%, 4.2%, and 15.1% of Handan, respectively. They constitutes a harmonious region, where current land use is consistent with the overall suitability category. Type 11 represents agricultural land suitable for agriculture, accounting for 70.5%, 59.9%, and 22.4% of Zone 1, Zone 2, and Zone 3, respectively. Such agricultural land is high in quality and almost free from non-agricultural impact. Type 22 indicates construction land unsuitable for agriculture, concentrated in urban areas and county towns of Zone 1 and Zone 2. Type 23 refers to ecological land unsuitable for agriculture, mainly located in Zone 3. Such land generally has important ecological functions and causes severe restrictions on agriculture, constituting the core area of ecological protection.
Type 12, Type 13, and Type 21 occupied 6.1%, 1.3%, and 14.5% of Handan, respectively. They constitutes a conflict region, where current land use is different from the overall suitability category. The construction land suitable for agriculture (Type 12) was scattered throughout Handan. The ecological land suitable for agriculture (Type 13) was dispersed in the relatively flat areas in the western mountainous region (Zone 3). The agricultural land unsuitable for agriculture (Type 21) accounted for 15.2%, 14.8%, and 12.1% of Zone 1, Zone 2, and Zone 3, respectively. This showed that a large percentage of agricultural land was at a high risk of loss or degradation in each sub-region of Handan.

3.5. Model Performance

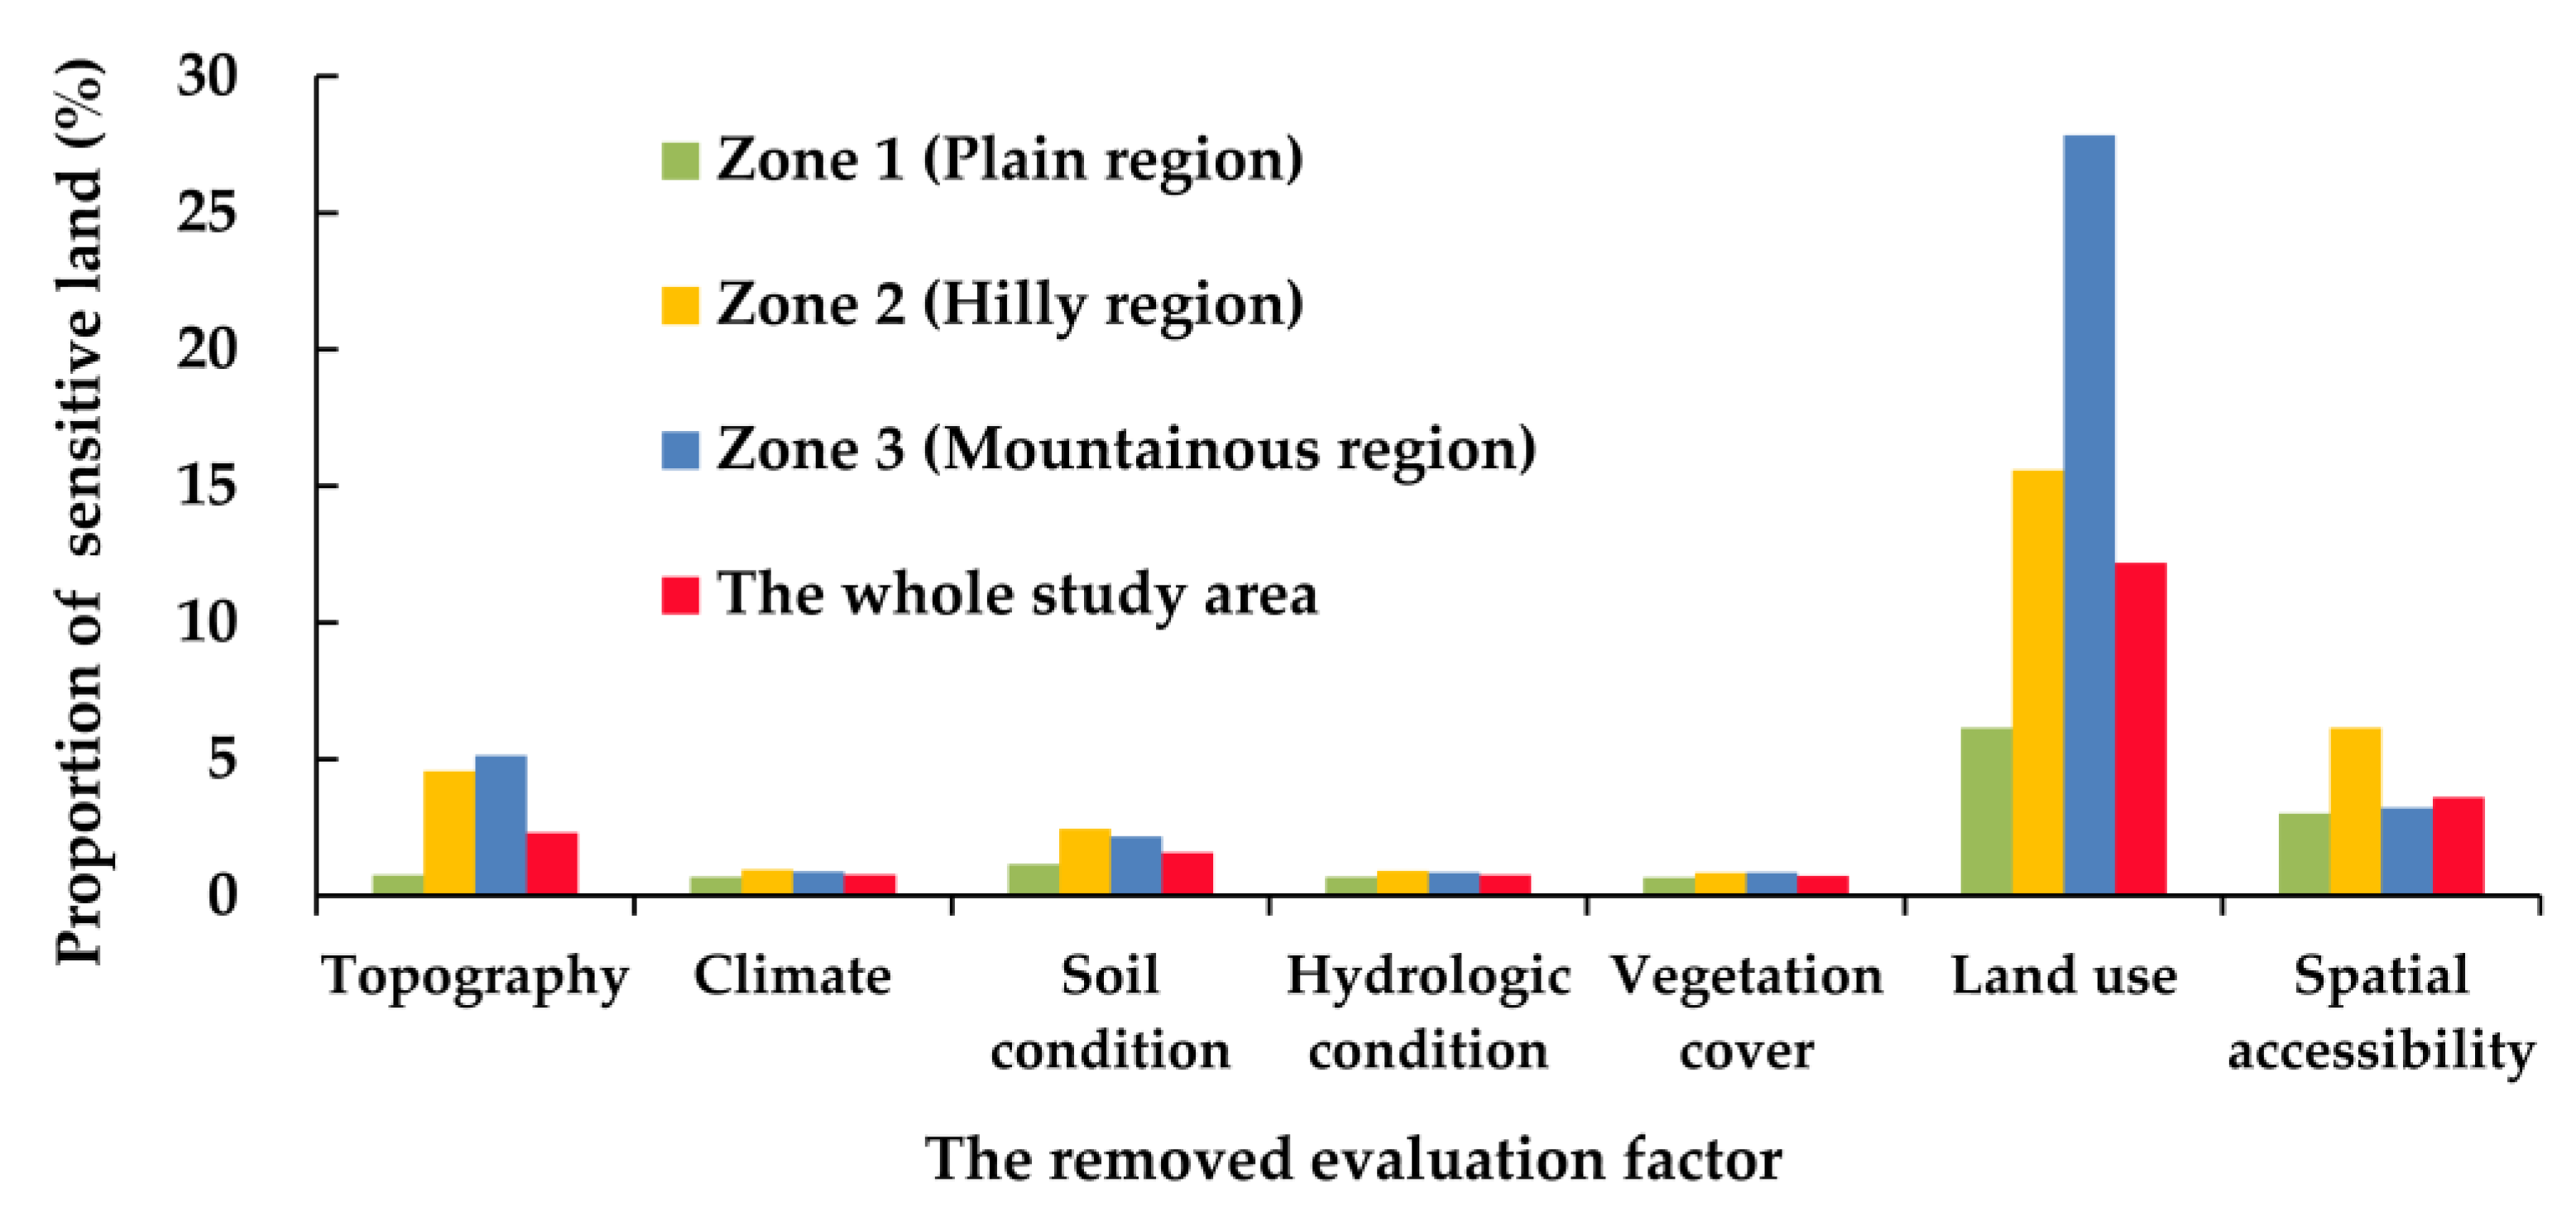
3.5.1. Sensitivity Analysis

Sensitivity analysis was conducted to quantify the impact of changes in evaluation factors on the evaluation results [52]. The analysis results reflected the robustness and stability of evaluation models and results [38]. In this study, a leave-one-out approach was adopted to analyze the sensitivity of evaluation results to the removal of each evaluation factor [53,54]. After removing one evaluation factor from the evaluation system, a new result was generated by integrating the suitability of the remaining evaluation factors. For the sensitive land, the suitability category changes from the original result to the new result. For instance, a sensitive unit is classified as a suitable category in the original result, but it is classified as an unsuitable category in the new result. If the total proportion of sensitive land in the study area is small, the model and result will be deemed to have strong stability and robustness.
Figure 8 presents the proportion of sensitive land due to the removal of one evaluation factor from the evaluation system. Except for land use, when any other factor was removed from the evaluation system, the proportion of sensitive land was below or near 5% in each geomorphic region. The total proportion of sensitive land accounted for 8.5%, 22.3%, and 33.3% of Zone 1, Zone 2, and Zone 3, respectively. The above findings confirmed that the model and result had relatively strong robustness and stability.
Compared with climate, hydrologic condition, vegetation cover, or soil condition, the evaluation result was more sensitive to the removal of land use, topography, and spatial accessibility. Besides, the results of sensitivity analysis were affected by regional differences. After land use or topography was removed from the evaluation system, the proportion of sensitive land gradually increased from east to west.

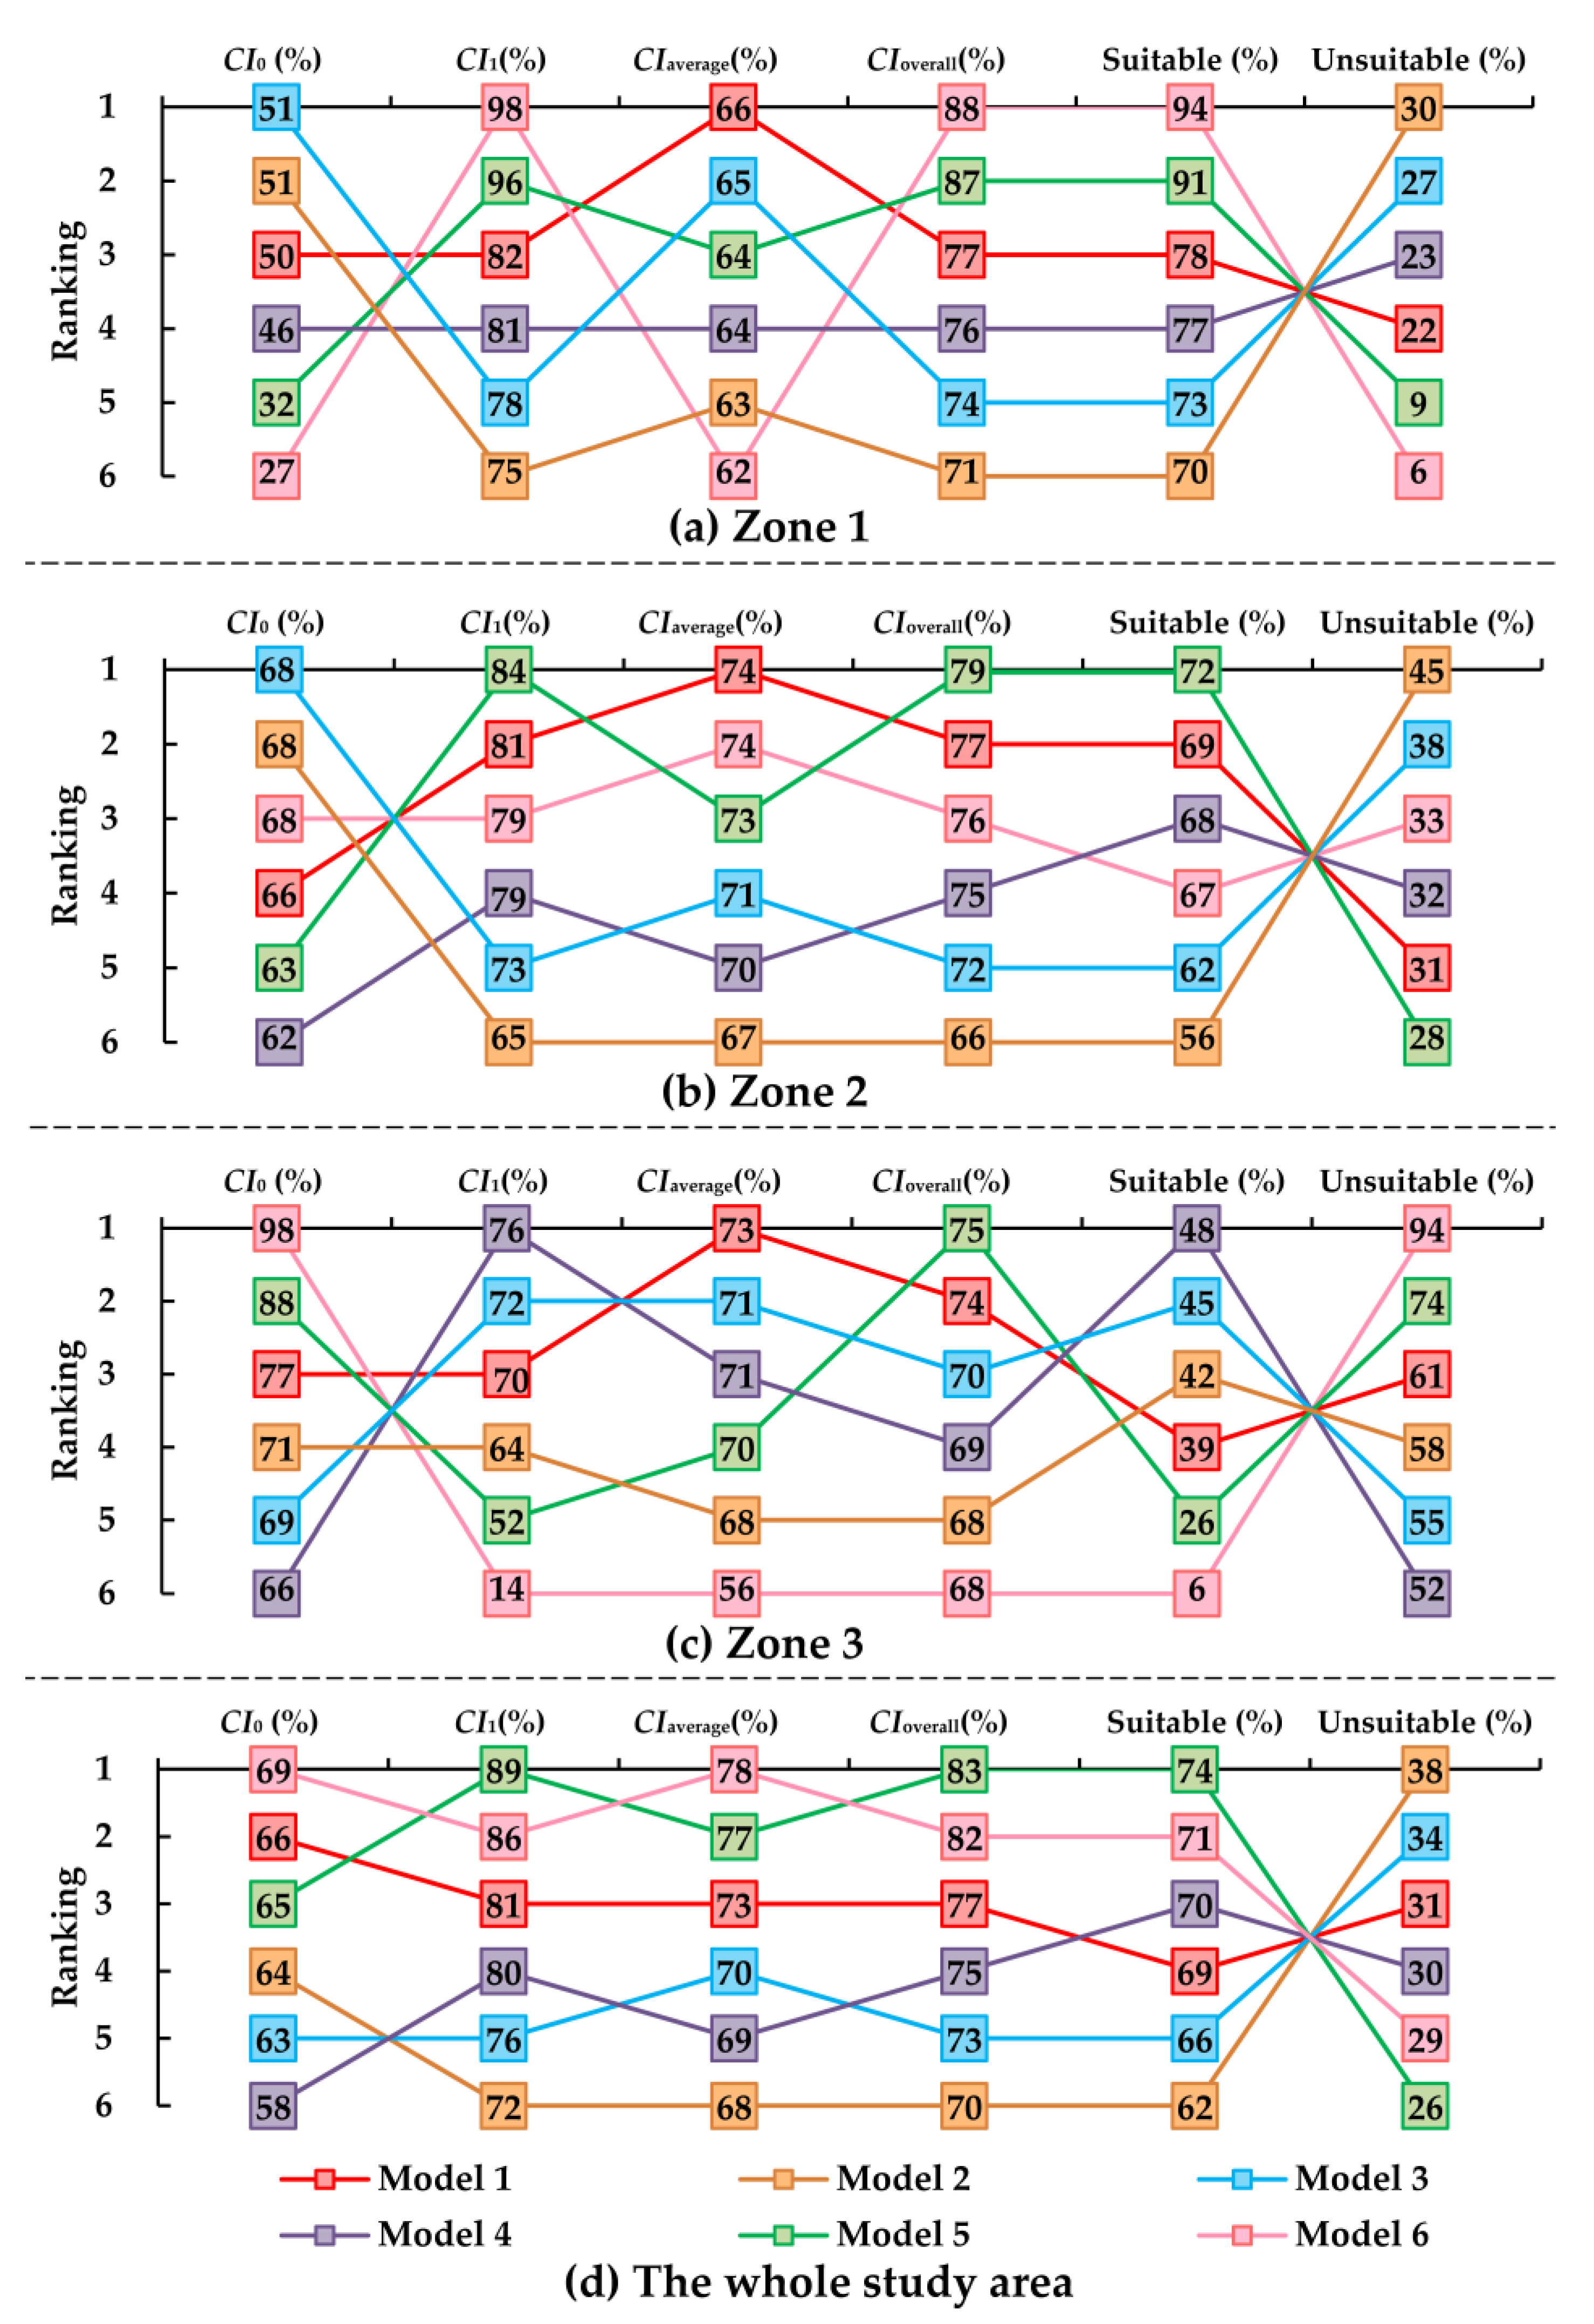
3.5.2. Model Comparison

Several similar models (Model 2–Model 6) were designed to make comparison with the optimized WLC-ALSE model (Model 1), as shown in Table 5. Model 2 only selected natural factors as evaluation factors, including topography, climate, soil conditions, hydrologic conditions, and vegetation cover. Model 3 adopted the entropy weighting method to determine the index weight [31]. Model 4 adopted the CV weighting method to determine the index weight [20]. Model 5 used the Jenks Natural Breaks method to establish different grading standards of overall suitability score for each sub-region [8,17,32]. Without considering regional differences, Model 6 established the identical grading standard of overall suitability score in the whole study area.
The performance of evaluation models was tested by the consistency indexes. If any consistency-index is high in a certain sub-region, it is considered that the corresponding model can produce reasonable and practical evaluation results. In contrast, an evaluation model with one low consistency index will be considered as unreasonable and lack practical significance.
Figure 9 shows the rankings of evaluation models in terms of multiple performance metrics. Among the six evaluation models, the optimized model (Model 1) achieved a high ranking in terms of the consistency indexes in every sub-region of Handan. In terms of overall consistency index (CIoverall) and average consistency index (CIaverage), Model 2, Model 3, and Model 4 were ranked behind Model 1 in every sub-region. This demonstrated that the comprehensive consideration of natural factors and socioeconomic factors and the use of MI weights could improve the accuracy of evaluation results.
The classification results without considering current land use (Model 5) or regional differences (Model 6) seriously deviated from actual land use in one sub-region: too much agricultural land was classified as not suitable for agriculture or too much non-agricultural land was classified as suitable for agriculture. In Zone 1, Model 5 and Model 6 classified only 32% and 27% of non-agricultural land as unsuitable for agriculture, respectively. As a result, the proportion of unsuitable land in model 6 and Model 7 was only 9% and 6%, respectively, lower than the proportion of the existing non-agricultural land (15%). In Zone 3, Model 5 and Model 6 classified only 52% and 14% of agricultural land as suitable for agriculture, respectively. As a result, the proportion of suitable land in model 5 and Model 6 was only 26% and 6%, respectively, lower than the proportion of current agricultural land (34%) in Zone 3. Additionally, CIoverall and CIaverage of Model 6 were lower than those of Model 1 in Zone 3.

4. Discussion

4.1. Performance of the Optimized Model

Although the WLC method has been widely used in ALSE, the following limitations may affect the performance of the WLC-ALSE model. (1) Previous studies often omitted socioeconomic suitability for agriculture [3]. (2) The subjective weighting (SW) methods have been criticized for subjectivity and uncertainty [20,29]. The existing objective weighting (OW) methods were mainly based on the variability of evaluation factors [14], which could not effectively reflect the impact of evaluation factors on agricultural land use. (3) The classification of overall suitability scores usually ignored current land use and regional differences, which might cause the classification results to be unrealistic and affect its guiding role in land use practices.
This study focused on optimizing the WLC-ALSE model in the selection of evaluation factors, weight determination, and comprehensive suitability classification. The empirical study was conducted in Handan, China. First, natural factors and socioeconomic factors were selected to construct a more comprehensive evaluation system. Second, the weight of evaluation factors was determined by the mutual information between current land use and the suitability of evaluation factors. Furthermore, average consistency index (CIaverage) was used to identify the optimum boundary value between the suitable category and unsuitable category in each sub-region.
Sensitivity analysis showed that the optimized WLC-ALSE model had strong robustness and stability. Except for land use, when any other evaluation factor was removed from the evaluation system, the proportion of sensitive land was relatively small in each sub-region (see Figure 8).
Model comparison confirmed that the optimized model generated more reasonable results than the comparison models using conventional methods (see Figure 9). The specific discussion is as follows.
Firstly, the comprehensive consideration of socioeconomic factors and natural factors (Model 1) yielded a more realistic output than simply considering natural factors (Model 2) in each sub-region of Handan. One reason might be that natural factors and socioeconomic factors jointly affected agricultural land suitability. MI weights and sensitivity analysis revealed that land use and spatial accessibility were two key socioeconomic factors affecting agricultural land suitability in Handan. According to Figure 6d, the suitable land was characterized by flat terrain, good soil conditions, easy spatial accessibility, and weak non-agricultural impact, while the unsuitable land was limited by steep terrain, poor soil conditions, difficult spatial accessibility, or large non-agricultural impact in each sub-region of Handan. Therefore, incorporating socioeconomic factors into ALSE will help to generate more reasonable evaluation results and make better land use decisions.
Secondly, the MI weighting method outperformed the CV weighting method (Model 4) and the entropy weighting method (Model 5) in each sub-region, indicating that the OW method could better determine the index weight by analyzing the interaction between the index suitability and current land use. The MI weight showed that the spatial distribution of current agricultural land was closely associated with topography, soil conditions, climatic conditions, land use, and spatial accessibility in Handan. Therefore, these five evaluation factors were given relatively large weight in ALSE. In contrast, the spatial distribution of current agricultural land had no obvious correlations with hydrologic condition and vegetation cover. Therefore, these two factors were given very small weight in ALSE.
Thirdly, the consistency-index classification method considering regional differences (Model 1) screened out more practical and acceptable classification results than the classification method without considering current land use or regional differences (Model 6 and Model 7). Specifically, the optimized model balanced the classification effect of agricultural land and non-agricultural land, avoiding the unreasonable situation that too much agricultural land was classified as unsuitable for agriculture or too much non-agricultural land was classified as suitable for agriculture in local areas. Therefore, the optimized classification results are expected to better guide decision makers to allocate sufficient land for agriculture, urban development, and ecological protection.

4.2. Recommendations for Land Use Decision-Making

4.2.1. Improvement of Agricultural Land Suitability

The suitability conditions were significantly different among the three geomorphic regions in Handan. With the increasing restrictions of land use, soil conditions, topography, and spatial accessibility, the overall suitability gradually declined from east to west. The above findings revealed that the formulation of land use strategies should take into account regional differences. Similarly, Gao et al. [55] suggested that the reasonable utilization and risk assessment of cropland should be based on geomorphologic regionalization in China. Liu et al. [24] formulated targeted protection strategies for different cultivated land use zones in Hengshan County, Northwest China.
Groundwater is the main source of agricultural irrigation in Handan. However, the overuse of groundwater and insufficient rainfall have made hydrological and climatic conditions unfavorable for water-intensive agriculture in Zone 1. With the aim of restoring the groundwater level and adapting to dry climate, it is recommend that Handan should popularize water saving and water recycling technologies [56], cultivate drought-tolerant crops [33], use surface water, harvest rainwater, and transfer water from other areas [1]. Besides, Handan can learn from the United Arab Emirates, who initiate the programs of rainfall enhancement to improve local climatic conditions [33]. Apart from the above technical measures, the following management measures are essential to recover the groundwater table. The local governments have adopted a land fallow policy and adjusted the agricultural structure to reduce the sown areas of water-intensive crops (e.g., winter wheat) in over-exploited areas of groundwater [57]. D’haeze et al. [58] stated that the overuse of groundwater could be explained by the fact that water is free and open to agriculture. Therefore, the water withdraw permit system is requisite to control the total amount of irrigation water.
According to Figure 6a,b, vegetation coverage was an important limiting factor in Zone 1 and Zone 2. Besides, 24% of suitable land in Zone 3 was limited by vegetation cover. According to the remote sensing image of Google Earth and current land use map, the low vegetation coverage mainly occurred in construction land (e.g., built-up areas, rural residential land, open-pit mines, and roads); agricultural land around construction land; or along the riverbank and roads, greenhouses, bare land, and water bodies. Similar phenomena have been observed by other researchers [44]. According to the suitability score maps of evaluation factors (Figure 3), the lands with low vegetation coverage generally had favorable soil conditions and flat terrains in Handan, but many of them were adversely affected by non-agricultural land use. The above findings revealed that the low vegetation coverage in Handan might be mainly caused by human activities, such as urbanization, mining activities, industrial development, infrastructure projects, and land abandonment. Recent studies also highlighted the impact of human activities on land use and vegetation cover. Tian et al. [44] concluded that human disturbances posed a greater threat to habitat suitability than a single natural factor. Yi et al. [59] pointed out that industrial development and infrastructure projects contributed towards the destruction of vegetation in Shenmu County, Shaanxi Province, China. Yang et al. [45] and Yan et al. [60] observed that grazing, urban expansion, coal mining, and factory construction caused vegetation destruction, while eco-engineering projects had positive impacts on vegetation growth in Chen Barag Banner, Inner Mongolia, China. Therefore, effective management measures are required to reduce the adverse impact of human disturbances on vegetation coverage and agricultural land use in Handan. It is recommended that Handan should strictly control the area of construction land, prohibit illegal occupation of agricultural land, actively reclaim agricultural land from inefficient construction land, and implement the revegetation projects (e.g., “artificial planting” and “return farmland to grassland and woodland”) [59,60].
Figure 6c showed that soil conditions, land use, topography, and spatial accessibility were the main limiting factors in Zone 3. According to current land use and the suitability of evaluation factors, we found that a large fraction of agricultural land in Zone 3 was classified as unsuitable for agriculture, owing to steep terrain, poor soil conditions (i.e., shallow soil depth and coarse soil texture), and large non-agricultural impacts. Such land is vulnerable to soil erosion [27] and generally possesses low crop productivity [61], leading to the emergence of land abonnement. Some researchers proposed the following countermeasures to deal with these issues. Li et al. [51] pointed out that steep areas were suitable for high-intensity cultivation without proper management and investment in Malawi, southeastern Africa. Jamil et al. [62] recommended prioritizing soil restoration (e.g., fertilizing and planting trees) to reduce the limitations of slope and soil conditions on sugarcane cultivation in the Bijnor district of India. The South Korean government has been committed to promoting the cultivation of fruit trees and perennial crops on fallow land, as well as reforestation of marginal farmlands in highland agricultural areas of the Haean catchment [27]. Besides the above measures, we recommend building terraces [3], leveling the land, adopting conservation tillage [63], adding water and soil conservation facilities [24], and launching the “grain for green” projects [64] on sloping fields in Zone 3.

4.2.2. Management of Land Use Conflicts

The conflict regions accounted for 21.9% of Handan, indicating that there were severe spatial conflicts between agricultural land and non-agricultural land. Because non-agricultural land suitable for agriculture (Type 12 and Type 13) was less than agricultural land unsuitable for non-agriculture (Type 21), the growth potential of agricultural land was low in Handan. Therefore, priority should be given to the protection of existing agricultural land. It is necessary to continue implementing the policy of agricultural land requisition-compensation balance [8]. Once agricultural land is developed into non-agricultural land, the same quantity and quality of agricultural land shall be supplemented by non-agricultural land. At present, only 62.1% of suitable land belongs to basic farmland in Handan. Therefore, more land suitable for agriculture should be designated as basic farmland protection areas to mitigate non-agricultural impacts.
The agricultural land unsuitable for agriculture (Type 21) accounted for 14.5% of Handan. Besides, 15.4% of basic farmland was diagnosed as unsuitable for agriculture. The above results showed that a large percentage of agricultural land was at a high risk of loss or degradation. It is imperative to prohibit the unauthorized conversion from agricultural land to non-agricultural land [37] and control non-agricultural scope [11]. Nevertheless, the task of protecting agricultural land can be appropriately reduced in core non-agricultural areas.
The non-agricultural land suitable for agriculture (Type 12 and Type 13) was about 7.4% of Handan. Such land was generally surrounded by agricultural land and scattered throughout Handan. Much of such land is idle, wasted, or inefficiently utilized [2]. Therefore, it is encouraged to reclaim agricultural land from the construction land suitable for agriculture (Type 12), such as rural settlements and industrial and mining wasteland. In comparison, it is not economically feasible to develop the construction land unsuitable for agriculture into agricultural land. On the premise of ecological security, some ecological land suitable for agriculture (Type 13) can be carefully developed into agricultural land in Zone 3. However, the ecological land unsuitable for agriculture (Type 23) must be banned for agriculture to prevent potential ecological risks.

4.3. Limitations and Future Work

As a data-driven evaluation model, the quality of data will greatly affect the reliability and application value of evaluation results [51]. However, some data used in this study were dated or had a low spatial resolution. Therefore, the performance of evaluation results can be further improved by using more precise and up-to-date research data [20], including remote sensing images, observed data, and land use data provided by the land management department.
This research demonstrated that ALSE should consider regional differences and current land use. Similar viewpoints were also held by other researchers. Song et al. [5] pointed out that the evaluation parameters were dependent on the local conditions of different counties in China. Zou et al. [2] indicated that land suitability evaluation should select regional indicators in China. Wang et al. [64] divided the desertification-affected north China into 12 sub-regions and then selected representative counties to conduct cropland suitability evaluation. However, the measurement of some parameters in this study still lacked specific analysis of actual land use and regional characteristics. If the three geomorphic areas adopted different evaluation indexes, index classification standards, and index weights based on actual conditions, the evaluation results will be more valuable for land use planning and land use planning in Handan.
This study mainly examined the performance of evaluation models by comparing the evaluation results with current land use, which was a common practice in previous research [8,65]. The future work can develop other metrics, such as whether they conform to public interests, land use policies, and spatial planning [5]. In addition, expert consultation and field investigation can provide valuable feedback on the performance of an evaluation model [5,20].
The manual procedure will consume large amounts of labor and time. For the sake of simplicity and practicality, it is necessary to develop an automatic evaluation system.
Apart from limiting factor identification and land use conflict analysis, the ALSE results can be used for other aspects. For example, Hao et al. [66] optimized agricultural land use based on crop suitability. Liu et al. [8] measured land development potential based on the proportion of suitable land in each township in Dali Prefecture, China. Fu et al. [31] simulate land use changes from 2001 to 2011 based on land suitability in Hamilton County, State of Ohio, USA.

5. Conclusions

This study focused on the optimization of a WLC-ALSE model from three aspects in Handan, China: selection of evaluation factors, weight determination, and overall suitability classification. Sensitivity analysis showed that the optimized model was relatively robust and stable. Model comparison demonstrated that this study made substantial improvements to a conventional WLC-ALSE model in terms of the consistency between evaluation results and current land use. First, the combination of natural factors and socioeconomic factors produced more realistic results than simply considering natural factors. Second, the proposed MI weighting method (Model 1) performed better than a CV weighting method (Model 4) and entropy weighting method (Model 5) in each sub-region, demonstrating that it was feasible to develop a more effective OW method by analyzing the relationships between index suitability and current land use. The MI showed that topography, soil conditions, climate, land use, and spatial accessibility were closely associated with the spatial distribution of current agricultural land, so these five indicators were given relatively large weight in ALSE. Third, the consistency-index classification considering regional differences (Model 1) made a better compromise between CI0 and CI1 in each sub-region, compared with the consistency-index classification ignoring regional differences (Model 5) and Jenks Natural Breaks classification considering regional differences (Model 6). It avoided classifying too much agricultural land as unsuitable for agriculture or too much non-agricultural land as suitable for agriculture in each sub-region.
There were obvious regional differences in agricultural land suitability of Handan. Owing to increasing limitations of topography, soil condition, spatial accessibility, and land use, the average suitability score was 86.4, 79.1, and 56.2 in Zone 1, Zone 2, and Zone 3, respectively. The proportion of suitable land in Zone 1, Zone 2, and Zone 3 was 77.4%, 67.5%, and 30.9%, respectively. Climate, hydrologic condition, land use, and vegetation cover were the main limiting factors in Zone 1. Soil condition, vegetation cover, and land use were the major limiting factors in Zone 2. Land use, topography, soil condition, and spatial accessibility were major limiting factors in Zone 3. In order to recover the groundwater level and adapt to an adverse climate, Zone 1 should develop water saving and efficient agriculture, use surface water for irrigation, plant drought-resistant crops, harvest rainwater, and enhance rainfall. Besides, management means (e.g., the fallow policy and water withdraw permit system) are indispensable in groundwater over-exploited areas. With the aim of mitigating the vegetation damage by human activities and non-agricultural impacts, Handan needs to control the total amount of construction land, prohibit illegal conversion of agricultural land, reclaim agricultural land, and implement revegetation projects, etc. Besides, a large amount of agricultural land in Zone 3 was limited by steep terrain and poor soil conditions (i.e., shallow soil depth and coarse soil texture). In response to these issues, Zone 3 can plant perennial crops and fruit trees, adopt conservation tillage, establish soil conservation facilities, build terraces, and implement the “grain for green” projects.
The conflict region was characterized by inconsistency between the overall suitability category and current land use, occupying 21.9% of Handan. The agricultural land unsuitable for agriculture was 14.5% of Handan, indicating that a large portion of agricultural land was at a high risk of loss or degradation. In comparison, the construction land and ecological land suitable for agriculture was 6.1% and 1.3% of Handan, respectively. We suggest that priority should be given to the protection of existing agricultural land. The land suitable for agriculture should be included in the basic farmland protection areas as much as possible. The “occupation-compensation balance of of farmland” policy is essential to control the conversion from agricultural land to non-agricultural land. Nevertheless, the task of farmland protection can be properly reduced in core non-agricultural areas for economic development and ecological protection. It is encouraged to reclaim agricultural land from inefficient construction land (e.g., scattered rural settlements and industrial and mining wasteland). On the premise of ensuring ecological security, the proper development of ecological land suitable for agriculture is allowed in Zone 3.
This study will provide useful guidance for the evaluation and improvement of agricultural land suitability, as well as the analysis and management of land use conflict between agriculture and non-agriculture in Handan. The WLC-ALSE model can be further optimized by using the latest and high-precision data, combining regional differences and current land use to derive more parameters, designing more convincing performance indicators, and developing automatic evaluation systems, etc. In addition to limiting factor identification and land use conflict analysis, ALSE results can also be applied to other research fields in the future, such as main function zoning, development potential analysis of agricultural land, land use simulation, and optimization.

Author Contributions

Conceptualization, S.Y., J.L. (Jing Li) and K.J.; Formal analysis, S.Y. and J.L. (Jing Li); Funding acquisition, J.L. (Jing Li) and K.J.; Investigation, Y.W.; Methodology, S.Y.; Project administration, Y.W.; Supervision, J.L. (Jing Li); Writing—original draft, S.Y., J.L. (Jiaxin Liang), Z.Y. and Y.W.; Writing—review & editing, S.Y., J.L. (Jing Li), J.L. (Jiaxin Liang) and Y.W. All authors have read and agreed to the published version of the manuscript.

Funding

This research was funded by the National Key R&D Program of China (2016YFC0501101-4), the National Natural Science Foundation of China (41501564), and China Land Surveying and Planning Institute.

Acknowledgments

We are thankful to the editors and the anonymous reviewers for their valuable feedback. Acknowledgement for the data support from “National Earth System Science Data Center, National Science & Technology Infrastructure of China. (http://www.geodata.cn)”.

Conflicts of Interest

The authors declare no conflict of interest.

References

  1. Mazahreh, S.; Bsoul, M.; Hamoor, D.A. GIS approach for assessment of land suitability for different land use alternatives in semi arid environment in Jordan: Case study (Al Gadeer Alabyad-Mafraq). Inf. Process. Agric. 2019, 6, 91–108. [Google Scholar] [CrossRef]
  2. Zou, L.; Liu, Y.; Wang, J.; Yang, Y.; Wang, Y. Land use conflict identification and sustainable development scenario simulation on China’s southeast coast. J. Clean. Prod. 2019, 238. [Google Scholar] [CrossRef]
  3. Akpoti, K.; Kabo-bah, A.T.; Zwart, S.J. Agricultural land suitability analysis: State-of-the-art and outlooks for integration of climate change analysis. Agric. Syst. 2019, 173, 172–208. [Google Scholar] [CrossRef]
  4. Danvi, A.; Jütten, T.; Giertz, S.; Zwart, S.J.; Diekkrüger, B. A spatially explicit approach to assess the suitability for rice cultivation in an inland valley in central Benin. Agric. Water Manag. 2016, 177, 95–106. [Google Scholar] [CrossRef]
  5. Song, M.; Chen, D.M.; Woodstock, K.; Zhang, Z.; Wu, Y. An RP-MCE-SOP framework for China’s county-level “three-space” and “three-line” planning-An integration of rational planning, multi-criteria evaluation, and spatial optimization. Sustainability 2019, 11, 2997. [Google Scholar] [CrossRef] [Green Version]
  6. Maleki, F.; Kazemi, H.; Siahmarguee, A.; Kamkar, B. Development of a land use suitability model for saffron (Crocus sativus L.) cultivation by multi-criteria evaluation and spatial analysis. Ecol. Eng. 2017, 106, 140–153. [Google Scholar] [CrossRef]
  7. Pilevar, A.R.; Matinfar, H.R.; Sohrabi, A.; Sarmadian, F. Integrated fuzzy, AHP and GIS techniques for land suitability assessment in semi-arid regions for wheat and maize farming. Ecol. Indic. 2020, 110, 105887. [Google Scholar] [CrossRef]
  8. Liu, Q.; Liu, Y.; Peng, J.; Zhang, T.; Li, Y.; Hu, Y. Linking GRNN and neighborhood selection algorithm to assess land suitability in low-slope hilly areas. Ecol. Indic. 2018, 93, 581–590. [Google Scholar] [CrossRef]
  9. Islam, M.M.; Ahamed, T.; Noguchi, R. Land suitability and insurance premiums: A GIS-based multicriteria analysis approach for sustainable rice production. Sustainability 2018, 10, 1759. [Google Scholar] [CrossRef]
  10. Chen, D.; Yang, D.; Zhang, X.; Zhao, Y.; Zhang, Y. Spatial suitability evaluation of an arid city based on the perspective of major function oriented zoning: A case study of Urumqi city in Xinjiang, China. Sustainability 2018, 10, 3004. [Google Scholar] [CrossRef] [Green Version]
  11. Cheng, L.; Hu, Z.; Lou, S. Improved methods for fuzzy comprehensive evaluation of the reclamation suitability of abandoned mine lands. Int. J. Mining Reclam. Environ. 2017, 31, 212–229. [Google Scholar] [CrossRef]
  12. Zabihi, H.; Alizadeh, M.; Langat, P.K.; Karami, M.; Shahabi, H.; Ahmad, A.; Said, M.N.; Lee, S. GIS multi-criteria analysis by orderedweighted averaging (OWA): Toward an integrated citrus management strategy. Sustainability 2019, 11, 1009. [Google Scholar] [CrossRef] [Green Version]
  13. Romano, G.; Dal Sasso, P.; Trisorio Liuzzi, G.; Gentile, F. Multi-criteria decision analysis for land suitability mapping in a rural area of Southern Italy. Land Use Policy 2015, 48, 131–143. [Google Scholar] [CrossRef]
  14. Kong, C.; Lan, H.; Yang, G.; Xu, K. Geo-environmental suitability assessment for agricultural land in the rural–urban fringe using BPNN and GIS: A case study of Hangzhou. Environ. Earth Sci. 2016, 75. [Google Scholar] [CrossRef]
  15. Montgomery, B.; Dragićević, S. Comparison of GIS-Based Logic Scoring of Preference and Multicriteria Evaluation Methods: Urban Land Use Suitability. Geogr. Anal. 2016, 48, 427–447. [Google Scholar] [CrossRef]
  16. Abou-Najem, S.; Palacios-Rodríguez, G.; Darwish, T.; Faour, G.; Kattar, S.; Clavero Rumbao, I.; Navarro-Cerrillo, R.M. Land Capability for Agriculture, Hermel District, Lebanon. J. Maps 2019, 1–9. [Google Scholar] [CrossRef] [Green Version]
  17. Deng, F.; Li, X.; Wang, H.; Zhang, M.; Li, R.; Li, X. GIS-based assessment of land suitability for alfalfa cultivation: A case study in the dry continental steppes of northern China. Span. J. Agric. Res. 2014, 12, 364–375. [Google Scholar] [CrossRef] [Green Version]
  18. Radočaj, D.; Jurišić, M.; Gašparović, M.; Plaščak, I. Optimal soybean (Glycine max L.) land suitability using gis-based multicriteria analysis and sentinel-2 multitemporal images. Remote Sens. 2020, 12, 1463. [Google Scholar] [CrossRef]
  19. Malczewski, J. On the use of weighted linear combination method in GIS: Common and best practice approaches. Trans. GIS 2000, 4, 5–22. [Google Scholar] [CrossRef]
  20. Li, Z.; Fan, Z.; Shen, S. Urban green space suitability evaluation based on the AHP-CV combined weight method: A case study of Fuping county, China. Sustainability 2018, 10, 2656. [Google Scholar] [CrossRef] [Green Version]
  21. Jayasinghe, S.L.; Kumar, L.; Sandamali, J. Assessment of potential land suitability for tea (Camellia sinensis (L.) O. Kuntze) in Sri Lanka using a gis-based multi-criteria approach. Agriculture 2019, 9, 148. [Google Scholar] [CrossRef] [Green Version]
  22. Zhang, X.; Fang, C.; Wang, Z.; Ma, H. Urban construction land suitability evaluation based on improved multi-criteria evaluation based on GIS (MCE-GIS): Case of New Hefei City, China. Chin. Geogr. Sci. 2013, 23, 740–753. [Google Scholar] [CrossRef] [Green Version]
  23. Ziadat, F.M.; Sultan, K.A. Combining current land use and farmers’ knowledge to design land-use requirements and improve land suitability evaluation. Renew. Agric. Food Syst. 2011, 26, 287–296. [Google Scholar] [CrossRef]
  24. Liu, Y.; Zhang, Y.; Guo, L. Towards realistic assessment of cultivated land quality in an ecologically fragile environment: A satellite imagery-based approach. Appl. Geogr. 2010, 30, 271–281. [Google Scholar] [CrossRef]
  25. Montgomery, B.; Dragićević, S.; Dujmović, J.; Schmidt, M. A GIS-based Logic Scoring of Preference method for evaluation of land capability and suitability for agriculture. Comput. Electron. Agric. 2016, 124, 340–353. [Google Scholar] [CrossRef]
  26. Dubovyk, O.; Menz, G.; Khamzina, A. Land Suitability Assessment for Afforestation with Elaeagnus Angustifolia, L. in Degraded Agricultural Areas of the Lower Amudarya River Basin. Land Degrad. Dev. 2016, 27, 1831–1839. [Google Scholar] [CrossRef]
  27. Kim, I.; Arnhold, S. Mapping environmental land use conflict potentials and ecosystem services in agricultural watersheds. Sci. Total Environ. 2018, 630, 827–838. [Google Scholar] [CrossRef]
  28. Nguyen, T.T.; Verdoodt, A.; Van, Y.T.; Delbecque, N.; Tran, T.C.; Van Ranst, E. Design of a GIS and multi-criteria based land evaluation procedure for sustainable land-use planning at the regional level. Agric. Ecosyst. Environ. 2015, 200, 1–11. [Google Scholar] [CrossRef]
  29. Ligmann-Zielinska, A.; Jankowski, P. Spatially-explicit integrated uncertainty and sensitivity analysis of criteria weights in multicriteria land suitability evaluation. Environ. Model. Softw. 2014, 57, 235–247. [Google Scholar] [CrossRef]
  30. Liu, H.; Zhan, Q.; Zhan, M. The uncertainties on the GIS based land suitability assessment for urban and rural planning. Int. Arch. Photogramm. Remote Sens. Spat. Inf. Sci.-ISPRS Arch. 2017, 42, 523–530. [Google Scholar] [CrossRef] [Green Version]
  31. Fu, X.; Wang, X.; Yang, Y.J. Deriving suitability factors for CA-Markov land use simulation model based on local historical data. J. Environ. Manag. 2018, 206, 10–19. [Google Scholar] [CrossRef] [PubMed]
  32. Quinn, B.; Schiel, K.; Caruso, G. Mapping uncertainty from multi-criteria analysis of land development suitability, the case of Howth, Dublin. J. Maps 2015, 11, 487–495. [Google Scholar] [CrossRef]
  33. Ugbaje, S.U.; Odeh, I.O.A.; Bishop, T.F.A. Fuzzy measure-based multicriteria land assessment for rainfed maize in West Africa for the current and a range of plausible future climates. Comput. Electron. Agric. 2019, 158, 51–67. [Google Scholar] [CrossRef]
  34. Yun, H.J.; Kang, D.J.; Kim, D.K.; Kang, Y. A GIS-assisted assessment and attribute-based clustering of forest wetland utility in South Korea. Sustainability 2019, 11, 4632. [Google Scholar] [CrossRef] [Green Version]
  35. Leng, P.; Li, Z.; Duan, S.; Gao, M.; Huo, H. A practical approach for deriving all-weather soil moisture content using combined satellite and meteorological data ISPRS Journal of Photogrammetry and Remote Sensing A practical approach for deriving all-weather soil moisture content using combined sate. ISPRS J. Photogramm. Remote Sens. 2017, 131, 40–51. [Google Scholar] [CrossRef]
  36. Malczewski, J. GIS-based land-use suitability analysis: A critical overview. Prog. Plann. 2004, 62, 3–65. [Google Scholar] [CrossRef]
  37. Rhebergen, T.; Fairhurst, T.; Zingore, S.; Fisher, M.; Oberthür, T.; Whitbread, A. Climate, soil and land-use based land suitability evaluation for oil palm production in Ghana. Eur. J. Agron. 2016, 81, 1–14. [Google Scholar] [CrossRef] [Green Version]
  38. Aldababseh, A.; Temimi, M.; Maghelal, P.; Branch, O.; Wulfmeyer, V. Multi-criteria evaluation of irrigated agriculture suitability to achieve food security in an arid environment. Sustainability 2018, 10, 803. [Google Scholar] [CrossRef] [Green Version]
  39. Liu, Y.; Ye, Q.; Li, J.; Kong, X.; Jiao, L. Suitability evaluation of rural settlements based on accessibility of production and living: A case study of Tingzu Town in Hubei Province of China. Chin. Geogr. Sci. 2016, 26, 550–565. [Google Scholar] [CrossRef] [Green Version]
  40. Zolekar, R.B. Integrative approach of RS and GIS in characterization of land suitability for agriculture: A case study of Darna catchment. Arab. J. Geosci. 2018, 11. [Google Scholar] [CrossRef]
  41. Han, F.; Liu, P.; Niu, J.; Wulan, B.; Zhang, Q.; Zhang, J. Spatial Distribution and Evolution of Climatic Aridity in Desert Steppe in Inner Mongolia in Recent 50 Years HAN. Arid Zo. Res. 2013, 30, 449–456. [Google Scholar] [CrossRef] [Green Version]
  42. Ahmad, F.; Goparaju, L.; Qayum, A. FAO guidelines and geospatial application for agroforestry suitability mapping: Case study of Ranchi, Jharkhand state of India. Agrofor. Syst. 2019, 93, 531–544. [Google Scholar] [CrossRef]
  43. Zolekar, R.B.; Bhagat, V.S. Multi-criteria land suitability analysis for agriculture in hilly zone: Remote sensing and GIS approach. Comput. Electron. Agric. 2015, 118, 300–321. [Google Scholar] [CrossRef]
  44. Tian, Y.; Wang, Z.; Mao, D.; Li, L.; Liu, M.; Jia, M.; Man, W.; Lu, C. Remote observation in habitat suitability changes for waterbirds in the West Songnen Plain, China. Sustainability 2019, 11, 1552. [Google Scholar] [CrossRef] [Green Version]
  45. Yang, Z.; Li, J.; Yin, S.; Shen, Y. A method of identifying mining disturbance in arid or semi-arid steppe using inter-annual landsat images-a case study in North-Eastern China. Remote Sens. Lett. 2018, 9, 1224–1232. [Google Scholar] [CrossRef]
  46. Van Berkel, D.B.; Munroe, D.K.; Gallemore, C. Spatial analysis of land suitability, hot-tub cabins and forest tourism in Appalachian Ohio. Appl. Geogr. 2014, 54, 139–148. [Google Scholar] [CrossRef]
  47. Alberti, G.; Grima, R.; Vella, N.C. The use of geographic information system and 1860s cadastral data to model agricultural suitability before heavy mechanization. A case study from Malta. PLoS ONE 2018, 13, e0192039. [Google Scholar] [CrossRef] [Green Version]
  48. Lang, K.; Zhang, M.; Yuan, Y. Improved neural networks with random weights for short-term load forecasting. PLoS ONE 2015, 10, e0143175. [Google Scholar] [CrossRef]
  49. Bennasar, M.; Hicks, Y.; Setchi, R. Feature selection using Joint Mutual Information Maximisation. Expert Syst. Appl. 2015, 42, 8520–8532. [Google Scholar] [CrossRef] [Green Version]
  50. Yue, K.; Wang, F.; Wei, M.; Liu, W. Extending Qualitative Probabilistic Network with Mutual Information Weights. Int. J. Intell. Sci. 2015, 5, 133–144. [Google Scholar] [CrossRef] [Green Version]
  51. Li, G.; Messina, J.P.; Peter, B.G.; Snapp, S.S. Mapping Land Suitability for Agriculture in Malawi. L. Degrad. Dev. 2017, 28, 2001–2016. [Google Scholar] [CrossRef]
  52. Bozdağ, A.; Yavuz, F.; Günay, A.S. AHP and GIS based land suitability analysis for Cihanbeyli (Turkey) County. Environ. Earth Sci. 2016, 75. [Google Scholar] [CrossRef]
  53. Chen, Y.; Yu, J.; Khan, S. Spatial sensitivity analysis of multi-criteria weights in GIS-based land suitability evaluation. Environ. Model. Softw. 2010, 25, 1582–1591. [Google Scholar] [CrossRef]
  54. Sahoo, S.; Sil, I.; Dhar, A.; Debsarkar, A.; Das, P.; Kar, A. Future scenarios of land-use suitability modeling for agricultural sustainability in a river basin. J. Clean. Prod. 2018, 205, 313–328. [Google Scholar] [CrossRef]
  55. Gao, X.; Cheng, W.; Wang, N.; Liu, Q.; Ma, T.; Chen, Y.; Zhou, C. Spatio-temporal distribution and transformation of cropland in geomorphologic regions of China during 1990–2015. J. Geogr. Sci. 2019, 29, 180–196. [Google Scholar] [CrossRef] [Green Version]
  56. Hoseini, Y.; Kamrani, M. Using a fuzzy logic decision system to optimize the land suitability evaluation for a sprinkler irrigation method. Outlook Agric. 2018, 47, 298–307. [Google Scholar] [CrossRef]
  57. Wang, X.; Li, X.; Xin, L.; Tan, M.; Li, S.; Wang, R. Ecological compensation for winter wheat abandonment in groundwater over-exploited areas in the North China Plain. J. Geogr. Sci. 2016, 26, 1463–1476. [Google Scholar] [CrossRef]
  58. D’haeze, D.; Deckers, J.; Raes, D.; Phong, T.A.; Loi, H.V. Environmental and socio-economic impacts of institutional reforms on the agricultural sector of Vietnam: Land suitability assessment for Robusta coffee in the Dak Gan region. Agric. Ecosyst. Environ. 2005, 105, 59–76. [Google Scholar] [CrossRef]
  59. Yi, X.; Wang, L. Land Suitability Assessment on a Watershed of Loess Plateau Using the Analytic Hierarchy Process. PLoS ONE 2013, 8. [Google Scholar] [CrossRef]
  60. Yan, X.; Li, J.; Shao, Y.; Hu, Z.; Yang, Z.; Yin, S.; Cui, L. Driving forces of grassland vegetation changes in Chen Barag Banner, Inner Mongolia. GIScience Remote Sens. 2020, 57, 753–769. [Google Scholar] [CrossRef]
  61. Dittrich, A.; Buerkert, A.; Brinkmann, K. Assessment of land use and land cover changes during the last 50 years in oases and surrounding rangelands of Xinjiang, NW China. J. Agric. Rural Dev. Trop. Subtrop. 2010, 111, 129–142. [Google Scholar]
  62. Jamil, M.; Ahmed, R.; Sajjad, H. Land suitability assessment for sugarcane cultivation in Bijnor district, India using geographic information system and fuzzy analytical hierarchy process. GeoJournal 2018, 83, 595–611. [Google Scholar] [CrossRef]
  63. Kazemi, H.; Akinci, H. A land use suitability model for rainfed farming by Multi-criteria Decision-making Analysis (MCDA) and Geographic Information System (GIS). Ecol. Eng. 2018, 116, 1–6. [Google Scholar] [CrossRef]
  64. Wang, X.; Lu, C.; Fang, J.; Shen, Y. Implications for development of grain-for-green policy based on cropland suitability evaluation in desertification-affected north China. Land Use Policy 2007, 24, 417–424. [Google Scholar] [CrossRef]
  65. Ristić, V.; Maksin, M.; Nenković-Riznić, M.; Basarić, J. Land-use evaluation for sustainable construction in a protected area: A case of Sara mountain national park. J. Environ. Manag. 2018, 206, 430–445. [Google Scholar] [CrossRef] [PubMed]
  66. Hao, L.; Su, X.; Singh, V.P.; Ayantobo, O.O. Spatial optimization of agricultural land use based on cross-entropy method. Entropy 2017, 19, 592. [Google Scholar] [CrossRef] [Green Version]
Figure 1. Location and land use map in 2015 of Handan City, Hebei Province, China.
Sustainability 12 10134 g001
Figure 2. The consistency indexes corresponding to different boundary values in three sub-regions of Handan (ad). The boundary value is used to divide the overall suitability score into a suitable category and unsuitable category. CI0 represents the consistency index of non-agricultural land, calculated by Equation (8). CI1 represents the consistency index of agricultural land, calculated by Equation (9). CIaverage represents the average consistency index, which is equal to the average of CI0 and CI1, calculated by Equation (10).
Sustainability 12 10134 g002
Figure 3. The suitability score maps of evaluation factors and the overall suitability score map in Handan. (a) Topography; (b) Climate; (c) Soil condition; (d) Hydrologic condition; (e) Vegetation cover; (f) Land use; (g) Spatial accessibility; (h) Overall suitability score.
Sustainability 12 10134 g003
Figure 4. The proportion of current agricultural land and information entropy of land use corresponding to different suitability grades of evaluation factors. (a) Topography; (b) Climate; (c) Soil condition; (d) Hydrologic condition; (e) Vegetation cover; (f) Land use; (g) Spatial accessibility; (h) The information entropy of land use corresponding to the proportion of agricultural land.
Sustainability 12 10134 g004
Figure 5. The overall suitability grades for agriculture in Handan.
Sustainability 12 10134 g005
Figure 6. Percentage of evaluation units limited by various evaluation factors in suitable land, unsuitable land, and all land. If the suitability grade of one evaluation factor was S1 or S2 (Figure 1), the evaluation unit was limited by this factor. According to Figure 5, S1 and S2 were grouped into suitable land, while S3, S4, and S5 were grouped into unsuitable land.
Sustainability 12 10134 g006
Figure 7. The combination types of overall suitability categories and current land uses in Handan. Type 11 denotes the agricultural land suitable for agriculture. Type 12 denotes the construction land suitable for agriculture. Type 13 denotes the ecological land suitable for agriculture. Type 21 denotes the agricultural land unsuitable for agriculture. Type 22 denotes the construction land unsuitable for agriculture. Type 23 denotes the ecological land unsuitable for agriculture.
Sustainability 12 10134 g007
Figure 8. The proportion of sensitive land due to the removal of one evaluation factor from the evaluation system. The suitability category of sensitive land in the original result is different from that in the new result.
Sustainability 12 10134 g008
Figure 9. Rankings of evaluation models in terms of multiple performance metrics.
Sustainability 12 10134 g009
Table 1. Agricultural suitability classification of evaluation factors in Handan.
Evaluation FactorsSub-FactorsSuitability Score
100 (S1)80 (S2)60 (S3)40 (S4)
TopographySlope (°)0–5>5–15>15–25>25
Relief amplitude (m)0–70>70–200>200–500>500
ClimateAnnual precipitation (mm)>800>400–800>200–4000–200
Aridity index0–1>1–1.5>1.5–4.0>4.0
Annual accumulated temperature above 10 °C (°C)>3400>1600–3400>1000–16000–1000
Soil conditionSoil depth (cm)>100>60–100>30–600–30
Soil textureLoamyClay Sandy Gravelly
Soil moistureCalculated by Equation (2)
Soil organic matter content (%)>2>1–2>0.6–10–0.6
Hydrologic conditionIrrigation guarantee rate (%)>75–100>50–75>25–500–25
Groundwater depth (m)Calculated by Equation (3)
Distance to surface water (m)Calculated by Equation (3)
Vegetation coverAnnual maximum NDVICalculated by Equation (2)
Land useArea of contiguous non-agricultural land (m2)Calculated by Equation (3)
Spatial accessibilityCost distance to villages (min)Calculated by Equation (3)
Table 2. Contingency table of suitability category and current land use.
Current Land UseSuitability CategoryRow Total
SuitableUnsuitable
Agricultural landN11N01N11 + N01
Non-agricultural landN10N00N10 + N00
Column TotalN11 + N10N01 + N00N11 + N01 + N00 + N10
Table 3. Suitability grades with reduced uncertainty in land use and mutual information (MI) weight of evaluation factors.
Evaluation FactorSuitability Grades with Reduced Uncertainty in Land UseMIWeight
Agricultural Land Was DominantNon-Agricultural Land Was Dominant
TopographyS1S3, S40.190.22
ClimateS2, S3, S4 0.130.15
Soil conditionS1 0.140.16
Hydrologic conditionS1, S3, S4 0.010.01
Vegetation coverS1 0.040.05
Land useS1, S2S40.240.28
Spatial accessibilityS1S30.110.13
Table 4. Classification of overall suitability score in the three geomorphic regions of Handan.
Overall Suitability GradeScore RangeProportion (%)
Zone 1Zone 2Zone 3Zone 1Zone 2Zone 3Study Area
S1>46.0–76.5>39.5–67.2>33.3–51.842.841.623.638.7
S2>76.5–85.1>67.2–76.5>51.8–55.534.625.97.327.5
S3>85.1–88.0>76.5–84.3>55.5–59.216.614.27.814.4
S4>88.0–94.5>84.3–93.2>59.2–91.54.310.56.65.8
S5Special land1.77.854.713.6
Table 5. Basic information of comparison models.
Evaluation ModelsSelection of Evaluation FactorsWeighting MethodOverall Suitability Classification
MethodRegional Differences
Model 1Natural and socioeconomic MICIConsidered
Model 2NaturalMICIConsidered
Model 3Natural and socioeconomicEntropyCIConsidered
Model 4Natural and socioeconomicCVCIConsidered
Model 5Natural and socioeconomicMIJenks Natural BreaksConsidered
Model 6Natural and socioeconomicMICINot considered
Publisher’s Note: MDPI stays neutral with regard to jurisdictional claims in published maps and institutional affiliations.

